the Creative Commons Attribution 3.0 License.
the Creative Commons Attribution 3.0 License.
XBAER-derived aerosol optical thickness from OLCI/Sentinel-3 observation
Linlu Mei
Vladimir Rozanov
Marco Vountas
John P. Burrows
Andreas Richter
A cloud identification algorithm used for cloud masking, which is based on the spatial variability of reflectances at the top of the atmosphere in visible wavelengths, has been developed for the retrieval of aerosol properties by MODIS. It is shown that the spatial pattern of cloud reflectance, as observed from space, is very different from that of aerosols. Clouds show a high spatial variability in the scale of a hundred metres to a few kilometres, whereas aerosols in general are homogeneous. The concept of spatial variability of reflectances at the top of the atmosphere is mainly applicable over the ocean, where the surface background is sufficiently homogeneous for the separation between aerosols and clouds. Aerosol retrievals require a sufficiently accurate cloud identification to be able to mask these ground scenes. However, a conservative mask will exclude strong aerosol episodes and a less conservative mask could introduce cloud contamination that biases the retrieved aerosol optical properties (e.g. aerosol optical depth and effective radii). A detailed study on the effect of cloud contamination on aerosol retrievals has been performed and parameters are established determining the threshold value for the MODIS aerosol cloud mask (3×3-STD) over the ocean. The 3×3-STD algorithm discussed in this paper is the operational cloud mask used for MODIS aerosol retrievals over the ocean.
A prolonged pollution haze event occurred in the northeast part of China during the period 16–21 December 2016. To assess the impact of such events, the amounts and distribution of aerosol particles, formed in such events, need to be quantified. The newly launched Ocean Land Colour Instrument (OLCI) onboard Sentinel-3 is the successor of the MEdium Resolution Imaging Spectrometer (MERIS). It provides measurements of the radiance and reflectance at the top of the atmosphere, which can be used to retrieve the aerosol optical thickness (AOT) from synoptic to global scales. In this study, the recently developed AOT retrieval algorithm eXtensible Bremen AErosol Retrieval (XBAER) has been applied to data from the OLCI instrument for the first time to illustrate the feasibility of applying XBAER to the data from this new instrument. The first global retrieval results show similar patterns of aerosol optical thickness, AOT, to those from MODIS and MISR aerosol products. The AOT retrieved from OLCI is validated by comparison with AERONET observations and a correlation coefficient of 0.819 and bias (root mean square) of 0.115 is obtained. The haze episode is well captured by the OLCI-derived AOT product. XBAER is shown to retrieve AOT well from the observations of MERIS and OLCI.
Please read the corrigendum first before continuing.
-
Notice on corrigendum
The requested paper has a corresponding corrigendum published. Please read the corrigendum first before downloading the article.
-
Article
(7726 KB)
-
The requested paper has a corresponding corrigendum published. Please read the corrigendum first before downloading the article.
- Article
(7726 KB) - Full-text XML
- Corrigendum
- BibTeX
- EndNote


Haze is an atmospheric phenomenon which is associated with horizontal visibilities of less than l0 km and atmospheric relative humidity (RH) less than 90 % (Liu et al., 2013). It is well known that haze occurs as a result of pollution. For example, the release of sulfur dioxide (SO2), nitrogen oxides (NOx), and volatile organic compounds/hydrocarbons coupled with sunlight leads to aerosol formation, particles or the photochemical production of atmospheric particles (Sezer et al., 2005; Pudasainee et al., 2006). These particles are called aerosol. Aerosol has a variety of effects on climate and environment both directly and indirectly. The direct effect is through scattering, which cools the atmosphere and surface system or by absorption of incoming solar radiation, which also cools the surface but warms the atmosphere. Indirectly, aerosol impacts on cloud formation and the microphysical properties of clouds, which in turn influence cloud albedo and precipitation (Li et al., 2011) adding to their negative health impacts. Aerosols are also the carriers of toxic substances such as heavy metals and polycyclic aromatic hydrocarbons (Wilkomirski et al., 2011). In Beijing, under high pollution conditions, the concentrations of sulfate and nitrate have been shown to account for one-third of the particle matter (PM10) mass and two-thirds of the PM2.5 mass, a part of which is attributed to the additional secondary conversion of from SO2 and from NOx (Ji et al., 2012). Haze has a significant effect on regional climatic phenomena, such as monsoon (Chung et al., 2002; Evan et al., 2011), and on the environment, e.g. air quality (Lin et al., 2012) and visibility (Zhao et al., 2011). Aerosol can adversely affects human health (Evan et al., 2011), especially for the elderly, children (American Academy of Pediatrics Committee on Environmental Health, 1993), and even newborn children (Dadvand et al., 2013).
A thick smoke haze enveloped the eastern and northern part of China in December 2016. Pictures taken by cameras onboard the satellite TERRA/AQUA show that the area of China affected by haze exceeded about 1.5 million square kilometres. The poor visibility resulted in several highways and regional airports being closed for extended periods. The situation deteriorated significantly during the haze event and became a matter of public concern.
Satellite observations of the reflectance of solar radiation at the top of the atmosphere are used to determine aerosol optical thickness (AOT), which is used as an indicator of air quality (Kaufman et al., 2002). There are numerous attempts for the retrieval of aerosol properties from satellite observations. AOT retrieval algorithms have been developed for use with the measurements of Moderate Resolution Imaging Spectroradiometer (MODIS) (e.g. Dark-Target (Levy et al., 2013), DeepBlue (Hsu et al., 2013), the Multiangle implementation of atmospheric correction (MAIAC) (Lyapustin et al., 2011)), Advanced Along-Track Scanning Radiometer (AATSR) (e.g. AATSR Dual-Viewing (ADV) (Kolmonen et al., 2016; Sogacheva et al., 2017), Oxford-RAL Aerosol and Cloud (ORAC) (Thomas et al., 2009), and Swansea University (SU) (North et al., 1999) algorithms). AOT is also derived from observations of the Multi-angle Imaging SpectroRadiometer (MISR) (Diner et al., 2005), PARASOL's Polarization and Directionality of the Earth's Reflectances (POLDER) (Dubovik et al., 2014), Sea-Viewing Wide Field-of-View Sensor (SeaWiFS) (Sayer et al., 2012) etc.
One challenge for the derivation of AOT long-term datasets from satellite observation is to generate comparable AOT data products from the different instruments, which have limited lifetimes. Consequently, mature aerosol algorithms, which can be applied to data from instruments on different platforms, are required. For example, the three MODIS aerosol algorithms have been applied to the Visible Infrared Imaging Radiometer Suite (VIIRS) instrument and the three AATSR algorithms have been proposed to be applied to the observations of the Sea and Land Surface Temperature Radiometer (SLSTR) instrument (Popp et al., 2016).
The MERIS instrument onboard Environmental Satellite (Envisat) provided valuable information for different applications (Verstraete et al., 1999). There are several previous attempts to develop AOT retrieval algorithms for MERIS, e.g. the Bremen AErosol Retrieval (BAER; von Hoyningen-Huene et al., 2003, 2011), and the European Space Agency (ESA) standard aerosol retrieval (Santer et al., 2007). These had mixed success (Mei et al., 2017a). BAER has limited accuracy away from dark-vegetated surfaces and primarily for non-absorbing aerosols (de Leeuw et al., 2015; Holzer-Popp et al., 2013), while the ESA standard AOT retrieval tends to overestimate AOT (de Leeuw et al., 2015). The recently developed eXtensible Bremen AErosol (XBAER) algorithm (Mei et al., 2017a, b) has been internally validated in the Aerosol-Climate Change Initiative (Aerosol-CCI) project (Popp et al., 2016), and shows very promising results.
The newly launched (on 16 February, 2016) instrument Ocean Land Colour Instrument (OLCI) continues the work of MERIS as it contains all MERIS channels. Theoretically it is possible to transfer the mature MERIS retrieval algorithms to the OLCI instrument. In this paper, the XBAER algorithm has been applied to OLCI instrument for the first time. To our best knowledge, this is the first publication of AOT retrieved from OLCI. Although Sentinel-3 has only recently been launched, applying XBAER to OLCI data we have identified a haze event over Beijing, China, during December 2016. We use observations by OLCI during this episode to test our retrieval of AOT. This study is a necessary first step to observing the aerosol in the Arctic, which is an overarching long-term objective.
In this paper, the characteristics of OLCI and MERIS instruments are presented and compared in Sect. 2. The XBAER algorithm is briefly explained in Sect. 3. Section 4 shows the comparison between OLCI and MERIS instruments – first XBAER OLCI-derived AOT results and a comparison with AOT from MODIS/MISR and AERONET observations is shown and discussed from a global point of view. The AOT retrieved during the regional haze event is also presented and discussed in Sect. 4. Conclusions are given in Sect. 5.
The European Space Agency Sentinel-3 satellite was successfully launched on 16 February 2016. It is one element of the EU Copernicus system previously known as the Global Monitoring for Environment and Security (GMES) system (https://sentinel.esa.int/web/sentinel/user-guides/sentinel-3-olci). The aim of the Sentinel-3 mission is to provide data continuity of observation and data products for two of the instruments aboard ENVISAT, namely MERIS (https://earth.esa.int/web/guest/missions/esa-operational-eo-missions/envisat/instruments/meris) and AATSR (https://earth.esa.int/web/guest/missions/esa-operational-eo-missions/envisat/instruments/aatsr). There is no overlap of observations because ENVISAT was lost unexpectedly and suddenly in April 2012. The outstanding performance of ENVISAT over the last decade led both scientists and engineers to believe that it is valuable to make use of multiple sensing instruments to accomplish its operational mission for oceanography and global land applications. The instruments onboard Sentinel-3 include SLSTR (Sea and Land Surface Temperature Radiometer), OLCI, SRAL (SAR Altimeter), DORIS (Doppler Orbitography and Radiopositioning Integrated by Satellite), and MWR (Microwave Radiometer), which can deliver additional information for sea/land colour data (at least MERIS quality), sea/land surface temperature (at least AATSR quality), and sea surface topography data (at least Envisat RA quality) (https://earth.esa.int/web/guest/missions/esa-eo-missions/sentinel-3).
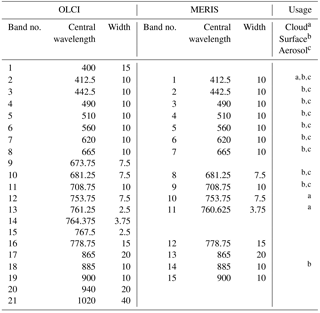
The primary objective of OLCI is to observe the ocean and land surface in the solar spectral region and thereby to harvest information related to biology. OLCI also provides information on the atmosphere and contributes to climate studies. OLCI is a push-broom imaging spectrometer that measures solar radiation reflected by the Earth, at a ground spatial resolution of 300 m, in 21 spectral bands between 0.4 and 1.02 µm, with a swath width of 1270 km. A comparison between the MERIS and OLCI instruments has been included in Table 1.
The XBAER algorithm was designed for the retrieval of AOT from MERIS and similar observations. It has its own cloud-screening approach, aerosol type selection and surface parameterization (Mei et al., 2017a, b). The cloud-screening algorithm minimizes cloud contamination for aerosol retrieval in XBAER. The XBAER cloud-masking algorithm determines the presence of cloud by using (i) the brightness of the scene, (ii) the homogeneity or variability of the top of the atmosphere reflectance, and (iii) cloud height information (Mei et al., 2017b). The threshold values in the XBAER cloud-masking algorithm are selected by a two-step process. The ranges for the thresholds were determined by using accurate radiative transfer modelling with different surface and atmospheric scenarios. A histogram analysis has been used for different cloud, aerosol, and surface scenarios to estimate the optimal threshold values for each criterion.
The XBAER algorithm uses a generic one-parametric surface parameterization for both land and ocean. XBAER uses a set of space–time-dependent spectral coefficients to describe surface properties. The spatial and temporal resolutions are 10 km and monthly, respectively. The surface spectral reflectance can be determined simultaneously with AOT in an iterative procedure (Mei et al., 2017a). This approach assumes that the wavelength-dependent properties of surface spectral reflectance are constrained by space- and time-dependent spectral coefficients. The wavelength-independent single parameters (soil-adjusted vegetation index (SAVI) for land retrieval and normalized differential pigment index (NDPI) for ocean retrieval) have been used as the “tuning” parameters. The definitions of SAVI and NDPI are
where R is the SSR and the subscript for the wavelength denotes the MERIS channel numbers defined in Table 1, and
In this manner, XBAER is not limited to dark surfaces (ocean, vegetation) and also retrieves AOT over bright surfaces (e.g. desert, semiarid, and urban areas).
XBAER uses MODIS Dark-Target aerosol type assumptions and the expected aerosol type for a given region and season is taken from an analysis of Aerosol Robotic Network (AERONET) and Maritime Aerosol Network (MAN) observations for both land and ocean. AOT and surface reflectance are retrieved by minimizing the difference between simulated and measured top-of-the-atmosphere (TOA) reflectance using a look-up table (LUT), created by the radiative transfer software package SCIATRAN (Rozanov et al., 2014). Details of the XBAER algorithm can be found in Mei et al. (2017a, b). A post-processing technique used in Aerosol-CCI project and the MODIS monthly snow fraction dataset have been additionally applied to avoid unresolved clouds/snow (Popp et al., 2016).

Figure 1Spectral response function of MERIS (dashed lines) and OLCI (solid lines) for overlap channels.
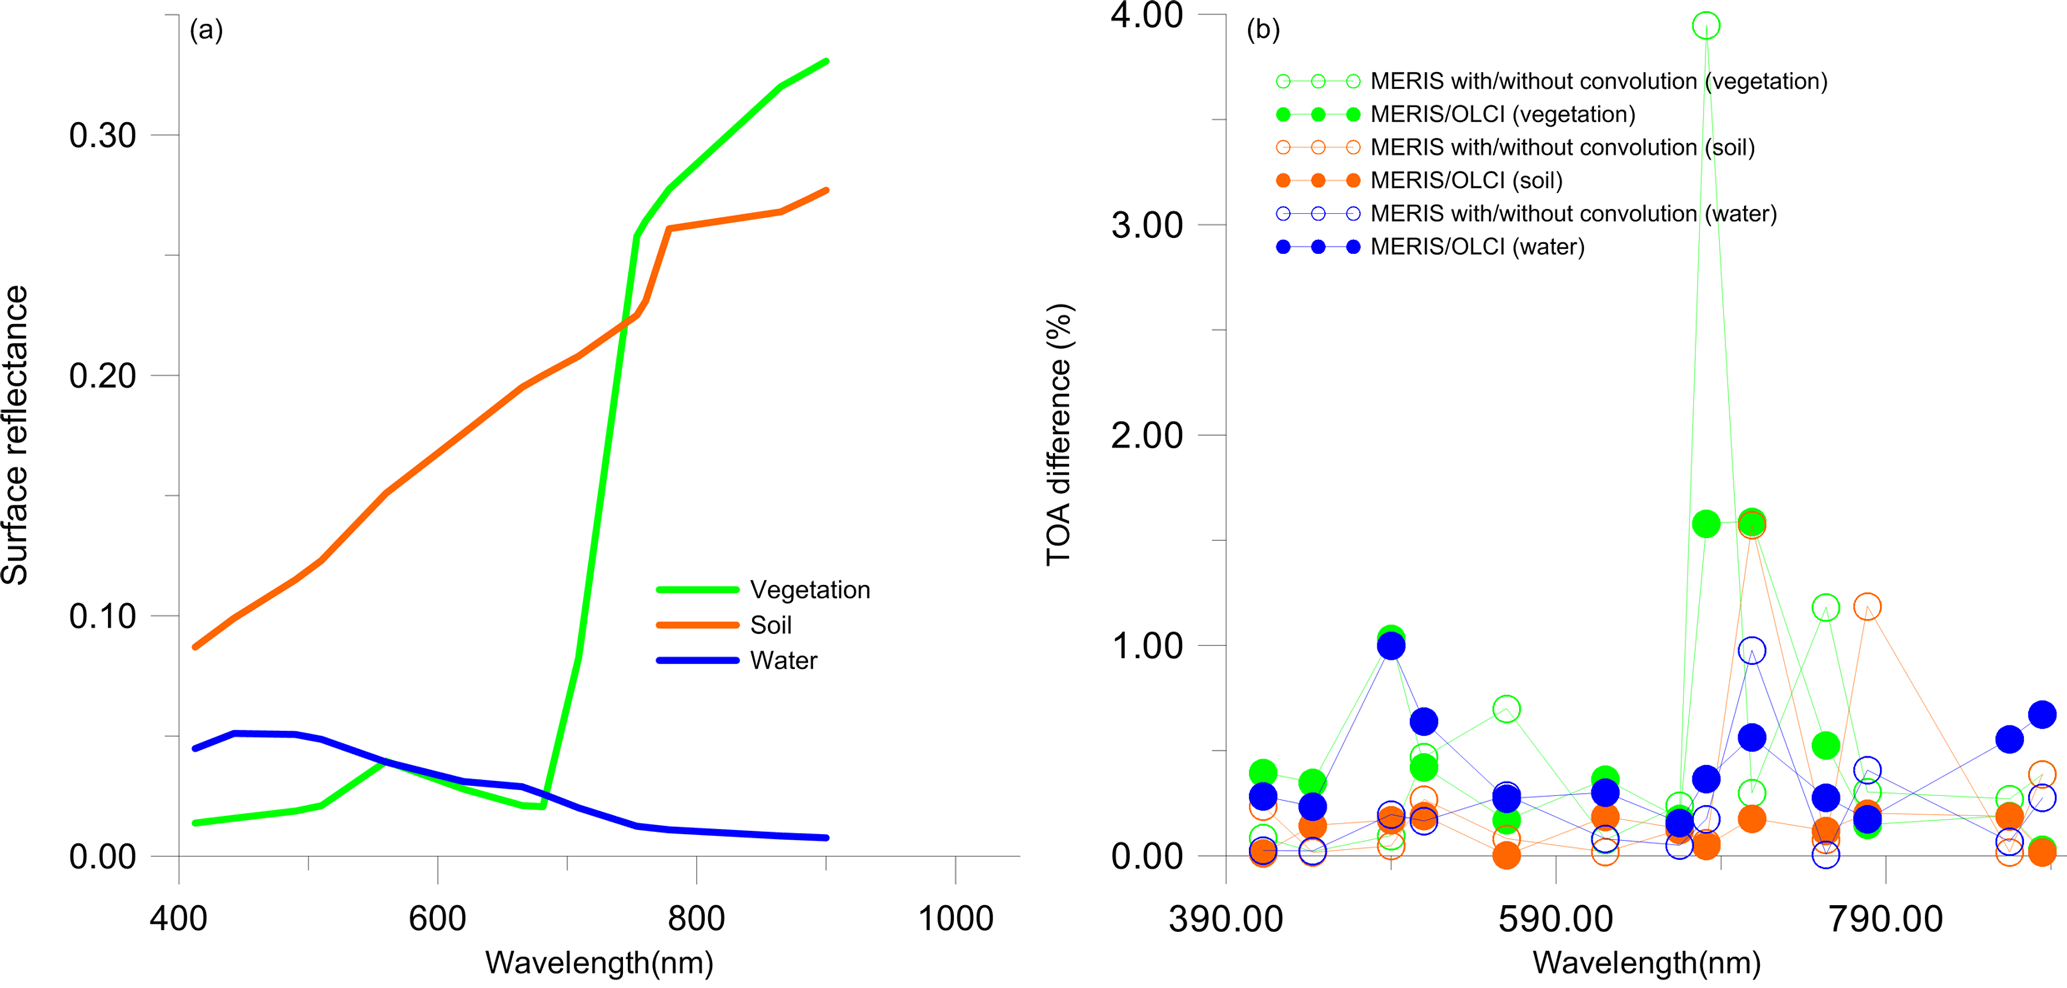
Figure 2(a) Surface reflectances of the three selected surface types; (b) comparisons of the simulated TOA reflectance for different combinations of MERIS and OLCI SRF values. Green, orange, and blue colours in (a) and (b) represent vegetation, soil, and water simulations. Filled circles in (b) are differences for simulations using MERIS and OLCI SRFs. Circles in (b) are differences for simulations with and without convolution.
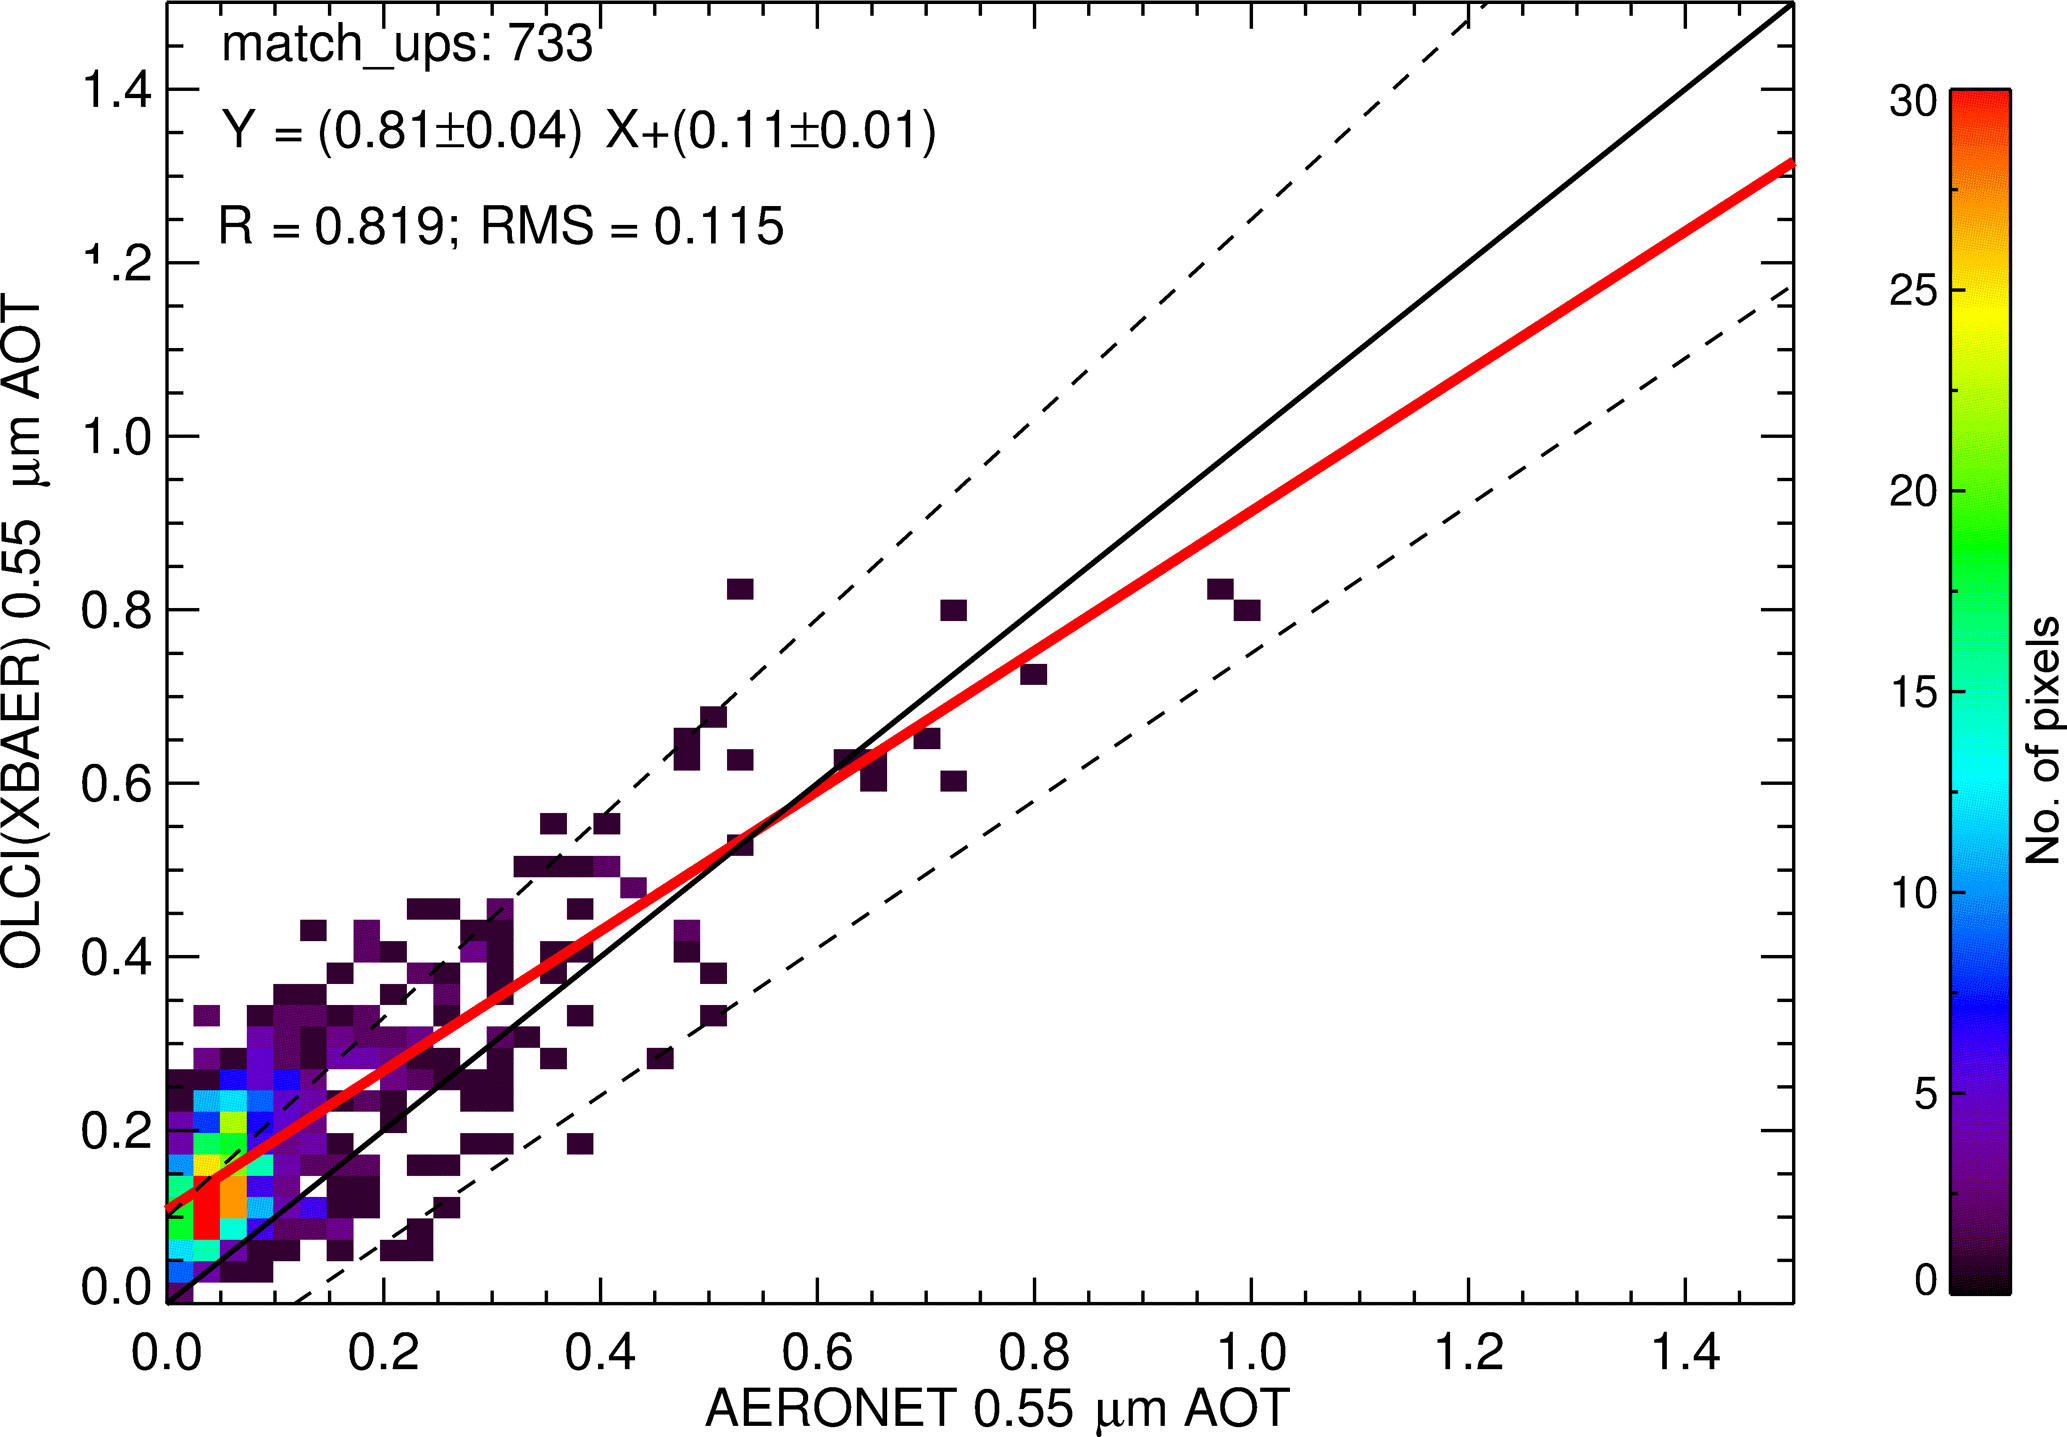
Figure 3Global comparison of OLCI XBAER AOT with AERONET observations for 2016 December. R and “match_ups” refer to the Pearson correlation coefficient and the number of locations used in the validation respectively. The dashed lines are .
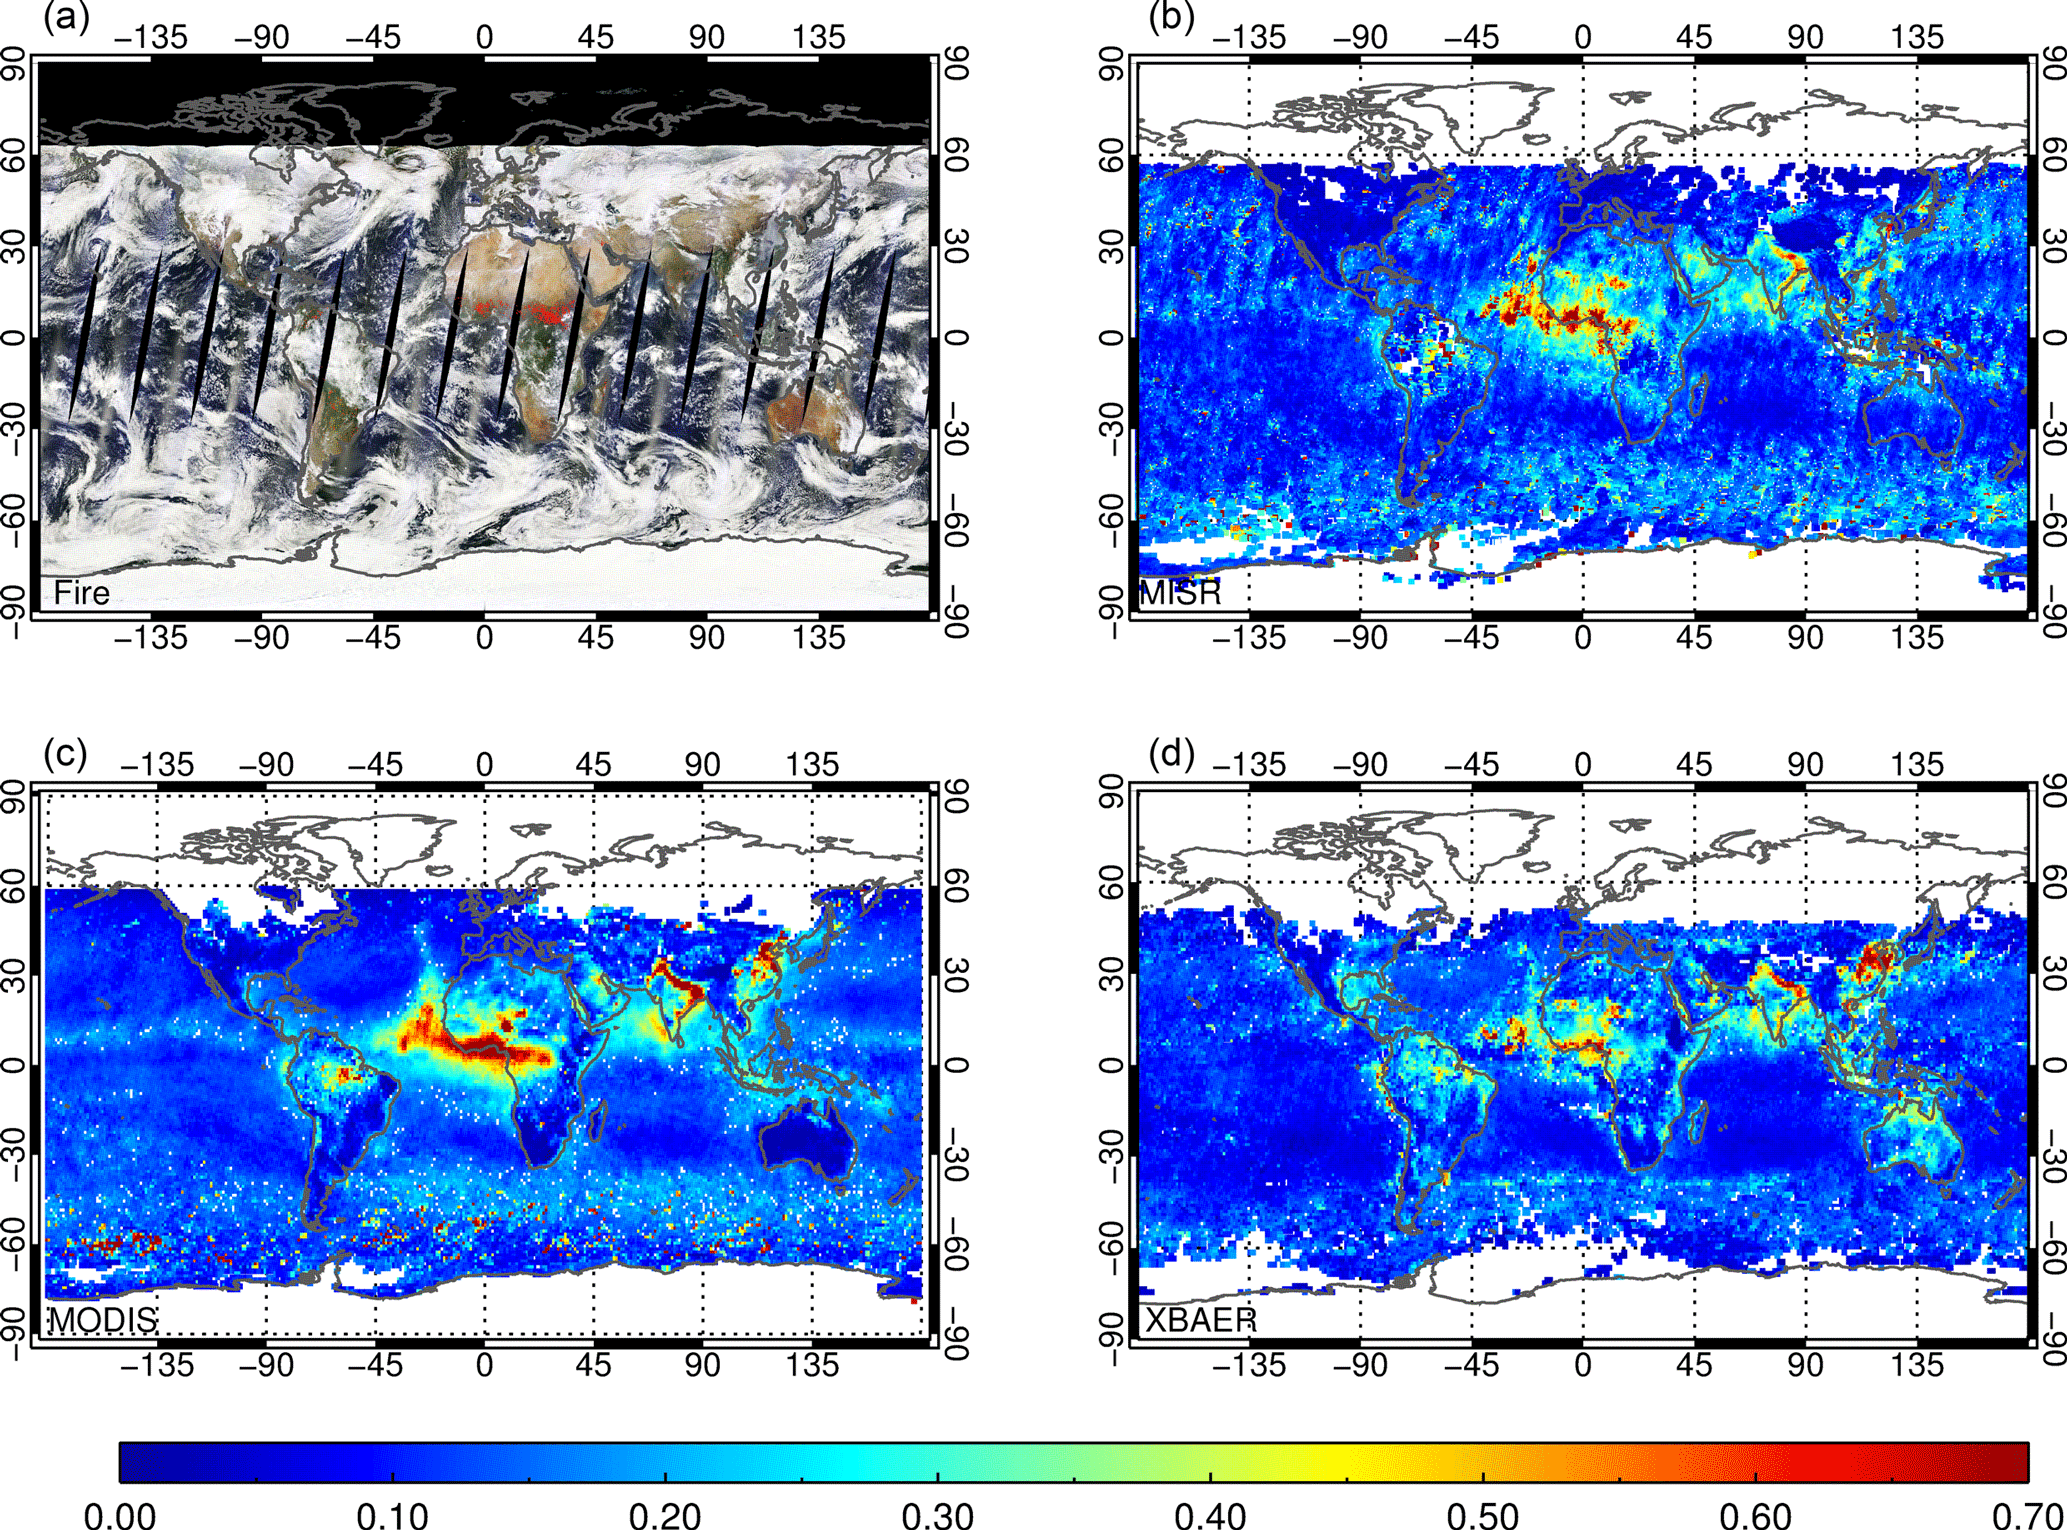
Figure 4Comparison of the retrieved global monthly mean AOT at 0.55 µm for December 2016. (a) MODIS fire product, (b) MISR, (c) MODIS (Dark-Target and DeepBlue combined), and (d) OLCI (XBAER).
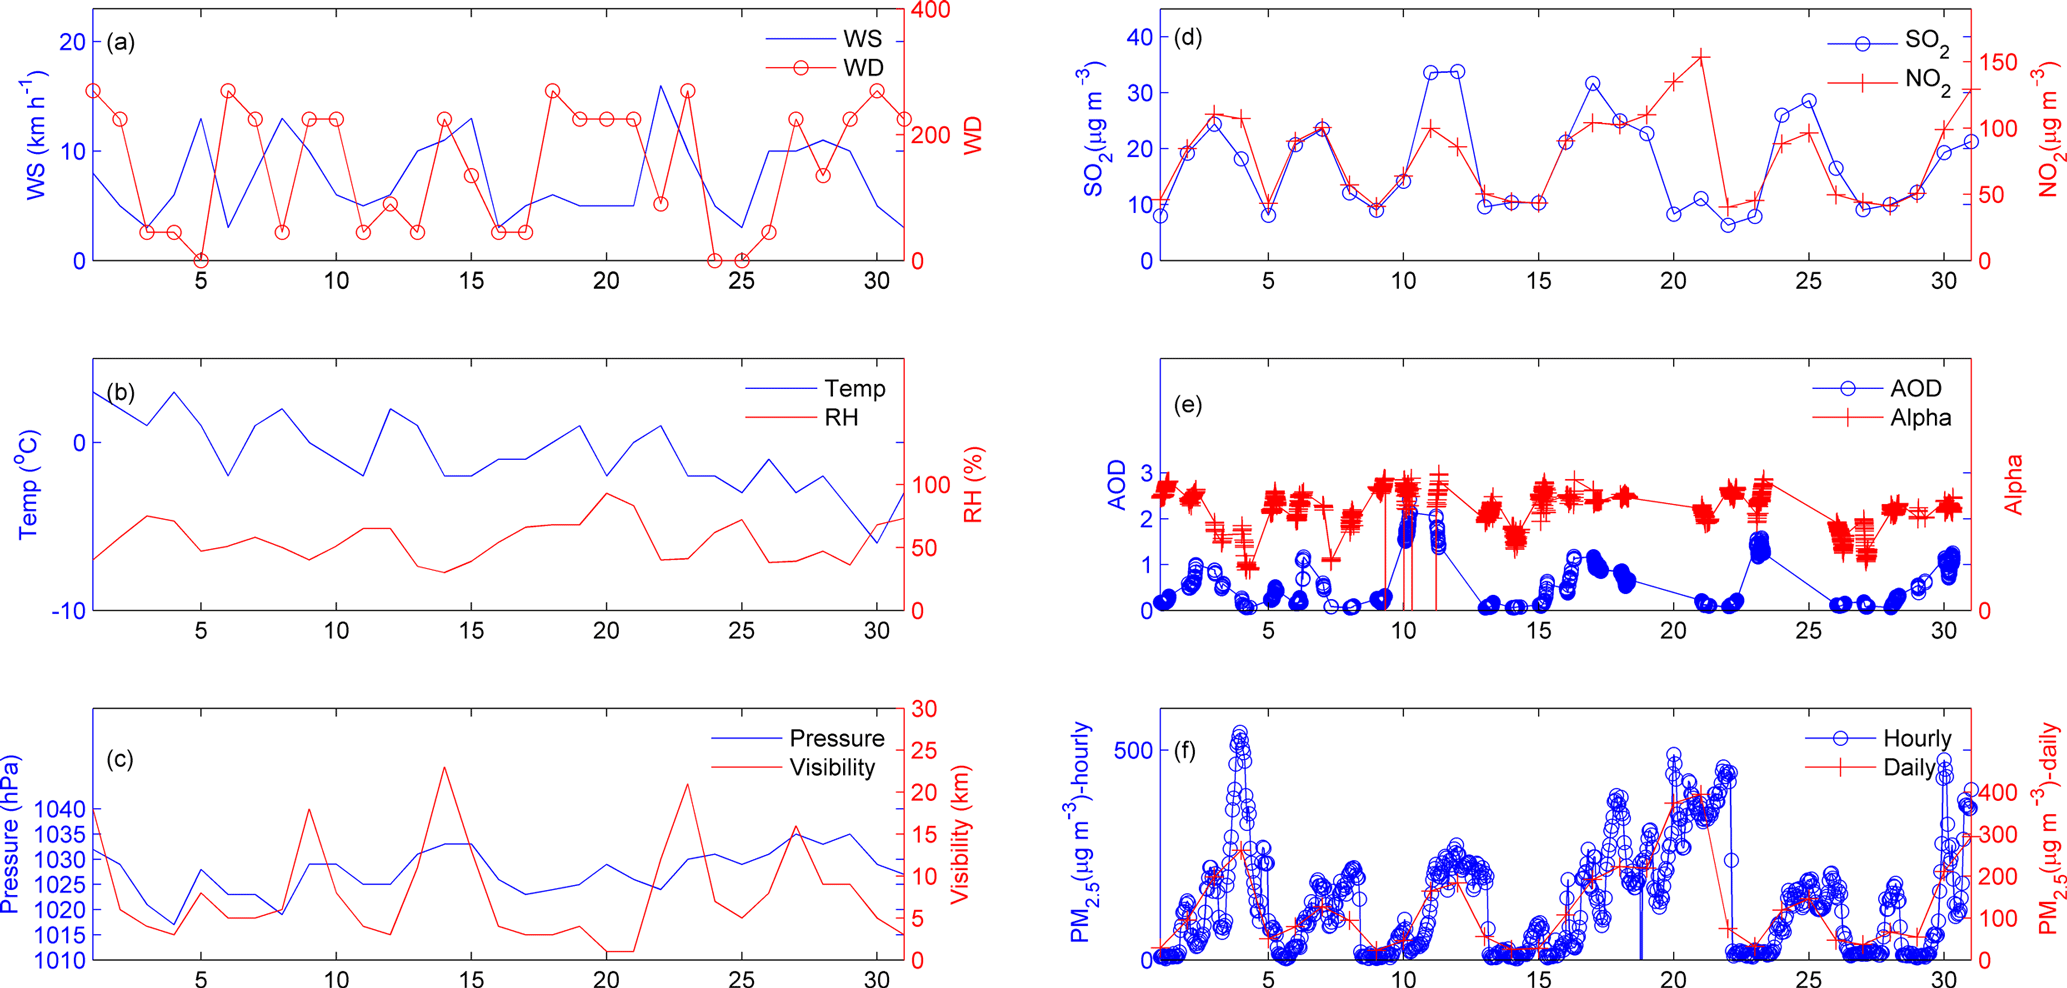
Figure 5Time series of meteorological parameters and pollutants during December 2016. (a) Wind direction and wind speed (km h−1), (b) temperature (∘C) and relative humidity (%), (c) atmospheric pressure (hPa) and visibility (m), (d) SO2 and NO2 concentration (µg m−3), (e) AOT and Ångström coefficient (440–870 nm) (Alpha), and (f) PM2.5 hourly and daily concentration (µg m−3). The atmospheric components and meteorological data are from https://www.aqistudy.cn/historydata/index.php and https://www.wunderground.com/.
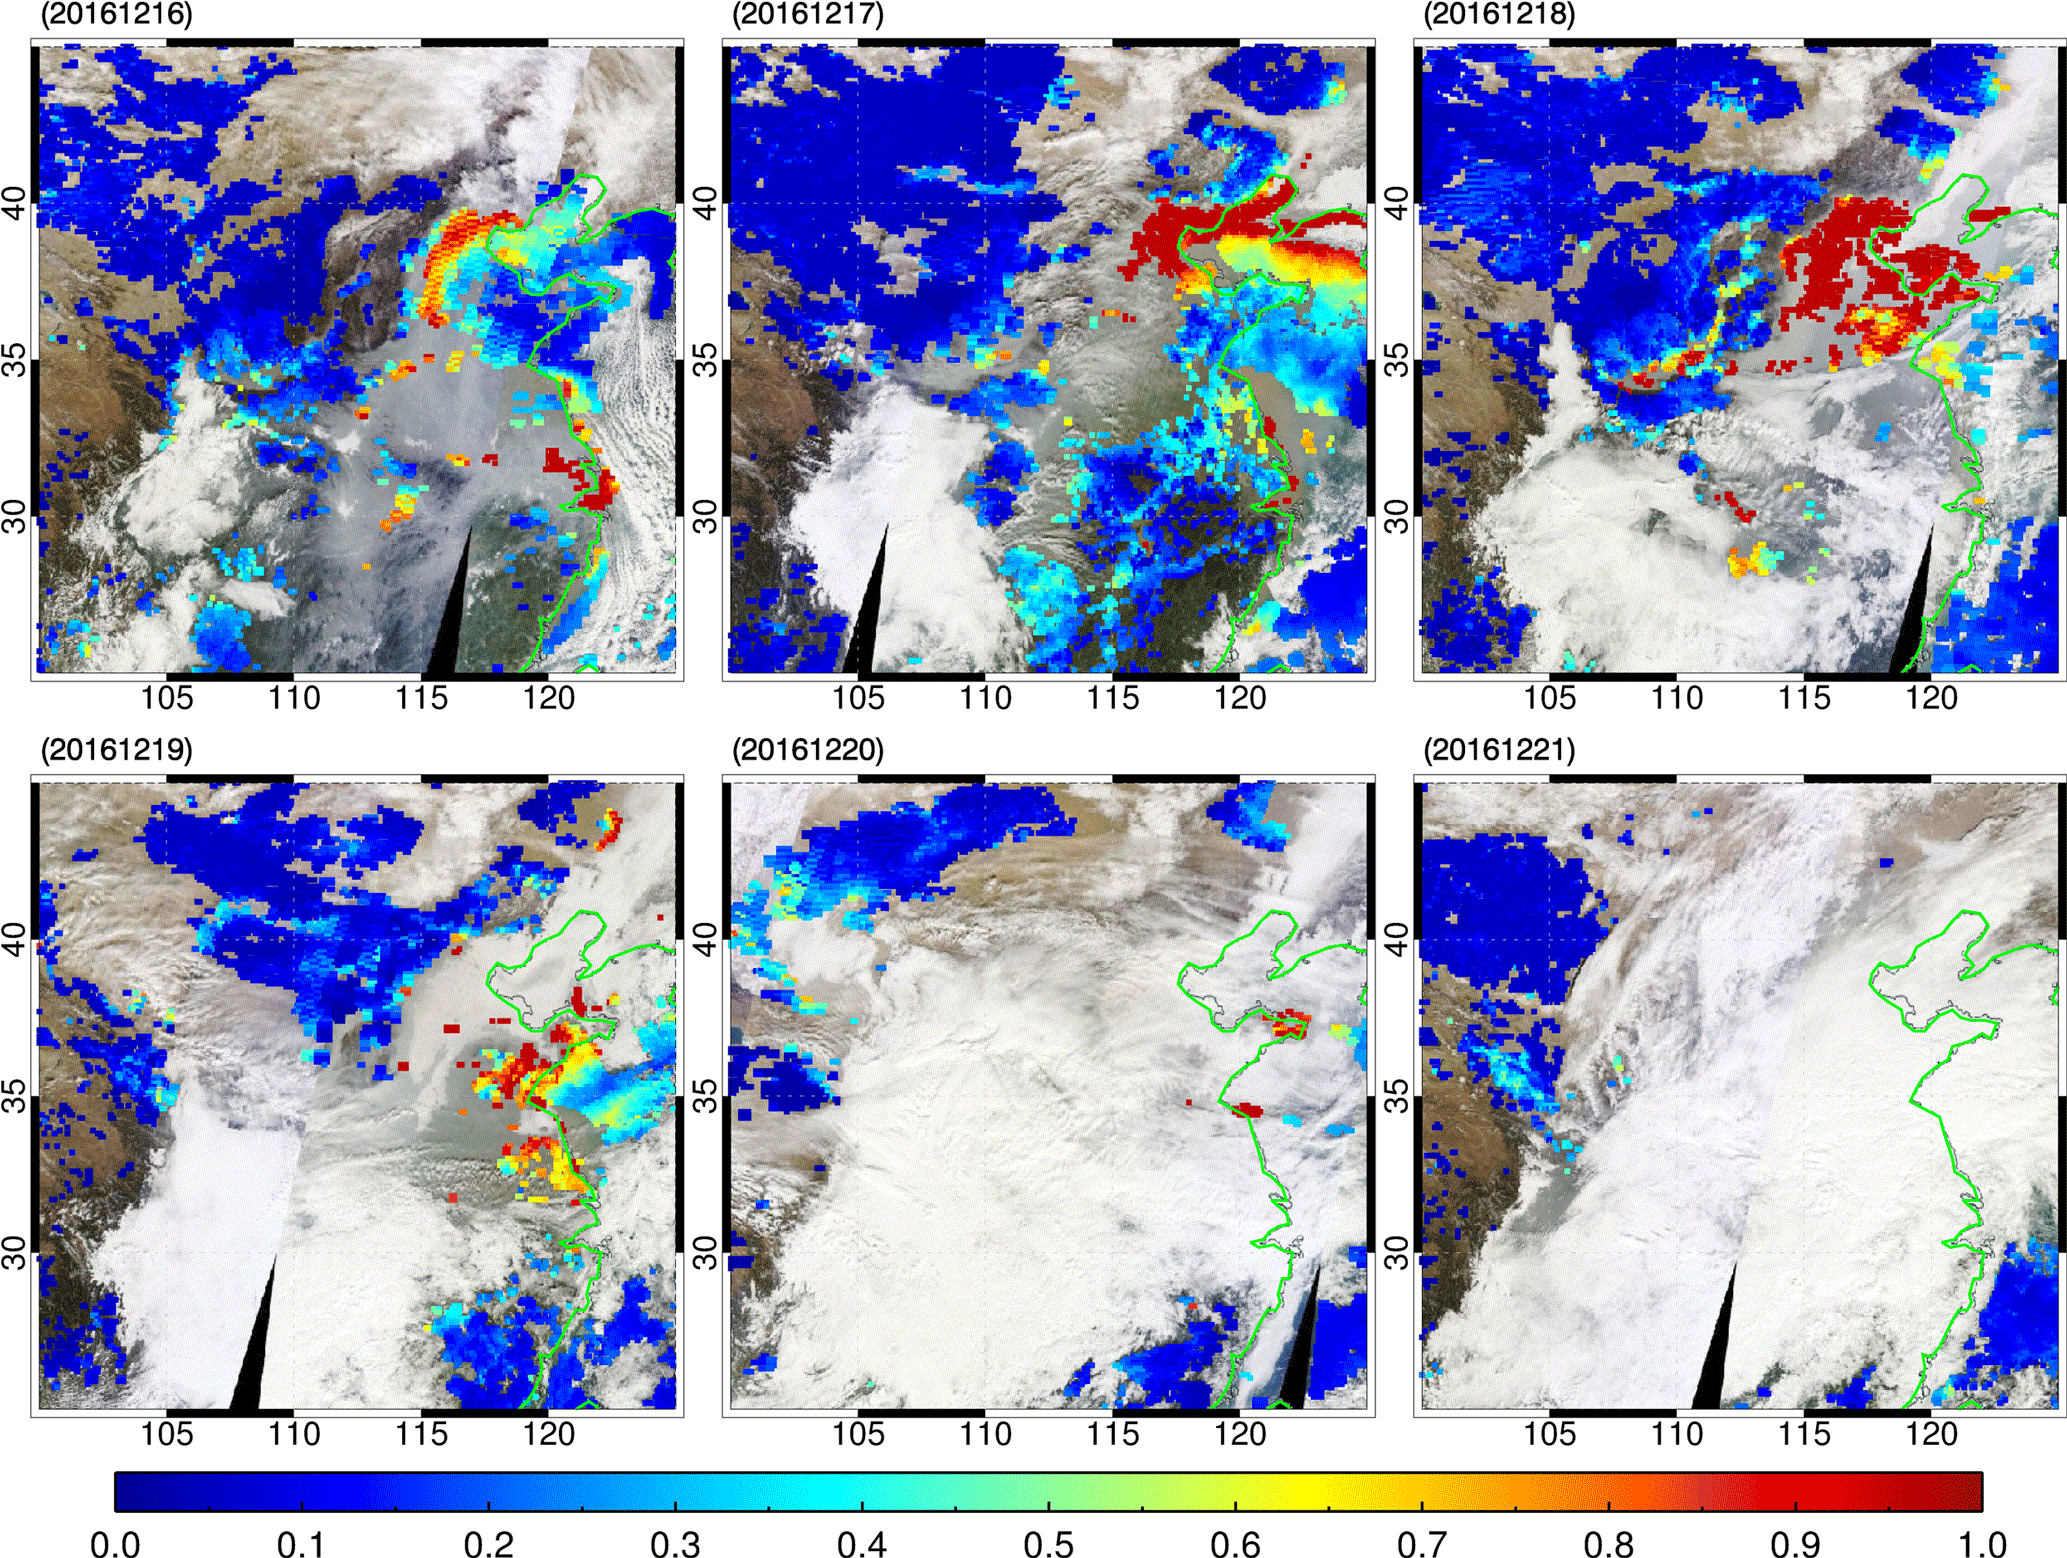
Figure 6Daily MODIS RGB and AOT for East China (100–125∘ E, 25–45∘ N) during the period 16–21 December 2016 (from top left to bottom right).
4.1 Verification
One important characteristic investigated is the instrument spectral response function (SRF) because it is the major difference between MERIS and OLCI for overlap channels. Figure 1 shows the SRF for the MERIS and OLCI overlap channels. The OLCI SRF mean dataset (https://sentinel.esa.int/web/sentinel/technical-guides/sentinel-3-olci/olci-instrument/spectral-response-function-data) has been used. Differences between MERIS and OLCI SRF are identified but have negligible impact on the retrieved AOT.
In order to quantitatively investigate the impact of different SRFs, the TOA reflectances have been simulated with and without taking SRF into account. The simulations have been determined by undertaking radiative transfer simulations using SCIATRAN for atmospheric and surface conditions (Rozanov et al., 2014). The MERIS observation geometry for 2 July 2009 over Paris was used to perform a forward simulation. In particular, the solar zenith angle, viewing angle, and relative azimuth were set to (32.32∘, 28.7∘, 30.65∘) as suggested in Mei et al. (2017a).
In order to design representative simulated scenarios, we define a comprehensive set of aerosol optical parameters, surface spectral reflectances, and other atmospheric properties comprising temperature and pressure profiles, the profiles of the concentration of gaseous absorbers and scattering. Suitable ranges of values for all relevant inputs for the radiative transfer model are obtained by statistical analysis of corresponding global products (Mei et al., 2016a). For this purpose, we use the following parameters.
Surface reflectance: three typical surface types representing vegetation, soil and water, i.e. relatively dark land (vegetation-covered city), bright land (desert), and water surface (ocean surface), were used. The typical vegetation and soil spectra are adapted from von Hoyningen-Huene et al. (2011), the liquid water spectrum comes from the SCIATRAN database (see references in Rozanov et al., 2014). Figure 2 shows the corresponding surface reflectance spectra for selected surface types.
Aerosol scenarios: within the ESA Aerosol-CCI project, a representative value for global mean AOT of 0.25 has been selected (Holzer-Popp et al., 2013; de Leeuw et al., 2015). Thus an AOT of 0.25 was selected for the simulation of “vegetation” and “water” cases. An AOT value of 0.5 was used for the “soil” scenario to represent a “real” case for the Sahara region. Moderately absorbing (fine-mode radius rv, f=0.150 µm, coarse-mode radius rv, c=3.19 µm, fine-mode variance σf=0.408, coarse-mode variance σc=0.754, fine/coarse-mode volumes (µm3 µm−3) are 0.055 and 0.038), pure maritime type (rv, f=0.150 µm, rv, c=3.19 µm, σf=0.408, σc=0.754, fine/coarse-mode volumes (µm3 µm3−) are 0.04 and 0.296) and dust aerosol model (rv, f=0.140 µm, rv, c=1.74 µm, σf=0.454, σc=0.687, fine/coarse-mode volumes (µm3 µm−3) are 0.02 and 0.157) were used for aerosol types.
Other atmospheric parameters: the profiles of temperature, pressure, and concentration of the gases ozone, O3, nitrogen dioxide, NO2, and molecular oxygen, O2, and water vapour, H2O, which all absorb in the 400–900 nm spectral region were provided by the Bremen 2-D chemical transport model (Sinnhuber et al., 2009).
In Table 1 the spectral channels of OLCI and MERIS are given. Figure 2a presents the surface spectral reflectance for the three surface types selected. Figure 2b presents the simulated TOA differences for the above scenarios. The differences for all surface/atmospheric conditions are less than 1.5 %. These are similar to the simulation with and without convolution for MERIS with the exception of the O2A and water vapour channels. However, the potential impacts of different SRFs may also introduce some uncertainties to the XBAER cloud mask due to the relatively strong impact of SRF to the O2A channels (about 20 % difference).
4.2 First XBAER AOT retrieval for OLCI and its validation
AERONET observations are considered to be the “ground truth” for satellite validation (Holben et al., 1998). Here, we collocate the XBAER OLCI aerosol retrievals with the AERONET Version 3.0 (https://aeronet.gsfc.nasa.gov/new_web/Documents/AERONET-V3_News_Final.pdf, last access: 15 May 2017), Level 1.5 (level 2.0 for both AERONET Version 2.0 and 3.0 are not available until 15 May 2017) (Holben et al., 1998; Smirnov et al., 2000). As AERONET does not provide AOT at 0.55 µm, data are interpolated to 0.55 µm using quadratic fits on a log–log scale (Eck et al., 1999). Since AERONET provides a point measurement with high temporal resolution while satellite observations represent a “regional” measurement depending on the satellite spatial resolution for a particular overpass time, spatial statistics for the OLCI data are calculated and compared to the temporal statistics of the AERONET observations taken within ±30 min of OLCI overpass following the spatial–temporal technique of Ichoku et al. (2002).
Figure 3 is a plot which compares XBAER-derived and AERONET-observed AOT at 0.55 µm. The collocations of Fig. 3 contain various surface and aerosol types, which ensure a wide representativeness of the validation. A total of 733 collocations were found for December 2016. The colour of each ordered pair (0.025×0.025 increment) represents the number of such matchups. Negative AOT (0.1) values are possible and reasonable as a result of the noise in satellite observations (Levy et al., 2007) and uncertainties of surface parameterization. The comparison here excluded negative values and only AOT values between 0.0 and 2.5 are used following the validation method of other aerosol products (Sayer et al., 2012; Levy et al., 2013). The validation contains various surface and aerosol types, which ensures a wide representativeness of the validation. The regression equation is with slightly higher correlation compared to the first MERIS validation (R=0.82 vs. R=0.78) (Mei et al., 2016a). The AOT is reasonably correlated between the two datasets (R=0.82), with increased scatter for high aerosol loadings. The majority of the data (87.5 %) are for low aerosol loadings (AOT <0.3). The comparison between XBAER AOTs and AERONET observations shows the acceptable quality of the first OLCI XBAER results.
Figure 4 shows the global monthly AOT of December 2016 for MODIS collection 6 (Levy et al., 2013), MISR (Diner et al., 2005) and OLCI (XBAER) algorithm. In order to identify biomass burning events, the active fire points of MODIS (https://lance.modaps.eosdis.nasa.gov/cgi-bin/imagery/firemaps.cgi) are added to the figures. Please note that the MISR “FIRSTLOOK” product is used because the monthly Land Surface and Aerosol products are not yet processed for December 2016 (NASA Langley ASDC, personal communication, 2017). MODIS/MISR on board of TERRA and OLCI on board of Sentinel-3 have very similar overpass time (within 30 min difference). Therefore, all four results should show similar patterns for large AOT from desert dust events over the Sahara, biomass burning over West Africa and the Amazon region, and anthropogenic pollution over India and East Asia. In Fig. 4, XBAER AOT from OLCI shows similar patterns as the AOT from MODIS and MISR for both land and ocean. However, there are differences in the magnitude of the AOTs. Biomass burning over Africa, as observed in the MODIS active fire product, produces a “plume belt” of high AOT near the Equator. This is observed in all three AOT products. The AOT distribution pattern over India, which depends on the unique meteorological conditions and emissions, is captured by the three AOT data products as well. MODIS and OLCI show similar pattern and magnitude of large AOT over eastern China while the values from MISR are slightly lower, which may be due to the relatively small sampling compared to MODIS and OLCI. However, the retrievals from XBAER over Australia are higher than those of MODIS and MISR. In addition to potential contamination by thin clouds observed in the RGB composite figures, the calibration uncertainties associated with a new instrument may also contribute to the bias of XBAER-derived AOT. The large AOT differences over the Sahara may stem, in part, from different assumptions in the different algorithms for bright surfaces (Lyapustin et al., 2011b; Mei et al., 2016a). Different patterns over the Amazon can most likely be attributed to the use of different cloud-screening methods. The global patterns obtained indicate that the generic XBAER algorithm works over both dark and bright surfaces using its flexible surface parameterization approach. For relative dark surfaces, the one-parametric surface parameterization is dominated by the first term (SAVI or NDPI tuned term) making XBAER behave like the Dark-Target-like retrieval algorithm. For bright surfaces such as desert, XBAER becomes similar to the DeepBlue AOT retrieval algorithm.

4.3 Beijing haze event observed by OLCI
In the following we show the ability of the retrievals of XBAER used with OLCI data to resolve spatial aerosol patterns on a synoptic scale. A prolonged haze event was observed over Beijing during the period 16–21 December 2016. The intention of applying XBAER to this event is to show the potential of the retrieval to resolve aerosol patterns at a local level and thus being able to support future studies analysing such events. This event is investigated by both ground-based measurements and satellite observations. Figure 5a shows that winds at the surface were weak, with a daily averaged wind speed lower than 3.5 m s−1 during the period, causing the accumulation of pollutants on a regional scale. The low temperature and high surface pressure near the surface indicate relatively stable atmospheric conditions in the vertical direction (Fig. 5b and c). The dispersion of pollutants out of the boundary layer is therefore slow. The relative humidity remained high (Fig. 5b), causing the aerosol particles size to increase by the uptake of water (Winkler, 1988), thus making the haze event stronger. Under these meteorological conditions, pollutants can accumulate over the North China Plain (NCP) (Li et al., 2011).
Figure 5d shows the time series of concentration of SO2 and NO2 in the boundary layer provided by ground-based measurements. The concentrations of SO2 and NO2 for haze periods are three to five times larger than those on relatively clear days. We thus assume anthropogenic activities to be the major source of AOT. Figure 5e and f show the AOT from AERONET sites and the time series of the daily mean concentration of PM2.5 in Beijing with clearly increased values in the same timespan (16–21 December). The lack of larger AOT values observed by AERONET is likely going back to too strict cloud-screening procedures. The daily mean concentrations of PM2.5 during 16–21 December 2016 ranged from 107.1 to 394.5 µg m−3, which is far above the daily PM2.5 limit of the new threshold value set as the Chinese Ambient Air Quality standard (75 µg m−3) (http://transportpolicy.net/index.php?title=China:_Air_Quality_Standards). A large Ångström coefficient (Fig. 5e) shows that fine particles dominate during this period. In summary, we find that the cause of the haze event in Beijing and northeastern China can be traced back to (1) the stable meteorological conditions (low wind speeds and temperature inversion), (2) local emissions, and (3) high relative humidity.
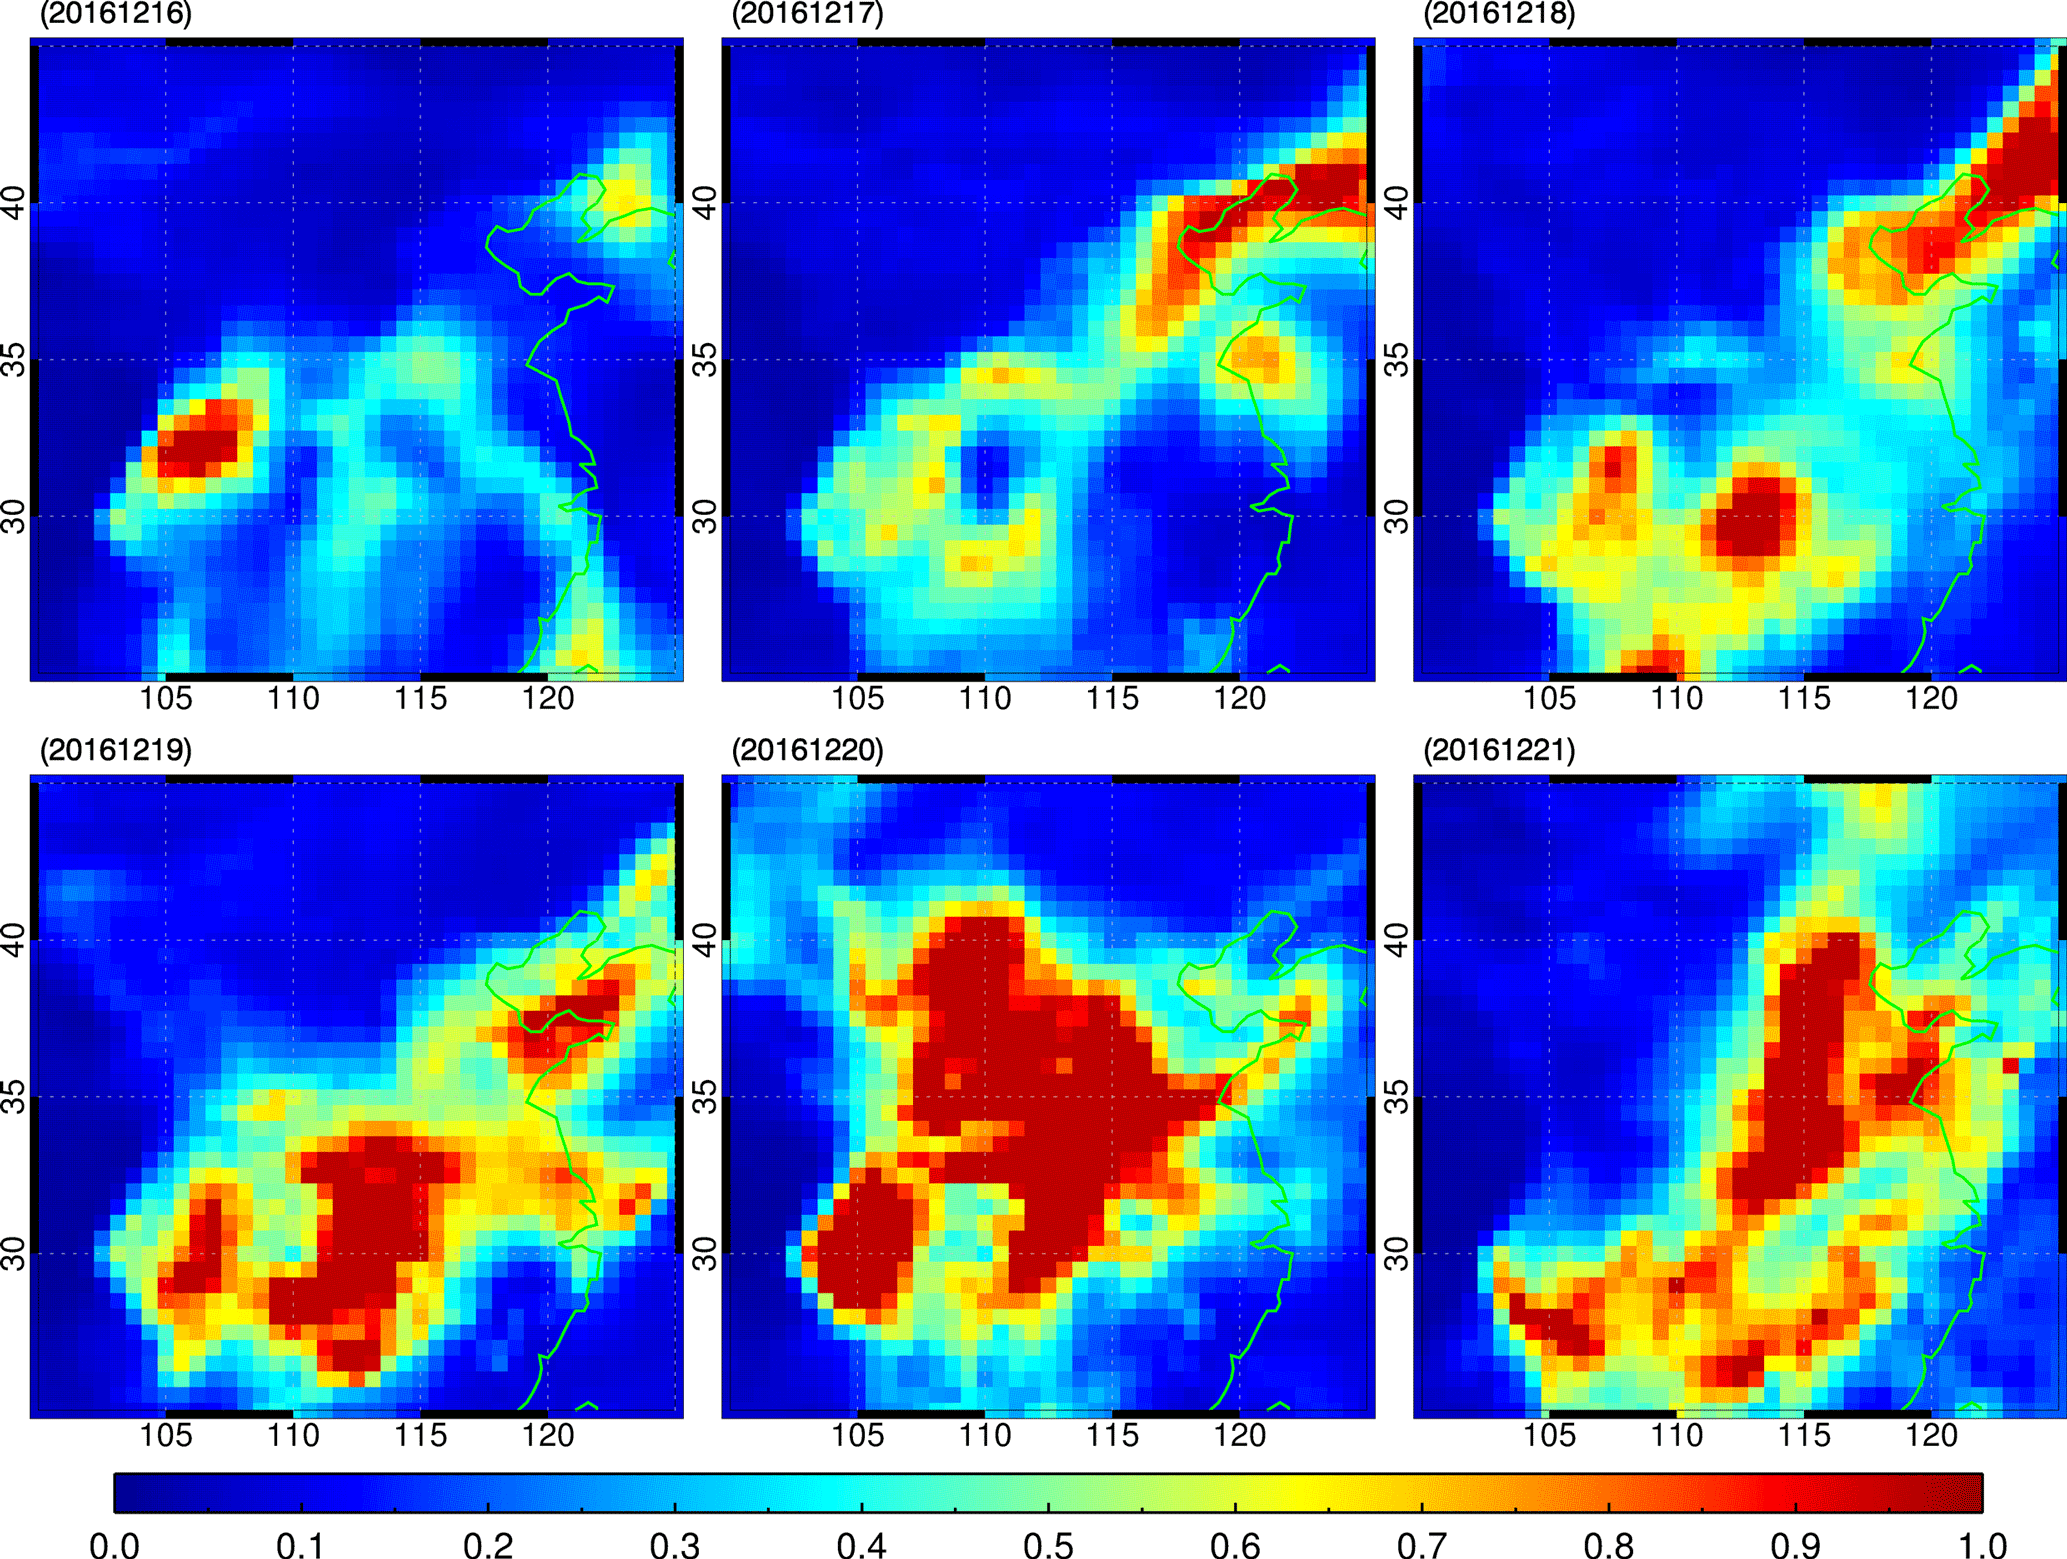
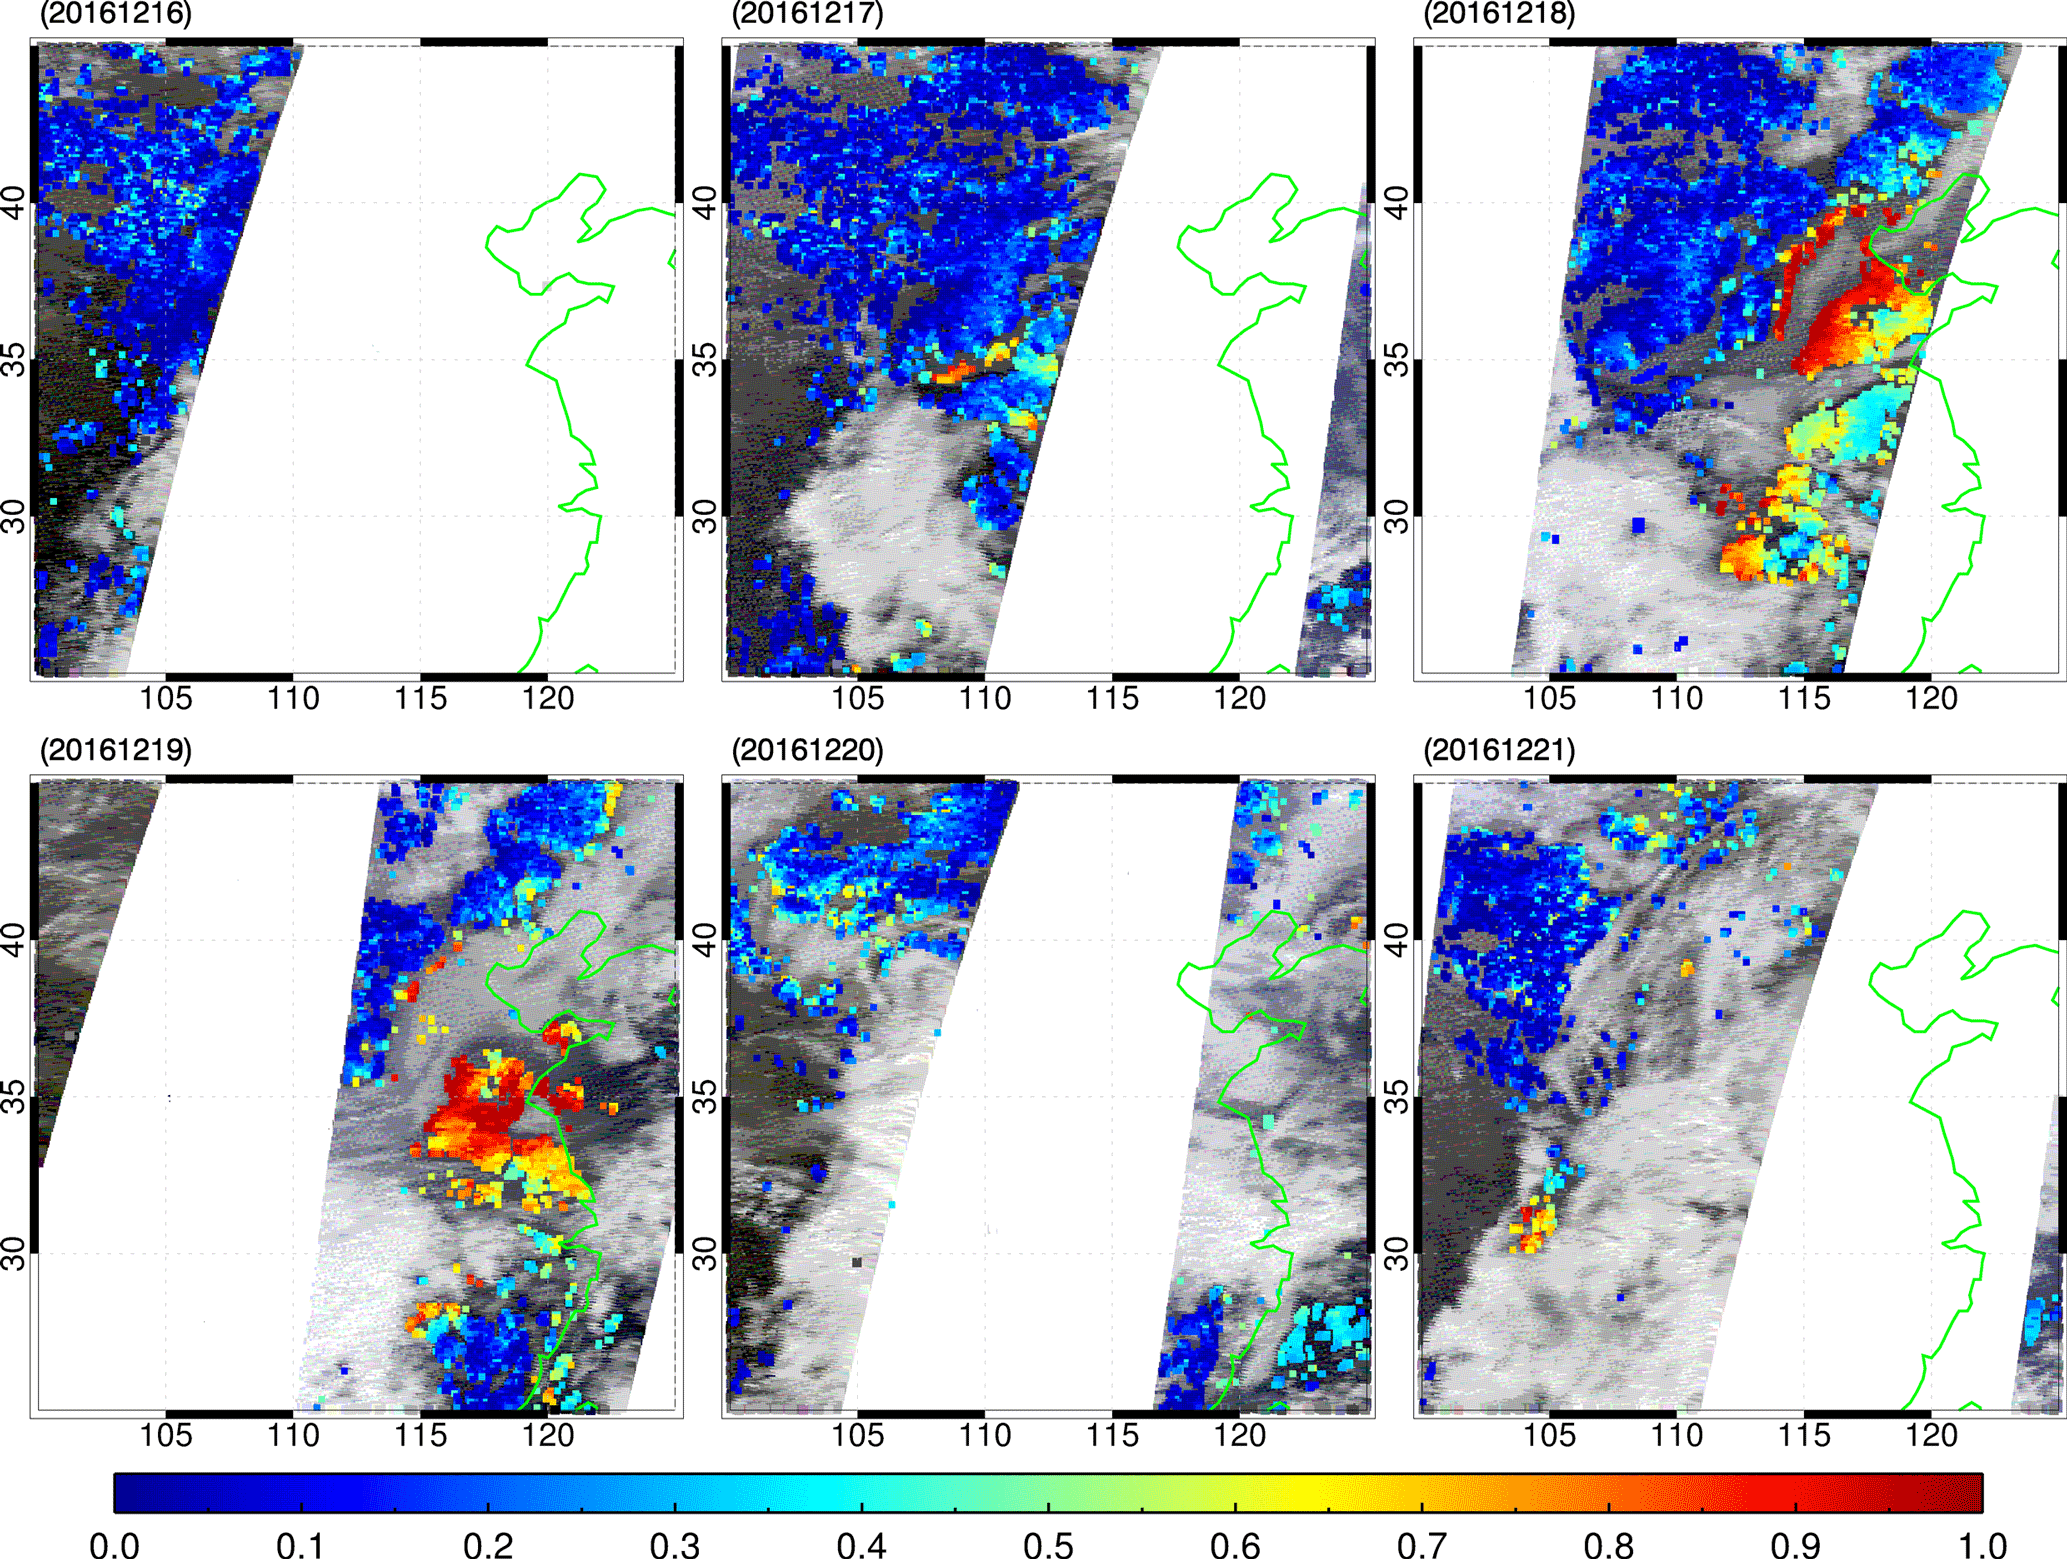
Figure 6 shows the MODIS/Terra-derived AOT for the haze period. According to Fig. 6, this intense part of the haze episode has been partly observed by MODIS. However, a large part of it (under cloud-free conditions) during the first 3 days is missing, mainly due to cloud masking applied in the MODIS aerosol retrieval. Figure 7 shows the AOT from Modern-Era Retrospective analysis for Research and Applications Version 2 (MERRA-2) simulation (Rienecker et al., 2011) in order to exclude the impact from cloud screening. According to Fig. 7, the shape of the area covered by high AOT in MERRA remains stable except for 20 December, indicating the relative stable meteorological condition during the haze period. Due to the narrower swath width of OLCI compared to that of MODIS (1270 km vs. 2300 km), OLCI has a longer “revisit” time for a repetitive observation of the ground scene in Beijing. According to Figs. 6 and 8, XBAER discards fewer clear-sky ground scenes than the MODIS retrieval, in particular on 18 and 19 December over eastern China. For this period, the aerosol over eastern China has been characterized as “moderately absorbing aerosol”. The single-scattering albedo at 0.675 µm from AERONET has values between 0.88 and 0.91, indicating relatively strong absorption from anthropogenic activities. The magnitude of AOT for the overlap regions between OLCI and MERRA are comparable according to Figs. 7 and 8. The regions of high aerosol agree well with the areas having high NO2 columns in Global Ozone Monitoring Experiment 2 (GOME2) (Richter et al., 2011) for the corresponding time period as presented in Fig. 9. Figure 8 illustrates that cloud masking, surface treatment, and aerosol type selection in XBAER all work well for the detection of extreme haze events. Studies like the one by Zheng et al. (2015) usually focus on the origin of such plumes and the speciation of aerosol particles on a city level. XBAER results utilizing multi-spectral imagery such as provided by OLCI can support this kind of study to identify plume transport and extension. This implies that the OLCI instrument can provide important data on AOT for atmospheric research.
In this study, we have applied XBAER to data from the OLCI instrument onboard Sentinel-3 for the first time on both synoptic and global scale. The potential differences caused by different spectral response functions for OLCI and MERIS have been investigated by using SCIATRAN to generate representative simulated scenarios for dust aerosol type over desert, moderately absorbing aerosol over vegetation regions, and maritime aerosol over water. The overall differences for all selected channels for XBAER are smaller than 1.5 %. This implies that XBAER can be used to retrieve AOT from OLCI. Although relatively large differences caused by SRFs (approximately 20 %) have been found for the O2A channels, the global retrieval of OLCI shows that the original MERIS cloud masking, which includes the use of O2A channels, works well for OLCI and can potentially even be improved as only MERIS-heritage channels have been used so far with OLCI.
The global monthly mean XBAER AOT maps for December 2016 show good agreement with those by MODIS and MISR. The comparison with AERONET measurements reveals that XBAER can provide promising results over both dark and bright surface. The first comparison with AERONET shows acceptable agreement between the two data sets, with a regression yielding and correlation of R=0.82. The global retrievals confirm that XBAER is valid for both dark and bright surfaces because of its use of an optimized monthly global SSR spectral coefficients dataset.
A significant haze event during December 2016 over Beijing has been analysed in this paper based on ground-based and satellite observations to show the potential of the retrieval to resolve aerosol patterns at a local level and thus being able to support future studies analysing such events. This large haze event has been attributed to the large local emissions under unfavourable meteorological conditions (temperature inversion in vertical direction and no advection). The MODIS/Terra- and OLCI-derived AOT both detect the haze event. However, due to cloud screening, the MODIS AOT partly misses it while the OLCI AOT is able to detect the main pattern of haze for clear conditions. The overlap retrieval for both MODIS and OLCI has similar values, indicating that OLCI provides another useful data source for air pollution monitoring.
Although the study shows that XBAER can be applied to OLCI observations for synoptic to global applications, several important issues need to be addressed in the future work. Potential cloud contamination due to both the relative large calibration uncertainty of OLCI compared to MERIS as well as the impact of SRF on O2A channel need to be investigated with the new version of level 1 TOA reflectance dataset. Modification or improvement for OLCI cloud screening will be included, besides the criteria of brightness, texturing/variability, and cloud altitude of the scenes (Mei et al., 2017b). The underestimation of AOT over regions like the Sahara could be explained by the spheroid dust model adapted from MODIS-DT algorithm due to the impact of non-sphericity of dust particles on the aerosol phase function (Mei et al., 2016a) – a new spheroid model accounting for aerosol particle non-sphericity will be included in the new version (Dubovik et al., 2006). The cloud-screening evaluation shows that approximately 5–10 % clouds may be misclassified as retrievable clear cases for MERIS (Mei et al., 2016b), which introduces both bias and potential patchiness of XBAER-derived AOT for OLCI. Thus a new cloud post-processing, following the AATSR dual-view (ADV) algorithm (Sogacheva et al., 2017), will be applied to discard the pixels that might potentially be affected by cloud (cloud edge, very thin cloud, and so on).
The XBAER-derived OLCI product is available upon request to the corresponding author.
The authors declare that they have no conflict of interest.
The authors would like to express their appreciation to Andreas Heckel from Swansea University, Bahjat Alhammoud/Manuel Arias from
ARGANS Ltd, and Debbie Richards from EUMETSAT for very valuable and detailed discussion about the OLCI instrument. The discussion
of model simulations with Anne Blechschmidt and Abram Sanders from the University of Bremen is highly appreciated. We would also like to
express our gratitude to the AERONET PIs for establishing and maintaining the long-term AERONET stations used for the validation. The
atmospheric components and meteorological data are from https://www.aqistudy.cn/historydata/index.php and
https://www.wunderground.com/. The MODIS fire point product is available from https://worldview.earthdata.nasa.gov/. We
would also like to thank the anonymous reviewers for their valuable comments, which greatly improved the quality of this
paper. The project is partly funded by the University and State of Bremen and the German Science Foundation (DFG) Trans Regio
SFB “Arctic Amplification TR 172”. This work was partly supported by the European Space Agency as part of the Aerosol_CCI project.
This research is in part a contribution by IUP/UB to MARUM a DFG-Research Center/Cluster of Excellence “The Ocean in the Earth
System” (OC-CCP1).
The article processing charges for this open-access
publication were covered by the University of Bremen.
Edited by: Alma Hodzic
Reviewed by: three anonymous referees
American Academy of Pediatrics Committee on Environmental Health: Ambient air pollution: respiratory hazards to children, Pediatrics, 91, 1210–1213, 1993.
Chung, C. E., Ramanathan, V., and Kiehl, J. T.: Effect of the South Asian absorbing haze on the northeast monsoon and surface–air heat exchange, J. Climate, 15, 2462–2476, https://doi.org/10.1175/1520-0442(2002)015<2462:EOTSAA>2.0.CO;2, 2002.
Dadvand, P., Parker, J., Bell, M. L., Bonzini, M., Brauer, M., Darrow, L. A., Gehring, U., Glinianaia, S. V., Gouveia, N., Ha, E.-H., Leem, J. H., van den Hooven, E. H., Jalaludin, B., Jesdale, B. M., Lepeule, J., Morello-Frosch, R., Morgan, G. G., Pesatori, A. C., Pierik, F. H., Pless-Mulloli, T., Rich, D. Q., Sathyanarayana, S., Seo, J., Slama, R., Strickland, M., Tamburic, L., Wartenberg, D., Nieuwenhuijsen, M. J., and Woodruff, T. J.: Maternal exposure to particulate air pollution and term birth weight: a multi-country evaluation of effect and heterogeneity, Environ. Health Persp., 121, 367–373, https://doi.org/10.1289/ehp.1205575, 2013.
de Leeuw, G., Holzer-Popp, T., Bevan, S., Davies, W., Descloitres, J., Grainger, R. G., Griesfeller, J., Heckel, A., Kinne, S., Klüser, L., Kolmonen, P., Litvinov, P., Martynenko, D., North, P. J. R., Ovigneur, B., Pascal, N., Poulsen, C., Ramon, D., Schulz, M., Siddans, R., Sogacheva, L., Tanré, D., Thomas, G. E., Virtanen, T. H., von Hoyningen Huene, W., Vountas, M., and Pinnock, S. : Evaluation of seven European aerosol optical depth retrieval algorithms for climate analysis, Remote Sensing Environment, 162, 295–315, 2015.
Diner, D. J., Martonchik, J. V., Kahn, R. A., Pinty, B., Gobron, N., Nelson, B. N., and Holben, B. N.: Using angular and spectral shape similarity constraints to improve MISR aerosol and surface retrievals over land, Remote Sens. Environ., 94, 155–171, 2005.
Dubovik, O., Sinyuk, A., Lapyonok, T., Holben, B. N., Mishchenko, M., Yang, P., Eck. T. F., Volten, H., Munoz, O., Veihelmann, B., van der Zande, W. J., Leon, J.-F., Sorokin, M., and Slutsker, I.: Application of spheroid models to account for aerosol particle nonsphericity in the remote sensing of desert dust, J. Geophys. Res.-Atmos., 111, D11208, https://doi.org/10.1029/2005JD006619, 2006.
Dubovik, O., Lapyonok, T., Litvinov, P., Herman, M., Fuertes, D., Ducos, F., Torres, B., Derimian, Y., Huang, X., Lopain, A., Chaikovsky, A., Aspetsberger, M., and Federspiel, C.: GRASP: a versatile algorithm for characterizing the atmosphere, SPIE Newsroom, 1–4, https://doi.org/10.1117/2.1201408.005558, 2014.
Eck, T. F., Holben, B. N., Reid, J. S., Dubovik, O., Smirnov, A., O'Neill, N. T., Slutsker, I., and Kinne, S.: Wavelength dependence of the optical depth of biomass burning, urban, and desert dust aerosols, J. Geophys. Res.-Atmos., 104, 31333–31349, 1999.
Evan, A. T., Kossin, J. P., Chung, C. E., and Ramanathan, V.: Arabian Sea tropical cyclones intensified by emissions of black carbon and other aerosols, Nature, 479, 94–97, https://doi.org/10.1038/nature10552, 2011.
Holzer-Popp, T., de Leeuw, G., Griesfeller, J., Martynenko, D., Klüser, L., Bevan, S., Davies, W., Ducos, F., Deuzé, J. L., Graigner, R. G., Heckel, A., von Hoyningen-Hüne, W., Kolmonen, P., Litvinov, P., North, P., Poulsen, C. A., Ramon, D., Siddans, R., Sogacheva, L., Tanre, D., Thomas, G. E., Vountas, M., Descloitres, J., Griesfeller, J., Kinne, S., Schulz, M., and Pinnock, S.: Aerosol retrieval experiments in the ESA Aerosol_cci project, Atmos. Meas. Tech., 6, 1919–1957, https://doi.org/10.5194/amt-6-1919-2013, 2013.
Holben, B. N., Eck, T. F., Slutsker, I., Tanre, D., Buis, J. P., Setzer, A., Vermote, E., Reagan, J. A., Kaufman, Y. J., Nakajima, T., Lavenu, F., Jankowiak, I., and Smirnov, A.: AERONET – a federated instrument network and data archive for aerosol characterization, Remote Sensing Environment, 66, 1–16, 1998.
Hsu, N. C., Jeong, M.-J., Bettenhausen, C., Sayer, A. M., Hansell, R., Seftor, C. S., Huang, J., and Tsay, S.-C.: Enhanced Deep Blue aerosol retrieval algorithm: The second generation, J. Geophys. Res.-Atmos., 118, 9296–9315, https://doi.org/10.1002/jgrd.50712, 2013.
Ichoku, C., Chu, D., Mattoo, S., Kaufman, Y. J., Remer, L., Tanre, D., Slutsker, I., and Holben, N. B.: A spatio-temporal approach for global validation and analysis of MODIS aerosol products, Geophys. Res. Lett., 29, 1616, https://doi.org/10.1029/2001GL013206, 2002.
Ji, D. S., Wang, Y. S., Wang, L. L., Chen, L. F., Hu, B., Tang, G. Q., Xin, J. Y., Song, T., Wen, T. X., Sun, Y., Pan, Y. P., and Liu, Z. R.: Analysisi of heavy pollution episodes in selected cities of northern China, Atmos. Res., 50, 338–348, https://doi.org/10.1016/j.atmosenv.2011.11.053, 2012.
Kaufman, Y. J., Tanre, D., and Boucher, O.: A satelite view of aerosols in the climate system, Nature, 419, 215–223, https://doi.org/10.1038/nature01091, 2002.
Kolmonen, P., Sogacheva, L., Virtanen, T. H., de Leeuw, G., and Kulmala, M.: The ADV/ASV AATSR aerosol retrieval algorithm: current status and presentation of a full-mission AOD dataset, Int. J. Digit. Earth, 9, 545–561, https://doi.org/10.1080/17538947.2015.1111450, 2016.
Levy, R., Remer, L., Mattoo, S., Vermote, E., and Kaufman, Y. J. : Second-generation operational algorithm: Retrieval of aerosol properties over land from inversion of Moderate Resolution Imaging Spectroradiometer spectral reflectance, J. Geophys. Res.-Atmos., 112, D13211, https://doi.org/10.1029/2006JD007811, 2007.
Levy, R. C., Mattoo, S., Munchak, L. A., Remer, L. A., Sayer, A. M., Patadia, F., and Hsu, N. C.: The Collection 6 MODIS aerosol products over land and ocean, Atmos. Meas. Tech., 6, 2989–3034, https://doi.org/10.5194/amt-6-2989-2013, 2013.
Li, Z. Q., Li, C., Chen, H., Tsay, S.-C., Holben, B., Huang, J., Li, B., Maring, H., Qian, Y., Shi, G., Xia, X., Yin, Y., Zheng, Y., and Zhuang, G.: East Asian studies of tropospheric aerosols and their impact on regional climate (EAST-AIRC): an overview, J. Geophys. Res.-Atmos., 116, D00K34, https://doi.org/10.1029/2010JD015257, 2011.
Lin, M., Tao, J., Chan, C. Y., Cao, J. J, Zhang, Z. S., Zhu, L. H., and Zhang, R. J.: Regression analyses between recent air quality and visibility changes in megacities at four haze regions in China, Aerosol Air Qual. Res., 12, 1049–1061, https://doi.org/10.4209/aaqr.2011.11.0220, 2012.
Liu, X. G., Li, J., Qu, Y., Han, T., Hou, L., Gu, J., Chen, C., Yang, Y., Liu, X., Yang, T., Zhang, Y., Tian, H., and Hu, M.: Formation and evolution mechanism of regional haze: a case study in the megacity Beijing, China, Atmos. Chem. Phys., 13, 4501–4514, https://doi.org/10.5194/acp-13-4501-2013, 2013.
Lyapustin, A., Wang, Y., Laszlo, I., Kahn, R., Korkin, S., Remer, L., Levy, R., and Reid, J. S.: Multiangle implementation of atmospheric correction (MAIAC): 2. Aerosol algorithm, J. Geophys. Res.-Atmos., 116, D03211, https://doi.org/10.1029/2010JD014986, 2011.
Mei, L., Rozanov, V. V., Vountas, M., Burrows, J. P., Levy, R. C., and Lotz, W. A.: Retrieval of aerosol optical properties using MERIS observations: algorithm and some first results, Remote Sensing Environment, 197, 125–141, https://doi.org/10.1016/j.rse.2016.11.015, 2017a.
Mei, L. L., Vountas, M., Gómez-Chova, L., Rozanov, V., Jäger, M., Lotz, W., Burrows, J. P., and Hollmann, R.: A Cloud masking algorithm for the XBAER aerosol retrieval using MERIS data, Remote Sensing Environment, 197, 141–160, https://doi.org/10.1016/j.rse.2016.11.016, 2017b.
North, P., Briggs, S., Plummer, S., and Settle, J.: Retrieval of land surface bidirectional reflectance and aerosol opacity from ATSR-2 multiangle imagery, IEEE T. Geosci. Remote, 37, 526–537, 1999.
Pudasainee, D., Sapkota, B., Shrestha, M. L., Kaga, A., Kondo, A., and Inoue, Y.: Ground level ozone concentrations and its association with NOx and meteorological parameters in Kathmandu valley, Nepal, Atmos. Environ., 40, 8081–8087, https://doi.org/10.1016/j.atmosenv.2006.07.011, 2006.
Popp, T., deLeeuw, G., Bingen, C., Brühl, C., Capelle, V., Chedin, A., Clarisse, L., Dubovik, O., Grainger, R., Griesfeller, J., Heckel, A., Kinne, S., Klüser, L., Kosmale, M., Kolmonen, P., Lelli,L., Litvinov, P., Mei, L., North, P., Pinnock,S., Povey, A., Robert, C., Schulz, M., Sogacheva, L., Stebel, K., Zweers, D. S., Thomas, G., Gijsbert Tilstra, L., Vandenbussche, S., Veefkind, P., Vountas, M., and Xue, Y.: : Development, production and evaluation of aerosol climate data records from european satellite observations (Aerosol_cci), Remote Sensing, 8, 421, https://doi.org/10.3390/rs8050421, 2016.
Richter, A., Begoin, M., Hilboll, A., and Burrows, J. P.: An improved NO2 retrieval for the GOME-2 satellite instrument, Atmos. Meas. Tech., 4, 1147–1159, https://doi.org/10.5194/amt-4-1147-2011, 2011.
Rienecker, M. M., Suarez, M. J., Gelaro, R., Todling, R., Bacmeister, J., Liu, R., Bosilovich, M. G., Schubert, S. D., Takacs, L., Kim, G-K, Bloom, S., Chen, J., Collins, D., Conaty, A., da Silva, A., Gu, W., Joiner, J., Koster, R. D., Lucchesi, R., Molod, A., Owens, T., Pawson, S., Pegion, P., Redder, C. R., Reichle, R., Robertson, F. R., Ruddick, A. G., Sienkiewicz, M., and Woollen, J.: MERRA: NASA's Modern-Era Retrospective Analysis for Research and Applications, J. Climate, 24, 3624–3648, 2011.
Rozanov, V., Rozanov, A., Kokhanovsky, A., and Burrows, J.: Radiative transfer through terrestrial atmosphere and ocean: software package SCIATRAN, J. Quant. Spectrosc. Ra., 133, 13–71, 2014.
Santer, R., Ramon, D., Vidot, J., and Dilligeard, E.: A surface reflectance model for aerosol remote sensing over land, Int. J. Remote Sens., 28, 737–760, 2007.
Sayer, A. M., Hsu, N. C., Bettenhausen, C., Ahmad, Z., Holben, B., Smirnov, A., Thomas, G. E., and Zhang, J.: SeaWiFS Ocean Aerosol Retrieval (SOAR): algorithm, validation, and comparison with other data sets, J. Geophys. Res.-Atmos., 117, D03206, https://doi.org/10.1029/2011JD016599, 2012.
Sezer, T. F., Nuhoglu, A., and Bayraktar, H.: Impacts of some meteorological parameters on SO2 and TSP concentrations in Erzurum, Turkey, Chemosphere, 59, 1633–1642, https://doi.org/10.1016/j.chemosphere.2005.02.003, 2005.
Sinnhuber, B.-M., Sheode, N., Sinnhuber, M., Chipperfield, M. P., and Feng, W.: The contribution of anthropogenic bromine emissions to past stratospheric ozone trends: a modelling study, Atmos. Chem. Phys., 9, 2863–2871, https://doi.org/10.5194/acp-9-2863-2009, 2009.
Smirnov, A., Holben, B. N., Eck, T. F., Dubovik, O., and Slutsker, I.: Cloud-screening and quality control algorithms for the AERONET database, Remote Sens. Environ., 73, 337–349, 2000.
Sogacheva, L., Kolmonen, P., Virtanen, T. H., Rodriguez, E., Saponaro, G., and de Leeuw, G.: Post-processing to remove residual clouds from aerosol optical depth retrieved using the Advanced Along Track Scanning Radiometer, Atmos. Meas. Tech., 10, 491–505, https://doi.org/10.5194/amt-10-491-2017, 2017.
Thomas, G. E., Poulsen, C. A., Sayer, A. M., Marsh, S. H., Dean, S. M., Carboni, E., Siddans, R., Grainger, R. G., and Lawrence, B. N.: The GRAPE aerosol retrieval algorithm, Atmos. Meas. Tech., 2, 679–701, https://doi.org/10.5194/amt-2-679-2009, 2009.
Verstraete, M. M., Pinty, B., and Curran, P. J.: MERIS potential for land applications, Int. J. Remote Sens., 20, 1747–1756, 1999.
von Hoyningen-Huene, W., Freitag, M., and Burrows, J. P.: Retrieval of aerosol optical thickness over land surface from top-of-atmosphere radiance, J. Geophys. Res.-Atmos., 108, D9, https://doi.org/10.1029/2001JD002018, 2003.
von Hoyningen-Huene, W., Yoon, J., Vountas, M., Istomina, L. G., Rohen, G., Dinter, T., Kokhanovsky, A. A., and Burrows, J. P.: Retrieval of spectral aerosol optical thickness over land using ocean color sensors MERIS and SeaWiFS, Atmos. Meas. Tech., 4, 151–171, https://doi.org/10.5194/amt-4-151-2011, 2011.
Wilkomirski, B., Sudnik-Wojcikowska, B., Galera, H., Wierzbicka, M., and Malawska, M.: Railway transportation as a serious source of organic and inorganic pollutionn, Water Air Soil Poll., 218, 333–345, https://doi.org/10.1007/s11270-010-0645-0, 2011.
Winkler, P.: The growth of atmospheric aerosol particles with relative humidity, Phys. Scripta, 37, 223–230, https://doi.org/10.1088/0031-8949/37/2/008, 1988.
Zhao, P. S., Zhang, X. L., Xu, X. F., and Zhao, X. J.: Long-term visibility trends and characteristics in the region of Beijing, Tianjin, and Hebei, China, Atmos. Res., 101, 711–718, https://doi.org/10.1016/j.atmosres.2011.04.019, 2011.
Zheng, G. J., Duan, F. K., Su, H., Ma, Y. L., Cheng, Y., Zheng, B., Zhang, Q., Huang, T., Kimoto, T., Chang, D., Pöschl, U., Cheng, Y. F., and He, K. B.: Exploring the severe winter haze in Beijing: the impact of synoptic weather, regional transport and heterogeneous reactions, Atmos. Chem. Phys., 15, 2969–2983, https://doi.org/10.5194/acp-15-2969-2015, 2015.
The requested paper has a corresponding corrigendum published. Please read the corrigendum first before downloading the article.
- Article
(7726 KB) - Full-text XML