the Creative Commons Attribution 4.0 License.
the Creative Commons Attribution 4.0 License.
 | 20 Feb 2018
Vertically resolved characteristics of air pollution during two severe winter haze episodes in urban Beijing, China
Qingqing Wang
Weiqi Xu
Libo Zhou
Guiqian Tang
Chen Chen
Xueling Cheng
Xiujuan Zhao
Dongsheng Ji
Tingting Han
Jie Li
Zifa Wang
We conducted the first real-time continuous vertical measurements of particle extinction (bext), gaseous NO2, and black carbon (BC) from ground level to 260 m during two severe winter haze episodes at an urban site in Beijing, China. Our results illustrated four distinct types of vertical profiles: (1) uniform vertical distributions (37 % of the time) with vertical differences less than 5 %, (2) higher values at lower altitudes (29 %), (3) higher values at higher altitudes (16 %), and (4) significant decreases at the heights of ∼ 100–150 m (14 %). Further analysis demonstrated that vertical convection as indicated by mixing layer height, temperature inversion, and local emissions are three major factors affecting the changes in vertical profiles. Particularly, the formation of type 4 was strongly associated with the stratified layer that was formed due to the interactions of different air masses and temperature inversions. Aerosol composition was substantially different below and above the transition heights with ∼ 20–30 % higher contributions of local sources (e.g., biomass burning and cooking) at lower altitudes. A more detailed evolution of vertical profiles and their relationship with the changes in source emissions, mixing layer height, and aerosol chemistry was illustrated by a case study. BC showed overall similar vertical profiles as those of bext (R2=0.92 and 0.69 in November and January, respectively). While NO2 was correlated with bext for most of the time, the vertical profiles of bext ∕ NO2 varied differently for different profiles, indicating the impact of chemical transformation on vertical profiles. Our results also showed that more comprehensive vertical measurements (e.g., more aerosol and gaseous species) at higher altitudes in the megacities are needed for a better understanding of the formation mechanisms and evolution of severe haze episodes in China.
- Article
(9911 KB) - Full-text XML
-
Supplement
(673 KB) - BibTeX
- EndNote


Air pollution is a severe environmental problem in China (Chan and Yao, 2008; Zhang et al., 2015), which offers a great challenge for future air quality improvement and economic development. Severe haze episodes with surprisingly high concentration of PM2.5 (particles with aerodynamic diameters less than 2.5 µm) dominantly occur in fall and winter seasons. However, current air quality models often fail to accurately predict extreme haze episodes (Y. Wang et al., 2014; B. Zheng et al., 2015; L. T. Wang et al., 2014; Z. F. Wang et al., 2014). One reason is the incomplete understanding of the formation mechanisms of haze pollution. For example, the coupled Weather Research and Forecasting–Community Multiscale Air Quality (WRF-CMAQ) model showed significant improvements in simulating sulfate and nitrate concentrations and temporal variations in January 2013 episode by incorporating heterogeneous reaction mechanisms (B. Zheng et al., 2015), yet it failed to predict the haze peak on 12–13 January that was found to be mainly caused by regional transport (Ji et al., 2014; Sun et al., 2014). However, there are strong arguments about the role of regional transport in the haze pollution (Guo et al., 2014; P. Li et al., 2015), especially during severe haze episodes with stagnant meteorological conditions and shallow boundary layer (Sun et al., 2014; G. J. Zheng et al., 2015; Quan et al., 2013). Therefore, vertical characterization of air pollutants is critical for elucidating the formation and transport of regional haze events, especially for severe haze episodes with boundary layer height less than 300 m (Quan et al., 2013; Tang et al., 2015; Wiegner et al., 2006).
Extensive measurements have been conducted at ground sites for characterization of the composition, sources, and formation mechanisms of severe haze episodes in north China (Huang et al., 2014; Ji et al., 2014; Zhao et al., 2013; Y. L. Sun et al., 2013a). However, vertical measurements are rather limited, particularly in the megacities in north China. Zhang et al. (2009) analyzed the vertical distributions of aerosol number and volume concentrations during 17 aircraft measurements in the spring of 2005 and 2006. Three different types of vertical profiles were observed, which were mainly affected by meteorological conditions. Chen et al. (2009) further analyzed the vertical measurements of gaseous pollutants in Beijing in summer 2007 and found a significant impact of mountain–valley breeze on the vertical distributions of pollutants. Recent aircraft measurements for black carbon (BC) showed different vertical profiles between southern and northern air masses and an enhanced regional transport between 0.5 and 1 km (Zhao et al., 2015). However, most aircraft measurements in the megacity of Beijing were conducted above ∼ 300–500 m, while the vertical distributions in the lower levels of the boundary layer (e.g., < 300 m) are rarely characterized. In addition, how the vertical profiles evolve during an entire cycle of haze episode is poorly understood due to the limited aircraft measurements. Although recent measurements with tethered balloons provide more insights into the vertical characteristics of air pollutants (e.g., BC) (Ran et al., 2016; J. Li et al., 2015), most of them were conducted at rural sites, which might be significantly different from urban areas with more complex pollution sources and land surfaces.
The meteorological tower is a unique platform to study the vertical characteristics of air pollutants in the lower levels of the boundary layer. For example, the vertical profiles of trace gases and aerosol species from 3 to 270 m were comprehensively characterized using a 300 m tower at the Boulder Atmospheric Observatory (BAO) during late winter 2011 (Brown et al., 2013), which provides many new insights into the sources of chemical species (e.g., local emissions, regional transport, and point sources) and aerosol processing at different heights (Kim et al., 2014; Öztürk et al., 2013b). Because the BAO tower is located at a suburban area with low aerosol mass loadings, the vertical profiles of aerosol and gas species (VandenBoer et al., 2013; Riedel et al., 2013; Öztürk et al., 2013a) could be substantially different from those in megacities in China. The Beijing 325 m IAP Meteorological Tower (BMT) is located between the north 3rd and 4th ring roads in the city center. Compared with the BAO tower, the land surface, sources emissions, and atmospheric processes of aerosol particles at the BMT are far more complex. Early studies on the BMT were mainly focused on trace gases, PM2.5, and filter measurements (Meng et al., 2008; Y. Sun et al., 2013, 2009). The results showed that the mixing ratio of O3 often peaked at ∼ 120 m and was maintained at higher levels in the residual layer at nighttime (Li et al., 2003), while SO2 was found to have the highest mixing ratio at ∼ 50 m (Meng et al., 2008). Filter measurements on the BMT showed higher ratios of organic carbon to elemental carbon at higher altitudes, indicating the vertical differences in secondary formation (Chan et al., 2005). Tao et al. (2007) further found enhanced gas–particle partitioning of polycyclic aromatic compounds at higher heights likely due to the lower temperature and higher relative humidity (RH). However, most previous vertical measurements are either limited by the time resolution, e.g., 1–3 days for filter collection, or vertical resolution, e.g., typically three or four heights. Our understanding of the vertical profiles and evolution of air pollutants, and their interactions with the lower boundary layer during severe haze episodes, is far from complete. Until recently, Sun et al. (2015, 2016) and Zhao et al. (2017) conducted real-time simultaneous measurements of aerosol particle composition at ground level and 260 m using two aerosol mass spectrometers. The results showed largely different characteristics of primary and secondary aerosols between ground level and 260 m, elucidating the different contributions of local emissions and regional transport to air pollution at different heights. In addition, the interactions between meteorological parameters and vertical differences were also illustrated by several case studies. Because these measurements were conducted at two fixed heights, i.e., ground level and 260 m, the vertical variations in the middle were never known, particularly during winter severe haze episodes with the boundary layer height lower than 300 m (Tang et al., 2015).
In this study, we conducted the first continuous vertical measurements of particle extinction (bext), NO2, and BC between ground level to 260 m in the megacity of Beijing during two severe winter haze episodes along with synchronous measurements of aerosol particle composition at ground level and 260 m with two aerosol mass spectrometers. The types of vertical profiles are identified and their relationships with meteorological parameters and aerosol chemistry are elucidated. A more detailed evolution of vertical profiles and their interactions with boundary layer during the severe haze episode is further illustrated by a case study. Finally, the vertical profiles and relationships between bext, NO2, and BC are investigated.
The vertically resolved measurements were conducted at the Tower Branch of the Institute of Atmospheric Physics, Chinese Academy of Sciences, using a container that can travel on the BMT at a relatively constant speed of approximately 9 m min−1. The instruments including a cavity attenuated phase shift particulate matter extinction monitor (CAPS-PMext, Aerodyne Research, Inc.) (Kebabian et al., 2007), a CAPS-NO2 monitor (Kebabian et al., 2008; Ge et al., 2013), and a seven-wavelength Aethalometer (model AE33; Magee Scientific Corp.) (Drinovec et al., 2015) were equipped in the container for real-time measurements of light extinction coefficient (bext, λ=630 nm) of dry fine particles, gaseous NO2, and BC with a time resolution of 1 s, 1 s, and 1 min, respectively. Because all instruments were powered by uninterruptible power supply, the vertical measurements were performed approximately every 4 h from ground level to 260 m during daytime and every 6 h from ground to 200 m during nighttime for safety, with the rest time being ground measurements. In this study, the vertical experiments were conducted during two severe haze episodes that occurred during 19–21 November 2014 and 12–16 January 2015, and in total 72 vertical profiles were obtained (Table S1 and Figs. S1 and S2 in the Supplement).
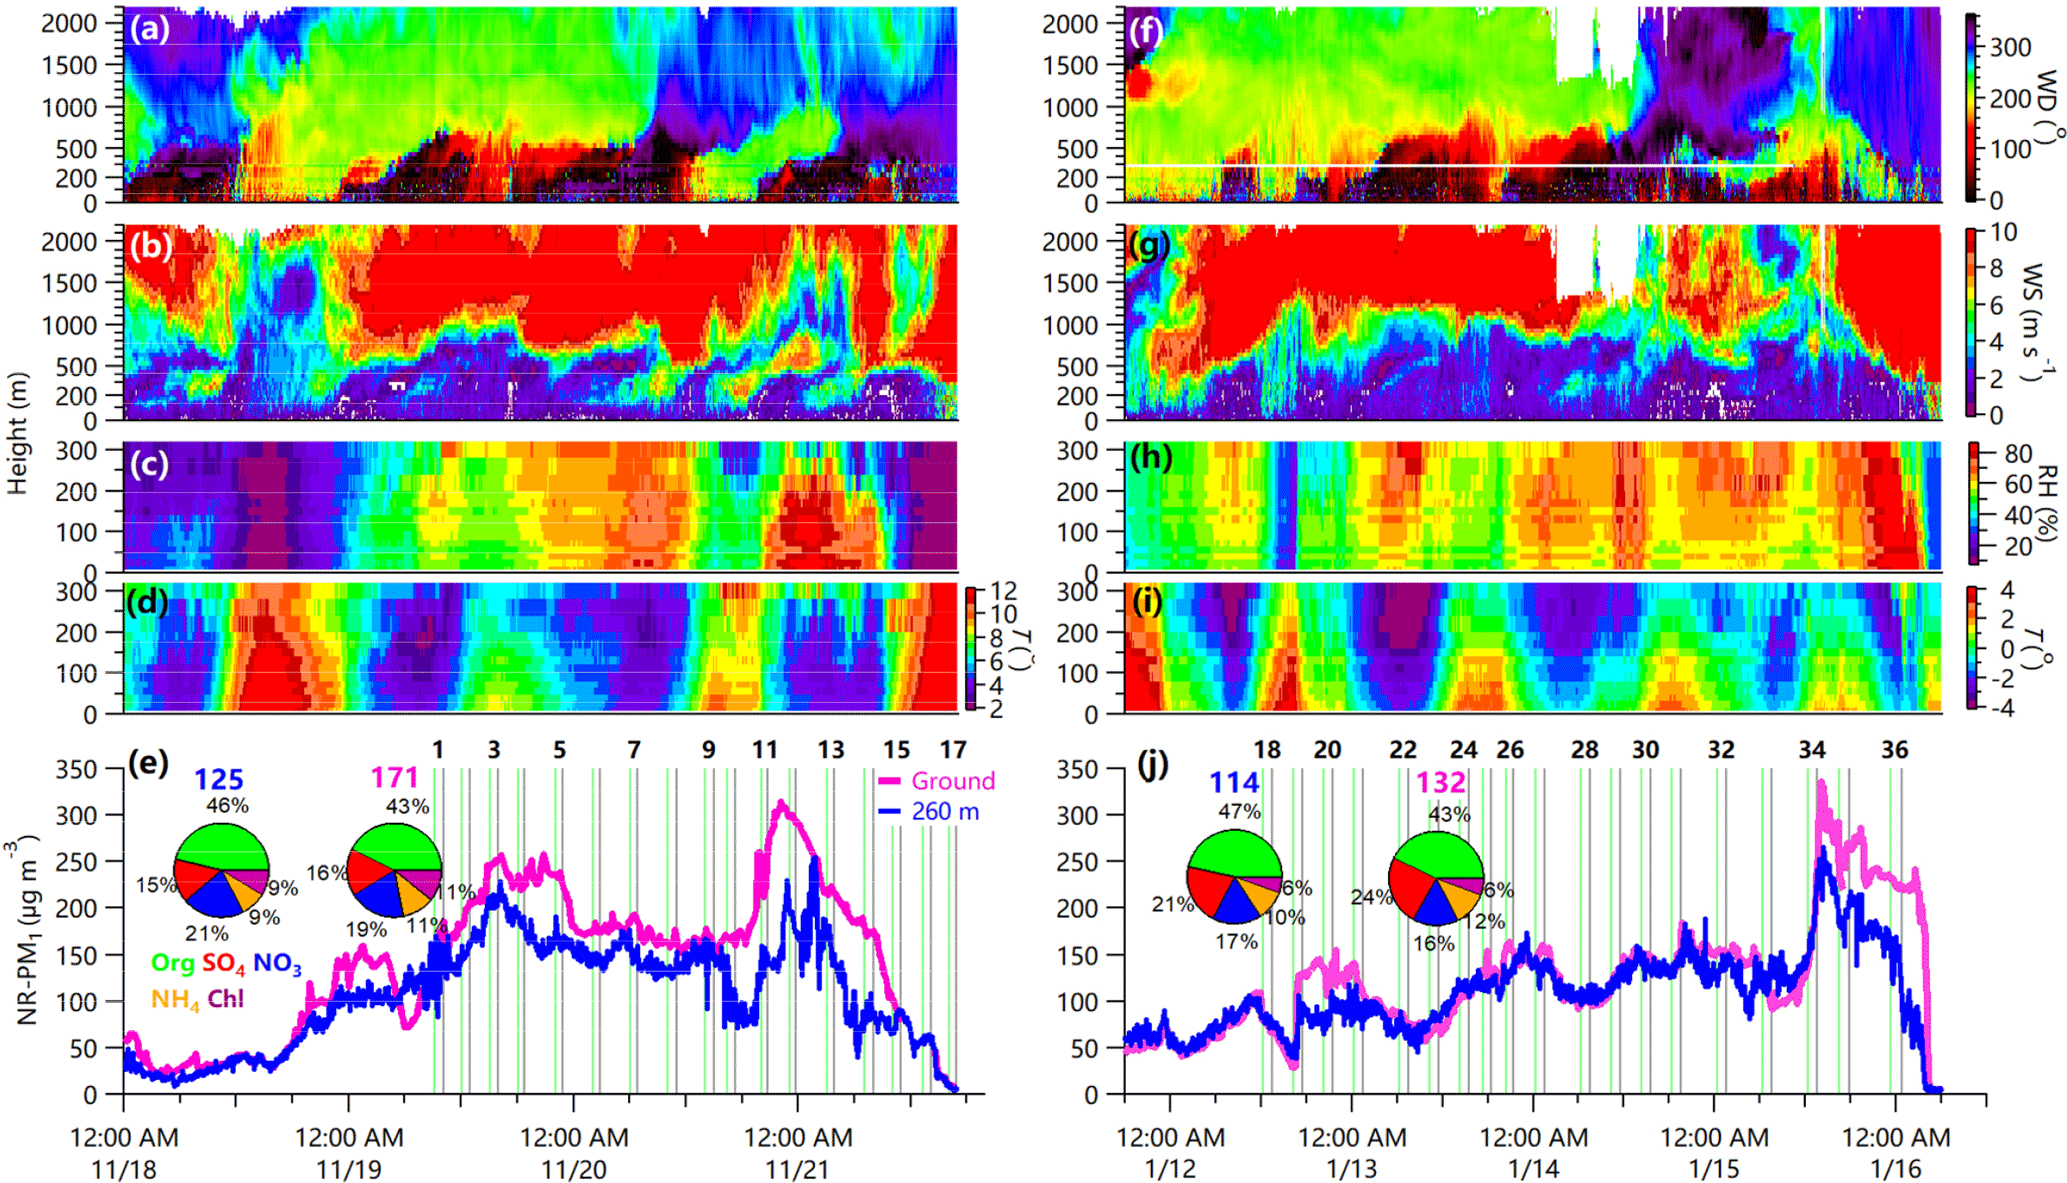
Figure 1Vertical evolution of (a, f) wind direction, (b, g) wind speed, (c, h) relative humidity, and (d, i) temperature during two severe haze episodes in November 2014 and January 2015. Panels (e) and (j) show the time series of NR-PM1 mass concentrations at ground level and 260 m. The two pie charts in each panel present the average composition of NR-PM1 for each episode at ground level (right) and 260 m (left), respectively, and the numbers on the top of pie charts are the average mass concentrations. The number of vertical profile experiments is also marked in panels (e, j) as green (up) and gray (down) vertical lines, and the time for each vertical profile is detailed in Table S1 in the Supplement.
In addition, nonrefractory submicron aerosol (NR-PM1) species, including organics, sulfate, nitrate, ammonium, and chloride, were measured simultaneously at ground level and 260 m on the tower with an Aerodyne High-Resolution Time-of-Flight Aerosol Mass Spectrometer (HR-ToF-AMS) and an Aerosol Chemical Speciation Monitor (ACSM), respectively. The detailed sampling setup and calibration of the two instruments as well as data analysis have been described in Xu et al. (2015) and Chen et al. (2015). Considering that the ACSM measurements can have uncertainties of 9–36 % for different NR-PM1 species (Crenn et al., 2015), we performed a 2-week intercomparison between ACSM and HR-ToF-AMS measurements at ground site. All submicron aerosol species measured by the ACSM were highly correlated with those measured by the HR-ToF-AMS (R2>0.97), and the regression slopes of ACSM against HR-AMS varied from 0.61 to 1.24 for different aerosol species (Sun et al., 2015). To reduce the uncertainties in vertical comparisons, the ACSM measurements were further corrected using the regression slopes determined from the intercomparisons. Positive matrix factorization (PMF) (Paatero and Tapper, 1994) was first performed to the unit mass resolution spectra of organic aerosol (OA) at ground level that were measured with HR-ToF-AMS during the same period as that of ACSM, and five factors including three primary OA (POA) factors – i.e., fossil-fuel-related OA (FFOA) predominantly from coal combustion emissions, cooking OA (COA), and biomass burning OA (BBOA) – and two secondary OA (SOA) factors – i.e., less-oxidized oxygenated OA (LO-OOA) and more-oxidized oxygenated OA (MO-OOA) – were identified. To better compare the OA factors between ground level and 260 m, the multi-linear engine 2 (ME-2) (Canonaco et al., 2013; Crippa et al., 2014) using the mass spectral profiles of three POA factors at ground level as constrains was performed to the ACSM OA spectra. In addition to the three POA factors, a LO-OOA and a MO-OOA were also resolved. It should be noted that such an approach could introduce some uncertainties for OA source apportionment at 260 m because POA factors are not exactly the same between ground level and 260 m. We also performed PMF analysis on ACSM OA spectra and found that the BBOA factor cannot be resolved although biomass burning is a common source in winter. The detailed evaluation of PMF results and the a-value based ME-2 solutions were given in Zhou et al. (2017).
Meteorological variables (temperature, T; RH; wind speed, WS; and wind direction, WD) were measured at 15 heights on the BMT (8, 15, 32, 47, 63, 80, 102, 120, 140, 160, 180, 200, 240, 280, and 320 m) with four-cup anemometers (model O1OC, Met One Instruments) and a standard meteoprobe (model HC2-S3, ROTRONIC). The wind field data, T, pressure, CO2, and H2O were measured by ultrasonic anemometers (Gill Instruments Limited, Lymington, UK) and Li-7500CO2 ∕ H2O gas analyzers (LI-COR, Inc., Nebraska, USA) at seven heights (8, 15, 47, 80, 140, 200, and 280 m) on the BMT with a time resolution of 10 Hz, Liu et al., 2015). The turbulent kinetic energy (TKE) of motion (e) along x, y, and z directions is calculated as , , and , respectively, of which , , and are the 20 min averages of u, v, and w, respectively. Eu, Ev, and Ew are then defined as the 20 min averages of eu, ev, and ew, respectively. Virtual potential temperature (VPT) was calculated with meteorological variables measured at 7 heights.
In addition, a Doppler wind lidar (Windcube 200, Leosphere, Orsay, France) was deployed at the same location to measure wind profiles from 100 to 5000 m with a spatial resolution of 50 m and a time resolution of 10 min (Sun et al., 2016), and a single-lens ceilometer (CL51, Vaisala, Finland) was used to measure the vertical attenuated backscatter coefficient (vertical resolution: 10 m). The mixing layer height (MLH) was then retrieved using the algorithm that has been detailed in Tang et al. (2015, 2016). The Vaisala software product BL-VIEW (version 2.0) was used to identify the MLH with the gradient method. The temporal and vertical attenuated backscatter coefficients were first smoothly averaged to avoid the effect of noise and interference from the aerosol layering structure, and the maximum negative gradient value (−dβ∕ dx) was then determined as the top of the mixing layer (Münkel et al., 2007; Geiß et al., 2017; Zhu et al., 2016). The NR-PM1 aerosol composition and the meteorological variables at ground level were input into the ISORROPIA-II (Nenes et al., 1998) model to predict liquid water content (LWC) associated with inorganic species.
3.1 Descriptions of the two severe haze episodes
The formation of the two haze episodes in Fig. 1 was initiated by a change in WD from the north-northwest to south-southwest, and both lasted approximately 3–4 days. However, the variations in NR-PM1 were different between the two episodes. During the first episode in November (Ep1), the mass concentration of NR-PM1 increased rapidly from less than 50 to ∼ 250 µg m−3 in a day and then remained at relatively constant levels until a further steep increase on 21 November due to a high RH and LWC event as indicated in Figs. 1 and S4. The variations in NR-PM1 were overall consistent with those of H2O which increased from 3 to 5.6 g m−3 during this episode (Fig. S5). In contrast, the variations of NR-PM1 during the second episode in January (Ep2) were relatively more stable with the concentrations ranging from 100 to 150 µg m−3 until 12:00 on 15 January when steep increases in NR-PM1 at both ground level and 260 m were observed. The average mass concentrations of NR-PM1 during Ep1 were 171 and 125 µg m−3 at ground level and 260 m, respectively, which are 30 and 10 % higher than those observed during Ep2, indicating that the PM pollution during Ep1 was more severe than during Ep2. A more detailed analysis showed that the higher PM during Ep1 was mainly caused by the lower mixing layer height (mean: 278 ± 109 m) in comparison to Ep2 (mean: 498 ± 314 m) (Wang et al., 2010). As shown in Fig. S4, the MLH in January was ubiquitously higher than that in November. For example, the MLH was below 400 m for most of the time during Ep1, while it was often above 600 m in daytime during Ep2. This is consistent with a more frequent occurrence of T inversions during Ep1 than Ep2; for example, T inversions were observed every night from 19 to 21 November (Fig. 1d), while only two short periods were observed on 15–16 January (Fig. 1i).
The temporal variations of NR-PM1 at ground level and 260 m were different between Ep1 and Ep2. While substantial vertical differences were observed for most of the time during Ep1, the variations of NR-PM1 were overall similar between ground level and 260 m during Ep2. The average vertical difference of NR-PM1 is 46 µg m−3 during Ep1, which is much higher than the 18 µg m−3 during Ep2. Figure 1 also shows that the vertical difference in NR-PM1 was tightly related to T inversion, and larger differences typically occurred during periods with clear T inversions (Fig. 1d). The average composition of NR-PM1 was overall similar between ground level and 260 m during Ep1 and Ep2, except for slightly higher contributions of organics and nitrate at 260 m. While organics dominated NR-PM1 both at ground level (43 %) and 260 m (46–47 %), the composition of inorganic aerosols was substantially different between Ep1 and Ep2. Particularly, the episode in January showed much higher contributions of sulfate (21–24 %) than Ep1 (15–16 %). Higher sulfate during Ep2 was likely due to higher RH that facilitated the aqueous-phase processing of SO2 to form sulfate.
3.2 Vertical profiles of pollutants

Figure 2Time series of (a) vertical difference (max – min) and slope of extinction versus height and (b) extinction and vertical difference ((max–min) avg)) for each vertical profile during the haze episode in November. The circles refer to the down profiles while boxes indicate the up profiles.
The vertical profiles of bext, NO2, and BC varied substantially during the formation, evolution, and clearing stages of the haze episodes and strongly depended on the vertical changes in meteorological parameters. In this study, we analyzed each vertical profile by calculating the differences in vertical changes ((max–min) mean); Fig. 2), performing linear fit analysis on the correlations between extinction and height, and checking the presence of T inversions (Figs. 2 and 3). Overall, four distinctly different types of vertical profiles were categorized (Fig. 4). Type 1 is well mixed as indicated by the small vertical differences (< 5 %) and slopes (−0.3–0.3 Mm−1 m−1). Type 2 shows clear decreases as a function of heights, which is mainly categorized according to the large vertical differences (> 5 %). In addition, all vertical profiles for type 2 present negative slopes, and the slope values depend on the absolute extinction values. The vertical profiles of type 3 are characterized by increases as a function of height, and all the slopes for this type are positive although the vertical differences can vary substantially. The vertical profiles of type 4 showed significant decreases within a short height interval. Another major difference between type 4 and type 3 is the strong T inversion that occurred at a height of less than 150 m. The four types together account for 96 % of the total profiles, which can be considered representative during the two haze episodes. A more detailed summary of the four types of vertical profiles is presented in Tables S2–S5.
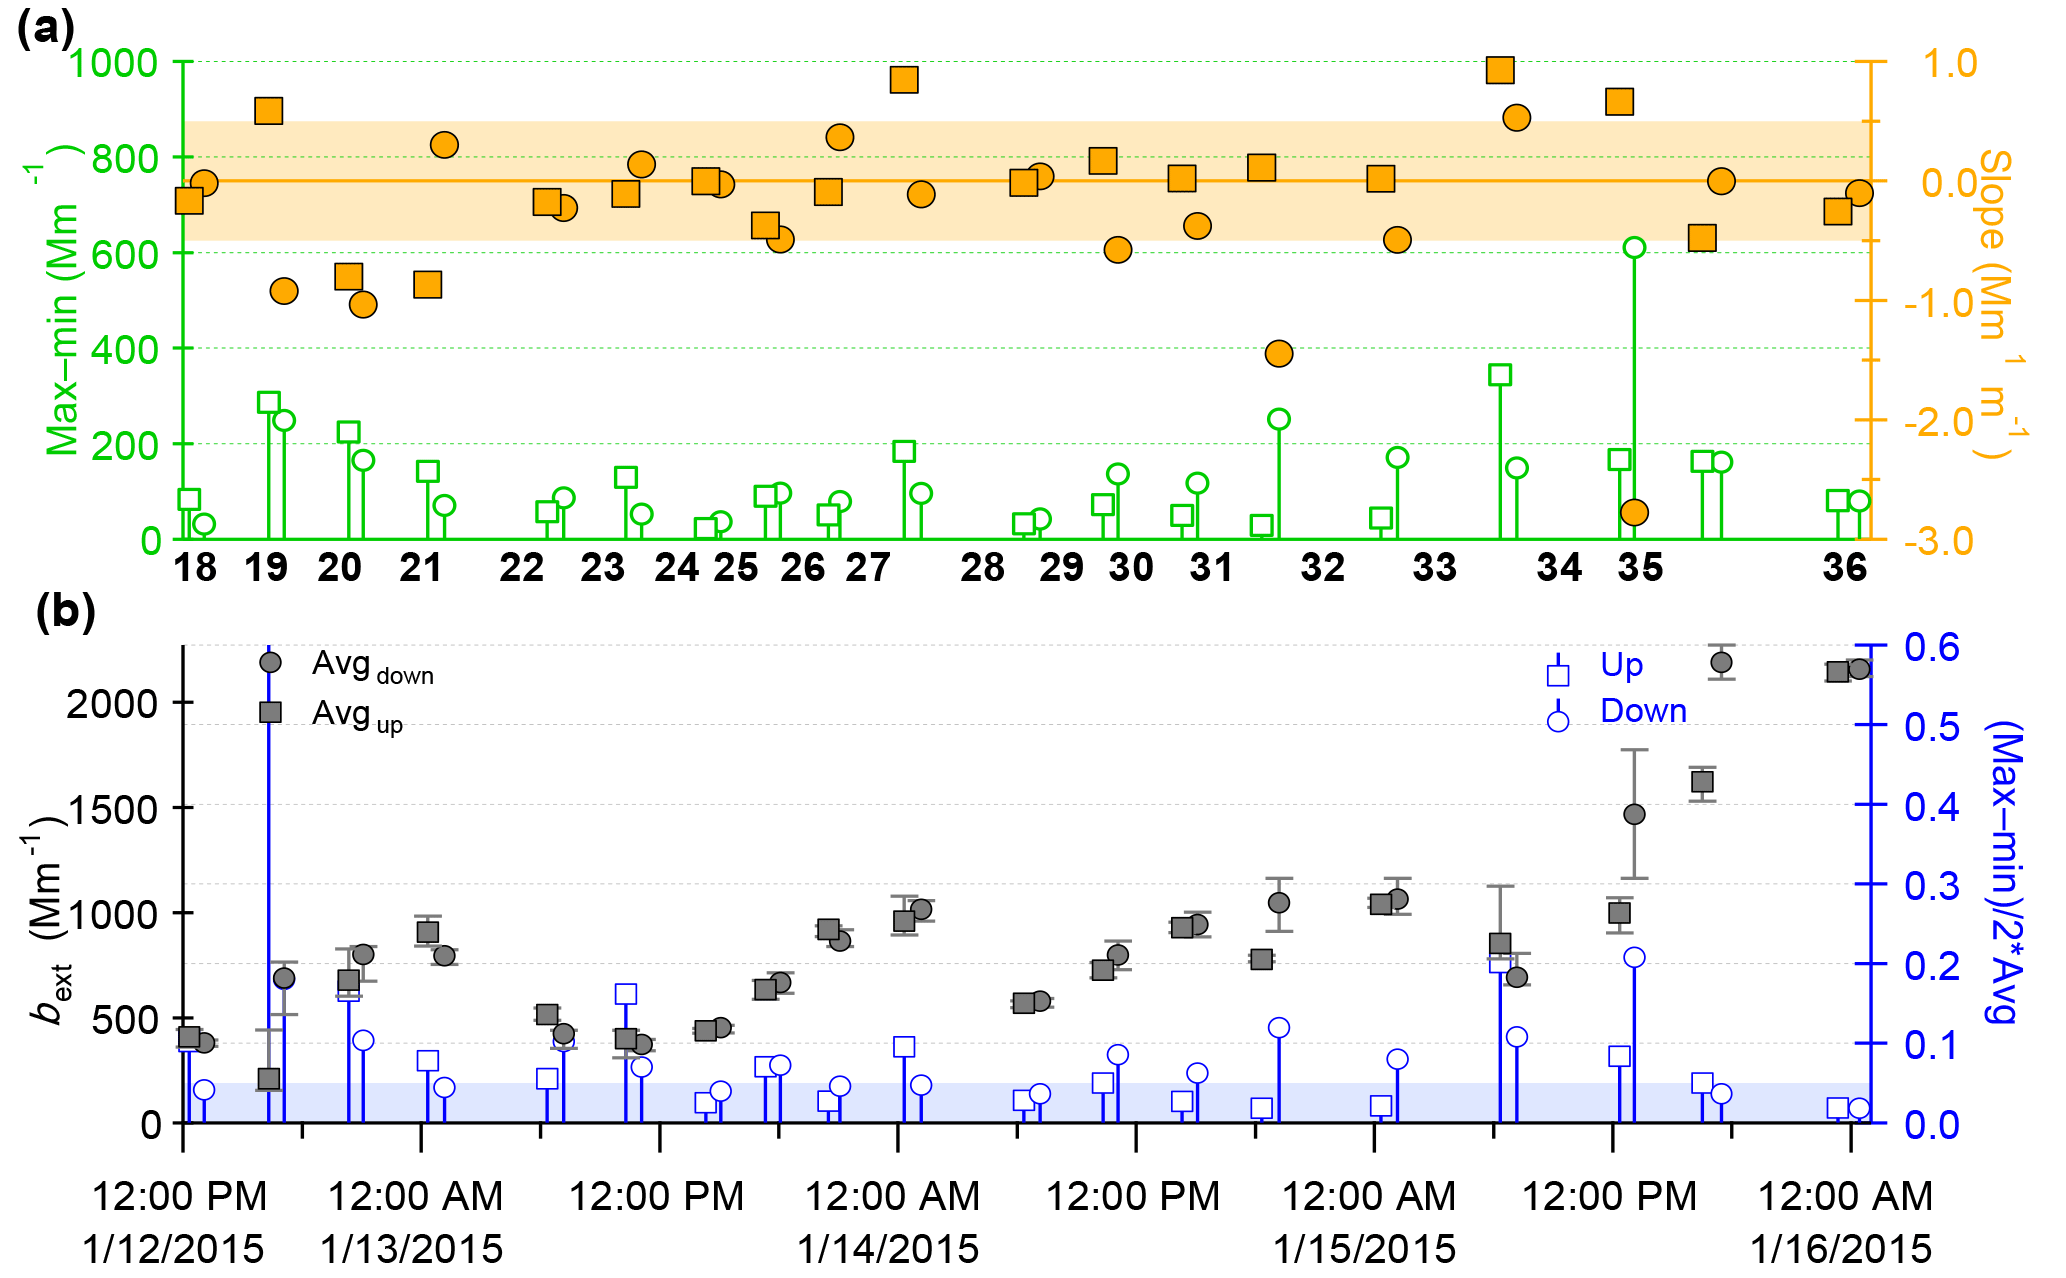
Figure 3Time series of (a) vertical difference (max–min) and slope of extinction versus height and (b) extinction and vertical difference ((max–min avg)) for each vertical profile during the haze episode in January. The circles refer to the down profiles while boxes indicate the up profiles.

Figure 4Four selected types of vertical profiles of bext, bext ∕ NO2, T, RH, and WS. “U” in the legend indicates the “up” experiments, the others are the “down” ones. The vertical profile 9 (V9) for bext ∕ NO2 is missing because NO2 data were not available. The rightmost panels show four selected vertical profiles of WD, i.e., V3, V25, V33, and V11. For clarity, some vertical profiles were offset by certain values as indicated by “+” or “–” in the figure. Note that all vertical profiles reaching 260 m were measured at daytime, while those of 200 m were measured at nighttime (Table S1).
-
Uniform vertical distributions. As shown in Fig. 4a, the vertical variations for the three vertical profiles of bext were small, and the vertical differences were all less than 5 %, indicating that aerosol particles were relatively well mixed during these three periods. Such types of vertical profiles (37 % of the total profiles) were typically observed during daytime, e.g., 10:00–16:00, when T and TKE are high (Fig. S5), and MLH is above 260 m (370–1000 m here). Also, there were no T inversions, and the VPT showed small vertical variations (Fig. S6) supporting relatively well-mixed lower boundary. NO2 showed remarkably similar vertical profiles to bext, which is indicated by the constant ratios of bext ∕ NO2 across different heights (Fig. 4a). The vertical profiles of T and RH during these three measurements were similar. While T showed a gradual decrease as the increase with increasing height, RH was relatively even across different heights. Note that the differences of meteorological variables in absolute values were significant: for example, the temperature difference between V3 (vertical profile of 3, Table S1) and V24 (vertical profile of 24, Table S1) is ∼ 6 ∘C, and the wind speed of V24 (∼ 2.5 m s−1) is nearly 70 % higher than that of V3 (∼ 1.5 m s−1). In addition, the TKE for V3 (∼ 0.2 m2 s−2) is less than half of that of V24 (∼ 0.6 m2 s−2) across different heights (Fig. S5), indicating a more stagnant condition for V3. Such meteorological differences might be one of the major reasons for the different bext levels, e.g., 454 Mm−1 for V24 and 1482 Mm−1 for V3, as well as the largely different bext ∕ NO2 ratios among different vertical profiles (e.g., 8.8 Mm−1 ppb−1 for V24 and 16.5 Mm−1 ppb−1 for V3). We note slightly different aerosol composition between ground level and 260 m (Fig. 5a) although the vertical differences in bext and the total mass concentrations of NR-PM1 were small. For example, V24 showed 2 % higher contribution of sulfate and 4 % lower organics in NR-PM1 at ground level compared with that at 260 m. While secondary formation influenced by RH ∕T and solar radiation could be slightly different, the relative importance of local emissions versus regional transport at different heights might have also played a role.
-
Higher values at lower altitudes. Such vertical profiles were frequently observed during this study (29 % of the time), which were typically characterized by smooth decreases as a function of height, yet the vertical differences were larger than 5 % (Fig. 4b). The decreasing rates of bext varied mostly between 0.4 and 1.4 Mm−1 m−1 except for the profiles during clean periods (e.g., V17). Most of these profiles (60 %) occurred at the time between 10:00 and 11:00 and between 16:00 and 18:00 when the vertical convection was moderately high as indicated by Ew in Fig. S7. These results suggest that such vertical changes were mainly caused by the dilution effects associated with vertical convection. Another reason is the stronger local emissions at ground level, e.g., cooking emissions during lunch and dinner times (Sun et al., 2013b; Xu et al., 2015), yet it is slow to be mixed to a higher height, particularly at night with shallower boundary layer. For example, Sun et al. (2015) found much larger ratios between 260 m and ground level for local primary species than regional secondary aerosols at nighttime, indicating that the intensities of local emissions can affect the vertical profiles substantially. Figure 4b shows similar vertical profiles of T and RH, yet the vertical differences of bext can vary substantially among different vertical profiles. For example, bext in V29 decreased from 870 Mm−1 at ground level to 720 Mm−1 at 260 m, which is a change by ∼ 17 %. In comparison, bext in V34 showed a more dramatic decrease by ∼ 34 % from 1776 to 1170 Mm−1. Although V29 and V34 were measured at relatively similar times (11:00 and 13:00, respectively), the MLH was substantially different, which was 1106 and 546 m, respectively. The higher MLH associated with higher TKE and stronger vertical convection led to a much smaller vertical gradient for V29 than V34. The vertical profiles of NO2 were similar to those of bext for most of the time. However, vertical variations in bext ∕ NO2 ratios were also observed (Fig. 4b). For example, the bext ∕ NO2 ratio in V34 showed a slight decrease from 21 Mm−1 ppb−1 at ground level to ∼ 20 Mm−1 ppb−1 at ∼ 150 m, followed by a sudden decrease to 18 Mm−1 ppb−1. Such a transition height in vertically resolved bext ∕ NO2 was consistent with that of bext and wind direction (Fig. 4b), indicating a change of air masses with different pollution characteristics at approximately 150 m.
-
Higher values at higher altitudes (16 % of the time). Figure 4c shows three typical vertical profiles of bext that increase substantially at approximately 120–150 m. A common meteorological feature for such vertical profiles is the T inversion (Fig. 4c) and a change of wind direction at the same height. The heights of VPT with significant changes were generally similar to those of T (Fig. S6), suggesting a stratification of the lower boundary layer at ∼ 150 m. For example, wind direction showed a clear change from the northeast to south between 150 and 200 m and a further change to the southwest above 200 m during V33 (Fig. 4c). The change of WD was associated with an increase in RH, further indicating different air masses below and above the T inversion. As a result, the increase in bext above ∼ 150 m was mainly caused by regional transport from the south-southwest. While the vertical profiles of NO2 were all similar to those of bext, similar vertical transition points with the changes in bext ∕ NO2 ratios were also observed (Fig. 4c). As shown in Fig. 5c, aerosol composition was very similar between ground level and 260 m before V33; however, it showed increases in the contributions of organics and chloride at 260 m while it remained at small changes at ground level. These results further indicate a change of air masses at high altitude during V33. Compared with V33, V12 also showed an increase in bext between 120 and 200 m, which appears to be in contradiction to the much lower NR-PM1 concentration at 260 m (177 µg m−3) than ground level (294 µg m−3) (Fig. 1e). The vertical profile of RH showed consistently high values (∼ 70–80 %) below 200 m and then a large decrease above 200 m, leading to the presence of a stable layer below 200 m (Fig. 1). TKE was ubiquitously less than 0.3 m2 s−2, indicating a stagnant atmosphere during this period. Considering the differences between ground level and 260 m, and the vertical changes in meteorological variables, we expect a rapid decrease of bext between 200 and 260 m although the data were not available. The increase of bext between 120 and 200 m was likely due to a decrease of WS from 2 to 1 m s−1.
-
Significant decreases at the heights of ∼ 100–150 m (14 % of time). Such vertical profiles were observed dominantly in November (9 of 10, Table S5) and were typically associated with rapid formation or cleaning of PM pollution and T inversions (Figs. 1 and 4d). For example, V11 was conducted during the rapid formation stage of the pollution (20:25–20:46, Fig. 1e), which was associated with the formation of the high RH–LWC event (Figs. 1 and S4). RH and H2O were consistently higher at lower heights, while they showed sudden decreases at 100 m from ∼ 70 to ∼ 50 % (300 m) and 5.5 to 4 g m−3 (Fig. S5b), respectively. T also showed a strong inversion between 100 and 200 m with the difference being approximately 1.3 ∘C (Fig. 4d). Figure 4d showed that the vertical changes in RH and T, and the formation of the higher RH event was likely due to the interaction of two different air masses that changed from the northeast to northwest at 100 m. Such vertical profiles clearly indicate very different layers at different heights. This is further supported by the vertical profiles of VPT, which showed significant increases at similar heights (Fig. S6) and suggested a low stable stratification. As a result, the vertical profile of bext showed a sudden decrease at 100 m, from ∼ 1800 to ∼ 1200 Mm−1 at 200 m. Consistently, the mass concentration of NR-PM1 showed a significant increase by ∼ 50 µg m−3 at ground level, while it remained relatively constant at 260 m. The vertical profile of NO2 also showed a similar decrease at the same transition height (from 94 to 83 ppb) as bext, yet the change was much smaller than bext, leading to a similar decrease in vertical profile of bext ∕ NO2. These results indicate that the local accumulation effects caused by the high RH event are more significant on particles than gaseous species. The vertical changes also have a significant impact on aerosol composition. For example, the contribution of OA to NR-PM1 was higher at ground level (48–51 %) than 260 m (44 %), mainly due to the accumulation of local pollutants, e.g., cooking aerosols during the high RH event (Fig. 6). Compared with V11, V14 took place during the clearing stage of the pollution (Fig. 1e). A stable layer associated with a clear T inversion in the morning was observed at approximately 150 m. RH was significantly different below and above the layer. While RH was consistently high at ∼ 70 % below 150 m (Fig. 4d), it showed a rapid decrease from 70 to 40 % between 150 and 300 m, suggesting dryer air masses in higher altitudes. Such vertical profiles in RH and T led to a significant transition in bext at 150 m. While bext was relatively constant (∼ 1350 Mm−1) below 150 m, it had a sudden decrease at 150 m and reached the lowest value at 260 m (∼ 770 Mm−1), which was nearly twice lower than that at low altitudes. Similarly, NO2 showed a sudden decrease from 78 to 67 ppb at the same height, yet the change was much smaller than bext, leading to a significantly different bext ∕ NO2 ratio below and above 150 m (∼ 18 and ∼ 13–14 Mm−1 ppb−1, respectively; Fig. 4d). The difference is consistent with that of NR-PM1 between ground level and 260 m, which was 175 and 87 µg m−3, respectively. Due to the different air masses and meteorological conditions, aerosol composition was substantially different between ground level and 260 m, particularly when higher contributions of sulfate and lower contributions of organics were observed at ground level (Fig. 5d).

Figure 5Average chemical composition of NR-PM1 for selected vertical profiles: (a) V24, (b) V29, (c) V33, and (d) V14 at ground level (c, d) and 260 m (a, b). The numbers on bar charts are the mass fractions of sulfate and organics. “U” and “D” represent “up” and “down” experiment, respectively.
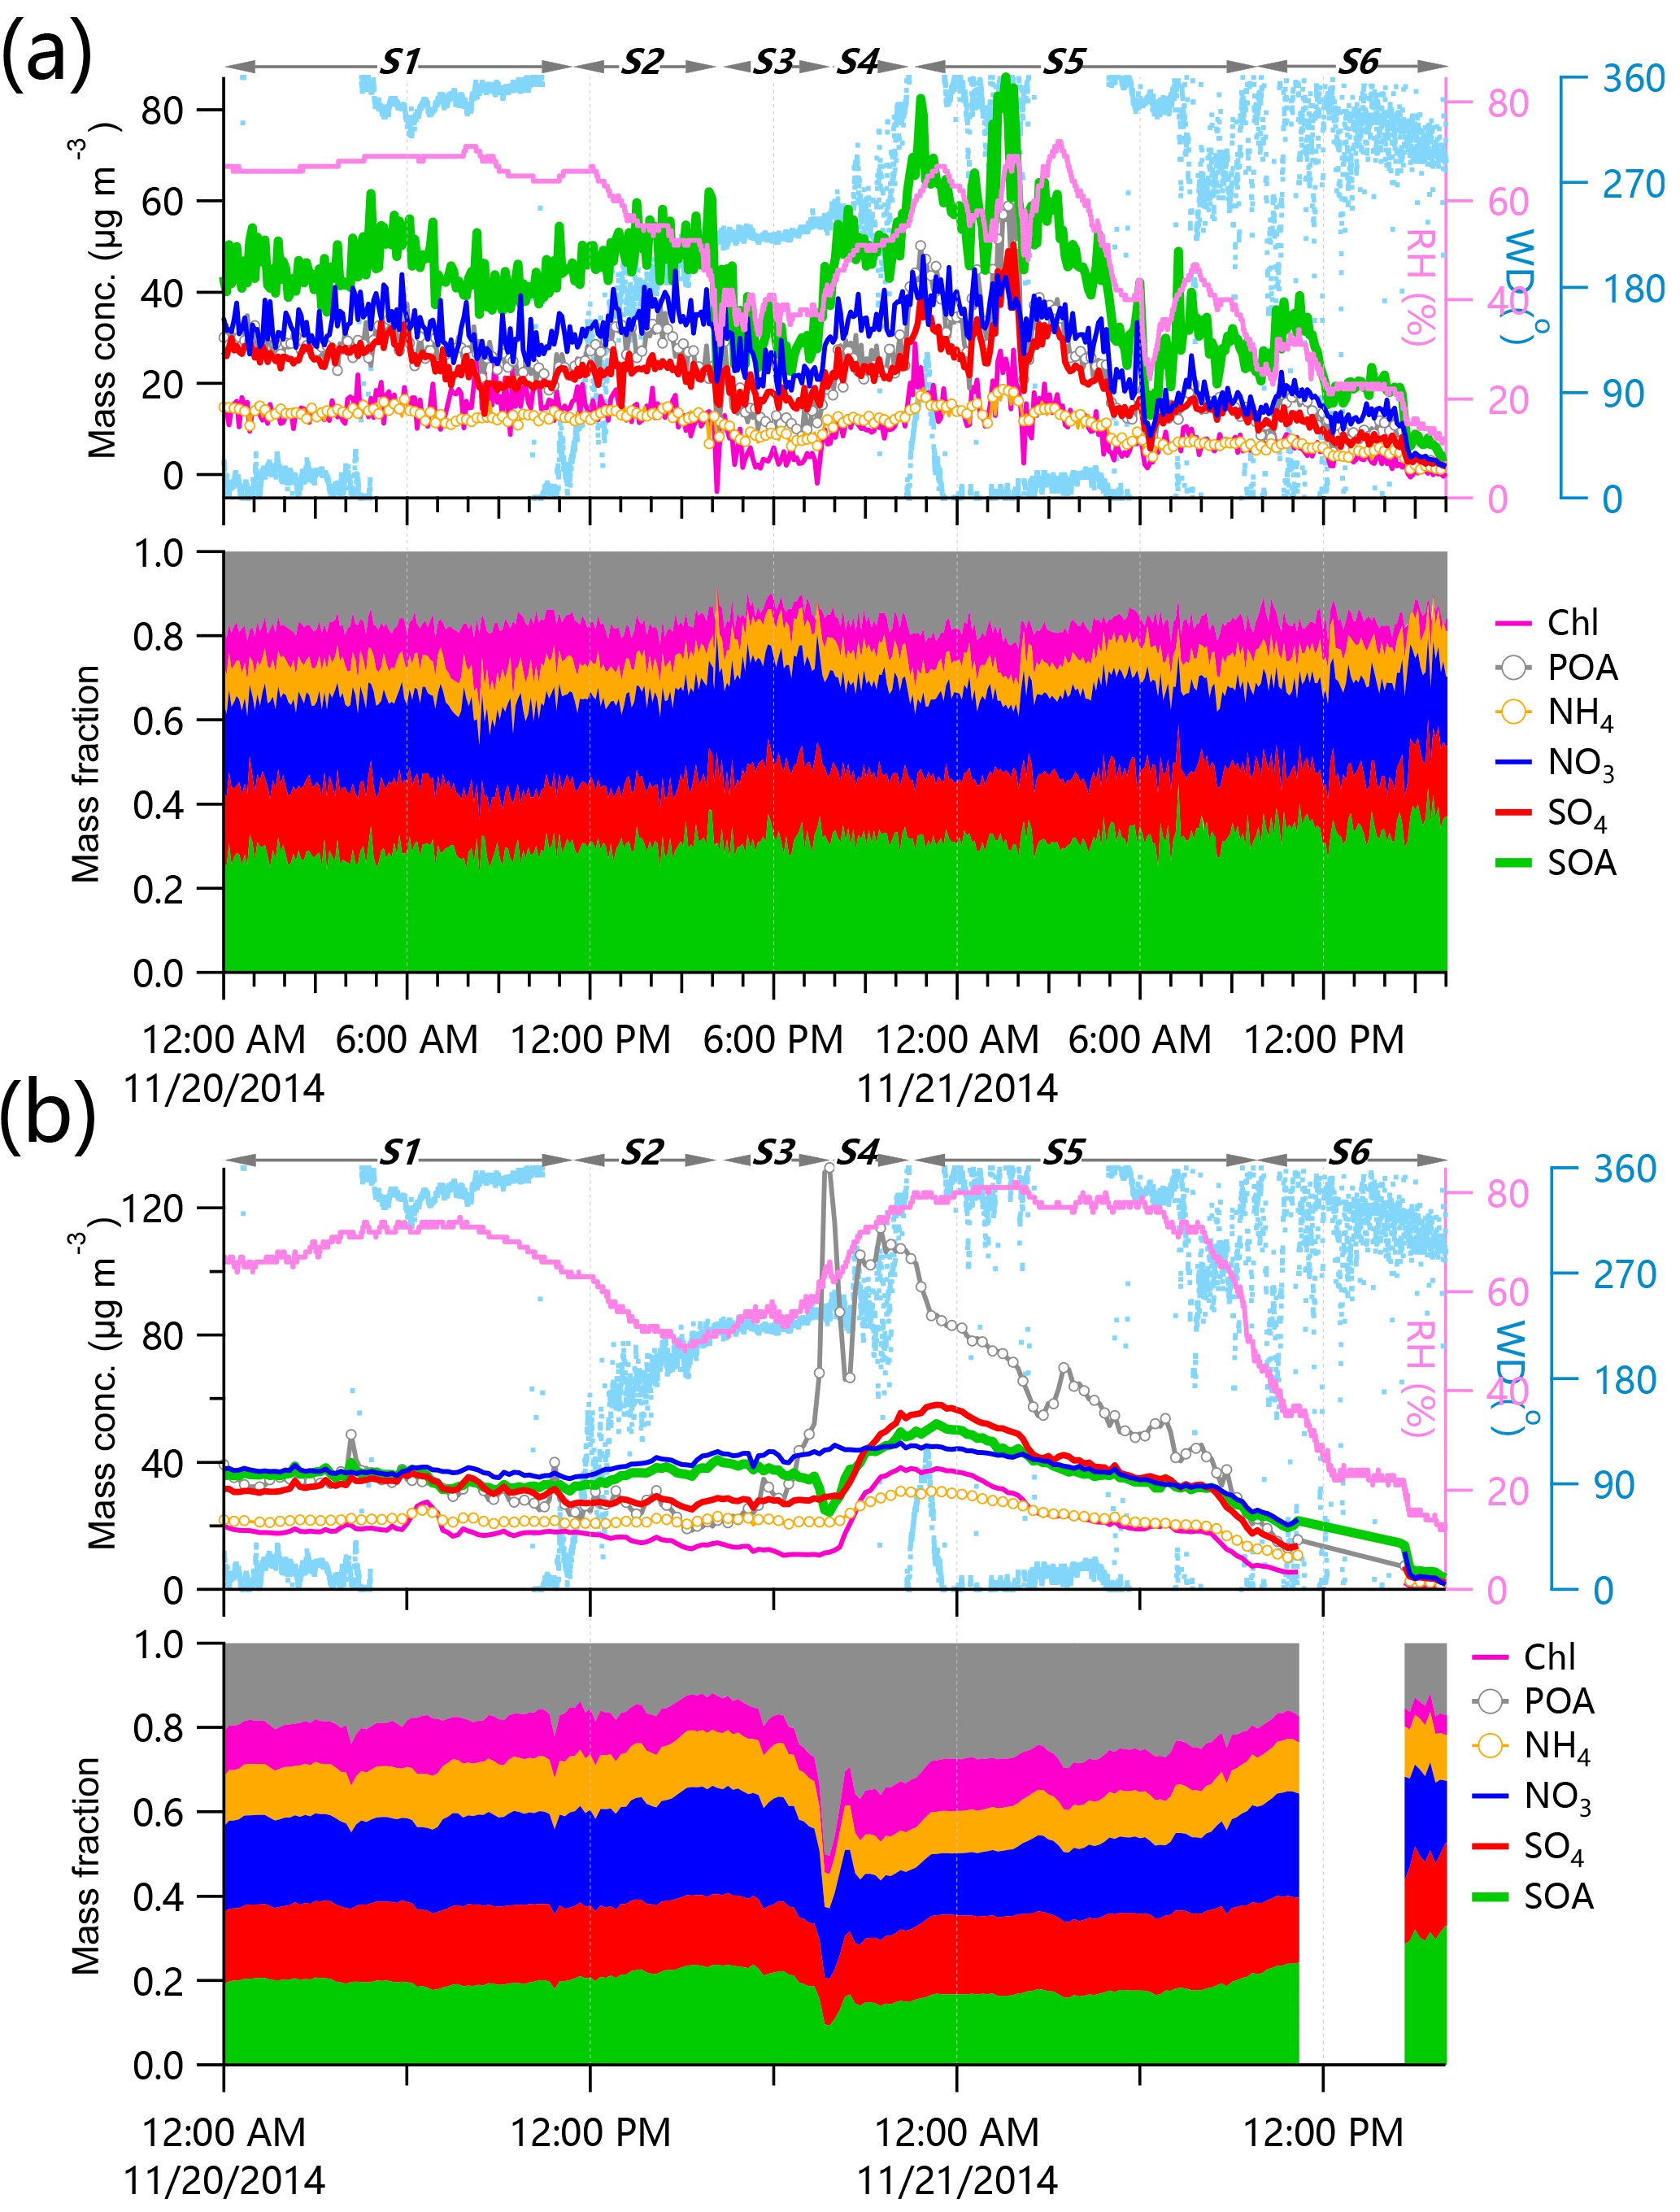
Figure 6Evolution of nonrefractory submicron aerosol species and NR-PM1 composition at (a) 260 m and (b) ground level. POA (FFOA + COA + BBOA) and SOA (LO-OOA + MO-OOA) were from positive matrix factorization of OA. RH and WD are also shown for a comparison.
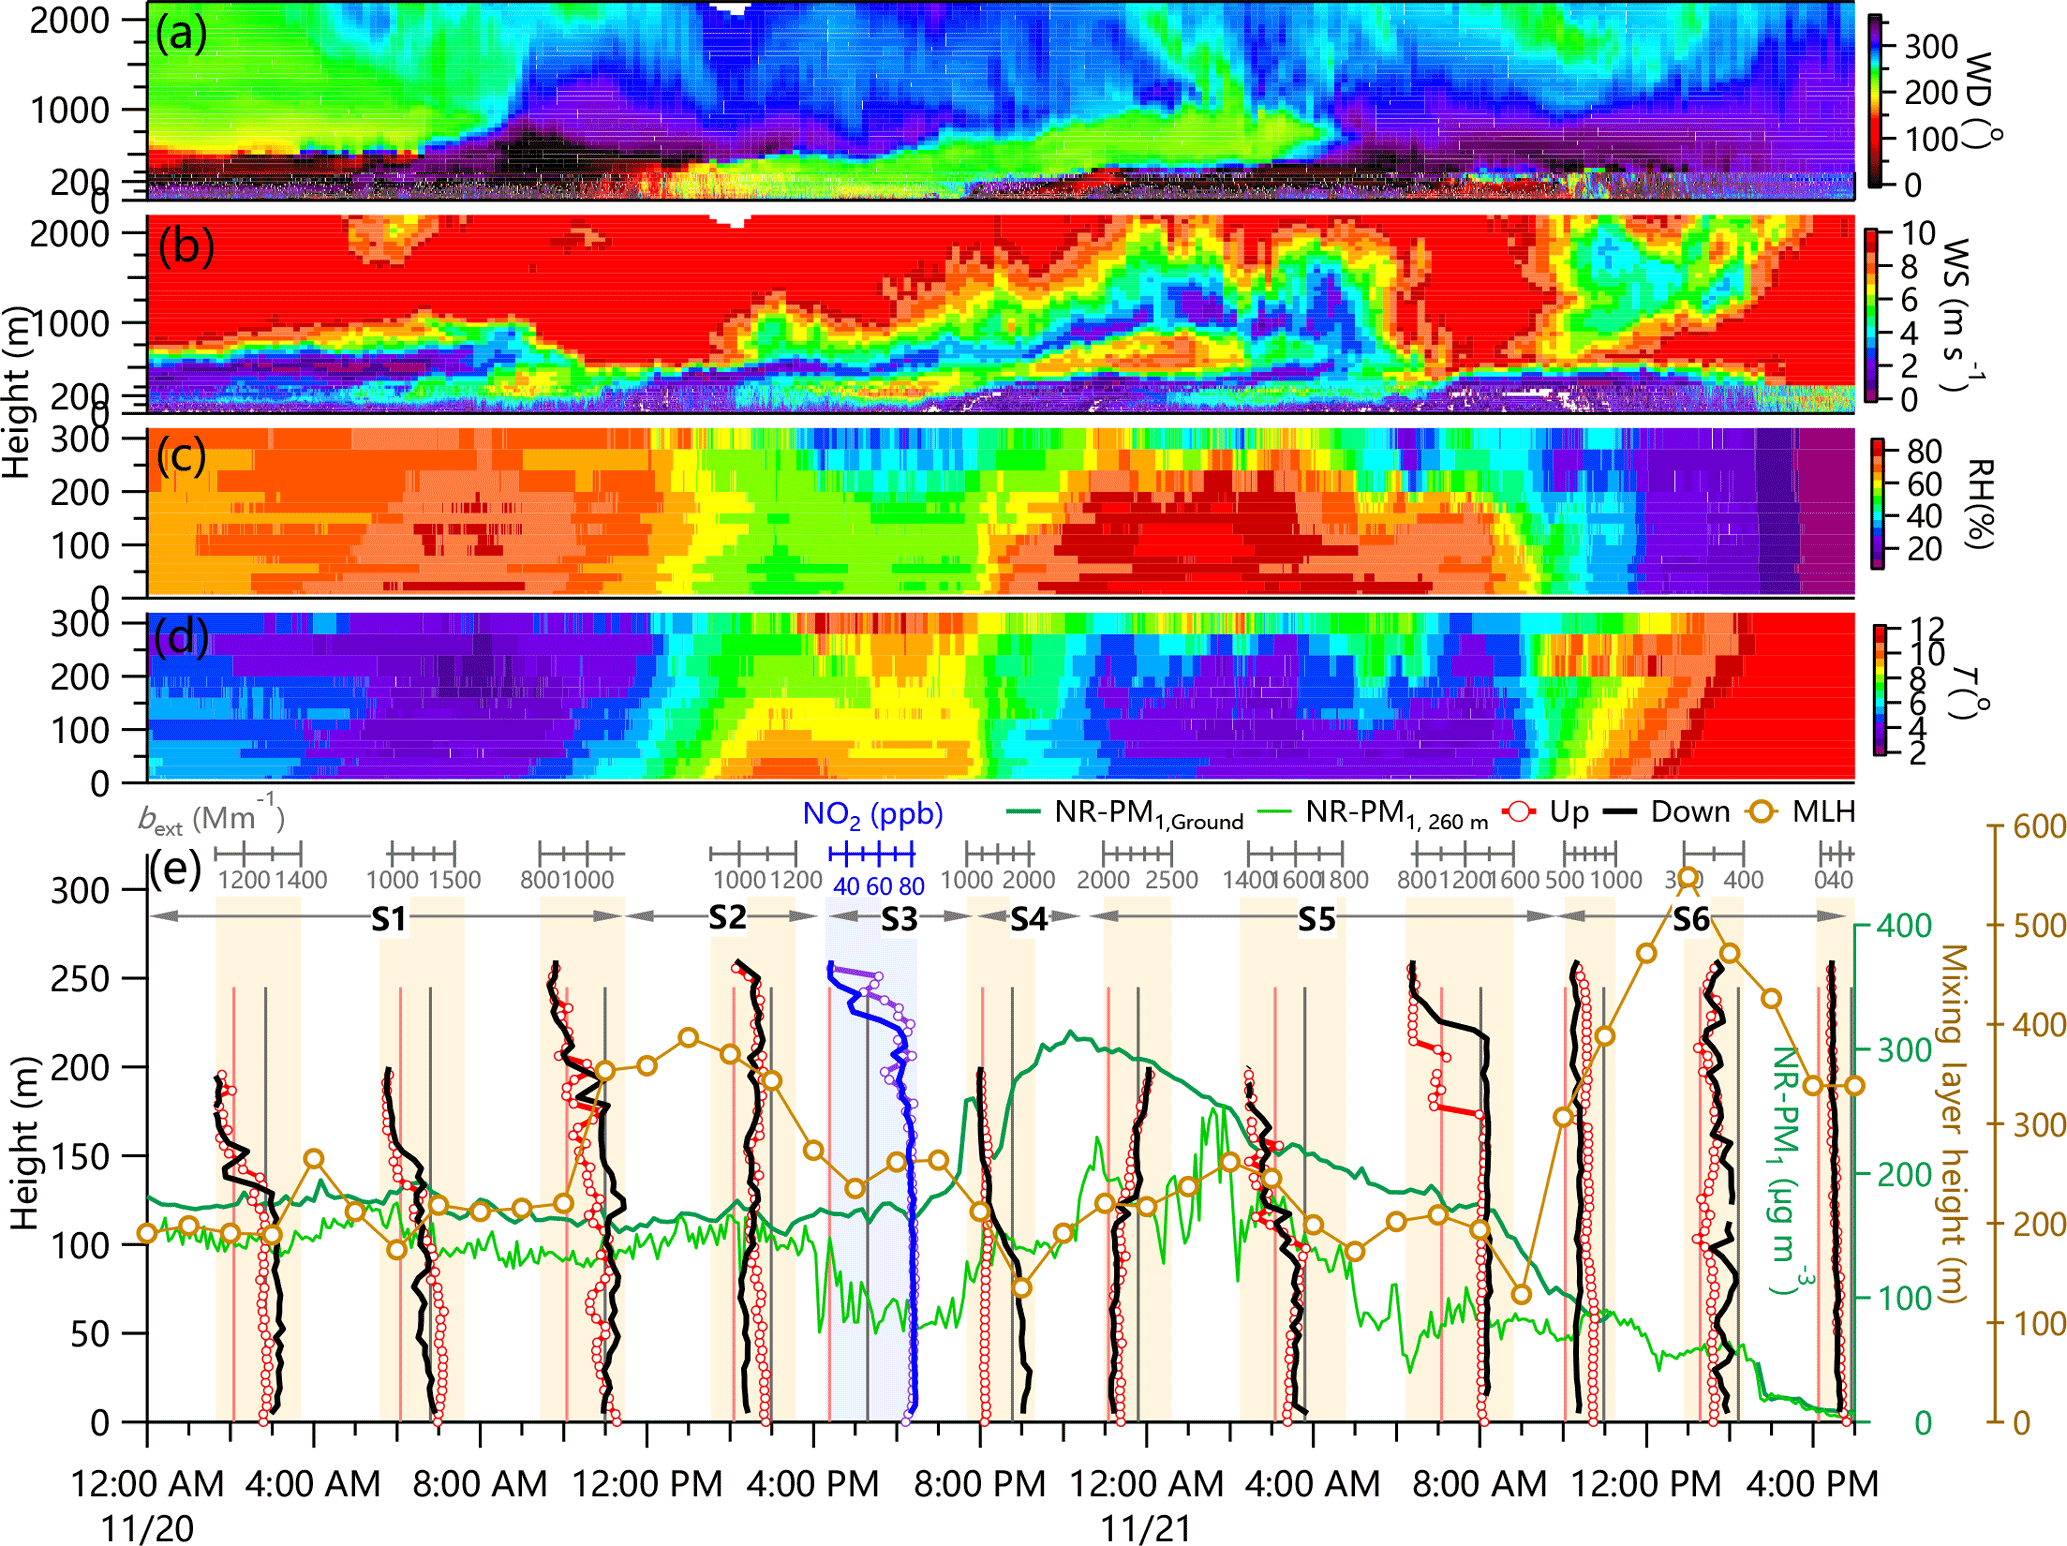
Figure 7Evolution of vertical profiles of bext and meteorological parameters from 00:00 on 20 November to 17:00 on 21 November. Also shown are time series of NR-PM1 mass concentrations at ground level and 260 m as well as MLH (right axis). Note that the vertical profiles of bext between 16:00 and 17:30 were not available due to a malfunction of the CAPS PMext, therefore, the two vertical profiles of NO2 were used as surrogates. The shaded areas in panel (e) indicate the time periods for the vertical measurements.
3.3 Case study of evolution of vertical profiles
Figure 7 shows a detailed evolution of vertical profiles of bext and meteorological conditions from 00:00 on 20 November to 17:00 on 21 November. The evolution can be classified into six stages, and the types of vertical profiles evolved routinely from type 4 at nighttime to type 2 and/or type 1 during daytime, and then type 3 and/or type 4 at nighttime again. The first stage (S1, 00:00–11:00) was characterized by consistent northerly winds and moderately high RH (60–80 %). As a result, aerosol species and chemical composition were relatively stable at both ground level and 260 m during this stage. The vertical profile of bext showed a clear transition height at approximately 120 m at 03:00 am, indicating the presence of a nocturnal stable boundary layer (Stull, 1988). The transition height started to increase with the increase of temperature and reached approximately 200 m at 11:00. Consequently, the vertical profiles evolved from type 4 to type 2. The variation of the stable layer height was consistent with that of MLH, which increased from 190 to 350 m. But note that the MLH was ubiquitously higher by ∼ 50 m than the transition height that was determined from bext, which might indicate that the MLH retrieved from the ceilometer measurement was overestimated during severe haze episodes.
The second stage (S2) was characterized by a transition of wind direction from north to south at 12:00, which remained unchanged until 20:00. Due to the increasing T and vertical convection, the vertical differences between ground level and 260 m (e.g., NR-PM1 in Fig. 7e) were gradually reduced, and the vertical profiles were relatively even and evolved from type 2 to type 1, e.g., V9 between 14:00 and 15:00. This is also consistent with the relatively high MLH, which was generally above 350 m. These results indicate that aerosol particles were relatively well mixed during this stage. Increases in secondary nitrate and SOA were also observed at both ground level and 260 m, which is likely due to the enhanced photochemical production and/or regional transport from the south. The concentration of NR-PM1 at 260 m showed a significant decrease from ∼ 150 to ∼ 80 µg m−3 during stage 3 (S3, 16:00–20:00), while it remained relatively constant at ground level. Such changes were likely caused by a significant increase in wind speed between 200 and 300 m that diluted the pollutants substantially (Fig. 7b). This is further supported by significant increases in TKE (Eu, Ev, Ew) above 200 m (Fig. S5). Indeed, we observed a significant decrease in NO2 level from ∼ 70 ppb at 200 m to 30 ppb at 260 m and also a large decrease in BC from 22 to 14 µg m−3 for V10 (bext was not available). A further increase in vertical difference between ground level and 260 m was observed during the later stage of S3 (18:00–20:00), which was primarily caused by significant increase in POA (mainly local COA) from ∼ 25 to 130 µg m−3 at the ground site (Fig. 6b).
After S3, T showed a significant decrease while RH showed a rapid increase from 55 to ∼ 80 % below 100 m, and LWC at ground surface reached > 50 mg m−3. The high RH event was mainly caused by the interaction between the warmer southwestern air mass and the colder northeastern one (Fig. 7b). The height of the high RH (> 70 %) layer was consistently below 200 m during S4 (20:00–22:30). Therefore, aerosol species showed much smaller variations at 260 m compared with the large increases at ground level (Fig. 6b). Not surprising, bext showed a large vertical gradient (type 4); for example, bext for V11 decreased from ∼ 2000 Mm−1 at ground level to 1200 Mm−1 above 100 m. Such a vertical profile was also consistent with a dramatic decrease in MLH from 220 to 135 m. Note that the most significant increases in organics, sulfate, and chloride during S4 likely indicate the rapid accumulation and/or transformation of coal combustion emissions (Wang et al., 2015). The high RH layer height gradually evolved to ∼ 240 m during stage 5 (S5, 22:30–09:00) according to the vertical variations in RH and, correspondingly, the MLH increased from 130 to 260 m. Figure 7b and c show consistently low WS and high RH at the early stage of S5. Although NR-PM1 at ground level showed a gradual decrease, the contributions of secondary species to NR-PM1 increased. These results likely indicate an enhanced formation of secondary aerosol species due to aqueous-phase processing while the scavenging compensated the increases in the total mass. As a comparison, we did not observe similar increases in secondary aerosol species at 260 m because of low RH (< 70 %). The vertical profile of bext showed a transition point at the height of ∼ 100–130 m, overall consistent with the vertical variations in meteorology. After 01:00, an increase in WS above 100 m was observed, leading to a faster decrease of NR-PM1 at 260 m than ground level. The height of the high RH layer was also decreased from ∼ 240 to 150 m. Such changes in meteorological conditions again led to a strong vertical gradient of bext. For example, bext for V14 was ∼ 1400 Mm−1 at ground level, while it was nearly a factor of 2 lower at 260 m (∼ 750 Mm−1), consistent with the difference in NR-PM1 concentration (170 vs. 90 µg m−3). After 09:00, RH quickly dropped to < 20 % at both ground level and 260 m. Because of the increasing T, MLH rapidly increased from < 200 to ∼ 550 m (13:00). Consistently, the vertical differences between ground level and 260 m were largely reduced, and the vertical profiles of bext showed relatively even distributions (type 1). These results indicate that aerosol particles during S6 became relatively well mixed.
3.4 Vertical covariations of pollutants
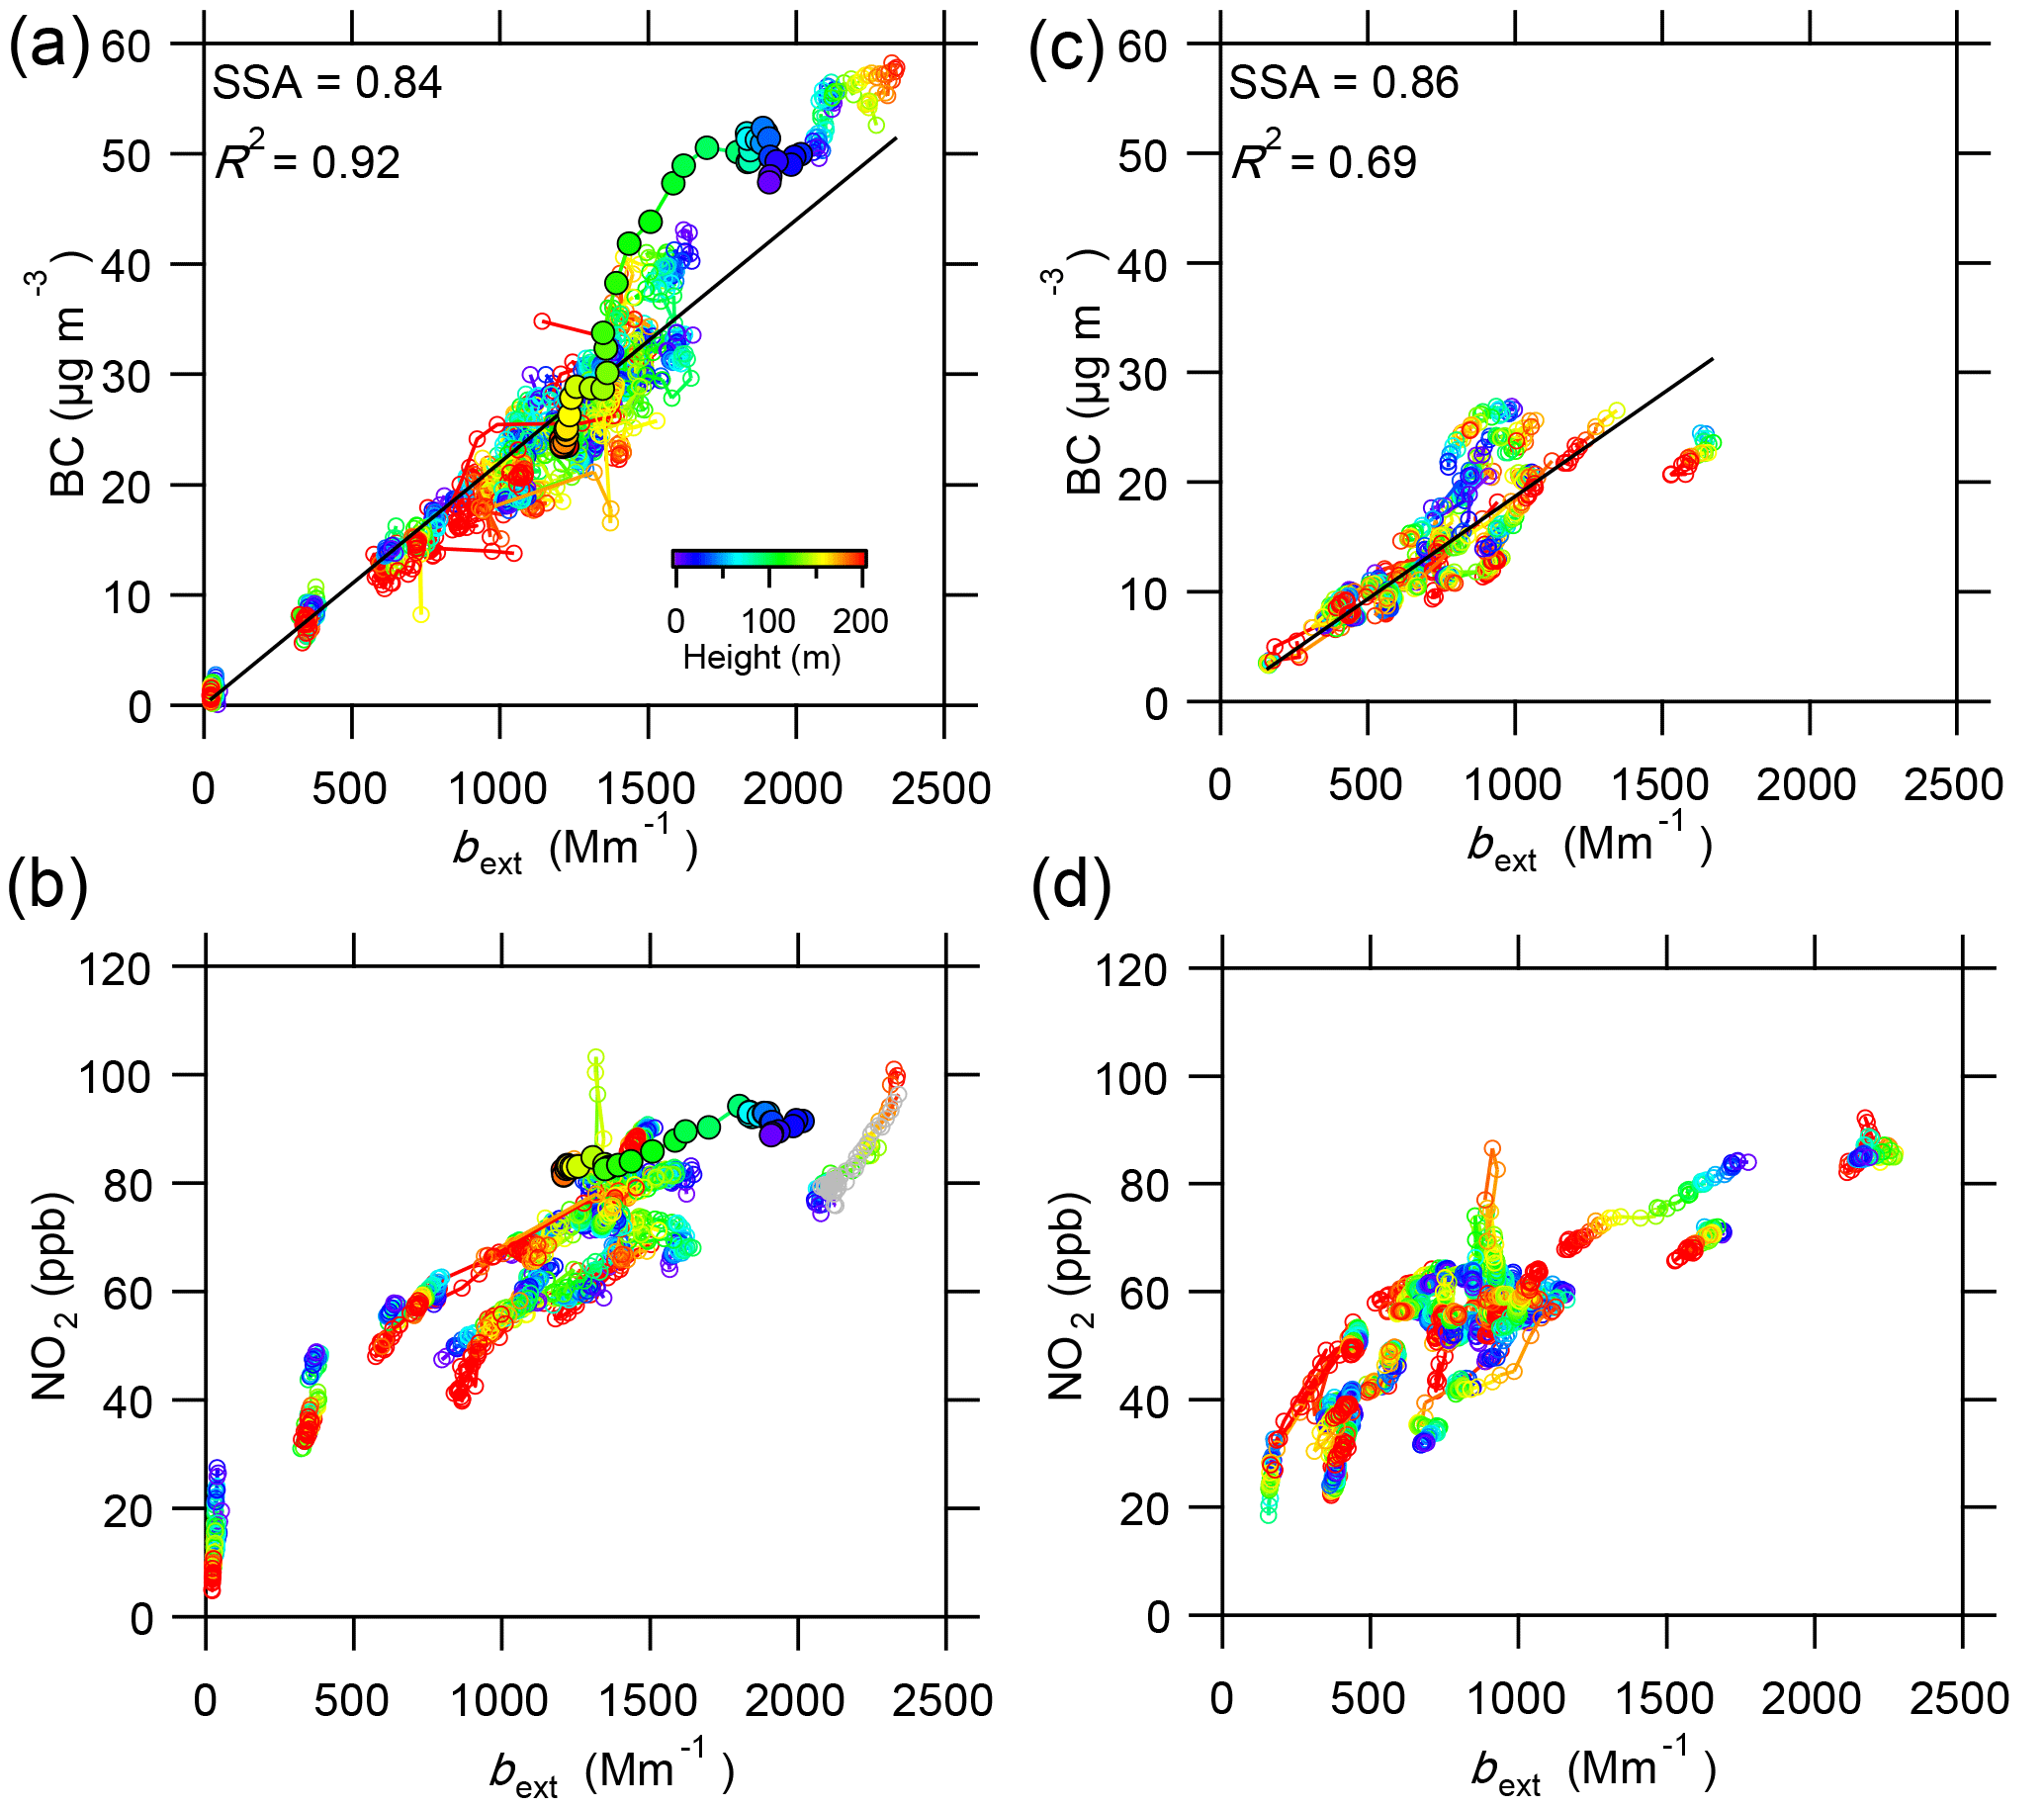
Figure 8Correlations between BC and bext, NO2 and bext for all vertical profiles in (a, b) November and (c, d) January. The data points are color coded by the heights. The solid circles in panels (a) and (b) are data points for V11.
Figure 8 shows the correlations of BC and NO2 with bext for all vertical profiles during the two haze episodes. The vertical profiles of BC were similar to bext for most of the time (R2=0.92 and 0.69 in November and January, respectively). By performing a linear regression of BC to three POA factors (FFOA, COA, BBOA) and secondary aerosol species (SA = SOA + sulfate + nitrate + ammonium) (Sun et al., 2016), we found that ∼ 30 % of BC was associated with SA during the severe haze episode in November, while it was only ∼ 11 % during the one in January. This explains the better correlation between bext and BC in November than in January. The average single-scattering albedo (SSA) calculated with a constant mass absorption efficiency for BC (7.3 m2 g−1) (Han et al., 2015) using Eq. (1) was 0.84 and 0.86 in November and January, respectively.
The SSA values were generally consistent with those observed in previous studies (Z. Li et al., 2015; Lee et al., 2007; Han et al., 2015, 2017), e.g., 0.85 (±0.06) during the fall of 2014 (Han et al., 2015) and 0.85 (±0.04) in the winter of 2015 (Han et al., 2017). We also observed slightly lower values at lower altitudes, indicating an enhanced BC absorption due to the influences of local emissions (Sun et al., 2015, 2010). However, for several specific events, we observed very significantly different correlations between BC and bext. For example, V11 showed strong vertical gradients for both BC and bext with sudden decreases at approximately 100 m (Fig. S8). As indicated in Fig. 4d, such changes were mainly associated with corresponding changes in meteorological parameters, which were characterized by a T inversion, a decrease in RH, and a wind direction change from northeast to northwest. The vertical profile of SSA first showed a gradual decrease from 0.82 at ground level to 0.78 at 100 m, followed by a large increase to 0.86 at 200 m (Fig. S8). As shown in Fig. 9, aerosol composition was substantially different below (ground level) and above (260 m) the transition height. While organics showed higher contribution at ground site than at 260 m (48–51 % vs. 44 %), the nitrate contribution was relatively lower (18–20 % vs. 23–24 %). Also, OA at the ground site was dominated by POA from cooking and biomass burning emissions (70–74 %), while it was mainly composed of secondary OA (LO-OOA + MO-OOA, ∼ 66 %) at 260 m. These results indicate that aerosol particles below the transition height were largely influenced by local source emissions, while those above the height were more affected by secondary aerosols.

Figure 9Average chemical composition of NR-PM1 and OA at ground level and 260 m for vertical profile 11 (V11). Right panels are the mass fractions of NR-PM1 and OA species. “U” and “D” represent “up” and “down” experiment, respectively.
NO2 showed overall similar vertical profiles as bext (Fig. S9) during the severe haze episode in November as indicated by the tight correlations in Fig. 10 (R2>0.75 for 63 % of the time). The slopes of bext versus NO2 were relatively stable before 21 November by varying from 16 to 20 Mm−1 ppb−1. However, we observed large decreases in bext ∕ NO2 from 26 to 2–3 Mm−1 ppb−1 on 21 November. This is consistent with the fact that the NO2 concentration slowly decreased from ∼ 60 to 20 ppb, while bext rapidly decreased from ∼ 2000 to 60 Mm−1. Compared with November, the vertical profiles of NO2 showed more differences from those of bext during the haze episode in January. The similar vertical profiles with R2>0.75 accounted for 32 % of the total profiles (Fig. 10). The average bext ∕ NO2 ratios also varied more significantly (∼ 10–20 Mm−1 ppb−1 for most of the time) than those in November. Also note that the bext ∕ NO2 ratios in January appeared to show a clear diurnal pattern with higher values at nighttime, which can be explained by the different primary and secondary sources between daytime and nighttime. The types of vertical profiles of bext ∕ NO2 are relatively similar to those of bext. As shown in Fig. 4, the vertical profiles of bext ∕ NO2 showed either uniform distributions (type 1), decreases or increases as a function of height (types 2 and 3), or significant decreases at ∼ 100 m (V11) or 180–200 m (V14) (type 4).
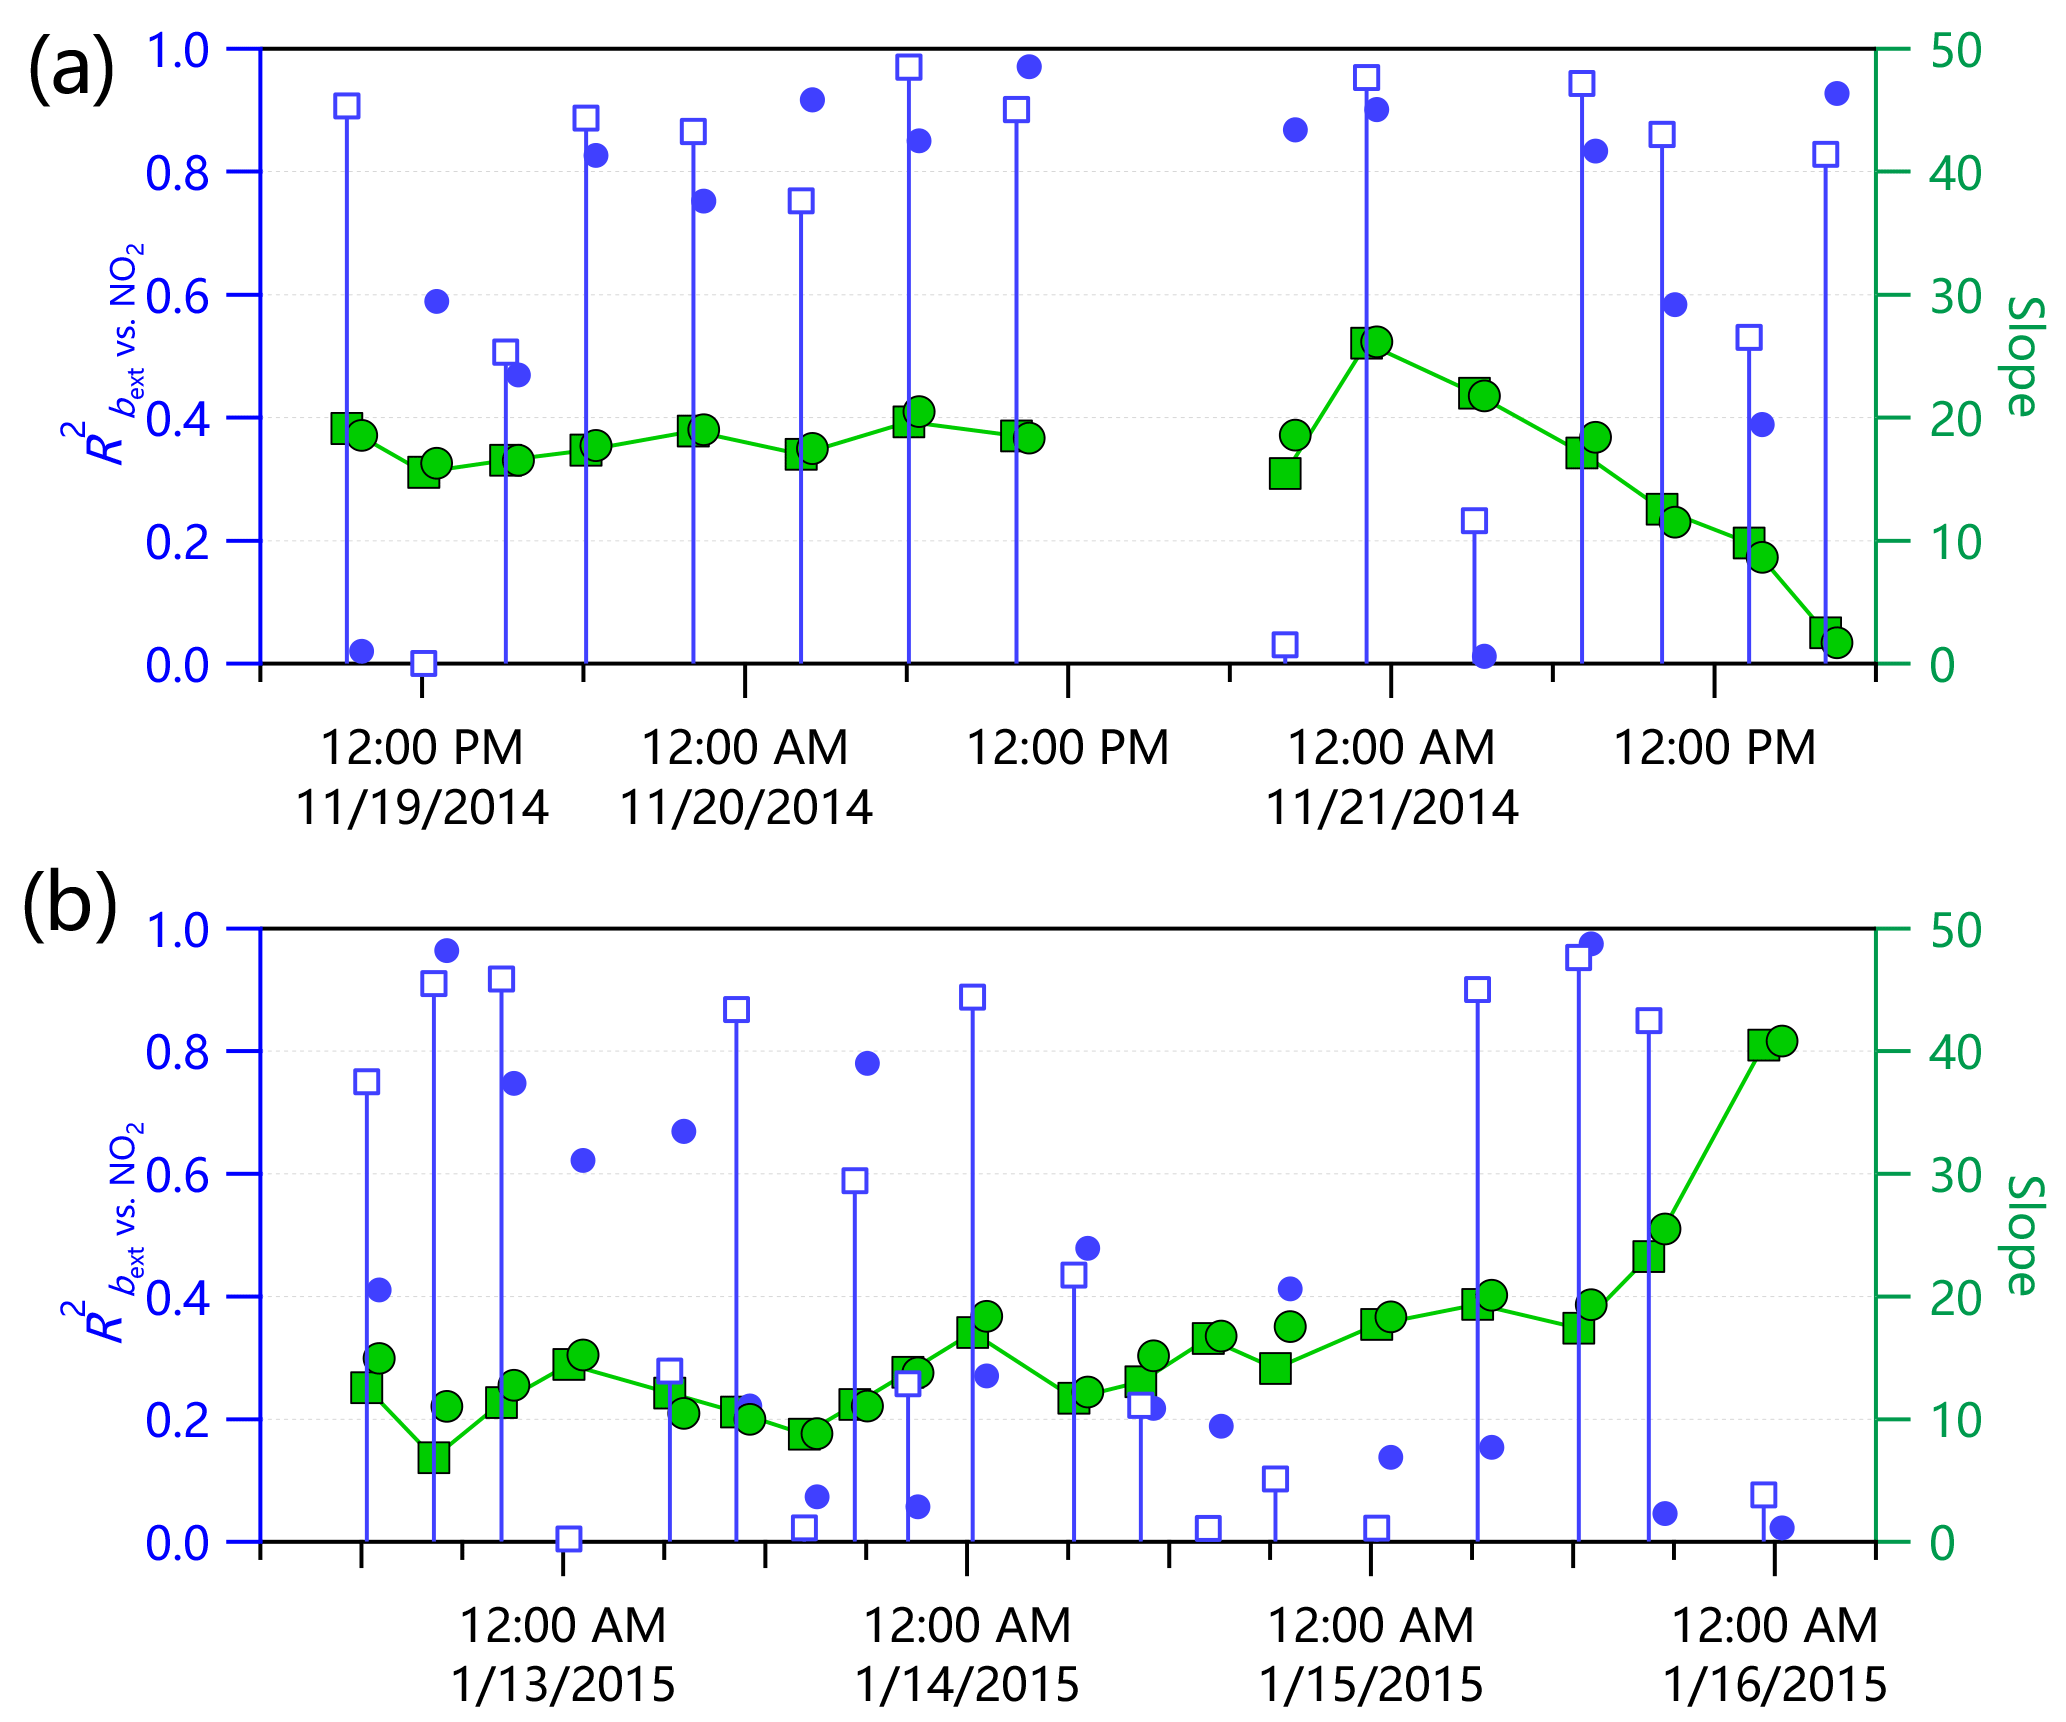
Figure 10Time series of correlation coefficients (R2) and slopes between bext and NO2 for each vertical profile in (a) November and (b) January. The circles refer to the down profiles while other are the up profiles.
Figure 8c and d also show that the correlations between bext and NO2 were not linear, and the ratio of bext ∕ NO2 appeared to increase as a function of pollution level. For example, the ratio of bext ∕ NO2 decreased from ∼ 26 to ∼ 17 Mm−1 ppb−1 during the high RH period of 00:00–07:00 on 21 November as the mass concentration of NR-PM1 decreased from ∼ 300 to 170 µg m−3 (Dan et al., 1999, 2003; Mcmurry et al., 2004; Wayne et al., 1991). One explanation is the enhanced formation of secondary aerosol species during severe haze episodes that were associated with the oxidation of precursors (e.g., SO2 and NO2). This is particularly important for SO2 that can be rapidly oxidized to form sulfate via aqueous-phase and/or fog processing (Sun et al., 2013b; Quan et al., 2015), while the role of NO2 oxidation is generally small due to its much slower aqueous-phase processing rates (Seinfeld and Pandis, 2006), which is also supported by the shorter lifetime of SO2 compared with that of NO2 in the atmosphere. In addition, the scavenging rates of gaseous species and particles can be substantially different during the high RH event (Wayne et al., 1991; Dan et al., 1999, 2003; Mcmurry et al., 2004). While most aerosol species can be efficiently scavenged (e.g., > 50 % during fog events with high RH) (Gilardoni et al., 2014), the scavenging of NO2 is much slower due to its low solubility. This could be another important factor affecting the changes in bext ∕ NO2 ratios.
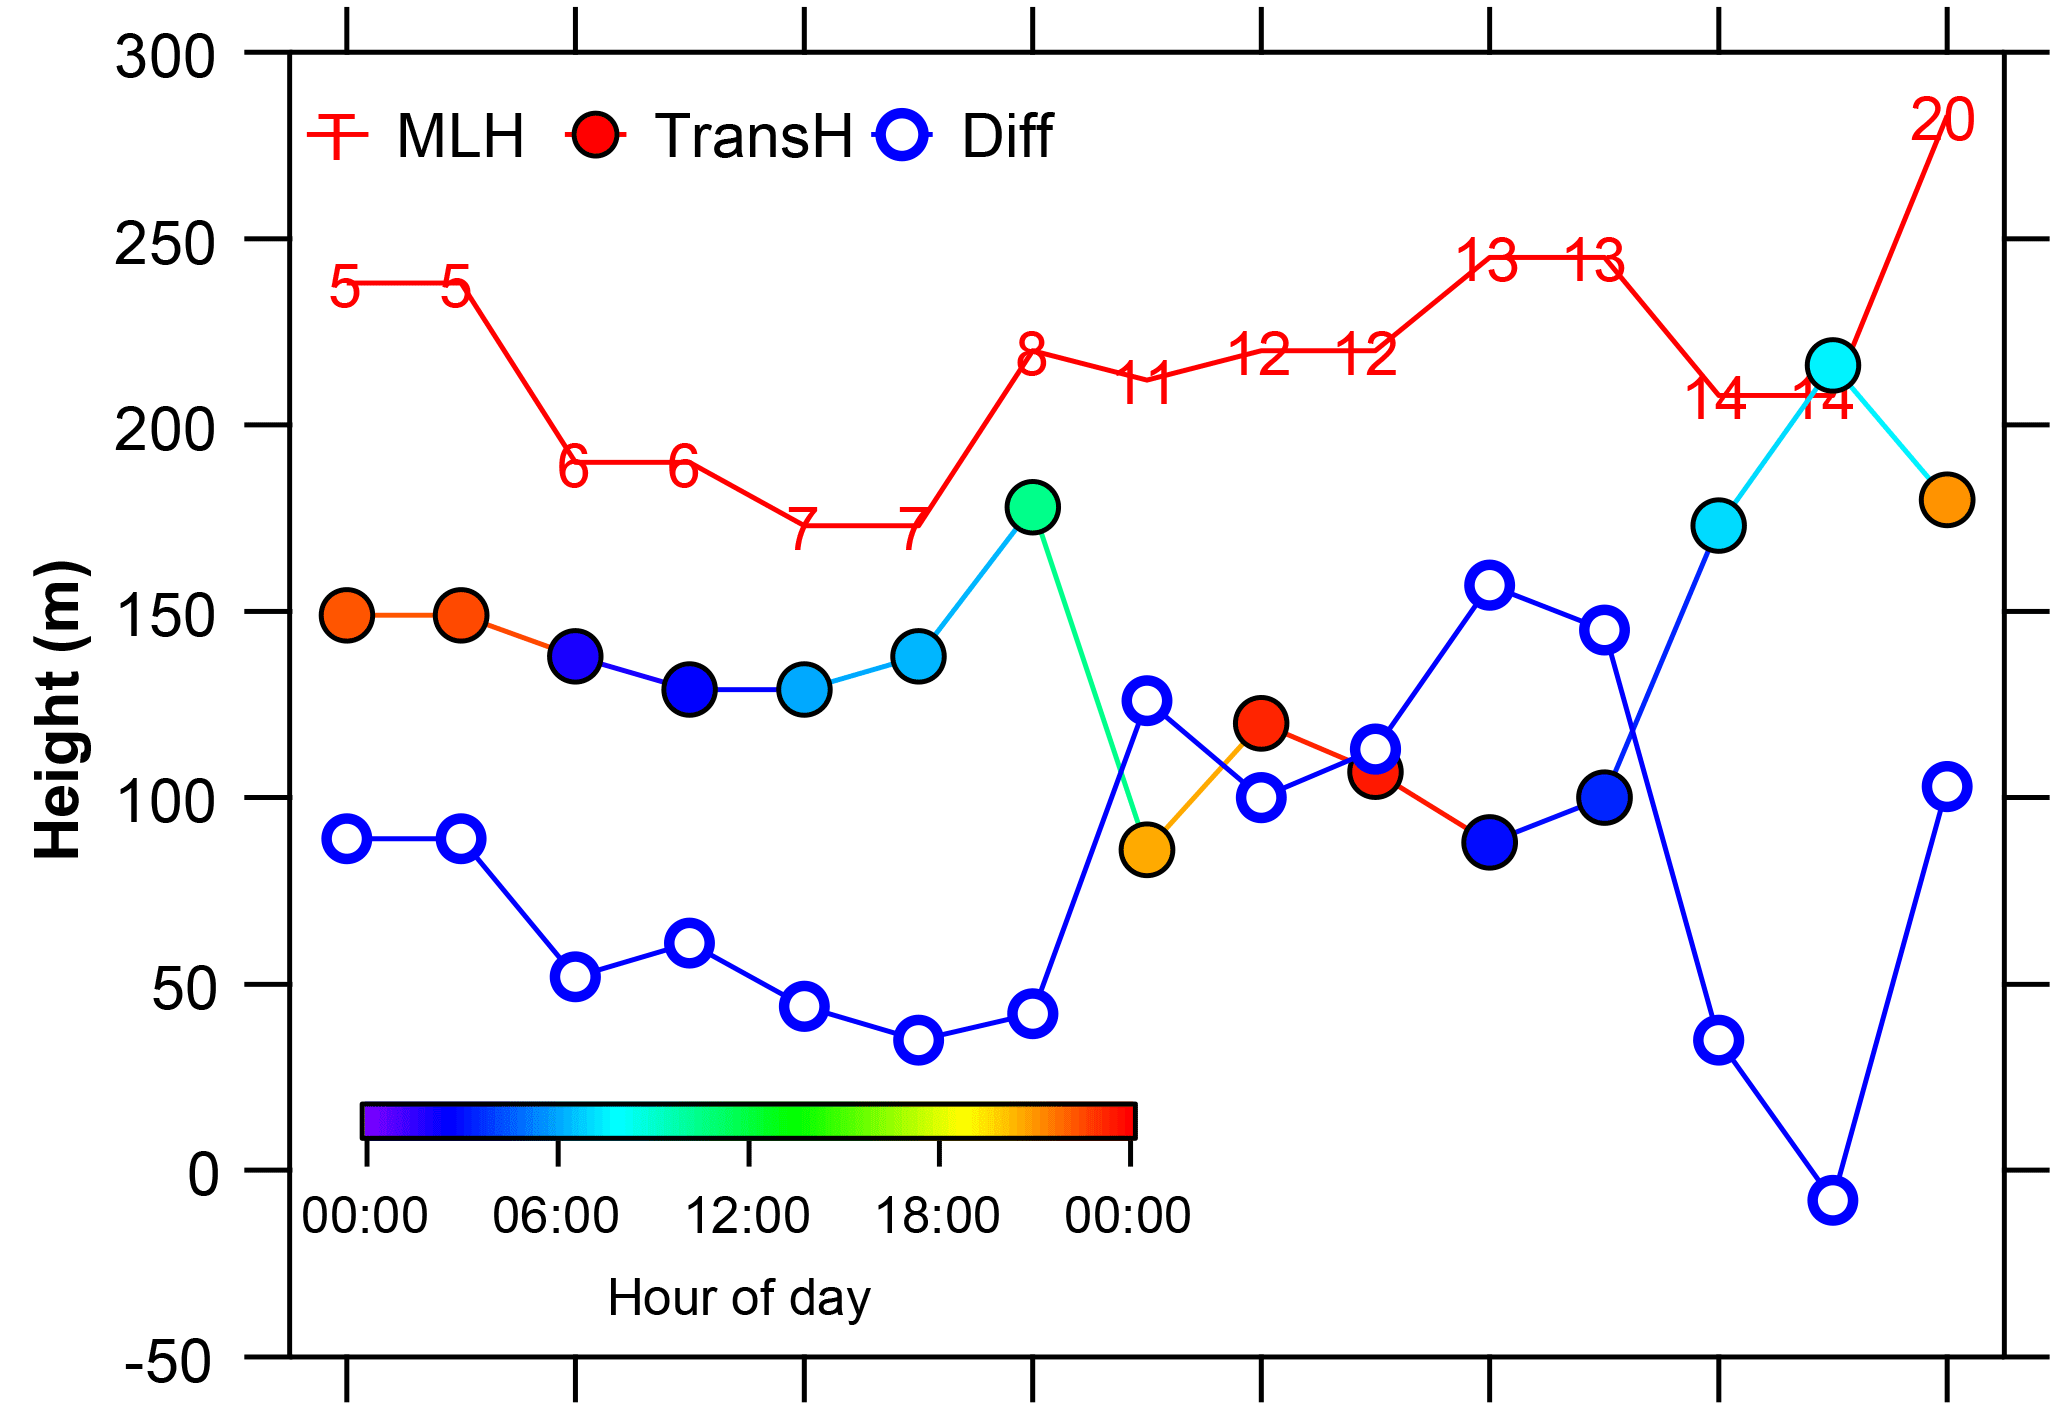
Figure 11A comparison of mixing layer height (MLH) with that estimated from the transition heights of bext. The numbers of vertical profiles as marked in Fig. 1 and the differences of the two heights are also shown. Note that only vertical profiles with significant changes were used for estimation of transition heights.
The vertical profiles of particle extinction, gaseous NO2, and BC from ground level to 260 m measured during two severe winter haze episodes in the megacity of Beijing varied very dynamically and interacted closely with boundary layer and meteorological conditions. Four types of vertical profiles (96 % of the time) were sorted out to elucidate the vertical evolution characteristics of air pollutants during the two severe haze episodes. The diurnal evolution of vertical profiles of bext highlighted the presence of a nocturnal stable boundary layer between 100 and 150 m during severe haze episodes and its impact on the vertical characteristics of air pollution. However, the transition heights determined from the vertical changes in bext through visual inspection were consistently lower than the MLH retrieved from the ceilometer measurements. As shown in Fig. 11, the differences between the two methods can be as large as 100–150 m during the periods with the highest bext (vertical profiles of 11–13) and ∼ 40–100 m during other periods with nocturnal stable boundary layer. These results indicate that the ceilometer measurements might often overestimate the MLH, particularly at nighttime during severe haze episodes, and the vertically resolved measurements on the BMT can be an essential supplement, particularly for the lidar measurements with a blind zone below ∼ 200–300 m. Because of the relatively low number of cases and the limited height of the meteorological tower, future vertical measurements of particle extinction to a high altitude, e.g., using tethered balloons, are needed to further validate the retrieval of MLH from CL51 measurements. Traditional air quality forecast models often underestimate severe haze episodes substantially. In addition to the incomplete understanding of the formation mechanisms, the very complex and dynamic vertical variations could also be one of the major reasons. Our results also highlight that more comprehensive vertical measurements (e.g., more aerosol and gaseous species) at a higher altitude in the megacities are urgently needed for a better understanding of the formation mechanisms and evolution of severe haze episodes.
The data in this study are available from the authors upon request (sunyele@mail.iap.ac.cn).
The supplement related to this article is available online at: https://doi.org/10.5194/acp-18-2495-2018-supplement.
The authors declare that they have no conflict of interest.
This work was supported by the National Key Project of Basic Research
(2014CB447900), the National Natural Science Foundation of China (41575120,
41571130034), the Beijing Natural Science Foundation (8161004), National
Postdoctoral Program for Innovative Talents (BX201600157), and the General
Financial Grant from the China Postdoctoral Science Foundation
(2017M610972).
Edited by: Andreas Richter
Reviewed by: two anonymous referees
Brown, S. S., Thornton, J. A., Keene, W. C., Pszenny, A. A. P., Sive, B. C., Dubé, W. P., Wagner, N. L., Young, C. J., Riedel, T. P., Roberts, J. M., VandenBoer, T. C., Bahreini, R., Öztürk, F., Middlebrook, A. M., Kim, S., Hübler, G., and Wolfe, D. E.: Nitrogen, Aerosol Composition, and Halogens on a Tall Tower (NACHTT): Overview of a wintertime air chemistry field study in the front range urban corridor of Colorado, J. Geophys. Res., 118, 8067–8085, https://doi.org/10.1002/jgrd.50537, 2013.
Canonaco, F., Crippa, M., Slowik, J. G., Baltensperger, U., and Prévôt, A. S. H.: SoFi, an IGOR-based interface for the efficient use of the generalized multilinear engine (ME-2) for the source apportionment: ME-2 application to aerosol mass spectrometer data, Atmos. Meas. Tech., 6, 3649–3661, https://doi.org/10.5194/amt-6-3649-2013, 2013.
Chan, C. K. and Yao, X.: Air pollution in mega cities in China, Atmos. Environ., 42, 1–42, https://doi.org/10.1016/j.atmosenv.2007.09.003, 2008.
Chan, C. Y., Xu, X. D., Li, Y. S., Wong, K. H., Ding, G. A., Chan, L. Y., and Cheng, X. H.: Characteristics of vertical profiles and sources of PM2.5, PM10 and carbonaceous species in Beijing, Atmos. Environ., 39, 5113–5124, https://doi.org/10.1016/j.atmosenv.2005.05.009, 2005.
Chen, C., Sun, Y. L., Xu, W. Q., Du, W., Zhou, L. B., Han, T. T., Wang, Q. Q., Fu, P. Q., Wang, Z. F., Gao, Z. Q., Zhang, Q., and Worsnop, D. R.: Characteristics and sources of submicron aerosols above the urban canopy (260 m) in Beijing, China, during the 2014 APEC summit, Atmos. Chem. Phys., 15, 12879–12895, https://doi.org/10.5194/acp-15-12879-2015, 2015.
Chen, Y., Zhao, C., Zhang, Q., Deng, Z., Huang, M., and Ma, X.: Aircraft study of Mountain Chimney Effect of Beijing, China, J. Geophys. Res., 114, D08306, https://doi.org/10.1029/2008JD010610, 2009.
Crenn, V., Sciare, J., Croteau, P. L., Verlhac, S., Fröhlich, R., Belis, C. A., Aas, W., äijälä, M., Alastuey, A., Artiñano, B., Baisnée, D., Bonnaire, N., Bressi, M., Canagaratna, M., Canonaco, F., Carbone, C., Cavalli, F., Coz, E., Cubison, M. J., Esser-Gietl, J. K., Green, D. C., Gros, V., Heikkinen, L., Herrmann, H., Lunder, C., Minguillón, M. C., Mocnik, G., O'Dowd, C. D., Ovadnevaite, J., Petit, J.-E., Petralia, E., Poulain, L., Priestman, M., Riffault, V., Ripoll, A., Sarda-Estève, R., Slowik, J. G., Setyan, A., Wiedensohler, A., Baltensperger, U., Prévôt, A. S. H., Jayne, J. T., and Favez, O.: ACTRIS ACSM intercomparison – Part 1: Reproducibility of concentration and fragment results from 13 individual Quadrupole Aerosol Chemical Speciation Monitors (Q-ACSM) and consistency with co-located instruments, Atmos. Meas. Tech., 8, 5063–5087, https://doi.org/10.5194/amt-8-5063-2015, 2015.
Crippa, M., Canonaco, F., Lanz, V. A., äijälä, M., Allan, J. D., Carbone, S., Capes, G., Ceburnis, D., Dall'Osto, M., Day, D. A., DeCarlo, P. F., Ehn, M., Eriksson, A., Freney, E., Hildebrandt Ruiz, L., Hillamo, R., Jimenez, J. L., Junninen, H., Kiendler-Scharr, A., Kortelainen, A.-M., Kulmala, M., Laaksonen, A., Mensah, A. A., Mohr, C., Nemitz, E., O'Dowd, C., Ovadnevaite, J., Pandis, S. N., Petäjä, T., Poulain, L., Saarikoski, S., Sellegri, K., Swietlicki, E., Tiitta, P., Worsnop, D. R., Baltensperger, U., and Prévôt, A. S. H.: Organic aerosol components derived from 25 AMS data sets across Europe using a consistent ME-2 based source apportionment approach, Atmos. Chem. Phys., 14, 6159–6176, https://doi.org/10.5194/acp-14-6159-2014, 2014.
Dan, J., Anderson, T., Covert, D., Kotchenruther, R., Trost, B., Danielson, J., Simpson, W., Berntsen, T., Karlsdottir, S., and Blake, D.: Transport of Asian air pollution to North America, Geophys. Res. Lett., 26, 711–714, 1999.
Dan, J., Mckendry, I., Anderson, T., and Price, H.: Six “new” episodes of trans-Pacific transport of air pollutants, Atmos. Environ., 37, 391–404, 2003.
Drinovec, L., Mocnik, G., Zotter, P., Prévôt, A. S. H., Ruckstuhl, C., Coz, E., Rupakheti, M., Sciare, J., Müller, T., Wiedensohler, A., and Hansen, A. D. A.: The “dual-spot” Aethalometer: an improved measurement of aerosol black carbon with real-time loading compensation, Atmos. Meas. Tech., 8, 1965–1979, https://doi.org/10.5194/amt-8-1965-2015, 2015.
Ge, B., Sun, Y., Liu, Y., Dong, H., Ji, D., Jiang, Q., Li, J., and Wang, Z.: Nitrogen dioxide measurement by cavity attenuated phase shift spectroscopy (CAPS) and implications in ozone production efficiency and nitrate formation in Beijing, China, J. Geophys. Res., 118, 9499–9509, https://doi.org/10.1002/jgrd.50757, 2013.
Geiß, A., Wiegner, M., Bonn, B., Schäfer, K., Forkel, R., von Schneidemesser, E., Münkel, C., Chan, K. L., and Nothard, R.: Mixing layer height as an indicator for urban air quality?, Atmos. Meas. Tech., 10, 2969–2988, https://doi.org/10.5194/amt-10-2969-2017, 2017.
Gilardoni, S., Massoli, P., Giulianelli, L., Rinaldi, M., Paglione, M., Pollini, F., Lanconelli, C., Poluzzi, V., Carbone, S., Hillamo, R., Russell, L. M., Facchini, M. C., and Fuzzi, S.: Fog scavenging of organic and inorganic aerosol in the Po Valley, Atmos. Chem. Phys., 14, 6967–6981, https://doi.org/10.5194/acp-14-6967-2014, 2014.
Guo, S., Hu, M., Zamora, M. L., Peng, J., Shang, D., Zheng, J., Du, Z., Wu, Z., Shao, M., Zeng, L., Molina, M. J., and Zhang, R.: Elucidating severe urban haze formation in China, P. Natl. Acad. Sci. USA, 111, 17373–17378, https://doi.org/10.1073/pnas.1419604111, 2014.
Han, T., Xu, W., Chen, C., Liu, X., Wang, Q., Li, J., Zhao, X., Du, W., Wang, Z., and Sun, Y.: Chemical apportionment of aerosol optical properties during the Asia-Pacific Economic Cooperation (APEC) summit in Beijing, China, J. Geophys. Res., 120, 12281–12295, https://doi.org/10.1002/2015JD023918, 2015.
Han, T., Xu, W., Li, J., Freedman, A., Zhao, J., Wang, Q., Chen, C., Zhang, Y., Wang, Z., Fu, P., Liu, X., and Sun, Y.: Aerosol optical properties measurements by a CAPS single scattering albedo monitor: Comparisons between summer and winter in Beijing, China, J. Geophys. Res., 122, 2513–2526, https://doi.org/10.1002/2016jd025762, 2017.
Huang, R.-J., Zhang, Y., Bozzetti, C., Ho, K.-F., Cao, J.-J., Han, Y., Daellenbach, K. R., Slowik, J. G., Platt, S. M., Canonaco, F., Zotter, P., Wolf, R., Pieber, S. M., Bruns, E. A., Crippa, M., Ciarelli, G., Piazzalunga, A., Schwikowski, M., Abbaszade, G., Schnelle-Kreis, J., Zimmermann, R., An, Z., Szidat, S., Baltensperger, U., Haddad, I. E., and Prevot, A. S. H.: High secondary aerosol contribution to particulate pollution during haze events in China, Nature, 514, 218–222, 10.1038/nature13774, 2014.
Ji, D., Li, L., Wang, Y., Zhang, J., Cheng, M., Sun, Y., Liu, Z., Wang, L., Tang, G., Hu, B., Chao, N., Wen, T., and Miao, H.: The heaviest particulate air-pollution episodes occurred in northern China in January, 2013: Insights gained from observation, Atmos. Environ., 92, 546–556, 2014.
Kebabian, P. L., Robinson, W. A., and Freedman, A.: Optical extinction monitor using cw cavity enhanced detection, Rev. Sci. Instrum., 78, 063102, https://doi.org/10.1063/1.2744223, 2007.
Kebabian, P. L., Wood, E. C., Herndon, S. C., and Freedman, A.: A Practical Alternative to Chemiluminescence-Based Detection of Nitrogen Dioxide: Cavity Attenuated Phase Shift Spectroscopy, Environ. Sci. Technol., 42, 6040–6045, https://doi.org/10.1021/es703204j, 2008.
Kim, S., VandenBoer, T. C., Young, C. J., Riedel, T. P., Thornton, J. A., Swarthout, B., Sive, B., Lerner, B., Gilman, J. B., Warneke, C., Roberts, J. M., Guenther, A., Wagner, N. L., Dubé, W. P., Williams, E., and Brown, S. S.: The primary and recycling sources of OH during the NACHTT-2011 campaign: HONO as an important OH primary source in the wintertime, J. Geophys. Res., 116, 6886–6896, 2014.
Lee, K. H., Li, Z., Man, S. W., Xin, J., Wang, Y., Hao, W. M., and Zhao, F.: Aerosol single scattering albedo estimated across China from a combination of ground and satellite measurements, J. Geophys. Res., 112, 88–97, 2007.
Li, J., Fu, Q., Huo, J., Wang, D., Yang, W., Bian, Q., Duan, Y., Zhang, Y., Pan, J., Lin, Y., Huang, K., Wang, S.-H., Fu, J., and Louie, P. K. K.: Tethered Balloon-Based Black Carbon Profiles within the Lower Troposphere of Shanghai in the 2013 East China Smog, Atmos. Environ., 123, 327–338, 2015.
Li, P., Yan, R., Yu, S., Wang, S., Liu, W., and Bao, H.: Reinstate regional transport of PM2.5 as a major cause of severe haze in Beijing, P. Natl. Acad. Sci. USA, 112, E2739–E2740, https://doi.org/10.1073/pnas.1502596112, 2015.
Li, X., An, J., Wang, Y., Chen, W., Hu, F., Chen, H., and Liqing, S.: Studies on the measurement of atmospheric ozone in summer with Beijing meteorological tower, China Environ. Sci., 23, 353–357, 2003.
Li, Z., Li, L., Zhang, F., Li, D., Xie, Y., and Xu, H.: Comparison of aerosol properties over Beijing and Kanpur: Optical, physical properties and aerosol component composition retrieved from 12 years ground-based Sun-sky radiometer remote sensing data, J. Geophys. Res., 120, 1520–1535, 2015.
Liu, X., Cheng, X., and Hu, F.: Gradient characteristics of CO2 concentration and flux in Beijing urban area part I: Concentration and virtual temperature, Chinese J. Geophys., 58, 1502–1512, 2015 (in Chinese).
Mcmurry, P. H., Shepherd, M. F., and Vickery, J. S.: Particulate matter science for policy makers: a NARSTO assessment, 542, Cambridge University Press ISBN-13: 9780521842877, 2004.
Meng, Z. Y., Ding, G. A., Xu, X. B., Xu, X. D., Yu, H. Q., and Wang, S. F.: Vertical distributions of SO2 and NO2 in the lower atmosphere in Beijing urban areas, China, Sci. Total Environ., 390, 456–465, https://doi.org/10.1016/j.scitotenv.2007.10.012, 2008.
Münkel, C., Eresmaa, N., Räsänen, J., and Karppinen, A.: Retrieval of mixing height and dust concentration with lidar ceilometer, Bound-Lay. Meteorol., 124, 117–128, 2007.
Nenes, A., Pandis, S. N., and Pilinis, C.: ISORROPIA: A New Thermodynamic Equilibrium Model for Multiphase Multicomponent Inorganic Aerosols, Aquat. Geochem., 4, 123–152, 1998.
Öztürk, F., Bahreini, R., Wagner, N., Dubé, W., Young, C., Brown, S., Brock, C., Ulbrich, I., Jimenez, J., and Cooper, O.: Vertically resolved chemical characteristics and sources of submicron aerosols measured on a Tall Tower in a suburban area near Denver, Colorado in winter, J. Geophys. Res., 118, 13591–13605, 2013a.
Öztürk, F., Bahreini, R., Wagner, N. L., Dubé, W. P., Young, C. J., Brown, S. S., Brock, C. A., Ulbrich, I. M., Jimenez, J. L., Cooper, O. R., and Middlebrook, A. M.: Vertically Resolved Chemical Characteristics and Sources of Sub-micron Organic Aerosols Measured on a Tall Tower in a Suburban Area near Denver, Colorado in winter, J. Geophys. Res., 118, 13591–13605, https://doi.org/10.1002/2013JD019923, 2013b.
Paatero, P. and Tapper, U.: Positive matrix factorization – A nonnegative factor model with optimal utilization of error estimates of data values, Environmetrics, 5, 111–126, https://doi.org/10.1002/env.3170050203, 1994.
Quan, J., Gao, Y., Zhang, Q., Tie, X., Cao, J., Han, S., Meng, J., Chen, P., and Zhao, D.: Evolution of planetary boundary layer under different weather conditions, and its impact on aerosol concentrations, Particuology, 11, 34–40, 2013.
Quan, J., Liu, Q., Li, X., Gao, Y., Jia, X., Sheng, J., and Liu, Y.: Effect of heterogeneous aqueous reactions on the secondary formation of inorganic aerosols during haze events, Atmos. Environ., 122, 306–312, 2015.
Ran, L., Deng, Z., Xu, X., Yan, P., Lin, W., Wang, Y., Tian, P., Wang, P., Pan, W., and Lu, D.: Vertical profiles of black carbon measured by a micro-aethalometer in summer in the North China Plain, Atmos. Chem. Phys., 16, 10441–10454, https://doi.org/10.5194/acp-16-10441-2016, 2016.
Riedel, T. P., Wagner, N. L., Dubé, W. P., Middlebrook, A. M., Young, C. J., Öztürk, F., Bahreini, R., VandenBoer, T. C., Wolfe, D. E., and Williams, E. J.: Chlorine activation within urban or power plant plumes: Vertically resolved ClNO2 and Cl2 measurements from a tall tower in a polluted continental setting, J. Geophys. Res., 118, 8702–8715, 2013.
Seinfeld, J. H. and Pandis, S. N.: Atmospheric Chemistry and Physics: from Air Pollution to Climate Change, Wiley, John & Sons, Incorporated, New York, 1203 pp., 2006.
Stull, R. B.: An introduction to boundary layer meteorology, Springer Netherlands, 666 pp., 1988.
Sun, Y., Wang, Y., and Zhang, C.: Measurement of the vertical profile of atmospheric SO2 during the heating period in Beijing on days of high air pollution, Atmos. Environ., 43, 468–472, https://doi.org/10.1016/j.atmosenv.2008.09.057, 2009.
Sun, Y., Wang, Y., and Zhang, C.: Vertical observations and analysis of PM2.5, O3, and NOx at Beijing and Tianjin from towers during summer and autumn 2006, Adv. Atmos. Sci., 27, 123–136, 2010.
Sun, Y., Song, T., Tang, G., and Wang, Y.: The vertical distribution of PM2.5 and boundary-layer structure during summer haze in Beijing, Atmos. Environ., 74, 413–421, 2013.
Sun, Y. L., Wang, Z. F., Fu, P. Q., Yang, T., Jiang, Q., Dong, H. B., Li, J., and Jia, J. J.: Aerosol composition, sources and processes during wintertime in Beijing, China, Atmos. Chem. Phys., 13, 4577–4592, https://doi.org/10.5194/acp-13-4577-2013, 2013a.
Sun, Y. L., Wang, Z., Fu, P., Jiang, Q., Yang, T., Li, J., and Ge, X.: The impact of relative humidity on aerosol composition and evolution processes during wintertime in Beijing, China, Atmos. Environ., 77, 927–934, 2013b.
Sun, Y. L., Jiang, Q., Wang, Z., Fu, P., Li, J., Yang, T., and Yin, Y.: Investigation of the sources and evolution processes of severe haze pollution in Beijing in January 2013, J. Geophys. Res., 119, 4380–4398, https://doi.org/10.1002/2014JD021641, 2014.
Sun, Y. L., Du, W., Wang, Q., Zhang, Q., Chen, C., Chen, Y., Chen, Z., Fu, P., Wang, Z., Gao, Z., and Worsnop, D. R.: Real-Time Characterization of Aerosol Particle Composition above the Urban Canopy in Beijing: Insights into the Interactions between the Atmospheric Boundary Layer and Aerosol Chemistry, Environ. Sci. Technol., 49, 11340–11347, 10.1021/acs.est.5b02373, 2015.
Sun, Y. L., Wang, Z., Wild, O., Xu, W., Chen, C., Fu, P., Du, W., Zhou, L., Zhang, Q., Han, T., Wang, Q., Pan, X., Zheng, H., Li, J., Guo, X., Liu, J., and Worsnop, D. R.: “APEC Blue”: Secondary Aerosol Reductions from Emission Controls in Beijing, Sci. Rep., 6, 20668, https://doi.org/10.1038/srep20668, 2016.
Tang, G., Zhu, X., Hu, B., Xin, J., Wang, L., Münkel, C., Mao, G., and Wang, Y.: Impact of emission controls on air quality in Beijing during APEC 2014: lidar ceilometer observations, Atmos. Chem. Phys., 15, 12667–12680, https://doi.org/10.5194/acp-15-12667-2015, 2015.
Tang, G., Zhang, J., Zhu, X., Song, T., Münkel, C., Hu, B., Schäfer, K., Liu, Z., Zhang, J., Wang, L., Xin, J., Suppan, P., and Wang, Y.: Mixing layer height and its implications for air pollution over Beijing, China, Atmos. Chem. Phys., 16, 2459–2475, https://doi.org/10.5194/acp-16-2459-2016, 2016.
Tao, S., Wang, Y., Wu, S., Liu, S., Dou, H., Liu, Y., Lang, C., Hu, F., and Xing, B.: Vertical distribution of polycyclic aromatic hydrocarbons in atmospheric boundary layer of Beijing in winter, Atmos. Environ., 41, 9594–9602, https://doi.org/10.1016/j.atmosenv.2007.08.026, 2007.
VandenBoer, T. C., Brown, S. S., Murphy, J. G., Keene, W. C., Young, C. J., Pszenny, A., Kim, S., Warneke, C., Gouw, J. A., and Maben, J. R.: Understanding the role of the ground surface in HONO vertical structure: High resolution vertical profiles during NACHTT-11, J. Geophys. Res., 118, 10155–110171, 2013.
Wang, L. T., Wei, Z., Yang, J., Zhang, Y., Zhang, F. F., Su, J., Meng, C. C., and Zhang, Q.: The 2013 severe haze over southern Hebei, China: model evaluation, source apportionment, and policy implications, Atmos. Chem. Phys., 14, 3151–3173, https://doi.org/10.5194/acp-14-3151-2014, 2014.
Wang, Q., Sun, Y., Jiang, Q., Du, W., Sun, C., Fu, P., and Wang, Z.: Chemical composition of aerosol particles and light extinction apportionment before and during the heating season in Beijing, China, J. Geophys. Res., 120, 12708–12722, https://doi.org/10.1002/2015JD023871, 2015.
Wang, W., Cheng, T., Zhang, R., Jia, X., Han, Z., Zhang, X., Xu, X., and Li, D.: Insights into an Asian dust event sweeping Beijing during April 2006: Particle chemical composition, boundary layer structure, and radiative forcing, J. Geophys. Res., 115, 311–319, 2010.
Wang, Y., Yao, L., Wang, L., Liu, Z., Ji, D., Tang, G., Zhang, J., Sun, Y., Hu, B., and Xin, J.: Mechanism for the formation of the January 2013 heavy haze pollution episode over central and eastern China, Sci. China Earth Sci., 57, 14–25, https://doi.org/10.1007/s11430-013-4773-4, 2014.
Wang, Z. F., Jie, L., Zhe, W., Yang, W. Y., Xiao, T., Ge, B. Z., Yan, P. Z., Zhu, L. L., Chen, X. S., and Chen, H. S.: Modeling study of regional severe hazes over mid-eastern China in January 2013 and its implications on pollution prevention and control, Sci. China Earth Sci., 57, 3–13, 2014.
Wayne, R. P., Barnes, I., Biggs, P., Burrows, J. P., Canosa-Mas, C. E., Hjorth, J., Bras, G. L., Moortgat, G. K., Perner, D., and Poulet, G.: The nitrate radical: Physics, chemistry, and the atmosphere, Atmos. Environ., 25, 1–203, 1991.
Wiegner, M., Emeis, S., Freudenthaler, V., Heese, B., Junkermann, W., Münkel, C., Schäfer, K., Seefeldner, M., and Vogt, S.: Mixing layer height over Munich, Germany: Variability and comparisons of different methodologies, J. Geophys. Res., 111, D13201, https://doi.org/10.1029/2005JD006593, 2006.
Xu, W. Q., Sun, Y. L., Chen, C., Du, W., Han, T. T., Wang, Q. Q., Fu, P. Q., Wang, Z. F., Zhao, X. J., Zhou, L. B., Ji, D. S., Wang, P. C., and Worsnop, D. R.: Aerosol composition, oxidation properties, and sources in Beijing: results from the 2014 Asia-Pacific Economic Cooperation summit study, Atmos. Chem. Phys., 15, 13681–13698, https://doi.org/10.5194/acp-15-13681-2015, 2015a.
Zhang, Q., Ma, X., Tie, X., Huang, M., and Zhao, C.: Vertical distributions of aerosols under different weather conditions: Analysis of in-situ aircraft measurements in Beijing, China, Atmos. Environ., 43, 5526–5535, 2009.
Zhang, R., Wang, G., Guo, S., Zamora, M. L., Ying, Q., Lin, Y., Wang, W., Hu, M., and Wang, Y.: Formation of Urban Fine Particulate Matter, Chem. Rev., 115, 3803–3855, https://doi.org/10.1021/acs.chemrev.5b00067, 2015.
Zhao, D., Tie, X., Gao, Y., Zhang, Q., Tian, H., Bi, K., Jin, Y., and Chen, P.: In-Situ Aircraft Measurements of the Vertical Distribution of Black Carbon in the Lower Troposphere of Beijing, China, in the Spring and Summer Time, Atmosphere, 6, 713–731, 2015.
Zhao, J., Du, W., Zhang, Y., Wang, Q., Chen, C., Xu, W., Han, T., Wang, Y., Fu, P., Wang, Z., Li, Z., and Sun, Y.: Insights into aerosol chemistry during the 2015 China Victory Day parade: results from simultaneous measurements at ground level and 260 m in Beijing, Atmos. Chem. Phys., 17, 3215–3232, https://doi.org/10.5194/acp-17-3215-2017, 2017.
Zhao, X. J., Zhao, P. S., Xu, J., Meng, W., Pu, W. W., Dong, F., He, D., and Shi, Q. F.: Analysis of a winter regional haze event and its formation mechanism in the North China Plain, Atmos. Chem. Phys., 13, 5685–5696, 10.5194/acp-13-5685-2013, 2013.
Zheng, B., Zhang, Q., Zhang, Y., He, K. B., Wang, K., Zheng, G. J., Duan, F. K., Ma, Y. L., and Kimoto, T.: Heterogeneous chemistry: a mechanism missing in current models to explain secondary inorganic aerosol formation during the January 2013 haze episode in North China, Atmos. Chem. Phys., 15, 2031–2049, https://doi.org/10.5194/acp-15-2031-2015, 2015.
Zheng, G. J., Duan, F. K., Su, H., Ma, Y. L., Cheng, Y., Zheng, B., Zhang, Q., Huang, T., Kimoto, T., Chang, D., Pöschl, U., Cheng, Y. F., and He, K. B.: Exploring the severe winter haze in Beijing: the impact of synoptic weather, regional transport and heterogeneous reactions, Atmos. Chem. Phys., 15, 2969–2983, https://doi.org/10.5194/acp-15-2969-2015, 2015.
Zhou, W., Wang, Q., Zhao, X., Xu, W., Chen, C., Du, W., Zhao, J., Canonaco, F., Prévôt, A. S. H., Fu, P., Wang, Z., Worsnop, D. R., and Sun, Y.: Characterization and source apportionment of organic aerosol at 260 m on a meteorological tower in Beijing, China, Atmos. Chem. Phys. Discuss., https://doi.org/10.5194/acp-2017-1039, in review, 2017.
Zhu, X., Tang, G., Hu, B., Wang, L., Xin, J., Zhang, J., Liu, Z., Münkel, C., and Wang, Y.: Regional pollution and its formation mechanism over North China Plain: A case study with ceilometer observations and model simulations, J. Geophys. Res., 121, 14574–14588, 2016.