the Creative Commons Attribution 4.0 License.
the Creative Commons Attribution 4.0 License.
 | 15 Feb 2018
Bulk and molecular-level characterization of laboratory-aged biomass burning organic aerosol from oak leaf and heartwood fuels
Claire F. Fortenberry
Michael J. Walker
Yaping Zhang
Dhruv Mitroo
William H. Brune
Brent J. Williams
The chemical complexity of biomass burning organic aerosol (BBOA) greatly increases with photochemical aging in the atmosphere, necessitating controlled laboratory studies to inform field observations. In these experiments, BBOA from American white oak (Quercus alba) leaf and heartwood samples was generated in a custom-built emissions and combustion chamber and photochemically aged in a potential aerosol mass (PAM) flow reactor. A thermal desorption aerosol gas chromatograph (TAG) was used in parallel with a high-resolution time-of-flight aerosol mass spectrometer (AMS) to analyze BBOA chemical composition at different levels of photochemical aging. Individual compounds were identified and integrated to obtain relative decay rates for key molecules. A recently developed chromatogram binning positive matrix factorization (PMF) technique was used to obtain mass spectral profiles for factors in TAG BBOA chromatograms, improving analysis efficiency and providing a more complete determination of unresolved complex mixture (UCM) components. Additionally, the recently characterized TAG decomposition window was used to track molecular fragments created by the decomposition of thermally labile BBOA during sample desorption. We demonstrate that although most primary (freshly emitted) BBOA compounds deplete with photochemical aging, certain components eluting within the TAG thermal decomposition window are instead enhanced. Specifically, the increasing trend in the decomposition m∕z 44 signal (CO) indicates formation of secondary organic aerosol (SOA) in the PAM reactor. Sources of m∕z 60 (C2H4O), typically attributed to freshly emitted BBOA in AMS field measurements, were also investigated. From the TAG chemical speciation and decomposition window data, we observed a decrease in m∕z 60 with photochemical aging due to the decay of anhydrosugars (including levoglucosan) and other compounds, as well as an increase in m∕z 60 due to the formation of thermally labile organic acids within the PAM reactor, which decompose during TAG sample desorption. When aging both types of BBOA (leaf and heartwood), the AMS data exhibit a combination of these two contributing effects, causing limited change to the overall m∕z 60 signal. Our observations demonstrate the importance of chemically speciated data in fully understanding bulk aerosol measurements provided by the AMS in both laboratory and field studies.
- Article
(2674 KB) - Full-text XML
-
Supplement
(2787 KB) - BibTeX
- EndNote


Atmospheric particulate matter (PM) negatively affects human health (e.g., Kampa and Castanas, 2008), impedes visibility (e.g., Appel et al., 1985), and impacts the global energy balance through direct radiative forcing or by acting as cloud condensation nuclei (e.g., Kanakidou et al., 2005). Organic aerosol (OA) particles comprise 20–90 % of submicron PM (PM1) and may consist of thousands of distinct organic compounds (Goldstein and Galbally, 2007; Ng et al., 2010; Zhang et al., 2007). Given the multitude of organic compounds in the atmosphere and the numerous chemical reactions they can experience during atmospheric processing (e.g., Goldstein and Galbally, 2007; Kroll et al., 2009), laboratory studies are needed to fully understand the chemical composition and oxidative evolution of source-specific primary OA (POA, aerosol emitted directly into the atmosphere) and secondary OA (SOA, formed from gas-phase material that partition into the particle phase following photooxidation).
Biomass burning organic aerosol (BBOA) may contribute up to 90 % of global combustion OA and 75 % of combustion POA (Bond et al., 2004; May et al., 2013). Previous BBOA molecular speciation studies over the past several decades have focused on the chemical composition of primary emissions (e.g., Fine et al., 2002; Oros and Simoneit, 1999; Rogge et al., 1998; Simoneit et al., 2000). Recently, improved understanding of SOA formation in BBOA plumes has motivated the use of oxidation chambers in laboratory BBOA experiments (e.g., Cubison et al., 2011; Grieshop et al., 2009; Ortega et al., 2013). Some of these BBOA photooxidation studies have demonstrated that OA production can exceed decay under certain conditions due to oxidation and phase partitioning of gas-phase semivolatile and intermediately volatile compounds (SVOCs and IVOCs, respectively; Grieshop et al., 2009). Other field measurements show minimal OA enhancement with aging of primary biomass plumes (Capes et al., 2008). During the third Fire Lab at Missoula Experiment (FLAME-3) campaign (2013), OA enhancements following photooxidation varied widely depending on the biomass source; although BBOA from some sources doubled in mass after photochemical aging, other types of BBOA were depleted (Ortega et al., 2013). The variation in OA enhancement observed by Ortega et al. (2013) in the FLAME-3 study suggests that the amount of SOA from biomass emissions depends on the fuel type, illustrating the need for source-specific oxidation studies to investigate reactions and products leading to SOA formation.
Previous BBOA oxidation studies (e.g., Grieshop et al., 2009; Ortega et al., 2013) have utilized a high-resolution time-of-flight aerosol mass spectrometer (HR-ToF-AMS, Aerodyne, Inc., Billerica, MA). The aerosol mass spectrometer (AMS) obtains chemical information on bulk aerosol including total mass concentrations and high-resolution ion signals, allowing for determination of bulk aerosol chemical composition (Canagaratna et al., 2007; DeCarlo et al., 2006). Hydrogen-to-carbon ratios (H : C) and oxygen-to-carbon ratios (O : C) can also be calculated using high-resolution AMS data, which are incorporated into estimations of an average carbon oxidation state ( × H : C − O : C; Kroll et al., 2011). Although the AMS provides real-time measurements of ensemble-averaged properties for submicron nonrefractory aerosol, it does not achieve molecular speciation and thus cannot be used to identify individual compounds present in OA. Typical AMS BBOA studies use m∕z 60 (C2H4O and m∕z 44 (CO signals to quantify primary and aged emissions, respectively (e.g., Cubison et al., 2011; Ng et al., 2010, 2011a, b). Levoglucosan, a cellulose decomposition product often used as a molecular tracer for freshly emitted BBOA (e.g., Simoneit et al., 1999, 2004), is frequently considered to be a primary contributor to m∕z 60 in AMS laboratory and field studies (e.g., Lee et al., 2010; Ng et al., 2011b). However, although levoglucosan has traditionally been understood to remain stable over relevant timescales (Fraser and Lakshmanan, 2000; Locker, 1988; Simoneit et al., 1999), multiple laboratory studies suggest that hydroxyl radical (OH)-driven levoglucosan decay occurs on a timescale similar to transport and deposition timescales (Hennigan et al., 2010; Hoffmann et al., 2010; Lai et al., 2014). Additionally, recent measurements demonstrate that m∕z 60 abundances may remain above background levels with sufficient atmospheric processing, suggesting that not all m∕z 60 originates from BBOA (Cubison et al., 2011; Ortega et al., 2013). These two considerations highlight the need for in situ molecular speciation measurements to complement bulk aerosol chemical data supplied by the AMS.
The thermal desorption aerosol gas chromatograph (TAG) pairs automated aerosol collection and thermal desorption with gas chromatography and mass spectrometry (GC-MS), providing molecular-level speciation with in situ analysis and hourly time resolution (Williams et al., 2006). The TAG has been used in field studies to identify molecular tracers in ambient air and to link different chemical profiles to unique sources (e.g., Kreisberg et al., 2009; Lambe et al., 2009; Williams et al., 2007, 2010, 2014; Worton et al., 2011; Zhang et al., 2014, 2016). The TAG is capable of providing speciated compound measurements for approximately 20 % of total organic aerosol mass on average, depending on the type of aerosol collected (Williams et al., 2006). Although the TAG reliably detects a high fraction (up to 100 %) of hydrocarbon OA mass, which is typical of POA, the analyzed fraction of oxidized OA mass is often much lower (Williams et al., 2010, 2016; Zhang et al., 2014). This discrepancy is attributed to low mass throughput of oxidized species through the 30 m nonpolar gas chromatography (GC) capillary column (Williams et al., 2006, 2016) and presents a disadvantage for TAG analysis of oxidized components typical of SOA.
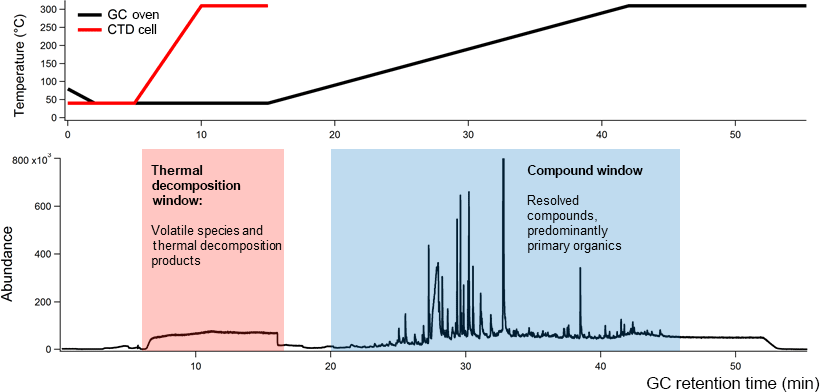
Figure 1An example TAG chromatogram with GC oven and TAG collection and thermal desorption (CTD) cell temperature ramp programs.
Recent advances have expanded the TAG's analytical capability. Traditional GC utilizes a solvent delay to prevent detector damage from large solvent or water signals. In the TAG, much of the solvent can be purged prior to sample injection, and the solvent delay is no longer applied. The lack of a solvent delay allows volatile components and aerosol thermal decomposition products to reach the detector during thermal sample desorption (5–15 min of TAG GC program) from the TAG collection cell to the GC column. The mass-spectral signal within this period, called the thermal decomposition window, typically features an air signal (e.g., m∕z 32 for O, m∕z 40 for Ar+, m∕z 44 for CO, but can also contain ions characteristic of decomposing nitrates (m∕z 30 for NO+, m∕z 46 for NO, sulfates (m∕z 48 for SO+, m∕z 64 for SO, and organics (m∕z 44 for CO. These ion signals were shown to correlate with corresponding AMS ions for ambient data collected during the Saint Louis Air Quality Regional Study in 2013 (Williams et al., 2016). However, the TAG thermal decomposition window has only recently been used to analyze ambient data, and more laboratory studies are needed to explore the thermal decomposition products of OA from unique sources.
In this work, we present results from laboratory studies aimed at characterizing BBOA chemical composition using both the TAG compound window (minutes 20–55 of the chromatogram; Fig. 1) and the TAG thermal decomposition window (minutes 6–16 of the chromatogram; Fig. 1) in parallel with an AMS. A custom-built emissions and combustion chamber was used to generate BBOA, and a potential aerosol mass (PAM) oxidative flow reactor (OFR), which can mimic up to 16 days of atmospheric aging with residence times on the order of 100 s (Kang et al., 2007; Lambe et al., 2011), was used to oxidize laboratory-generated BBOA plumes at different levels of accelerated photochemistry. Our experiments addressed three primary objectives. First, the chemical composition of laboratory-generated BBOA was explored to identify molecular tracers from the leaf and heartwood of the American white oak (Quercus alba). Recently developed chromatogram-binning Positive Matrix Factorization (PMF) techniques (Zhang et al., 2014, 2016) were applied to the TAG compound window to determine the prevalence of different compound classes and functionalities unique to BBOA from each fuel type. Trends in compounds and compound classes with oxidation were evaluated using both individual compound integrations and chromatogram binning PMF results. Second, the TAG thermal decomposition window was used to investigate how the chemical composition of thermally decomposing BBOA varies with PAM aging. Concurrent AMS measurements were taken to complement TAG decomposition window data, providing estimations and high-resolution ion signals for bulk BBOA samples. These AMS parameters were used to inform interpretation of TAG decomposition ion signals, particularly the variation of TAG decomposition m∕z 44 and m∕z 60 signals with extent of oxidation in the PAM chamber. Chromatogram-binning PMF techniques (Zhang et al., 2014, 2016) were also applied to the decomposition window to investigate the presence and covariance of key ion signals. Finally, trends in TAG and AMS m∕z 60 signals with PAM aging were explored to evaluate the utility of m∕z 60 as a tracer for freshly emitted BBOA. We present evidence that, depending on biomass source and atmospheric conditions, a significant fraction of AMS m∕z 60, which is typically used to track primary BBOA in the atmosphere, may be attributed to aged OA mass.
2.1 Emissions and combustion chamber
A flow diagram of the experimental setup and a diagram of the custom-built emissions and combustion chamber are given in the Supplement (Sect. S1, Figs. S1 and S2, respectively). A complete description of the emissions and combustion chamber is available elsewhere (Mellott, 2012). The chamber is a rectangular 1.48 m3 chamber made of 0.635 cm thick tempered glass panels secured by aluminum framing (80/20, Inc., Columbia City, IN). The chamber is divided into two compartments, separated by an aluminum baffle with a central hole 3 cm in diameter. In the first compartment, biomass samples are resistively heated in proportional–integral–derivative (PID)-controlled stainless-steel cups installed along the chamber floor. The second compartment serves as a mixing chamber from which primary gases and particles are sampled at 10 L min−1. Air was treated with a HEPA filter (Pall Corporation, Port Washington, NY) and a hydrocarbon trap (Model BHT-4, Agilent Technologies, Santa Clara, CA), then supplied to the heating compartment of the chamber to promote mixing. Both compartments are extensively vented between experiments to clear the chamber of gases and particles.
2.2 Devolatilization and combustion experiments
White oak (Q. alba) heartwood and leaves were chosen for these studies because of their abundance in the oak–hickory forests of Missouri and the southeastern United States. Although comparing different tree species is also of interest, two different plant fractions of the same species are studied here to investigate different types of wildfire or controlled combustion processes, some of which may only impact leaf litter fall and others would have wood available as a fuel. The white oak biomass samples used in this study were collected at the Tyson Research Center in Eureka, MO, located approximately 32 km outside of St. Louis, MO. An oak trunk segment was taken from the site, and heartwood samples were collected by drilling into the center of the trunk segment. Oak leaves were clipped from a single branch that was taken directly from a live tree. The leaf samples were air-dried for at least 1 week and milled into fine pieces using a tobacco grinder prior to running the experiment. All biomass was stored at room temperature (20–25 ∘C), and moisture content was not controlled for either fuel type.
Samples of oak heartwood or leaf were preweighed (0.2–0.5 g), placed in the emissions chamber cup, and spread evenly across the bottom rim. The cup was heated for 3.5 min, with typical ignition temperatures of 300 ∘C. In this work, we use the term “devolatilization” to describe the noncombustive release of emissions from biomass fuels at elevated temperatures. During the heat pulse, the biomass sample was first devolatilized, with smoldering embers observed in the final minute of the heat ramp. No flaming combustion occurred during any of the emissions experiments.
To ensure the TAG and AMS collected particles within a similar size range, primary emissions were passed through a PM1 cyclone (Thermo Fisher Scientific, Waltham, MA) operated at 16.7 L min−1 to remove particles too large to be sampled by the AMS (DeCarlo et al., 2006). Because dilution drives partitioning of SVOCs and IVOCs from the particle phase into the gas phase in BBOA plumes (Grieshop et al., 2009; Ortega et al., 2013), dilution was minimized in the system during devolatilization and combustion experiments. Dilution air, purified using separate zero air generators (Model 737, Aadco Instruments, Cleves, OH), was supplied before the PM1 cyclone (6.7 L min−1) and after the PAM chamber (4 L min−1) to provide sufficient flow to the cyclone and to all instruments (Fig. S1), giving a net dilution ratio of approximately 5 for all experiments.
2.3 PAM reactor operation
Particulate and gas-phase emissions were treated together in the PAM flow reactor. A detailed description of the PAM reactor is given elsewhere (Kang et al., 2007; Lambe et. al. 2011). The reactor consists of a 13 L cylindrical aluminum chamber coated internally with Iridite 14-2 (MacDermid, Inc., Waterbury, CT), a chromate conversion film designed to decrease charge buildup and thereby inhibit losses of charged particles to the walls of the reactor. Within the PAM chamber, low-pressure mercury lamps emit light at two wavelengths (185 and 254 nm) in the UV range, and different OH concentrations are produced by adjusting the intensity of the UV irradiation (Kang et al., 2007). Ozone (O3) is produced externally by irradiating 0.4 L min−1 of pure O2 with mercury lamps (λ = 185 nm; BHK, Inc., Ontario, CA) to produce 4 ppm externally added O3. Water vapor is introduced into the PAM reactor with 4.6 L min−1 of humidified N2. A total flow rate of 10 L min−1 was maintained throughout the experiments, giving an average residence time of 78 s within the reactor. To achieve consistent OH formation, the relative humidity (RH) inside of the reactor was kept at 30.0 % ± 3.7 % (1 standard deviation), measured with a relative humidity and temperature probe with manufacturer-specified accuracy of 1.5 % (Vaisala, Inc., Woburn, MA). The reactor water concentration, and therefore RH, was altered by controlling N2 flow through a Nafion membrane humidifier (Perma Pure LLC, Lakewood, NJ). The role of water concentration in OH formation is discussed in detail in the Supplement (Sect. S2.1, Fig. S3).
OH exposures (OHexp) within the PAM reactor were calculated using the offline sulfur dioxide (SO2) calibration method described in previous work (Kang et al., 2007). During reactor calibration, SO2 concentrations (Airgas, Inc., Radnor, PA) were measured with an SO2 monitor (Model 43i-TLE analyzer, Thermo Fisher Scientific, Waltham, MA) at varied UV lamp intensities; similarly, O3 was measured downstream of the PAM reactor by UV photometry (Model 49i, Thermo Fisher Scientific, Waltham, MA). Equivalent atmospheric aging times from the SO2 calibrations were calculated assuming an average atmospheric OH concentration of 1.5 × 10⁶ molec cm−3 (Mao et al., 2009) and are provided as the upper limit on the equivalent aging time ranges obtained for the system (Table 1). PAM reactor calibration details and results are provided in the Supplement (Sect. S2). For both heartwood and leaf fuels, experiments were performed at two level of photochemical aging in addition to a baseline without OH exposure. Henceforward, the different photochemical aging conditions will be denoted by the corresponding equivalent aging time ranges (Table 1).
Previous PAM reactor studies have demonstrated that high concentrations of volatile organic compounds (VOCs) can suppress OH reactivity (Li et al., 2015; Peng et al., 2015). This suppression occurs because VOCs drive rapid conversion of OH to HO2, and recycling of HO2 back to OH can be slow without addition of sufficient O3 (Peng et al., 2015, 2016). External OH reactivity (OHRext, s−1) is defined as the sum of the products of concentrations of externally reacting species (Ci for a compound i) and corresponding OH reaction rate constants (ki; Peng et al., 2016):
This metric is used to describe the potential for interfering gases to react with OH and suppress heterogeneous oxidation. The external production of O3 featured in our system is expected to reduce OH suppression by introducing additional O3 to promote recycling of HO2 back to OH (Peng et al., 2015).
Table 1Qualitative levels of PAM-reactor oxidation with corresponding OH exposure (OHexp) estimations and equivalent aging times. The OHexp estimations were made using methods described in the Supplement (Methods: PAM Calibrations and Equivalent Aging Estimations).
Due to a lack of gas-phase measurements, OHRext values were not calculated during TAG and AMS collections. However, supplementary experiments were conducted to approximate OHRext by repeating the fuel burning procedure and measuring resulting CO emissions with a CO monitor (Peak Laboratories, Mountain View, CA). During these experiments, emissions were sampled alternately through the PAM chamber, set to approximately 3 days of equivalent aging according to the most recent offline SO2 calibration, and a bypass line. We observed little difference in CO OHRext between PAM-aged emissions (maximum OHRext = 0.558 s−1) and bypassed emissions (maximum OHRext = 0.516 s−1). Additionally, we estimated total OHRext by scaling trace gas emission factors (EFs) from previous laboratory-generated oak biomass combustion VOC measurements (Burling et al., 2010) to our measured CO concentrations. Using this method, we approximate a total OHRext of 2.2 s−1. This OHRext value is assumed for subsequent OHexp and equivalent aging estimations. A detailed description of the experimental methods, as well as a discussion of the limitations of this OHRext estimation approach, is available in the Supplement (Sect. S2.2). Averaged CO concentrations for aged and unaged leaf BBOA are provided in Fig. S4.
Based on an RH of 30 %, a typical internally produced output O3 range of 0.3–1.7 ppm (measured during reactor calibrations), and an OHRext of 2.2 s−1, we estimated OHexp ranges for each PAM UV light setting using the Oxidation Flow Reactor Exposure Estimator version 2.3 developed by Peng et al. (2016), available for download at http://sites.google.com/site/pamwiki/hardware/estimation-equations (Peng et al., 2015, 2016). Results obtained using this spreadsheet are given in the Supplement (Table S1). The “condition type”, which indicates whether VOC suppression is significant under the input conditions, was found to be “safer”, indicating that chemical interferences from VOCs are minimal based on input measurements and assumptions.
Flow field simulations and chemical tracer tests have demonstrated that the PAM reactor used in this study is approximately well mixed if sufficient time (at least 15 min) is given prior to sample collection to establish a well-mixed and near steady-state concentration throughout the combustion chamber and PAM chamber (Mitroo, 2017; Mitroo et al., 2017). The TAG therefore consistently collected 30 min after the biomass heat pulse to minimize particle concentration gradients within the reactor.
Photobleaching of BBOA, particularly at 254 nm, has been reported in previous literature (e.g., Sumlin et al., 2017; Wong et al., 2017; Zhao et al., 2015) and therefore should be considered when estimating oxidative aging. With the spreadsheet provided by Peng et al. (2016), we estimate 254 and 185 nm exposure ratios (ratio of photon flux, photons cm−2, to OHexp; Peng et al., 2016) to be 1.2 × 10⁵ and 8.1 × 102 cm s−1, respectively, at a measured internally generated O3 concentration of 1.7 ppm (at the highest PAM UV lamp intensity), a water mixing ratio of 1 % (RH = 30 %), and assuming a maximum OHRext value of 1 (Peng et al., 2016). Using Figs. 1 and 2 of Peng et al. (2016) to interpret these values, we find that at both 185 and 254 nm, photolysis rates are likely less than 10 % for species of interest.
2.4 Instrumentation and data analysis
The TAG and the AMS were used to collect complementary chemical composition data. A scanning mobility particle sizer (SMPS; Model 3081 DMA, Model 3022A CPC, TSI, Inc., Shoreview, MN) was used to measure aerosol size distributions and volume concentrations.
The devolatilization and combustion experiments were performed in two distinct experimentation periods. In the first period, the procedure was done at each level of PAM oxidation using 0.2 g biomass. Triplicate experiments were done with the TAG and the SMPS during this period to ensure repeatability of the devolatilization and combustion cycle. In the second experimentation period, experiments were performed once more at each level of oxidation to obtain simultaneous TAG, SMPS, and AMS measurements. For these experiments, the devolatilization and combustion procedure was done with more biomass fuel (0.5 g) so the AMS could obtain sufficient signal.
2.4.1 Thermal desorption aerosol gas chromatograph (TAG)
A full description of the TAG system is provided in previous literature (Williams et al., 2006). Particles are collected via humidification and inertial impaction at a typical flow rate of 9.3 L min−1, with a particle cutoff (dp50) of approximately 70 nm (Williams et al., 2006). Following sample collection, the collection and thermal desorption (CTD) cell is heated to 310 ∘C at a typical rate of 50 ∘C min−1 to thermally desorb the collected OA. The desorbed sample is flushed through a heated transfer line over helium and transported to a gas chromatography column for separation and mass spectral detection. An Agilent 6890 GC (Agilent Technologies, Santa Clara, CA) with a 30 m long 0.25 mm inner diameter RTX5-MS nonpolar fused silica capillary column (Restek Corporation, Bellefonte, PA) was used to achieve chromatographic separation. A 70 eV electron ionization quadrupole mass spectrometer (5973 MSD, Agilent Technologies, Santa Clara, CA), operated to scan between 29–450 m∕z, provided mass spectral detection. TAG performance was evaluated regularly (once every 1–3 days) using a 5 ng C12–C40 even alkane standard mixture (Sigma Aldrich, St. Louis, MO) manually injected onto the CTD cell and thermally desorbed onto the GC column via a helium carrier stream (Kreisberg et al., 2009).
The TAG system developed by Isaacman et al. (2014) features an online derivatization technique designed to improve analysis of oxidized species, including methoxyphenols, levoglucosan, and other compounds unique to BBOA (Isaacman et al., 2014). Although this technique presents multiple analytical advantages, it was developed for a metal filter collection cell and is not suitable for the impactor-style CTD cell used in these experiments. We chose to use the impactor-style CTD cell to allow analysis of the thermal decomposition window, since other collection cells purge this material when transferring to a secondary trap. Additionally, we were interested to identify new molecular marker compounds that could be associated with these source types. We therefore performed all experiments without sample derivatization prior to chromatographic analysis.
TAG data were collected during the first experimentation period using 0.2 g biomass in the heat pulse. For all the oak leaf and heartwood experiments, particles were collected on the TAG for 4 min, 30 min after the heat pulse was performed in the emissions chamber. The TAG collected two additional samples over the course of 3 h to ensure that both the emissions chamber and the PAM reactor were clean prior to the subsequent devolatilization cycle.
In this work, the TAG compound and thermal decomposition time windows were analyzed as complementary sets of chemical data (Fig. 1). As defined for this study, the thermal decomposition window occurs between minutes 6 and 16 of GC analysis, which coincides with the thermal desorption of the sample from the CTD cell. The compound window consists of material eluting from minutes 20–55 of analysis following condensation of desorbed sample at the column head. This window contains information on OA components that have been successfully desorbed, transferred, and separated.
Prior to each experiment, a system blank chromatogram was obtained by sampling from the empty emissions chamber through the PAM reactor, with the PAM UV lamps set to the voltage corresponding to the subsequent equivalent aging time to be tested. A system blank was subtracted from each chromatogram prior to data processing to correct for both TAG system artifacts (e.g., air signal and column bleed) and sampling system (PAM reactor and emissions and combustion chamber) artifacts. Additionally, to isolate changes in aerosol chemical properties from changes in aerosol mass with photochemical aging, each blank-subtracted chromatogram was normalized to volume concentration by dividing the abundance at each scan by the maximum volume concentration (nm3 cm−3) obtained by the SMPS for each devolatilization cycle (Table S2 and Fig. S5 in the Supplement). This blank subtraction and normalization process was done for all total ion count (TIC) chromatograms and single-ion chromatograms (SICs) presented in this work.
2.4.2 TAG positive matrix factorization
Positive matrix factorization (PMF) was performed on TAG chromatograms to identify source-specific major compounds and compound classes present in the heartwood and leaf BBOA. TAG chromatograms were binned by retention time according to the method outlined in previous work (Zhang et al., 2014, 2016). Prior to chromatogram binning, each chromatogram was blank subtracted to minimize the contribution of background noise in PMF calculations. An instrument error of 10 %, chosen based on a typical average TAG instrument error of 10 % (Williams et al., 2006), was assumed during PMF calculations.
The GC-resolved mass spectral PMF method for binned TAG data was developed to separate compounds in TAG chromatograms into chemically similar factors, improving analysis efficiency (Zhang et al., 2014). With this method, mass spectral data are supplied to the PMF model, and solutions are obtained using the PMF2 algorithm (Paatero, 1997). Each resulting factor consists of a mass spectrum corresponding to a compound or class of compounds present in the TAG chromatograms (Zhang et al., 2014). This PMF method was performed on the compound and decomposition analytical windows separately for data obtained from both BBOA types. PMF output and solutions were evaluated using custom-built pre- and postprocessing analysis software in conjunction with the PMF Evaluation Tool (version 3.00A; Ulbrich et al., 2009) in Igor Pro version 6.38Beta01 (WaveMetrics, Inc.). Mass spectral identification of different factors was aided by the NIST MS Search Program version 2.0, available for download at http://chemdata.nist.gov/mass-spc/ms-search/.
The number of appropriate PMF factors was determined for each solution based on two considerations. First, in a typical PMF analysis, the optimal number of factors in a solution is selected based on the objective function Q, which is the sum of weighed squared residuals (Paatero, 1997). The Q∕Qexp value, or the ratio of the actual objective function to the expected objective function assuming normally distributed residuals, should ideally approach 1; too few factors may result in a large Q∕Qexp, indicating that errors have been underestimated in PMF calculations (Ulbrich et al., 2009). Additionally, if too many factors are specified, the solution may feature split factors, where information from a compound or compound class is distributed across multiple factors. In this work, the number of factors presented for each analysis was selected to minimize split factors while maximizing identifiable factors. Because of the TAG data's high chromatographic resolution, low rotational ambiguity was assumed, and all calculations were performed with fpeak = 0. This assumption is supported by previous work, where TAG data were not sensitive to fpeak or starting point (seeds) during PMF analysis (Williams et al., 2010).
2.4.3 AMS
The AMS data presented in this work were obtained using 0.5 g of biomass in the heat pulse instead of 0.2 g to ensure the AMS received sufficient signal. The AMS was operated in V mode throughout all experiments (DeCarlo et al., 2006). AMS data were processed in Igor Pro version 6.38Beta01 using the SQUIRREL version 1.57 toolkit for unit mass resolution analysis and the PIKA version 1.16 toolkit for high-resolution analysis. Both AMS data analysis tools are available for download at http://cires1.colorado.edu/jimenez-group/ToFAMSResources/ToFSoftware/index.html.
3.1 AMS measurements
Average AMS mass spectra and van Krevelen plots are provided in the Supplement (Figs. S6 and S8, respectively). In addition, AMS-measured concentrations of key species, including total organics, sulfate, and potassium (K+), are provided in Fig. S7 and Table S3.
According to AMS mass spectra, the BBOA measured in these experiments is chemically consistent with BBOA from similar oak fuel sources, though with key differences related to combustion conditions (Cubison et al., 2011; Ortega et al., 2013; Reece et al., 2017; Weimer et al., 2008). Detailed analysis and contextualization of the AMS chemical composition data is given in the Supplement (Sect. S4).
3.2 Individual compound analysis
The mass spectral dot product method proposed by Stein and Scott was used to determine chemical similarity between each chromatogram and to evaluate inter-test variability. For each blank-subtracted TAG chromatogram, a summed mass spectrum was obtained by summing all ions (m∕z 33–m∕z 450) across all scans (retention times) in the chromatogram and converting the resulting mass spectral vector into a unit vector. To assess the similarity of two mass spectra, the dot product of the mass spectral unit vectors was calculated; a dot product of 1 signifies a perfect mass spectral match, and a dot product of 0 indicates a complete mismatch (Stein and Scott, 1994). Within a fuel type and an oxidation condition, the dot product was assessed for two TAG chromatograms at a time for a total of 3 dot product values. These values are given in Table S4.
For both leaf and heartwood BBOA, key molecules identified within the compound window of the TAG chromatograms are given in the Supplement (Table S5). Corresponding molecular structures for the compounds used in individual compound analysis are also provided (Fig. S9). Identification certainty (“Certainty of ID”) was classified for each compound according to the following criteria: (A) the compound was positively identified based on external standard injections; (B) the compound was identified based on a high match quality (MQ > 75 %) using available mass spectral libraries; (C) the compound was identified based on a low-to-moderate match quality (MQ <75 %) using available mass spectral libraries; and (D) no adequate mass spectral library match was available for the compound, so the compound structure was inferred by retention time and manually evaluating possible fragmentation patterns. Identification method (D) was particularly relevant for long-chain aliphatic compounds, including alkenes and even-carbon aldehydes. For these compounds, the parent ion was first determined, then major ions were identified (e.g., in tetracosanal, m∕z 334 corresponds to C24H following loss of H2O). The feasibility of the identified structure was confirmed based on predicted vapor pressures and retention times from even alkane standards.
Subcooled liquid vapor pressures at 25 ∘C were predicted for each compound using the Advanced Chemistry Development (ACD/Labs) Software V11.02 (© 1994–2017 ACD/Labs), available for use on the SciFinder website (ACD/Labs, 2017).
3.2.1 Trends in individual compounds with photochemical aging
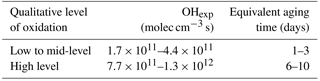
Leaf and heartwood BBOA chromatograms at three levels of photochemical aging are overlaid for comparison in Fig. 2. Raw peak integration values with standard deviations are provided for each compound at each level of equivalent aging (Table S6). Each chromatogram constitutes an average of the triplicate blank-subtracted measurements, with each chromatogram normalized to the maximum total volume concentration measured during the experiment. For these plots, the averaged, normalized chromatograms at each level of aging were further normalized to the point of highest abundance in the unaged (“0 days”) average chromatogram. In the leaf BBOA chromatograms (Fig. 2a), many of the low-volatility species eluting after minute 35 of the GC analysis are long-chain alkanes, alcohols, aldehydes, and terpenoids, compounds commonly found in the leaf's waxy exterior coating (Gülz and Boor, 1992). Based on even-numbered alkane standard injections, compounds eluting after minute 35 exhibit approximate saturation vapor pressures not exceeding that of docosane (approximately 3.64 × 10⁻³ Pa at 25 ∘C), which corresponds approximately to log10(C∗) = 2.76 (Table S5 in the Supplement; ACD/Labs, 2017).
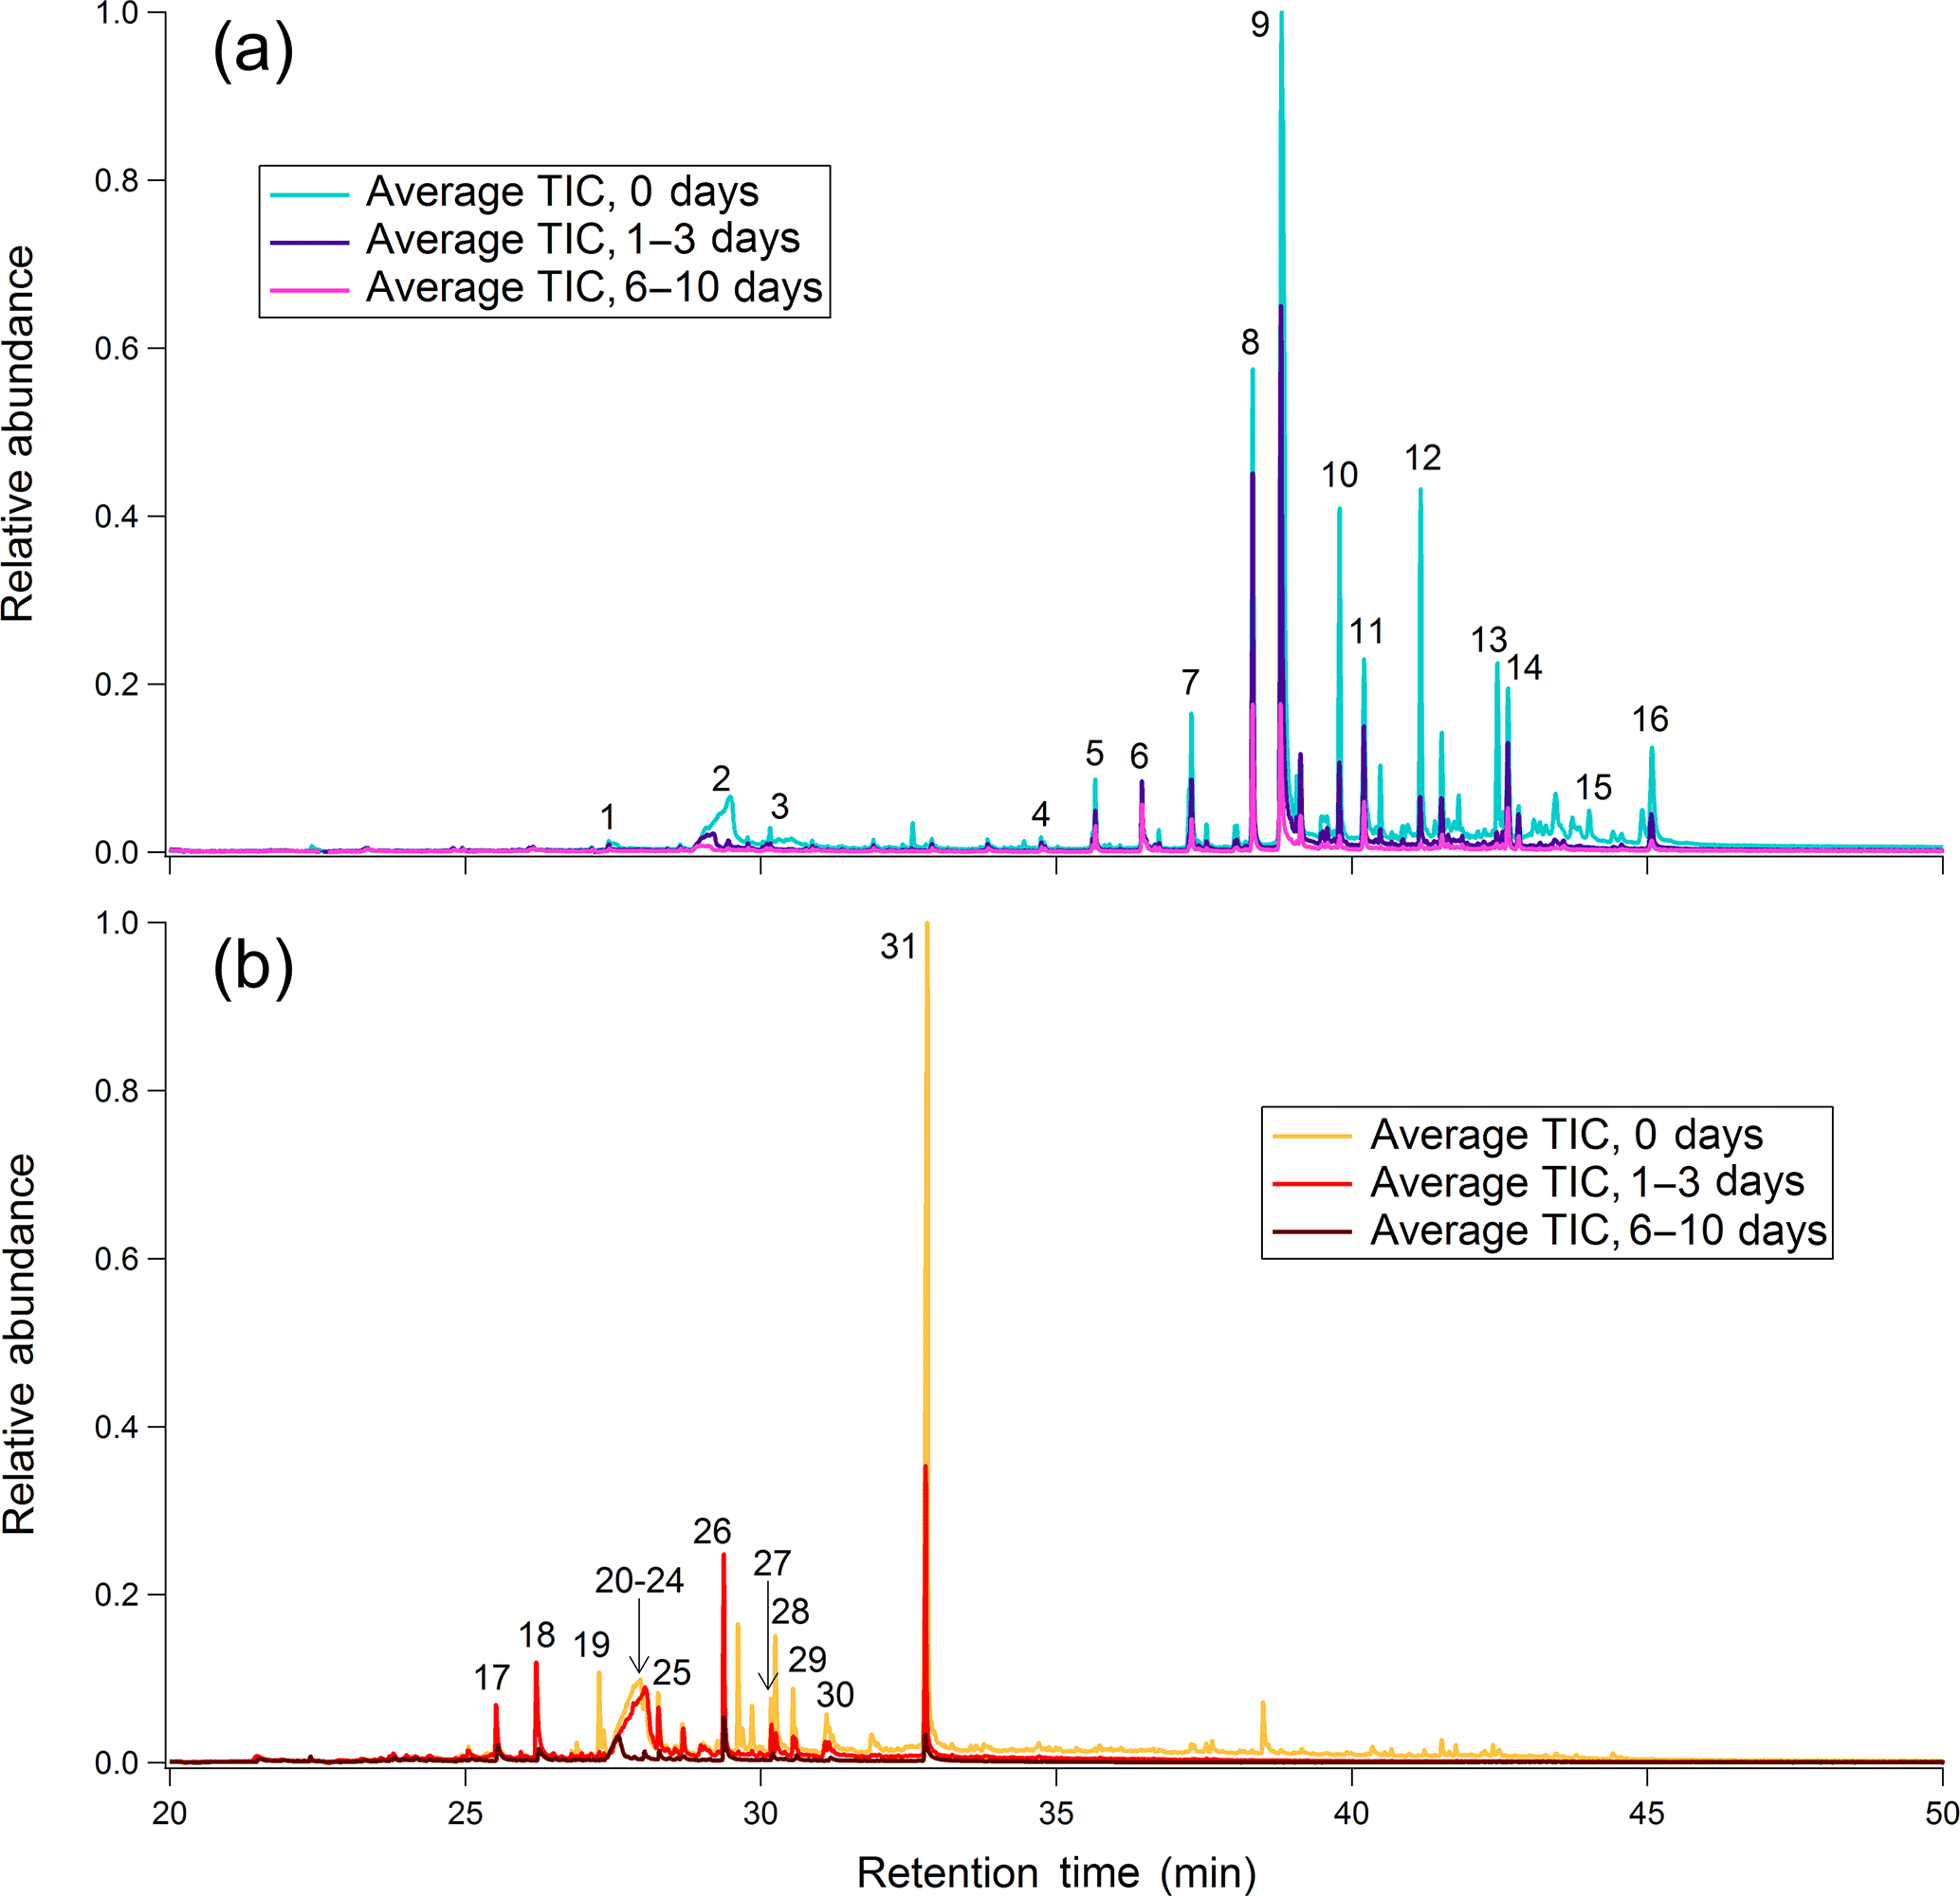
Figure 2Chromatograms for (a) leaf BBOA and (b) heartwood BBOA at different levels of oxidation. Corresponding names and structures for numbered compounds are given in Table S5 and Fig. S9. For each plot, all traces are normalized to the point of highest abundance within the average unaged chromatogram.
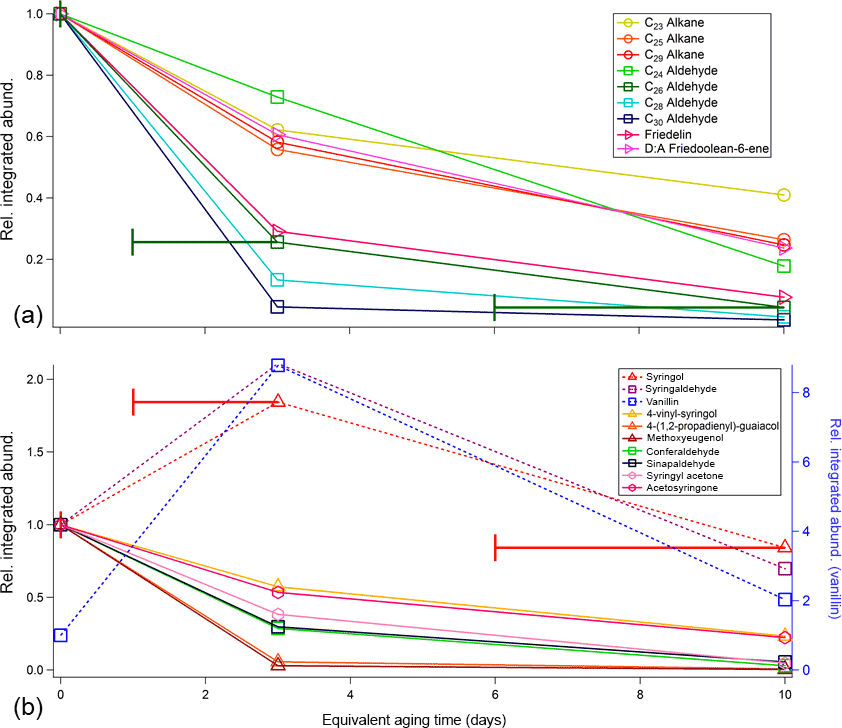
Figure 3Relative changes in integrated abundance as a function of equivalent aging time (per SO2 calibrations) for primary compounds identified in (a) oak leaf BBOA chromatograms and (b) oak heartwood BBOA chromatograms. For each compound, the integrated abundances were first normalized to appropriate volume concentrations, then subsequently normalized to corresponding abundances at no oxidation (“0 days”). Compounds that decrease in abundance are indicated with solid lines, and compounds that deviate from this trend are given with dotted lines. Raw compound abundances are provided in the Supplement (Table S6). The x-axis error bars denote equivalent aging time ranges calculated for this study and are applicable to all TAG data presented here, though they are only included on one compound per panel to preserve figure readability.
To illustrate the relative rates of decay that each compound experiences in the PAM reactor, Fig. 3a provides integrated abundances for nine compounds of interest. The integrated abundances were first normalized to appropriate volume concentrations, then to the corresponding abundances at no oxidation. Nearly all compounds identified after 35 min decrease in relative abundance with photochemical aging. Notably, we have identified an even-carbon aliphatic aldehyde series based on and (where M is the parent mass) peaks present in the mass spectra of each of the compounds (Watson and Sparkman, 2007). As the carbon number (nC) increases, the aldehyde abundance decreases more readily with oxidation. To our knowledge, rate constants for the reaction of long-chain ( condensed-phase aliphatic aldehydes with OH have not been reported. However, previous studies on short-chain (nC ≤ C14) condensed-phase aliphatic aldehydes demonstrate that OH reaction rate constants increase with increasing carbon chain length (D'Anna et al., 2001; Niki et al., 1978). Although aliphatic aldehydes, particularly C26 and C28 aldehydes, have been characterized as components of oak leaf waxes (Gülz and Boor, 1992), these aldehydes have not been reported as components of oak leaf BBOA and may therefore serve as novel tracer species in future field experiments. To confirm the presence of aldehydes in the leaf waxes, solvent extractions were performed on oak leaves and were manually injected onto the TAG CTD cell (Sect. S5.1 and Fig. S10 in the Supplement). Analysis of these extractions confirm that the aldehydes are present in the leaf wax prior to devolatilization and combustion.
Literature information available for hydrocarbon particle- and gas-phase OH kinetics indicates that the trends observed in leaf BBOA alkane and aldehyde abundances are consistent with heterogeneous OH oxidation. For example, Smith et al. (2009) report approximately 70 % decay of squalane (a C30 branched alkane) particles when exposed to an OHexp of 1.1 × 10¹² molec cm−3 s−1 (approximately 10 days of equivalent aging; Smith et al., 2009), a figure approximately consistent with the observed C29 alkane decay of 75 % at 6–10 days of equivalent aging. Additionally, based on parameters provided by Kwok and Atkinson (1995), gas-phase OH reaction rate constants at 298 K are estimated to be 2.5 × 10⁻¹¹, 2.7 × 10⁻¹¹, and 3.1 × 10⁻¹¹ cm3 molec−1 s−1 for C23, C25, and C29 alkanes, respectively (Kwok and Atkinson, 1995). Taking these rate constants into account, if purely gas-phase chemistry is assumed, all three alkanes would react nearly 100 % before 1–3 days of equivalent aging. A similar analysis on relevant aldehydes gave estimated gas-rate constants of 2.5 × 10⁻¹¹, 2.8 × 10⁻¹¹, and 3.0 × 10⁻¹¹ cm3 molec−1 s−1 for C24, C26, and C28 aldehydes, respectively (Kwok and Atkinson, 1995), which in all cases would lead to complete depletion by 1–3 days of equivalent aging if gas-phase chemistry is assumed.
Compounds characteristic of heartwood primary BBOA are typically more volatile than those found in the leaf primary BBOA, eluting between minutes 28 and 35 of the GC analysis (Fig. 2b). Based on even alkane standard injections, compounds eluting within this time window exhibit approximate vapor pressures within 6.03 × 10⁻¹–3.64 × 10⁻³ Pa at 25 ∘C ( 4.85–2.76; Table S5 in the Supplement; ACD/Labs, 2017). The compound with the highest abundance in unoxidized wood BBOA chromatograms is sinapaldehyde (4-hydroxy-3,5-dimethoxycinnamaldehyde), a phenolic compound derived from lignin. Of the compounds examined, sinapaldehyde decays most rapidly in the PAM reactor, with the normalized average integrated peak area decreasing by approximately 70 % from 0 to 1–3 days of equivalent aging (Fig. 3b). Based on a rapid gas-phase OH reaction rate constant of 2.7 × 10⁻¹² cm3 molec−1 s−1, the observed sinapaldehyde decay is likely occurring in the particle phase. Other compounds, including methyl-β-D-glucopyranoside, galactoheptulose, and acetylgalactosamine, also exhibit decreases in abundance. Relative rates of decay for these and other wood BBOA tracers are given in Fig. 3b.
Syringol (2,6-dimethoxy-phenol), syringaldehyde (4-hydroxy-3,5-dimethoxy-benzaldehyde), and vanillin (4-hydroxy-3-methoxy-benzaldehyde) increase in abundance from 0 to 1–3 days of equivalent aging and are depleted with 6–10 days of equivalent aging. Since the average volume concentration for runs at 1–3 days of aging were larger than those at 0 days of aging by a factor of approximately 1.3 (Table S2 in the Supplement), the factor of ∼ 2 increase in syringol and syringaldehyde integrated abundances could occur due to partitioning from the gas phase into the particle phase. To estimate phase partitioning for these compounds, particle-phase fractions for syringol, syringaldehyde, and vanillin (ξi) were calculated based on AMS total organic concentrations (COA, µg m−3; Table S3 in the Supplement) and effective saturation concentrations (, µg m−3) using a basic partitioning equation (Donahue et al., 2006; Table S5 in the Supplement):
Resulting particle-phase fractions are tabulated in the Supplement (Table S7). Based on these approximations, syringol, syringaldehyde, and vanillin are expected to partition primarily to the gas phase. For these compounds, the increase in abundances at low to mid-levels of oxidation could therefore result from increased SOA formation driving these compounds into the particle phase. This observation is consistent with previous measurements where maximum SOA concentrations were observed at similar levels of OHexp for aerosol generated from oxidation of a single precursor (Lambe et al., 2012; Ortega et al., 2016).

Figure 4Average binned chromatograms and mass spectra for factors 1–9 + 12 (F1–9 + 12) in PMF 15-factor solution on TAG oak leaf BBOA compound window data. Relevant plots obtained in PMF calculations are provided in the Supplement (Figs. S12a and S13a). These chromatograms were obtained from PMF calculations by averaging binned data corresponding to triplicate chromatograms at each level of oxidation. The triplicate-averaged binned chromatograms at each equivalent aging time are displayed in one trace; different aging times are demarcated with vertical lines across the x axis. Average binned chromatograms and mass spectra for factors 10–15 (F10–15) in PMF 15-factor solution on TAG oak leaf BBOA compound window data.
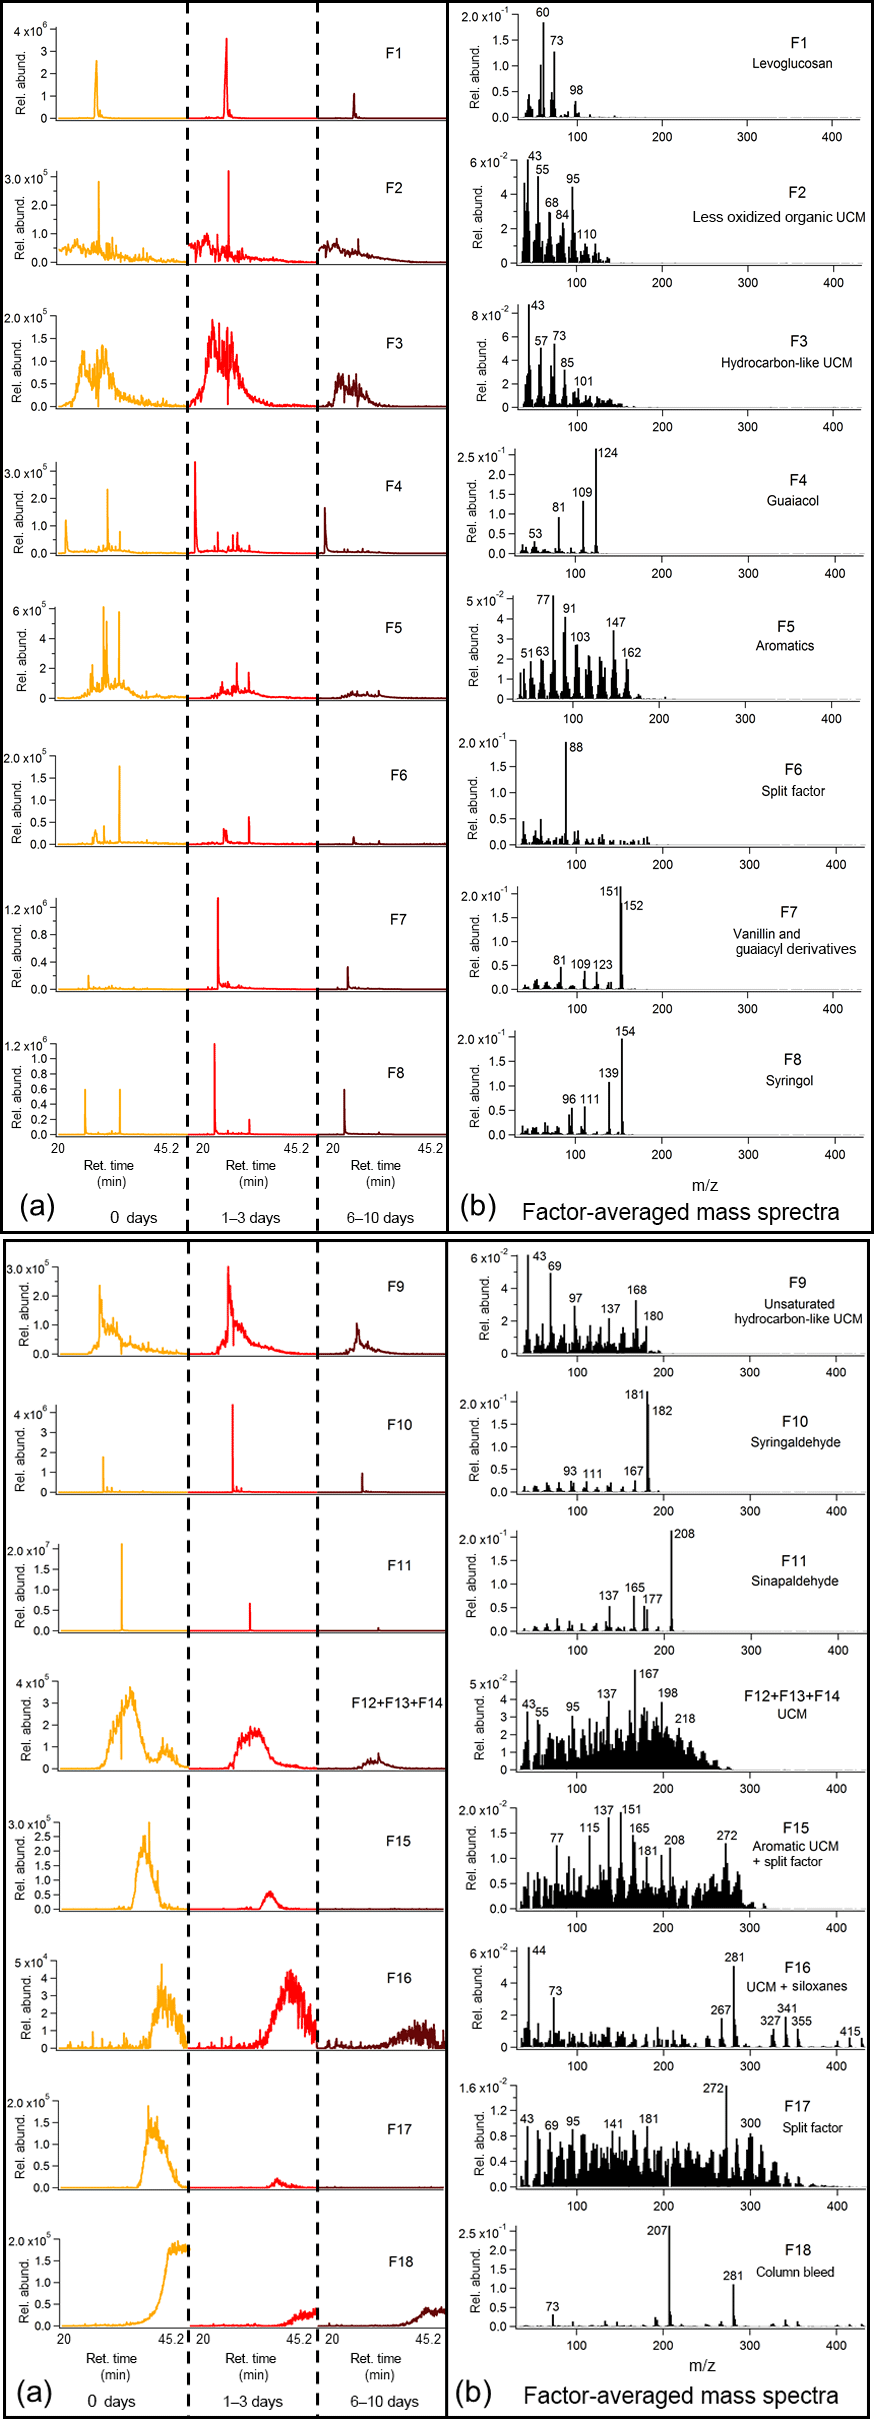
Figure 5Average binned chromatograms and mass spectra for factors 1–8 (F1–8) in PMF 18-factor solution on TAG oak heartwood BBOA compound window data. Relevant plots obtained in PMF calculations are provided in the Supplement (Figs. S12b and S13b). These chromatograms were obtained from PMF calculations by averaging binned data corresponding to triplicate chromatograms at each level of oxidation. The triplicate-averaged binned chromatograms at each equivalent aging time are displayed in one trace; different aging times are demarcated with vertical lines across the x axis. Average binned chromatograms and mass spectra for factors 9–18 (F9–18) in PMF 18-factor solution on TAG oak heartwood BBOA compound window data. Relevant plots obtained in PMF calculations are provided in the Supplement (Figs. S12b and S13b).
Although phase partitioning may contribute to the trend in vanillin with photochemical aging, the nearly eight-fold increase in vanillin integrated abundance from 0 to 1–3 days of aging could suggest an alternative formation mechanism driven by reactions occurring in the PAM reactor. One potential mechanism for the formation of aldehydes from larger lignin decomposition products involves the cleavage of the Cα–Cβ unsaturated bond on the benzyl substituent following formation and fragmentation of a peroxide radical intermediate (Wong et al., 2010; Fig. S11 in the Supplement). The presence of OH in the PAM reactor may drive a similar process, leading to increases in vanillin abundance at moderate OHexp.
3.2.2 Compound window PMF analysis
GC-MS PMF results are provided for both leaf and wood BBOA chromatograms using data collected within the TAG compound window (Figs. 4 and 5). Q∕Qexp and residual plots are provided in the Supplement (Figs. S12 and S13, respectively). The chromatograms are displayed as averages of binned data from triplicate measurements at each level of oxidation and are displayed in one trace; different equivalent aging times are demarcated with vertical lines along the x axis. Corresponding mass spectra are identified and displayed with key ions labeled. High factor solutions (≥ 15) were used for compound window data to best deconvolve the large and complex mixture of compounds. However, in some cases, factor splitting resulted in the distribution of ions between two or more factors, made evident by similarities in retention times. Wherever possible, split factors were recombined by summing the binned chromatograms and the mass spectra and are labeled accordingly (e.g., “F10 + F12” indicates that factor 10 and factor 12 have been recombined). In general, for the compound window, factor solutions were chosen to maximize the number of identifiable factors while minimizing the number of split factors.
A 15-factor solution was chosen to deconvolve leaf BBOA compound window chromatograms (Fig. 4; additional information provided in Figs. S12a and S13a). This solution provided enough factors to resolve the lowest-abundance components (e.g., F1), and increasing the number of factors past 15 led to greater factor splitting without providing additional insight into the chromatograms. Among the factors identifiable with this solution include quinic acid (Factor 2, F2), sugars and anhydrosugars (e.g., mannose; F3), alcohols and alkenes (F6), aldehydes (F10), terpenoids (e.g., friedelin; F11), and column bleed (F13 + F14). Other factors (F1, F5 + F7, F9 + F12, F15) correspond to different classes of unresolved complex mixtures (UCMs) and have been tentatively identified by considering the closest matches in the NIST mass spectral database. Factor 4 (F4) is identified as a split factor, exhibiting mass spectral characteristics of multiple factors, including acids (m∕z 129) and anhydrosugars (m∕z 116). Factors 13 and 14 demonstrate contributions from both terpenoid-like UCMs and column bleed and are therefore combined. The presence of alkylbenzenes (F8), dominated by m∕z 91 (C7H and m∕z 92 (C7H, is noteworthy, as alkylbenzenes are typical of anthropogenic materials (e.g., detergent precursors produced from petroleum; Forman et al., 2014) and have not been reported as components of biomass. Since the leaves were not cleaned after they were collected, the alkylbenzenes could come from deposition of fuel combustion aerosol onto the leaves' surface prior to biomass sample collection. The presence of alkylbenzenes on the surface of the leaf was confirmed with TAG analysis of solvent-extracted leaf surface components (Fig. S14), supporting the interpretation of deposition of anthropogenic compounds on the leaf's exterior.
An 18-factor solution was applied to deconvolve compounds in the wood BBOA chromatograms (Fig. 5; additional information provided in Figs. S12b and S13b). Notable factors correspond to levoglucosan (F1), guaiacol (F4), vanillin and guaiacyl compounds (F7), syringol (F8), syringaldehyde (F10), sinapaldehyde (F11), and column bleed (F18). Based on retention time and mass spectral characteristics (e.g., m∕z 77), factor 5 (F5) corresponds to aromatic species and is not matched to a single compound. Factor 6 (F6) is featured in multiple aromatic compounds, but is also present in levoglucosan in very low abundances. Several types of UCM (F2, F3, F9, F12 + F13 + F14, F15, F16) were deconvolved and tentatively identified using the top matches from the mass spectral database. Factor 16 (F16) is predominated by siloxanes (e.g., m∕z 73, m∕z 281, m∕z 341), though some UCM has been split from other factors. Finally, factor 17 (F17) exhibits characteristics of multiple classes of compounds and is therefore identified as a split factor.
Nearly all factors obtained in the leaf BBOA compound window analysis decrease with photochemical aging, including quinic acid (F2), sugars and anhydrosugars (F3), alkanes and long-chain aliphatics (F6, F10, F15), alkylbenzenes (F8), terpenoid components (F11), and various classes of UCM (F1, F4, F5 + F7, F9 + F12). This trend agrees well with the individual compound analysis and further indicates that primary components undergo increased fragmentation at higher OHexp. In the heartwood BBOA, some primary components decrease steadily with photochemical aging, including sinapaldehyde (F11), aromatics (F5), and various classes of UCM (F12 + F13 + F14, F15, F17). Other factors, including guaiacol (F4), vanillin (F7), syringol (F8), and syringaldehyde, exhibit a strong increase in abundance at 1–3 days of aging followed by a decrease at 6–10 days of aging, possibly due to changes in partitioning as described previously. Levoglucosan (F1) also appears to increase slightly in abundance at 1–3 days of equivalent aging, though this is likely due to differences in aerosol mass produced between experiments. Results from both types of BBOA show changes in column bleed (F13 + 14 and F18 for leaf and wood BBOA, respectively) from unaged chromatograms to 6–10 days of aging. Although the column bleed decreases with photochemical aging in both cases, this trend is due to differences in blank subtractions from run to run and is not related to changes in photochemical aging.
3.3 TAG thermal decomposition window
The TAG thermal decomposition window has been used in previous work to assess contributions of inorganic (nitrates, sulfates, etc.) and organic species present in atmospheric aerosol (Williams et al., 2016). In this work, we provide evidence that the TAG thermal decomposition window can be used to evaluate the relative level of oxidation of bulk OA samples using the m∕z 44 (CO ion. In addition, we demonstrate that other fragments within the decomposition window may give insight into the chemical composition of aged, thermally labile BBOA.
Replicable, quantitative TAG data were not obtained during experiments that used 0.5 g biomass, potentially due to a minor system leak. However, the TAG chromatograms that were obtained using 0.5 g biomass were chemically similar to the triplicate TAG chromatograms obtained using 0.2 g biomass, and we therefore compare all AMS data with TAG chromatograms collected using 0.2 g biomass in subsequent analysis. Chemical similarity between chromatograms was confirmed using the dot product mass spectral comparison method outlined by Stein and Scott (1994). The dot product was determined for two chromatograms, one obtained with 0.5 g biomass and one obtained with 0.2 g biomass, at each level of oxidation. The resulting dot products for both leaf and wood oak are all above 0.75 and are provided in the Supplement (Fig. S15; Table S8).
3.3.1 m∕z 44 as a tracer for aged OA
Figure 6a and b show m∕z 44 TAG decomposition SICs for leaf and wood BBOA, respectively. Raw SICs, along with blanks, are provided in Fig. S16. At each oxidation condition, SICs from the triplicate chromatograms were blank subtracted, normalized to maximum volume concentrations, and averaged to obtain the displayed trace. Within each plot, the chromatograms have been further normalized to the point of highest abundance within the unaged (“0 days”) m∕z 44 signal. The m∕z 44 signals were also summed across the entire decomposition window following blank subtraction, normalization to appropriate volume concentrations, and triplicate averaging, and are provided as functions of equivalent aging time (± 1 standard deviation) in Fig. 6c. The upward trend in the m∕z 44 signal between minutes 6 and 10 of GC analysis coincides with the CTD temperature ramp from 45 to 310 ∘C and is thus consistent with gradual increase in OA thermal decomposition as the temperature rises. The subsequent decrease in m∕z 44 signal from minutes 10 to 16 reflects the thermal decomposition of remaining material as the CTD cell is held at 310 ∘C. For both types of BBOA, the decomposition m∕z 44 integrated signal increases overall from 0 to 6–10 days of equivalent aging, indicating an increase in OA material that can thermally decompose with increased PAM oxidation. This trend is consistent with relative increased decomposition of highly oxidized aerosol formed within the PAM reactor, as demonstrated in previous ambient aerosol observations (Williams et al., 2016). In the leaf BBOA chromatograms, the increase in integrated m∕z 44 signal is most pronounced from 0 to 1–3 days of equivalent aging, while the heartwood BBOA data exhibit the most dramatic increase from 1–3 to 6–10 days. The variation in the shape of the decomposition m∕z signal between the two types of biomass likely reflects differences in thermal lability between different types of OA.
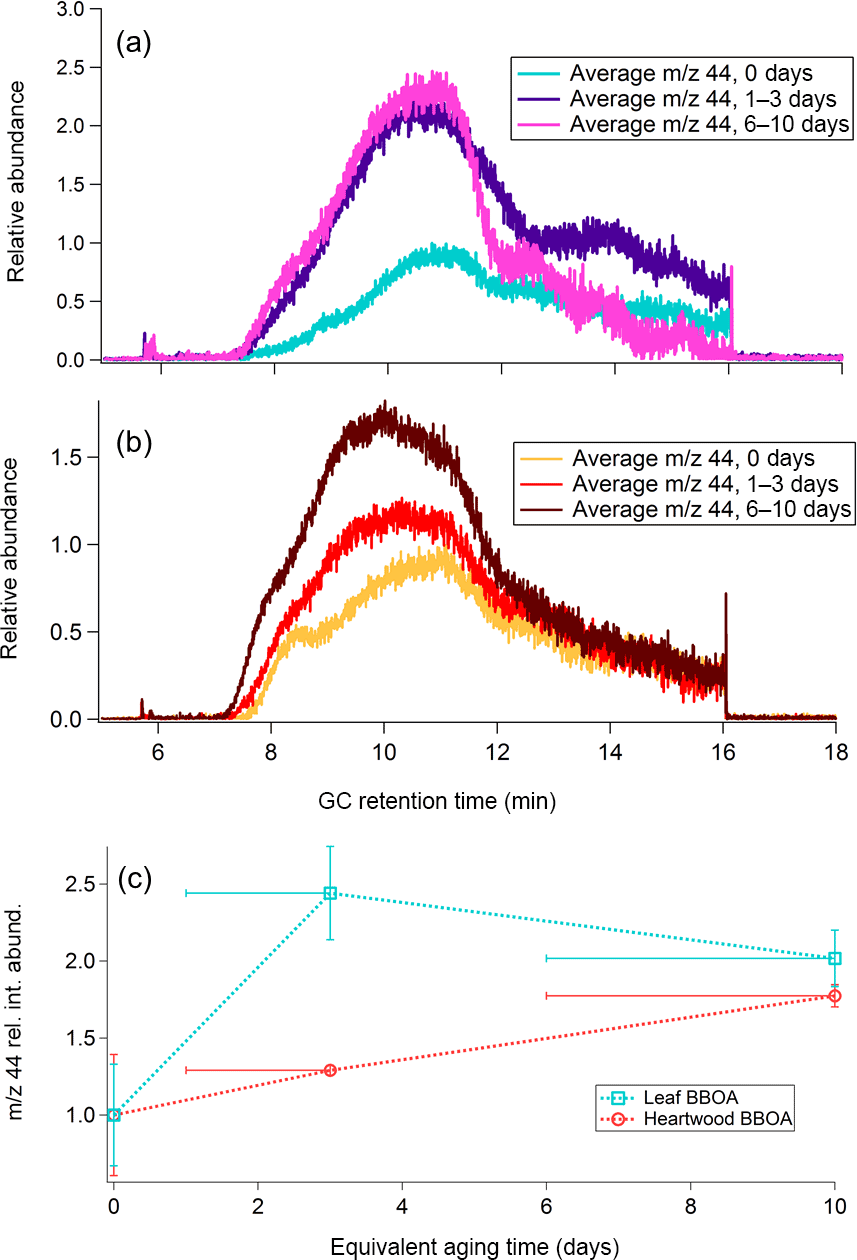
Figure 6(a) Average m∕z 44 single-ion chromatograms (SICs) across distinct levels of photochemical aging for leaf BBOA, normalized to the point of highest abundance within the averaged unaged chromatogram (“0 days”). (b) Average m∕z 44 SICs across different levels of photochemical aging for heartwood BBOA, normalized to the point of highest abundance within the averaged unaged chromatogram. (c) Summed relative m∕z 44 decomposition signal as a function of photochemical aging for both fuels (± 1 standard deviation). These values were obtained by averaging triplicate m∕z 44 decomposition signals at each level of photochemical aging. For each fuel type, all summed abundances are normalized to the unaged m∕z 44 signal (“0 days”). The x-axis error bars denote the equivalent aging time range and are applicable for all measurements obtained in this study.
AMS values calculated for both types of biomass range from −1.5 to −0.2 (Fig. 7). In both types of BBOA, an increase in relative integrated TAG decomposition m∕z 44 signal coincides with an increase in from 0 to 6–10 days of photochemical aging. A linear correlation between decomposition m∕z 44 and AMS for wood BBOA (r2 = 1) indicates that under these experimental conditions, the TAG thermal decomposition window has the potential to provide quantitative measurements of bulk OA oxidation levels. By contrast, leaf BBOA decomposition m∕z 44 and AMS correlate poorly (r2 = 0.8 for a linear fit). The nonlinear trend in TAG decomposition m∕z 44 for leaf BBOA may indicate a shift in the dominant oxidation mechanisms between moderate and high levels of OH within the PAM chamber; at the highest OHexp, primary gas and/or particle-phase components may undergo increased fragmentation, leading to a net decrease in production of the aged OA that thermally decomposes during TAG analysis, along with an increase in highly volatile fragmentation products that are not captured by the TAG. However, the mechanisms behind this trend remain unclear and merit further investigation.
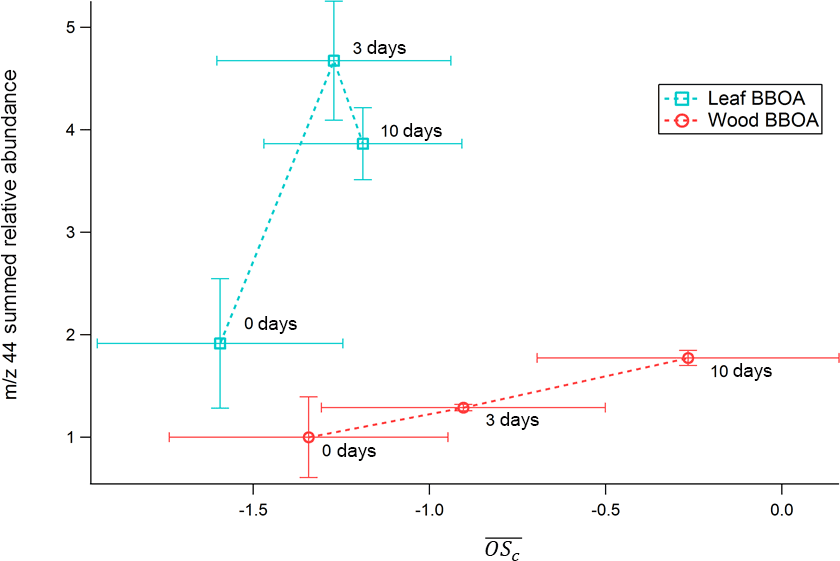
Figure 7TAG decomposition m∕z 44 integrated relative abundances for PAM-aged leaf and heartwood BBOA as functions of AMS . Here, all TAG data have been normalized to the unaged (“0 days”) wood BBOA integrated m∕z 44 abundance.
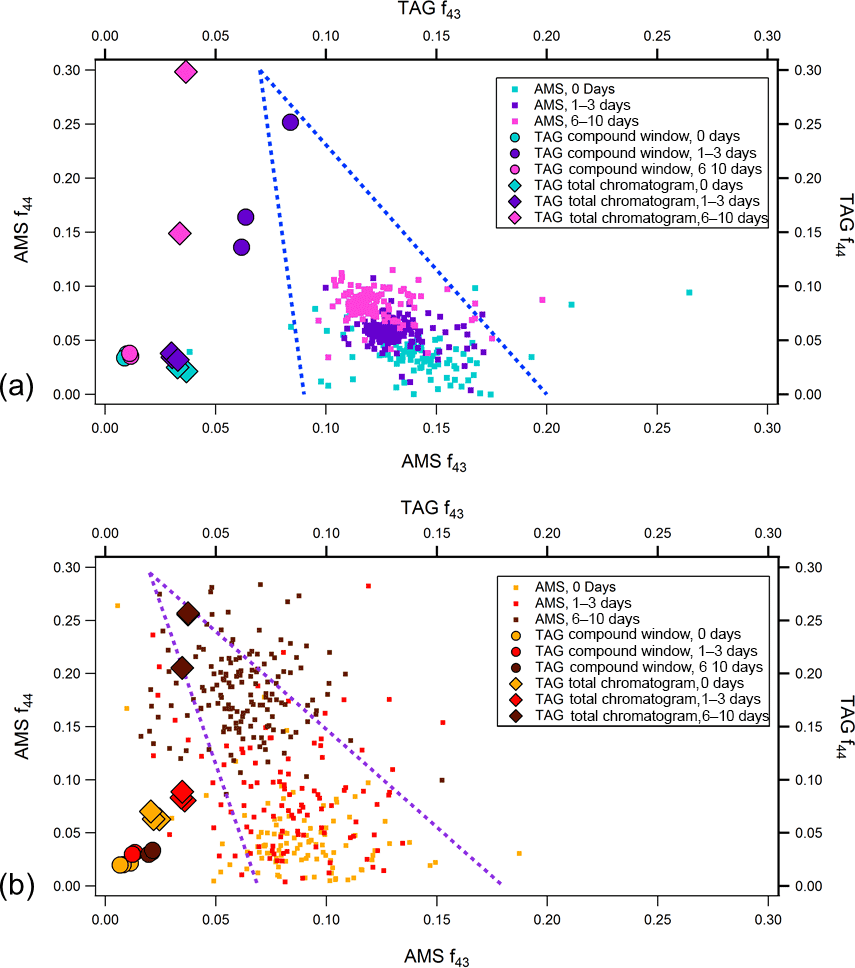
Figure 8AMS and TAG f44 vs. f43 at different levels of photochemical aging for (a) leaf and (b) heartwood BBOA. TAG f44 and f43 values were obtained using Eq. (3). To minimize noise, AMS data are plotted only for points where sufficient total organic concentrations were achieved, around the peak of the concentration profile. The triangles formed by the blue dotted lines provide visual guidelines for the evolution of OA chemical composition across f44 vs. f43space; the apex of the triangle indicates the direction of OA photochemical oxidation (Ng et al., 2010).
For each fuel type, AMS f44 vs. f43 data have been plotted at each level of equivalent aging (Fig. 8). To further explore the TAG's analytical capability in relation to AMS bulk chemical data, TAG-integrated ion fractions (fion) are also provided in these plots. These fractions are defined as the blank-subtracted integrated ion signal divided by the blank-subtracted integrated TIC signal. For example, for a chromatogram i, the TAG f44 signal is defined as follows:
Here, (A44)i is the integrated m∕z 44 signal across all (i.e., TAG total chromatogram) or part (i.e., TAG compound window) of i, (A44)blank is the integrated m∕z 44 signal across a blank chromatogram, (ATIC)i is the integrated TIC across all or part of i, and (ATIC)blank is the integrated TIC across the same blank. For heartwood BBOA, although AMS f44 increases and f43 decreases with photochemical aging, both TAG f44 and f43 increase with increasing oxidation, particularly when the decomposition window is included in analysis (i.e., TAG total chromatogram). However, TAG fractions from the leaf BBOA data are more varied and do not exhibit a clear trend. In general, the TAG fractions tend to fall to the left of AMS f44 vs. f43 data points, indicating that the TAG excels at throughput of less-oxygenated hydrocarbon OA and struggles with throughput of oxidized species in the compound window. However, the increase in TAG f44 with inclusion of decomposition window material shows a clearer oxidation trend that is in greater agreement with the AMS oxidation trend. This interpretation relies on the assumption that the m∕z 43 and m∕z 44 signals obtained in the TAG decomposition window from sample thermal desorption at 310 ∘C are similar in nature to those obtained when aerosol is flash vaporized at 600 ∘C in the AMS.
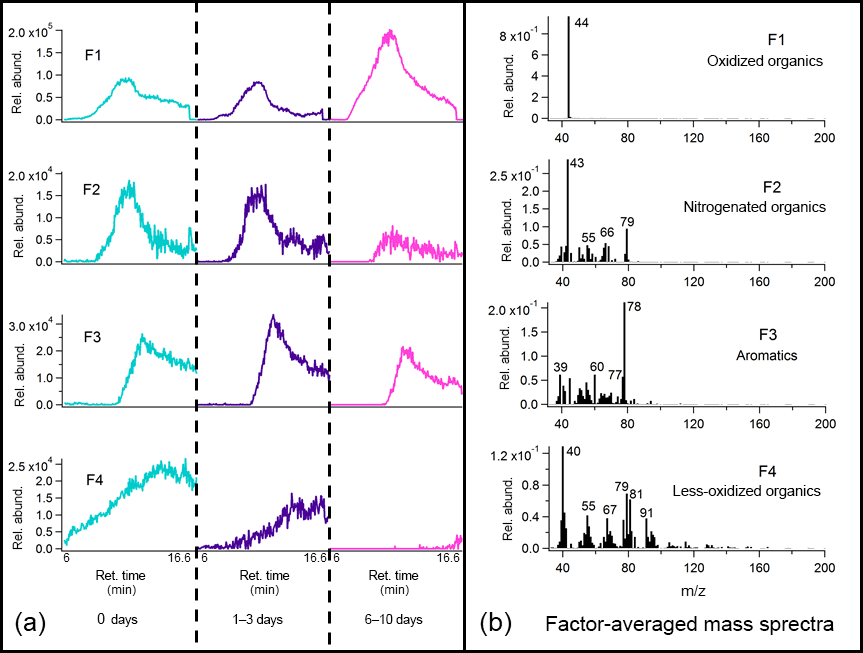
Figure 9Average binned chromatograms and mass spectra for factors 1–4 (F1–4) in PMF 4-factor solution on TAG oak leaf BBOA decomposition window data. Relevant plots obtained in PMF calculations are provided in the Supplement (Figs. S12c and S13c). These chromatograms were obtained from PMF calculations by averaging binned data corresponding to triplicate chromatograms at each level of oxidation. The triplicate-averaged binned chromatograms at each equivalent aging time are displayed in one trace; different aging times are demarcated with vertical lines across the x axis.
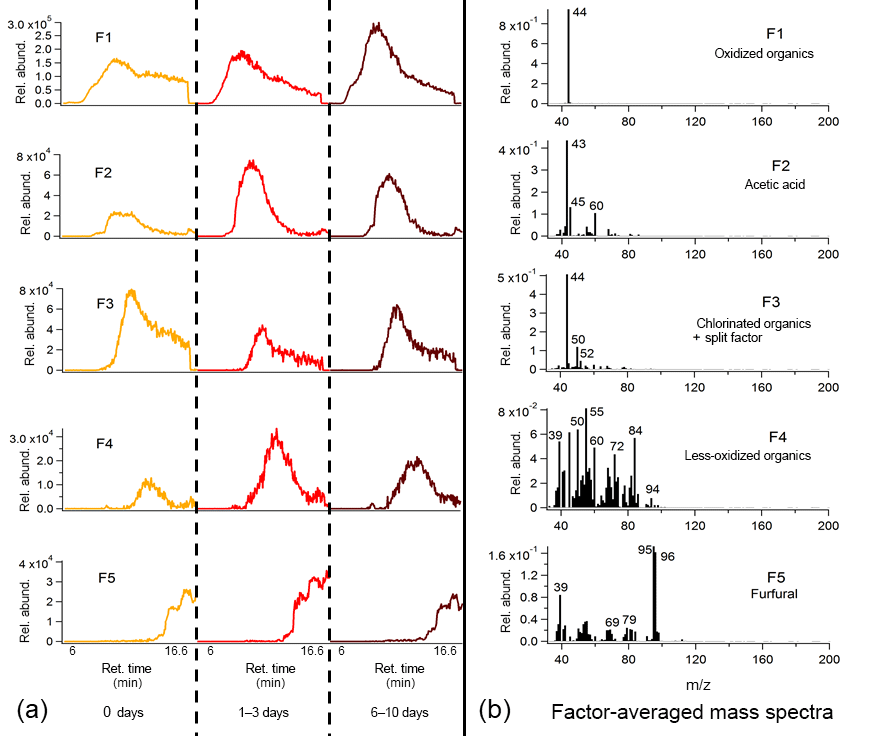
Figure 10Average binned chromatograms and mass spectra for factors 1–5 (F1–5) in PMF 5-factor solution on TAG heartwood BBOA decomposition window data. Relevant plots obtained in PMF calculations are provided in the Supplement (Figs. S12d and S13d). These chromatograms were obtained from PMF calculations by averaging binned data corresponding to triplicate chromatograms at each level of oxidation. The triplicate-averaged binned chromatograms at each equivalent aging time are displayed in one trace; different aging times are demarcated with vertical lines along the x axis.
3.3.2 Decomposition window PMF analysis
To aid identification of key thermal decomposition products, the binning deconvolution PMF method was applied to the TAG chromatogram decomposition window (Figs. 9 and 10). Details of the PMF analyses are provided in the Supplement (Figs. S12 and S13). Tentative identification of different factors was facilitated by the NIST mass spectral database, though standard injections are needed to adequately quantify the decomposition window signal and identify the factors with complete confidence. As with the compound window PMF results, chromatograms are displayed as triplicate averages of binned data at each level of oxidation and are demarcated by vertical lines across the x axis. Key ions are labeled, and tentative identifications are provided above each mass spectrum.
For the leaf BBOA chromatograms, a 4-factor solution gave several distinguishable factors (Fig. 9; additional information provided in Figs. S12c and S13c), including the m∕z 44 (CO signal previously identified as originating from thermal decomposition oxidized organics (F1). Factor 3 (F3), dominated by m∕z 78 (possibly C6H with smaller contributions from m∕z 39 (C3H and m∕z 51 (C4H, could indicate decomposing aromatics. Factor 2 (F2) matches with nitrogenated compounds in the mass spectral database, and the co-elution of m∕z 43 (possibly C2H3O+) and m∕z 79 (possibly C4H3N2O+) could signal the presence of nitrogenated oxidized organics. Finally, factor 4 (F4) is dominated by multiple fragments characteristic of less-oxidized or unsaturated organic material, including m∕z 55 (C4H, m∕z 67 (C5H, and m∕z 91 (C7H; this factor may also include contributions from air (m∕z 40; Ar+) and m∕z 79 split from factor 3.
A 5-factor solution was chosen for the wood BBOA chromatograms (Fig. 10; additional information provided in Figs. S12d and S13d). Factor 1 (F1) is dominated by m∕z 44, attributed to decomposing oxidized organics (CO. Acetic acid was identifiable in factor 2 (F2) based on relative abundances of m∕z 43 (C2H3O+), m∕z 45 (CHO, and m∕z 60 (C2H4O, suggesting that organic acids comprise part of the thermal decomposition OA. Factor 3 (F3) features m∕z 50 and m∕z 52 (possibly CHCl+ and CHCl+, respectively) in the 3 : 1 isotopic ratio characteristic of chlorine, indicating that the wood BBOA may contain chlorinated organics. Based on comparison of retention times, the large contribution of m∕z 44 to factor 3 may be due to splitting from factor 1. Factor 4 is dominated by ions characteristic of less-oxygenated or unsaturated organic material, including m∕z 55 (C4H, m∕z 72 (C4H8O+), and m∕z 84 (C5H8O+). Lastly, factor 5 (F5) has been identified as furfural using the mass spectral database, which has been previously reported in gas-phase mass spectral measurements of biomass burning emissions (Stockwell et al., 2015).
Because of the lack of chemical resolution in the thermal decomposition window, trends in factors with oxidative aging remain challenging to interpret. Notably, the factors featuring m∕z 44 (F1 in both Figs. 9 and 10) increase with photochemical aging, consistent with an increase in oxidized OA. In the heartwood BBOA, F2 (acetic acid) and F4 (less-oxidized organics) appear to peak at 1–3 days of equivalent aging, though the mechanisms driving this change remain uncertain. The PMF results obtained in this study will be used to develop appropriate standards for the TAG thermal decomposition window, allowing for more quantitative analysis and easier identification of mass spectral fragments in future field and laboratory work.
3.4 m∕z 60 as a tracer for both primary and aged BBOA
The signal eluting between minutes 27 and 32 of GC analysis results from the co-elution of multiple compounds, including levoglucosan. Many of these co-eluting species exhibit m∕z 60 (dominated by the C2H4O+ ion) as a major fragment in their mass spectra. These compounds are poorly resolved because the nonpolar GC column is not designed to resolve such polar compounds. SICs at different levels of oxidation reveal that each compound within this retention time window reacts at a unique rate, allowing for the identification of different co-eluting species.
Heartwood and leaf BBOA m∕z 60 SICs at each level of oxidation are given in Fig. 11, and relative abundances of key m∕z 60 fragmenting species in the TAG compound window are provided in the Supplement (Tables S9 and S10). In the unaged heartwood BBOA chromatograms, approximately 82 % of the TAG compound window m∕z 60 signal has been identified as levoglucosan (retention time determined from authentic standards; Fig. S17 in the Supplement), though other sugars and anhydrosugars exist in lower abundances. Although some levoglucosan (between 8.35 and 3.20 %) is present in the leaf BBOA chromatograms, up to 60 % of the TAG compound m∕z 60 signal comes from quinic acid, which elutes beginning at minute 29 (retention time determined from authentic standards; Fig. S17). The differences in sources of m∕z 60 between types of biomass illustrate that the m∕z 60 signal in any given BBOA sample may be highly complex and dependent on the type of biomass burned. Additionally, the presence of m∕z 60 is likely dependent on the combustion characteristics, as combustion processes can influence the emission and phase of different compounds.
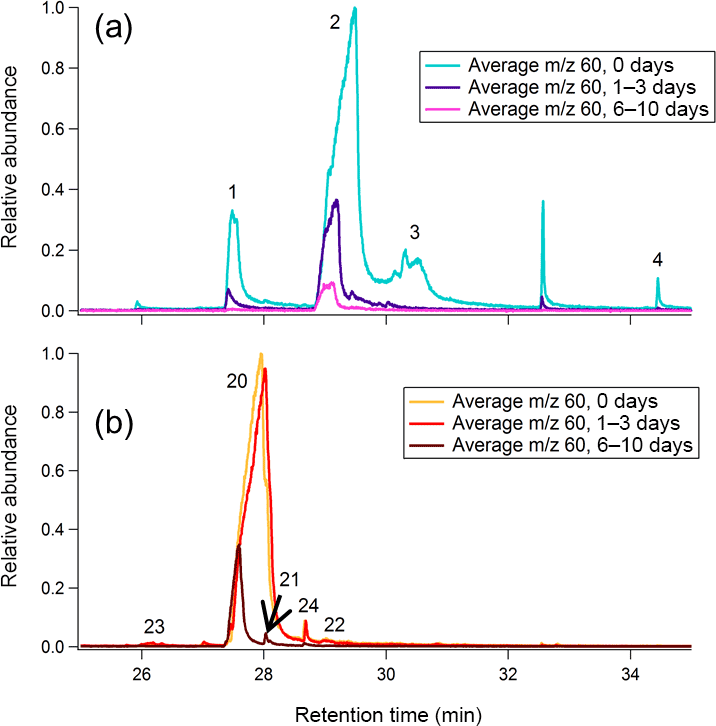
Figure 11Average m∕z 60 single-ion chromatograms (SICs) across the compound window for (a) leaf BBOA and (b) heartwood BBOA. For each plot, all traces are normalized to the point of highest abundance within the average unaged chromatogram. Individual compounds are labeled according to identifications provided in the Supplement (Fig. S9; Table S5).
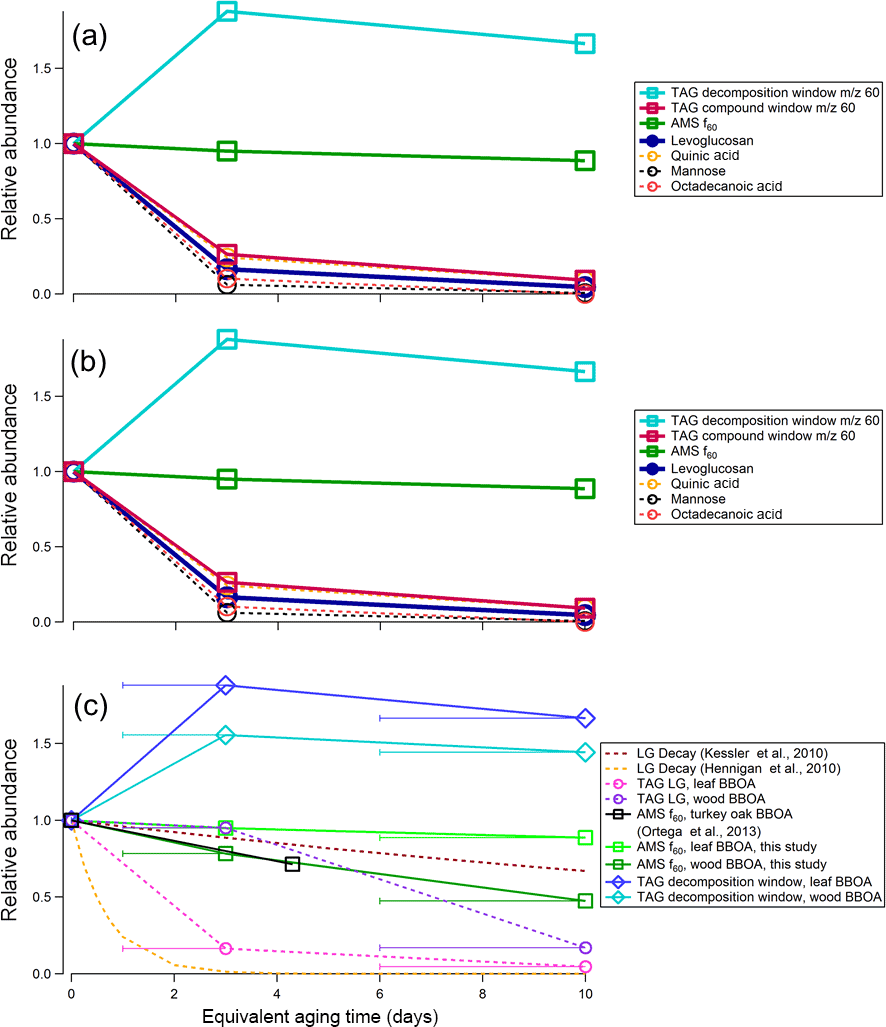
Figure 12Relative changes in abundance for different m∕z 60 fragmenting species in (a) leaf and (b) heartwood BBOA; (c) TAG and AMS m∕z 60 species as a function of OHexp. Levoglucosan (LG) decay rates were calculated using two different literature kLG values (Hennigan et al., 2010; Kessler et al., 2010) with an assumed typical outdoor OH concentration of 1.5 × 10⁻⁶ molec cm−3 (Mao et al., 2009). Additionally, normalized AMS f60 values for turkey oak (Quercus laevis) BBOA obtained during the FLAME-3 campaign were adapted from Fig. 10b in Ortega et al. (2013) and are included for comparison. The x-axis error bars denote the equivalent aging time range and are applicable for all measurements obtained in this study, though they are only included in panel (c) to preserve figure readability.
In the leaf and heartwood BBOA, an increase in the m∕z 60 signal was observed in the decomposition window from 0 to 6–10 days of equivalent aging (Fig. 12). Deconvolution PMF results demonstrate that the m∕z 60 decomposition signal co-elutes with m∕z 43 and m∕z 45 signals, which likely correspond to C2H3O+ and CHO, respectively, and is distinct from the mass spectrum of levoglucosan (Fig. S18 in the Supplement). The co-elution of these three fragments and their relative integrated abundances provides evidence that organic acids constitute a portion of the decomposing OA. Further, the increase in the m∕z 60 integrated signal suggests that these acids are formed during oxidative reactions occurring in the PAM chamber, either through heterogeneous oxidation of primary BBOA or condensation of oxidized SOA material.
Relative rates of decay for TAG integrated m∕z 60 fragmenting species are given in Fig. 12. For leaf BBOA (Fig. 12a), these compounds include levoglucosan, quinic acid, mannose, and octadecanoic acid, and for heartwood BBOA (Fig. 12b), these include levoglucosan, methyl-β-D-glucopyranoside, galactoheptulose, n-acetyl-d-galactosamine, and 1,6-anhydro-α-d-galactofuranose. The TAG decomposition window m∕z 60 signal, total TAG compound window m∕z 60 signal, and AMS f60 (the ratio of m∕z 60 to the total signal; Ng et al., 2011b) are also included in Fig. 12a and b for comparison. All values have been normalized to the signal obtained at 0 days of equivalent aging. The normalized abundances for TAG species were obtained by integrating each compound's m∕z 60 signal at each level of oxidation, then dividing each peak area by the peak area obtained in the unaged chromatograms (“0 days”). As with TAG species, AMS f60 has been normalized at each level of oxidation to the AMS f60 obtained without photochemical aging.
Primary TAG species generally decrease in abundance with photochemical aging, though rates of decay vary depending on the compound. By contrast, in both heartwood and leaf BBOA, the TAG decomposition m∕z 60 summed signal increases overall from zero to 6–10 days of equivalent aging, peaking at 1–3 days of aging. In the leaf BBOA, the AMS m∕z 60 signal decreases by approximately 10 % at 6–10 days of aging, while the AMS f60 in the wood BBOA is reduced to 50 % of its original value at the highest level of oxidation. These trends in AMS f60 may reflect the combined effects of the oxidative decay of primary BBOA compounds, including sugars and anhydrosugars, and the formation of organic acids with functionalization reactions in the PAM chamber. Previous BBOA chemical characterization studies have identified organic acids as BBOA tracers (Falkovich et al., 2005; Lin et al., 2016; Mazzoleni et al., 2007), and Ortega et al. (2013) report that organic acids formed through OFR-driven oxidation may contribute to net AMS m∕z 60 (Ortega et al., 2013).
Figure 12c displays experimental relative abundances as functions of equivalent aging time for various TAG and AMS markers observed during wood BBOA oxidation, along with levoglucosan decay rates calculated using kLG values obtained in previous studies (Hennigan et al., 2010; Kessler et al., 2010). In addition, AMS f60 values obtained for PAM-aged turkey oak (Q. laevis) BBOA during the FLAME-3 campaign (Ortega et al., 2013) are overlaid for comparison; the values plotted correspond to f60 = 0.028 at OHexp = 0 molec cm−3 s and f60 = 0.016 at OHexp = 5.6 × 10¹¹ molec cm−3 s (approximately 4 days of equivalent aging based on their PAM reactor calibration), with each point normalized to f60 = 0.028 (Ortega et al., 2013).
The OH-driven oxidation kinetics of levoglucosan in BBOA have been investigated in previous chamber oxidation studies. For example, Kessler et al. (2010) obtained a second-order rate constant of kLG = (3.09 ± 0.18) × 10−13 cm3 molec−1 s−1 from AMS measurements of OFR-oxidized levoglucosan particles (Kessler et al., 2010), while Hennigan et al. (2010) obtained a rate constant of kLG = (1.1 ± 0.5) × 10−11 cm3 molec−1 s−1 from smog chamber experiments (Hennigan et al., 2010). Lai et al. (2014) obtained expressions for kLG as a function of relative humidity and temperature in their own smog chamber experiments; at 25 ∘C and 30 % relative humidity, kLG = 1.107 × 10⁻¹¹ cm3 molec−1 s−1, a value in good agreement with Hennigan et al. (2010)'s results (Lai et al., 2014). Lai et al. (2014) attribute the discrepancy between Kessler et al. (2010)'s and Hennigan et al. (2010)'s calculated kLG to differences in both the levoglucosan detection method and experimental OH concentration ranges. First, while Hennigan et al. (2010) used offline filter collections to determine levoglucosan concentrations, Kessler et al. (2010) took online measurements using an AMS and used m∕z 144 as the marker fragment for levoglucosan. Lai et al. (2014) suggest that because the parent ion of m∕z 162 was not used as the marker fragment in Kessler et al.'s AMS measurements, any potential effects from reaction products cannot be fully isolated, possibly leading to an underestimate of levoglucosan decay. However, our chromatographic methods are not subject to this mass spectral interference, and in the case of the heartwood BBOA, the TAG-measured levoglucosan decay matches the decay predicted by Kessler et al. (2010). Additionally, Lai et al. (2014) suggest that their own results may differ from those obtained by Kessler et al. (2010) because they operated at much lower OH concentrations. During these experiments, OH concentrations ([OH]) ranged from 109–1010 molec cm−3, closer to the operating conditions of Kessler et al. (2010) ([OH] = 109–2 × 10¹¹ molec cm−3) than Lai et al. (2014) ([OH] = 3.50 × 10⁷ molec cm−3).
Although levoglucosan decays rapidly in the leaf BBOA with increasing OHexp, levoglucosan in the heartwood BBOA is depleted more slowly. Levoglucosan is classified as semivolatile (at 25 ∘C, pL∘ ∼ 2.41 × 10⁻⁵ Pa; ACD/Labs, 2017) and is therefore expected to partition between the gas and particle phases. To approximate phase partitioning, particle-phase fractions for levoglucosan (ξLG) were calculated based on AMS total organic concentrations and effective saturation concentrations (, µg m−3) using Eq. (2). The resulting values and relevant parameters are reported in Table S12. For each fuel, little variance is expected in levoglucosan particle-phase fraction between oxidation conditions, so we conclude that phase partitioning is unlikely to be driving trends in levoglucosan abundances observed in these experiments. Based on the partitioning approximations, the leaf BBOA is expected to contain a higher percentage of levoglucosan in the particle phase than the heartwood BBOA (91.1 ± 1.65 % vs. 77.8 % ± 2.26 %), though in both cases, gas-phase levoglucosan concentrations are likely to remain low. The prevalence of levoglucosan in the particle phase during photochemical aging is consistent with previous laboratory measurements of aged levoglucosan particles (Kessler et al., 2010). Considering that heartwood BBOA exhibited lower total organic concentrations than the leaf BBOA, the slower depletion of levoglucosan in the heartwood samples is perhaps consistent with OH suppression effects, wherein OH experiences increased reactivity with gas-phase species at the particle surface.
The AMS m∕z 60 signal agrees well with the levoglucosan decay rate calculated using Kessler et al. (2010)'s kLG and decreases with increasing OHexp, though it displays less overall decay compared to levoglucosan measured by the TAG. Our results demonstrate that although m∕z 60 may be an effective tracer for levoglucosan and primary BBOA under certain conditions, the formation of organic acids through photochemical aging may also impact AMS m∕z 60 and should be considered when using the AMS to track levoglucosan and primary BBOA in future studies. Furthermore, these results illustrate the utility of TAG data in interpreting AMS bulk OA measurements, as it gives both molecular characterization as well as additional insight on the chemical makeup of the most aged OA through evaluation of thermal decomposition components.
The experimental methods presented in this work allow repeatable collection, oxidation, and molecular-level analysis of source-specific BBOA. The identification of molecular tracers unique to leaf and wood fuels can aid apportionment of BBOA to different plant fractions. For example, based on our results, a BBOA plume exhibiting high concentrations of aliphatic leaf wax components may be attributed to canopy or leaf litter devolatilization and combustion, while a plume with high concentrations of levoglucosan and lignin decomposition products could be attributed to heartwood combustion. Additionally, our results suggest that certain molecular components present in freshly emitted BBOA may persist after 3 days of equivalent aging and could even increase in abundance with atmospheric aging due to reaction or gas-to-particle partitioning. The relative rates of OH-driven decay obtained from TAG measurements may thus inform future field observations where molecular speciation information is obtained for photochemically aged plumes.
The PMF deconvolution results support the identification and analysis of individual compounds present in heartwood and leaf BBOA. Because each chromatogram may contain hundreds of compounds, a general knowledge of the compound classes characteristic of each BBOA type can greatly reduce individual compound analysis time and ensure that chromatograms are characterized as completely as possible. The results presented in this study therefore confirm that the chromatogram binning method coupled with PMF, as developed by Zhang et al. (2014, 2016), can aid molecular tracer analysis by elucidating different compound classes of interest present in BBOA. The compound window PMF results provide information on characteristic mass spectral signatures within leaf and wood primary BBOA and may be compared to results obtained in future BBOA studies to more fully characterize how different compounds evolve with photochemical aging in the atmosphere.
Based on previous studies, combustion conditions are expected to significantly impact the chemical composition of both primary and secondary BBOA (Ortega et al., 2013; Reece et al., 2017; Weimer et al., 2008; see “AMS Chemical Characterization” in the Supplement). The resistive heating technique applied in these experiments allows for the isolation of devolatilization (precombustion) and low-temperature (≤ 300 ∘C) smoldering conditions, which is difficult to achieve in combustion chambers that require ignition of a flame. For example, Tian et al. (2015) designed a chamber that allows the user to control the relative contributions of smoldering and flaming combustion, though smoldering combustion is only achieved in this chamber following the introduction of a flame to the biomass fuel (Tian et al., 2015). The devolatilization and combustion procedure presented here is thus advantageous for investigating aerosol from small masses of biomass fuel under tightly controlled conditions. However, these results alone are likely not representative of a real-world system, where smoldering combustion often occurs alongside flaming combustion. Our results may therefore serve to complement field measurements, where either smoldering or flaming combustion may dominate, as well as laboratory studies where combustion conditions are controlled.
Future work will focus on characterizing sources of bias to improve quantification of material in both the TAG compound and decomposition window. For example, particle matrix effects, whereby certain compounds exhibit enhanced or diminished recovery due to the presence of a particle matrix, have been reported to influence compound responses in previous work with the TAG and other thermal desorption GC systems, particularly for large molecular weight compounds (Lambe et al., 2009; Lavrich and Hays, 2007). Lambe et al. (2009) quantified this effect for the TAG by co-injecting a constant C30 deuterated alkane standard with 0–60 µg motor oil and found that the presence of the motor oil matrix enhanced recovery of the standard by a factor of 2–3 (Lambe et al., 2009). In these experiments, the TAG collected estimated ranges of 6–16 µg particles for leaf BBOA and 22–36 µg particles for heartwood BBOA. Based on these mass ranges, we do not expect these matrix effects to contribute significantly to our results, especially for the lower molecular weight compounds. However, future work will incorporate an evaluation of matrix effects to minimize bias in TAG measurements. Although the TAG's OA analysis capability has historically been limited by poor mass throughput of highly oxygenated species, we demonstrate here that the TAG decomposition window can be used to gain a better understanding of the molecular composition of oxidized BBOA. Though the decomposition window does not provide chemical composition information with molecular resolution, the chromatogram binning PMF results allow identification of different co-eluting factors, many of which correspond to molecular fragments that could be used as source-specific BBOA tracers in future field studies.
The utility of the thermal decomposition window is limited by a lack of adequate analytical standards, particularly for organic components. Although ammonium sulfate and ammonium nitrate standards have been used to quantify sulfate and nitrate particles in previous work (Williams et al., 2016), the development of satisfactory standards for decomposing organics remains difficult for several reasons. Fragments eluting in the decomposition window may be tentatively identified using available mass spectral identification tools, though we often cannot infer the source of the fragments, since they are products of compound thermal decomposition rather than volatilization. Many of the compounds undergoing decomposition during sample desorption may therefore be too involatile for typical GC-MS analysis. Despite these challenges, analytical standards are currently under development to aid identification and interpretation of decomposition window results based on molecular functionality. For both types of BBOA, the m∕z 44 signal in the TAG decomposition window increases with photochemical aging, confirming that this signal indicates the presence of thermally labile oxygenated OA. The increase in m∕z 44 with oxidation in both the TAG decomposition window and the AMS mass spectra is consistent with results from previous studies (Williams et al., 2016). However, our observations suggest that the utility of decomposition m∕z 44 as a quantifiable tracer for aged OA varies depending on OA type. For the heartwood BBOA, the TAG decomposition m∕z 44 signal correlates well with AMS , suggesting that for this type of BBOA, the decomposition m∕z 44 abundance could be used to estimate the aerosol's oxidation state. By contrast, the correlation between TAG decomposition m∕z 44 and AMS is not significant for PAM-aged oak leaf BBOA, perhaps because compounds formed with photochemical aging of leaf BBOA are less thermally labile and more resistant to thermal decomposition than those found in aged heartwood BBOA. In addition, without mass-based standard calibrations for the decomposition window, distinguishing between an increase in thermally labile mass (i.e. due to SOA formation) and a relative increase in thermally decomposing OA due to changes in chemical composition (i.e. due to heterogeneous oxidation and functionalization) remains challenging.
From the TAG data, we observe two competing effects driving the overall m∕z 60 signal measured in the AMS. While many primary BBOA components exhibiting a characteristic m∕z 60 fragment, including anhydrosugars like levoglucosan, were depleted with photochemical aging, an enhanced m∕z 60 signal in the decomposition window indicates increased formation of organic acids in the PAM reactor. Both processes have been reported in previous literature, though the oxidative depletion of primary BBOA is most typically thought to drive AMS m∕z 60 trends in field and laboratory studies. Our data suggest that although AMS measurements provide useful chemical composition information on bulk OA, laboratory studies with molecular-level measurements are needed to complement AMS data and provide a more complete understanding of processes occurring in the atmosphere.
The mechanisms driving compositional changes in BBOA remain challenging to interpret. Although many compounds observed in this study are clearly depleted through functionalization reactions, some species may be subjected to phase partitioning effects in addition to PAM-driven oxidation. In particular, the enhancement in TAG thermal decomposition m∕z 44 and m∕z 60 may occur due to formation of SOA through oxidation and condensation of low-volatility gases, heterogeneous functionalization of compounds in the particle phase, or a combination of these processes. Future studies will focus on investigating the role of phase partitioning in OA chemical composition within BBOA plumes, with emphasis on the thermally labile material eluting in the TAG thermal decomposition window. In addition, different types of biomass will be tested to explore the dependence of phase partitioning and photochemical aging effects on fuel type, broadening the applicability of these techniques to future field measurements.
Data from this study are available upon request by contacting the corresponding author.
The supplement related to this article is available online at: https://doi.org/10.5194/acp-18-2199-2018-supplement.
The authors declare that they have no conflict of interest.
The material presented is based on work supported by the National Science
Foundation (award no. 1437933). The authors would also like to acknowledge
support from the International Center for Energy, Environment and
Sustainability (INCEES) and the McDonnell Academy Global Energy and
Environment Partnership (MAGEEP) at Washington University in St. Louis. The
authors would also like to thank Audrey Dang, Benjamin Sumlin, and Junseok Lee for assisting with supplementary CO measurements. Finally, the authors
would like to thank Benjamin Sumlin for his insight during the editing
process.
Edited by: Sergey A. Nizkorodov
Reviewed by: three anonymous referees
ACD/Labs: Advanced Chemistry Development (ACD/Labs) Software V11.02 (© 1994–2012 ACD/Labs), available at: http://www.cas.org/products/scifinder, last access: 11 May 2017.
Appel, B. R., Tokiwa, Y., Hsu, J., Kothny, E. L., and Hahn, E.: Visibility as related to atmospheric aerosol constituents, Atmos. Environ., 19, 1525–1534, https://doi.org/10.1016/0004-6981(85)90290-2, 1985.
Bond, T. C., Streets, D. G., Yarber, K. F., Nelson, S. M., Woo, J.-H., and Klimont, Z.: A technology-based global inventory of black and organic carbon emissions from combustion, J. Geophys. Res.-Atmos., 109, D14203, https://doi.org/10.1029/2003JD003697, 2004.
Burling, I. R., Yokelson, R. J., Griffith, D. W. T., Johnson, T. J., Veres, P., Roberts, J. M., Warneke, C., Urbanski, S. P., Reardon, J., Weise, D. R., Hao, W. M., and de Gouw, J.: Laboratory measurements of trace gas emissions from biomass burning of fuel types from the southeastern and southwestern United States, Atmos. Chem. Phys., 10, 11115–11130, https://doi.org/10.5194/acp-10-11115-2010, 2010.
Canagaratna, M. R., Jayne, J. T., Jimenez, J. L., Allan, J. D., Alfarra, M. R., Zhang, Q., Onasch, T. B., Drewnick, F., Coe, H., Middlebrook, A., Delia, A., Williams, L. R., Trimborn, A. M., Northway, M. J., Decarlo, P. F., Kolb, C. E., Davidovits, P., and Worsnop, D. R.: Chemical and microphysical characterization of ambient aerosols with the aerodyne aerosol mass spectrometer, Mass Spectrom. Rev., 26, 185–222, https://doi.org/10.1002/mas.20115, 2007.
Capes, G., Johnson, B., McFiggans, G., Williams, P. I., Haywood, J., and Coe, H.: Aging of biomass burning aerosols over West Africa: Aircraft measurements of chemical composition, microphysical properties, and emission ratios, J. Geophys. Res.-Atmos., 113, D00C15, https://doi.org/10.1029/2008JD009845, 2008.
Cubison, M. J., Ortega, A. M., Hayes, P. L., Farmer, D. K., Day, D., Lechner, M. J., Brune, W. H., Apel, E., Diskin, G. S., Fisher, J. A., Fuelberg, H. E., Hecobian, A., Knapp, D. J., Mikoviny, T., Riemer, D., Sachse, G. W., Sessions, W., Weber, R. J., Weinheimer, A. J., Wisthaler, A., and Jimenez, J. L.: Effects of aging on organic aerosol from open biomass burning smoke in aircraft and laboratory studies, Atmos. Chem. Phys., 11, 12049–12064, https://doi.org/10.5194/acp-11-12049-2011, 2011.
D'Anna, B., Andresen, Ø., Gefen, Z., and Nielsen, C. J.: Kinetic study of OH and NO3 radical reactions with 14 aliphatic aldehydes, Phys. Chem. Chem. Phys., 3, 3057–3063, https://doi.org/10.1039/B103623H, 2001.
DeCarlo, P. F., Kimmel, J. R., Trimborn, A., Northway, M. J., Jayne, J. T., Aiken, A. C., Gonin, M., Fuhrer, K., Horvath, T., Docherty, K. S., Worsnop, D. R., and Jimenez, J. L.: Field-Deployable, High-Resolution, Time-of-Flight Aerosol Mass Spectrometer, Anal. Chem., 78, 8281–8289, https://doi.org/10.1021/ac061249n, 2006.
Donahue, N. M., Robinson, A. L., Stanier, C. O., and Pandis, S. N.: Coupled Partitioning, Dilution, and Chemical Aging of Semivolatile Organics, Environ. Sci. Technol., 40, 2635–2643, https://doi.org/10.1021/es052297c, 2006.
Falkovich, A. H., Graber, E. R., Schkolnik, G., Rudich, Y., Maenhaut, W., and Artaxo, P.: Low molecular weight organic acids in aerosol particles from Rondônia, Brazil, during the biomass-burning, transition and wet periods, Atmos. Chem. Phys., 5, 781–797, https://doi.org/10.5194/acp-5-781-2005, 2005.
Fine, P. M., Cass, G. R., and Simoneit, B. R. T.: Organic compounds in biomass smoke from residential wood combustion: Emissions characterization at a continental scale, J. Geophys. Res.-Atmos., 107, 8349, https://doi.org/10.1029/2001JD000661, 2002.
Forman, G. S., Hauser, A. B., and Adda, S. M.: Life cycle analysis of gas to liquids (GTL) derived linear alkyl benzene, J. Clean. Prod., 80, 30–37, https://doi.org/10.1016/j.jclepro.2014.05.058, 2014.
Fraser, M. P. and Lakshmanan, K.: Using Levoglucosan as a Molecular Marker for the Long-Range Transport of Biomass Combustion Aerosols, Environ. Sci. Technol., 34, 4560–4564, https://doi.org/10.1021/es991229l, 2000.
Goldstein, A. H. and Galbally, I. E.: Known and Unexplored Organic Constituents in the Earth's Atmosphere, Environ. Sci. Technol., 41, 1514–1521, https://doi.org/10.1021/es072476p, 2007.
Grieshop, A. P., Logue, J. M., Donahue, N. M., and Robinson, A. L.: Laboratory investigation of photochemical oxidation of organic aerosol from wood fires 1: measurement and simulation of organic aerosol evolution, Atmos. Chem. Phys., 9, 1263–1277, https://doi.org/10.5194/acp-9-1263-2009, 2009.
Gülz, P. G. and Boor, G.: Seasonal Variations in Epicuticular Wax Ultrastructures of Quercus robur Leaves, Z. Naturforsch., 47c, 807–814, 1992.
Hennigan, C. J., Sullivan, A. P., Collett, J. L., and Robinson, A. L.: Levoglucosan stability in biomass burning particles exposed to hydroxyl radicals, Geophys. Res. Lett., 37, L09806, https://doi.org/10.1029/2010GL043088, 2010.
Hoffmann, D., Tilgner, A., Iinuma, Y., and Herrmann, H.: Atmospheric stability of levoglucosan: a detailed laboratory and modeling study, Environ. Sci. Technol., 44, 694–699, https://doi.org/10.1021/es902476f, 2010.
Isaacman, G., Kreisberg, N. M., Yee, L. D., Worton, D. R., Chan, A. W. H., Moss, J. A., Hering, S. V., and Goldstein, A. H.: Online derivatization for hourly measurements of gas- and particle-phase semi-volatile oxygenated organic compounds by thermal desorption aerosol gas chromatography (SV-TAG), Atmos. Meas. Tech., 7, 4417–4429, https://doi.org/10.5194/amt-7-4417-2014, 2014.
Kampa, M. and Castanas, E.: Human health effects of air pollution, Environ. Pollut., 151, 362–367, https://doi.org/10.1016/j.envpol.2007.06.012, 2008.
Kanakidou, M., Seinfeld, J. H., Pandis, S. N., Barnes, I., Dentener, F. J., Facchini, M. C., Van Dingenen, R., Ervens, B., Nenes, A., Nielsen, C. J., Swietlicki, E., Putaud, J. P., Balkanski, Y., Fuzzi, S., Horth, J., Moortgat, G. K., Winterhalter, R., Myhre, C. E. L., Tsigaridis, K., Vignati, E., Stephanou, E. G., and Wilson, J.: Organic aerosol and global climate modelling: a review, Atmos. Chem. Phys., 5, 1053–1123, https://doi.org/10.5194/acp-5-1053-2005, 2005.
Kang, E., Root, M. J., Toohey, D. W., and Brune, W. H.: Introducing the concept of Potential Aerosol Mass (PAM), Atmos. Chem. Phys., 7, 5727–5744, https://doi.org/10.5194/acp-7-5727-2007, 2007.
Kessler, S. H., Smith, J. D., Che, D. L., Worsnop, D. R., Wilson, K. R., and Kroll, J. H.: Chemical Sinks of Organic Aerosol: Kinetics and Products of the Heterogeneous Oxidation of Erythritol and Levoglucosan, Environ. Sci. Technol., 44, 7005–7010, https://doi.org/10.1021/es101465m, 2010.
Kreisberg, N. M., Hering, S. V., Williams, B. J., Worton, D. R., and Goldstein, A. H.: Quantification of Hourly Speciated Organic Compounds in Atmospheric Aerosols, Measured by an In-Situ Thermal Desorption Aerosol Gas Chromatograph (TAG), Aerosol Sci. Technol., 43, 38–52, https://doi.org/10.1080/02786820802459583, 2009.
Kroll, J. H., Smith, J. D., Che, D. L., Kessler, S. H., Worsnop, D. R., and Wilson, K. R.: Measurement of fragmentation and functionalization pathways in the heterogeneous oxidation of oxidized organic aerosol, Phys. Chem. Chem. Phys., 11, 8005–8014, https://doi.org/10.1039/B905289E, 2009.
Kroll, J. H., Donahue, N. M., Jimenez, J. L., Kessler, S. H., Canagaratna, M. R., Wilson, K. R., Altieri, K. E., Mazzoleni, L. R., Wozniak, A. S., Bluhm, H., Mysak, E. R., Smith, J. D., Kolb, C. E., and Worsnop, D. R.: Carbon oxidation state as a metric for describing the chemistry of atmospheric organic aerosol, Nat. Chem., 3, 133–139, https://doi.org/10.1038/nchem.948, 2011.
Kwok, E. S. C. and Atkinson, R.: Estimation of hydroxyl radical reaction rate constants for gas-phase organic compounds using a structure-reactivity relationship: An update, Atmos. Environ., 29, 1685–1695, https://doi.org/10.1016/1352-2310(95)00069-B, 1995.
Lai, C., Liu, Y., Ma, J., Ma, Q., and He, H.: Degradation kinetics of levoglucosan initiated by hydroxyl radical under different environmental conditions, Atmos. Environ., 91, 32–39, https://doi.org/10.1016/j.atmosenv.2014.03.054, 2014.
Lambe, A. T., Logue, J. M., Kreisberg, N. M., Hering, S. V., Worton, D. R., Goldstein, A. H., Donahue, N. M., and Robinson, A. L.: Apportioning black carbon to sources using highly time-resolved ambient measurements of organic molecular markers in Pittsburgh, Atmos. Environ., 43, 3941–3950, https://doi.org/10.1016/j.atmosenv.2009.04.057, 2009.
Lambe, A. T., Ahern, A. T., Williams, L. R., Slowik, J. G., Wong, J. P. S., Abbatt, J. P. D., Brune, W. H., Ng, N. L., Wright, J. P., Croasdale, D. R., Worsnop, D. R., Davidovits, P., and Onasch, T. B.: Characterization of aerosol photooxidation flow reactors: heterogeneous oxidation, secondary organic aerosol formation and cloud condensation nuclei activity measurements, Atmos. Meas. Tech., 4, 445–461, https://doi.org/10.5194/amt-4-445-2011, 2011.
Lambe, A. T., Onasch, T. B., Croasdale, D. R., Wright, J. P., Martin, A. T., Franklin, J. P., Massoli, P., Kroll, J. H., Canagaratna, M. R., Brune, W. H., Worsnop, D. R., and Davidovits, P.: Transitions from Functionalization to Fragmentation Reactions of Laboratory Secondary Organic Aerosol (SOA) Generated from the OH Oxidation of Alkane Precursors, Environ. Sci. Technol., 46, 5430–5437, https://doi.org/10.1021/es300274t, 2012.
Lavrich, R. J. and Hays, M. D.: Validation studies of thermal extraction-GC/MS applied to source emissions aerosols. 1. Semivolatile analyte-nonvolatile matrix interactions, Anal. Chem., 79, 3635–3645, https://doi.org/10.1021/ac0623282, 2007.
Lee, T., Sullivan, A. P., Mack, L., Jimenez, J. L., Kreidenweis, S. M., Onasch, T. B., Worsnop, D. R., Malm, W., Wold, C. E., Hao, W. M., and Collett Jr., J. L.: Chemical Smoke Marker Emissions During Flaming and Smoldering Phases of Laboratory Open Burning of Wildland Fuels, Aerosol Sci. Technol., 44, i–v, https://doi.org/10.1080/02786826.2010.499884, 2010.
Li, R., Palm, B. B., Ortega, A. M., Hlywiak, J., Hu, W., Peng, Z., Day, D. A., Knote, C., Brune, W. H., de Gouw, J. A., and Jimenez, J. L.: Modeling the Radical Chemistry in an Oxidation Flow Reactor: Radical Formation and Recycling, Sensitivities, and the OH Exposure Estimation Equation, J. Phys. Chem. A, 119, 4418–4432, https://doi.org/10.1021/jp509534k, 2015.
Lin, P., Aiona, P. K., Li, Y., Shiraiwa, M., Laskin, J., Nizkorodov, S. A., and Laskin, A.: Molecular Characterization of Brown Carbon in Biomass Burning Aerosol Particles, Environ. Sci. Technol., 50, 11815–11824, https://doi.org/10.1021/acs.est.6b03024, 2016.
Locker, H. B.: The use of levoglucosan to assess the environmental impact of residential wood-burning on air quality, ResearchGate, available at: https://www.researchgate.net/publication/236428890_The_use_of_levoglucosan_to_assess_the_environmental_impact_of_residential_wood-burning_on_air_quality (last access: 16 January 2017), 1988.
Mao, J., Ren, X., Brune, W. H., Olson, J. R., Crawford, J. H., Fried, A., Huey, L. G., Cohen, R. C., Heikes, B., Singh, H. B., Blake, D. R., Sachse, G. W., Diskin, G. S., Hall, S. R., and Shetter, R. E.: Airborne measurement of OH reactivity during INTEX-B, Atmos. Chem. Phys., 9, 163–173, https://doi.org/10.5194/acp-9-163-2009, 2009.
May, A. A., Levin, E. J. T., Hennigan, C. J., Riipinen, I., Lee, T., Collett, J. L., Jimenez, J. L., Kreidenweis, S. M., and Robinson, A. L.: Gas-particle partitioning of primary organic aerosol emissions: 3. Biomass burning, J. Geophys. Res.-Atmos., 118, 11327–11338, https://doi.org/10.1002/jgrd.50828, 2013.
Mazzoleni, L. R., Zielinska, B., and Moosmüller, H.: Emissions of Levoglucosan, Methoxy Phenols, and Organic Acids from Prescribed Burns, Laboratory Combustion of Wildland Fuels, and Residential Wood Combustion, Environ. Sci. Technol., 41, 2115–2122, https://doi.org/10.1021/es061702c, 2007.
Mellott, P.: Development and Testing of Novel Atmospheric Chemistry Technologies, MS Thesis, Washington University in St. Louis, St. Louis, MO, USA, 2012.
Mitroo, D.: Applications and Flow Visualization of a Potential Aerosol Mass Reactor, PhD Thesis, Washington University in St. Louis, St. Louis, MO, USA, 2017.
Mitroo, D., Sun, Y., Combest, D. P., Kumar, P., and Williams, B. J.: Assessing the degree of plug flow in oxidation flow reactors (OFRs): a study on a Potential Aerosol Mass (PAM) reactor, Atmos. Meas. Tech. Discuss., https://doi.org/10.5194/amt-2017-352, in review, 2017.
Ng, N. L., Canagaratna, M. R., Zhang, Q., Jimenez, J. L., Tian, J., Ulbrich, I. M., Kroll, J. H., Docherty, K. S., Chhabra, P. S., Bahreini, R., Murphy, S. M., Seinfeld, J. H., Hildebrandt, L., Donahue, N. M., DeCarlo, P. F., Lanz, V. A., Prévôt, A. S. H., Dinar, E., Rudich, Y., and Worsnop, D. R.: Organic aerosol components observed in Northern Hemispheric datasets from Aerosol Mass Spectrometry, Atmos. Chem. Phys., 10, 4625–4641, https://doi.org/10.5194/acp-10-4625-2010, 2010.
Ng, N. L., Canagaratna, M. R., Jimenez, J. L., Chhabra, P. S., Seinfeld, J. H., and Worsnop, D. R.: Changes in organic aerosol composition with aging inferred from aerosol mass spectra, Atmos. Chem. Phys., 11, 6465–6474, https://doi.org/10.5194/acp-11-6465-2011, 2011a.
Ng, N. L., Canagaratna, M. R., Jimenez, J. L., Zhang, Q., Ulbrich, I. M., and Worsnop, D. R.: Real-Time Methods for Estimating Organic Component Mass Concentrations from Aerosol Mass Spectrometer Data, Environ. Sci. Technol., 45, 910–916, https://doi.org/10.1021/es102951k, 2011b.
Niki, H., Maker, P. D., Savage, C. M., and Breitenbach, L. P.: Relative rate constants for the reaction of hydroxyl radical with aldehydes, J. Phys. Chem., 82, 132–134, https://doi.org/10.1021/j100491a002, 1978.
Oros, D. R. and Simoneit, B. R. T.: Identification of Molecular Tracers in Organic Aerosols from Temperate Climate Vegetation Subjected to Biomass Burning, Aerosol Sci. Technol., 31, 433–445, https://doi.org/10.1080/027868299303986, 1999.
Ortega, A. M., Day, D. A., Cubison, M. J., Brune, W. H., Bon, D., de Gouw, J. A., and Jimenez, J. L.: Secondary organic aerosol formation and primary organic aerosol oxidation from biomass-burning smoke in a flow reactor during FLAME-3, Atmos. Chem. Phys., 13, 11551–11571, https://doi.org/10.5194/acp-13-11551-2013, 2013.
Ortega, A. M., Hayes, P. L., Peng, Z., Palm, B. B., Hu, W., Day, D. A., Li, R., Cubison, M. J., Brune, W. H., Graus, M., Warneke, C., Gilman, J. B., Kuster, W. C., de Gouw, J., Gutiérrez-Montes, C., and Jimenez, J. L.: Real-time measurements of secondary organic aerosol formation and aging from ambient air in an oxidation flow reactor in the Los Angeles area, Atmos. Chem. Phys., 16, 7411–7433, https://doi.org/10.5194/acp-16-7411-2016, 2016.
Paatero, P.: Least squares formulation of robust non-negative factor analysis, Chemometr. Intell. Lab., 37, 23–35, https://doi.org/10.1016/S0169-7439(96)00044-5, 1997.
Peng, Z., Day, D. A., Stark, H., Li, R., Lee-Taylor, J., Palm, B. B., Brune, W. H., and Jimenez, J. L.: HOx radical chemistry in oxidation flow reactors with low-pressure mercury lamps systematically examined by modeling, Atmos. Meas. Tech., 8, 4863–4890, https://doi.org/10.5194/amt-8-4863-2015, 2015.
Peng, Z., Day, D. A., Ortega, A. M., Palm, B. B., Hu, W., Stark, H., Li, R., Tsigaridis, K., Brune, W. H., and Jimenez, J. L.: Non-OH chemistry in oxidation flow reactors for the study of atmospheric chemistry systematically examined by modeling, Atmos. Chem. Phys., 16, 4283–4305, https://doi.org/10.5194/acp-16-4283-2016, 2016.
Reece, S. M., Sinha, A., and Grieshop, A. P.: Primary and Photochemically Aged Aerosol Emissions from Biomass Cookstoves: Chemical and Physical Characterization, Environ. Sci. Technol., 51, 9379–9390, https://doi.org/10.1021/acs.est.7b01881, 2017.
Rogge, W. F., Hildemann, L. M., Mazurek, M. A., and Cass, G. R.: Sources of Fine Organic Aerosol. 9. Pine, Oak, and Synthetic Log Combustion in Residential Fireplaces, Environ. Sci. Technol., 32, 13–22, https://doi.org/10.1021/es960930b, 1998.
Simoneit, B. R. T., Schauer, J. J., Nolte, C. G., Oros, D. R., Elias, V. O., Fraser, M. P., Rogge, W. F., and Cass, G. R.: Levoglucosan, a tracer for cellulose in biomass burning and atmospheric particles, Atmos. Environ., 33, 173–182, https://doi.org/10.1016/S1352-2310(98)00145-9, 1999.
Simoneit, B. R. T., Rogge, W. F., Lang, Q., and Jaffé, R.: Molecular characterization of smoke from campfire burning of pine wood (Pinus elliottii), Chemosphere – Glob. Change Sci., 2, 107–122, https://doi.org/10.1016/S1465-9972(99)00048-3, 2000.
Simoneit, B. R. T., Kobayashi, M., Mochida, M., Kawamura, K., and Huebert, B. J.: Aerosol particles collected on aircraft flights over the northwestern Pacific region during the ACE-Asia campaign: Composition and major sources of the organic compounds, J. Geophys. Res.-Atmos., 109, D19S09, https://doi.org/10.1029/2004JD004565, 2004.
Smith, J. D., Kroll, J. H., Cappa, C. D., Che, D. L., Liu, C. L., Ahmed, M., Leone, S. R., Worsnop, D. R., and Wilson, K. R.: The heterogeneous reaction of hydroxyl radicals with sub-micron squalane particles: a model system for understanding the oxidative aging of ambient aerosols, Atmos. Chem. Phys., 9, 3209–3222, https://doi.org/10.5194/acp-9-3209-2009, 2009.
Stein, S. E. and Scott, D. R.: Optimization and testing of mass spectral library search algorithms for compound identification, J. Am. Soc. Mass Spectr., 5, 859–866, https://doi.org/10.1016/1044-0305(94)87009-8, 1994.
Stockwell, C. E., Veres, P. R., Williams, J., and Yokelson, R. J.: Characterization of biomass burning emissions from cooking fires, peat, crop residue, and other fuels with high-resolution proton-transfer-reaction time-of-flight mass spectrometry, Atmos. Chem. Phys., 15, 845–865, https://doi.org/10.5194/acp-15-845-2015, 2015.
Sumlin, B. J., Pandey, A., Walker, M. J., Pattison, R. S., Williams, B. J., and Chakrabarty, R. K.: Atmospheric Photooxidation Diminishes Light Absorption by Primary Brown Carbon Aerosol from Biomass Burning, Environ. Sci. Technol. Lett., 4, 540–545, https://doi.org/10.1021/acs.estlett.7b00393, 2017.
Tian, J., Chow, J., Cao, J., Han, Y., Ni, H., Chen, L.-W. A., Wang, X., Huang, R., Moosmüller, H., and Watson, J.: A Biomass Combustion Chamber: Design, Evaluation, and a Case Study of Wheat Straw Combustion Emission Tests, Aerosol Air Qual. Res., 15, 2104–2114, 2015.
Ulbrich, I. M., Canagaratna, M. R., Zhang, Q., Worsnop, D. R., and Jimenez, J. L.: Interpretation of organic components from Positive Matrix Factorization of aerosol mass spectrometric data, Atmos. Chem. Phys., 9, 2891–2918, https://doi.org/10.5194/acp-9-2891-2009, 2009.
Watson, J. T. and Sparkman, O. D.: Introduction to Mass Spectrometry: Instrumentation, Applications, and Strategies for Data Interpretation, 4th ed., John Wiley & Sons Ltd, West Sussex, UK, 2007.
Weimer, S., Alfarra, M. R., Schreiber, D., Mohr, M., Prévôt, A. S. H., and Baltensperger, U.: Organic aerosol mass spectral signatures from wood-burning emissions: Influence of burning conditions and wood type, J. Geophys. Res.-Atmos., 113, D10304, https://doi.org/10.1029/2007JD009309, 2008.
Williams, B. J., Goldstein, A. H., Kreisberg, N. M., and Hering, S. V.: An In-Situ Instrument for Speciated Organic Composition of Atmospheric Aerosols: Thermal Desorption Aerosol GC/MS-FID (TAG), Aerosol Sci. Technol., 40, 627–638, https://doi.org/10.1080/02786820600754631, 2006.
Williams, B. J., Goldstein, A. H., Millet, D. B., Holzinger, R., Kreisberg, N. M., Hering, S. V., White, A. B., Worsnop, D. R., Allan, J. D., and Jimenez, J. L.: Chemical speciation of organic aerosol during the International Consortium for Atmospheric Research on Transport and Transformation 2004: Results from in situ measurements, J. Geophys. Res.-Atmos., 112, D10S26, https://doi.org/10.1029/2006JD007601, 2007.
Williams, B. J., Goldstein, A. H., Kreisberg, N. M., Hering, S. V., Worsnop, D. R., Ulbrich, I. M., Docherty, K. S., and Jimenez, J. L.: Major components of atmospheric organic aerosol in southern California as determined by hourly measurements of source marker compounds, Atmos. Chem. Phys., 10, 11577–11603, https://doi.org/10.5194/acp-10-11577-2010, 2010.
Williams, B. J., Jayne, J. T., Lambe, A. T., Hohaus, T., Kimmel, J. R., Sueper, D., Brooks, W., Williams, L. R., Trimborn, A. M., Martinez, R. E., Hayes, P. L., Jimenez, J. L., Kreisberg, N. M., Hering, S. V., Worton, D. R., Goldstein, A. H., and Worsnop, D. R.: The First Combined Thermal Desorption Aerosol Gas Chromatograph – Aerosol Mass Spectrometer (TAG-AMS), Aerosol Sci. Technol., 48, 358–370, https://doi.org/10.1080/02786826.2013.875114, 2014.
Williams, B. J., Zhang, Y., Zuo, X., Martinez, R. E., Walker, M. J., Kreisberg, N. M., Goldstein, A. H., Docherty, K. S., and Jimenez, J. L.: Organic and inorganic decomposition products from the thermal desorption of atmospheric particles, Atmos. Meas. Tech., 9, 1569–1586, https://doi.org/10.5194/amt-9-1569-2016, 2016.
Wong, J. P. S., Nenes, A., and Weber, R. J.: Changes in Light Absorptivity of Molecular Weight Separated Brown Carbon Due to Photolytic Aging, Environ. Sci. Technol., 51, 8414–8421, https://doi.org/10.1021/acs.est.7b01739, 2017.
Wong, Z., Chen, K., and Li, J.: Formation of Vanillin and Syringaldehyde in an Oxygen Delignification Process, BioResources, 5, 1509–1516, 2010.
Worton, D. R., Goldstein, A. H., Farmer, D. K., Docherty, K. S., Jimenez, J. L., Gilman, J. B., Kuster, W. C., de Gouw, J., Williams, B. J., Kreisberg, N. M., Hering, S. V., Bench, G., McKay, M., Kristensen, K., Glasius, M., Surratt, J. D., and Seinfeld, J. H.: Origins and composition of fine atmospheric carbonaceous aerosol in the Sierra Nevada Mountains, California, Atmos. Chem. Phys., 11, 10219–10241, https://doi.org/10.5194/acp-11-10219-2011, 2011.
Zhang, Q., Jimenez, J. L., Canagaratna, M. R., Allan, J. D., Coe, H., Ulbrich, I., Alfarra, M. R., Takami, A., Middlebrook, A. M., Sun, Y. L., Dzepina, K., Dunlea, E., Docherty, K., DeCarlo, P. F., Salcedo, D., Onasch, T., Jayne, J. T., Miyoshi, T., Shimono, A., Hatakeyama, S., Takegawa, N., Kondo, Y., Schneider, J., Drewnick, F., Borrmann, S., Weimer, S., Demerjian, K., Williams, P., Bower, K., Bahreini, R., Cottrell, L., Griffin, R. J., Rautiainen, J., Sun, J. Y., Zhang, Y. M., and Worsnop, D. R.: Ubiquity and dominance of oxygenated species in organic aerosols in anthropogenically-influenced Northern Hemisphere midlatitudes, Geophys. Res. Lett., 34, L13801, https://doi.org/10.1029/2007GL029979, 2007.
Zhang, Y., Williams, B. J., Goldstein, A. H., Docherty, K., Ulbrich, I. M., and Jimenez, J. L.: A Technique for Rapid Gas Chromatography Analysis Applied to Ambient Organic Aerosol Measurements from the Thermal Desorption Aerosol Gas Chromatograph (TAG), Aerosol Sci. Technol., 48, 1166–1182, https://doi.org/10.1080/02786826.2014.967832, 2014.
Zhang, Y., Williams, B. J., Goldstein, A. H., Docherty, K. S., and Jimenez, J. L.: A technique for rapid source apportionment applied to ambient organic aerosol measurements from a thermal desorption aerosol gas chromatograph (TAG), Atmos. Meas. Tech., 9, 5637–5653, https://doi.org/10.5194/amt-9-5637-2016, 2016.
Zhao, R., Lee, A. K. Y., Huang, L., Li, X., Yang, F., and Abbatt, J. P. D.: Photochemical processing of aqueous atmospheric brown carbon, Atmos. Chem. Phys., 15, 6087–6100, https://doi.org/10.5194/acp-15-6087-2015, 2015.