the Creative Commons Attribution 4.0 License.
the Creative Commons Attribution 4.0 License.
 | 21 Dec 2018
Variability of depolarization of aerosol particles in the megacity of Beijing: implications for the interaction between anthropogenic pollutants and mineral dust particles
Yu Tian
Tomoaki Nishizawa
Hiroshi Kobayashi
Itsushi Uno
Xiquan Wang
Atsushi Shimizu
Zifa Wang
East Asia is suffering from severe air pollution problems due to intensive anthropogenic emissions and natural mineral dust aerosols. During transport, the aerosol particles undergo complex mixing processes, resulting in great impacts on regional air quality, human health and climate. In this study, we conducted a long-term observation using an optical particle counter equipped with a polarization detection module (POPC) at an urban site in Beijing. Mass concentrations of both PM2.5 and PM10 estimated from POPC compared well with ground-based measurements. The results revealed that the observed depolarization ratio (δ, termed as the ratio of the intensity of the s-polarized signal to the intensity of the 120∘ backward scattering signal ) for aerosol particles in the fine mode was generally much lower in summer than that in spring as a result of predominance of different aerosol types. Mineral dust particles in the coarse mode normally had a large δ value (0.3±0.05) owing to their nonspherical shape; however, particles in the fine mode mostly had water-soluble compositions, which led to an apparent decrease of their δ values in particular high relative humidity (RH) conditions. Because the observation site was subject to the impact of frequent dust events in spring, the δ value of particle at 1 µm was almost twice as high as that (0.07±0.01) in summer. Based on size-resolved δ values, anthropogenic pollutants, mineral dust and polluted mineral dust particles and their contribution to local air quality could be well distinguished. About 26.7 % of substandard days (daily averaged PM2.5 concentration larger than 75 µg m−3) in Beijing featured high atmospheric loading of coarse-mode particles in winter and springtime. In particular, during severe pollution episodes in winter, the δ values of coarse-mode particles decreased by 13 %, which implies a high possibility of dust-related heterogeneous processes in pollution formation. During dust events, δ values of particles with optical size (Dp) of 5 µm evidently decreased, with an increase of the PM2.5 ∕ PM10 ratio as well as RH, indicating the morphological changes of mineral dust. This study confirmed that high RH tends to promote water absorption processes on the dust surface as well as the coating of soluble compounds, and suggested that remote sensing techniques for aerosols may underestimate the impact of dust particles due to the complex mixing of dust and anthropogenic particles in urban areas, and the interaction between dust particles and pollutants should be considered well by the optical model.
- Article
(12331 KB) - Full-text XML
-
Supplement
(1583 KB) - BibTeX
- EndNote


Rapid economic growth and urbanization processes in East Asia have caused serious air pollution in the past decades owing to the substantial consumption of fossil fuel. Anthropogenic emissions (industrial, traffic, residential, etc.) emit a substantial amount of pollutant gases (SO2, NO2, NH3, VOCs, etc.) and primary aerosols (Akimoto, 2003, 2006; Kurokawa et al., 2013; Li et al., 2017), resulting in the formation of PM2.5. Mineral dust particles in the atmosphere also have a detrimental impact on air quality and on human health, such as reducing visibility and increasing respiratory morbidity. Beijing is located in the vicinity of dust source regions. In dry seasons, mineral dust particles emitted from the Taklimakan, the Gobi, the Mongolia Plateau and the Loess Plateau may transport eastwardly across the northern part of China (Takemura et al., 2002; Jickells et al., 2005; Uno et al., 2009), and undergo complex mixing with anthropogenic pollutants.
The environmental and climate effects of these mixing processes are notable because of dramatic changes in the physical, chemical and optical properties of mixed particles (Pan et al., 2009). In polluted urban areas, soluble salts coated on dust aerosols reduce the critical supersaturation, and there is a stronger tendency for polluted aerosols to serve as CCN (cloud condensation nuclei), influencing the formation of cloud (Sullivan et al., 2009; Tang et al., 2016). The soluble salts are derived from the directly trapping of inorganic salt and from the heterogeneous reactions between reactive gases (mostly HNO3, HCl, SO2 and NO2) and alkaline mineral dust. Continuous coating and hygroscopic growth processes on the surface modify the shapes of dust particles (Li et al., 2011). A recent study pointed out that the coexistence of NOx and mineral dust may lead to a gas–particle conversion process and promote the conversion of SO2 to sulfate (He et al., 2014). There is also observational evidence that heavy dust mixed with anthropogenic pollution may trigger new particle formation (Dupart et al., 2012; Nie et al., 2014), which exaggerates the degradation of regional air quality. The above scientific discoveries all indicate the importance of study on the mixing states of dust and pollution aerosols.
Widely used technologies to distinguish aerosol types include high-precision ground-based lidar (light detection and ranging) systems and satellite-borne observations (Cloud-Aerosol Lidar and Infrared Pathfinder Satellite Observation, CALIPSO; Winker et al., 2009; Cesana et al., 2016; Venkata and Reagan, 2016) that measure a targeted air parcel's volume depolarization ratio from backward scattering signals. Aerosol types can be distinguished by the distinct parts formed by data points on a figure of their volume depolarization ratio (, at 532 nm) of aerosols versus backscattering color ratio (1064 nm ∕ 532 nm); however, bias in the classification of internal mixed dust (normally has a large color ratio and small δa) is sometimes unavoidable since external mixing of a substantial amount of fine particles (δa < 0.1) with mineral dust aerosols (δa > 0.35) can also result in a decrease of the δa value. To respond to this need, an optical particle counter with a depolarization module was developed. The single-particle δ value measure is able to quantitatively investigate the evolution of the mixing of dust particles during their transport (Pan et al., 2015). According to the size-resolved δ value of scattering signals, particles with a spherical shape could be distinguished because the direction of the polarization of scattering light was identical to the incident light; for the nonspherical particles, the direction of polarization deviated significantly. Generally, secondary formatted particles tend to be spherical with a small δ value, while natural mineral dust has a larger δ value because of its irregular shape (Kobayashi et al., 2014). Real-time measurements of δ values on a single-particle basis help to avoid the misclassification of aerosol types. Sugimoto et al. (2015) found that the backscattering δ value in polluted dust was smaller compared to pure Asian dust for measurements in Seoul. A previous study (Pan et al., 2017) in Beijing indicated that coating processes such as heterogeneous reactions and hygroscopic growth on the surface of dust particles play a vital role in the decrease of the depolarization ratio (δ) of particles in the coarse mode. As far as we know, long-term measurements of the interaction of anthropogenic pollution and mineral dust and their effect on dust morphological changes in northern China are still lacking.
In this study, a comprehensive ground-based measurement of depolarization properties of aerosol particles was performed at an urban site in Beijing (Fig. 1), at the State Key Laboratory of Atmospheric Boundary Layer Physics and Atmospheric Chemistry (LAPC; 116.37∘ E, 39.97∘ N), Institute of Atmospheric Physics/Chinese Academy of Sciences. The morphological variability of ambient aerosol particles was investigated from November 2015 to July 2016 using a polarization optical particle counter (POPC), and the seasonal characteristics of the depolarization ratio (δ) of atmospheric aerosols were explained. Three pollution events including an anthropogenic pollution case, a typical dust-dominant case and a mixed-type pollution period were classified according to their trajectory analysis result and size distributions and δ values, to investigate the interactions between dust particles and pollutants. The objective of this study focuses on the variation of the δ value of aerosol particles and its relationship with secondary pollutants. For the first time this study represents such long-term observations of ambient aerosol morphology performed in the megacity of Beijing, and provides more applicable data for evaluating the mixing processes of atmospheric aerosols and their impact on the climate.
2.1 Instrument overview
The observation of the depolarization properties of single particles in Beijing was performed using a polarization optical particle counter (POPC) (Kobayashi et al., 2014). The instrument was installed on the second floor of an air-conditioned two-story building. The inlet was ∼50 cm above the roof of the building, and ambient air was drawn into room through a 1∕2 in. stainless tube with a rainproof cap. The total flow rate of inlet sampling air was set to 13 L min−1 (liters per minute) with a supporting pump. For POPC, the detecting size range was 0.5–10 µm. A polarized laser beam at a wavelength of 780 nm illuminated the particles. The POPC uses a forward scattering light at a scattering angle of 60∘ to determine the size of particles; backward scattering intensity at 120∘ is divided into two components with the polarizer: p-polarized light is in the plane of the incident and reflected beams, known as the horizontal polarized light, while s-polarized light is perpendicular to the plane. Normally, the ratio of the s-polarized signal to that of the total backward light scattering signal is defined as the depolarization ratio (δ), which can provide morphological information about the particle (Muñoz and Hovenier, 2011). The acceptance angle (angle of the backscattered light received by the polarizer) for the polarization detector is 45∘. To avoid coincidence error (several particles passing through the laser beam simultaneously), the sampling flow of the POPC is set to 80 cm3 min−1 (cubic centimeters per minute) with a dilution flow of 920 cm3 min−1.
During the observation, POPC was calibrated using standard known-size particles (JSR Life Sciences Corp.) at Dp = 0.048 µm (SC-0050-D) and 1.005 µm (SC-103-S), and DYNOSHERE polystyrene standard aerosols at 3.210 µm (SS-032-P), 5.125 µm (SS-052-P), 7.008 µm (SS-074-P) and 10.14 µm (SS-104-P). Aerosols were generated by a nebulizer at a flow rate of 3.5 L min−1, desiccated by passing through a vertically placed 45 cm Perma casing tube (MD-110-24P, GL Sciences), as the laboratory calibration process in Fig. S1 showed. The δ values of typical spherical particles at Dp = 5.125, 7.008 and 10.14 µm were found to be 0.075, 0.085 and 0.102, and the δ value was almost zero for the fine-mode particles (Dp = 0.048, 1.005 µm; Fig. S2). The uncertainties of the δ value were affected by various factors, including the voltage variance of power supply (), the environmental water content () and the complex refraction index () of the aerosols; we estimate the uncertainty of the δ value to be < 13 %. For comparison, mass concentrations of pollutants in Beijing were obtained from a ground-based state control site (116.40∘ E, 39.98∘ N; 2.7 km northeast of LAPC) and corresponding meteorology data from the climatological station (116.48∘ E, 39.95∘ N; 9.5 km southeast of LAPC); we thus analyzed the artificial pollution processes and special mineral dust cases that occurred in Beijing.
The vertical profile of the extinction coefficient and the depolarization ratio of aerosol particles was concurrently measured using a National Institute for Environmental Studies (NIES) lidar system (http://www-lidar.nies.go.jp/AD-Net/, last access: 30 October 2018; Singh et al., 2008; Shimizu et al., 2016). The polarization Mie lidar is a powerful instrument for identifying the change of optical properties of mineral dust (Shimizu et al., 2004). The data from the lidar were processed at 15 min resolution to derive the volume depolarization ratio at 532 nm, the attenuated backscattering coefficient at 1064 and 532 nm and the extinction coefficient estimated for spherical aerosols (mainly air pollutants) and nonspherical particles (mainly natural dust). The energy is 20 and 30 mJ pulse−1 for the 1064 and 532 nm laser, and the light is emitted vertically with a pulse repetition of 10 Hz (Shimizu et al., 2016). Telescopes with a diameter of 20 cm (lidar in Beijing) are used to collect the scattered light from the sky at an observation wavelength of 532 nm.
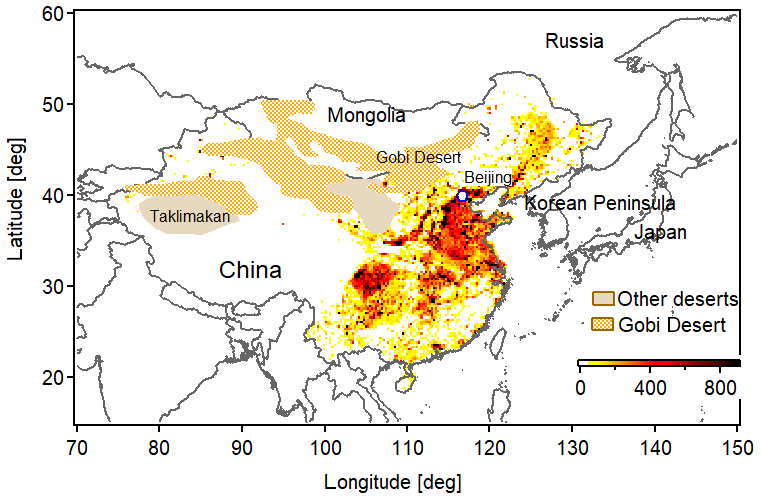
Figure 1Geographical location of the observation site in Beijing, PM2.5 emissions in China and the location of major deserts including the Gobi in East Asia.
2.2 Dispersion and trajectory analysis
The long-range and mesoscale dispersion of air parcels over the Asian region was simulated using the FLEXPART (FLEXible PARTicle) dispersion model. FLEXPART is a Lagrangian transport and dispersion model (https://www.flexpart.eu, last access: 15 June 2018) developed by the Norwegian Institute for Air Research. This model is suitable for the simulation of a large range of atmospheric transport processes (Stohl et al., 2005), which can do forward simulation to trace particles from source areas and backward simulation to track particles from given receptors. The meteorological fields for FLEXPART are taken from NCEP's (National Centers for Environmental Prediction) reanalysis GDAS (Global Data Assimilation System) dataset on a 1∘×1∘ grid, which provides global observation meteorological data at 00:00, 06:00, 12:00 and 18:00 UTC and forecast data at 03:00, 09:00, 15:00 and 21:00 UTC (http://nomads.ncep.noaa.gov/pub/data/nccf/com/gfs/prod/, last access: 18 December 2018). During the simulation, 1 unit mass of particles considered as an air sample was released from the observation site at 150 m above ground level. The spatial distribution of the footprint region of the air samples was calculated on the 5 days of backward simulation considering flow meteorology, turbulent motions, the sub-grid terrain effect and Earth's water cycle. In addition, a footprint region of air parcels of interest was simulated used the HYSPLIT (Hybrid Single Particle Lagrangian Integrated Trajectory) model developed by the NCEP (National Centers for Environmental Prediction) and NCAR (National Center for Atmospheric Research), which is based on the Lagrangian transport model (https://ready.arl.noaa.gov/HYSPLIT_traj.php, last access: 1 November 2018) (Stein et al., 2015). The dataset provided for HYSPLIT is the global reanalysis data in GDAS format (ftp://arlftp.arlhq.noaa.gov/pub/archives/gdas1, last access: 10 December 2018). It produces meteorological data four times a day, namely, at 00:00, 06:00, 12:00 and 18:00 UTC, and the horizontal resolution is 2.5∘ ×2.5∘. The vertical direction is 17 floors, ranging from the ground surface to 10 hPa. Elements, including wind, temperature, humidity, potential height and ground precipitation, are provided. During the simulation, the trajectory ensemble option starts multiple trajectories from the first selected starting location. Each member of the trajectory ensemble is calculated by offsetting the meteorological data by a fixed grid factor (one meteorological grid point in the horizontal and 0.01σ units in the vertical). Air samples were released at 150 m above ground level from LAPC, and the simulation time of the backward trajectory was 5 days.
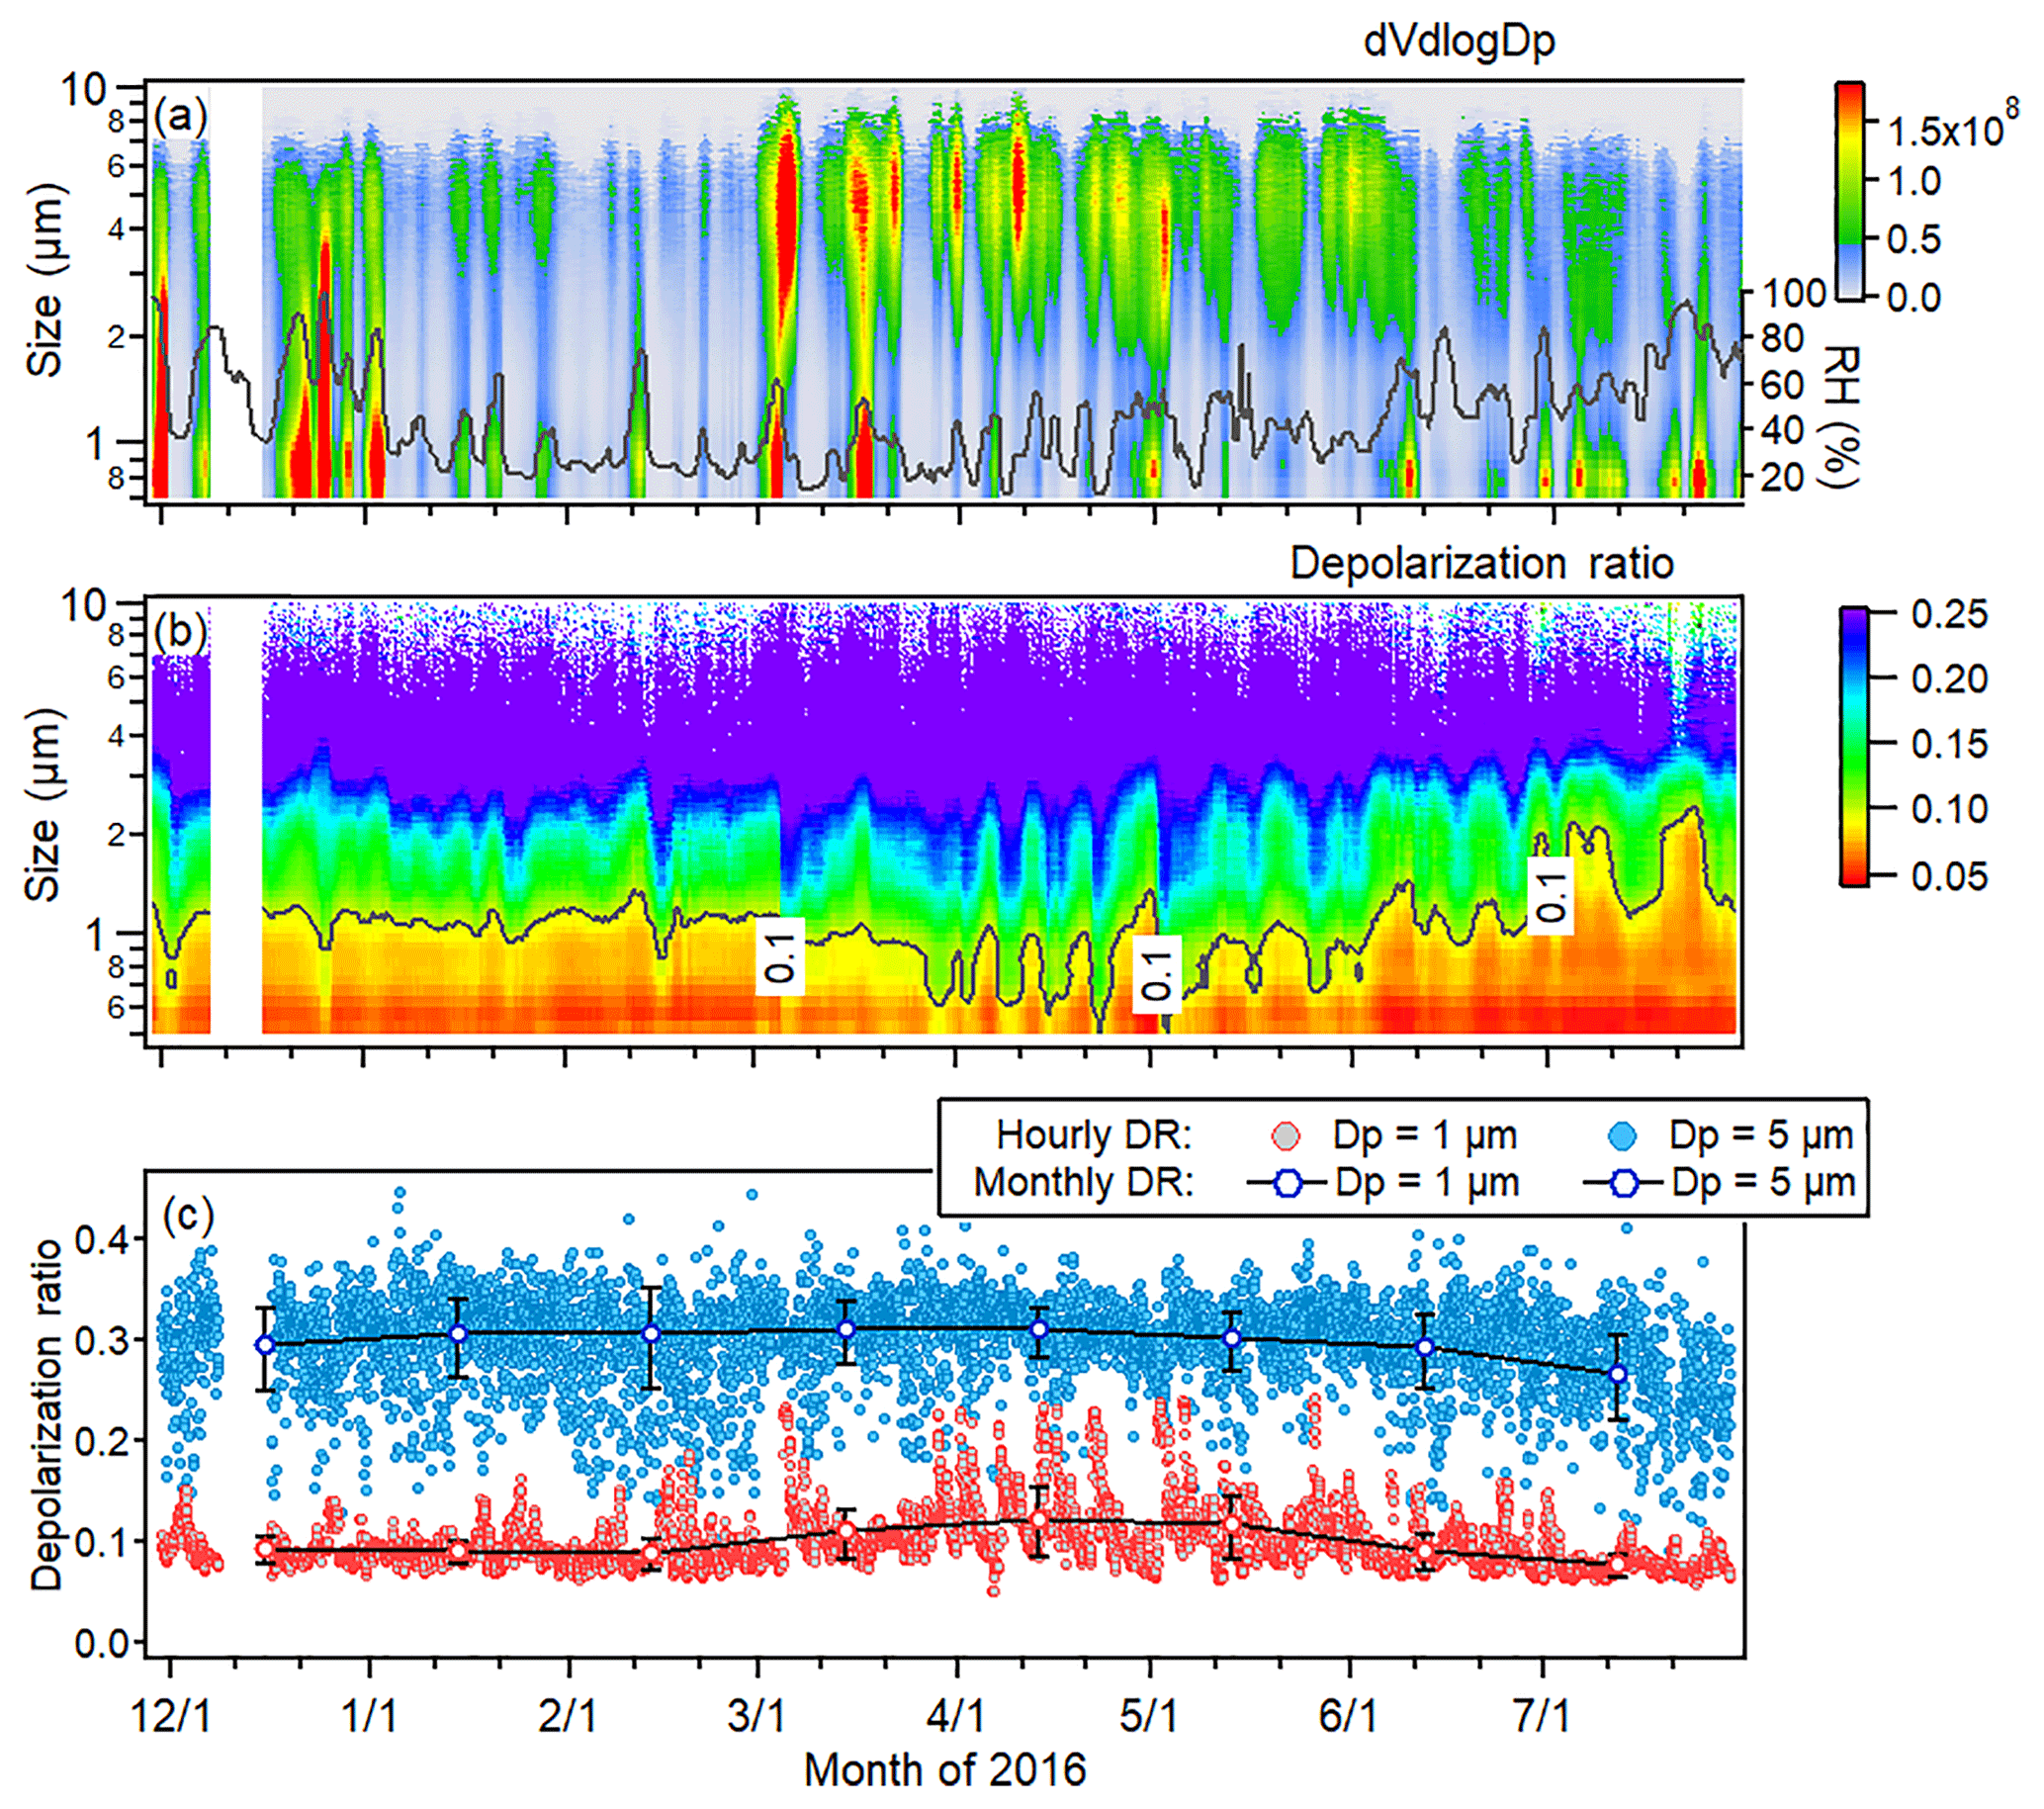
Figure 2Time series of (a) volume size distributions and RH, (b) size-resolved δ values (solid line: δ = 0.1) and (c) hourly and monthly averaged δ values for fixed-size particles: Dp = 1 and 5 µm from 29 November 2015 to 29 July 2016. Error bars for monthly averaged δ in (c) depict the monthly averaged standard deviation of value.
3.1 Size distribution of ambient aerosols
The hourly-averaged volume size distribution of aerosol from 29 November 2015 to 29 July 2016 is shown in Fig. 2a. The particle size was derived according to the calibration curve between the forward scattering intensity and standard spherical particles (Fig. S3). Mass concentrations of particle matters were reconstructed on the basis of the number concentration of particles measured by the POPC and particle density. The particle density was assumed to increase linearly from 1.77 (0.5 µm) to 2.2 g cm−3 (10 µm). To test the accuracy of the POPC detection, the PM2.5 and PM10 inverted by POPC were compared with the observed data from the Olympic Sport Center state control station (Fig. S4). The correlation coefficients are 0.91 and 0.89 (significance level: 0.001) for PM2.5 and PM10, respectively. The result also compared well with a commercial optical particle counter (KC52, RION, as shown in Fig. S5), especially in the coarse-mode size range observation.
It can be seen in Fig. 2a that volume size distribution generally had two size modes during the whole observation periods. The occurrence of fine mode (peak at ∼1 µm) was accompanied with an increase of RH. The coarse mode (4–8 µm) mainly occurred in the spring when the eastward transport of dust events was significant (Lue et al., 2010). According to the POPC observations, five main dust episodes in total (3–5, 16–22 and 30–31 March; 9–10 April; and 28 April–1 May) happened at the site during the observation period. For the cases on 3–5 and 16–18 March, the volume size distribution of ambient particles showed two peaks in both the fine and the coarse mode (Fig. S6), suggesting the interaction of anthropogenic pollutants and dust particles and the high possibility of the existence of internally mixed dust particles (discussed in Sect. 3.5). In winter 2015, POPC observed anthropogenic-dominant pollution cases five times. All of them were related to high emissions for residential heating purposes and unfavorable air diffusion circumstances (Wang et al., 2015). In summer, the volume concentration of aerosols in all size modes was significantly low because of relatively moderate anthropogenic emissions, better diffusing boundary layer conditions and frequent precipitation. In addition, relatively strong turbulence in the planetary boundary layer also increased the dry deposition processes of particles.
3.2 Seasonal patterns of the δ value of ambient aerosols
Figure 2b illustrates the size-resolved δ value as a function of time during the observation period. The δ value of particles increased significantly as the size increased. Episodes influenced by mineral dust could be easily discerned due to the increase in both the volume concentration of coarse-mode aerosols and the δ value of fine-mode aerosols. In general, the δ value of particles in urban Beijing had prominent seasonal variability, with a summer low and a spring high pattern due to the different compositions and origins of aerosols and atmospheric meteorology at the site. The averaged δ value of particles in both fine and coarse mode was highest in March 2016 (0.26) and lowest in July 2016 (0.19). This seasonal variability was very obvious in fine-mode particles. Figure 2c shows temporal variations of hourly and monthly averaged δ values for the typical particle size at 1 and 5 µm, and the error bar depicts the monthly averaged deviation. For fine particles at Dp = 1 µm, their δ values in winter and summer were 0.09±0.01 and 0.07±0.01 respectively; however, they could increase up to 0.2 as they were subject to dust events in spring. The phenomenon of the coexistence of fine mineral dust with anthropogenic pollutants has been reported in electro-microscopic studies in the literature (Li and Shao, 2009; Li et al., 2011). The daily averaged δ value at Dp = 5 µm varied significantly between 0.12 and 0.4, with a monthly mean value of 0.3±0.05. We could discern that the δ values for 5 µm particles in winter could decrease dramatically down to 0.15; however they had a very small deviation in spring. This was because water-soluble anthropogenic pollutants in winter and summer were substantial. Although dV∕dlogDp of coarse mode particles was comparatively low, heterogeneous processes on the surface of particles in the coarse mode under high RH conditions were inevitable, which may result in a decrease in the δ value.

Figure 3Dependence of the hourly-averaged δ value of particles at Dp = 5 and Dp = 1 µm on the wind speed and direction in winter (December, January and February: DJF) 2015, spring (March, April and May: MAM) 2016 and summer (June and July: JJ) 2016.
3.3 δ value of aerosols from different origins
The dependence of the hourly-averaged δ value of particles at Dp = 1 µm and Dp = 5 µm on the wind speed and directions in different seasons is plotted in Fig. 3. It can be seen that the δ values at both sizes increased when the observation site experienced a prevailing northwest wind, almost regardless of the season. For the particles at Dp = 5 µm, δ values in all direction in spring were generally higher than those in winter and summer because of the impact of mineral dust aerosols, and the δ values also generally increased with wind speed, implying the impact of resuspended road dust or floating dust under strong wind conditions. For particles at Dp = 1 µm, it was only during the northwest wind period that the δ values were 40 %–50 % higher than other directions. This demonstrated that the morphology of particles in the fine mode was only altered significantly during dust events. We noted that particles with low δ values in all size modes were observed when the site had a prevailing southeast wind in summer, indicating the presence of a large fraction of spherical particles and high ambient water content, which greatly contributed to the deliquescence process of soluble components in the atmosphere.
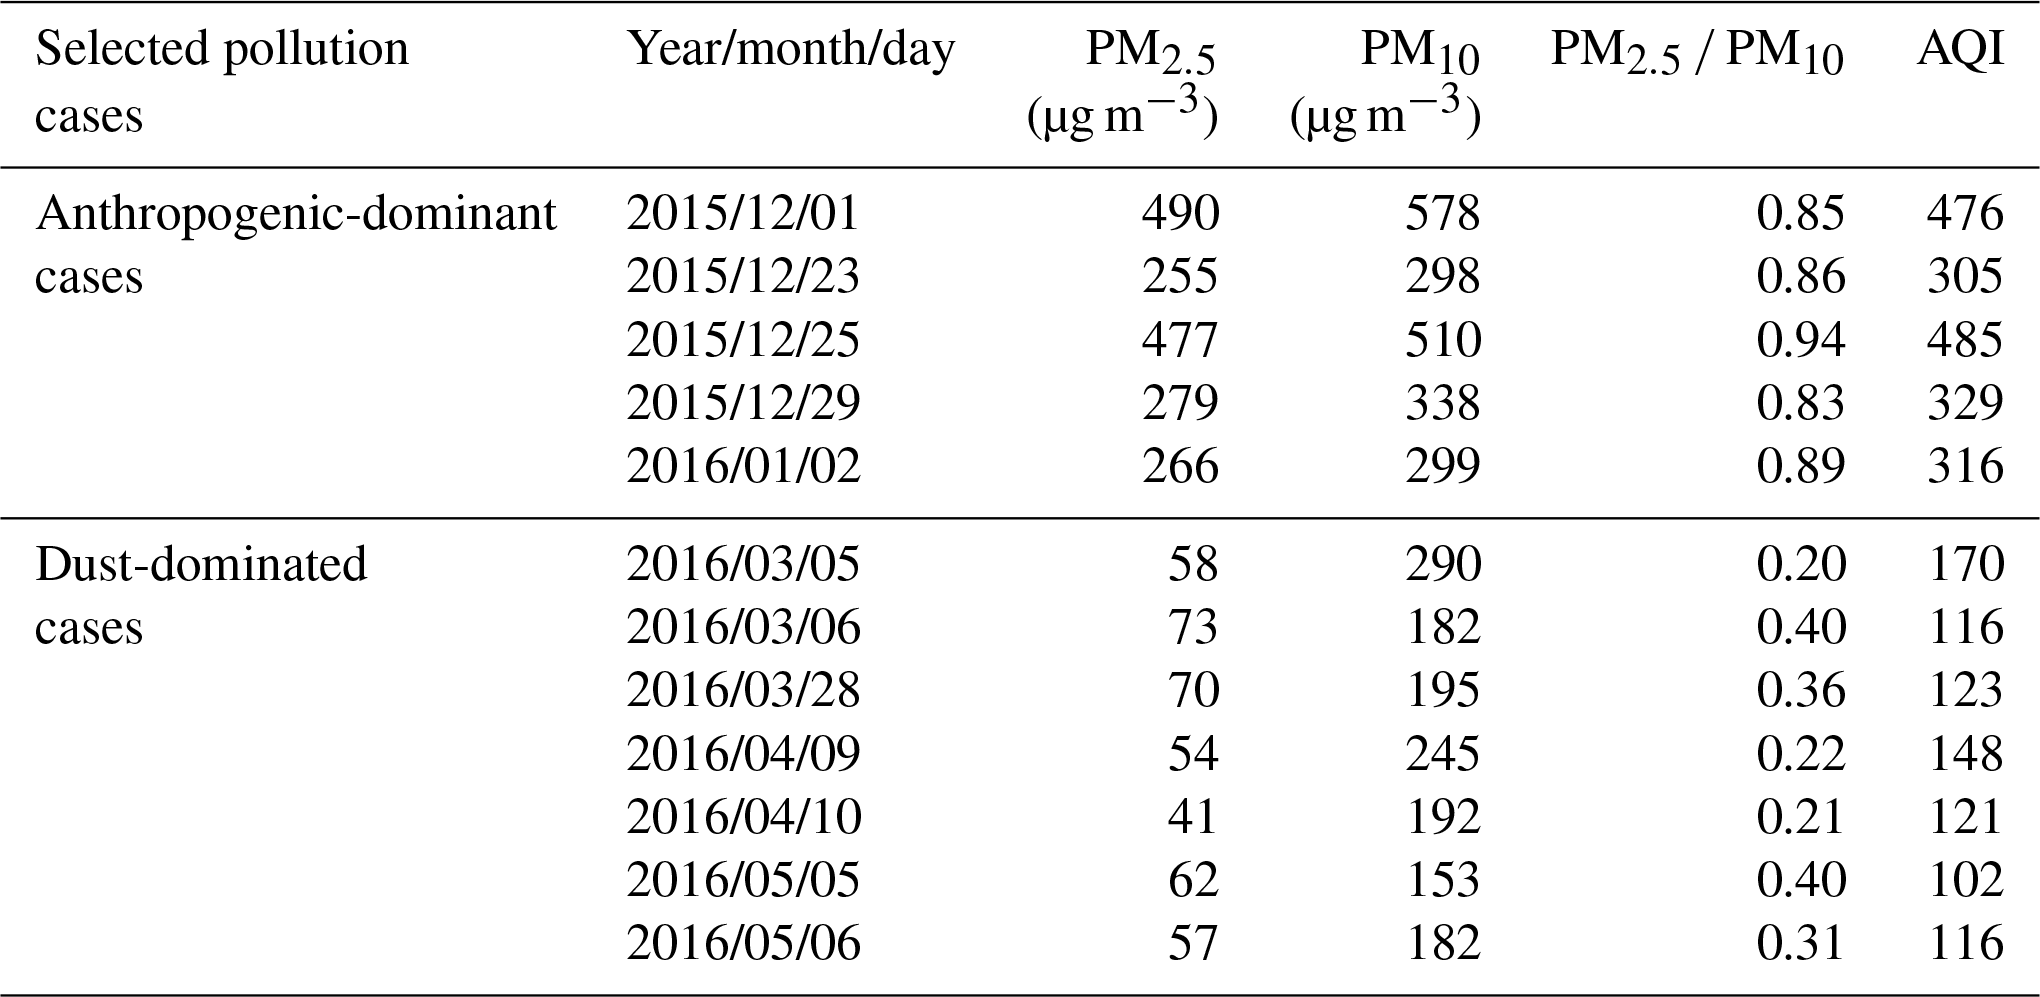
In order to understand the source region of air masses in different pollution types and further explain the seasonal characteristics of δ values of atmospheric aerosols, the footprint of the air mass in typical anthropogenic pollution cases and mineral-dust-dominant cases were analyzed. Generally speaking, PM2.5 ∕ PM10 ratios have been used for identifying the sources of primary pollutants (Chan et al., 2005; Pérez et al., 2008). A higher ratio was generally ascribed to anthropogenic-related secondary particles (sulfate, nitrate etc.), and a lower ratio indicates significant contributions of mainly resuspended or fugitive mineral dust particles due to some mechanical processes (Chan and Yao, 2008; Akyuz and Cabuk, 2009; Xu et al., 2017). Here, the specific pollution incidents were identified based on the size-resolved volume distribution and δ values. The criteria of PM2.5 > 250 µg m−3 and PM2.5 ∕ PM10≥0.8, and PM10 > 150 µg m−3 and PM2.5 ∕ PM10≤0.4 were chosen for heavy anthropogenic pollution-dominant and dust-dominant cases, as shown in Table 1.
Table 1Representative cases of heavy anthropogenic pollution and dust episodes in Beijing.
The 5-day backward trajectories were calculated from HYSPLIT ensemble calculations, resulting in 27 members for all possible offsets around the release point. The different directions from which the air mass originated over Beijing are shown in Fig. 4. For mineral-dust-dominant episodes, the air mass mainly originated from large areas in western Mongolia and the Gobi Desert, and the footprint pattern represented comparatively large dust loading in the atmosphere in spring, while for the anthropogenic-pollution-dominant period, air mass passed through the Beijing–Tianjin–Hebei region, where anthropogenic emission was significantly strong. Note that the RH along the trajectories was 13.9 % on average during dust-dominant cases (mostly in springtime) and 87.6 % in anthropogenic-pollution-dominant cases (mostly in wintertime). It means that the origin of aerosol particles and their interaction with water vapor as well as consecutively heterogeneous reactions can lead to pronounced morphological changes of particles.

Figure 4Proportion of different directions from which the air mass over Beijing originated in varying pollution types: (a) the severe anthropogenic-pollution-dominant case and (b) the dust-dominant case. The red ellipse represents the major source region of air mass arriving at the site.
3.4 δ variability of atmospheric aerosols on clean and substandard days
Figure 5a shows the number of substandard days that daily-averaged PM2.5 exceeds 75 µg m−3, the secondary standard of the Chinese Ambient Air Quality Standard. Figure 5b shows the mean mass concentrations of PM2.5, PM10 and the PM2.5 ∕ PM10 ratio on substandard days. About 26.7 % of substandard days featured high atmospheric loading of coarse-mode particles (PM2.5 ∕ PM10 < 0.6) in winter and spring. There were 18 substandard days in December 2015 with mean values of 199.6 and 240.1 µg m−3 for PM2.5 and PM10. A high PM2.5 ∕ PM10 ratio (0.83) suggested that anthropogenic pollutants were dominant. We found that the median δ value of the particles at Dp = 5 µm (0.27) during substandard days in the winter of 2015 was 12.9 % lower than that (0.31) on clean days, as shown in Fig. 5c. It indicated that during the substandard days the dust particles were more likely to be modified in shape due to the coexistence of huge amount of pollutants. The second most pollution days occurred in March (15 days) and April (14 days), and the PM2.5 ∕ PM10 ratio was 0.67 and 0.65 respectively. The δ value of particles at Dp = 5 µm particles was almost the same for substandard and clean days. This demonstrated that almost all of the mineral dust particles were in irregular shape.
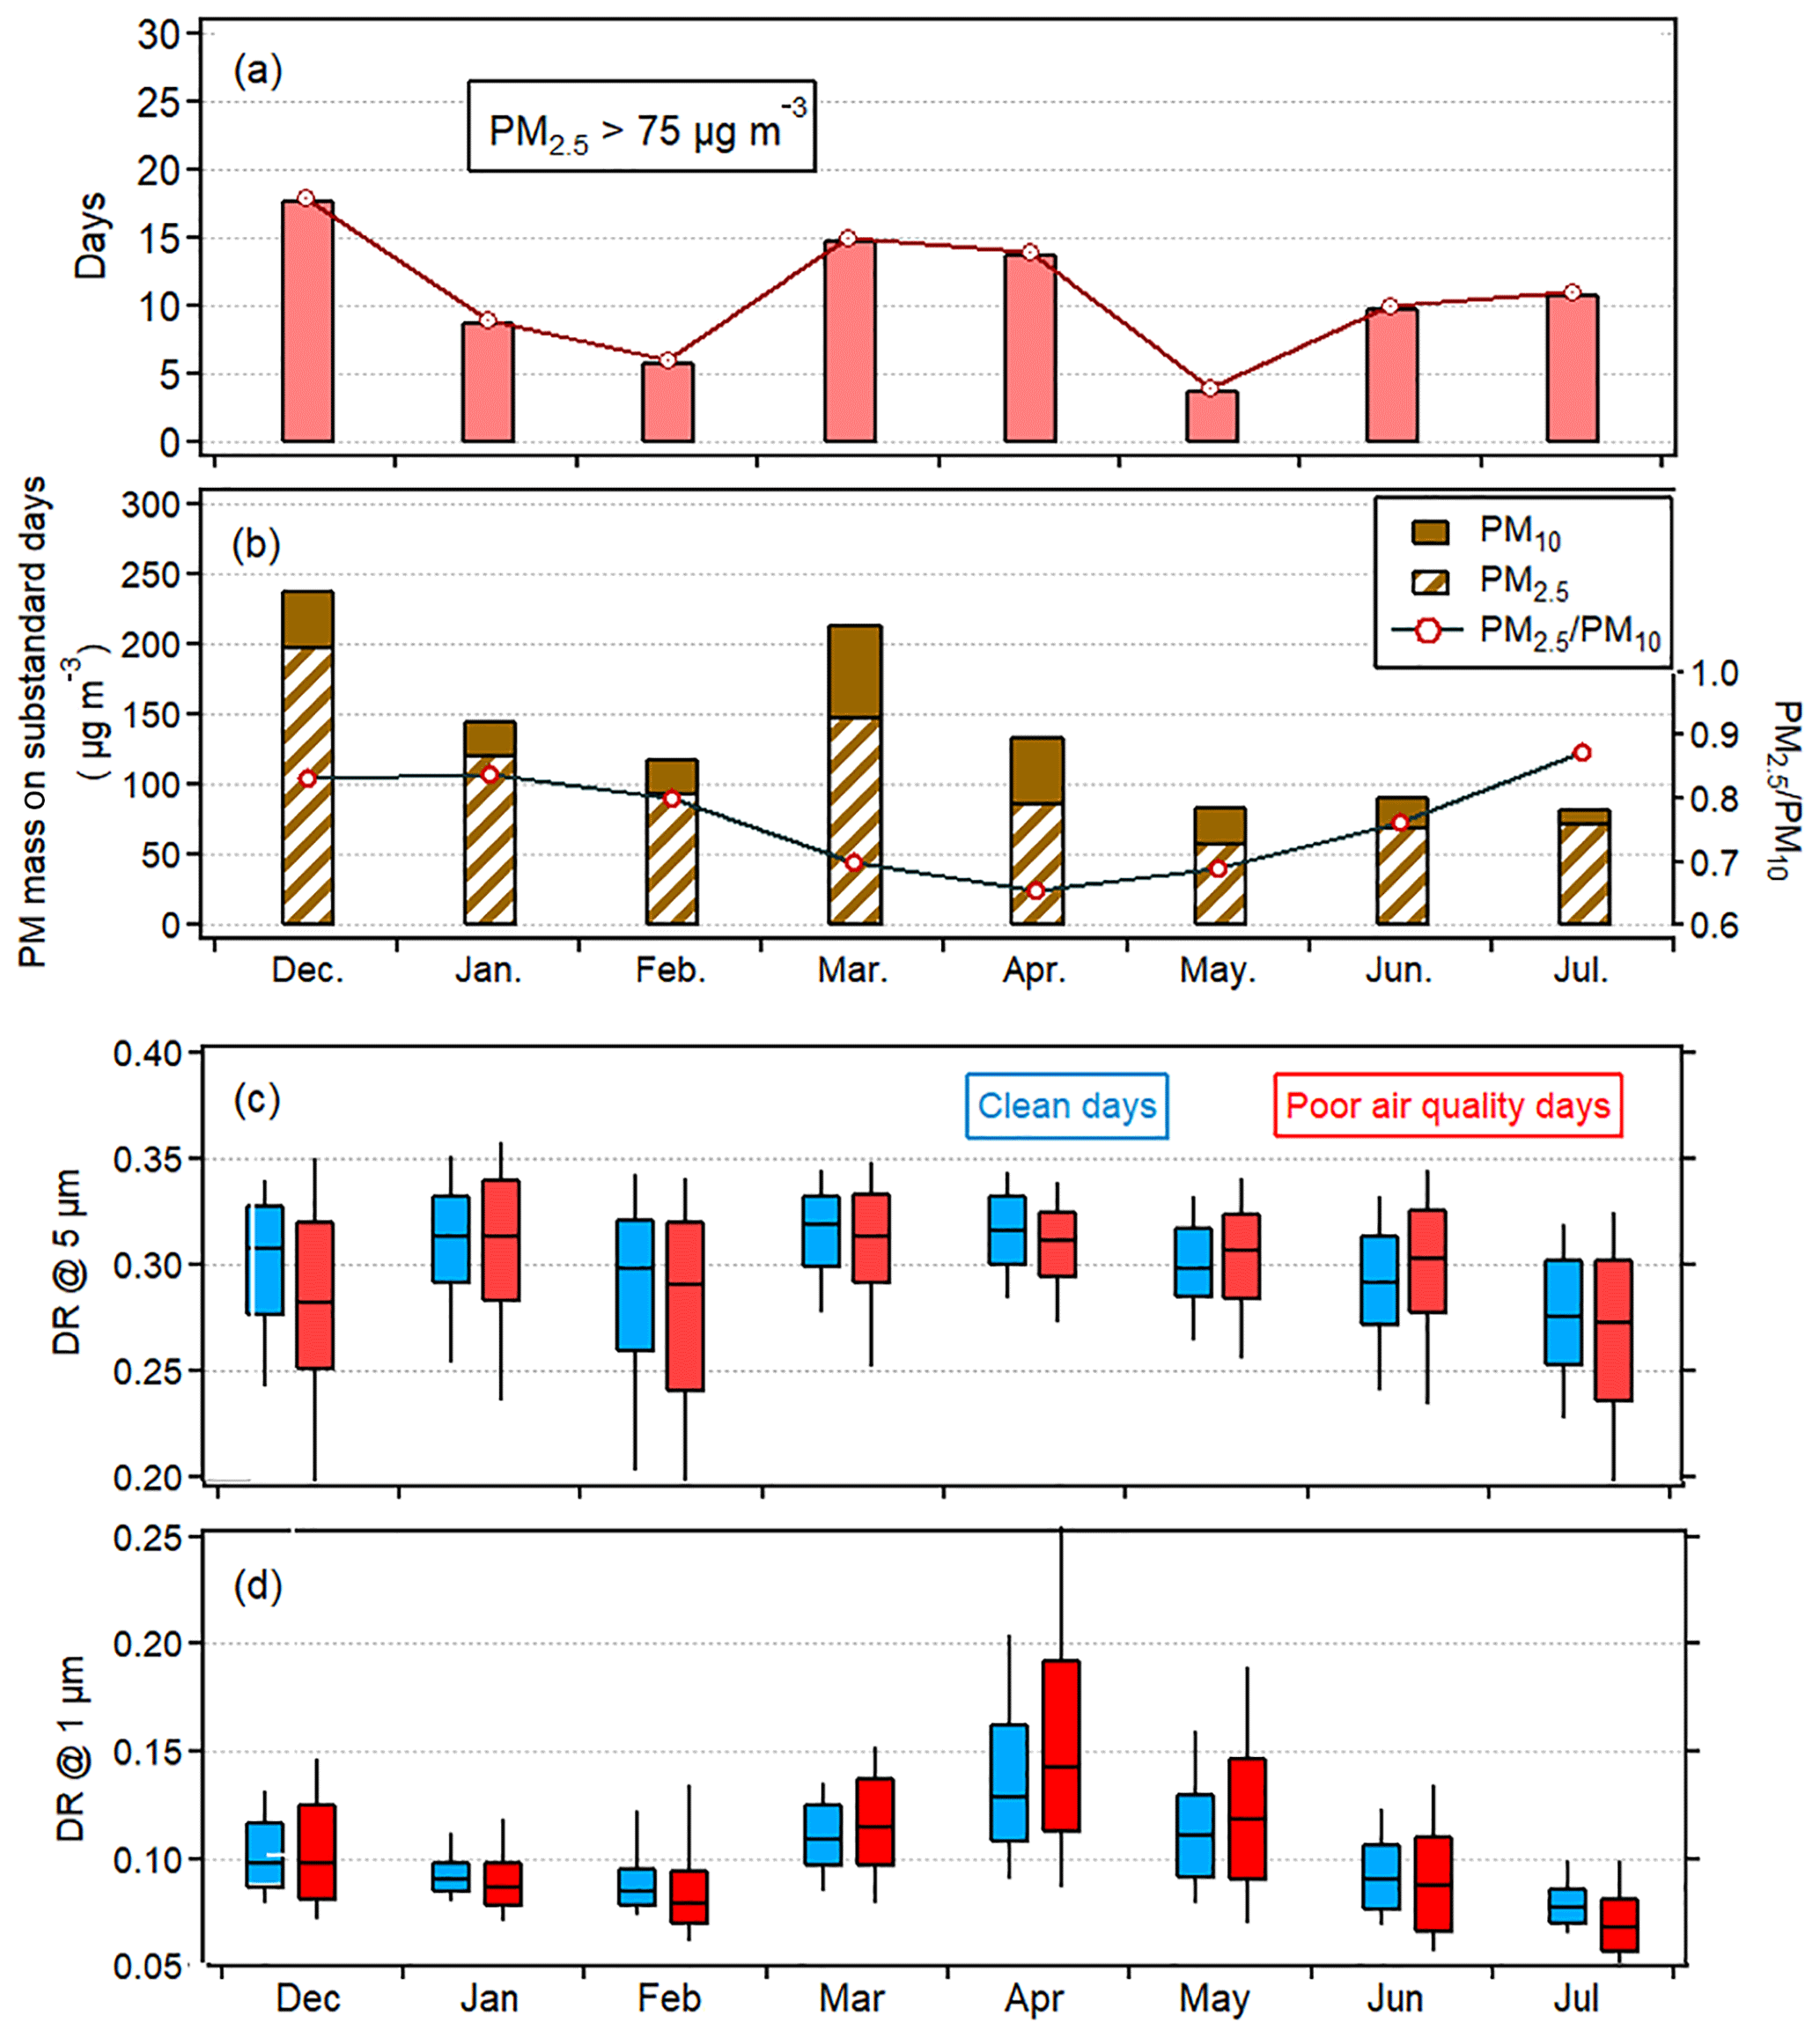
Figure 5(a) The number of poor air quality days, (b) daily averaged mass concentration of PM2.5 and PM10 on the poor air quality days and the ratio of PM2.5 ∕ PM10, (c) a box plot of particle δ values of Dp = 5 and (d) Dp = 1 µm on clean days (PM2.5 < 35 µg m−3) and poor air quality days.
The peak of δ value of the particles at Dp = 1 µm occurred in April, 0.15±0.03 (0.13±0.02) on substandard (clean) days (Fig. 5d). The high 90th percentile value indicated that the observation site was influenced by several intensive dust events in spring. Anthropogenic pollution was dominant on substandard days in summer for which PM2.5 accounts for 0.76 and 0.87 in PM10 in June and July. The δ value of aerosols at Dp = 1 and 5 µm in summer was 0.07±0.01 and 0.27±0.03, and there was no apparent difference for substandard and clean days. This was because under the humid and high oxidizing environment in summertime, catalyzing processes (Nie et al., 2012; Dupart et al., 2012) on the surface of mineral dust aerosols affect the hygroscopicity of dust and affect the evolution of particle morphology. Previous studies found that mineral dust coexisting with NOx can promote the conversion of SO2 to sulfate (He et al., 2014). Nie et al. (2014) also found that mixed plumes provide abundant reactive species, and dust-induced photocatalytic reactions accelerate oxidization in SO2 and volatile organic compounds (VOCs). This implies that it is highly likely that pollution days in northern China induce internal mixing of dust and pollutants, especially in a high humid atmospheric environment, and dust-related heterogeneous processes on the dust surface can aggravate the deterioration of air quality as a feedback.
3.5 δ value of different types of aerosols
Li et al. (2011) showed that the surface of mineral dust aerosols provides a suitable space for heterogeneous reactions with gaseous pollutants, leading to changes in the size, shape and chemical components. On the basis of depolarization properties of single particles, the evolution of the mixing state of dust particles could be estimated properly. Here, three pollution cases were carefully chosen considering the variation of both the volume size distribution and the δ value: anthropogenic pollution, a typical dust-dominant case and a mixed-type pollution period (coexistence of anthropogenic pollutants and dust particles in the atmosphere that caused severe air pollution). They are denoted as case A on 22–23 December 2015, case B on 9–10 April 2016 and case C on 4–6 March 2016, respectively. The vertical profile of the extinction coefficient and the depolarization ratio are shown in Fig. 8, and the evolution of depolarization properties of dust particles was simultaneously observed by POPC. In this study, we simulated a 5-day footprint region of air mass based on the FLEXPART model. The inert particles were released at 09:00 UTC each day on 23 December 2015, 9 April 2016 and 4 March 2016. The releasing point was at LAPC in Beijing at 150 m above ground level. The footprint regions for the three cases are shown in Fig. 6a–c. The variation of the volume concentration of particles as a function of both the δ value and particle sizes is depicted in Fig. 6d–f. For better comparison, the standard volume concentration was normalized to a maximum value of 1 using the following formula: normalized value = (truth value – minimum) ∕ (maximum – minimum).
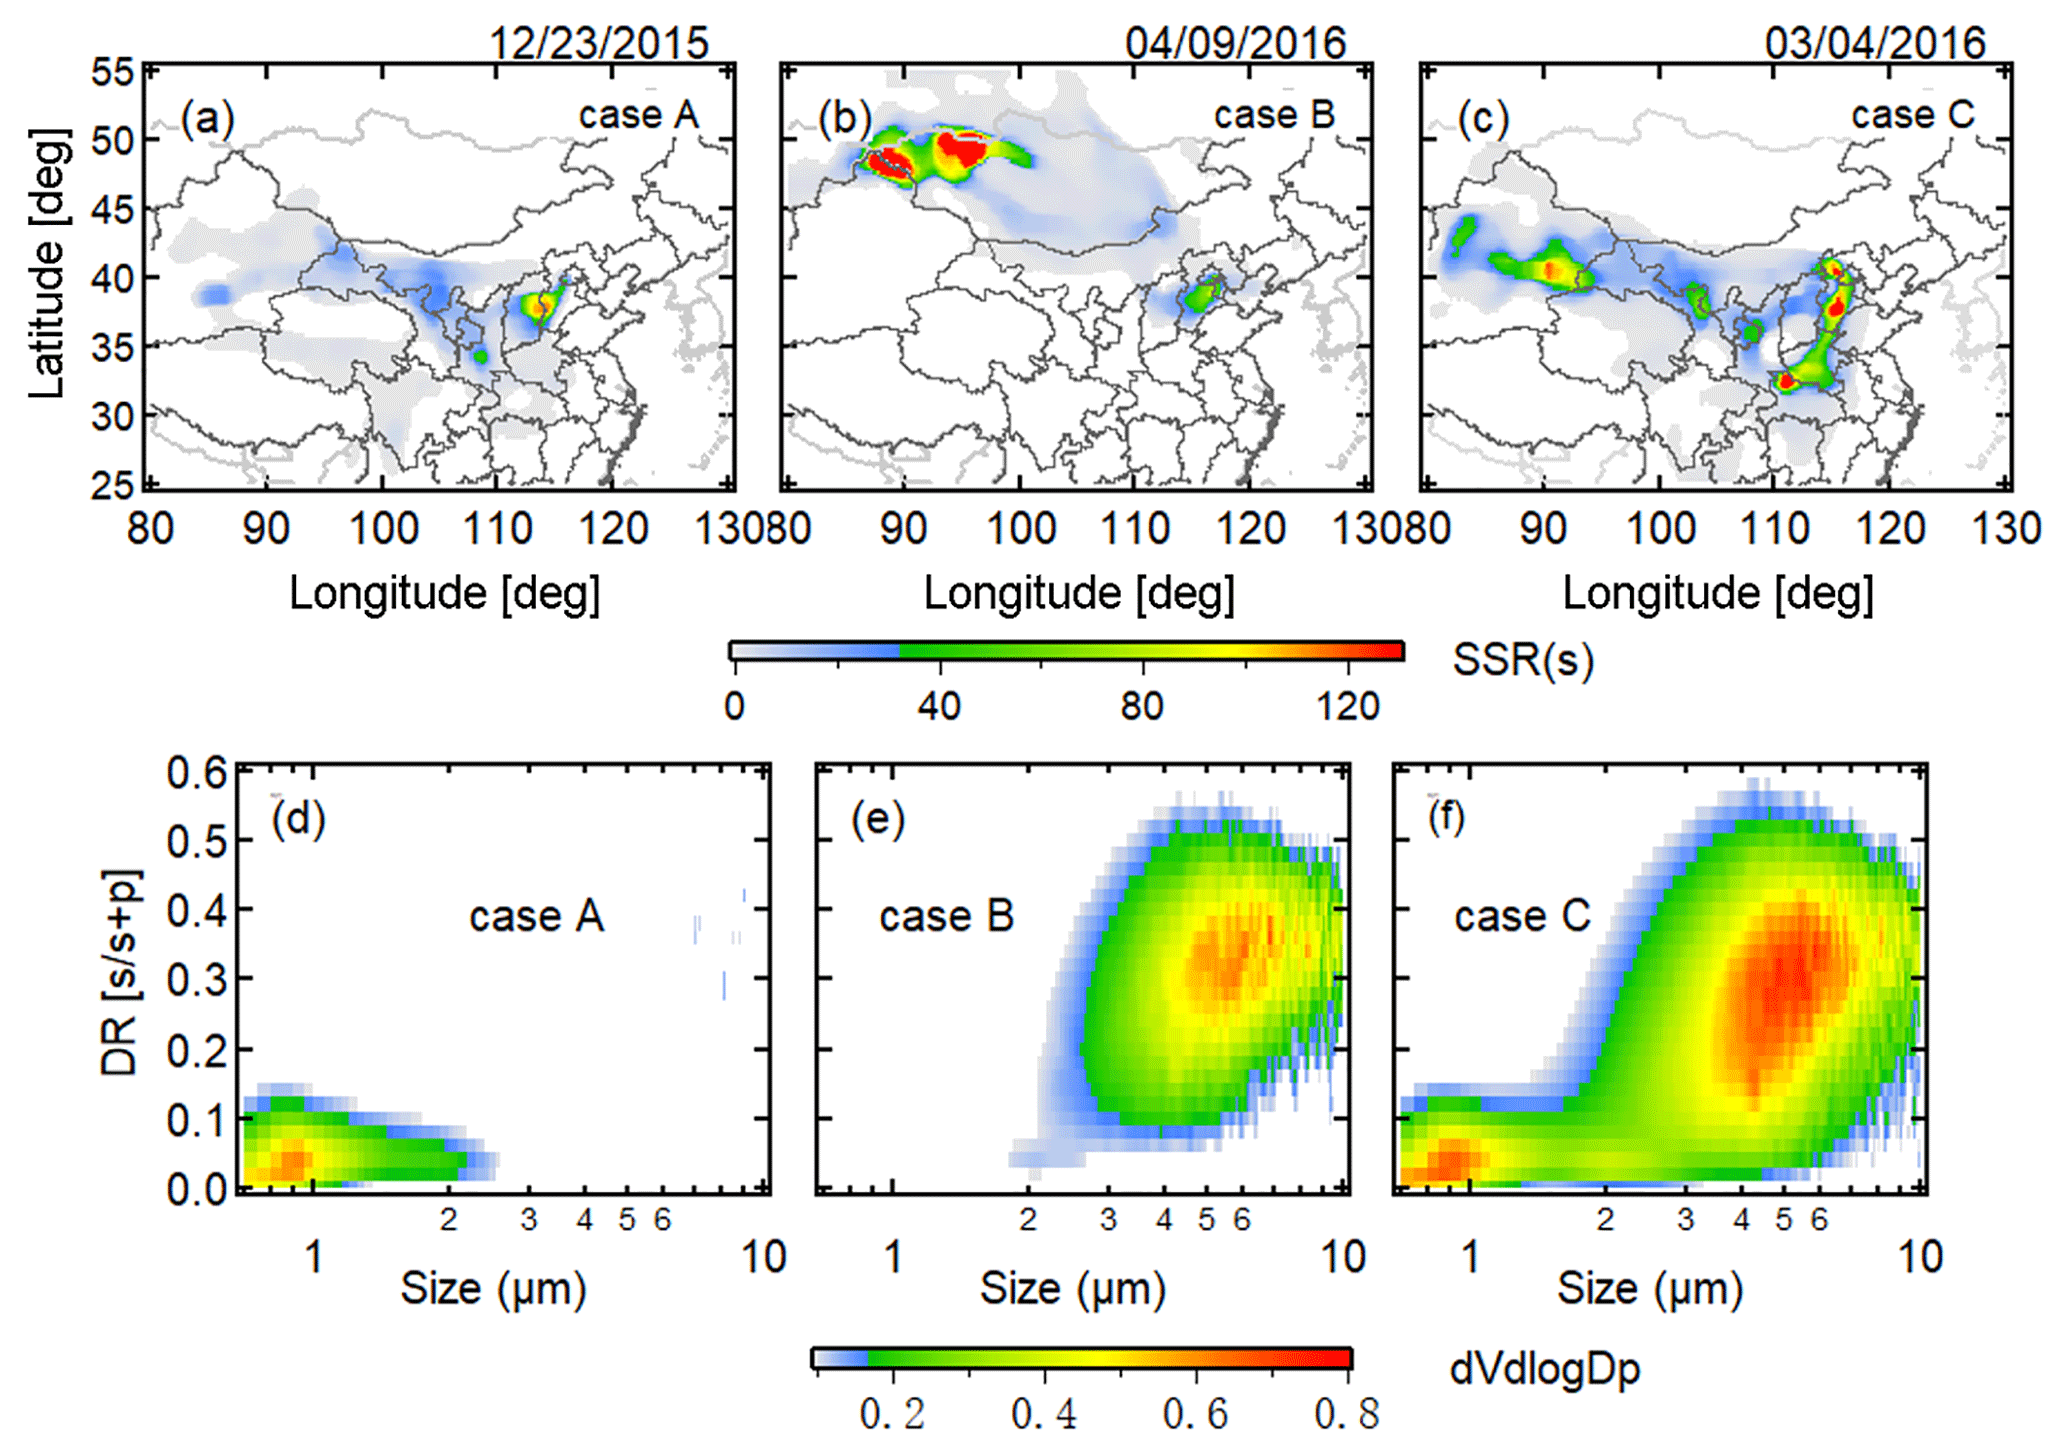
Figure 6Backward trajectories from Beijing calculated by the FLEXPART dispersion model for (a) the anthropogenic pollution case, (b) the dust-dominant case and (c) the mixed pollution period. Variation in the standard δ value as a function of particle size is shown for corresponding episodes: (d), (e) and (f).
3.5.1 Anthropogenic-pollution-dominant period
In case A, daily-averaged PM2.5 was 281.3 µg m−3, with a PM2.5 ∕ PM10 ratio of 0.72. The volume concentration of particles in this period had a peak in the submicron range, with a δ value of < 0.1 (Fig. 6d), reflecting the predominance of secondary formation pollutants. As shown in Fig. 7, the δ values of particles with Dp less than 2 µm were normally less than 0.12 and increased gradually to ∼0.27 (Dp > 4 µm), implying the influence from dust aerosol, even in the typical anthropogenic-pollution-dominant period. The footprint of air mass covered the west of the North China Plain, which is characterized by heavy industrialization and high emissions (Zhao et al., 2012). As suggested by many previous studies (Ilten and Selici, 2008; Wang et al., 2013; Zhang et al., 2016; Chang and Zhan, 2017), unfavorable meteorological conditions played an important role in the occurrence of severe pollution. In case A, the RH ranged 80 % and 90 % from 00:00 LST on 22 December to 12:00 LST on 23 December, and diffusion conditions were weak (wind speed < 1.5 m s−1) (Fig. S7). Air mass was mostly stagnant within a high emission region, resulting in the substantial formation of secondary pollutants from primary pollutant precursors in the atmosphere (Wang et al., 2014).
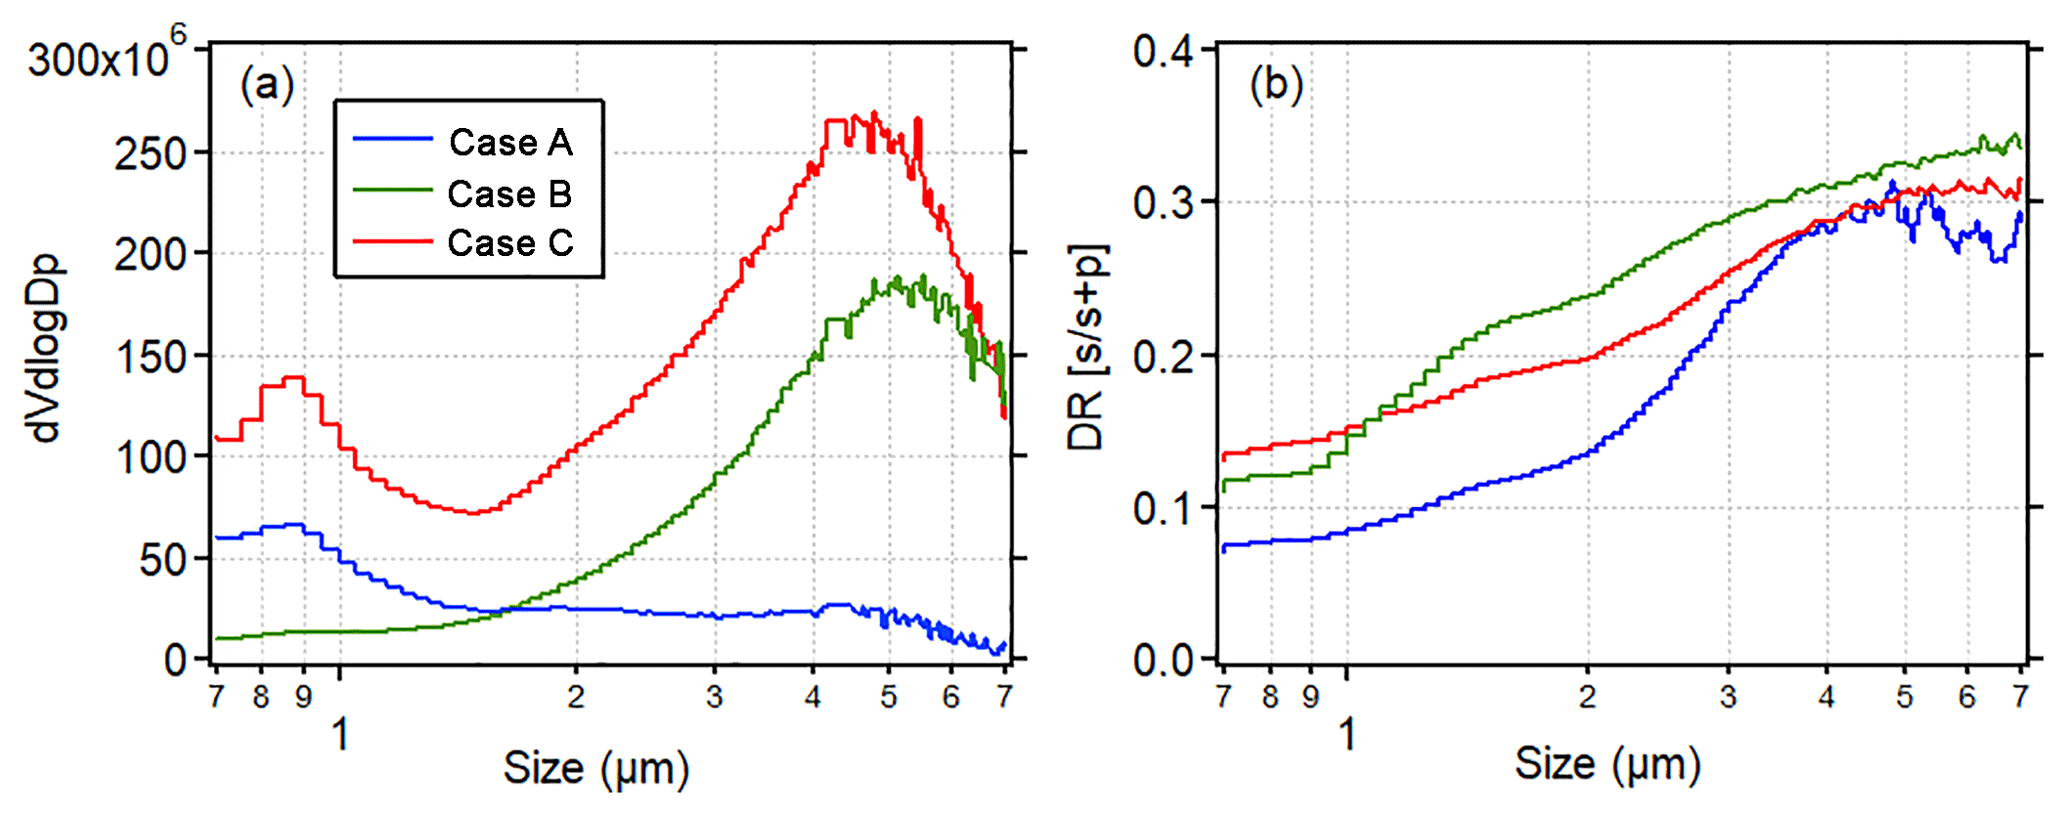
Figure 7(a) Volume and (b) δ value size distribution of aerosols observed in the study cases.
3.5.2 Dust-dominant case
The typical dust-dominant case occurred on 9–10 April 2016. The main body of the dust plume arrived at the site on 9 April with a daily-averaged PM10 of 273.6 µg m−3 and a PM2.5 ∕ PM10 ratio of 0.33. Footprint analysis shows that air mass originated from western Mongolia and was transported rapidly by a strong wind (∼5 m s−1). The vertical structure of the dust extinction coefficient determined by ground-based lidar measurement indicated that the dust plume presents a layered structure when it arrived at the observation site (Fig. 8a–b). The lowest dust layer in the altitudes < 700 m first arrived at Beijing at 06:00 LST on 9 April containing a huge amount of coarse-mode particles, with hourly averaged PM2.5−10 reaching 395 µg m−3 at noon. This layer was lifted up and became mixed with the dust layer at a height of 1 km in the afternoon of 9 April. The impact of anthropogenic pollutants on this dust event was weak for a smaller amount of pollutants. POPC analysis shows no feature of internally mixed dust particles. The dVdlogDp has a peak at 5 µm with a mean δ value of 0.34, consistent with the result in western Japan (Pan et al., 2015). The δ values of aerosols in coarse mode were found to be about 3 times larger than the calibration result (0.07–0.1) for standard spherical aerosols (Fig. S2), which suggests the coarse-mode particles at the site were nonspherical. Note that the δ values (0.18±0.02) of particles in fine mode were twice higher than those during the anthropogenic-pollutant-dominant case, indicating the presence of irregular dust particles.
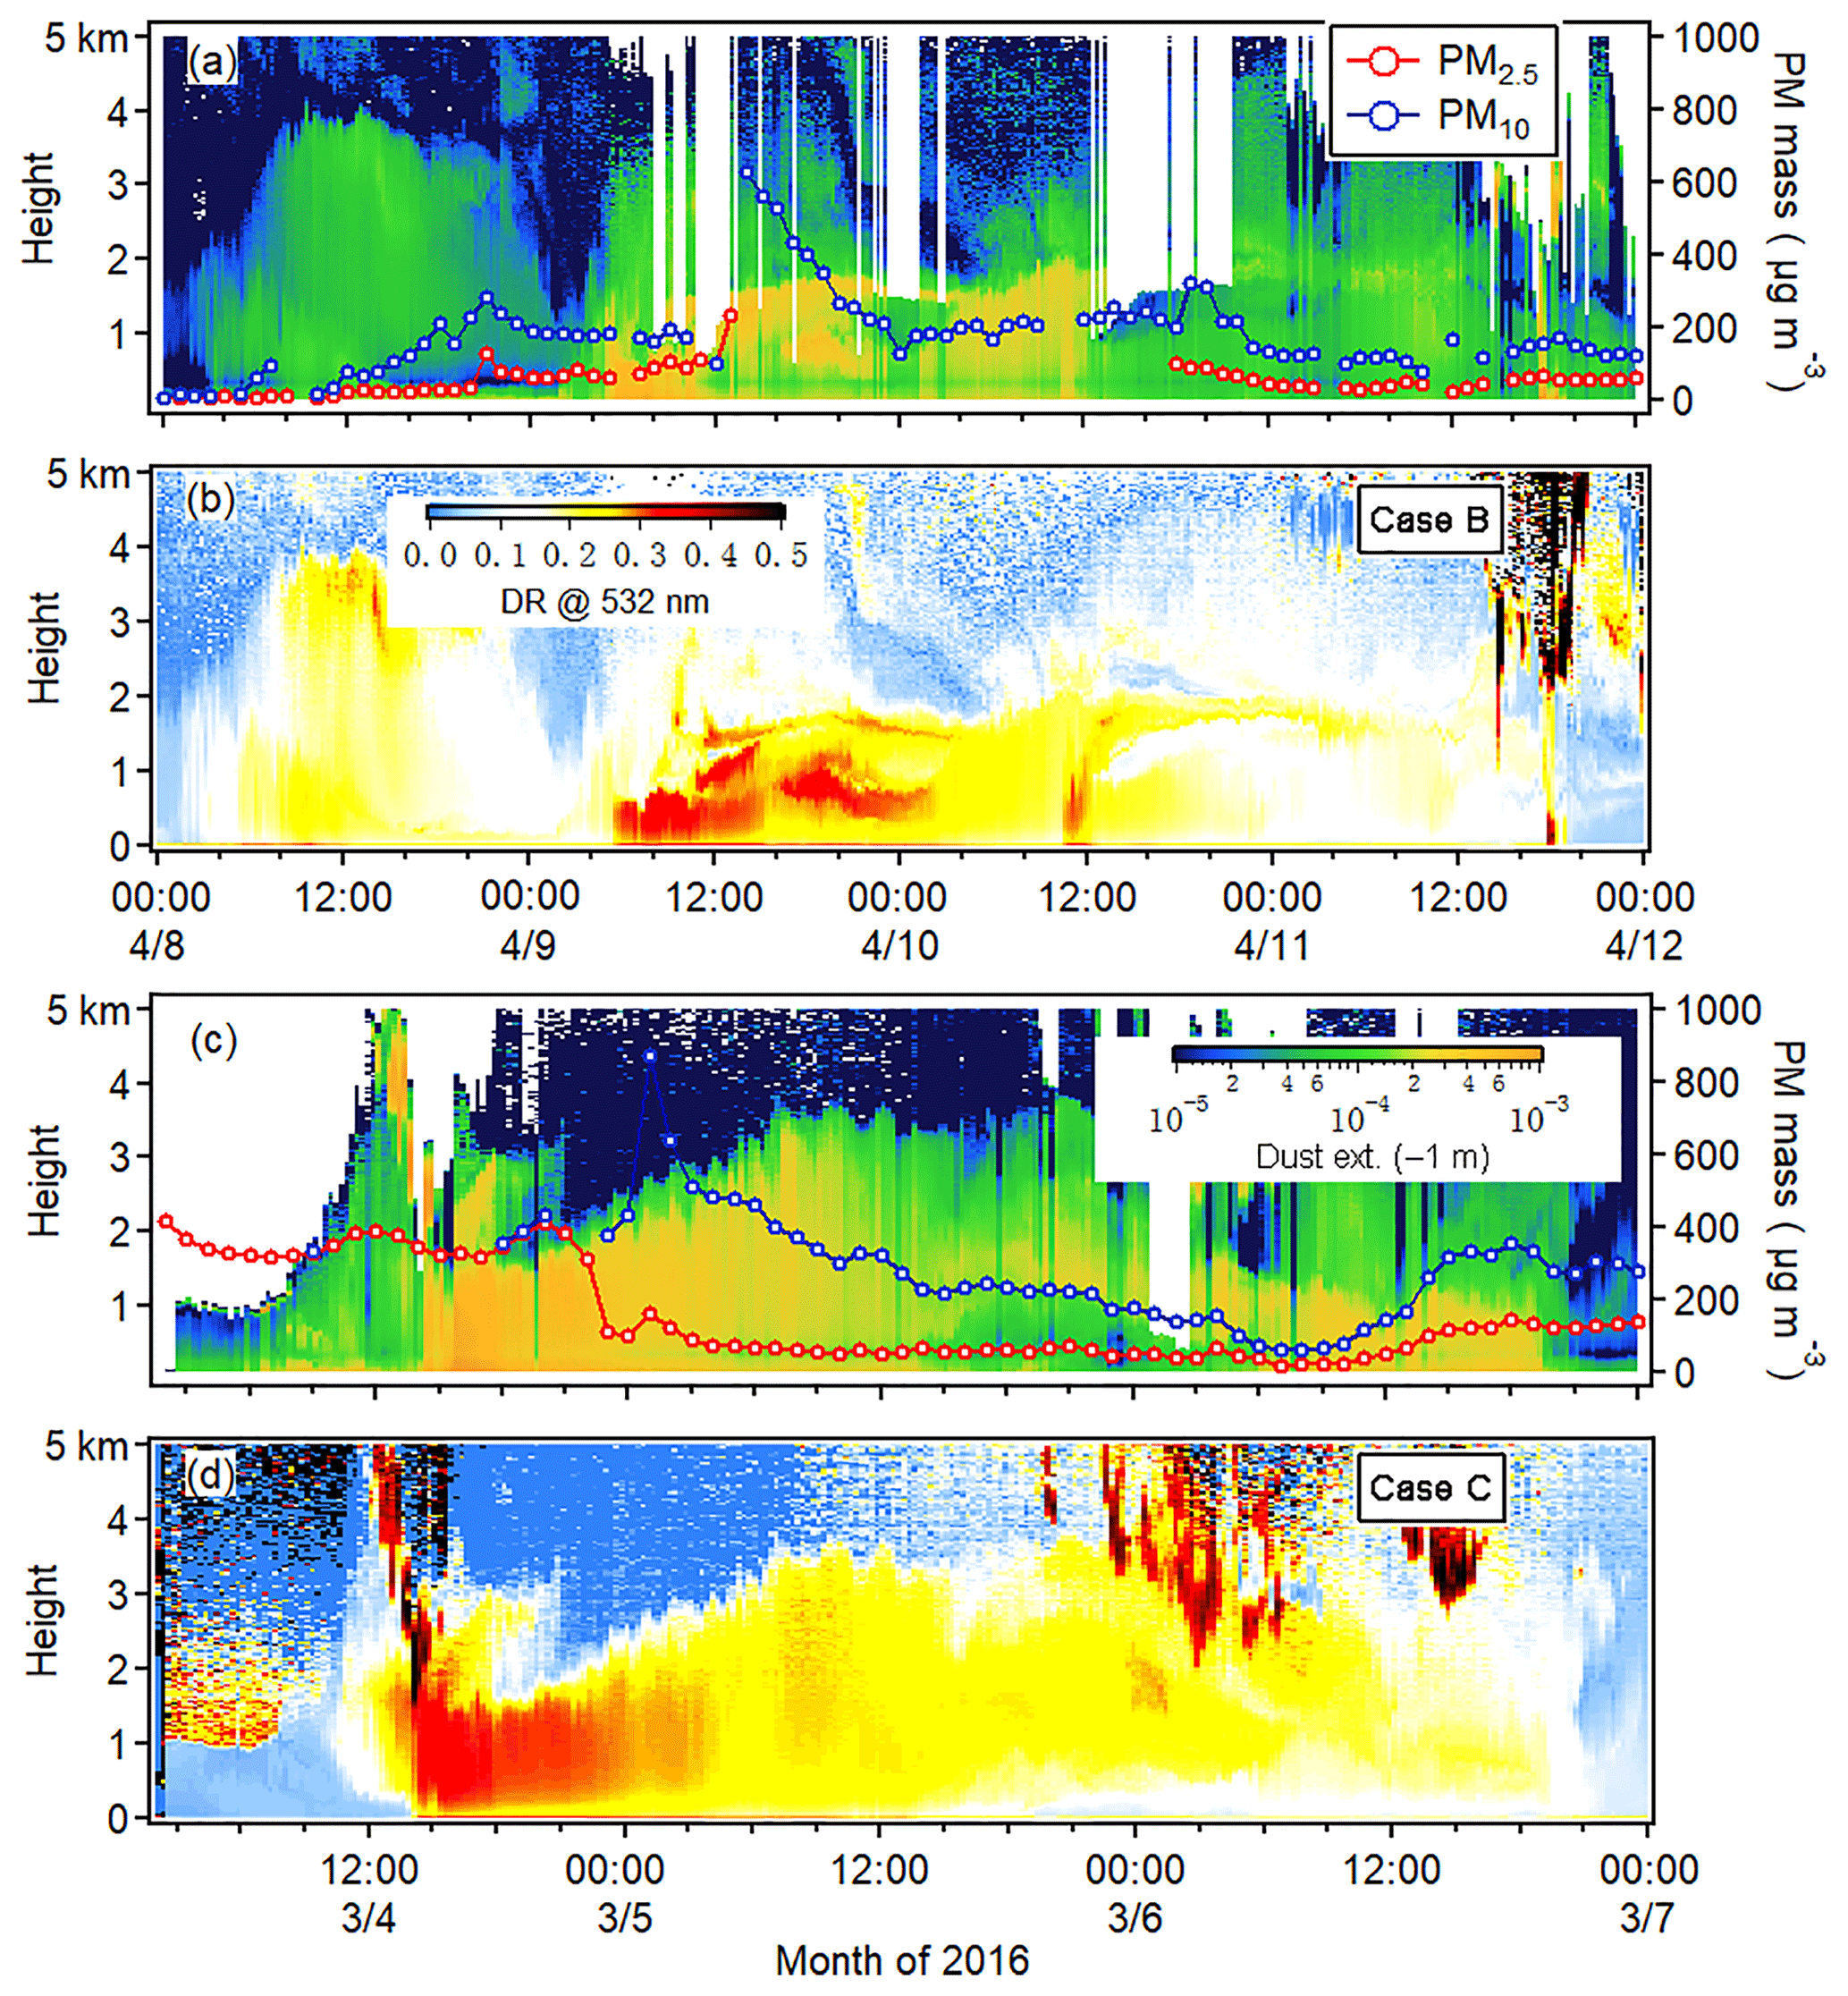
Figure 8Time–height indications of the dust extinction coefficient and the δ value at 532 nm derived from polarization-sensitive lidar measurement in Beijing in case B and case C.
3.5.3 Mixed pollution case
During the occurrence of the dust event on 4 March, daily-averaged PM10 was 376.3 µg m−3 and PM2.5 ∕ PM10 was 0.19, and the dust plume existed at an altitude of up to 3.5 km on 5 March. At 12:00 UTC on 5 March, the main body of the dust plume descended to an altitude of less than 1.5 km (Fig. 8c). The PM2.5 ∕ PM10 ratio concurrently increased to 49 % because of mixing with a higher concentration of pollutants and the rapid gravitational settlement of large particles. The δ value (0.28) for particles at 5 µm decreased 17.6 % at midnight on 5 March compared to 0.34 on 4 March (Fig. S8). The 5-day back trajectory implied that the air masses were from a convergence air flow of deviating northwest and south streams, being affected by both mineral dust in midwestern China and emissions of anthropogenic pollution in eastern China. The dV∕dlogDp in case C has two peaks in both the submicron range (0.9 µm) and the coarse-mode range (4.5 µm), corresponding to δ values of < 0.1 and 0.3±0.2 in Fig. 6f. Note that the averaged δ value for particles at Dp larger than 4 µm was about 0.3, which is 11.8 % lower compared to case B. T matrix simulations indicated that the aspect ratios of the dust particles were estimated to be 1.48 (δ = 0.30) (Fig. S9), presuming that the dust particles had a spheroid shape.
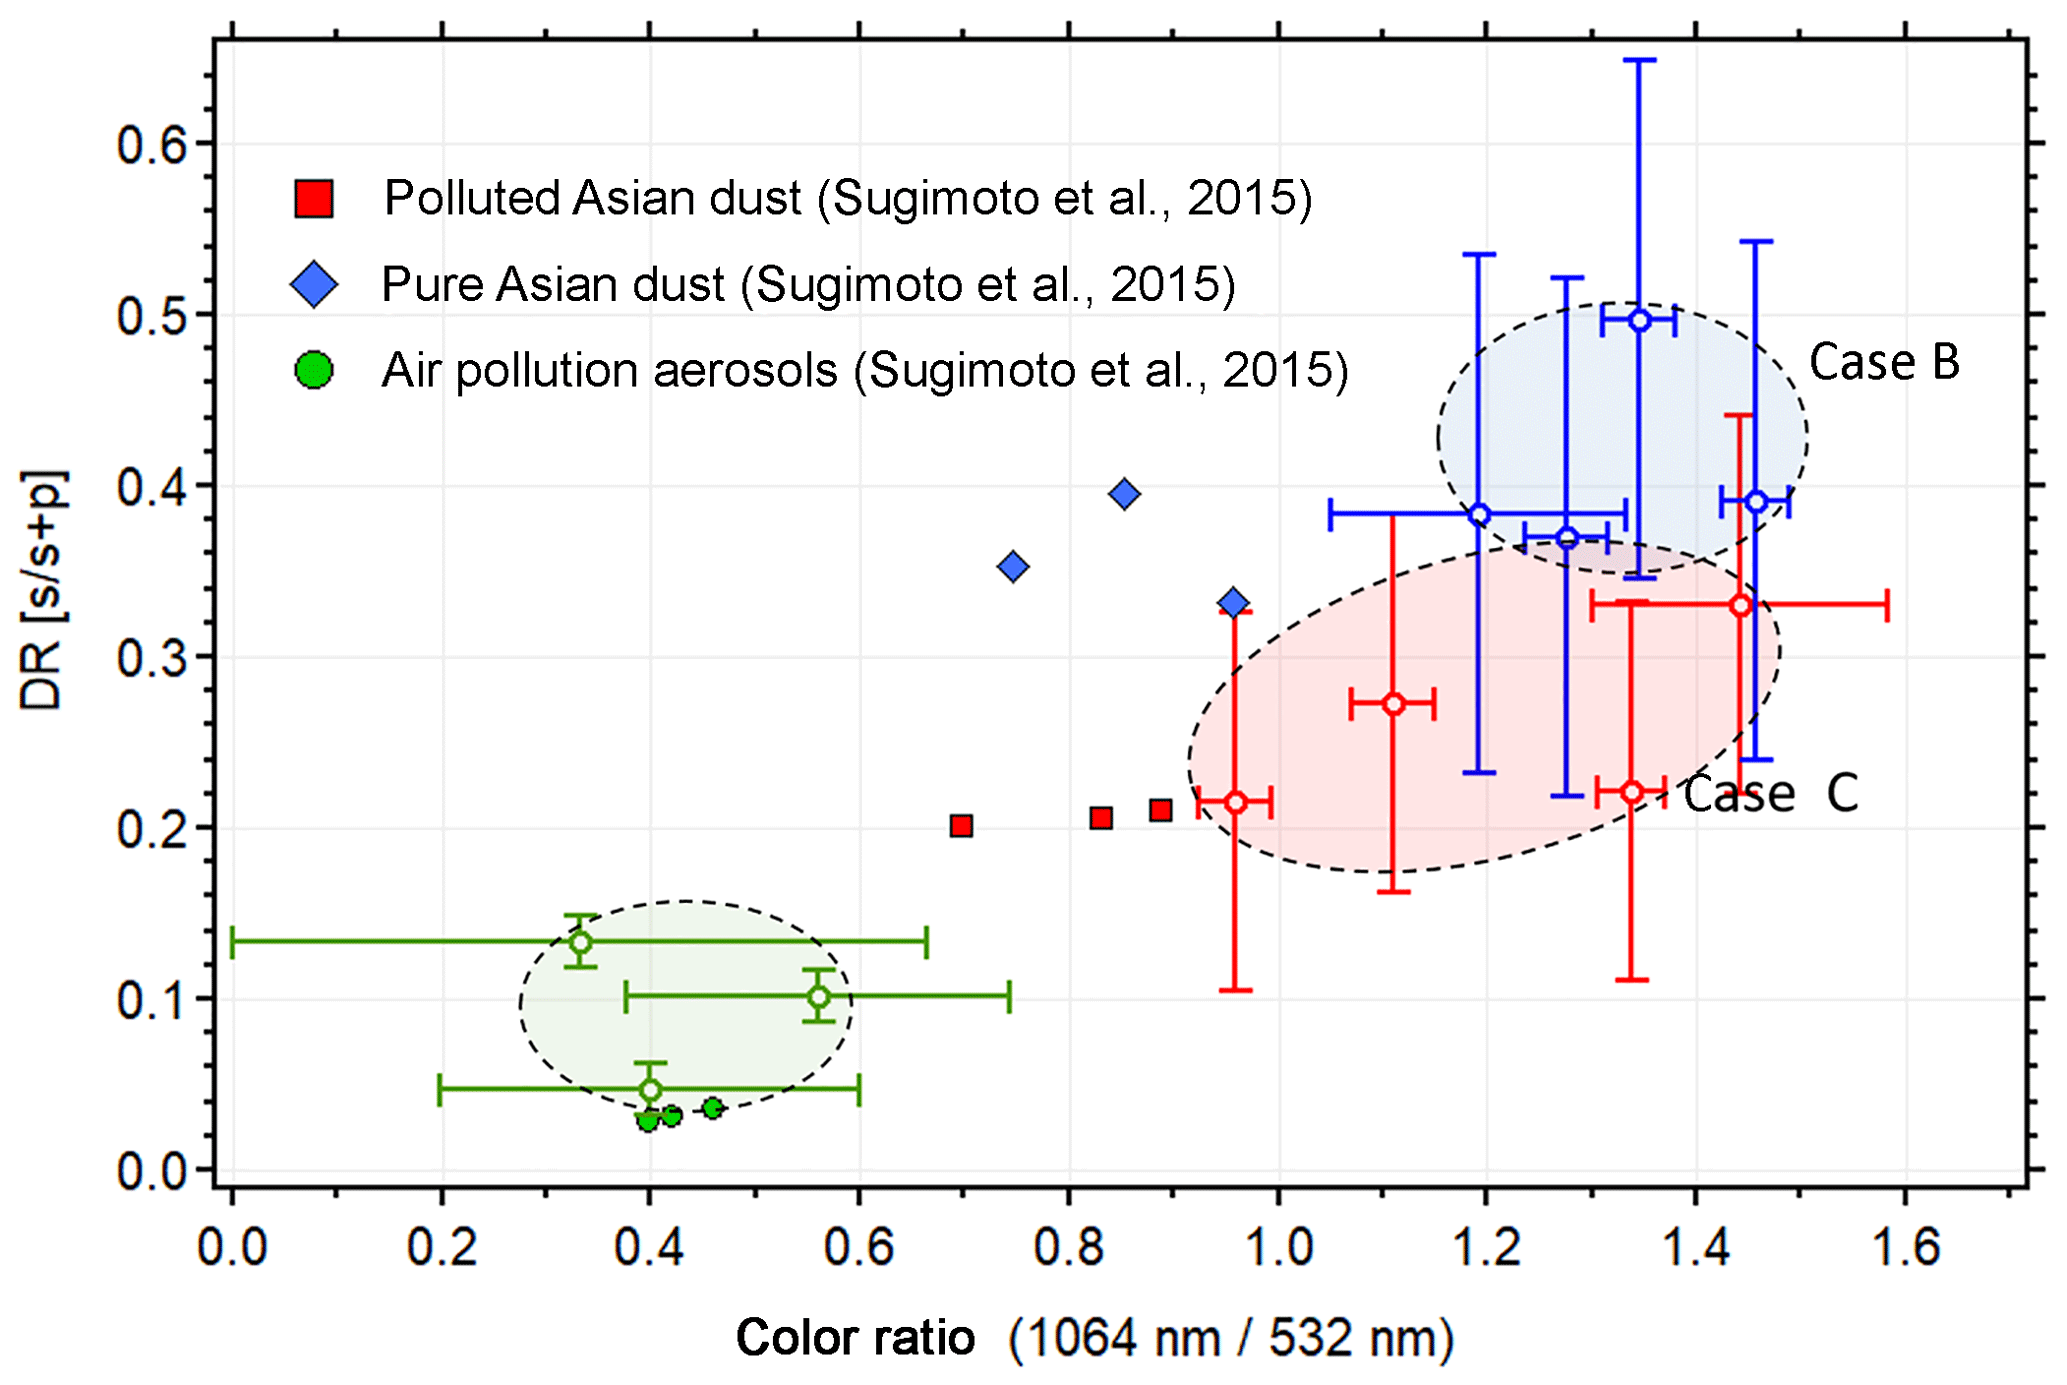
Figure 9Scatter diagram between the backscattering color ratio (1064 nm/ 532 nm) and the particle depolarization ratio at 532 nm for case B (dust-dominant case) and C (polluted dust case) and an anthropogenic-dominant case. The error bars indicate estimates of statistical error. The observations results in Seoul in a previous study are displayed in the plot.
Figure 9 shows the scatter diagram of the averaged particle depolarization ratio at 532 nm versus the ratio of the backscattering coefficient at 1064 nm ∕ 532 nm on the two dust cases and the anthropogenic-dominant case according to lidar measurement. For comparison, the results from an observation study of mixed-type pollution in Seoul (Sugimoto et al., 2015) were also plotted in the figure. As shown, the daily averaged δ value for dust aerosols in case C was 0.26±0.1, with a backscattering averaged color ratio of 1.21±0.4. It was ∼36.6 % lower than the δ value in case B (0.41±0.14), but the color ratio (1.32±0.14) was relatively consistent with case C. The air pollution aerosols had a color ratio of 0.32±0.25 and a δ value of 0.1±0.05. The results of the δ value in pure dust and polluted dust plume were similar to the study in Seoul, even though the coarse-mode aerosols observed in Seoul had a smaller size range due to the gravitational settlement of large particles during longer range transport. One possible reason for the decrease in the δ value was that the mineral dust was involved in the internal mixing process through the trapping or heterogeneous reactions. However, we cannot eliminate the possibility that the decrease of δ was just caused by the external mixing of a huge amount of dust and anthropogenic pollutants. Because lidar observations only provide an averaged δ value of all the particles in the detecting volume, the external mixing of dust particles with substantial amounts of spherical secondary anthropogenic particles could also result in a lower δ value. This means the environmental impact of transported Asian dust in polluted areas in East Asia may be underestimated since the shadow area of lidar improperly recognizes polluted dust particles.
3.6 Implication on heterogeneous processes on dust particles
Coarse-mode particles observed in northern China were reported to contain a large amount of Ca (Yuan et al., 2006; Geng et al., 2014), generally existing in the form of CaCO3 (component of calcite), which is the most widely investigated component of mineral dust particles. Previous studies indicate that the interaction between water vapor and CaCO3 particles was significant. Hatch et al. (2008) showed that the mass of adsorbed water on CaCO3 is equal to ∼8 % of the mass of dry CaCO3 particles at 78 % RH. Studies also found that one–nine monolayers of adsorbed water are formed on CaCO3 particles at 50 %–95 % RH (Gustafsson et al., 2005; Ma et al., 2012). Actually, the composition of dust particles is complex and may also contain SiO2 (component of quartz, illite, feldspar), Al2O3 (illite), CaO (feldspar) and aluminosilicate (kaolinite), etc. These substances are comparatively insoluble and not sensitive to water vapor in the air (Tang et al., 2016). This means the heterogeneous reactions and trapping process on the dust surface were closely related to the dust sources and residential time in the atmosphere. For example, Wang et al. (2011) found that the ratio of the Ca component in mineral dust in Beijing was high when air mass was from the Loess Plateau, while chemical components of dust from desert areas contained more crustal element oxides such as SiO2, Al2O3 and Fe2O3 (Ta et al., 2003). Dust with inert components requires longer transport or residential times before the morphology changes.
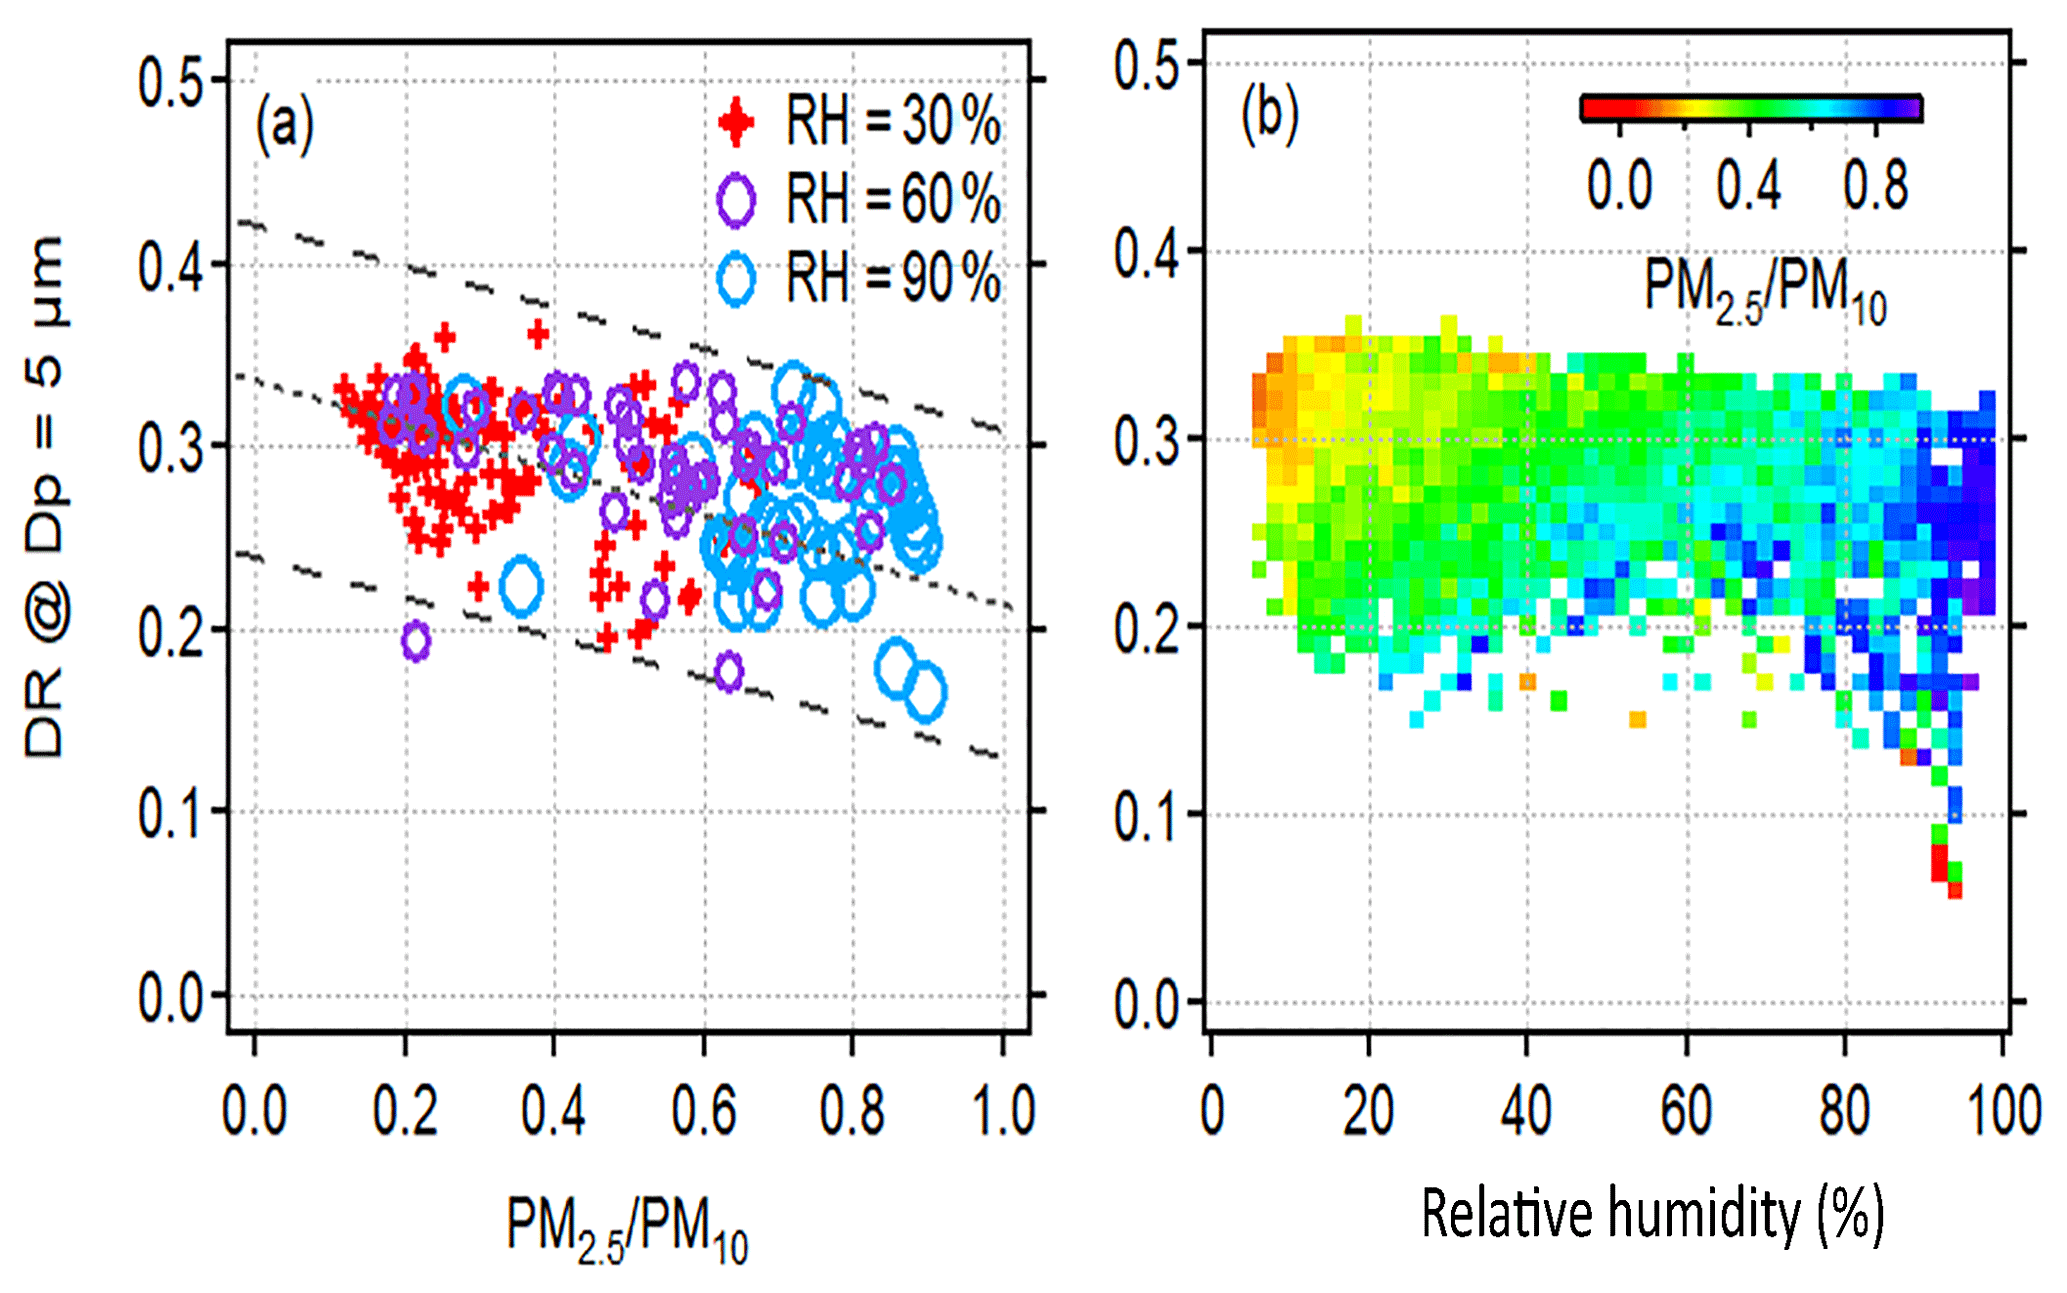
Figure 10Scatter diagram of the relationship between the δ values of dust particles (at Dp = 5 µm), vapor content (RH) and PM2.5 ∕ PM10 in the air.
Here, we investigate the vital roles that ambient air humidity and air pollution content in the air played in the morphological changes of dust particles in Beijing area. The high PM2.5 ∕ PM10 ratio indicates that the components of soluble inorganic salts or reactive gases loading in the atmosphere were highly likely to be relatively high in the case of high humidity. It also indicates a high collision probability between pollutants and dust. Therefore, the morphology and corresponding δ values of particles should be affected. According to our 8-month observation in Beijing, the δ value had a general trend of increasing with particle size but decreasing with the PM2.5 ∕ PM10 ratio (Fig. S10). The extent of the decrease was not equal for different particle sizes: for particles at Dp = 5 µm, the δ value was ∼0.3, while PM2.5 ∕ PM10 was less than 0.6 and decreased by ∼20 % when PM2.5 ∕ PM10 increased to 1; for particles at Dp = 1 µm, the δ value decreased by 42.9 % from 0.14 to 0.08. In fact, atmospheric humidity played a vital role in the observed δ value decrease. Figure 10 shows the relationship between the δ values of dust particles (Dp = 5 µm), vapor content (RH) and PM2.5 ∕ PM10 in the air. It can be seen that the δ value of particles in coarse mode decreased as the PM2.5 ∕ PM10 ratio increased, especially under high RH conditions. For particles at Dp = 5 µm, their δ value was generally 0.28–0.35 when the ambient air was dry (RH < 10 %), and it decreased by ∼28.6 % when the ambient RH increased to > 90 %. The δ value of particles at Dp = 3 µm decreased by ∼36.4 % (Fig. S11). For small dust particles, the interaction of water vapor and pollutants on the surface was more obvious in the change of morphology and reduction in δ value. This negative relationship reflected the spheroidization of the dust particles as a result of the hygroscopic properties of mineral dust aerosols. Polluted air generally contains abundant HNO3 (Liang et al., 2007; Shi et al., 2014). Li and Shao (2009) reported that mineral particles were mainly covered with coating including Ca(NO3)2, Mg(NO3)2, and NaNO3 in northern China. Deeper interaction between alkaline mineral dust and reactive acidic gases and the trapping process of atmospheric secondary inorganic salt modified the hydrophilic state of dust aerosols. According to Sullivan et al. (2009), pure CaCO3 with a diameter of ∼2 µm needs supersaturation values of 0.6 to 0.9 to be activated, while the soluble salts of Ca(NO3)2 and CaCl2 are more likely to be activated with supersaturation values ranging from 0.07 to 0.4. This means that the more dust particles become involved in chemical mixing or coagulation processes, the more easily they become hydrophilic and are incorporated into cloud processes and affect regional and global climate (Shi et al., 2008; Koehler et al., 2009). Further, the theoretical simulation of Ishimoto et al. (2010) indicated that a change in refractive index could also affect the δ value; the simulation results depicted that the δ value showed a leveling off tendency at 0.31±0.02 for the coarse modal particles (Fig. S12), which means variations in the particle's refractive index can only explain limited depolarization variability (6 %). At present, observation studies for single-particle δ values combined with aerosol chemical composition analysis are still few in number. To clarify that the chemical process happened during mixed pollution, more observational and experimental results in the lab are needed.
Interactions between mineral dust and anthropogenic pollutants have a great impact on physical properties and the climate effect of dust particles in East Asia. In this study, a long-term observation of atmospheric aerosols in the megacity of Beijing from 29 November 2015 to 29 July 2016 was performed using an optical particle counter equipped with a polarization detection module (POPC). Combined with trajectory and dispersion model analysis, the temporal variability of depolarization characterization of aerosols, the mixing state of dust particles, and their effect on local air quality were investigated. The major conclusions are as follows: (1) The depolarization ratio (δ) of particles in urban Beijing has significant seasonal variabilities due to different components and origins of aerosols. The averaged δ value of particles in both fine and coarse mode was highest in March 2016 (0.26) and lowest in July 2016 (0.19). The seasonal variation of the δ value in fine-mode particles (<2 µm) showed a more pronounced winter and spring high and summer low pattern owing to emissions as well as weather conditions in different seasons. During the substandard days in Beijing, the decrease of δ value of particles in coarse mode implied the internal mixing of mineral dust and pollutants, especially under humid atmospheric conditions. (2) Although both lidar and POPC could identify the impact of dust aerosols, single-particle-based depolarization measurement could provide more accurate information about the sphericity of particles, which could indicate the possible modification of the morphology of particles as a result of mixing processes. Through case studies on the evolution of a typical Asian dust event, we found that the δ of dust particles obtained by POPC could decrease by 17.6 % with the mixing effects of pollutants. The volume δ value measured by lidar also showed an obvious decreasing trend; however the interference of a substantial amount of small spherical anthropogenic pollutants makes it difficult to evaluate their interactions. During a typical polluted dust event, the shape of mineral dust can be modified as a result of heterogeneous processes. In this study, the δ value of particles at Dp = 5 µm decreased by 28.6 % when RH increased up to 90 %. (3) These findings bring attention to the comprehensive study of the complex mixing processes and possible mechanisms of morphological change of Asian dust. In addition to lidar and satellites, single-particle-based depolarization measurement could provide a reliable detection method for separating aerosol types and investigating mixing processes of aerosol along the transport. This study also indicates the urgent need for a realistic optical model for predicting the physical changes of Asian dust particles during transport.
To request POPC data for scientific research purposes, please contact Xiaole Pan at the Institute of Atmospheric Physics, Chinese Academy of Sciences, via email (panxiaole@mail.iap.ac.cn).
The supplement related to this article is available online at: https://doi.org/10.5194/acp-18-18203-2018-supplement.
YT and XP designed the entire study and coordinated all of the analyses. TN examined the T-Matrix model calculation result and related discussion. HK guaranteed the operation of POPC. IU examined the discussion of Asian dust process. AS performed the lidar observation and provide related crucial parameter. And XW and ZW supported the field observation in Beijing. YT wrote the manuscript with valuable input from all of the co-authors.
The authors declare that they have no conflict of interest.
This work was supported by the National Natural Science Foundation of China
(grant no. 41675128 and 41620104008). Air quality data were provided by
the Ministry of Environmental Protection, and meteorological data were from the
Chinese meteorological department. The authors also thank the NCEP for
provision of the GDAS dataset, NILU for developing the FLEXPART transport and
dispersion model, and NCAR for exploiting the HYSPLIT model in collaboration with NCEP.
Edited by: Hang Su
Reviewed by: two anonymous referees
Akimoto, H.: Global air quality and pollution, Science, 302, 1716–1719, 10.1126/science.1092666, 2003.
Akimoto, H., Ohara, T., Kurokawa, J.-I., and Horii, N.: Verification of energy consumption in China during 1996–2003 by using satellite observational data, Atmos. Environ., 40, 7663–7667, https://doi.org/10.1016/j.atmosenv.2006.07.052, 2006.
Akyuz, M., and Cabuk, H.: Meteorological variations of PM2.5 ∕ PM10 concentrations and particle-associated polycyclic aromatic hydrocarbons in the atmospheric environment of Zonguldak, Turkey, J. Hazard. Mater., 170, 13–21, https://doi.org/10.1016/j.jhazmat.2009.05.029, 2009.
Cesana, G., Chepfer, H., Winker, D., Getzewich, B., Cai, X., Jourdan, O., Mioche, G., Okamoto, H., Hagihara, Y., Noel, V., and Reverdy, M.: Using in situ airborne measurements to evaluate three cloud phase products derived from CALIPSO, J. Geophys. Res.-Atmos., 121, 5788–5808, https://doi.org/10.1002/2015jd024334, 2016.
Chan, C. K. and Yao, X.: Air pollution in mega cities in China, Atmos. Environ., 42, 1–42, 10.1016/j.atmosenv.2007.09.003, 2008.
Chan, C. Y., Xu, X. D., Li, Y. S., Wong, K. H., Ding, G. A., Chan, L. Y., and Cheng, X. H.: Characteristics of vertical profiles and sources of PM2.5, PM10 and carbonaceous species in Beijing, Atmos. Environ., 39, 5113–5124, https://doi.org/10.1016/j.atmosenv.2005.05.009, 2005.
Chang, W. and Zhan, J.: The association of weather patterns with haze episodes: Recognition by PM2.5 oriented circulation classification applied in Xiamen, Southeastern China, Atmos. Res., 197, 425–436, https://doi.org/10.1016/j.atmosres.2017.07.024, 2017.
Dupart, Y., King, S. M., Nekat, B., Nowak, A., Wiedensohler, A., Herrmann, H., David, G., Thomas, B., Miffre, A., Rairoux, P., D'Anna, B., and George, C.: Mineral dust photochemistry induces nucleation events in the presence of SO2, P. Natl. Acad. Sci. USA, 109, 20842–20847, https://doi.org/10.1073/pnas.1212297109, 2012.
Geng, H., Hwang, H., Liu, X., Dong, S., and Ro, C.-U.: Investigation of aged aerosols in size-resolved Asian dust storm particles transported from Beijing, China, to Incheon, Korea, using low-Z particle EPMA, Atmos. Chem. Phys., 14, 3307–3323, https://doi.org/10.5194/acp-14-3307-2014, 2014.
Gustafsson, R. J., Orlov, A., Badger, C. L., Griffiths, P. T., Cox, R. A., and Lambert, R. M.: A comprehensive evaluation of water uptake on atmospherically relevant mineral surfaces: DRIFT spectroscopy, thermogravimetric analysis and aerosol growth measurements, Atmos. Chem. Phys., 5, 3415–3421, https://doi.org/10.5194/acp-5-3415-2005, 2005.
Hatch, C. D., Gierlus, K. M., Schuttlefield, J. D., and Grassian, V. H.: Water adsorption and cloud condensation nuclei activity of calcite and calcite coated with model humic and fulvic acids, Atmos. Environ., 42, 5672–5684, https://doi.org/10.1016/j.atmosenv.2008.03.005, 2008.
He, H., Wang, Y., Ma, Q., Ma, J., Chu, B., Ji, D., Tang, G., Liu, C., Zhang, H., and Hao, J.: Mineral dust and NOx promote the conversion of SO2 to sulfate in heavy pollution days, Sci. Rep., 4, 4172, https://doi.org/10.1038/srep04172, 2014.
Ilten, N. and Selici, A. T.: Investigating the impacts of some meteorological parameters on air pollution in Balikesir, Turkey, Environ. Monit. Assess., 140, 267–277, https://doi.org/10.1007/s10661-007-9865-1, 2008.
Jickells, T. D., An, Z. S., Andersen, K. K., Baker, A. R., Bergametti, G., Brooks, N., Cao, J. J., Boyd, P. W., Duce, R. A., Hunter, K. A., Kawahata, H., Kubilay, N., laRoche, J., Liss, P. S., Mahowald, N., Prospero, J. M., Ridgwell, A. J., Tegen, I., and Torres, R.: Global iron connections between desert dust, ocean biogeochemistry, and climate, Science, 308, 67–71, https://doi.org/10.1126/science.1105959, 2005.
Kobayashi, H., Hayashi, M., Shiraishi, K., Nakura, Y., Enomoto, T., Miura, K., Takahashi, H., Igarashi, Y., Naoe, H., Kaneyasu, N., Nishizawa, T., and Sugimoto, N.: Development of a polarization optical particle counter capable of aerosol type classification, Atmos. Environ., 97, 486–492, https://doi.org/10.1016/j.atmosenv.2014.05.006, 2014.
Koehler, K. A., Kreidenweis, S. M., DeMott, P. J., Petters, M. D., Prenni, A. J., and Carrico, C. M.: Hygroscopicity and cloud droplet activation of mineral dust aerosol, Geophys. Res. Lett., 36, https://doi.org/10.1029/2009gl037348, 2009.
Kurokawa, J., Ohara, T., Morikawa, T., Hanayama, S., Janssens-Maenhout, G., Fukui, T., Kawashima, K., and Akimoto, H.: Emissions of air pollutants and greenhouse gases over Asian regions during 2000–2008: Regional Emission inventory in ASia (REAS) version 2, Atmos. Chem. Phys., 13, 11019–11058, https://doi.org/10.5194/acp-13-11019-2013, 2013.
Li, M., Zhang, Q., Kurokawa, J.-i., Woo, J.-H., He, K., Lu, Z., Ohara, T., Song, Y., Streets, D. G., Carmichael, G. R., Cheng, Y., Hong, C., Huo, H., Jiang, X., Kang, S., Liu, F., Su, H., and Zheng, B.: MIX: a mosaic Asian anthropogenic emission inventory under the international collaboration framework of the MICS-Asia and HTAP, Atmos. Chem. Phys., 17, 935–963, https://doi.org/10.5194/acp-17-935-2017, 2017.
Li, W. J. and Shao, L. Y.: Observation of nitrate coatings on atmospheric mineral dust particles, Atmos. Chem. Phys., 9, 1863–1871, https://doi.org/10.5194/acp-9-1863-2009, 2009.
Li, W. J., Zhang, D. Z., Shao, L. Y., Zhou, S. Z., and Wang, W. X.: Individual particle analysis of aerosols collected under haze and non-haze conditions at a high-elevation mountain site in the North China plain, Atmos. Chem. Phys., 11, 11733–11744, https://doi.org/10.5194/acp-11-11733-2011, 2011.
Liang, Q., Jaeglé, L., Hudman, R. C., Turquety, S., Jacob, D. J., Avery, M. A., Browell, E. V., Sachse, G. W., Blake, D. R., Brune, W., Ren, X., Cohen, R. C., Dibb, J. E., Fried, A., Fuelberg, H., Porter, M., Heikes, B. G., Huey, G., Singh, H. B., and Wennberg, P. O.: Summertime influence of Asian pollution in the free troposphere over North America, J. Geophys. Res., 112, https://doi.org/10.1029/2006jd007919, 2007.
Lue, Y. L., Liu, L. Y., Hu, X., Wang, L., Guo, L. L., Gao, S. Y., Zhang, X. X., Tang, Y., Qu, Z. Q., Cao, H. W., Jia, Z. J., Xu, H. Y., and Yang, Y. Y.: Characteristics and provenance of dustfall during an unusual floating dust event, Atmos. Environ., 44, 3477–3484, https://doi.org/10.1016/j.atmosenv.2010.06.027, 2010.
Ma, Q., Liu, Y., Liu, C., and He, H.: Heterogeneous reaction of acetic acid on MgO, alpha-Al2O3, and CaCO3 and the effect on the hygroscopic behaviour of these particles, Phys. Chem. Chem. Phys., 14, 8403–8409, https://doi.org/10.1039/c2cp40510e, 2012.
Muñoz, O. and Hovenier, J. W.: Laboratory measurements of single light scattering by ensembles of randomly oriented small irregular particles in air. A review, J. Quant. Spectrosc. Ra., 112, 1646–1657, https://doi.org/10.1016/j.jqsrt.2011.02.005, 2011.
Nie, W., Wang, T., Xue, L. K., Ding, A. J., Wang, X. F., Gao, X. M., Xu, Z., Yu, Y. C., Yuan, C., Zhou, Z. S., Gao, R., Liu, X. H., Wang, Y., Fan, S. J., Poon, S., Zhang, Q. Z., and Wang, W. X.: Asian dust storm observed at a rural mountain site in southern China: chemical evolution and heterogeneous photochemistry, Atmos. Chem. Phys., 12, 11985–11995, https://doi.org/10.5194/acp-12-11985-2012, 2012.
Nie, W., Ding, A., Wang, T., Kerminen, V. M., George, C., Xue, L., Wang, W., Zhang, Q., Petaja, T., Qi, X., Gao, X., Wang, X., Yang, X., Fu, C., and Kulmala, M.: Polluted dust promotes new particle formation and growth, Sci. Rep., 4, 6634, https://doi.org/10.1038/srep06634, 2014.
Pan, X., Uno, I., Hara, Y., Kuribayashi, M., Kobayashi, H., Sugimoto, N., Yamamoto, S., Shimohara, T., and Wang, Z.: Observation of the simultaneous transport of Asian mineral dust aerosols with anthropogenic pollutants using a POPC during a long-lasting dust event in late spring 2014, Geophys. Res. Lett., 42, 1593–1598, https://doi.org/10.1002/2014gl062491, 2015.
Pan, X., Uno, I., Wang, Z., Nishizawa, T., Sugimoto, N., Yamamoto, S., Kobayashi, H., Sun, Y., Fu, P., Tang, X., and Wang, Z.: Real-time observational evidence of changing Asian dust morphology with the mixing of heavy anthropogenic pollution, Sci. Rep., 7, 335, https://doi.org/10.1038/s41598-017-00444-w, 2017.
Pan, X. L., Yan, P., Tang, J., Ma, J. Z., Wang, Z. F., Gbaguidi, A., and Sun, Y. L.: Observational study of influence of aerosol hygroscopic growth on scattering coefficient over rural area near Beijing mega-city, Atmos. Chem. Phys., 9, 7519–7530, https://doi.org/10.5194/acp-9-7519-2009, 2009.
Pérez, N., Pey, J., Querol, X., Alastuey, A., López, J. M., and Viana, M.: Partitioning of major and trace components in PM10–PM2.5–PM1 at an urban site in Southern Europe, Atmos. Environ., 42, 1677–1691, https://doi.org/10.1016/j.atmosenv.2007.11.034, 2008.
Shi, Z., Zhang, D., Hayashi, M., Ogata, H., Ji, H., and Fujiie, W.: Influences of sulfate and nitrate on the hygroscopic behaviour of coarse dust particles, Atmos. Environ., 42, 822–827, https://doi.org/10.1016/j.atmosenv.2007.10.037, 2008.
Shimizu, A., Sugimoto, N., Matsui, I., Arao, K., Uno, I., Murayama, T., Kagawa, N., Aoki, K., Uchiyama, A., and Yamazaki, A.: Continuous observations of Asian dust and other aerosols by polarization lidars in China and Japan during ACE-Asia, J. Geophys. Res.-Atmos., 109, D19S17, https://doi.org/10.1029/2002jd003253, 2004.
Shimizu, A., Nishizawa, T., Jin, Y., Kim, S.-W., Wang, Z., Batdorj, D., and Sugimoto, N.: Evolution of a lidar network for tropospheric aerosol detection in East Asia, Opt. Eng., 56, 031219, https://doi.org/10.1117/1.oe.56.3.031219, 2016.
Singh, U. N., Sugimoto, N., Asai, K., Matsui, I., Shimizu, A., Jayaraman, A., Nishizawa, T., Hara, Y., Xie, C., Uno, I., Yumimoto, K., Wang, Z., and Yoon, S.-C.: Lidar network observations of tropospheric aerosols, Proc. Spie., 7153, 71530A, https://doi.org/10.1117/12.806540, 2008.
Stein, A. F., Draxler, R. R., Rolph, G. D., Stunder, B. J. B., Cohen, M. D., and Ngan, F.: NOAA's HYSPLIT Atmospheric Transport and Dispersion Modeling System, B. Am. Meteorol. Soc., 96, 2059–2077, https://doi.org/10.1175/bams-d-14-00110.1, 2015.
Stohl, A., Forster, C., Frank, A., Seibert, P., and Wotawa, G.: Technical note: The Lagrangian particle dispersion model FLEXPART version 6.2, Atmos. Chem. Phys., 5, 2461–2474, https://doi.org/10.5194/acp-5-2461-2005, 2005.
Sugimoto, N., Nishizawa, T., Shimizu, A., Matsui, I., and Kobayashi, H.: Detection of internally mixed Asian dust with air pollution aerosols using a polarization optical particle counter and a polarization-sensitive two-wavelength lidar, J. Quant. Spectrosc. Ra., 150, 107–113, https://doi.org/10.1016/j.jqsrt.2014.08.003, 2015.
Sullivan, R. C., Moore, M. J. K., Petters, M. D., Kreidenweis, S. M., Roberts, G. C., and Prather, K. A.: Effect of chemical mixing state on the hygroscopicity and cloud nucleation properties of calcium mineral dust particles, Atmos. Chem. Phys., 9, 3303–3316, https://doi.org/10.5194/acp-9-3303-2009, 2009.
Ta, W., Xiao, Z., Qu, J., Yang, G., and Wang, T.: Characteristics of dust particles from the desert/Gobi area of northwestern China during dust-storm periods, Environ. Geol., 43, 667–679, https://doi.org/10.1007/s00254-002-0673-1, 2003.
Takemura, T., Uno, I., Nakajima, T., Higurashi, A., and Sano, I.: Modeling study of long-range transport of Asian dust and anthropogenic aerosols from East Asia, Geophys. Res. Lett., 29, 11–14, https://doi.org/10.1029/2002gl016251, 2002.
Tang, M., Cziczo, D. J., and Grassian, V. H.: Interactions of Water with Mineral Dust Aerosol: Water Adsorption, Hygroscopicity, Cloud Condensation, and Ice Nucleation, Chem. Rev., 116, 4205–4259, https://doi.org/10.1021/acs.chemrev.5b00529, 2016.
Uno, I., Eguchi, K., Yumimoto, K., Takemura, T., Shimizu, A., Uematsu, M., Liu, Z., Wang, Z., Hara, Y., and Sugimoto, N.: Asian dust transported one full circuit around the globe, Nat. Geosci., 2, 557–560, https://doi.org/10.1038/ngeo583, 2009.
Venkata, S. and Reagan, J.: Aerosol Retrievals from CALIPSO Lidar Ocean Surface Returns, Remote Sens., 8, 1006, https://doi.org/10.3390/rs8121006, 2016.
Wang, L. T., Wei, Z., Yang, J., Zhang, Y., Zhang, F. F., Su, J., Meng, C. C., and Zhang, Q.: The 2013 severe haze over southern Hebei, China: model evaluation, source apportionment, and policy implications, Atmos. Chem. Phys., 14, 3151–3173, https://doi.org/10.5194/acp-14-3151-2014, 2014.
Wang, Q., Zhuang, G., Li, J., Huang, K., Zhang, R., Jiang, Y., Lin, Y., and Fu, J. S.: Mixing of dust with pollution on the transport path of Asian dust–revealed from the aerosol over Yulin, the north edge of Loess Plateau, Sci. Total Environ., 409, 573–581, https://doi.org/10.1016/j.scitotenv.2010.10.032, 2011.
Wang, Q., Sun, Y., Jiang, Q., Du, W., Sun, C., Fu, P., and Wang, Z.: Chemical composition of aerosol particles and light extinction apportionment before and during the heating season in Beijing, China, J. Geophys. Res.-Atmos., 120, 12708–12722, https://doi.org/10.1002/2015jd023871, 2015.
Wang, Y., Yao, L., Wang, L., Liu, Z., Ji, D., Tang, G., Zhang, J., Sun, Y., Hu, B., and Xin, J.: Mechanism for the formation of the January 2013 heavy haze pollution episode over central and eastern China, Sci. China Earth Sci., 57, 14–25, https://doi.org/10.1007/s11430-013-4773-4, 2013.
Winker, D. M., Vaughan, M. A., Omar, A., Hu, Y., Powell, K. A., Liu, Z., Hunt, W. H., and Young, S. A.: Overview of the CALIPSO Mission and CALIOP Data Processing Algorithms, J. Atmos. Ocean. Tech., 26, 2310–2323, https://doi.org/10.1175/2009jtecha1281.1, 2009.
Xu, G., Jiao, L., Zhang, B., Zhao, S., Yuan, M., Gu, Y., Liu, J., and Tang, X.: Spatial and Temporal Variability of the PM2.5 ∕ PM10 Ratio in Wuhan, Central China, Aerosol Air Qual. Res., 17, 741–751, https://doi.org/10.4209/aaqr.2016.09.0406, 2017.
Yuan, H., Zhuang, G., Rahn, K. A., Zhang, X., and Li, Y.: Composition and mixing of individual particles in dust and nondust conditions of north China, spring 2002, J. Geophys. Res., 111, D20208, https://doi.org/10.1029/2005jd006478, 2006.
Zhang, Z., Zhang, X., Gong, D., Kim, S. J., Mao, R., and Zhao, X.: Possible influence of atmospheric circulations on winter haze pollution in the Beijing–Tianjin–Hebei region, northern China, Atmos. Chem. Phys., 16, 561–571, https://doi.org/10.5194/acp-16-561-2016, 2016.
Zhao, B., Wang, P., Ma, J. Z., Zhu, S., Pozzer, A., and Li, W.: A high-resolution emission inventory of primary pollutants for the Huabei region, China, Atmos. Chem. Phys., 12, 481–501, https://doi.org/10.5194/acp-12-481-2012, 2012.