the Creative Commons Attribution 4.0 License.
the Creative Commons Attribution 4.0 License.
 | 14 Dec 2018
Secondary organic aerosol production from local emissions dominates the organic aerosol budget over Seoul, South Korea, during KORUS-AQ
Benjamin A. Nault
Pedro Campuzano-Jost
Douglas A. Day
Jason C. Schroder
Bruce Anderson
Andreas J. Beyersdorf
Donald R. Blake
William H. Brune
Yonghoon Choi
Chelsea A. Corr
Joost A. de Gouw
Jack Dibb
Joshua P. DiGangi
Glenn S. Diskin
Alan Fried
L. Gregory Huey
Michelle J. Kim
Christoph J. Knote
Kara D. Lamb
Taehyoung Lee
Taehyun Park
Sally E. Pusede
Eric Scheuer
Kenneth L. Thornhill
Jung-Hun Woo
Jose L. Jimenez
Organic aerosol (OA) is an important fraction of submicron aerosols. However, it is challenging to predict and attribute the specific organic compounds and sources that lead to observed OA loadings, largely due to contributions from secondary production. This is especially true for megacities surrounded by numerous regional sources that create an OA background. Here, we utilize in situ gas and aerosol observations collected on board the NASA DC-8 during the NASA–NIER KORUS-AQ (Korea–United States Air Quality) campaign to investigate the sources and hydrocarbon precursors that led to the secondary OA (SOA) production observed over Seoul. First, we investigate the contribution of transported OA to total loadings observed over Seoul by using observations over the Yellow Sea coupled to FLEXPART Lagrangian simulations. During KORUS-AQ, the average OA loading advected into Seoul was ∼1–3 µg sm−3. Second, taking this background into account, the dilution-corrected SOA concentration observed over Seoul was ∼140 at 0.5 equivalent photochemical days. This value is at the high end of what has been observed in other megacities around the world (20–70 at 0.5 equivalent days). For the average OA concentration observed over Seoul (13 µg sm−3), it is clear that production of SOA from locally emitted precursors is the major source in the region. The importance of local SOA production was supported by the following observations. (1) FLEXPART source contribution calculations indicate any hydrocarbons with a lifetime of less than 1 day, which are shown to dominate the observed SOA production, mainly originate from South Korea. (2) SOA correlated strongly with other secondary photochemical species, including short-lived species (formaldehyde, peroxy acetyl nitrate, sum of acyl peroxy nitrates, dihydroxytoluene, and nitrate aerosol). (3) Results from an airborne oxidation flow reactor (OFR), flown for the first time, show a factor of 4.5 increase in potential SOA concentrations over Seoul versus over the Yellow Sea, a region where background air masses that are advected into Seoul can be measured. (4) Box model simulations reproduce SOA observed over Seoul within 11 % on average and suggest that short-lived hydrocarbons (i.e., xylenes, trimethylbenzenes, and semi-volatile and intermediate-volatility compounds) were the main SOA precursors over Seoul. Toluene alone contributes 9 % of the modeled SOA over Seoul. Finally, along with these results, we use the metric ΔOA/ΔCO2 to examine the amount of OA produced per fuel consumed in a megacity, which shows less variability across the world than ΔOA∕ΔCO.
- Article
(4047 KB) - Full-text XML
-
Supplement
(3844 KB) - BibTeX
- EndNote


Prior to 1950, 30 % of the human population resided in urban areas (UNDESA, 2015). In 2007, the human population living in urban areas had increased to over 50 % (making it the first time in human history that more people reside in urban than rural areas), and it is predicted that nearly two-thirds of the human population will be living in urban areas by 2050 (Monks et al., 2009; UNDESA, 2015; Baklanov et al., 2016). Urban areas are large sources of anthropogenic emissions to the atmosphere (from sources including transportation, industry, cooking, personal care products, and power produced from fossil fuels), and these emissions have important impacts on local, regional, and global air pollution, climate, and human and ecological health (Hallquist et al., 2009; Monks et al., 2009; Myhre et al., 2013; Baklanov et al., 2016; WHO, 2016; Cohen et al., 2017; Landrigan et al., 2018; McDonald et al., 2018). Effects from urban emissions are strongly modulated by the chemical evolution of the primary emissions (e.g., nitrogen oxides, hydrocarbons, and primary organic aerosols, POAs) to secondary pollutants, including secondary organic aerosols (SOAs, produced from atmospheric reactions) and other aerosols (Monks et al., 2009). These emissions and their chemical by-products significantly influence hemispheric climate and air quality. They increase mortality in polluted urban areas, leading to over 3 million premature deaths annually (Lelieveld et al., 2015; Baklanov et al., 2016; WHO, 2016). Finally, the emissions and production of anthropogenic aerosol may strongly regulate cloud nucleation (Peng et al., 2014), which impacts the aerosols' direct and indirect effects on climate (Myhre et al., 2013).
Production of SOA is poorly understood (Hallquist et al., 2009; Shrivastava et al., 2017; Tsimpidi et al., 2017), including in large urban environments (Volkamer et al., 2006; de Gouw et al., 2008, 2009; Hayes et al., 2015; Woody et al., 2016; Janssen et al., 2017; Ma et al., 2017). It has been shown that a large fraction (35 %–85 %) of urban fine aerosol is composed of organic aerosol (OA) (Zhang et al., 2007; Jimenez et al., 2009), and a substantial fraction of this OA is typically SOA produced through the chemical processing of urban hydrocarbon emissions (Kleinman et al., 2007, 2008, 2009, 2016; Dzepina et al., 2009, 2011; DeCarlo et al., 2010; Hodzic et al., 2010; Hersey et al., 2013; Zhao et al., 2014, 2016; Freney et al., 2014; Hayes et al., 2015; Ma et al., 2017). Also, observations indicate the majority of urban SOA production is rapid and is nearly completed within 24 equivalent photochemical hours (a measure of OH exposure, assuming interactions in a volume with 1.5×10⁶ molecules cm−3 OH throughout a 24 h period; equivalent age enables comparison of chemistry rates across different events or studies) (DeCarlo et al., 2010; Hayes et al., 2013; Freney et al., 2014; Hu et al., 2016; Ortega et al., 2016; Ma et al., 2017), even during winter (Schroder et al., 2018). This consistently rapid SOA production over urban areas around the world may be due to the short lifetime (less than 1 day) of urban semi-volatile and intermediate-volatility organic compounds (S/IVOCs), which numerous studies suggest to be major SOA precursors, along with aromatics (Robinson et al., 2007; Zhao et al., 2014, 2016; Hayes et al., 2015; Ma et al., 2017; McDonald et al., 2018). S/IVOCs and low-volatility organic compounds (LVOCs – compounds produced from the photooxidation of hydrocarbons – Robinson et al., 2007; Kroll and Seinfeld, 2008; Murphy et al., 2011; Palm et al., 2016) are challenging to measure due to strong interaction with inlet and instrument surfaces (e.g., Pagonis et al., 2017), limiting our knowledge of the emission rates and concentrations of these species in the atmosphere (Zhao et al., 2014; Hunter et al., 2017). It has also been recently shown that historical chamber SOA yields are biased low due to unaccounted-for partitioning of S/IVOCs to walls (Matsunaga and Ziemann, 2010; Zhang et al., 2014; Krechmer et al., 2016, 2017). These missing or underrepresented compounds and low-biased yields, along with uncertain emission inventories for SOA precursors (Shrivastava et al., 2008; Woody et al., 2016; Murphy et al., 2017), led SOA modeling efforts over urban areas using pre-2007 models to underpredict observed SOA concentrations (de Gouw et al., 2005, 2009; Volkamer et al., 2006; Dzepina et al., 2009; Freney et al., 2014; Woody et al., 2016). More recent modeling efforts have achieved closure (and sometimes overprediction) of the observed SOA, but with some controversy about the real causes of the increased modeled SOA (Dzepina et al., 2009; Hodzic et al., 2010; Tsimpidi et al., 2010; Hayes et al., 2015; Cappa et al., 2016; Ma et al., 2017; McDonald et al., 2018).
Another complexity in understanding SOA production over urban areas is addressing the contributions of transport of SOA and its gas-phase precursors. Airborne observations of SOA and SOA precursors upwind, over, and downwind of megacities around the world (Kleinman et al., 2007, 2008, 2009, 2016; DeCarlo et al., 2008, 2010; Bahreini et al., 2009; McMeeking et al., 2012; Craven et al., 2013; Freney et al., 2014; Schroder et al., 2018) have constrained the role of regional transport versus megacity emissions. In general, these studies show that there is often regional background SOA, often due to biogenic compounds and regional pollution, transported into megacities, but that rapid SOA production is always observed and is generally dominated by the anthropogenic emissions from the urban area being studied.
The Seoul metropolitan area (SMA), as considered here, is a densely populated megacity, extending beyond Seoul proper into the large Incheon and Gyeonggi cities. The SMA has ∼24 million people, or ∼50 % of the South Korean population, living on ∼12 000 km2 of land (Park et al., 2017). The SMA has large anthropogenic emissions but is also often downwind of China, presenting the challenge of separating local emissions and production of SOA versus transport of SOA and its precursors from regions upwind (H. S. Kim et al., 2007; Heo et al., 2009; Y. J. Kim et al., 2009; B. M. Kim et al., 2016; H. Kim et al., 2017, 2018; H. C. Kim et al., 2017; Jeong et al., 2017; Lee et al., 2017; Seo et al., 2017). Most of the studies in this region have used ground-based observations and/or 3-D models to characterize the amount of aerosol, and aerosol precursors, transported to the SMA and South Korea, finding 50 % to 80 % of the aerosol load is due to international transport in the seasons with favorable synoptic conditions (winter and spring). Though satellites are starting to be used to investigate transport of aerosols into the SMA and South Korea (Lee et al., 2013; Park et al., 2014; Jeong et al., 2017), retrievals typically do not provide any chemical characterization or vertical location of the aerosol (boundary layer versus free troposphere) and are typically strongly influenced by larger aerosols (e.g., mineral dust). Airborne observations of the upwind transport and local production of aerosol and aerosol precursors have the potential to directly assess the impact of transport versus local emissions in this region.
In this study, we use observations collected on board the NASA DC-8 research aircraft during the NASA–NIER (South Korean National Institute of Environmental Research) Korea–United States Air Quality (KORUS-AQ) field campaign. These data provided the opportunity to investigate SOA production as well as the role of OA and SOA precursor transport on the OA concentration and SOA production over Seoul during the campaign. We evaluate the observed SOA production over the SMA with source analysis models, correlation of secondary gas-phase species with SOA, an oxidation flow reactor, and box modeling to constrain local versus transport contributions. These results are discussed and placed into the context of improving our knowledge about SOA production and sources in urban environments.
Here, we introduce the KORUS-AQ campaign (Sect. 2.1), the key instruments for this study (Sect. 2.2), additional measurements used in the analyses (Sect. 2.4), and the airborne oxidation flow reactor (Sect. 2.3). All linear fits, unless otherwise noted, use the least-orthogonal-distance regression fitting method (ODR).
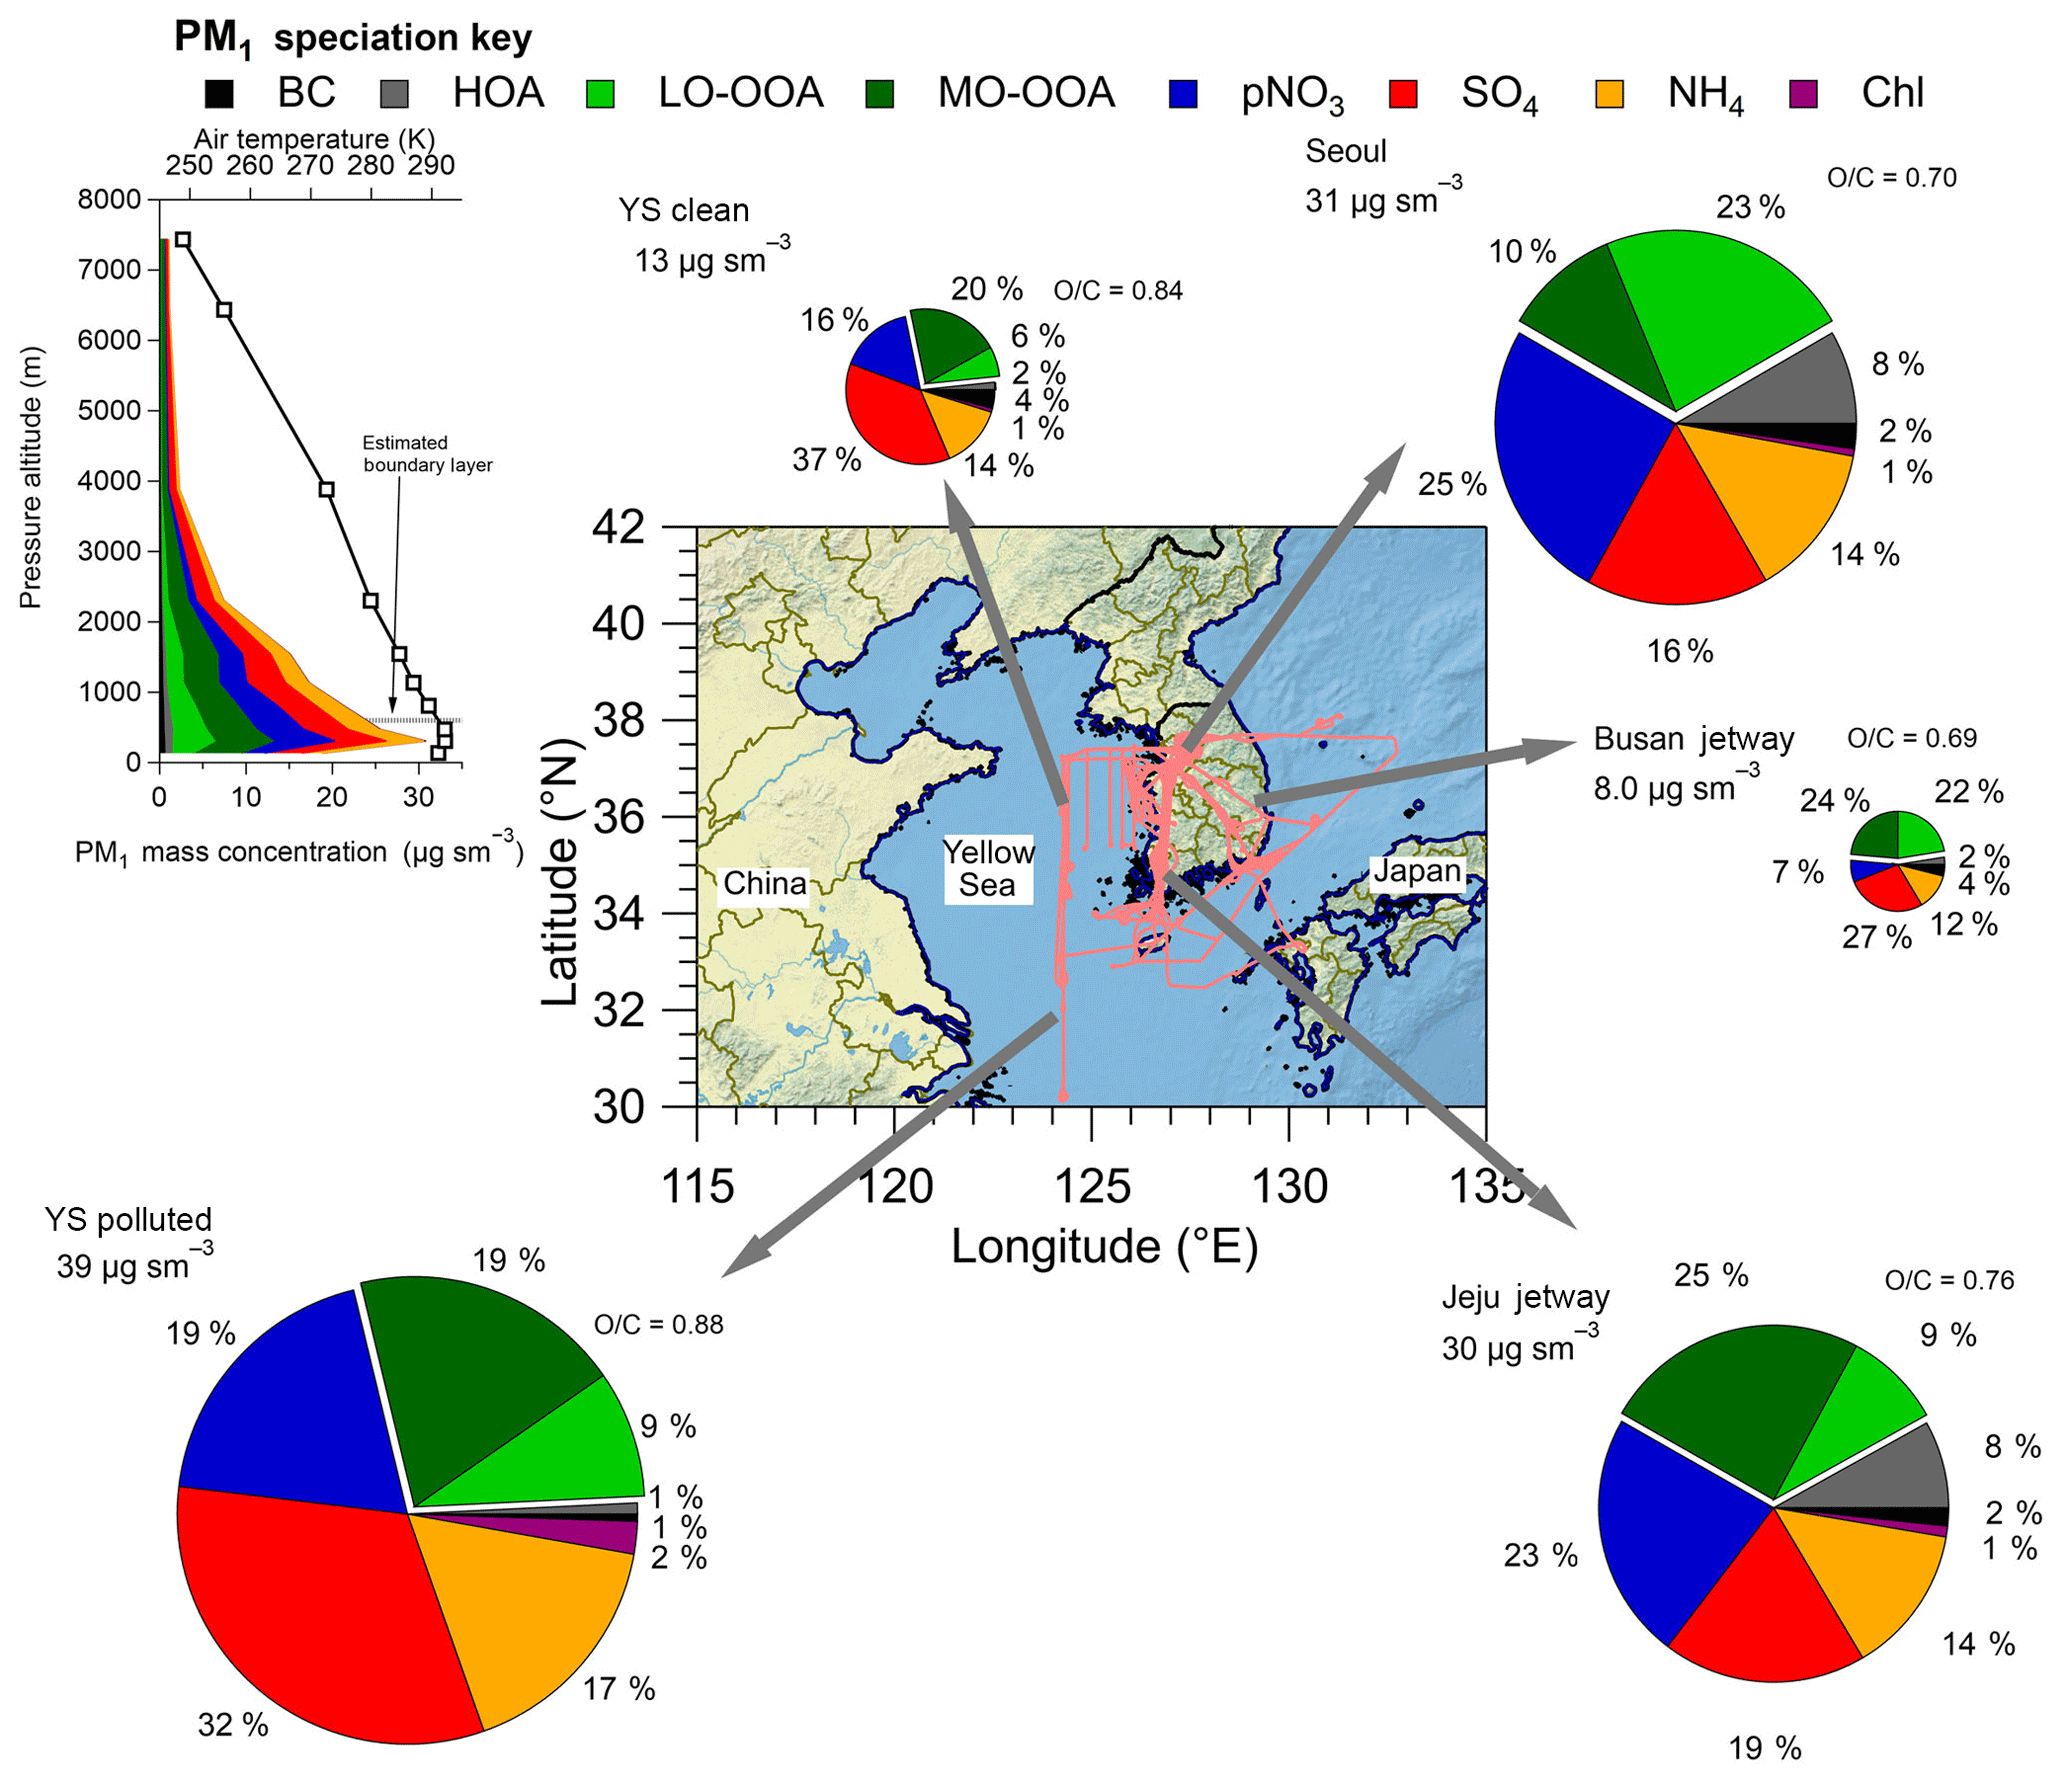
Figure 1Pie charts of the average boundary layer PM1 composition by the different regions (defined in Table S2) sampled over South Korea during the campaign. The flight paths are shown in light red. The Busan jetway had no measurable Chl; therefore, Chl is not included in the pie chart. The pie chart area is proportional to PM1 in each region. The average O∕C for OA is shown by each OA section in the pie charts. The map shows the DC-8 flight paths throughout KORUS-AQ. The average vertical profile of PM1 species (along with temperature and continental planetary boundary layer height) over all of South Korea is shown in the upper left. YS: Yellow Sea.
2.1 KORUS-AQ brief overview
KORUS-AQ was conducted over South Korea and the Yellow Sea during May–June 2016. This study focuses on the NASA DC-8 (Aknan and Chen, 2018) observations; however, there were numerous other measurement platforms in operation (Al-Saadi et al., 2015). The DC-8 was stationed in the Songtan area of Pyeongtaek, South Korea, approximately 60 km south of Seoul. The DC-8 flew 20 research flights (RFs) (Fig. 1; Table S1 in the Supplement). For each RF, the DC-8 would take off from near Seoul, typically at 08:00 local time (LT), which is Korean standard time, and perform a missed approach over Seoul Air Base, which is less than 15 km from the Seoul city center. This pattern was typically conducted two more times during each flight, around 12:00 LT and prior to landing (∼15:00 LT), leading to 55 missed approaches over Seoul during the campaign. Each missed approach involved flying near Seoul below 1000 m (above ground) for 15–45 min, providing a large number of observations of the Seoul boundary layer. The observations collected during this pattern, along with any other flights conducted within the coordinates defined as Seoul (Table S2, Fig. S1 in the Supplement) are referred to as “Seoul” below.
Briefly, the SMA is bordered by the Yellow Sea and Gyeonggi Bay to the west and forests and mountainous regions to the north, south, and east (Park et al., 2017). Within this region, nearly 30 % of the land is used for human activities, ∼21 % is used for cropland, pasture, and grassland, and ∼36 % is forested (Park et al., 2017). During the time period of KORUS-AQ, the wind was typically from the west to northwest, meaning that observations over the Yellow Sea represent typical background (inflow) air mass observations for Seoul (H. C. Kim et al., 2017). May and June are typically characterized by low precipitation and rising temperatures prior to the summer monsoon (Hong and Hong, 2016; H. C. Kim et al., 2017).
In addition to the Seoul missed approaches, the DC-8 would fly over the Yellow Sea, the Jeju jetway, or the Busan jetway at four different altitudes (nominally ∼300, ∼1000, ∼1500, and ∼7500 m above ground, depending on the height of the boundary layer, clouds, and chemical forecasts). Many of the three lower elevation sampling legs around South Korea encountered significant pollution, similar to the flight segments over Seoul. Similar to Seoul, the approximate coordinates defining these regions are also included in Table S2. For this study, the observations over the Yellow Sea have been split into two categories: “clean,” referring to the typical conditions observed during KORUS-AQ, and “transport/polluted,” referring to one RF (RF12, 24 May 2016) that had direct transport of pollution from the Shanghai region over the Yellow Sea. Also, RF11 (21 May 2016) is not included in the Yellow Sea category, as this flight sampled outflow from the SMA (prevailing winds from the east).
2.2 CU-AMS sampling and analysis
A highly customized high-resolution time-of-flight aerosol mass spectrometer (HR-ToF-AMS, Aerodyne Research, Inc.) was flown on the NASA DC-8 during KORUS-AQ. Hereafter, this instrument will be referred to as CU-AMS since there were two high-resolution AMSs on the DC-8 during KORUS-AQ (see Sect. 2.4). Both AMSs measured non-refractory composition of PM1 (particulate matter with aerodynamic diameters less than 1 µm) (DeCarlo et al., 2006; Canagaratna et al., 2007). The key difference between the two AMSs was the type of vaporizer (standard for CU-AMS versus capture for the other AMS), which has been described in prior publications (Jayne and Worsnop, 2016; Hu et al., 2017a, b, 2018a, b; Xu et al., 2017) and below and in Sect. 2.4. The basic concept, and operation, of the CU-AMS for aircraft sampling has been described elsewhere (DeCarlo et al., 2006, 2008, 2010; Dunlea et al., 2009; Cubison et al., 2011; Kimmel et al., 2011; Schroder et al., 2018), and a brief description of other important details follows. For detailed information on field AMS calibrations, positive matrix factorization, photochemical clock calculations, and model setups, see Sects. S2–S7 in the Supplement.
Ambient particles were drawn into the airplane through an NCAR High-Performance Instrumented Airborne Platform for Environmental Research Modular Inlet (HIMIL; Stith et al., 2009) at a constant standard (T=273 K and P=1013 hPa) flow rate of 9 L min−1. The RAM heating of the inlet dried the aerosol prior to entering the airplane, and the temperature of the cabin (typically ∼10 ∘C higher than ambient) maintained the sampling line relative humidity to less than 40 %, ensuring the aerosol remained dry prior to entering the AMS. The sample was introduced into the AMS aerodynamic focusing lens (Zhang et al., 2002, 2004), operated at 2.00 hPa (1.5 Torr), through a pressure-controlled inlet, which was operated at 433 hPa (325 Torr) (Bahreini et al., 2008). The lens transmission calibrations (Sect. S2 and Fig. S4) were conducted through the entire plumbing, including the pressure-controlled inlet. There were minimal losses of ammonium nitrate and sulfate through the pressure-controlled inlet during these calibrations. The focused particles were then introduced after several differential pumping stages into a detection chamber, where they impacted on an inverted cone porous tungsten vaporizer (standard vaporizer) held at 600 ∘C. The non-refractory species were flash-vaporized and the vapors were ionized by 70 eV electron ionization. Finally, the ions were extracted and analyzed with a HR-ToF-AMS (Tofwerk AG). The residence time from outside the inlet to the vaporizer was ∼0.4 s in the boundary layer and ∼1.0 s at 7500 m during KORUS-AQ. Unless otherwise noted, all aerosol data reported here are at standard temperature (273 K) and pressure (1013 hPa) (STP), leading to the notation µg sm−3 (sm−3 is the standard volume, in cubic meters, at STP). Notation in scm−3 is also at STP.
For KORUS-AQ, the CU-AMS was operated in the fast mass spectrum mode (Kimmel et al., 2011), in order to obtain high-time-resolution measurements (1 Hz) continuously. Each fast mass spectrum 1 s “run” is collected in either the chopper closed (background with particle beam blocked) or chopper open (background plus ambient particles and air) position. For KORUS-AQ, the CU-AMS sampled in the chopper closed position for 6 s and the chopper open position for 46 s. For the remaining 8 s of the 1 min cycle, it sampled with the efficient particle time-of-flight (ePToF) mode, which provides particle sizing but with reduced sensitivity (Fig. S2). Also, once every 20–30 min, rapid sampling (20 s) of outside air through a particle filter was used to ensure quality control of the instrument background and detection limits. The filters provide data quality checks throughout the flight by checking for leaks as the cabin changes pressure to determine the response time of the different species (typically less than 2 s) and to validate the real-time continuous detection limits calculated using the Drewnick et al. (2009) method. The average of the two background signal periods (chopper closed) before and after the open signal was subtracted from each 1 s open measurement. In addition to the 1 s data, we reported a 1 min data product, in which we averaged raw mass spectra prior to fitting the high-resolution ions, leading to improved signal-to-noise ratio (SNR) from reduced nonlinear fitting noise (beyond the expected increased SNR from averaging in an ion-counting noise regime). For this study, the 1 min data product is used since the additional spatial resolution provided by the 1 s product was not required for the analysis of regional plumes. The software packages Squirrel v1.60 and PIKA v1.20 within Igor Pro 7 (WaveMetrics) (DeCarlo et al., 2006; Sueper, 2018) were used to analyze all AMS data.
The CU-AMS always used the “V-mode” ion path (DeCarlo et al., 2006), with a spectral resolution (m∕Δm) of 2500 at m∕z 44 and 2800 at m∕z 184. The collection efficiency (CE) for the CU-AMS was estimated per Middlebrook et al. (2012) and ranged from 0.5 to 1 (Fig. S28), with most of the values occurring around 0.5. Calibrations of the CU-AMS are discussed in the Supplement (Sect. S2), and detection limits for the 1 min data were 26, 12, 4, 10, and 115 ng sm−3 for SO4 (sulfate), NO3 (nitrate), NH4 (ammonium), Chl (chloride), and OA, respectively (note that the charge symbol is not included for the nominally inorganic species, as organic compounds may make (typically small) contributions to these species (e.g., organonitrates, organosulfates, and reduced organic nitrogen species) (Huffman et al., 2009; Farmer et al., 2010)). On average, during the campaign, organic nitrates were ∼8 % of the total CU-AMS NO3 signal and were only an important contribution to the NO3 signal when NO3 was less than 0.50 µg sm−3 (Fig. S38). pNO3 will be used throughout the rest of the paper to represent aerosol NO3 and to ensure it is not confused with radical NO3. These detection limits are estimated for every data point per Drewnick et al. (2009) and remained nearly constant during each flight and throughout the campaign. The detection limits were scaled by , based on comparison with periodic filter blanks (Campuzano-Jost et al., 2016), since the Drewnick et al. (2009) method only uses some ions to determine the detection limits, while filters take all ions into account, and thus the latter provide a more accurate estimate. It was found that the scaling with the periodic blanks from the filters was not impacted by the length of sampling outside air through the filter. The low limit of detection for these species remained nearly constant during the flight by using a cryogenic pump that lowered the temperature of a surface surrounding the vaporizer region to 90 K. This freezes out most background gases and provided consistently low detection limits during the flight, when other AMSs may suffer from increased detection limits after several hours into a flight due to pumping out of large initial backgrounds. The cryogenic pump is necessary since the airplane had power only 3 h prior to take-off until 2 h after landing; therefore, the CU-AMS was not constantly being pumped. This leads to high backgrounds each time the instrument is started. The 2σ accuracy for the CU-AMS of inorganic and organic species is estimated to be 35 % and 38 %, respectively (Bahreini et al., 2009). The O∕C and H∕C ratios were determined using the improved-ambient method (Canagaratna et al., 2015). The CU-AMS was fully operational during KORUS-AQ, except for 2 h in RF01, leading to nearly 99 % data collection coverage. Additional information on AMS data interpretation can be found in Jimenez et al. (2018) as well as the data file headers for the KORUS-AQ AMS data (Aknan and Chen, 2018).
2.3 Oxidation flow reactor sampling and analysis
The potential aerosol mass (PAM) OFR measures the aerosol mass that can be formed from the precursors that are present in ambient or laboratory air (Kang et al., 2007; Lambe et al., 2011). The OFR has been successfully deployed in multiple urban and forested locations to quantify potential SOA (Ortega et al., 2016; Palm et al., 2016, 2017, 2018; Kang et al., 2018). The chemical regimes and comparability to ambient results of the OFR have been characterized extensively by modeling, which indicate that SOA formation proceeds by chemistry similar to that in the atmosphere, dominated by OH oxidation under low-NO conditions (Li et al., 2015; Peng et al., 2015, 2016). The sampling schematic of the OFR during KORUS-AQ is shown in Fig. S12. Briefly, it is a 13 L (45.7 cm length OD×19.7 cm ID) cylindrical aluminum tubular vessel that uses two low-pressure mercury 185 and 254 nm lamps (BHK, Inc., model no. 82-904-03) to produce OH radicals through the photolysis of ambient H2O, O2, and O3 (Reactions R1–R5). This mode of operation is referred to as “OFR185.”
The KORUS-AQ study represents the first airborne operation of an OFR to our knowledge. Unlike prior ground-based field studies (Ortega et al., 2016; Palm et al., 2016, 2017, 2018), the UV lamps were typically maintained at one constant light setting since the OFR was sampling more rapidly varying air masses. Since external OH reactivity (OHR) and water vapor concentrations changed with air mass, a range of OH exposures (OHexp) were reached inside the OFR despite the constant photolytic flux (Peng et al., 2015). The OFR OHexp was calibrated using two different methods. (1) We removed ambient CO in the OFR during flight (online calibration in Fig. S14a). (2) While on the ground, we injected known amounts of humidified (multichannel Nafion drier) CO from a zero-air cylinder spiked with ∼2 ppmv of CO (Scott Marrin) and varying the light intensity to produce different amounts of OH (offline calibration in Fig. S14b) and thus CO reactive removal. Both the off- and online approaches yielded a calibration factor of ×0.4 for the OHexp, calculated using the parameterization of Peng et al. (2015), similar to Palm et al. (2016). The OHexp calculated with the calibrated equation is used for periods in which the Picarro instrument was not sampling the OFR output. A histogram of the other key parameters used to calculate OHexp with the Peng et al. (2015) equation – H2O(g) (measured with a diode laser hygrometer, DLH) and ambient OH reactivity (measured by ATHOS) – is shown in Fig. S15. The OFR operating conditions were in the “safe” zone (Peng et al., 2015, 2016), meaning that they were consistent with tropospheric chemistry.
A key difference between the operation of this OFR during KORUS-AQ and previous field studies (which did not use any inlet; Ortega et al., 2016; Palm et al., 2016, 2017, 2018) was that the gas and aerosol passed through ∼1.8 m of ∼4.6 mm ID stainless steel tubing at 5 L min−1 (residence time is ∼1.4 s through tubing). The residence time in the OFR was ∼150 s. The gas and aerosol sample entered the OFR through a press fitted stainless steel inlet that was coated in SilcoNert (SilcoTek Co, Bellefonte, PA) and had 18 evenly spaced holes (Fig. S13) to promote more even injection of the sample into the OFR flow cross section (Ortega et al., 2016; Palm et al., 2017; Mitroo et al., 2018). The gas-phase output of the OFR was sampled by an 8.25 cm diameter Teflon ring inside the OFR connected to Teflon tubing and sampled by two gas analyzers for O3 (model 205, 2B Technologies, Boulder, CO, USA) and CO (Picarro; see above). The aerosol was sampled by a 2 mm ID stainless steel tube. A constant flow through the OFR at all times was maintained with a bypass flow (when the CU-AMS or CO instrument were not sampling from the OFR) to always maintain a constant residence time in the OFR. The CU-AMS sampled from the OFR for 12–15 s every 3 min (Fig. S2). This sampling scheme was chosen to ensure the CU-AMS had a high sampling frequency for ambient aerosol, while also sampling the OFR once each time the air inside it was replaced (given its residence time of ∼150 s).
In prior ground-based studies the OFR was placed outside, leading to the ambient and OFR temperature being within 1–2 ∘C (Ortega et al., 2016; Palm et al., 2016, 2017, 2018). During KORUS-AQ the OFR was housed inside the DC-8 cabin, which was typically ∼10 ∘C (range 0–20 ∘C) warmer than ambient air (Fig. S16). Since (NH4)2SO4 is nonvolatile, there was little impact on the amount of SO4 entering and exiting the OFR (as confirmed when the UV lights were off and OHexp was zero) (Fig. S17). For OA, which is typically a mixture of semivolatile and nonvolatile compounds, and for pNO3, which can be quite semivolatile (Huffman et al., 2009; Cappa and Jimenez, 2010), the mass concentration exiting the OFR was significantly lower than when entering, with lights off. This is due to evaporation of OA and pNO3 at the warmer cabin temperatures and longer residence times (∼150 s). However, for ambient measurements, the residence time was less than 1 s (Sect. 2.2), which is rapid enough to prevent volatilization of OA and pNO3, as discussed in prior work (Guo et al., 2016, 2017; Shingler et al., 2016). Thus, the average ratio of OA transmitted through the OFR versus bypassing the OFR with lights off is used (slope in Fig. S17) as an approximate correction for the amount of OA that should have exited the OFR without chemistry when the OFR was in oxidation mode. These values were highly correlated (R2=0.94) and did not vary for the entire campaign, leading to confidence in the correction. This corrects for the semivolatile nature of ambient OA, but it does not correct for any temperature dependence of SOA formation.
The average aerosol condensation sink inside the OFR is needed for the LVOC fate model described in Palm et al. (2016) to compute the amount of condensable vapors that do not form SOA in the OFR (due to residence-time limitations and surface losses), but that would be expected to form SOA in the atmosphere. Since there were no particle sizers available to estimate the changes in the aerosol surface area after the OFR (Palm et al., 2016), we used Eq. (1) to estimate the average aerosol surface area in the OFR and estimated condensational sink (CSest).
The CSamb (ambient condensational sink) is calculated using the LAS and scanning mobility particle sizer (SMPS) measurements. The second term is a scaling factor to account for the observed increase in mass in OFR (with a power of 2/3 for approximate conversion to relative surface area). The third term is a scaling factor for relative increase in surface area due to strong nanoparticle formation in the OFR, as observed in Los Angeles during CalNex (Ortega et al., 2016). A hygroscopic growth factor is not included in the CSest (Palm et al., 2016) as the aerosol in the OFR was dry (Sect. 2.1).
One simple way to confirm the validity of the OH exposures derived from the in-field calibrations and measurements is to compare the observed versus modeled sulfate enhancements in the OFR while traversing SO2 plumes (Palm et al., 2016) (Figs. S18 and S19). Albeit the point-to-point comparison is noisy as expected, we find good agreement on average between the modeled and measured SO4 enhancement (slope=0.94), validating the quantification of the OFR for this study. We obtained results from the OFR for all flights except RF12 (24 May 2016), when a valve malfunction prevented measurements of O3 and thus the ability to quantify OFR OHexp. During this flight, the Picarro instrument also did not sample from the OFR.
2.4 Co-located supporting measurements used in this study
In addition to the CU-AMS measurements, this study utilizes several co-located gas- and aerosol-phase measurements collected on board the DC-8.
2.4.1 Gas-phase measurements
NO, NO2, NOy, and O3 were measured by the NCAR chemiluminescence instrument (Weinheimer et al., 1994). For CO, the ambient measurements were made with the NASA Langley tunable diode laser absorption spectrometer (DACOM) (Sachse et al., 1987) while the measurements for CO exiting the OFR (Sect. 2.3) were made with a Picarro G2401-m. The Picarro instrument was calibrated in flight with a World Meteorological Organization (WMO) traceable gas standard. Gas-phase H2O was measured with the NASA Langley open-path tunable DLH (Diskin et al., 2002). The Pennsylvania State University Airborne Tropospheric Hydrogen Oxides Sensor (ATHOS), based on laser-induced fluorescence, measured OH, HO2, and OH reactivity (Faloona et al., 2004; Mao et al., 2009). Hydrocarbons were measured with the University of California-Irvine whole air sampler (WAS), followed by analysis with a gas chromatograph followed by either a flame ionization detector or mass spectrometer (Blake et al., 2003), and also with the University of Oslo proton-transfer-reaction time-of-flight mass spectrometer (PTR-MS) (Wisthaler et al., 2002; Müller et al., 2014). SO2 and speciated acyl peroxy nitrates (e.g., PAN and PPN) were measured using the Georgia Institute of Technology chemical ionization mass spectrometer (GT-CIMS) (Huey et al., 2004; Slusher et al., 2004; S. Kim et al., 2007) The sum of the total peroxy nitrates (ΣROONO2) and total alkyl and multifunctional nitrates (ΣRONO2) was measured using the University of California-Berkeley thermal-dissociation laser-induced fluorescence (TD-LIF) technique (Day et al., 2002; Wooldridge et al., 2010). Formaldehyde was measured with the University of Colorado-Boulder difference frequency absorption spectrometer (CAMS, or Compact Atmospheric Multi-species Spectrometer) (Weibring et al., 2010; Richter et al., 2015). Finally, HCN, HNO3, and dihydroxytoluene (DHT) were measured using the California Institute of Technology chemical ionization mass spectrometer (CIT-CIMS) (Crounse et al., 2006; Schwantes et al., 2017).
2.4.2 Supporting aerosol measurements
Refractory black carbon (BC) mass concentrations in the accumulation-mode size range were measured by the NOAA Single Particle Soot Photometer (SP2) (Schwarz et al., 2013; Lamb et al., 2018). was measured by both the University of New Hampshire mist-chamber ion chromatograph (MC/IC, fine mode only) (Talbot et al., 1997) and total particulate filters, analyzed offline with ion chromatography (fine and coarse mode with an estimated size cut of 4 µm) (Dibb et al., 2003; McNaughton et al., 2007; Heim et al., 2018). In addition to the CU-AMS, the Hankuk University of Foreign Studies operated an AMS on board as well (hereinafter referred to as K-AMS); however, they used a “capture vaporizer” (see Sect. 2.2 above). Briefly, the geometry and material of the vaporizer have been modified to reduce the amount of particle bounce, and this leads to a CE of ∼1 for all ambient species, albeit with more thermal decomposition (Jayne and Worsnop, 2016; Hu et al., 2017a, b, 2018a, b; Xu et al., 2017).
Finally, the physical concentration and properties of the aerosol were measured by the NASA Langley Aerosol Research Group (LARGE). These included (1) size-resolved particle number concentrations (values used to estimate surface area and volume) measured with a TSI laser aerosol spectrometer (LAS, model 3340; TSI Inc., St. Paul, MN; calibrated with a range of NIST traceable polystyrene latex (PSL) spheres, size range of 100–5000 nm in PSL mobility diameter), a SMPS (composed of a differential mobility analyzer, TSI model 3081 long column with custom flow system and SMPS operated using TSI software), and a condensation particle counter (TSI model 3010, size range of 10–200 nm in PSL mobility diameter). (2) Scattering coefficients at 450, 550, and 700 nm were measured with an integrating nephelometer (TSI, Inc. model 3563) and corrected for truncation errors per Anderson and Ogren (1998). (3) Absorption coefficients at 470, 532, and 660 nm were measured with a particle soot absorption photometer (PSAP, Radiance Research) and corrected for filter scattering per Virkkula (2010). In order to calculate extinction, which is used in this study, the measured Ångström exponent was used to adjust the scattering at 550 to 532 nm (Ziemba et al., 2013).
3.1 Intercomparisons of airborne PM1 during KORUS-AQ
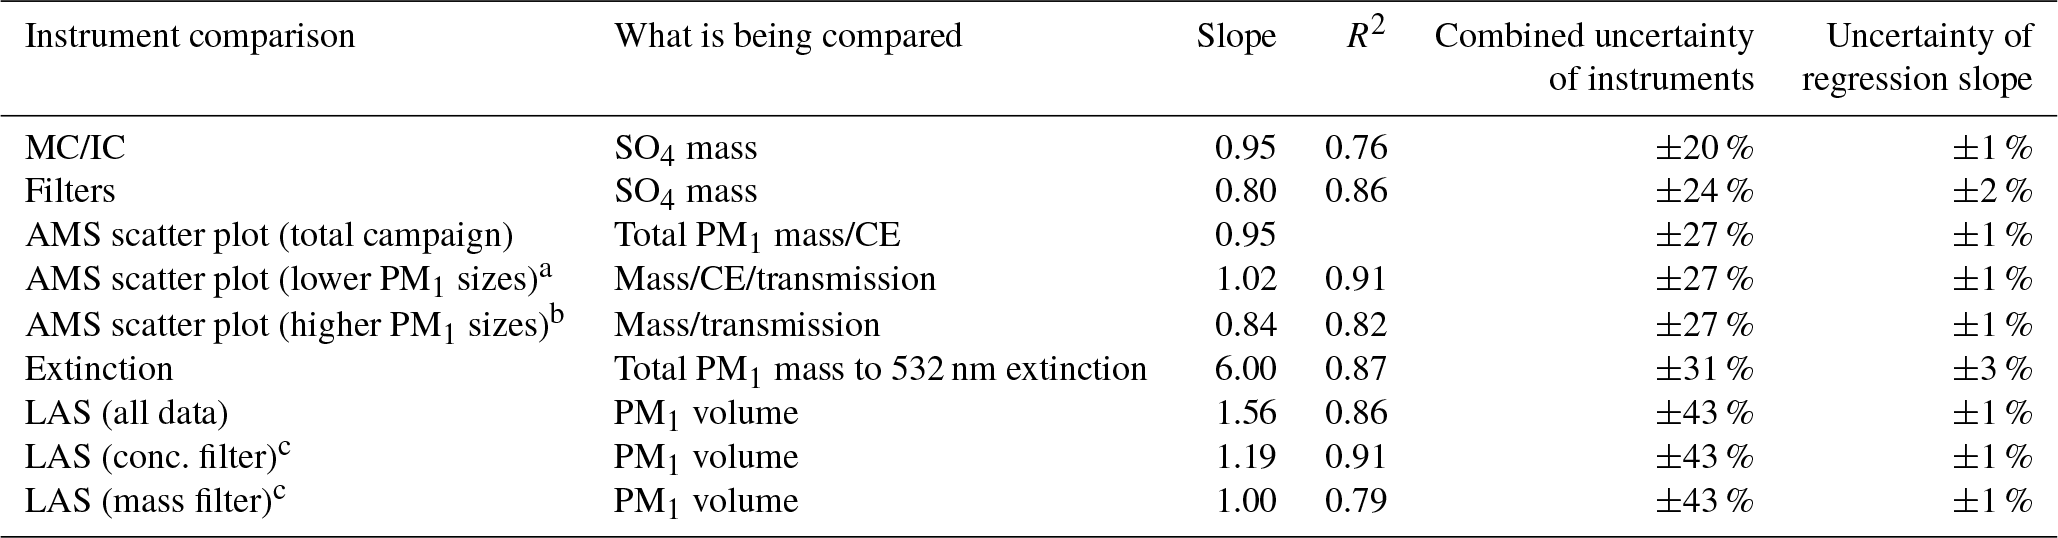
The intercomparison of aerosol measurements less than 1 µm is summarized here and shown in Table 1, and the full detailed intercomparison is found in Sect. S8. The AMS and the other aerosol measurements agree within their combined uncertainties, similar to prior studies (DeCarlo et al., 2008; Dunlea et al., 2009; Hayes et al., 2013; Liu et al., 2017; Schroder et al., 2018).
Table 1Overview of intercomparisons for KORUS-AQ CU-AMS versus other PM1 measurements. Uncertainties listed are 1σ.
a Comparison of K-AMS and CU-AMS for RFs 1–9, 11, 15, 19.
b Comparison of K-AMS and CU-AMS for RFs 10, 12–14, 16–18,
20.
c Using the lower concentration and mass filter. See Sect. S8 and
Fig. S27.
There are two comparisons that show lower agreement. The slope between AMS SO4 versus filter SO4 is 20 % lower than unity. As previously mentioned, the filters collect aerosols with diameters up to 4 µm, and Heim et al. (2018) concluded that the difference was due to supermicron throughout the campaign from the transport of dust from continental Asia to South Korea. Thus, the differences in the diameter cutoff among the AMS and filters and observations of supermicron are the likely cause of the lower slope. The comparison of calculated volume from AMS plus BC versus calculated volume from LAS indicates that the AMS- and BC-calculated volumes are higher. Part of the reason could be that LAS vaporizes BC (Kupc et al., 2018); however, as shown in Fig. 1, BC accounts for a small fraction of PM1. As discussed in Sect. S8, the LAS detector saturated at high particle number concentrations and high mass concentrations. This has also been observed by Liu et al. (2017) in a prior airborne campaign with the same instruments. Comparing the LAS and AMS plus BC volume at lower total mass concentrations and particle number concentrations, the difference is reduced to ∼10 %, which is well within the combined uncertainties.
3.2 PM1 concentration and composition over South Korea during KORUS-AQ
We briefly describe the PM1 composition observed over South Korea during the campaign and compare it to prior observations in the same region and for other large urban areas around the world. First, the comparison of PM1 in the boundary layer (estimated to be ∼600 m from temperature profiles measured on the DC-8 during the entire campaign, as shown in Fig. 1) in the KORUS-AQ domain is discussed. As shown in Fig. 1, the highest average PM1 values during KORUS-AQ were observed over the Yellow Sea during the transport/polluted RF (RF12, 24 May 2016), at 39 µg sm−3, and over Seoul, at 31 µg sm−3 (average of all flights over Seoul). However, during the latter half of the mission, PM1 was regularly greater than 60 µg sm−3, and as high as 100 µg sm−3, over Seoul. During the rest of the flights, the average mass concentration over the Yellow Sea was a factor of 3 lower (13 µg sm−3). Also, the Seoul and Yellow Sea PM1 composition was different, where SO4 and more-oxidized oxidized organic aerosol (MO-OOA) dominated the Yellow Sea PM1 budget, indicative of transported, aged chemistry (Dunlea et al., 2009; Lee et al., 2015). Also, the O∕C ratio for the Yellow Sea was 0.84 (YS clean) to 0.88 (YS polluted). Seoul showed higher fractions of less-oxidized OOA (LO-OOA) than MO-OOA, and higher pNO3 than SO4, which is more typical of fresher urban chemistry, with an average O∕C ratio of 0.70 (DeCarlo et al., 2008; Hennigan et al., 2008; Hayes et al., 2013; H. Kim et al., 2017, 2018). The eastern side of South Korea had lower average PM1 than observed over Seoul. This region of South Korea is not as highly populated as around Seoul, reducing the sources and production of PM1, and is more representative of PM1 background pollution/transport across the country. The average PM1 observed over the Jeju jetway was similar to what was observed over Seoul. Also, this area had similar contributions from hydrocarbon-like organic aerosol (HOA) and pNO3 similar to in Seoul, indicating that local emissions, including industry, along with transport and background, are impacting the PM1 composition (e.g., Hayes et al., 2013). This part of South Korea has some large population centers (e.g., Gwangju and Jeonju) and power plants (e.g., Boryeong power station), which are consistent with the observed impact.
The average PM1 observed over Seoul during KORUS-AQ was similar to the mass concentration measured in Seoul in previous years (37, 38, 37, 27, and 22 µg m−3 for Choi et al., 2012; H. S. Kim et al., 2007; H. C. Kim et al., 2016; Park et al., 2012; and H. Kim et al., 2017, respectively). Also, the average PM1 over the Yellow Sea during clean conditions (13 µg sm−3) is in line with what has been reported over Baengnyeong Island (Lee et al., 2015), located west of South Korea in the Yellow Sea (37∘58′00 N, 124∘37′04 S). Finally, the PM2.5 mass concentrations have remained nearly constant for the last ∼20 years (OECD, 2018).
The PM1 composition over Seoul is dominated by pNO3 and SOA, similar to what was observed on the ground during the same time period (Kim et al., 2018). The composition over Seoul is more similar to what has been observed over Mexico City during MILAGRO (DeCarlo et al., 2008) and in Los Angeles during CalNex (Hayes et al., 2013) than observed over large urban areas in Asia (Hu et al., 2016).
As the differences in PM1 composition for the different regions mostly occurred in the boundary layer, we show the average PM1 profile observed during all of KORUS-AQ in the inset of Fig. 1, and the fractional contribution to the profile in Fig. S32. At low altitudes, the PM1 mass is dominated by secondary PM1 species that compose the largest fractions in the pie charts in Fig. 1 (LO-OOA, MO-OOA, pNO3, and SO4). The fractional contributions of SO4 and MO-OOA to PM1 mass increase with altitude and become dominant above ∼4 km, representative of more aged aerosol, away from sources (e.g., Dunlea et al., 2009).
3.3 Analysis of background and transport influence on PM1
Transport of aerosols and aerosol precursors from distant sources creates a larger-scale background that needs to be quantified in order to understand the impact of local emissions on aerosol production. Prior studies have shown the potential impact of long-distance transport in creating a background aerosol mass over Seoul (H. S. Kim et al., 2007; Heo et al., 2009; Y. J. Kim et al., 2009; B. M. Kim et al., 2016; H. Kim et al., 2017, 2018; H. C. Kim et al., 2017; Jeong et al., 2017; Lee et al., 2017; Seo et al., 2017). To investigate the influence of background and transported air to Seoul, the FLEXPART Lagrangian model with WRF winds and meteorology is used. The application of FLEXPART to this study is described in Sect. S7. Briefly, the model uses back trajectories from the point at which the DC-8 was sampling and calculates the amount of CO and NO2 contributed by different emission regions for each sampled air parcel.
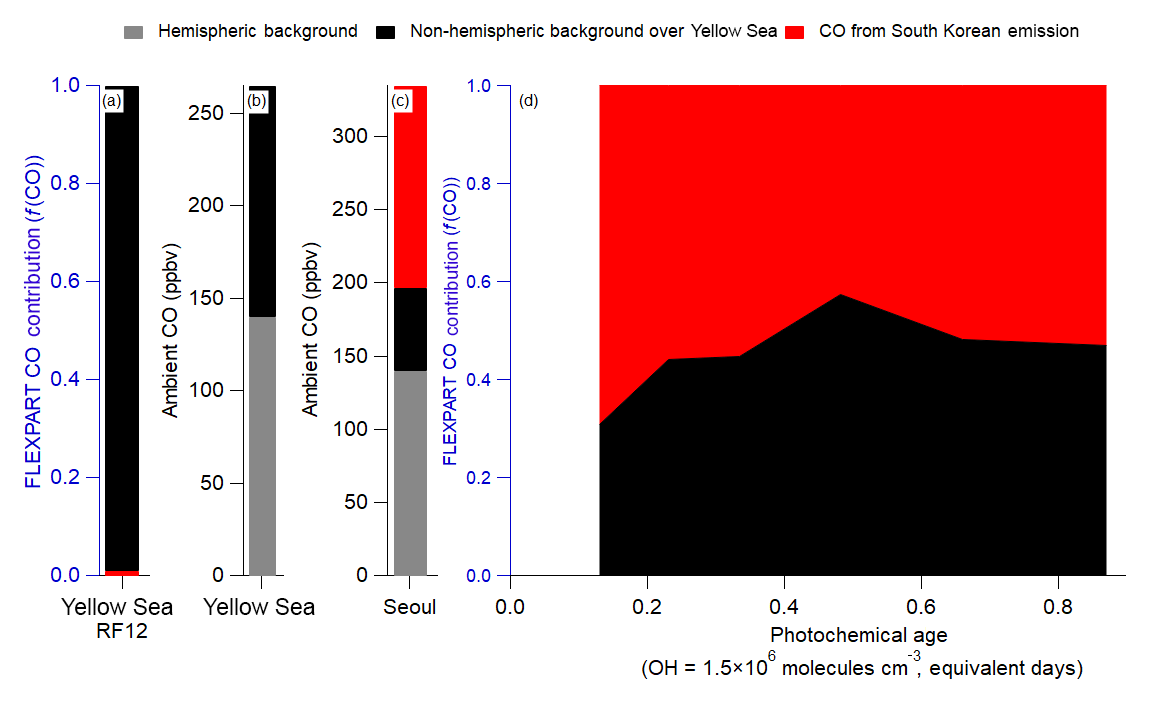
Figure 2Note differences in labels and values for each y axis. Also, note that FLEXPART does not include hemispheric background; therefore, it is not included in (a) and (d); however, it is included for the actual observations in (b) and (c). (a) Fractional contribution of foreign versus South Korean CO emission over the Yellow Sea from FLEXPART. (b) Estimated measured partitioning of the average CO observed over the Yellow Sea. (c) Same as (b), but for over Seoul. (d) Same as (a), but for over Seoul. For all panels, CO does not include any chemical losses or production.
The CO concentration measured during KORUS-AQ can be described by Eq. (2). The average CO mixing ratios observed during the campaign are used.
Here, is the hemispheric background of CO. In FLEXPART, the foreign emissions are from China, Hong Kong, Japan, Laos, Macau, Myanmar, Mongolia, North Korea, Russia, Taiwan, and Vietnam. FLEXPART does not include the CO hemispheric background; therefore, that term is estimated from upwind sites (Mt. Waliguan, China, and Ulaan-Uul, Mongolia) (Novelli et al., 2017) to be 140 ppbv CO. The Yellow Sea is the simplest case, as FLEXPART predicted that all the CO originated from the foreign sources listed above (Fig. 2a). Thus, COambient in the Yellow Sea can be attributed to 140 ppbv and 125 ppbv COforeign (Fig. 2b). The advection of CO from the Yellow Sea to Seoul will lead to dilution and mixing of the COforeign with air containing only . With an average wind speed of 4 m s−1 over the Yellow Sea, and a distance of ∼300 km, the air takes ∼1 actual day to move from where the DC-8 sampled over the Yellow Sea to Seoul. The results from FLEXPART are used to estimate the dilution rate, ∼0.7 day−1, comparable to the values determined in prior studies (McKeen et al., 1996; Price et al., 2004; Arnold et al., 2007; Dzepina et al., 2011; Fried et al., 2011). COforegin over Seoul was determined by Eq. (3), where day, day−1, and C(0)=125 ppbv. Using the full equation from McKeen et al. (1996), a similar value of 60 ppbv COforeign is derived.
With Eq. (2), the total CO background () is 200 ppbv, and the remainder of the observed ambient CO is attributed to local South Korean emissions (on average, 165 ppbv CO). Finally, results from FLEXPART show that the COforeign contribution (Fig. 2d) remained nearly constant throughout the campaign at all observed photochemical ages. Therefore, 200 ppbv CO background for observations over Seoul will be used throughout this study.
From the observed dilution-corrected OA concentrations (OA concentration divided by the hemispheric background subtracted CO mixing ratios) over the Yellow Sea (13 and 40 for clean Yellow Sea and RF12 Yellow Sea, respectively), the COforeign over Seoul would correspond to 1–3 µg sm−3 OA background (Eq. 4).
The upper limit will be used for the remainder of the study. The corresponding observed background values for HOA, LO-OOA, and MO-OOA are 0, 1±1, and 2±2 µg sm−3, respectively. Finally, the background for key gas-phase and aerosol species (which are discussed below) are 1.05±0.28 (CH2O), 69±5 (Ox), 0.25±0.06 (PAN), and 0.30±0.10 (ΣROONO2) ppbv; 0.44±0.34 (DHT) pptv; and 2±2 µg sm−3 (pNO3). Thus, the increase in OA mass concentration from the background values (3 µg sm−3) to average Seoul values (13 µg sm−3) must be due to South Korean emissions of POA and production of SOA.
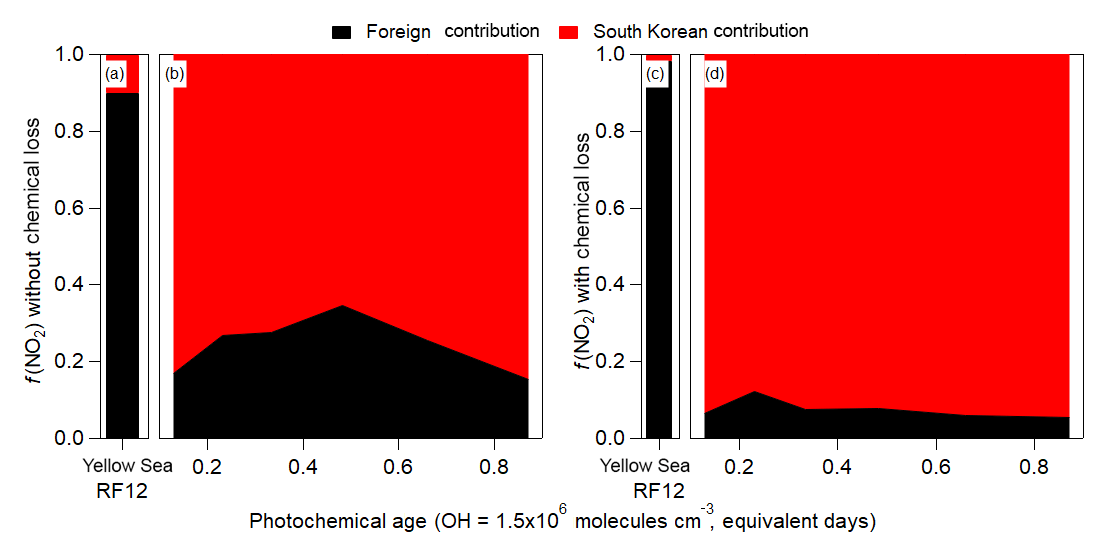
Figure 3Binned fractional contribution (South Korea ∕ (South Korea + foreign)) of the FLEXPART contributions to (a, b) NO2 (without any chemical losses) and (c, d) NO2 (with chemical losses (τ=1 day)) versus the observed (aircraft) photochemical age. For (a) and (c), the Yellow Sea bars are the average fractional contributions for RF12.
The contribution of foreign versus South Korean emissions of NO2 from FLEXPART over Seoul and the Yellow Sea (Fig. 3) is analyzed next. NO2 is investigated since it has a photochemical lifetime of ∼1 day (at OH molecules cm−3). This lifetime is similar to short-lived hydrocarbons (e.g., xylene, S/IVOC) that are thought to dominate urban SOA production in this campaign and other megacities (de Gouw et al., 2005; Kleinman et al., 2007, 2008; DeCarlo et al., 2010; Wood et al., 2010; Hayes et al., 2013, 2015; Hu et al., 2013, 2016; Ortega et al., 2016; Ma et al., 2017; Schroder et al., 2018). In general, f(NO2)foreign and f(NO2)local (with and without photochemical loss included in the FLEXPART model runs) is quite constant with photochemical age (Fig. 3), like CO. Unlike CO, the contribution of local NO2 is ∼70 % (if photochemical removal is not included) and ∼90 % (if photochemical removal is included). This strongly suggests that most short-lived hydrocarbons over Seoul, which are believed to dominate urban SOA production, are dominated by South Korean emissions and not transport from foreign sources.
4.1 SOA production over Seoul during KORUS-AQ
The conceptual model for analysis of photochemical SOA production over and downwind of megacities has been discussed in detail in de Gouw et al. (2005) and DeCarlo et al. (2010) and subsequent studies (Hayes et al., 2013; Hu et al., 2013, 2016; Freney et al., 2014; Schroder et al., 2018). An air mass with background values of OA and CO is advected over a megacity area, where fresh emissions of POA, SOA precursors, and CO are emitted into the air mass. The SOA precursors will oxidize to produce SOA and undergo dilution with the surrounding background air masses. To correct for this dilution effect, the change of OA over background OA () is divided by the change of CO over background CO (), and this term is the dilution-corrected concentration. CO has been used in prior studies as a surrogate for primary pollution emissions as this compound has a high SNR between urban plumes and background and a long photochemical lifetime (meaning minimal CO is lost due to chemistry or produced from VOC oxidation over a ∼1-day timescale; Griffin et al., 2007) (de Gouw et al., 2005; DeCarlo et al., 2010). Finally, ΔOA∕ΔCO is plotted versus estimated photochemical age. The photochemical age approximately accounts for the chemical evolution of precursors either into products, which can be estimated from the time evolution of NOx∕NOy, or the differences in removal rates of two hydrocarbons (o-xylene or m+p-xylene to ethylbenzene). See Sect. S5 for more information about the calculation of the photochemical age. The potential impact of SOA precursors being advected into Seoul is addressed in Sect. 4.4.
Throughout the paper, the estimated photochemical age from NOx∕NOy will be used as this measurement has higher temporal coverage, and an emission ratio is not needed to calculate the photochemical age (Sect. S5), but note that ages estimated from hydrocarbon-based clocks are consistent. For photochemical ages greater than 1 day (measurements over the Yellow Sea), the aromatic photochemical clock is used (Sect. S5) as the NOx∕NOy clock does not work well past 1 equivalent day (Sect. S5). As discussed in Parrish et al. (2007), compounds used to calculate photochemical ages should have lifetimes on the order of the range in ages to be quantified. For example, photochemical age over Seoul is less than 1 equivalent day, which is equivalent to the NOx lifetime; whereas, the photochemical age over the Yellow Sea is expected to be a few equivalent days, which is bracketed by the lifetimes of benzene and toluene.
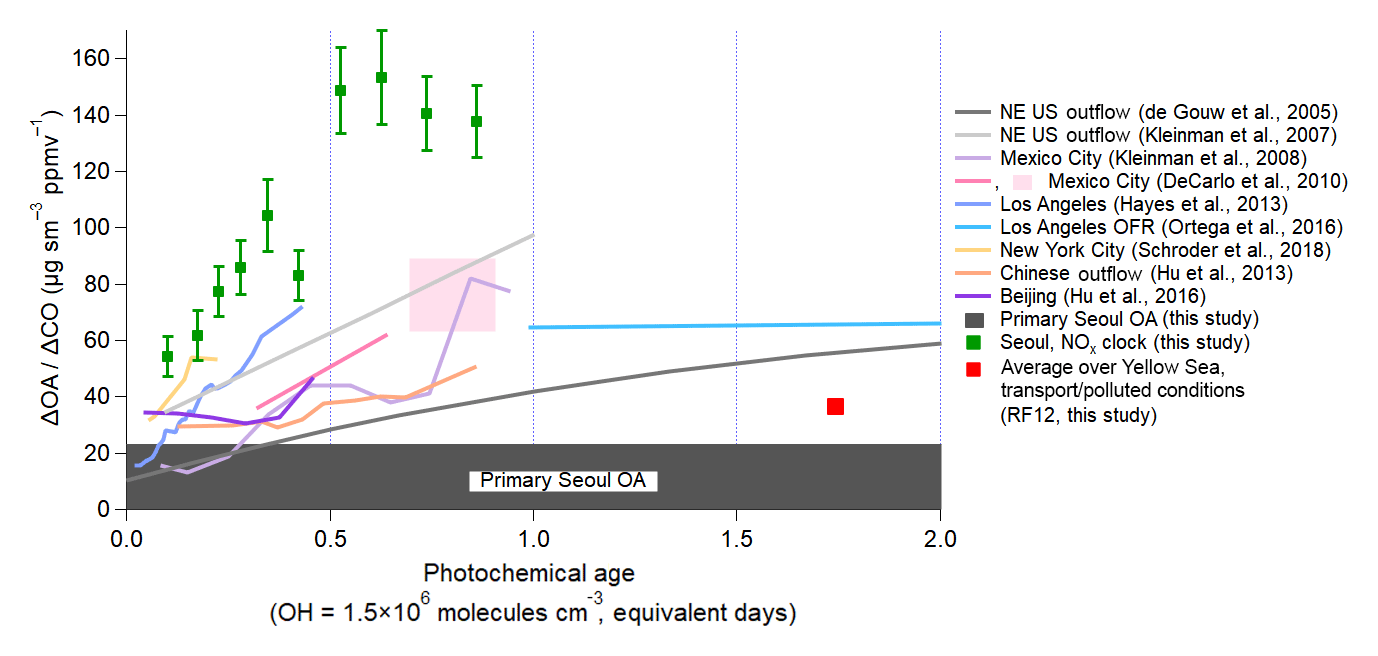
Figure 4Evolution of dilution-corrected OA versus equivalent photochemical age (days), for which and , during KORUS-AQ. Over Seoul and the Yellow Sea, the CO background is 200 (hemispheric plus foreign) and 140 ppbv (hemispheric only), respectively. The vertical error bars for the observations during KORUS-AQ are the standard error of ΔOA∕ΔCO for each bin. Photochemical age is determined by the NOx∕NOy ratio. The dark grey bar at the bottom (23 ) is the observed POA over Seoul during the campaign. Observations from other megacities (de Gouw et al., 2005; Kleinman et al., 2007, 2008; DeCarlo et al., 2010; Hayes et al., 2013; Hu et al., 2013, 2016; Ortega et al., 2016; Schroder et al., 2018) are also shown, as lines, for comparison, and have been updated, as described in Schroder et al. (2018).
Similar to prior studies, OA over Seoul increased rapidly within the first photochemical equivalent day from the emission source (Fig. 4). The dilution-corrected SOA production is very rapid for photochemical ages of less than 0.7 equivalent days (note that this would be only 4 h of exposure for an average OH concentration of 6×10⁶ molecules cm−3 observed during this campaign). After that time, the dilution-corrected OA plateaus and remains nearly constant. George et al. (2008) and Ortega et al. (2016) found that after ∼4–5 equivalent days, OH heterogeneous reactions start fragmenting the compounds in SOA, leading to a reduction in the dilution-corrected OA mass with age. Compared to prior megacity studies, the dilution-corrected OA produced over Seoul is between 40 and 80 higher at ∼0.5 equivalent days of photochemical aging and ∼70 higher than in Chinese megacities (Hu et al., 2013, 2016). Qualitatively, the timescale for the production and plateauing of dilution-corrected OA is similar for Seoul, Los Angeles, and Mexico City; however, the amount of OA produced per CO is larger for Seoul compared to Los Angeles and Mexico City. It also appears not to be significantly influenced by the outflow of upwind Chinese megacities since Seoul SOA formation is very rapid and occurs much faster than for air masses transported from those megacities and since the dilution-corrected production is much larger in Seoul than in Chinese megacities.
Finally, though the absolute ΔOA∕ΔCO value changes depending on background CO used, assuming a lower CO background does not change the general results that Seoul has higher and more rapid SOA production than has been observed in prior megacities. As shown in Fig. S34, the OA mass concentration increases versus CO mixing ratios as photochemical age increases, and in Fig. S35, even assuming a lower CO background (140 ppbv), the dilution-corrected OA concentration is still ∼100 . This value is still higher than what has been observed in prior cities (Fig. 4). If the CO background is higher than assumed here (200 pbbv), the OA production would be even higher.
To further investigate the potential influence from upwind megacities, we compare ΔOA∕ΔCO over the Yellow Sea versus that over Seoul (Fig. 4). The average ΔOA∕ΔCO ratio over the Yellow Sea during the transport/polluted conditions (RF12, 24 May 2016) is ∼40 . Since 40 has been observed in and downwind of China (Hu et al., 2013, 2016), and observed over the Yellow Sea during the transport/polluted event, this dilution-corrected OA concentration is taken to be representative of transport events from China to South Korea. This value has already been subtracted from the observations over Seoul. The fact that OA concentrations are greater than POA concentrations at the youngest photochemical ages may be due to (1) very rapid SOA production, (2) sunrise occurring 3–4 h (sunrise between 05:10 and 05:30 LT) prior to sampling air over Seoul in the morning, and (3) the imperfect characterization provided by the average photochemical age when fresh emissions have been recently injected into an air parcel.
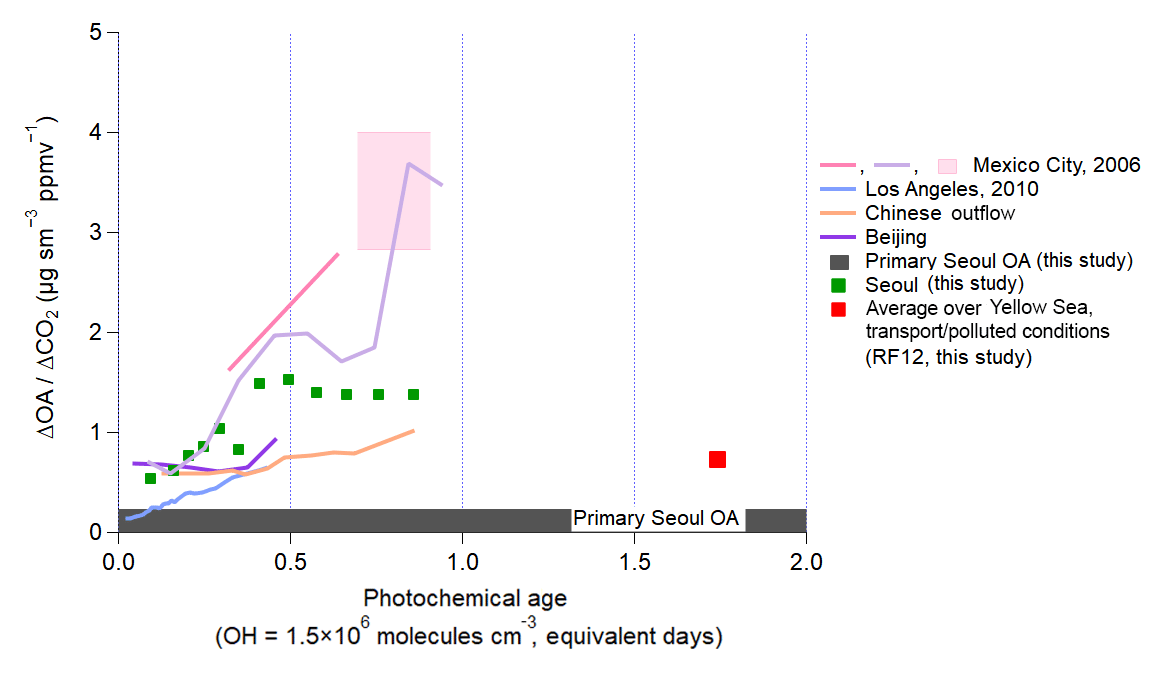
Figure 5Same as Fig. 4, but normalized by ΔCO2. The ratios of ΔOA to ΔCO2 are calculated using ΔCO∕ΔCO2 emission ratios from prior studies in each megacity that occur during the same campaign or for the same time of year since direct measurements of the CO2 enhancements above background during the aircraft studies of each megacity are very challenging. (Table S4).
Here, we introduce another dilution-correction method to investigate SOA production over a megacity – ΔOA∕ΔCO2 (Fig. 5). ΔOA∕ΔCO2 is a way to investigate the amount of OA produced per unit mass of fuel burned in each megacity. Note that although some SOA precursors are not emitted from combustion sources, such as volatile chemical products (McDonald et al., 2018), one can still define this ratio in an average sense for each megacity. It has been used previously for laboratory experiments (e.g., Gordon et al., 2013; Platt et al., 2013, 2017) and biomass burning (e.g., Akagi et al., 2012; Collier et al., 2016); however, to the best of the authors' knowledge, it has not been used for SOA production over a megacity. As noted above, CO has been typically used instead, given that it is always measured in pollution studies, and it typically has a higher signal-to-background ratio than CO2 in urban areas. Also, during spring and summer, CO2 is taken up by plants, which can reduce its signal-to-background ratio. However, the ratio of other gases to CO can vary among urban areas depending on the average combustion efficiency of the dominant sources (Silva et al., 2013). CO2 better accounts for fuel consumption in an urban area (Vay et al., 2009; Tang et al., 2018). Multiple recent studies have reported average emission ratios for different megacities based on high-precision measurements of ΔCO∕ΔCO2 (Vay et al., 2009; Wang et al., 2010; Peischl et al., 2013; Silva et al., 2013; Tohjima et al., 2014; Tang et al., 2018). These results provide an ability to convert the ΔOA∕ΔCO ratio determined in prior studies to ΔOA∕ΔCO2 (Table S4). We find that for most of the megacities studied, ΔOA∕ΔCO2 is very similar, though Mexico City and Seoul show higher values (approximately factor of 2). The range of observed ΔOA/ΔCO2 versus photochemical age is narrower, compared to the spread for all megacities observed for ΔOA∕ΔCO. Both analyses suggest that Seoul has larger relative emissions of SOA precursors compared to other megacities, which could be targeted for air quality improvement. However, more observations across other megacities and additional comparative analyses would be beneficial.
4.2 Composition-based analysis of the foreign versus South Korean contribution to SOA precursors and SOA over Seoul
4.2.1 Evolution of oxygenated organic aerosol over Seoul
Here, we focus on the positive matrix factorization (PMF) (Ulbrich et al., 2009) factors for OA resolved during KORUS-AQ, whose evolution over Seoul is shown in Fig. 6. Total OOA (LO-OOA plus MO-OOA) is used as a surrogate of total SOA. The fractional contribution of these two factors can be found in Fig. S36. Rapid production of OOA is observed, accounting for all of the observed growth in total OA over Seoul. LO-OOA, overall, is slightly more abundant than MO-OOA (Fig. S36). LO-OOA has lower O∕C compared to MO-OOA (Fig. S10); thus, the faster production of LO-OOA likely represents the LO-OOA produced from the photooxidation of SOA precursors (Hayes et al., 2013; Freney et al., 2014; Hu et al., 2016; Kim et al., 2018), while MO-OOA may represent the more-oxidized species or those formed from later generations of oxidation (Robinson et al., 2007; Miracolo et al., 2010; Tritscher et al., 2011; Ortega et al., 2016; Sato et al., 2017; Schwantes et al., 2017).
The PMF factors have very different dilution-corrected concentrations over the Yellow Sea during the transport/polluted event (Fig. 6a). All ΔPMF factor ∕ ΔCO ratios show much lower values than for aged air over Seoul. The discontinuity among the PMF factors between Seoul and the Yellow Sea indicates that transported OA, and transported SOA production, has a limited impact on the OA over Seoul.
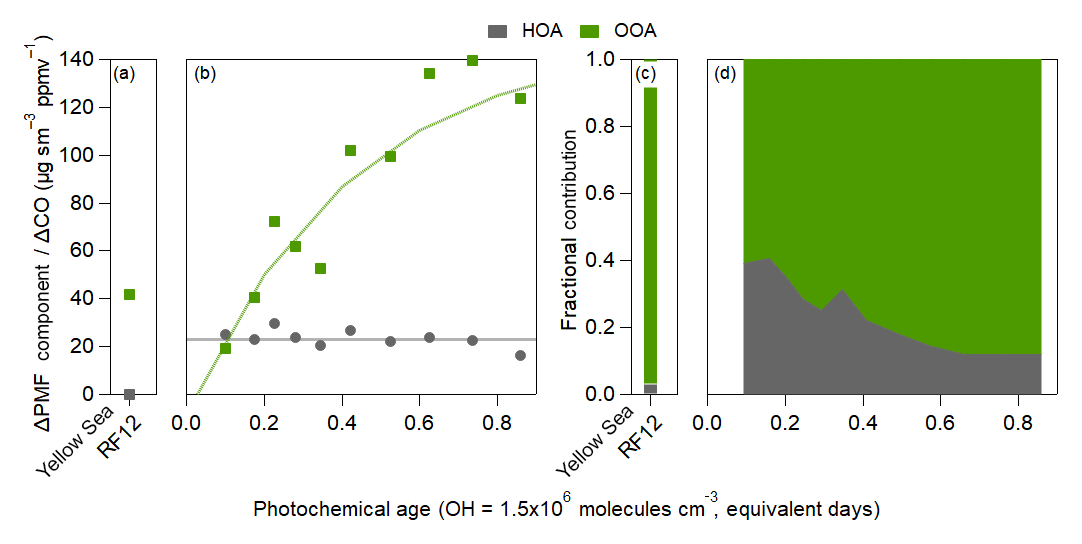
Figure 6Same as Fig. 4, but for the PMF results of the OA evolution over (a) the Yellow Sea during the polluted event (Yellow Sea RF12 at ∼1.75 equivalent days) and (b) over Seoul. For (b), fits to HOA and OOA are 23 and , respectively. For the OOA equation, 150 equals the max SOA. Fractional contribution of the PMF factors over (c) the Yellow Sea (RF12) and (d) over Seoul.
The slope of ΔHOA∕ΔCO versus age was nearly zero equivalent day−1, indicating minimal evolution within these timescales. There are mixed results on whether HOA changes with photochemical age (DeCarlo et al., 2010; Hayes et al., 2013; Hu et al., 2013, 2016; Freney et al., 2014; Schroder et al., 2018); however, due to the uncertainty that comes from the CO background, it is difficult to determine whether these changes are real or not.
At the lowest photochemical ages, HOA is ∼35 % of the total ΔOA∕ΔCO (Fig. 6d). Since HOA remains approximately constant with age while OOA rapidly increases (Fig. 6b), the HOA contribution to total ΔOA∕ΔCO decreases to ∼10 % after ∼1 equivalent day. It has been observed in prior urban campaigns that HOA contributes 10 %–50 % and total POA (HOA + other primary OA factors in AMS) contributes 30 %–60 % (Aiken et al., 2009; DeCarlo et al., 2010; Hayes et al., 2013; Crippa et al., 2014; Hu et al., 2016; H. Kim et al., 2017, 2018). The fractional contribution of HOA in Seoul is within this range.
A more detailed discussion of the behavior of AMS OA source tracers can be found in Sect. 11. In general, the AMS OA source tracers behave similarly to other urban campaigns (e.g., Hayes et al., 2013; Freney et al., 2014). Some dilute biomass burning OA was evident, but this source was not major for most of the KORUS-AQ. Similarly, isoprene oxidation chemistry was not a major contributor to SOA during this campaign.
4.2.2 Correlation of SOA versus other fast photochemical products
Results above support that a major fraction of the SOA observed over Seoul is rapidly produced through photooxidation of South Korean SOA precursors. To further evaluate this result, we analyze the correlation of OOA with other secondary species known to be rapidly produced through photooxidation of organic precursors.
The other secondary species used in this study are odd oxygen (Ox), formaldehyde (CH2O), PAN, the sum of all acyl peroxy nitrates (ΣROONO2), and pNO3. Ox (approximated as NO2+O3) is used instead of O3 to account for titration of O3 in the presence of fresh NO emissions. Prior studies have used Ox to provide insights into SOA production (Herndon et al., 2008; Wood et al., 2010; Hayes et al., 2013; Morino et al., 2014; Zhang et al., 2015; Hu et al., 2016) since Ox has a similar lifetime to SOA (∼1 week) (Jacob, 2000; Goldberg et al., 2015; Hodzic et al., 2015; Ortega et al., 2016), and Ox is also produced through the photooxidation of organic compounds. However, since both Ox and SOA have longer lifetimes, the correlation observed between these two species may have a contribution from transport of polluted air masses. To reduce the influence of transport on this analysis, the correlation of OOA with CH2O, PAN, ΣROONO2, and pNO3 is also investigated. The benefit of these species is that they have estimated lifetimes of less than 3 h during daytime in KORUS-AQ (typical temperature for transported air 17 ∘C). pNO3 is also used as it has been shown that dilution-corrected pNO3 decreases rapidly from urban centers, possibly due to dilution with surrounding air low in HNO3 and NH3 and irreversible uptake of HNO3 onto coarser particles (e.g., DeCarlo et al., 2008).
Example time series of OOA with Ox, CH2O, PAN, ΣROONO2, and pNO3 during three different afternoon Seoul overpasses are shown in Fig. 7a. All gas and aerosol species exhibit similar behavior, indicating that these species are undergoing photochemical production during these afternoon passes, similar to what has been observed in other urban environments during the afternoon (Perring et al., 2010; Fried et al., 2011; Parrish et al., 2012; Hayes et al., 2013; Zhang et al., 2015). OOA also tracks the evolution of these species, consistent with OOA also being a secondary product from hydrocarbon photooxidation.
Analyzing the entire KORUS-AQ campaign, correlations of R2>0.50 are observed between OOA and Ox, CH2O, PAN, ΣROONO2, and pNO3 for the overpass observations after 12:00 LT (Fig. 7b–f). These correlations for these secondary species produced through the oxidation of hydrocarbons, in the afternoon, when photochemical production dominates over mixing and losses, further supports that the OOA production observed in Figs. 4 and 6 is dominated by the photochemistry of locally emitted hydrocarbons.
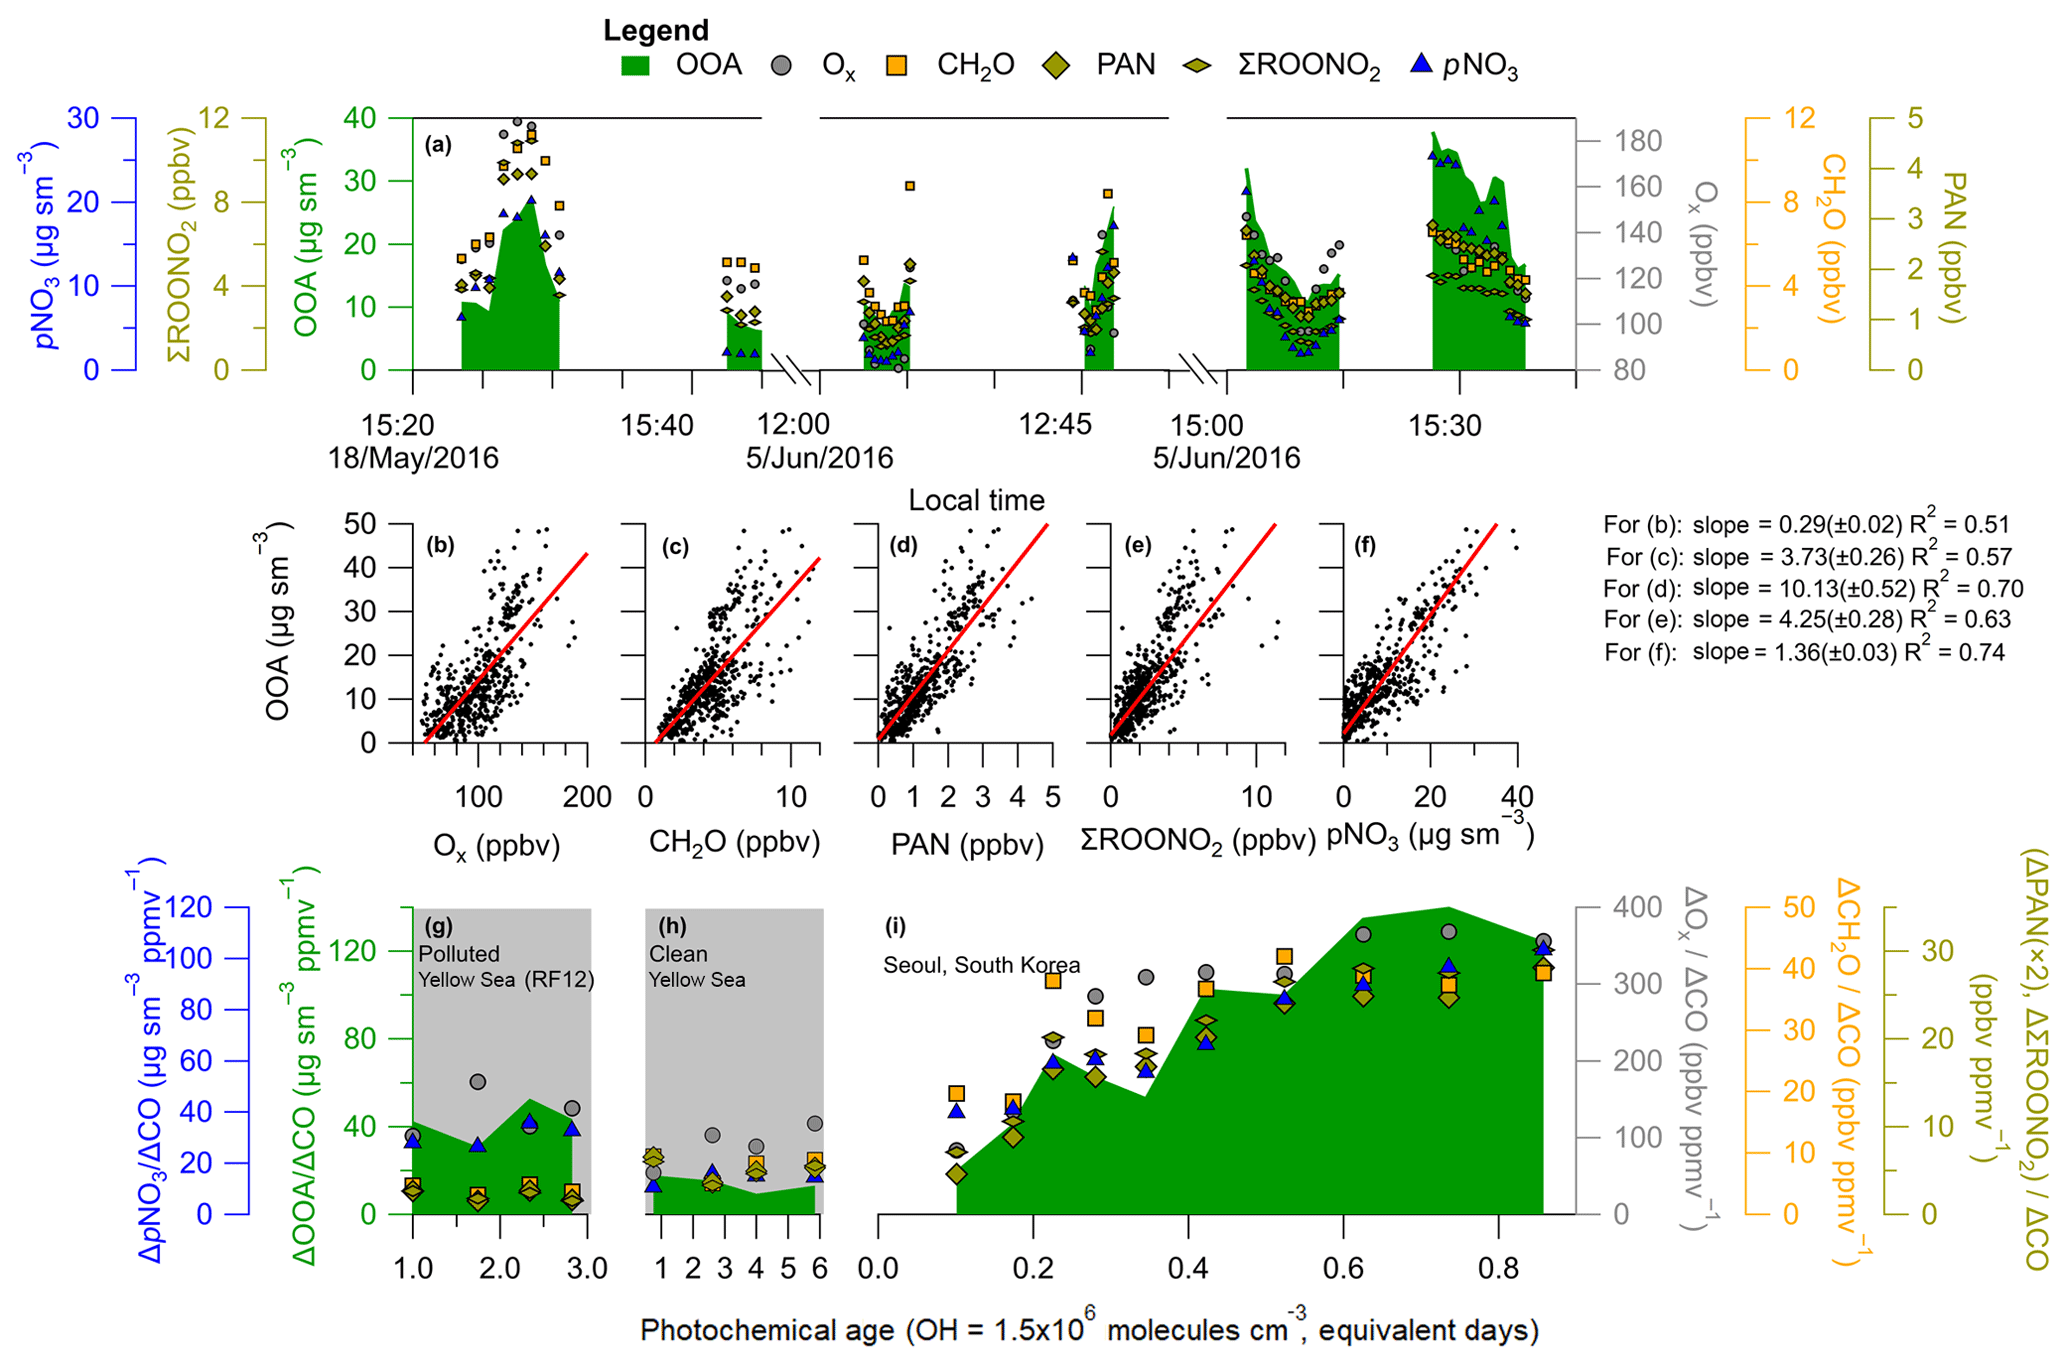
Figure 7(a) Time series of OOA (), Ox, CH2O, PAN, ΣROONO2, and pNO3 during RF09 (18 May 2016), and RF18 (5 June 2016) noon and afternoon overpasses. Gaps in time series correspond to climbing out of the boundary layer. OOA versus (b) Ox (), (c) CH2O, (d) PAN, (e) ΣROONO2, and (f) pNO3 over Seoul, South Korea, during KORUS-AQ. For (b)–(f), the observations are after 12:00 LT (03:00 UTC), the black dots are all data, and the slopes (red line) are an ODR fit to the data. (g–i) Same as Fig. 6 for ΔOOA∕ΔCO versus photochemical age, and including the dilution-corrected production of Ox, CH2O, PAN, ΣROONO2, and pNO3. Panel (g) shows observations over the Yellow Sea (RF12), (h) over the Yellow Sea (normal conditions), and (i) over Seoul. Similar to Fig. 4, the Δ corresponds to subtracting the background values for the respective species.
Ox, CH2O, PAN, ΣROONO2, and pNO3, when dilution-corrected with ΔCO, show a trend similar to that in OOA (Fig. 7i). From the lowest observed photochemical age (∼0.1 equivalent day) to the highest (∼0.85 equivalent day), Ox, CH2O, PAN, ΣROONO2, and pNO3 increase by factors of 4, 2, 7, 4, and 2, respectively. Over Mexico City, increases of factors of ∼2 (CH2O) (Fried et al., 2011) and ∼3 (ΣROONO2) (Perring et al., 2010) were observed, which are comparable to the Seoul observations. These rapid increases can only be explained by photooxidation of South Korean primary emissions (hydrocarbons and NOx).
The influence of the upwind background air masses over the Yellow Sea are investigated and shown in Fig. 7g and h. Over the Yellow Sea, the dilution-corrected concentrations of SOA, Ox, CH2O, PAN, ΣROONO2, and pNO3 were all nearly constant. This indicates that the secondary short-lived gas-phase species have reached steady state. Also, since dilution-corrected SOA concentration is flat, this suggests that the SOA precursors have been depleted, and the SOA production has ended, with SOA concentration reaching the plateau that is typically observed after ∼1 equivalent day (Ortega et al., 2016). The low PAN concentration and influence from transport over the Yellow Sea was also observed by Lee et al. (2012) over Baengnyeong Island, a regional background monitoring location for Seoul and South Korea, during August 2010 and March–April 2011. This further indicates low amounts of PAN are transported due to its thermal decomposition and very short lifetime, and any production, and correlation, of PAN with OOA would suggest local photochemical production.
In addition to the ubiquitous (but less specific) secondary species from organic compound oxidation, OOA shows a robust correlation with DHT (Fig. 8), a known SOA precursor from toluene photooxidation (Schwantes et al., 2017). DHT is very short lived, with a photochemical lifetime of less than 1 h, and it is formed under both low- and high-NO conditions (Schwantes et al., 2017). The lower correlation, compared to the ubiquitous secondary species, is possibly due to DHT forming from one precursor (toluene) instead of the broad range of precursors that form OOA and Ox, PAN, and CH2O. The correlation of OOA with a known SOA precursor, which is very short-lived, again supports that OOA production is dominated by photooxidation of locally emitted hydrocarbons, including toluene. The increasing ratio of OOA to DHT also suggests that SOA production is fastest at low equivalent ages and starts to plateau at higher ages.
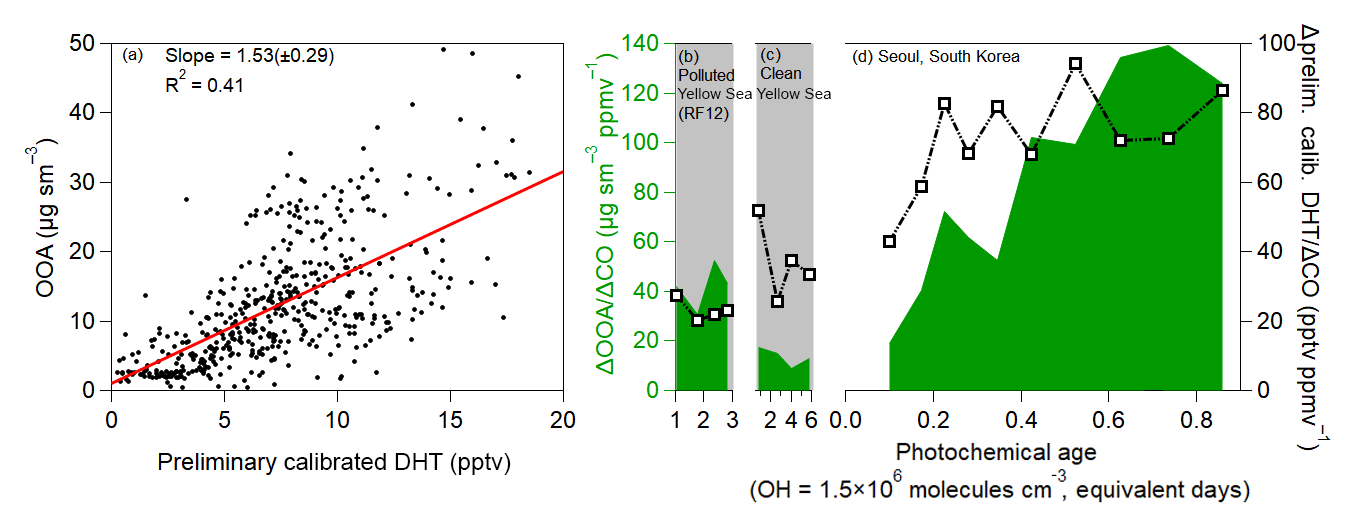
Figure 8(a) Scatter plot of OOA versus DHT over Seoul, South Korea, during KORUS-AQ, after 12:00 LT (03:00 UTC). (b) Same as Fig. 7g, but for DHT over the Yellow Sea (RF12). (c) Same as Fig. 7h, but for DHT over the Yellow Sea. (d) Same as Fig. 7i, but for DHT over Seoul. As an important note, concentrations of DHT are based on a preliminary calibration; however, any further calibrations are not expected to impact the relative trend and general correlation.
The correlation between OOA and secondary species that have very short lifetimes further suggests that the observed OOA is dominantly due to photooxidation of local emissions to produce SOA and the other secondary species and not transport. This is due to the fact that the short photochemical lifetimes of PAN, CH2O, DHT, and ΣROONO2 would cause the secondary species to be in steady state. The observations over the Yellow Sea, which is mainly upwind of Seoul and thus background air, show much lower ratios. These two observations further suggest that local SMA emissions are the precursors that undergo rapid photooxidation to produce SOA, pNO3, and the other secondary species.
4.2.3 Oxidation state of SOA
We investigate the oxidation state of the observed OA with the van Krevelen diagram (Heald et al., 2010) in Fig. 9a. The slope over Seoul (−0.69) is close to the average slope for numerous studies summarized by Chen et al. (2015) (−0.60) and similar to the range of slopes (−0.7 to −1.0) for studies impacted by urban pollution (Aiken et al., 2009; Docherty et al., 2011; Ge et al., 2012), including Los Angeles during CalNex (ranges from −0.64 to −0.68 from Hayes et al., 2013, and Ortega et al., 2016) or chamber studies investigating the photooxidation of combustion exhausts (Heald et al., 2010; Lambe et al., 2012; Jathar et al., 2013; Presto et al., 2014; Tkacik et al., 2014; Liu et al., 2015). This generally indicates that the photochemistry controlling the production of SOA is similar in urban areas, including photooxidation of diesel and gasoline emissions, evaporative diesel and gasoline, and cooking emissions (Hayes et al., 2015; Woody et al., 2016; Janssen et al., 2017; Ma et al., 2017; Kim et al., 2018).
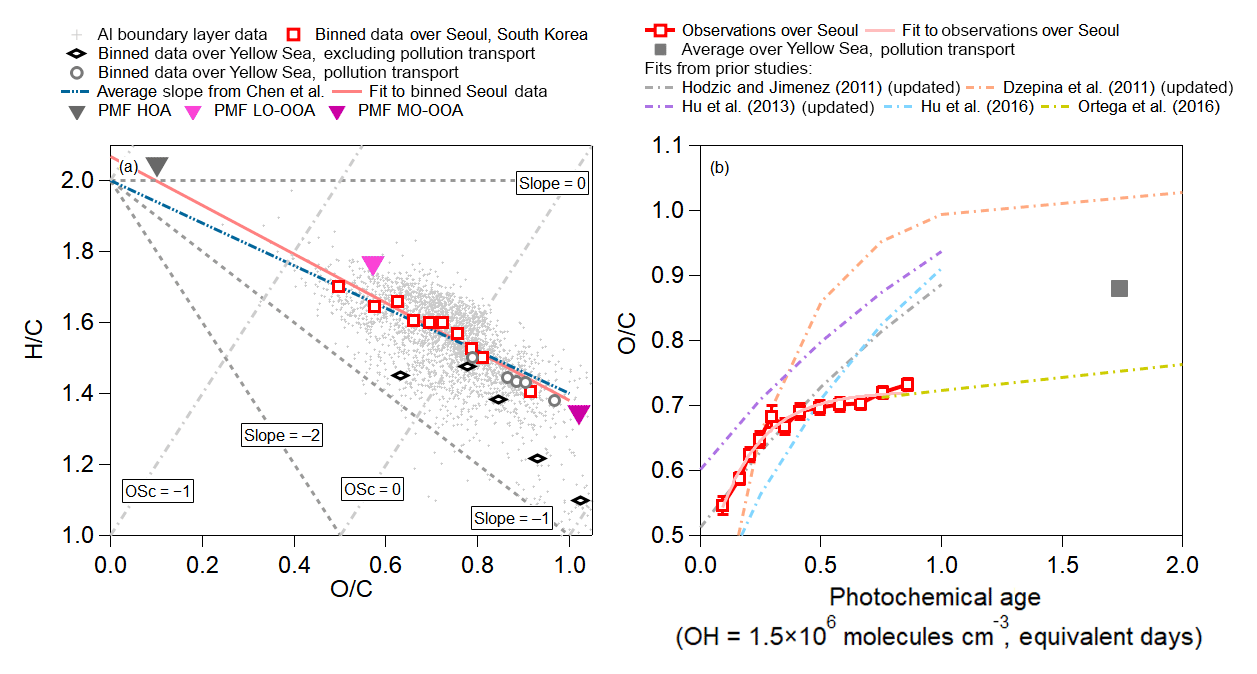
Figure 9(a) Van Krevelen diagram for all of KORUS-AQ. (Kroll et al., 2011). The observations are binned into deciles for observations over Seoul, South Korea, and binned into five bins for the clean Yellow Sea and polluted Yellow Sea. The teal line represents the average slope reported in Chen et al. (2015) of −0.60, and the light red line represents the slope ( and ) observed over Seoul, South Korea, during the campaign. (b) Binned O∕C from observations versus photochemical age, over Seoul, South Korea, and averaged O∕C versus photochemical clock over polluted Yellow Sea. The light red line is the fit to the observations over Seoul during KORUS-AQ. The values of O∕C versus photochemical age from Hodzic and Jimenez (2011), Dzepina et al. (2011), and Hu et al. (2013) are updated with calibrations of Canagaratna et al. (2015), whereas Hu et al. (2016) and Ortega et al. (2016) did not need updates.
The transport/polluted evolution of H∕C versus O∕C falls on the same slope as the observations over Seoul; however, the values lie at higher O∕C ratios, indicative of more aged OOA. O∕C versus H∕C during the transported/polluted event over the Yellow Sea is also comparable to the H∕C versus O∕C slope (−0.63) observed in Chinese outflow at Changdao (Hu et al., 2013). Conversely, O∕C versus H∕C ratios over the Yellow Sea during clean events show distinctly lower values and a steeper evolution ().
The evolution of O∕C with photochemical age over Seoul and over the Yellow Sea is shown in Fig. 9b, along with results from prior studies (Dzepina et al., 2011; Hodzic and Jimenez, 2011; Hu et al., 2013, 2016; Ortega et al., 2016). Note that older studies have been updated with the calibration of Canagaratna et al. (2015). For the first 0.5 equivalent days, O∕C is nearly identical to the Mexico City observations (Hodzic and Jimenez, 2011); however, after 0.5 equivalent days, the O∕C ratio growth slows down. The O∕C evolution then becomes more similar to that observed when processing Los Angeles air in an OFR (Ortega et al., 2016). The evolution of O∕C over Seoul is at the low end of the range of values observed from prior megacities. The average O∕C value observed over the Yellow Sea during RF12 is more similar to the values observed after 1 equivalent day at two sites in China (Hu et al., 2013, 2016).
4.3 Influence of local versus transported SOA precursors to SOA production over Seoul
OFR results can be used to investigate the role of SOA production from South Korean and Seoul emissions versus long-distance-transported SOA precursors. As shown in prior studies (Ortega et al., 2016; Palm et al., 2016, 2017, 2018), the SOA potential decreases drastically in the daytime, as the most reactive compounds to OH have already oxidized and formed SOA. Thus, these results will not directly capture the full emitted SOA potential for Seoul, South Korea. Also, recent studies indicate that lower-volatility species (e.g., S/IVOCs) can be lost to tubing walls, or their transfer can be greatly delayed (Pagonis et al., 2017; Deming et al., 2018; Liu et al., 2018). Thus, it is likely that the OFR inlet line on the DC-8 acted at least as a partial sink of S/IVOCs and thus reduced the measured potential SOA. As a reminder, a correction is included for the condensational sink of LVOC in the OFR based on Eq. (1).
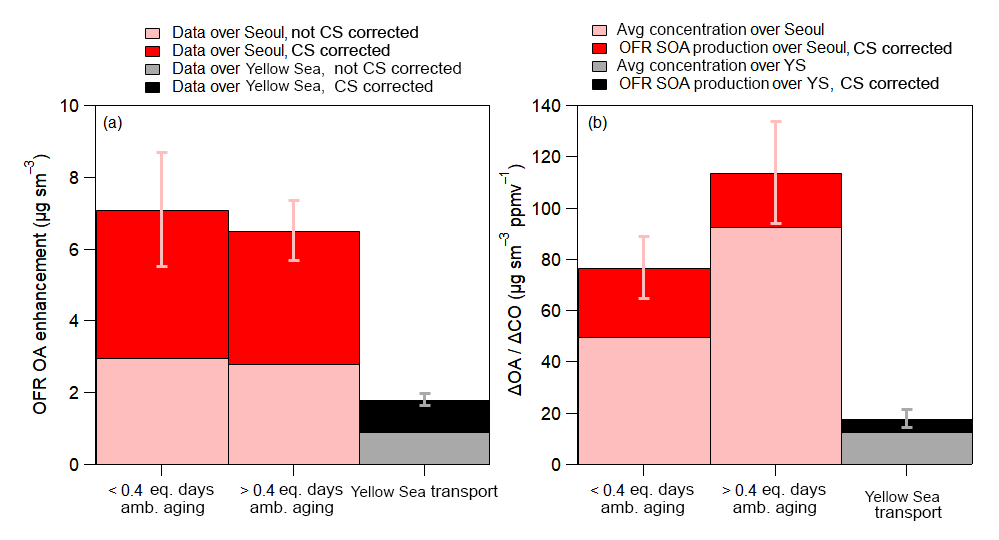
Figure 10(a) Comparison of OFR OA enhancement (OFR OA enhancement = OA exiting OFR − ambient OA) over Seoul, South Korea, and the Yellow Sea, corrected for evaporation losses. The difference between the two stacked shaded bars is that the lighter (bottom) shade has no condensational sink correction whereas the darker shade does. (b) The lighter color represents the average dilution-corrected observed ambient OA preexisting concentration corresponding to the OFR observations of the same air mass. The darker color represents the dilution-corrected SOA production in the OFR. The average additional photochemical age added in the OFR is ∼4 days ( ) over both Seoul and the Yellow Sea (YS). Also, the observations for the Yellow Sea are for all flights, not including RF12, and the average ΔOA∕ΔCO was 13 . For both (a) and (b), the OFR observations over Seoul are split between lower and higher equivalent ages (see x axis). The average ambient ages for the two bars are 0.17 and 0.63 equivalent days. Error bars are the standard errors of the observations.
The average OA enhancement in the OFR (OA enhancement = OA in OFR − ambient OA) in Seoul is slightly greater for the less-aged ambient air (7.1±1.6 versus 6.5±0.8 µg sm−3) but both values lie within the range of the measurements (Fig. 10a). The less-aged ambient air showing slightly higher OA enhancement suggests that more SOA precursors might have been present and available to form SOA mass (Ortega et al., 2016; Palm et al., 2016, 2017, 2018). The OA enhancement observed over Seoul was a factor of 3.5 greater than observed over the Yellow Sea (∼7 µg sm−3 over Seoul versus ∼2 µg sm−3 over the Yellow Sea). The much higher SOA formation potential observed over Seoul versus the Yellow Sea indicates that the majority of the precursors that led to the observed SOA and SOA production over Seoul originated from local emissions, consistent with the results above.
Plotting the OA enhancements as ΔOA∕ΔCO, similar to in Fig. 4, the amount of ambient SOA production, not including preexisting OA, for ambient air that has aged less than 0.4 equivalent days is 27 (±12) , a 50 % increase compared to the average ΔOA∕ΔCO observed over Seoul at the same ambient photochemical age (Fig. 10b). For air older than 0.4 equivalent days, the increase is slightly smaller (21 (±20) above ambient preexisting OA) since a large fraction of the most reactive, high-aerosol-producing compounds have already been depleted and produced ambient SOA (Ortega et al., 2016; Palm et al., 2016, 2017, 2018).
Finally, there is still a small amount of SOA production potential in the air transported over the Yellow Sea to Seoul. The average potential, not including preexisting OA, is 5 (±4) . This is a factor of 4–5 less than the potential SOA production observed in the OFR for Seoul. Including the preexisting dilution-corrected OA for the Yellow Sea observation (18 ), the concentration is approximately a factor of 8.5 less than the maximum ambient dilution-corrected OA concentration and a factor of 6–8 less than the total dilution-corrected OA concentration exiting the OFR. Some of this remaining production would have been further consumed during transport between the Yellow Sea and Seoul (typically 1 day); therefore, it is not expected to significantly impact the SOA production over Seoul. This further indicates that, during this campaign, the transported SOA precursors to Seoul from foreign sources did not contribute significantly to the overall observed SOA production.
4.4 Calculated precursor contributions to the SOA production over Seoul
We use a simple SOA model (Dzepina et al., 2009; Zhao et al., 2014) to calculate the contribution of various precursors to SOA over Seoul (Fig. 11, details in Sect. S6). Observed hydrocarbons (Table 2), from the WAS, along with estimated S/IVOC (Robinson et al., 2007; Dzepina et al., 2009; Hayes et al., 2015) and SOA yields updated to account for vapor wall losses (Ma et al., 2017) were used to estimate (Eqs. S3 and S4 in the Supplement) the contribution of various precursors to SOA production observed over Seoul. Dzepina et al. (2009) and Hayes et al. (2015) both found that the “Robinson” parameterization of SOA from S/IVOC was consistent with SOA production in Mexico City and Los Angeles for observations at 1 equivalent day or less; thus, the same parameterizations are used here.
The percent difference between the modeled and measured total OA ranged between −24 % and 34 % with an average value of the observations being 11 % higher. This provides confidence that the calculation described in Sect. S6 captures the chemical production of SOA over Seoul. Also, the difference between the estimated and measured OA is comparable to, or better than, found in other studies that utilized similar modeling approaches (Dzepina et al., 2009; Zhao et al., 2014, 2016; Hayes et al., 2015; Huang et al., 2015; Ma et al., 2017) and within the uncertainty of the measured OA (38 %, 2σ).
This box model does not explicitly consider volatile chemical products (VCPs) (Khare and Gentner, 2018; McDonald et al., 2018), S/IVOC from cooking emissions (e.g., Hayes et al., 2013; Ots et al., 2016), or glyoxal (Volkamer et al., 2006; Knote et al., 2014), although contributions from these components may be partially included in the empirical estimation of S/IVOC. Modeled SOA in Los Angeles, using estimates of S/IVOC from ΔHOA∕ΔCO, including approximately two-thirds of VCPs and not including glyoxal, was able to capture the observed SOA in the first 0.5 equivalent days (Hayes et al., 2015; McDonald et al., 2018), similar to the results here.
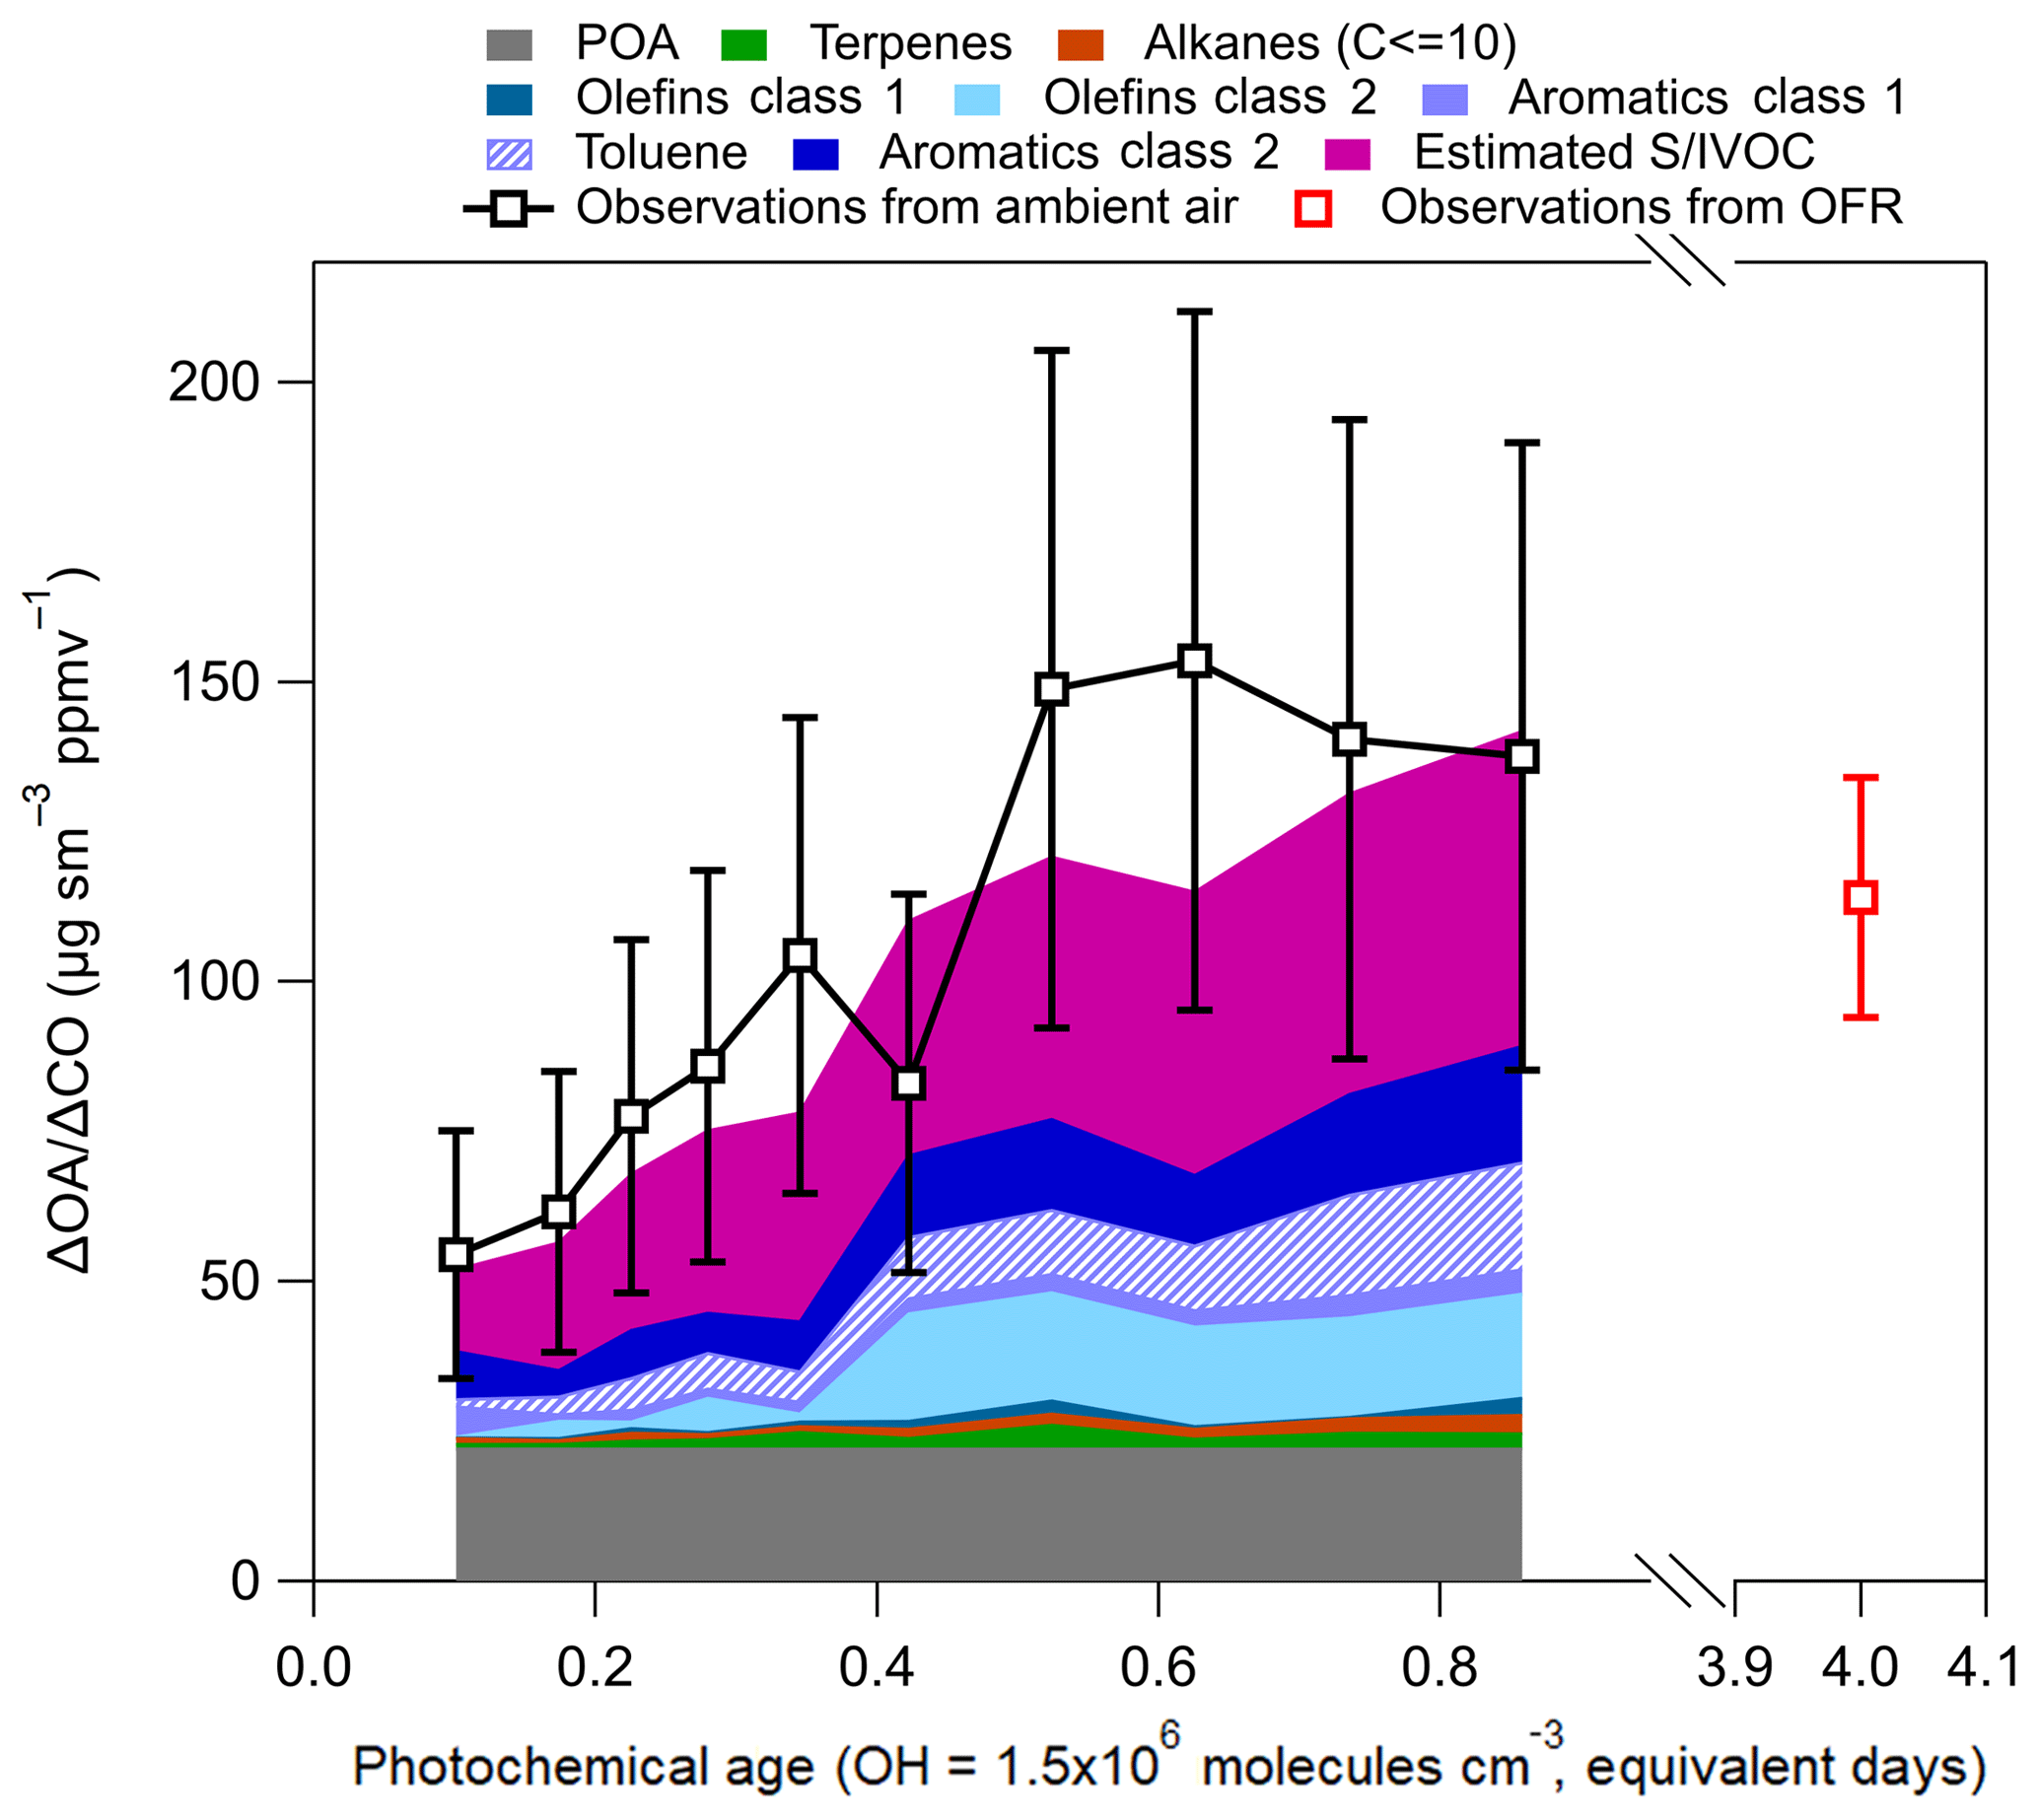
Figure 11Calculated SOA production for KORUS-AQ. POA is from observations shown in Fig. 6, and the observations of ΔOA∕ΔCO are from Fig. 4. The SOA precursor classes are defined in Table 2. Note, toluene is part of aromatics class 1 (light purple), but it is shown separately for discussion. The error bars represent the uncertainty in OA (±38 %). The OFR observations, and error bars, are from Fig. 10.
Table 2Definition of classes used in Fig. 11. The VOCs listed in the table were all measured by the WAS.
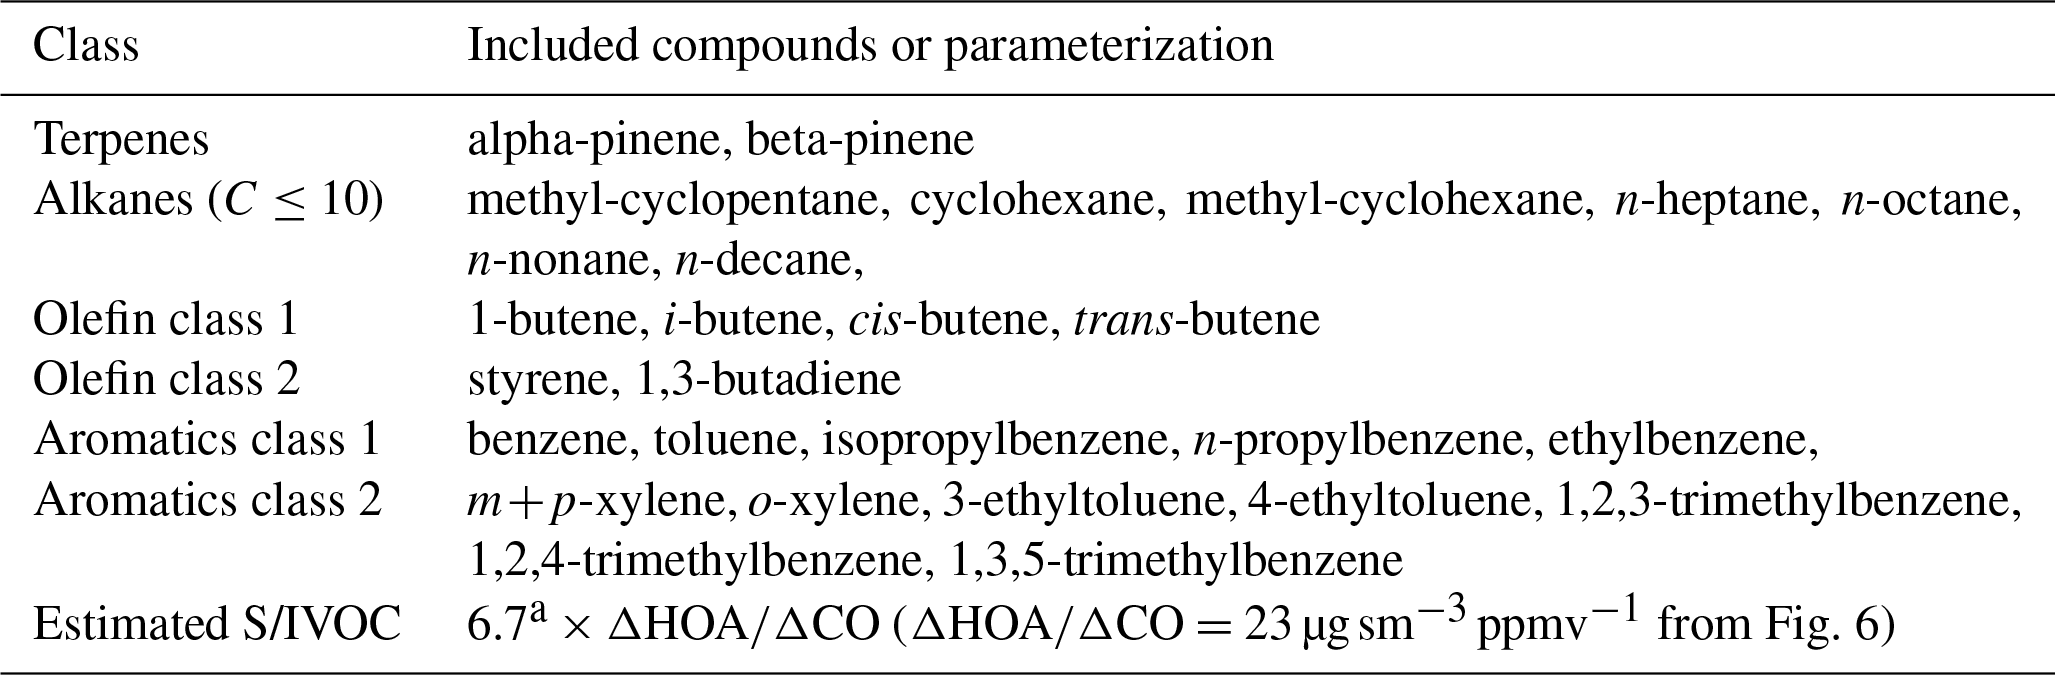
a This value is taken from Dzepina et al. (2009), which is based on partitioning calculations.
The most important calculated SOA precursors are S/IVOCs and the most reactive aromatics (Table 2). These two classes of compounds comprise ∼70 % of the total modeled SOA over Seoul. The calculation further supports the conclusions from multiple previous studies (Dzepina et al., 2009, 2011; Hodzic et al., 2010; Chen et al., 2015; Hayes et al., 2015; Ma et al., 2017) that aromatics and primary S/IVOCs dominate SOA formation over different urban environments. A consistent feature across most species in both classes of compounds is that they all have photochemical lifetimes of less than 1 equivalent day and less than 4 h for the average observed daytime OH (6×10⁶ molecules cm−3) over Seoul. With the typical wind speeds during KORUS-AQ (∼4 m s−1), the lifetime of these species would limit their transport to approximately 60 km during daytime. Since these compounds have short photochemical lifetimes, and they compose the majority of the calculated SOA budget, our conclusion that the SOA production over Seoul originates from local emissions is further supported.
Numerous prior studies have shown the importance of S/IVOC in order to explain the observed SOA production (Robinson et al., 2007; Dzepina et al., 2009, 2011; Grieshop et al., 2009; Pye and Seinfeld, 2010; Hodzic et al., 2010; Zhao et al., 2014; Jathar et al., 2014; Chen et al., 2015; Hayes et al., 2015; Palm et al., 2016, 2017, 2018; Ortega et al., 2016; Janssen et al., 2017; Ma et al., 2017). Until recently, it has been analytically challenging to measure these compounds (Ait-Helal et al., 2014; Zhao et al., 2014; Hunter et al., 2017), and they can make up a small fraction of the total measured, and speciated, hydrocarbons in an urban location (Ait-Helal et al., 2014; Zhao et al., 2014). However, due to the higher initial molecular weight, S/IVOCs already have a low saturation concentration (–1000 µg m−3 for SVOC and –1×10⁶ µg m−3 for IVOC), especially compared to aromatic compounds ( µg m−3); thus, any addition of functional groups will more easily lead to the partitioning of oxidized S/IVOC to the particle phase (Robinson et al., 2007; Hayes et al., 2015; Ma et al., 2017). In urban environments, S/IVOC emissions come from numerous sources, including transportation, cooking, and VCPs (Robinson et al., 2007; Hayes et al., 2015; Woody et al., 2016; Janssen et al., 2017; Ma et al., 2017; McDonald et al., 2018).
The next most important compound is toluene, composing 9 (±3) % of the estimated SOA production. Though this single compound is as important as the rest of aromatics class 1, olefin classes 1 and 2, alkanes, and terpenes (Table 2) combined, it does not contribute the majority of the calculated SOA budget, as was recently suggested in another study (Wu et al., 2016). The average aerosol yield for toluene used in this study (Y≈0.30) is similar to the value used in Wu et al. (2016) and recommended by Hildebrandt Ruiz et al. (2015). The aerosol yield is similar for all aromatics; however, the more reactive aromatics will contribute more SOA per unit precursor at shorter photochemical ages. The longer photochemical lifetime (factor of 2) for toluene decreases the overall amount of SOA produced compared to the very reactive aromatics.
4.5 Conceptual model representing rapid photochemical production
A conceptual model representing rapid photochemical production of SOA, pNO3, Ox, and CH2O is presented here. For the model, the flow is simplified to be from the west to the east. The lateral and vertical dilution have been represented as the equivalent first-order rate, constrained by observations (∼0.7 day−1). Also, the hemispheric and foreign transport is accurate on average based on observations, and is discussed in Sect. 3.3. For the production over Seoul, it is represented by photochemical aging, constrained by observations (Fig. 7i), as a first-order rate. Thus, the important processes are represented with realistic quantitative constraints, but in a simple enough system to demonstrate the impact of the secondary chemistry from Seoul.
The results are shown in Fig. 12. The figure summarizes and demonstrates the results discussed throughout the paper. First, as discussed in Sects. 3.2 and 4.2, there is no clear net production of the pollutants over the Yellow Sea. Instead, they undergo dilution as the air travels across the Yellow Sea. Then, as the air enters the SMA, there are fresh injections of primary emissions (CO, HOA, hydrocarbons, and NOx). These primary emissions undergo rapid photooxidation to produce SOA, pNO3, Ox, and CH2O, as detailed in Sect. 4.2. As demonstrated in Fig. 12, most of the production occurs within the SMA prior to dilution taking over. This demonstrates that the emissions and subsequent chemistry from the SMA directly impact the residents of the SMA. Thus, control of the primary pollutants, including the SOA precursors discussed in Sect. 4.5 (aromatics and S/IVOC), and NOx would substantially reduce concentration of the secondary photochemical products impacting the SMA, even during periods of higher foreign transport than observed during KORUS-AQ.
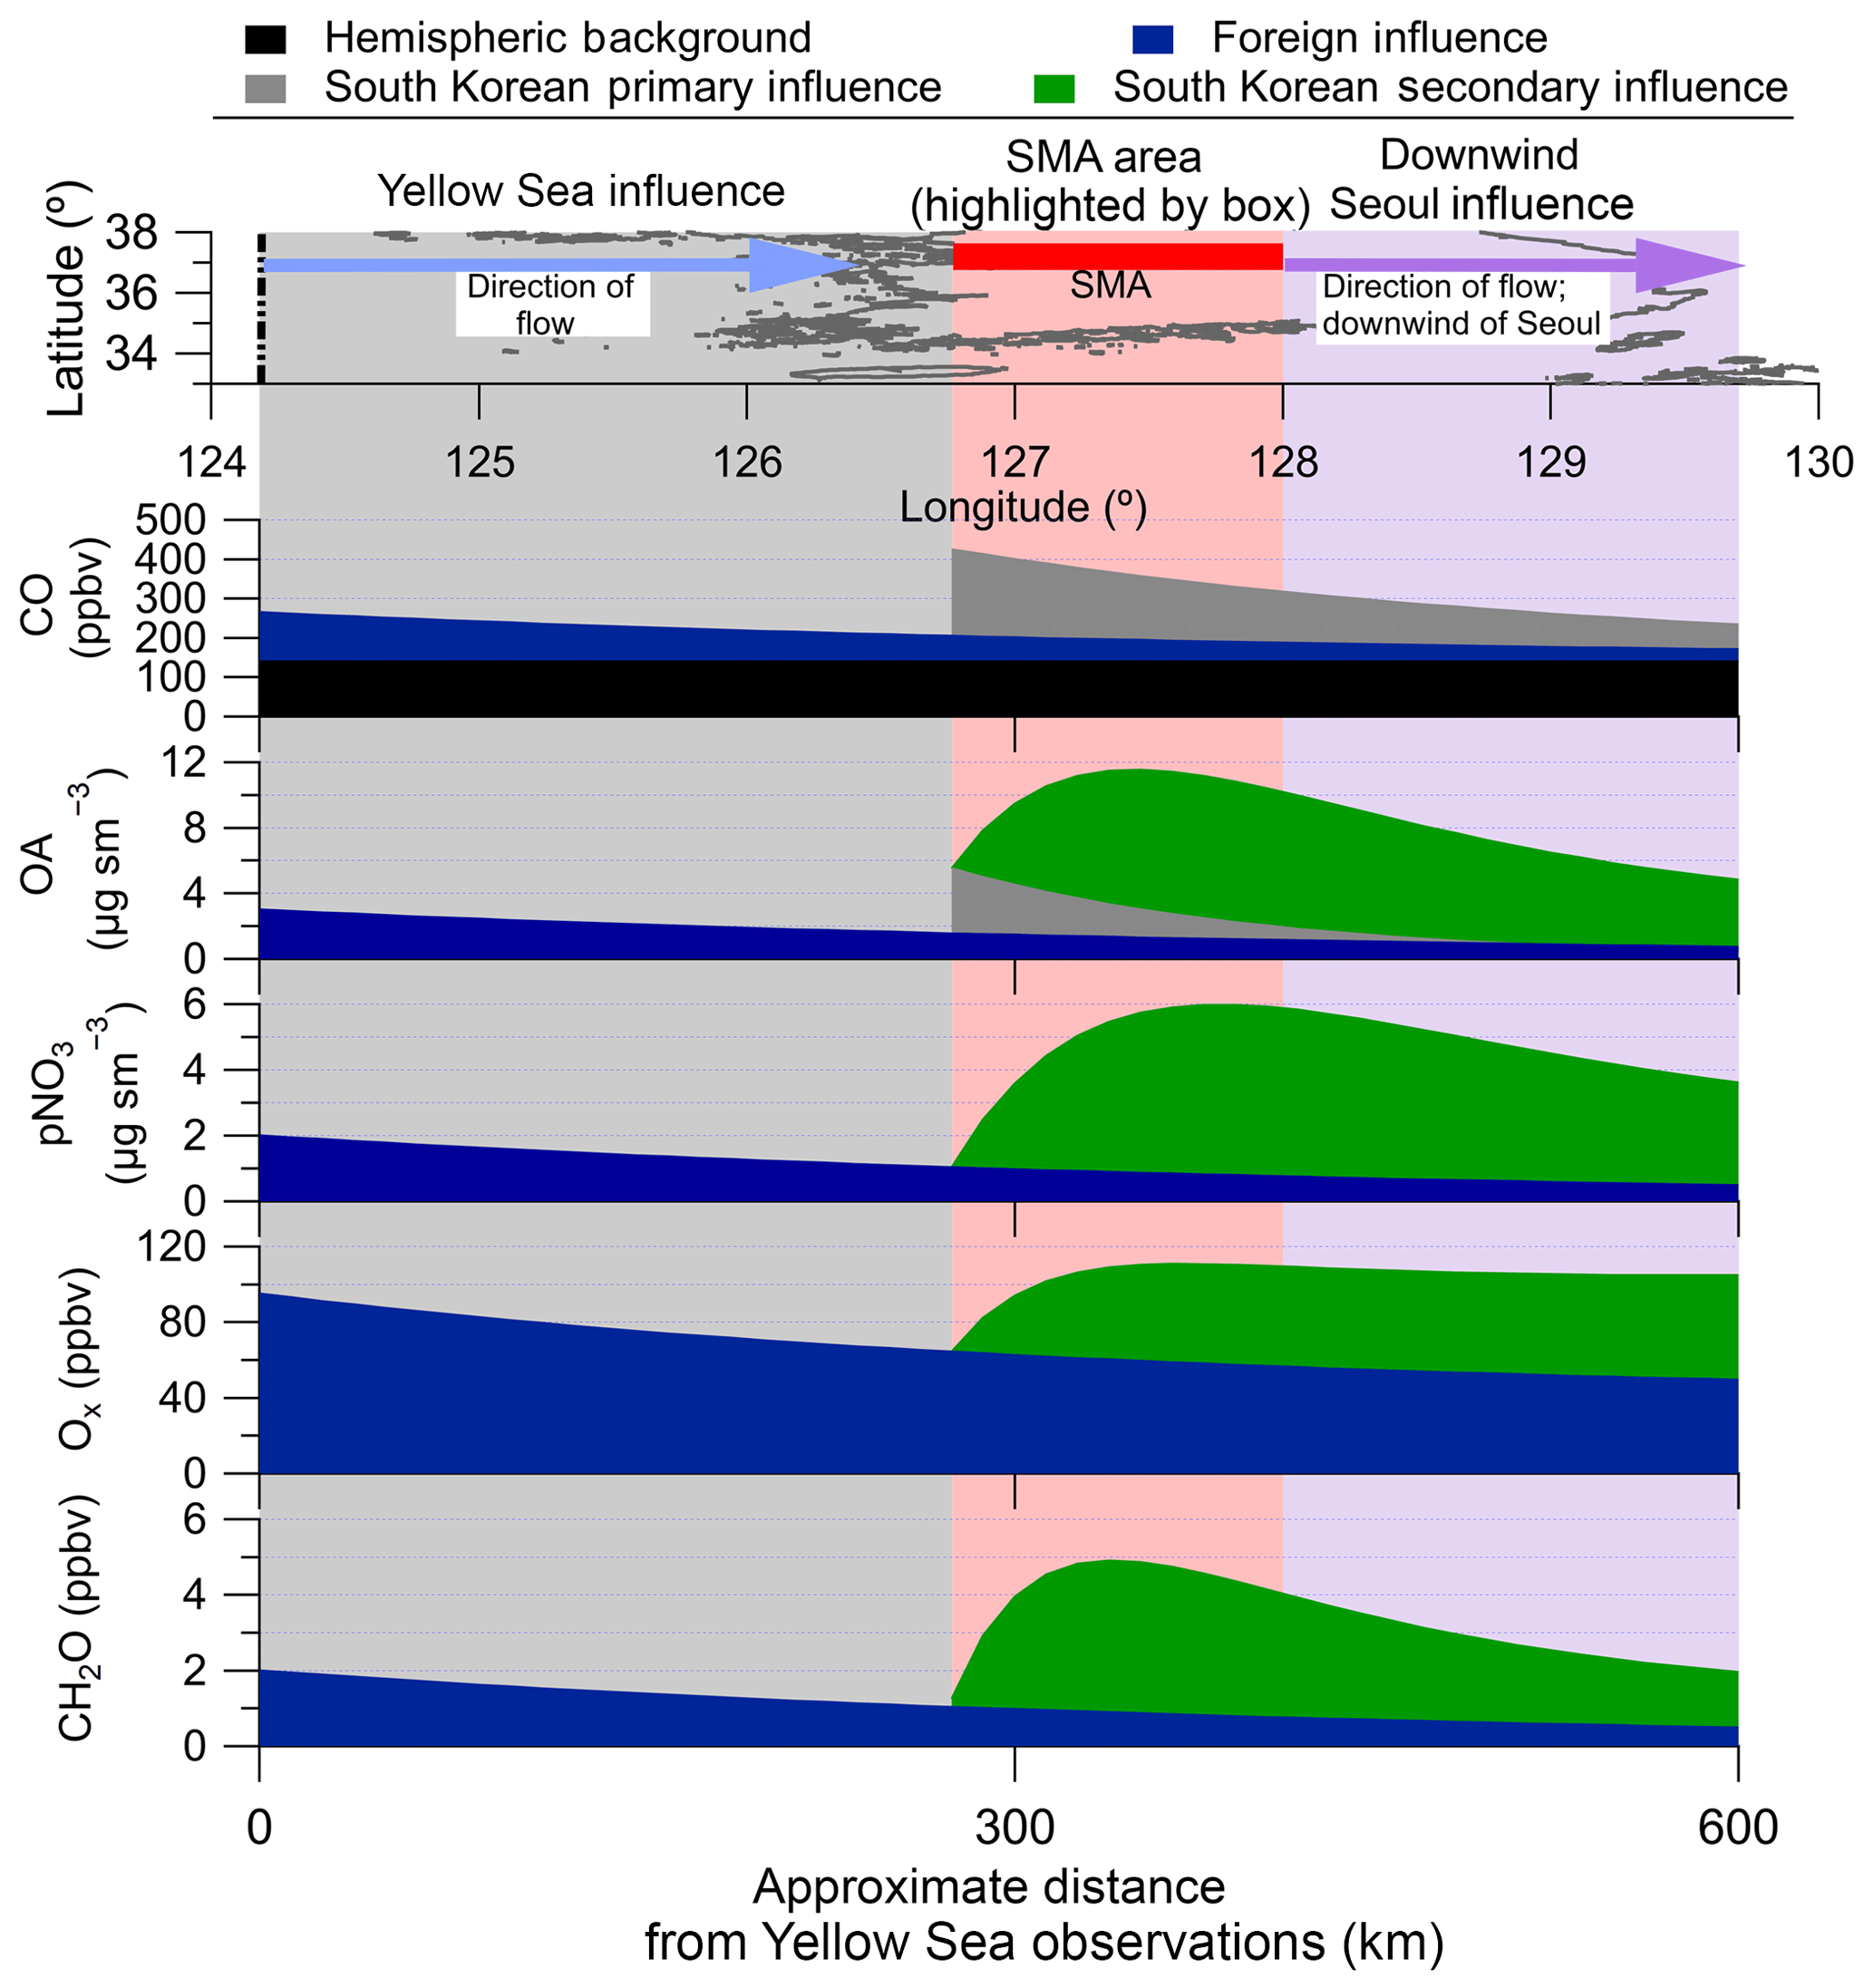
Figure 12Conceptual model representing the transport of background air into Seoul, and the emissions of primary species (CO and HOA) and photochemical production of secondary species (SOA, pNO3, Ox, and CH2O) impacting Seoul.
A suite of aerosol- and gas-phase measurements were made over Seoul and the Yellow Sea during May and June 2016, as part of the KORUS-AQ campaign. The results from this study are summarized below.
-
Using a combination of a Lagrangian back-trajectory model (FLEXPART) and observations, the hemispheric CO background was estimated to be 140 ppbv, the CO foreign background over Seoul was estimated to be 60 ppbv, and the remainder of the CO over Seoul was due to South Korean emissions. The CO background analysis allows estimation of background values for other species used throughout this study. In particular, the OA background was estimated to be between 1 and 3 µg sm−3.
-
FLEXPART was also used for source analysis of NO2, as a surrogate for SOA precursors. NO2 has a photochemical lifetime of less than 1 day (similar to the dominant urban SOA precursors). Results from FLEXPART indicate that greater than 90 % of NO2 originates from South Korea, consistent with most of the important SOA and pNO3 precursors also originating there.
-
Factor analysis of OA showed that the OA growth over Seoul was dominated by OOA (surrogate for SOA). This OOA (background subtracted) was low at low photochemical ages and rapidly increased throughout the day as photochemistry occurred. This points to local emissions controlling SOA production over Seoul.
-
OOA was correlated with secondary gas-phase species, including Ox (O3+NO2), formaldehyde, peroxy acetyl nitrates, the sum of acyl peroxy nitrates, DHT, and pNO3. Correlation with these species indicates that the SOA was produced from local emissions and photochemistry since some of these compounds (CH2O and PAN) had photochemical lifetimes of less than 3 h in the daytime during KORUS-AQ.
-
Using an airborne OFR for the first time, the amount of potential SOA produced from air sampled over Seoul was a factor of 3.5 higher than for air sampled over the Yellow Sea (a background inflow location). This points to local SOA precursor emissions from Seoul and subsequent rapid photochemistry, causing the increase in SOA observed over Seoul. The air sampled over the Yellow Sea did not have enough SOA precursors to cause the SOA production observed over Seoul.
-
A simple box model showed good agreement with the measured SOA growth. This allows an estimation of the contribution of various precursors to SOA over Seoul. Hydrocarbons with a photochemical lifetime of less than 1 day dominate the production of SOA. Specifically, short-lived aromatic compounds (i.e., ethyltoluenes, xylenes, trimethylbenzenes) and S/IVOCs are the main precursors to SOA, accounting for 70 % of the calculated SOA. Toluene was found to contribute 9 % of the calculated SOA.
-
Over Seoul, a large megacity with numerous sources of emissions, local emissions and their photochemical products overwhelm the foreign influence during KORUS-AQ. However, for smaller cities or more rural areas in South Korea that are not downwind of Seoul or other large sources, the foreign influence can more easily overwhelm the smaller local emissions. Thus, outside of the Seoul metropolitan area, the foreign influence has a greater impact on the air quality. During periods in which the foreign influence is larger than during KORUS-AQ (due to more favorable transport conditions), it will be more comparable to the importance of the Seoul emissions. However, given the apparently stronger emissions of SOA precursors than in other megacities, reducing South Korean emissions should improve air quality under all conditions.
Measurements and FLEXPART results from the KORUS-AQ campaign are available at https://www-air.larc.nasa.gov/cgi-bin/ArcView/korusaq, last access: 16 February 2018. Measurements for the CO background are available at ftp://aftp.cmdl.noaa.gov/data/trace_gases/co/flask/surface/, last access: 22 November 2016.
The supplement related to this article is available online at: https://doi.org/10.5194/acp-18-17769-2018-supplement.
BAN, PCJ, DAD, JCS, and JLJ collected the AMS data. BA, AJB, CAC, and KLT collected the data from LARGE. DRB collected the WAS data. WHB collected the OH, HO2, and OHR data. YC and JPDG collected the CO measurements from the Picarro instrument. JD and ES collected MC/IC and filter measurements. GSD and SEP collected H2O and ambient CO measurements. AF collected CH2O measurements. LGH collected PAN, PPN, and SO2 measurements. MJK collected HNO3, DHT, and HCN measurements. CJK ran the FLEXPART analysis. KDL collected the BC measurements. TL and TP collected the KAMS data. JHW provided the emissions for the FLEXPART analysis. JAdG assisted in the analysis of the photochemical clocks and SOA production. BAN and JLJ prepared the original paper, and all authors contributed to the review and editing of the paper.
The authors declare that they have no conflict of interest.
The views expressed in this document are solely those of the authors and do not necessarily reflect those of the U.S. EPA. The EPA does not endorse any products or commercial services mentioned in this publication.
This study was supported by NASA grants NNX15AT96G & 80NSSC18K0630 and
EPA STAR 83587701-0. It has not been formally reviewed by the EPA. Michelle J. Kim was funded by NSF
award number 1524860. Joost A. de Gouw worked as a part-time consultant for
Aerodyne Research Inc. during the preparation phase of this paper. The
authors acknowledge Joshua Schwarz and Anne Perring for the use of their
black carbon data, Ronald Cohen, Paul Wooldridge, and Paul Romer for use of
their ΣRONO2 and ΣROONO2 data, Paul Wennberg and
John Crounse for the use of their HCN, DHT, and HNO3 data, Armin
Wisthaler for the use of their PTR-MS data, and Andrew Weinheimer and Denise
Montzka for the use of their O3, NOx, and NOy data. Finally,
the authors acknowledge the NOAA ESRL GMD CCGG for the use of the CO
measurements in Mongolia and China for the background measurements.
Edited by: Robert McLaren
Reviewed by: two anonymous referees
Aiken, A. C., Salcedo, D., Cubison, M. J., Huffman, J. A., DeCarlo, P. F., Ulbrich, I. M., Docherty, K. S., Sueper, D., Kimmel, J. R., Worsnop, D. R., Trimborn, A., Northway, M., Stone, E. A., Schauer, J. J., Volkamer, R. M., Fortner, E., de Foy, B., Wang, J., Laskin, A., Shutthanandan, V., Zheng, J., Zhang, R., Gaffney, J., Marley, N. A., Paredes-Miranda, G., Arnott, W. P., Molina, L. T., Sosa, G., and Jimenez, J. L.: Mexico City aerosol analysis during MILAGRO using high resolution aerosol mass spectrometry at the urban supersite (T0) – Part 1: Fine particle composition and organic source apportionment, Atmos. Chem. Phys., 9, 6633–6653, https://doi.org/10.5194/acp-9-6633-2009, 2009.
Ait-Helal, W., Borbon, A., Sauvage, S., de Gouw, J. A., Colomb, A., Gros, V., Freutel, F., Crippa, M., Afif, C., Baltensperger, U., Beekmann, M., Doussin, J.-F., Durand-Jolibois, R., Fronval, I., Grand, N., Leonardis, T., Lopez, M., Michoud, V., Miet, K., Perrier, S., Prévôt, A. S. H., Schneider, J., Siour, G., Zapf, P., and Locoge, N.: Volatile and intermediate volatility organic compounds in suburban Paris: variability, origin and importance for SOA formation, Atmos. Chem. Phys., 14, 10439–10464, https://doi.org/10.5194/acp-14-10439-2014, 2014.
Akagi, S. K., Craven, J. S., Taylor, J. W., McMeeking, G. R., Yokelson, R. J., Burling, I. R., Urbanski, S. P., Wold, C. E., Seinfeld, J. H., Coe, H., Alvarado, M. J., and Weise, D. R.: Evolution of trace gases and particles emitted by a chaparral fire in California, Atmos. Chem. Phys., 12, 1397–1421, https://doi.org/10.5194/acp-12-1397-2012, 2012.
Aknan, A. and Chen, G.: KORUS-AQ DC-8 Aircraft Dataset, available at: https://www-air.larc.nasa.gov/cgi-bin/ArcView/korusaq, last access: 16 February 2018.
Al-Saadi, J., Carmichael, G., Crawford, J., Emmons, L., Korean, S. K., Group, S., Song, C.-K., Chang, L.-S., Lee, G., Kim, J., and Park, R.: NASA Contributions to KORUS-AQ: An International Cooperative Air Quality Field Study in Korea, 2015.
Anderson, T. L. and Ogren, J. A.: Determining Aerosol Radiative Properties Using the TSI 3563 Integrating Nephelometer, Aerosol Sci. Technol., 29, 57–69, https://doi.org/10.1080/02786829808965551, 1998.
Arnold, S. R., Methven, J., Evans, M. J., Chipperfield, M. P., Lewis, A. C., Hopkins, J. R., Mcquaid, J. B., Watson, N., Purvis, R. M., Lee, J. D., Atlas, E. L., Blake, D. R., and Rappenglück, B.: Statistical inference of OH concentrations and air mass dilution rates from successive observations of nonmethane hydrocarbons in single air masses, J. Geophys. Res.-Atmos., 112, D10S40, https://doi.org/10.1029/2006JD007594, 2007.
Bahreini, R., Dunlea, E. J., Matthew, B. M., Simons, C., Docherty, K. S., DeCarlo, P. F., Jimenez, J. L., Brock, C. A., and Middlebrook, A. M.: Design and Operation of a Pressure-Controlled Inlet for Airborne Sampling with an Aerodynamic Aerosol Lens, Aerosol Sci. Technol., 42, 465–471, https://doi.org/10.1080/02786820802178514, 2008.
Bahreini, R., Ervens, B., Middlebrook, A. M., Warneke, C., de Gouw, J. A., DeCarlo, P. F., Jimenez, J. L., Brock, C. A., Neuman, J. A., Ryerson, T. B., Stark, H., Atlas, E., Brioude, J., Fried, A., Holloway, J. S., Peischl, J., Richter, D., Walega, J., Weibring, P., Wollny, A. G., and Fehsenfeid, F. C.: Organic aerosol formation in urban and industrial plumes near Houston and Dallas, Texas, J. Geophys. Res., 114, D00F16, https://doi.org/10.1029/2008JD011493, 2009.
Baklanov, A., Molina, L. T., and Gauss, M.: Megacities, Air Quality and Climate, Atmos. Environ., 126, 235–249, https://doi.org/10.1016/j.atmosenv.2015.11.059, 2016.
Blake, N. J., Blake, D. R., Sive, B. C., Katzenstein, A. S., Meinardi, S., Wingenter, O. W., Atlas, E. L., Flocke, F., Ridley, B. A., and Rowland, F. S.: The seasonal evolution of NMHC's and light alkyl nitrates at middle to northern latitudes during TOPSE, J. Geophys. Res., 108, 8359, https://doi.org/10.1029/2001JD001467, 2003.
Campuzano-Jost, P., Day, D. A., Nault, B. A., Schroder, J. C., and Jimenez, J. L.: Temporal Variability of the Pieber Effect and Some Notes on AMS Dection Limits, in 17th AMS Users' Meeting, Portland, available at: http://cires1.colorado.edu/jimenez-group/UsrMtgs/UsersMtg17/10-14-2016_PCJ_AMSUsersMtg_Prez.pdf (last access: 5 April 2018), 2016.
Canagaratna, M. R., Jayne, J. T., Jimenez, J. L., Allan, J. D., Alfarra, M. R., Zhang, Q., Onasch, T. B., Drewnick, F., Coe, H., Middlebrook, A. M., Delia, A., Williams, L. R., Trimborn, A. M., Northway, M. J., DeCarlo, P. F., Kolb, C. E., Davidovits, P., and Worsnop, D. R.: Chemical and microphysical characterization of ambient aerosols with the Aerodyne Aerosol Mass Spectrometer, Mass Spectrom. Rev., 26, 185–222, https://doi.org/10.1002/mas.20115, 2007.
Canagaratna, M. R., Jimenez, J. L., Kroll, J. H., Chen, Q., Kessler, S. H., Massoli, P., Hildebrandt Ruiz, L., Fortner, E., Williams, L. R., Wilson, K. R., Surratt, J. D., Donahue, N. M., Jayne, J. T., and Worsnop, D. R.: Elemental ratio measurements of organic compounds using aerosol mass spectrometry: characterization, improved calibration, and implications, Atmos. Chem. Phys., 15, 253–272, https://doi.org/10.5194/acp-15-253-2015, 2015.
Cappa, C. D. and Jimenez, J. L.: Quantitative estimates of the volatility of ambient organic aerosol, Atmos. Chem. Phys., 10, 5409–5424, https://doi.org/10.5194/acp-10-5409-2010, 2010.
Cappa, C. D., Jathar, S. H., Kleeman, M. J., Docherty, K. S., Jimenez, J. L., Seinfeld, J. H., and Wexler, A. S.: Simulating secondary organic aerosol in a regional air quality model using the statistical oxidation model – Part 2: Assessing the influence of vapor wall losses, Atmos. Chem. Phys., 16, 3041–3059, https://doi.org/10.5194/acp-16-3041-2016, 2016.
Chen, Q., Heald, C. L., Jimenez, J. L., Canagaratna, M. R., He, L., Huang, X.-F., Campuzano-Jost, P., Palm, B. B., Poulain, L., Kuwata, M., Martin, S. T., Abbatt, J. P. D., Lee, A. K. Y., Liggio, J., Zhang, Q., He, L., and Huang, X.-F.: Elemental composition of organic aerosol: The gap between ambient and laboratory measurements, Geophys. Res. Lett., 42, 4182–4189, https://doi.org/10.1002/2015GL063693, 2015.
Choi, J. K., Heo, J. B., Ban, S. J., Yi, S. M., and Zoh, K. D.: Chemical characteristics of PM2.5 aerosol in Incheon, Korea, Atmos. Environ., 60, 583–592, https://doi.org/10.1016/j.atmosenv.2012.06.078, 2012.
Cohen, A. J., Brauer, M., Burnett, R., Anderson, H. R., Frostad, J., Estep, K., Balakrishnan, K., Brunekreef, B., Dandona, L., Dandona, R., Feigin, V., Freedman, G., Hubbell, B., Jobling, A., Kan, H., Knibbs, L., Liu, Y., Martin, R., Morawska, L., Pope, C. A., Shin, H., Straif, K., Shaddick, G., Thomas, M., van Dingenen, R., van Donkelaar, A., Vos, T., Murray, C. J. L., and Forouzanfar, M. H.: Estimates and 25-year trends of the global burden of disease attributable to ambient air pollution: an analysis of data from the Global Burden of Diseases Study 2015, Lancet, London, UK, 389, 1907–1918, https://doi.org/10.1016/S0140-6736(17)30505-6, 2017.
Collier, S., Zhou, S., Onasch, T. B., Jaffe, D. A., Kleinman, L., Sedlacek, A. J., Briggs, N. L., Hee, J., Fortner, E., Shilling, J. E., Worsnop, D., Yokelson, R. J., Parworth, C., Ge, X., Xu, J., Butterfield, Z., Chand, D., Dubey, M. K., Pekour, M. S., Springston, S., and Zhang, Q.: Regional Influence of Aerosol Emissions from Wildfires Driven by Combustion Efficiency: Insights from the BBOP Campaign, Environ. Sci. Technol., 50, 8613–8622, https://doi.org/10.1021/acs.est.6b01617, 2016.
Craven, J. S., Metcalf, A. R., Bahreini, R., Middlebrook, A., Hayes, P. L., Duong, H. T., Sorooshian, A., Jimenez, J. L., Flagan, R. C., and Seinfeld, J. H.: Los Angeles Basin airborne organic aerosol characterization during CalNex, J. Geophys. Res.-Atmos., 118, 11453–11467, https://doi.org/10.1002/jgrd.50853, 2013.
Crippa, M., Canonaco, F., Lanz, V. A., Äijälä, M., Allan, J. D., Carbone, S., Capes, G., Ceburnis, D., Dall'Osto, M., Day, D. A., DeCarlo, P. F., Ehn, M., Eriksson, A., Freney, E., Hildebrandt Ruiz, L., Hillamo, R., Jimenez, J. L., Junninen, H., Kiendler-Scharr, A., Kortelainen, A.-M., Kulmala, M., Laaksonen, A., Mensah, A. A., Mohr, C., Nemitz, E., O'Dowd, C., Ovadnevaite, J., Pandis, S. N., Petäjä, T., Poulain, L., Saarikoski, S., Sellegri, K., Swietlicki, E., Tiitta, P., Worsnop, D. R., Baltensperger, U., and Prévôt, A. S. H.: Organic aerosol components derived from 25 AMS data sets across Europe using a consistent ME-2 based source apportionment approach, Atmos. Chem. Phys., 14, 6159–6176, https://doi.org/10.5194/acp-14-6159-2014, 2014.
Crounse, J., McKinney, K. A., Kwan, A. J., and Wennberg, P. O.: Measurement of gas-phase hydroperoxides by chemical ionization mass spectrometry, Anal. Chem., 78, 6726–6732, https://doi.org/10.1021/ac0604235, 2006.
Cubison, M. J., Ortega, A. M., Hayes, P. L., Farmer, D. K., Day, D., Lechner, M. J., Brune, W. H., Apel, E., Diskin, G. S., Fisher, J. A., Fuelberg, H. E., Hecobian, A., Knapp, D. J., Mikoviny, T., Riemer, D., Sachse, G. W., Sessions, W., Weber, R. J., Weinheimer, A. J., Wisthaler, A., and Jimenez, J. L.: Effects of aging on organic aerosol from open biomass burning smoke in aircraft and laboratory studies, Atmos. Chem. Phys., 11, 12049–12064, https://doi.org/10.5194/acp-11-12049-2011, 2011.
Day, D. A., Wooldridge, P. J., Dillon, M. B., Thornton, J. A., and Cohen, R. C.: A thermal dissociation laser-induced fluorescence instrument for in situ detection of NO2, peroxy nitrates, alkyl nitrates, and HNO3, J. Geophys. Res., 107, 4046, https://doi.org/10.1029/2001JD000779, 2002.
DeCarlo, P. F., Kimmel, J. R., Trimborn, A., Northway, M. J., Jayne, J. T., Aiken, A. C., Gonin, M., Fuhrer, K., Horvath, T., Docherty, K. S., Worsnop, D. R., and Jimenez, J. L.: Field-Deployable, High-Resolution, Time-of-Flight Aerosol Mass Spectrometer, Anal. Chem., 78, 8281–8289, https://doi.org/10.1021/ac061249n, 2006.
DeCarlo, P. F., Dunlea, E. J., Kimmel, J. R., Aiken, A. C., Sueper, D., Crounse, J., Wennberg, P. O., Emmons, L., Shinozuka, Y., Clarke, A., Zhou, J., Tomlinson, J., Collins, D. R., Knapp, D., Weinheimer, A. J., Montzka, D. D., Campos, T., and Jimenez, J. L.: Fast airborne aerosol size and chemistry measurements above Mexico City and Central Mexico during the MILAGRO campaign, Atmos. Chem. Phys., 8, 4027–4048, https://doi.org/10.5194/acp-8-4027-2008, 2008.
DeCarlo, P. F., Ulbrich, I. M., Crounse, J., de Foy, B., Dunlea, E. J., Aiken, A. C., Knapp, D., Weinheimer, A. J., Campos, T., Wennberg, P. O., and Jimenez, J. L.: Investigation of the sources and processing of organic aerosol over the Central Mexican Plateau from aircraft measurements during MILAGRO, Atmos. Chem. Phys., 10, 5257–5280, https://doi.org/10.5194/acp-10-5257-2010, 2010.
de Gouw, J. A., Middlebrook, A. M., Warneke, C., Goldan, P. D., Kuster, W. C., Roberts, J. M., Fehsenfeld, F. C., Worsnop, D. R., Canagaratna, M. R., Pszenny, A. A. P., Keene, W. C., Marchewka, M. L., Bertman, S. B., and Bates, T. S.: Budget of organic carbon in a polluted atmosphere: Results from the New England Air Quality Study in 2002, J. Geophys. Res., 110, D16305, https://doi.org/10.1029/2004JD005623, 2005.
de Gouw, J. A., Brock, C. A., Atlas, E. L., Bates, T. S., Fehsenfeld, F. C., Goldan, P. D., Holloway, J. S., Kuster, W. C., Lerner, B. M., Matthew, B. M., Middlebrook, A. M., Onasch, T. B., Peltier, R. E., Quinn, P. K., Senff, C. J., Stohl, A., Sullivan, A. P., Trainer, M., Warneke, C., Weber, R. J., and Williams, E. J.: Sources of particulate matter in the northeastern United States in summer: 1. Direct emissions and secondary formation of organic matter in urban plumes, J. Geophys. Res., 113, D08301, https://doi.org/10.1029/2007JD009243, 2008.
de Gouw, J. A., Welsh-Bon, D., Warneke, C., Kuster, W. C., Alexander, L., Baker, A. K., Beyersdorf, A. J., Blake, D. R., Canagaratna, M., Celada, A. T., Huey, L. G., Junkermann, W., Onasch, T. B., Salcido, A., Sjostedt, S. J., Sullivan, A. P., Tanner, D. J., Vargas, O., Weber, R. J., Worsnop, D. R., Yu, X. Y., and Zaveri, R.: Emission and chemistry of organic carbon in the gas and aerosol phase at a sub-urban site near Mexico City in March 2006 during the MILAGRO study, Atmos. Chem. Phys., 9, 3425–3442, https://doi.org/10.5194/acp-9-3425-2009, 2009.
Deming, B., Pagonis, D., Liu, X., Talukdar, R. K., Roberts, J. M., Veres, P. R., Krechmer, J. E., de Gouw, J. A., Jimenez, J. L., and Zieman, P. J.: Measurements of Delays of Gas-Phase Compounds in a Wide Variety of Tubing Materials due to Gas-Wall Partitioning, in preparation, 2018.
Dibb, J. E., Talbot, R. W., Scheuer, E. M., Seid, G., Avery, M. A., and Singh, H. B.: Aerosol chemical composition in Asian continental outflow during the TRACE-P campaign: Comparison with PEM-West B, J. Geophys. Res., 108, 8815, https://doi.org/10.1029/2002JD003111, 2003.
Diskin, G. S., Podolske, J. R., Sachse, G. W., and Slate, T. A.: Open-path airborne tunable diode laser hygrometer, edited by: Fried, A., International Society for Optics and Photonics, Seattle, WA, USA, 4817, 196, 2002.
Docherty, K. S., Aiken, A. C., Huffman, J. A., Ulbrich, I. M., DeCarlo, P. F., Sueper, D., Worsnop, D. R., Snyder, D. C., Peltier, R. E., Weber, R. J., Grover, B. D., Eatough, D. J., Williams, B. J., Goldstein, A. H., Ziemann, P. J., and Jimenez, J. L.: The 2005 Study of Organic Aerosols at Riverside (SOAR-1): instrumental intercomparisons and fine particle composition, Atmos. Chem. Phys., 11, 12387–12420, https://doi.org/10.5194/acp-11-12387-2011, 2011.
Drewnick, F., Hings, S. S., Alfarra, M. R., Prevot, A. S. H., and Borrmann, S.: Aerosol quantification with the Aerodyne Aerosol Mass Spectrometer: detection limits and ionizer background effects, Atmos. Meas. Tech., 2, 33–46, https://doi.org/10.5194/amt-2-33-2009, 2009.
Dunlea, E. J., DeCarlo, P. F., Aiken, A. C., Kimmel, J. R., Peltier, R. E., Weber, R. J., Tomlinson, J., Collins, D. R., Shinozuka, Y., McNaughton, C. S., Howell, S. G., Clarke, A. D., Emmons, L. K., Apel, E. C., Pfister, G. G., van Donkelaar, A., Martin, R. V., Millet, D. B., Heald, C. L., and Jimenez, J. L.: Evolution of Asian aerosols during transpacific transport in INTEX-B, Atmos. Chem. Phys., 9, 7257–7287, https://doi.org/10.5194/acp-9-7257-2009, 2009.
Dzepina, K., Volkamer, R. M., Madronich, S., Tulet, P., Ulbrich, I. M., Zhang, Q., Cappa, C. D., Ziemann, P. J., and Jimenez, J. L.: Evaluation of recently-proposed secondary organic aerosol models for a case study in Mexico City, Atmos. Chem. Phys., 9, 5681–5709, https://doi.org/10.5194/acp-9-5681-2009, 2009.
Dzepina, K., Cappa, C. D., Volkamer, R. M., Madronich, S., DeCarlo, P. F., Zaveri, R. A., and Jimenez, J. L.: Modeling the Multiday Evolution and Aging of Secondary Organic Aerosol During MILAGRO 2006, Environ. Sci. Technol., 45, 3496–3503, https://doi.org/10.1021/es103186f, 2011.
Faloona, I. C., Tan, D., Lesher, R. L., Hazen, N. L., Frame, C. L., Simpas, J. B., Harder, H., Martinez, M., Di Carlo, P., Ren, X., and Brune, W. H.: A Laser-induced Fluorescence Instrument for Detecting Tropospheric OH and : Characteristics and Calibration, J. Atmos. Chem., 47, 139–167, https://doi.org/10.1023/B:JOCH.0000021036.53185.0e, 2004.
Farmer, D. K., Matsunaga, A., Docherty, K. S., Surratt, J. D., Seinfeld, J. H., Ziemann, P. J., and Jimenez, J. L.: Response of an aerosol mass spectrometer to organonitrates and organosulfates and implications for atmospheric chemistry, P. Natl. Acad. Sci. USA, 107, 6670–6675, https://doi.org/10.1073/pnas.0912340107, 2010.
Freney, E. J., Sellegri, K., Canonaco, F., Colomb, A., Borbon, A., Michoud, V., Doussin, J.-F., Crumeyrolle, S., Amarouche, N., Pichon, J.-M., Bourianne, T., Gomes, L., Prevot, A. S. H., Beekmann, M., and Schwarzenböeck, A.: Characterizing the impact of urban emissions on regional aerosol particles: airborne measurements during the MEGAPOLI experiment, Atmos. Chem. Phys., 14, 1397–1412, https://doi.org/10.5194/acp-14-1397-2014, 2014.
Fried, A., Cantrell, C., Olson, J., Crawford, J. H., Weibring, P., Walega, J., Richter, D., Junkermann, W., Volkamer, R., Sinreich, R., Heikes, B. G., O'Sullivan, D., Blake, D. R., Blake, N., Meinardi, S., Apel, E., Weinheimer, A., Knapp, D., Perring, A., Cohen, R. C., Fuelberg, H., Shetter, R. E., Hall, S. R., Ullmann, K., Brune, W. H., Mao, J., Ren, X., Huey, L. G., Singh, H. B., Hair, J. W., Riemer, D., Diskin, G., and Sachse, G.: Detailed comparisons of airborne formaldehyde measurements with box models during the 2006 INTEX-B and MILAGRO campaigns: potential evidence for significant impacts of unmeasured and multi-generation volatile organic carbon compounds, Atmos. Chem. Phys., 11, 11867–11894, https://doi.org/10.5194/acp-11-11867-2011, 2011.
Ge, X., Setyan, A., Sun, Y., and Zhang, Q.: Primary and secondary organic aerosols in Fresno, California during wintertime: Results from high resolution aerosol mass spectrometry, J. Geophys. Res. Atmos., 117, D19301, https://doi.org/10.1029/2012JD018026, 2012.
George, I. J., Slowik, J., and Abbatt, J. P. D.: Chemical aging of ambient organic aerosol from heterogeneous reaction with hydroxyl radicals, Geophys. Res. Lett., 35, L13811, https://doi.org/10.1029/2008GL033884, 2008.
Goldberg, D. L., Vinciguerra, T. P., Hosley, K. M., Loughner, C. P., Canty, T. C., Salawitch, R., and Dickerson, R. R.: Evidence for an increase in the ozone photochemical lifetime in the eastern United States using a regional air quality model, J. Geophys. Res.-Atmos., 120, 12778–12793, https://doi.org/10.1002/2015JD023930, 2015.
Gordon, T. D., Tkacik, D. S., Presto, A. A., Zhang, M., Jathar, S. H., Nguyen, N. T., Massetti, J., Truong, T., Cicero-Fernandez, P., Maddox, C., Rieger, P., Chattopadhyay, S., Maldonado, H., Maricq, M. M., and Robinson, A. L.: Primary Gas- and Particle-Phase Emissions and Secondary Organic Aerosol Production from Gasoline and Diesel Off-Road Engines, Environ. Sci. Technol., 47, 14137–14146, https://doi.org/10.1021/es403556e, 2013.
Grieshop, A. P., Miracolo, M. A., Donahue, N. M., and Robinson, A. L.: Constraining the Volatility Distribution and Gas-Particle Partitioning of Combustion Aerosols Using Isothermal Dilution and Thermodenuder Measurements, Environ. Sci. Technol., 43, 4750–4756, https://doi.org/10.1021/Es8032378, 2009.
Griffin, R. J., Chen, J., Carmody, K., Vutukuru, S., and Dabdub, D.: Contribution of gas phase oxidation of volatile organic compounds to atmospheric carbon monoxide levels in two areas of the United States, J. Geophys. Res. Atmos., 112, D10S17, https://doi.org/10.1029/2006JD007602, 2007.
Guo, H., Sullivan, A. P., Campuzano-Jost, P., Schroder, J. C., Lopez-Hilfiker, F. D., Dibb, J. E., Jimenez, J. L., Thornton, J. A., Brown, S. S., Nenes, A., and Weber, R. J.: Fine particle pH and the partitioning of nitric acid during winter in the northeastern United States, J. Geophys. Res.-Atmos., 121, 10355–10376, https://doi.org/10.1002/2016JD025311, 2016.
Guo, H., Liu, J., Froyd, K. D., Roberts, J. M., Veres, P. R., Hayes, P. L., Jimenez, J. L., Nenes, A., and Weber, R. J.: Fine particle pH and gas–particle phase partitioning of inorganic species in Pasadena, California, during the 2010 CalNex campaign, Atmos. Chem. Phys., 17, 5703–5719, https://doi.org/10.5194/acp-17-5703-2017, 2017.
Hallquist, M., Wenger, J. C., Baltensperger, U., Rudich, Y., Simpson, D., Claeys, M., Dommen, J., Donahue, N. M., George, C., Goldstein, A. H., Hamilton, J. F., Herrmann, H., Hoffmann, T., Iinuma, Y., Jang, M., Jenkin, M. E., Jimenez, J. L., Kiendler-Scharr, A., Maenhaut, W., McFiggans, G., Mentel, Th. F., Monod, A., Prévôt, A. S. H., Seinfeld, J. H., Surratt, J. D., Szmigielski, R., and Wildt, J.: The formation, properties and impact of secondary organic aerosol: current and emerging issues, Atmos. Chem. Phys., 9, 5155–5236, https://doi.org/10.5194/acp-9-5155-2009, 2009.
Hayes, P. L., Ortega, A. M., Cubison, M. J., Froyd, K. D., Zhao, Y., Cliff, S. S., Hu, W. W., Toohey, D. W., Flynn, J. H., Lefer, B. L., Grossberg, N., Alvarez, S., Rappenglück, B., Taylor, J. W., Allan, J. D., Holloway, J. S., Gilman, J. B., Kuster, W. C., de Gouw, J. A., Massoli, P., Zhang, X., Liu, J., Weber, R. J., Corrigan, A. L., Russell, L. M., Isaacman, G., Worton, D. R., Kreisberg, N. M., Goldstein, A. H., Thalman, R., Waxman, E. M., Volkamer, R., Lin, Y. H., Surratt, J. D., Kleindienst, T. E., Offenberg, J. H., Dusanter, S., Griffith, S., Stevens, P. S., Brioude, J., Angevine, W. M., and Jimenez, J. L.: Organic aerosol composition and sources in Pasadena, California, during the 2010 CalNex campaign, J. Geophys. Res., 118, 9233–9257, https://doi.org/10.1002/jgrd.50530, 2013.
Hayes, P. L., Carlton, A. G., Baker, K. R., Ahmadov, R., Washenfelder, R. A., Alvarez, S., Rappenglück, B., Gilman, J. B., Kuster, W. C., de Gouw, J. A., Zotter, P., Prévôt, A. S. H., Szidat, S., Kleindienst, T. E., Offenberg, J. H., Ma, P. K., and Jimenez, J. L.: Modeling the formation and aging of secondary organic aerosols in Los Angeles during CalNex 2010, Atmos. Chem. Phys., 15, 5773–5801, https://doi.org/10.5194/acp-15-5773-2015, 2015.
Heald, C. L., Kroll, J. H., Jimenez, J. L., Docherty, K. S., Decarlo, P. F., Aiken, A. C., Chen, Q., Martin, S. T., Farmer, D. K., and Artaxo, P.: A simplified description of the evolution of organic aerosol composition in the atmosphere, Geophys. Res. Lett., 37, L08803, https://doi.org/10.1029/2010GL042737, 2010.
Heim, E., Dibb, J., Scheuer, E., Campuzano-Jost, P., Nault, B. A., Jimenez, J. L., Peterson, D., Knote, C., Fenn, M., Hair, J., Beyersdorf, A. J., and Anderson, B. E.: Asian Dust Observed during KORUS-AQ Facilitates the Uptake and Incorporation of Soluble Pollutants during Transport to South Korea: The Hwangsa Anthropogenic Model, J. Geophys. Res.-Atmos., in review, 2018.
Hennigan, C. J., Sullivan, A. P., Fountoukis, C. I., Nenes, A., Hecobian, A., Vargas, O., Peltier, R. E., Case Hanks, A. T., Huey, L. G., Lefer, B. L., Russell, A. G., and Weber, R. J.: On the volatility and production mechanisms of newly formed nitrate and water soluble organic aerosol in Mexico City, Atmos. Chem. Phys., 8, 3761–3768, https://doi.org/10.5194/acp-8-3761-2008, 2008.
Heo, J.-B., Hopke, P. K., and Yi, S.-M.: Source apportionment of PM2.5 in Seoul, Korea, Atmos. Chem. Phys., 9, 4957–4971, https://doi.org/10.5194/acp-9-4957-2009, 2009.
Herndon, S. C., Onasch, T. B., Wood, E. C., Kroll, J. H., Canagaratna, M. R., Jayne, J. T., Zavala, M. A., Knighton, W. B., Mazzoleni, C., Dubey, M. K., Ulbrich, I. M., Jimenez, J. L., Seila, R., de Gouw, J. A., de Foy, B., Fast, J., Molina, L. T., Kolb, C. E., and Worsnop, D. R.: Correlation of secondary organic aerosol with odd oxygen in Mexico City, Geophys. Res. Lett., 35, L15804, https://doi.org/10.1029/2008GL034058, 2008.
Hersey, S. P., Craven, J. S., Metcalf, A. R., Lin, J., Lathem, T., Suski, K. J., Cahill, J. F., Duong, H. T., Sorooshian, A., Jonsson, H. H., Shiraiwa, M., Zuend, A., Nenes, A., Prather, K. A., Flagan, R. C., and Seinfeld, J. H.: Composition and hygroscopicity of the Los Angeles Aerosol: CalNex, J. Geophys. Res.-Atmos., 118, 3016–3036, https://doi.org/10.1002/jgrd.50307, 2013.
Hildebrandt Ruiz, L., Paciga, A. L., Cerully, K. M., Nenes, A., Donahue, N. M., and Pandis, S. N.: Formation and aging of secondary organic aerosol from toluene: changes in chemical composition, volatility, and hygroscopicity, Atmos. Chem. Phys., 15, 8301–8313, https://doi.org/10.5194/acp-15-8301-2015, 2015.
Hodzic, A. and Jimenez, J. L.: Modeling anthropogenically controlled secondary organic aerosols in a megacity: a simplified framework for global and climate models, Geosci. Model Dev., 4, 901–917, https://doi.org/10.5194/gmd-4-901-2011, 2011.
Hodzic, A., Jimenez, J. L., Madronich, S., Canagaratna, M. R., DeCarlo, P. F., Kleinman, L., and Fast, J.: Modeling organic aerosols in a megacity: potential contribution of semi-volatile and intermediate volatility primary organic compounds to secondary organic aerosol formation, Atmos. Chem. Phys., 10, 5491–5514, https://doi.org/10.5194/acp-10-5491-2010, 2010.
Hodzic, A., Madronich, S., Kasibhatla, P. S., Tyndall, G., Aumont, B., Jimenez, J. L., Lee-Taylor, J., and Orlando, J.: Organic photolysis reactions in tropospheric aerosols: effect on secondary organic aerosol formation and lifetime, Atmos. Chem. Phys., 15, 9253–9269, https://doi.org/10.5194/acp-15-9253-2015, 2015.
Hong, J.-W. and Hong, J.: Changes in the Seoul Metropolitan Area Urban Heat Environment with Residential Redevelopment, J. Appl. Meteorol. Climatol., 55, 1091–1106, https://doi.org/10.1175/JAMC-D-15-0321.1, 2016.
Hu, W., Hu, M., Hu, W., Jimenez, J. L., Yuan, B., Chen, W., Wang, M., Wu, Y., Chen, C., Wang, Z., Peng, J., Zeng, L., and Shao, M.: Chemical composition, sources and aging process of sub-micron aerosols in Beijing: contrast between summer and winter, J. Geophys. Res.-Atmos., 121, 1955–1977, https://doi.org/10.1002/2015JD024020, 2016.
Hu, W., Campuzano-Jost, P., Day, D. A., Croteau, P., Canagaratna, M. R., Jayne, J. T., Worsnop, D. R., and Jimenez, J. L.: Evaluation of the new capture vaporizer for aerosol mass spectrometers (AMS) through field studies of inorganic species, Aerosol Sci. Technol., 51, 735–754, https://doi.org/10.1080/02786826.2017.1296104, 2017a.
Hu, W., Campuzano-Jost, P., Day, D. A., Croteau, P., Canagaratna, M. R., Jayne, J. T., Worsnop, D. R., and Jimenez, J. L.: Evaluation of the new capture vapourizer for aerosol mass spectrometers (AMS) through laboratory studies of inorganic species, Atmos. Meas. Tech., 10, 2897–2921, https://doi.org/10.5194/amt-10-2897-2017, 2017b.
Hu, W., Day, D. A., Campuzano-Jost, P., Nault, B. A., Park, T., Lee, T., Croteau, P., Canagaratna, M. R., Jayne, J. T., Worsnop, D. R., and Jimenez, J. L.: Evaluation of the new capture vaporizer for Aerosol Mass Spectrometers: Characterization of organic aerosol mass spectra, Aerosol Sci. Technol., 52, 752–739, https://doi.org/10.1080/02786826.2018.1454584, 2018a.
Hu, W., Day, D. A., Campuzano-Jost, P., Nault, B. A., Park, T., Lee, T., Croteau, P., Canagaratna, M. R., Jayne, J. T., Worsnop, D. R., and Jimenez, J. L.: Evaluation of the New Capture Vaporizer for Aerosol Mass Spectrometers (AMS): Elemental Composition and Source Apportionment of Organic Aerosols (OA), ACS Earth Sp. Chem., 2, 410–421, https://doi.org/10.1021/acsearthspacechem.8b00002, 2018b.
Hu, W. W., Hu, M., Yuan, B., Jimenez, J. L., Tang, Q., Peng, J. F., Hu, W., Shao, M., Wang, M., Zeng, L. M., Wu, Y. S., Gong, Z. H., Huang, X. F., and He, L. Y.: Insights on organic aerosol aging and the influence of coal combustion at a regional receptor site of central eastern China, Atmos. Chem. Phys., 13, 10095–10112, https://doi.org/10.5194/acp-13-10095-2013, 2013.
Huang, C., Wang, H. L., Li, L., Wang, Q., Lu, Q., de Gouw, J. A., Zhou, M., Jing, S. A., Lu, J., and Chen, C. H.: VOC species and emission inventory from vehicles and their SOA formation potentials estimation in Shanghai, China, Atmos. Chem. Phys., 15, 11081–11096, https://doi.org/10.5194/acp-15-11081-2015, 2015.
Huey, L. G., Tanner, D. J., Slusher, D. L., Dibb, J. E., Arimoto, R., Chen, G., Davis, D., Buhr, M. P., Nowak, J. B., Mauldin III, R. L., Eisele, F. L., and Kosciuch, E.: CIMS measurements of HNO3 and SO2 at the South Pole during ISCAT 2000, Atmos. Environ., 38, 5411–5421, https://doi.org/10.1016/J.ATMOSENV.2004.04.037, 2004.
Huffman, J. A., Docherty, K. S., Aiken, A. C., Cubison, M. J., Ulbrich, I. M., DeCarlo, P. F., Sueper, D., Jayne, J. T., Worsnop, D. R., Ziemann, P. J., and Jimenez, J. L.: Chemically-resolved aerosol volatility measurements from two megacity field studies, Atmos. Chem. Phys., 9, 7161–7182, https://doi.org/10.5194/acp-9-7161-2009, 2009.
Hunter, J. F., Day, D. A., Palm, B. B., Yatavelli, R. L. N., Chan, A. W. H., Kaser, L., Cappellin, L., Hayes, P. L., Cross, E. S., Carrasquillo, A. J., Campuzano-Jost, P., Stark, H., Zhao, Y., Hohaus, T., Smith, J. N., Hansel, A., Karl, T., Goldstein, A. H., Guenther, A., Worsnop, D. R., Thornton, J. A., Heald, C. L., Jimenez, J. L., and Kroll, J. H.: Comprehensive characterization of atmospheric organic carbon at a forested site, Nat. Geosci., 10, 748–753, https://doi.org/10.1038/ngeo3018, 2017.
Jacob, D. J.: Heterogeneous chemistry and tropospheric ozone, Atmos. Environ., 34, 2131–2159, https://doi.org/10.1016/S1352-2310(99)00462-8, 2000.
Janssen, R. H. H., Tsimpidi, A. P., Karydis, V. A., Pozzer, A., Lelieveld, J., Crippa, M., Prévôt, A. S. H., Ait-Helal, W., Borbon, A., Sauvage, S., and Locoge, N.: Influence of local production and vertical transport on the organic aerosol budget over Paris, J. Geophys. Res.-Atmos., 1–21, https://doi.org/10.1002/2016JD026402, 2017.
Jathar, S. H., Miracolo, M. A., Tkacik, D. S., Donahue, N. M., Adams, P. J., and Robinson, A. L.: Secondary Organic Aerosol Formation from Photo-Oxidation of Unburned Fuel: Experimental Results and Implications for Aerosol Formation from Combustion Emissions, Environ. Sci. Technol., 47, 12886–12893, https://doi.org/10.1021/es403445q, 2013.
Jathar, S. H., Gordon, T. D., Hennigan, C. J., Pye, H. O. T., Pouliot, G., Adams, P. J., Donahue, N. M., and Robinson, A. L.: Unspeciated organic emissions from combustion sources and their influence on the secondary organic aerosol budget in the United States, P. Natl. Acad. Sci. USA, 111, 10473–10478, https://doi.org/10.1073/pnas.1323740111, 2014.
Jayne, J. T. and Worsnop, D. R.: Particle capture device, Aerodyne Research, Inc., 20150040689 A1, 2016.
Jeong, U., Kim, J., Lee, H., and Lee, Y. G.: Assessing the effect of long-range pollutant transportation on air quality in Seoul using the conditional potential source contribution function method, Atmos. Environ., 150, 33–44, https://doi.org/10.1016/j.atmosenv.2016.11.017, 2017.
Jimenez, J. L., Canagaratna, M. R., Donahue, N. M., Prévôt, A. S. H., Zhang, Q., Kroll, J. H., DeCarlo, P. F., Allan, J. D., Coe, H., Ng, N. L., Aiken, A. C., Docherty, K. S., Ulbrich, I. M., Grieshop, A. P., Robinson, A. L., Duplissy, J., Smith, J. D., Wilson, K. R., Lanz, V. A., Hueglin, C., Sun, Y. L., Tian, J., Laaksonen, A., Raatikainen, T., Rautiainen, J., Vaattovaara, P., Ehn, M., Kulmala, M., Tomlinson, J. M., Collins, D. R., Cubison, M. J., Dunlea, E. J., Huffman, J. A., Onasch, T. B., Alfarra, M. R., Williams, P. I., Bower, K., Kondo, Y., Schneider, J., Drewnick, F., Borrmann, S., Weimer, S., Demerjian, K., Salcedo, D., Cottrell, L., Griffin, R., Takami, A., Miyoshi, T., Hatakeyama, S., Shimono, A., Sun, J. Y., Zhang, Y. M., Dzepina, K., Kimmel, J. R., Sueper, D., Jayne, J. T., Herndon, S. C., Trimborn, A. M., Williams, L. R., Wood, E. C., Middlebrook, A. M., Kolb, C. E., Baltensperger, U., and Worsnop, D. R.: Evolution of Organic Aerosols in the Atmosphere, Science, 326, 1525–1529, https://doi.org/10.1126/science.1180353, 2009.
Jimenez, J. L., Campuzano-Jost, P., Day, D. A., Nault, B. A., Schroder, J. C., and Cubison, M. J.: Frequently AMS Questions for AMS Data Users, available at: http://cires.colorado.edu/jimenez-group/wiki/index.php?title=FAQ_for_AMS_Data_Users (last access: 6 December 2018), 2018.
Kang, E., Root, M. J., Toohey, D. W., and Brune, W. H.: Introducing the concept of Potential Aerosol Mass (PAM), Atmos. Chem. Phys., 7, 5727–5744, https://doi.org/10.5194/acp-7-5727-2007, 2007.
Kang, E., Lee, M., Brune, W. H., Lee, T., Park, T., Ahn, J., and Shang, X.: Photochemical aging of aerosol particles in different air masses arriving at Baengnyeong Island, Korea, Atmos. Chem. Phys., 18, 6661–6677, https://doi.org/10.5194/acp-18-6661-2018, 2018.
Khare, P. and Gentner, D. R.: Considering the future of anthropogenic gas-phase organic compound emissions and the increasing influence of non-combustion sources on urban air quality, Atmos. Chem. Phys., 18, 5391–5413, https://doi.org/10.5194/acp-18-5391-2018, 2018.
Kim, B. M., Seo, J., Kim, J. Y., Lee, J. Y., and Kim, Y.: Transported vs. local contributions from secondary and biomass burning sources to PM2.5, Atmos. Environ., 144, 24–36, https://doi.org/10.1016/j.atmosenv.2016.08.072, 2016.
Kim, H., Zhang, Q., Bae, G.-N., Kim, J. Y., and Lee, S. B.: Sources and atmospheric processing of winter aerosols in Seoul, Korea: insights from real-time measurements using a high-resolution aerosol mass spectrometer, Atmos. Chem. Phys., 17, 2009–2033, https://doi.org/10.5194/acp-17-2009-2017, 2017.
Kim, H., Zhang, Q., and Heo, J.: Influence of intense secondary aerosol formation and long-range transport on aerosol chemistry and properties in the Seoul Metropolitan Area during spring time: results from KORUS-AQ, Atmos. Chem. Phys., 18, 7149–7168, https://doi.org/10.5194/acp-18-7149-2018, 2018.
Kim, H. C., Kim, E., Bae, C., Cho, J. H., Kim, B.-U., and Kim, S.: Regional contributions to particulate matter concentration in the Seoul metropolitan area, South Korea: seasonal variation and sensitivity to meteorology and emissions inventory, Atmos. Chem. Phys., 17, 10315–10332, https://doi.org/10.5194/acp-17-10315-2017, 2017.
Kim, H. S., Huh, J. B., Hopke, P. K., Holsen, T. M., and Yi, S. M.: Characteristics of the major chemical constituents of PM2.5 and smog events in Seoul, Korea in 2003 and 2004, Atmos. Environ., 41, 6762–6770, https://doi.org/10.1016/j.atmosenv.2007.04.060, 2007.
Kim, S., Huey, L. G., Stickel, R. E., Tanner, D. J., Crawford, J. H., Olson, J. R., Chen, G., Brune, W. H., Ren, X., Lesher, R., Wooldridge, P. J., Bertram, T. H., Perring, A., Cohen, R. C., Lefer, B. L., Shetter, R. E., Avery, M., Diskin, G., and Sokolik, I.: Measurement of HO2NO2 in the free troposphere during the Intercontinental Chemical Transport Experiment–North America 2004, J. Geophys. Res., 112, D12S01, https://doi.org/10.1029/2006JD007676, 2007.
Kim, Y. J., Woo, J. H., Ma, Y. Il, Kim, S., Nam, J. S., Sung, H., Choi, K. C., Seo, J., Kim, J. S., Kang, C. H., Lee, G., Ro, C. U., Chang, D., and Sunwoo, Y.: Chemical characteristics of long-range transport aerosol at background sites in Korea, Atmos. Environ., 43, 5556–5566, https://doi.org/10.1016/j.atmosenv.2009.03.062, 2009.
Kimmel, J. R., Farmer, D. K., Cubison, M. J., Sueper, D., Tanner, C., Nemitz, E., Worsnop, D. R., Gonin, M., and Jimenez, J. L.: Real-time aerosol mass spectrometry with millisecond resolution, Int. J. Mass Spectrom., 303, 15–26, https://doi.org/10.1016/j.ijms.2010.12.004, 2011.
Kleinman, L., Kuang, C., Sedlacek, A., Senum, G., Springston, S., Wang, J., Zhang, Q., Jayne, J., Fast, J., Hubbe, J., Shilling, J., and Zaveri, R.: What do correlations tell us about anthropogenic–biogenic interactions and SOA formation in the Sacramento plume during CARES?, Atmos. Chem. Phys., 16, 1729–1746, https://doi.org/10.5194/acp-16-1729-2016, 2016.
Kleinman, L. I., Daum, P. H., Lee, Y.-N., Senum, G. I., Springston, S. R., Wang, J., Berkowitz, C., Hubbe, J., Zaveri, R. A., Brechtel, F. J., Jayne, J., Onasch, T. B., and Worsnop, D.: Aircraft observations of aerosol composition and ageing in New England and Mid-Atlantic States during the summer 2002 New England Air Quality Study field campaign, J. Geophys. Res., 112, D09310, https://doi.org/10.1029/2006JD007786, 2007.
Kleinman, L. I., Springston, S. R., Daum, P. H., Lee, Y.-N., Nunnermacker, L. J., Senum, G. I., Wang, J., Weinstein-Lloyd, J., Alexander, M. L., Hubbe, J., Ortega, J., Canagaratna, M. R., and Jayne, J.: The time evolution of aerosol composition over the Mexico City plateau, Atmos. Chem. Phys., 8, 1559–1575, https://doi.org/10.5194/acp-8-1559-2008, 2008.
Kleinman, L. I., Springston, S. R., Wang, J., Daum, P. H., Lee, Y.-N., Nunnermacker, L. J., Senum, G. I., Weinstein-Lloyd, J., Alexander, M. L., Hubbe, J., Ortega, J., Zaveri, R. A., Canagaratna, M. R., and Jayne, J.: The time evolution of aerosol size distribution over the Mexico City plateau, Atmos. Chem. Phys., 9, 4261–4278, https://doi.org/10.5194/acp-9-4261-2009, 2009.
Knote, C., Hodzic, A., Jimenez, J. L., Volkamer, R., Orlando, J. J., Baidar, S., Brioude, J., Fast, J., Gentner, D. R., Goldstein, A. H., Hayes, P. L., Knighton, W. B., Oetjen, H., Setyan, A., Stark, H., Thalman, R., Tyndall, G., Washenfelder, R., Waxman, E., and Zhang, Q.: Simulation of semi-explicit mechanisms of SOA formation from glyoxal in aerosol in a 3-D model, Atmos. Chem. Phys., 14, 6213–6239, https://doi.org/10.5194/acp-14-6213-2014, 2014.
Krechmer, J. E., Pagonis, D., Ziemann, P. J., and Jimenez, J. L.: Quantification of Gas-Wall Partitioning in Teflon Environmental Chambers Using Rapid Bursts of Low-Volatility Oxidized Species Generated in Situ, Environ. Sci. Technol., 50, 5757–5765, https://doi.org/10.1021/acs.est.6b00606, 2016.
Krechmer, J. E., Day, D. A., Ziemann, P. J., and Jimenez, J. L.: Direct Measurements of Gas/Particle Partitioning and Mass Accommodation Coefficients in Environmental Chambers, Environ. Sci. Technol., 51, 11867–11875, https://doi.org/10.1021/acs.est.7b02144, 2017.
Kroll, J. H. and Seinfeld, J. H.: Chemistry of secondary organic aerosol: Formation and evolution of low-volatility organics in the atmosphere, Atmos. Environ., 42, 3593–3624, https://doi.org/10.1016/J.ATMOSENV.2008.01.003, 2008.
Kroll, J. H., Donahue, N. M., Jimenez, J. L., Kessler, S. H., Canagaratna, M. R., Wilson, K. R., Altieri, K. E., Mazzoleni, L. R., Wozniak, A. S., Bluhm, H., Mysak, E. R., Smith, J. D., Kolb, C. E., and Worsnop, D. R.: Carbon oxidation state as a metric for describing the chemistry of atmospheric organic aerosol, Nat. Chem., 3, 133–139, https://doi.org/10.1038/nchem.948, 2011.
Kupc, A., Williamson, C., Wagner, N. L., Richardson, M., and Brock, C. A.: Modification, calibration, and performance of the Ultra-High Sensitivity Aerosol Spectrometer for particle size distribution and volatility measurements during the Atmospheric Tomography Mission (ATom) airborne campaign, Atmos. Meas. Tech., 11, 369–383, https://doi.org/10.5194/amt-11-369-2018, 2018.
Lamb, K. D., Perring, A. E., Samset, B., Peterson, D., Davis, S., Anderson, B. E., Beyersdorf, A., Blake, D. R., Campuzano-Jost, P., Corr, C. A., Diskin, G. S., Kondo, Y., Moteki, N., Nault, B. A., Oh, J., Park, M., Pusede, S. E., Simpson, I. J., Thornhill, K. L., Wisthaler, A., and Schwarz, J. P.: Estimating Source Region Influences on Black Carbon Abundance, Microphysics, and Radiative Effect Observed over South Korea, J. Geophys. Res.-Atmos., https://doi.org/10.1029/2018JD029257, 2018.
Lambe, A. T., Ahern, A. T., Williams, L. R., Slowik, J. G., Wong, J. P. S., Abbatt, J. P. D., Brune, W. H., Ng, N. L., Wright, J. P., Croasdale, D. R., Worsnop, D. R., Davidovits, P., and Onasch, T. B.: Characterization of aerosol photooxidation flow reactors: heterogeneous oxidation, secondary organic aerosol formation and cloud condensation nuclei activity measurements, Atmos. Meas. Tech., 4, 445–461, https://doi.org/10.5194/amt-4-445-2011, 2011.
Lambe, A. T., Onasch, T. B., Croasdale, D. R., Wright, J. P., Martin, A. T., Franklin, J. P., Massoli, P., Kroll, J. H., Canagaratna, M. R., Brune, W. H., Worsnop, D. R., and Davidovits, P.: Transitions from Functionalization to Fragmentation Reactions of Laboratory Secondary Organic Aerosol (SOA) Generated from the OH Oxidation of Alkane Precursors, Environ. Sci. Technol., 46, 5430–5437, https://doi.org/10.1021/Es300274t, 2012.
Landrigan, P. J., Fuller, R., Acosta, N. J. R., Adeyi, O., Arnold, R., Basu, N., Baldé, A. B., Bertollini, R., Bose-O'Reilly, S., Boufford, J. I., Breysse, P. N., Chiles, T., Mahidol, C., Coll-Seck, A. M., Cropper, M. L., Fobil, J., Fuster, V., Greenstone, M., Haines, A., Hanrahan, D., Hunter, D., Khare, M., Krupnick, A., Lanphear, B., Lohani, B., Martin, K., Mathiasen, K. V, McTeer, M. A., Murray, C. J. L., Ndahimananjara, J. D., Perera, F., Potočnik, J., Preker, A. S., Ramesh, J., Rockström, J., Salinas, C., Samson, L. D., Sandilya, K., Sly, P. D., Smith, K. R., Steiner, A., Stewart, R. B., Suk, W. A., van Schayck, O. C. P., Yadama, G. N., Yumkella, K., and Zhong, M.: The Lancet Commission on pollution and health, Lancet, 391, 462–512, https://doi.org/10.1016/S0140-6736(17)32345-0, 2018.
Lee, G., Choi, H. S., Lee, T., Choi, J., Park, J. S., and Ahn, J. Y.: Variations of regional background peroxyacetyl nitrate in marine boundary layer over Baengyeong Island, South Korea, Atmos. Environ., 61, 533–541, https://doi.org/10.1016/j.atmosenv.2012.07.075, 2012.
Lee, H. M., Park, R. J., Henze, D. K., Lee, S., Shim, C., Shin, H. J., Moon, K. J., and Woo, J. H.: PM2.5 source attribution for Seoul in May from 2009 to 2013 using GEOS-Chem and its adjoint model, Environ. Pollut., 221, 377–384, https://doi.org/10.1016/j.envpol.2016.11.088, 2017.
Lee, S., Ho, C.-H., Lee, Y. G., Choi, H.-J., and Song, C.-K.: Influence of transboundary air pollutants from China on the high-PM10 episode in Seoul, Korea for the period October 16–20, 2008, Atmos. Environ., 77, 430–439, https://doi.org/10.1016/J.ATMOSENV.2013.05.006, 2013.
Lee, T., Choi, J., Lee, G., Ahn, J., Park, J. S., Atwood, S. A., Schurman, M., Choi, Y., Chung, Y., and Collett, J. L.: Characterization of aerosol composition, concentrations, and sources at Baengnyeong Island, Korea using an aerosol mass spectrometer, Atmos. Environ., 120, 297–306, https://doi.org/10.1016/j.atmosenv.2015.08.038, 2015.
Lelieveld, J., Evans, J. S., Fnais, M., Giannadaki, D., and Pozzer, A.: The contribution of outdoor air pollution sources to premature mortality on a global scale, Nature, 525, 367–371, https://doi.org/10.1038/nature15371, 2015.
Li, R., Palm, B. B., Ortega, A. M., Hlywiak, J., Hu, W., Peng, Z., Day, D. A., Knote, C., Brune, W. H., de Gouw, J. A., and Jimenez, J. L.: Modeling the radical chemistry in an oxidation flow reactor: radical formation and recycling, sensitivities, and the OH exposure estimation equation, J. Phys. Chem. A, 119, 4418–4432, https://doi.org/10.1021/jp509534k, 2015.
Liu, T., Wang, X., Deng, W., Hu, Q., Ding, X., Zhang, Y., He, Q., Zhang, Z., Lü, S., Bi, X., Chen, J., and Yu, J.: Secondary organic aerosol formation from photochemical aging of light-duty gasoline vehicle exhausts in a smog chamber, Atmos. Chem. Phys., 15, 9049–9062, https://doi.org/10.5194/acp-15-9049-2015, 2015.
Liu, X., Huey, L. G., Yokelson, R. J., Selimovic, V., Simpson, I. J., Müller, M., Jimenez, J. L., Campuzano-Jost, P., Beyersdorf, A. J., Blake, D. R., Butterfield, Z., Choi, Y., Crounse, J. D., Day, D. A., Diskin, G. S., Dubey, M. K., Fortner, E., Hanisco, T. F., Hu, W., King, L. E., Kleinman, L., Meinardi, S., Mikoviny, T., Onasch, T. B., Palm, B. B., Peischl, J., Pollack, I. B., Ryerson, T. B., Sachse, G. W., Sedlacek, A. J., Shilling, J. E., Springston, S., St. Clair, J. M., Tanner, D. J., Teng, A. P., Wennberg, P. O., Wisthaler, A., and Wolfe, G. M.: Airborne measurements of western U.S. wildfire emissions: Comparison with prescribed burning and air quality implications, J. Geophys. Res., 122, 6108–6129, https://doi.org/10.1002/2016JD026315, 2017.
Liu, X., Deming, B., Pagonis, D., Day, D. A., Palm, B. B., Talukdar, R., Roberts, J. M., Veres, P., Krechmer, J., Thornton, J. A., de Gouw, J. A., Ziemann, P. J., and Jimenez, J. L.: Effects of Gas-Wall Interactions on Measurements of Semivolatile Compounds and Small Molecules, in preparation, 2018.
Ma, P. K., Zhao, Y., Robinson, A. L., Worton, D. R., Goldstein, A. H., Ortega, A. M., Jimenez, J. L., Zotter, P., Prévôt, A. S. H., Szidat, S., and Hayes, P. L.: Evaluating the impact of new observational constraints on P-S/IVOC emissions, multi-generation oxidation, and chamber wall losses on SOA modeling for Los Angeles, CA, Atmos. Chem. Phys., 17, 9237–9259, https://doi.org/10.5194/acp-17-9237-2017, 2017.
Mao, J., Ren, X., Brune, W. H., Olson, J. R., Crawford, J. H., Fried, A., Huey, L. G., Cohen, R. C., Heikes, B., Singh, H. B., Blake, D. R., Sachse, G. W., Diskin, G. S., Hall, S. R., and Shetter, R. E.: Airborne measurement of OH reactivity during INTEX-B, Atmos. Chem. Phys., 9, 163–173, https://doi.org/10.5194/acp-9-163-2009, 2009.
Matsunaga, A. and Ziemann, P. J.: Gas-Wall Partitioning of Organic Compounds in a Teflon Film Chamber and Potential Effects on Reaction Product and Aerosol Yield Measurements, Aerosol Sci. Technol., 44, 881–892, https://doi.org/10.1080/02786826.2010.501044, 2010.
McDonald, B. C., de Gouw, J. A., Gilman, J. B., Jathar, S. H., Akherati, A., Cappa, C. D., Jimenez, J. L., Lee-Taylor, J., Hayes, P. L., McKeen, S. A., Cui, Y. Y., Kim, S.-W., Gentner, D. R., Isaacman-VanWertz, G., Goldstein, A. H., Harley, R. A., Frost, G. J., Roberts, J. M., Ryerson, T. B., and Trainer, M.: Volatile chemical products emerging as largest petrochemical source of urban organic emissions, Science, 359, 760–764, https://doi.org/10.1126/science.aaq0524, 2018.
McKeen, S. A., Liu, S. C., Hsie, E.-Y., Lin, X., Bradshaw, J. D., Smyth, S., Gregory, G. L., and Blake, D. R.: Hydrocarbon ratios during PEM-WEST A: A model perspective, J. Geophys. Res. Atmos., 101, 2087–2109, https://doi.org/10.1029/95JD02733, 1996.
McMeeking, G. R., Bart, M., Chazette, P., Haywood, J. M., Hopkins, J. R., McQuaid, J. B., Morgan, W. T., Raut, J.-C., Ryder, C. L., Savage, N., Turnbull, K., and Coe, H.: Airborne measurements of trace gases and aerosols over the London metropolitan region, Atmos. Chem. Phys., 12, 5163–5187, https://doi.org/10.5194/acp-12-5163-2012, 2012.
McNaughton, C. S., Clarke, A. D., Howell, S. G., Pinkerton, M., Anderson, B., Thornhill, L., Hudgins, C., Winstead, E., Dibb, J. E., Scheuer, E., and Maring, H.: Results from the DC-8 Inlet Characterization Experiment (DICE): Airborne versus surface sampling of mineral dust and sea salt aerosols, Aerosol Sci. Technol., 41, 136–159, https://doi.org/10.1080/02786820601118406, 2007.
Middlebrook, A. M., Bahreini, R., Jimenez, J. L., and Canagaratna, M. R.: Evaluation of Composition-Dependent Collection Efficiencies for the Aerodyne Aerosol Mass Spectrometer using Field Data, Aerosol Sci. Technol., 46, 258–271, https://doi.org/10.1080/02786826.2011.620041, 2012.
Miracolo, M. A., Presto, A. A., Lambe, A. T., Hennigan, C. J., Donahue, N. M., Kroll, J. H., Worsnop, D. R., and Robinson, A. L.: Photo-Oxidation of Low-Volatility Organics Found in Motor Vehicle Emissions: Production and Chemical Evolution of Organic Aerosol Mass, Environ. Sci. Technol., 44, 1638–1643, https://doi.org/10.1021/es902635c, 2010.
Mitroo, D., Sun, Y., Combest, D. P., Kumar, P., and Williams, B. J.: Assessing the degree of plug flow in oxidation flow reactors (OFRs): a study on a potential aerosol mass (PAM) reactor, Atmos. Meas. Tech., 11, 1741–1756, https://doi.org/10.5194/amt-11-1741-2018, 2018.
Monks, P. S., Granier, C., Fuzzi, S., Stohl, A., Williams, M. L., Akimoto, H., Amann, M., Baklanov, A., Baltensperger, U., Bey, I., Blake, N., Blake, R. S., Carslaw, K., Cooper, O. R., Dentener, F., Fowler, D., Fragkou, E., Frost, G. J., Generoso, S., Ginoux, P., Grewe, V., Guenther, A., Hansson, H. C., Henne, S., Hjorth, J., Hofzumahaus, A., Huntrieser, H., Isaksen, I. S. A., Jenkin, M. E., Kaiser, J., Kanakidou, M., Klimont, Z., Kulmala, M., Laj, P., Lawrence, M. G., Lee, J. D., Liousse, C., Maione, M., McFiggans, G., Metzger, A., Mieville, A., Moussiopoulos, N., Orlando, J. J., O'Dowd, C. D., Palmer, P. I. I., Parrish, D. D., Petzold, A., Platt, U., Pöschl, U., Prévôt, A. S. H., Reeves, C. E., Reimann, S., Rudich, Y., Sellegri, K., Steinbrecher, R., Simpson, D., ten Brink, H., Theloke, J., van der Werf, G. R., Vautard, R., Vestreng, V., Vlachokostas, C., and von Glasow, R.: Atmospheric composition change – global and regional air quality, Atmos. Environ., 43, 5268–5350, https://doi.org/10.1016/j.atmosenv.2009.08.021, 2009.
Morino, Y., Tanabe, K., Sato, K., and Ohara, T.: Secondary organic aerosol model intercomparison based on secondary organic aerosol to odd oxygen ratio in Tokyo, J. Geophys. Res.-Atmos., 119, 13489–13505, https://doi.org/10.1002/2014JD021937, 2014.
Müller, M., Mikoviny, T., Feil, S., Haidacher, S., Hanel, G., Hartungen, E., Jordan, A., Märk, L., Mutschlechner, P., Schottkowsky, R., Sulzer, P., Crawford, J. H., and Wisthaler, A.: A compact PTR-ToF-MS instrument for airborne measurements of volatile organic compounds at high spatiotemporal resolution, Atmos. Meas. Tech., 7, 3763–3772, https://doi.org/10.5194/amt-7-3763-2014, 2014.
Murphy, B. N., Donahue, N. M., Fountoukis, C., and Pandis, S. N.: Simulating the oxygen content of ambient organic aerosol with the 2D volatility basis set, Atmos. Chem. Phys., 11, 7859–7873, https://doi.org/10.5194/acp-11-7859-2011, 2011.
Murphy, B. N., Woody, M. C., Jimenez, J. L., Carlton, A. M. G., Hayes, P. L., Liu, S., Ng, N. L., Russell, L. M., Setyan, A., Xu, L., Young, J., Zaveri, R. A., Zhang, Q., and Pye, H. O. T.: Semivolatile POA and parameterized total combustion SOA in CMAQv5.2: impacts on source strength and partitioning, Atmos. Chem. Phys., 17, 11107–11133, https://doi.org/10.5194/acp-17-11107-2017, 2017.
Myhre, G., Shindell, D., Bréon, F.-M., Collins, W., Fuglestvedt, J., Huang, J., Koch, D., Lamarque, J.-F., Lee, D., Mendoza, B., Nakajima, T., Robock, A., Stephens, G., Takemura, T., and Zhang, H.: Anthropogenic and Natural Radiative Forcing, in: Climate Change 2013: The Physical Science Basis. Contribution of Working Group I to the Fifth Assessment Report of the Intergovernmental Panel on Climate Change, edited by: Stocker, T. F., Qin, D., Plattner, G.-K., Tignor, M., Allen, S. K., Boschung, J., Nauels, A., Xia, Y., Bex, V., and Midgley, P. M., p. 659, Cambridge University Press, Cambridge, United Kingdom and New York, NY, USA, United Kingdom and New York, NY, USA, available at: https://www.ipcc.ch/report/ar5/wg1/ (last access: 6 December 2017), 2013.
Novelli, P. C., Crotwell, A., Lang, P. M., and Mund, J.: Atmospheric Carbon Monoxide Dry Air Mole Fractions from the NOAA ESRL Carbon Cycle Cooperative Global Air Sampling Network, 1988–2016, Version: 2017-07-28, available at: ftp://aftp.cmdl.noaa.gov/data/trace_gases/co/flask/surface/ (last access: 22 November 2016), 2017.
OECD: Exposure to PM2.5 in countries and regions: Exposure to PM2.5 in macroregions, available at: https://stats.oecd.org/index.aspx?queryid=72722, last access: 1 August 2018.
Ortega, A. M., Hayes, P. L., Peng, Z., Palm, B. B., Hu, W., Day, D. A., Li, R., Cubison, M. J., Brune, W. H., Graus, M., Warneke, C., Gilman, J. B., Kuster, W. C., de Gouw, J., Gutiérrez-Montes, C., and Jimenez, J. L.: Real-time measurements of secondary organic aerosol formation and aging from ambient air in an oxidation flow reactor in the Los Angeles area, Atmos. Chem. Phys., 16, 7411–7433, https://doi.org/10.5194/acp-16-7411-2016, 2016.
Ots, R., Vieno, M., Allan, J. D., Reis, S., Nemitz, E., Young, D. E., Coe, H., Di Marco, C., Detournay, A., Mackenzie, I. A., Green, D. C., and Heal, M. R.: Model simulations of cooking organic aerosol (COA) over the UK using estimates of emissions based on measurements at two sites in London, Atmos. Chem. Phys., 16, 13773–13789, https://doi.org/10.5194/acp-16-13773-2016, 2016.
Pagonis, D., Krechmer, J. E., de Gouw, J., Jimenez, J. L., and Ziemann, P. J.: Effects of gas–wall partitioning in Teflon tubing and instrumentation on time-resolved measurements of gas-phase organic compounds, Atmos. Meas. Tech., 10, 4687–4696, https://doi.org/10.5194/amt-10-4687-2017, 2017.
Palm, B. B., Campuzano-Jost, P., Ortega, A. M., Day, D. A., Kaser, L., Jud, W., Karl, T., Hansel, A., Hunter, J. F., Cross, E. S., Kroll, J. H., Peng, Z., Brune, W. H., and Jimenez, J. L.: In situ secondary organic aerosol formation from ambient pine forest air using an oxidation flow reactor, Atmos. Chem. Phys., 16, 2943–2970, https://doi.org/10.5194/acp-16-2943-2016, 2016.
Palm, B. B., Campuzano-Jost, P., Day, D. A., Ortega, A. M., Fry, J. L., Brown, S. S., Zarzana, K. J., Dube, W., Wagner, N. L., Draper, D. C., Kaser, L., Jud, W., Karl, T., Hansel, A., Gutiérrez-Montes, C., and Jimenez, J. L.: Secondary organic aerosol formation from in situ OH, O3, and NO3 oxidation of ambient forest air in an oxidation flow reactor, Atmos. Chem. Phys., 17, 5331–5354, https://doi.org/10.5194/acp-17-5331-2017, 2017.
Palm, B. B., de Sá, S. S., Day, D. A., Campuzano-Jost, P., Hu, W., Seco, R., Sjostedt, S. J., Park, J.-H., Guenther, A. B., Kim, S., Brito, J., Wurm, F., Artaxo, P., Thalman, R., Wang, J., Yee, L. D., Wernis, R., Isaacman-VanWertz, G., Goldstein, A. H., Liu, Y., Springston, S. R., Souza, R., Newburn, M. K., Alexander, M. L., Martin, S. T., and Jimenez, J. L.: Secondary organic aerosol formation from ambient air in an oxidation flow reactor in central Amazonia, Atmos. Chem. Phys., 18, 467–493, https://doi.org/10.5194/acp-18-467-2018, 2018.
Park, M. E., Song, C. H., Park, R. S., Lee, J., Kim, J., Lee, S., Woo, J.-H., Carmichael, G. R., Eck, T. F., Holben, B. N., Lee, S.-S., Song, C. K., and Hong, Y. D.: New approach to monitor transboundary particulate pollution over Northeast Asia, Atmos. Chem. Phys., 14, 659–674, https://doi.org/10.5194/acp-14-659-2014, 2014.
Park, M.-S., Park, S.-H., Chae, J.-H., Choi, M.-H., Song, Y., Kang, M., and Roh, J.-W.: High-resolution urban observation network for user-specific meteorological information service in the Seoul Metropolitan Area, South Korea, Atmos. Meas. Tech., 10, 1575–1594, https://doi.org/10.5194/amt-10-1575-2017, 2017.
Park, S. S., Kim, J.-H., and Jeong, J.-U.: Abundance and sources of hydrophilic and hydrophobic water-soluble organic carbon at an urban site in Korea in summer, J. Environ. Monit., 14, 224–232, https://doi.org/10.1039/c1em10617a, 2012.
Parrish, D. D., Stohl, A., Forster, C., Atlas, E. L., Blake, D. R., Goldan, P. D., Kuster, W. C., and de Gouw, J. A.: Effects of mixing on evolution of hydrocarbon ratios in the troposphere, J. Geophys. Res., 112, D10S34, https://doi.org/10.1029/2006JD007583, 2007.
Parrish, D. D., Ryerson, T. B., Mellqvist, J., Johansson, J., Fried, A., Richter, D., Walega, J. G., Washenfelder, R. A., de Gouw, J. A., Peischl, J., Aikin, K. C., McKeen, S. A., Frost, G. J., Fehsenfeld, F. C., and Herndon, S. C.: Primary and secondary sources of formaldehyde in urban atmospheres: Houston Texas region, Atmos. Chem. Phys., 12, 3273–3288, https://doi.org/10.5194/acp-12-3273-2012, 2012.
Peischl, J., Ryerson, T. B., Brioude, J., Aikin, K. C., Andrews, A. E., Atlas, E., Blake, D., Daube, B. C., de Gouw, J. A., Dlugokencky, E., Frost, G. J., Gentner, D. R., Gilman, J. B., Goldstein, A. H., Harley, R. A., Holloway, J. S., Kofler, J., Kuster, W. C., Lang, P. M., Novelli, P. C., Santoni, G. W., Trainer, M., Wofsy, S. C., and Parrish, D. D.: Quantifying sources of methane using light alkanes in the Los Angeles basin, California, J. Geophys. Res.-Atmos., 118, 4974–4990, https://doi.org/10.1002/jgrd.50413, 2013.
Peng, J. F., Hu, M., Wang, Z. B., Huang, X. F., Kumar, P., Wu, Z. J., Guo, S., Yue, D. L., Shang, D. J., Zheng, Z., and He, L. Y.: Submicron aerosols at thirteen diversified sites in China: size distribution, new particle formation and corresponding contribution to cloud condensation nuclei production, Atmos. Chem. Phys., 14, 10249–10265, https://doi.org/10.5194/acp-14-10249-2014, 2014.
Peng, Z., Day, D. A., Stark, H., Li, R., Lee-Taylor, J., Palm, B. B., Brune, W. H., and Jimenez, J. L.: HOx radical chemistry in oxidation flow reactors with low-pressure mercury lamps systematically examined by modeling, Atmos. Meas. Tech., 8, 4863–4890, https://doi.org/10.5194/amt-8-4863-2015, 2015.
Peng, Z., Day, D. A., Ortega, A. M., Palm, B. B., Hu, W., Stark, H., Li, R., Tsigaridis, K., Brune, W. H., and Jimenez, J. L.: Non-OH chemistry in oxidation flow reactors for the study of atmospheric chemistry systematically examined by modeling, Atmos. Chem. Phys., 16, 4283–4305, https://doi.org/10.5194/acp-16-4283-2016, 2016.
Perring, A. E., Bertram, T. H., Farmer, D. K., Wooldridge, P. J., Dibb, J., Blake, N. J., Blake, D. R., Singh, H. B., Fuelberg, H., Diskin, G., Sachse, G., and Cohen, R. C.: The production and persistence of ΣRONO2 in the Mexico City plume, Atmos. Chem. Phys., 10, 7215–7229, https://doi.org/10.5194/acp-10-7215-2010, 2010.
Platt, S. M., El Haddad, I., Zardini, A. A., Clairotte, M., Astorga, C., Wolf, R., Slowik, J. G., Temime-Roussel, B., Marchand, N., Ježek, I., Drinovec, L., Mocnik, G., Möhler, O., Richter, R., Barmet, P., Bianchi, F., Baltensperger, U., and Prévôt, A. S. H.: Secondary organic aerosol formation from gasoline vehicle emissions in a new mobile environmental reaction chamber, Atmos. Chem. Phys., 13, 9141–9158, https://doi.org/10.5194/acp-13-9141-2013, 2013.
Platt, S. M., El Haddad, I., Pieber, S. M., Zardini, A. A., Suarez-Bertoa, R., Clairotte, M., Daellenbach, K. R., Huang, R.-J., Slowik, J. G., Hellebust, S., Temime-Roussel, B., Marchand, N., de Gouw, J., Jimenez, J. L., Hayes, P. L., Robinson, A. L., Baltensperger, U., Astorga, C., and Prévôt, A. S. H.: Gasoline cars produce more carbonaceous particulate matter than modern filter-equipped diesel cars, Sci. Rep.-UK, 7, 4926, https://doi.org/10.1038/s41598-017-03714-9, 2017.
Presto, A. A., Gordon, T. D., and Robinson, A. L.: Primary to secondary organic aerosol: evolution of organic emissions from mobile combustion sources, Atmos. Chem. Phys., 14, 5015–5036, https://doi.org/10.5194/acp-14-5015-2014, 2014.
Price, H. U., Jaffe, D. A., Cooper, O. R., and Doskey, P. V: Photochemistry, ozone production, and dilution during long-range transport episodes from Eurasia to the northwest United States, J. Geophys. Res.-Atmos., 109, D23S13, https://doi.org/10.1029/2003JD004400, 2004.
Pye, H. O. T. and Seinfeld, J. H.: A global perspective on aerosol from low-volatility organic compounds, Atmos. Chem. Phys., 10, 4377–4401, https://doi.org/10.5194/acp-10-4377-2010, 2010.
Richter, D., Weibring, P., Walega, J. G., Fried, A., Spuler, S. M., and Taubman, M. S.: Compact highly sensitive multi-species airborne mid-IR spectrometer, Appl. Phys. B, 119, 119–131, https://doi.org/10.1007/s00340-015-6038-8, 2015.
Robinson, A. L., Donahue, N. M., Shrivastava, M. K., Weitkamp, E. A., Sage, A. M., Grieshop, A. P., Lane, T. E., Pierce, J. R., and Pandis, S. N.: Rethinking Organic Aerosols: Semivolatile Emissions and Photochemical Aging, Science, 315, 1259–1262, https://doi.org/10.1126/science.1133061, 2007.
Sachse, G. W., Hill, G. F., Wade, L. O., and Perry, M. G.: Fast-Response, High-Precision Carbon Monoxide Sensor using a Tunable Diode Laser Absorption Technique, J. Geophys. Res., 92, 2071–2081, https://doi.org/10.1029/JD092iD02p02071, 1987.
Sato, K., Nakashima, Y., Morino, Y., Imamura, T., Kurokawa, J., and Kajii, Y.: Total OH reactivity measurements for the OH-initiated oxidation of aromatic hydrocarbons in the presence of NOx, Atmos. Environ., 171, 272–278, https://doi.org/10.1016/j.atmosenv.2017.10.036, 2017.
Schroder, J. C., Campuzano-Jost, P., Day, D. A., Shah, V., Larson, K., Sommers, J. M., Sullivan, A. P., Campos, T., Reeves, J. M., Hills, A., Hornbrook, R. S., Blake, N. J., Scheuer, E., Guo, H., Fibiger, D. L., McDuffie, E. E., Hayes, P. L., Weber, R. J., Dibb, J. E., Apel, E. C., Jaeglé, L., Brown, S. S., Thronton, J. A., and Jimenez, J. L.: Sources and Secondary Production of Organic Aerosols in the Northeastern US during WINTER, J. Geophys. Res.-Atmos., 123, 7771–7796, https://doi.org/10.1029/2018JD028475, 2018.
Schwantes, R. H., Schilling, K. A., McVay, R. C., Lignell, H., Coggon, M. M., Zhang, X., Wennberg, P. O., and Seinfeld, J. H.: Formation of highly oxygenated low-volatility products from cresol oxidation, Atmos. Chem. Phys., 17, 3453–3474, https://doi.org/10.5194/acp-17-3453-2017, 2017.
Schwarz, J. P., Samset, B. H., Perring, A. E., Spackman, J. R., Gao, R. S., Stier, P., Schulz, M., Moore, F. L., Ray, E. A., and Fahey, D. W.: Global-scale seasonally resolved black carbon vertical profiles over the Pacific, Geophys. Res. Lett., 40, 5542–5547, https://doi.org/10.1002/2013GL057775, 2013.
Seo, J., Kim, J. Y., Youn, D., Lee, J. Y., Kim, H., Lim, Y. B., Kim, Y., and Jin, H. C.: On the multiday haze in the Asian continental outflow: the important role of synoptic conditions combined with regional and local sources, Atmos. Chem. Phys., 17, 9311–9332, https://doi.org/10.5194/acp-17-9311-2017, 2017.
Shingler, T., Crosbie, E., Ortega, A., Shiraiwa, M., Zuend, A., Beyersdorf, A., Ziemba, L., Anderson, B., Thornhill, L., Perring, A. E., Schwarz, J. P., Campazano-Jost, P., Day, D. A., Jimenez, J. L., Hair, J. W., Mikoviny, T., Wisthaler, A., and Sorooshian, A.: Airborne characterization of subsaturated aerosol hygroscopicity and dry refractive index from the surface to 6.5km during the SEAC4RS campaign, J. Geophys. Res., 121, 4188–4210, https://doi.org/10.1002/2015JD024498, 2016.
Shrivastava, M., Cappa, C. D., Fan, J., Goldstein, A. H., Guenther, A. B., Jimenez, J. L., Kuang, C., Laskin, A., Martin, S. T., Ng, N. L., Petaja, T., Pierce, J. R., Rasch, P. J., Roldin, P., Seinfeld, J. H., Shilling, J., Smith, J. N., Thornton, J. A., Volkamer, R., Wang, J., Worsnop, D. R., Zaveri, R. A., Zelenyuk, A., and Zhang, Q.: Recent advances in understanding secondary organic aerosol: Implications for global climate forcing, Rev. Geophys., 55, 509–559, https://doi.org/10.1002/2016RG000540, 2017.
Shrivastava, M. K., Lane, T. E., Donahue, N. M., Pandis, S. N., and Robinson, A. L.: Effects of gas particle partitioning and aging of primary emissions on urban and regional organic aerosol concentrations, J. Geophys. Res., 113, D18301, https://doi.org/10.1029/2007JD009735, 2008.
Silva, S. J., Arellano, A. F., and Worden, H. M.: Toward anthropogenic combustion emission constraints from space-based analysis of urban CO2/CO sensitivity, Geophys. Res. Lett., 40, 4971–4976, https://doi.org/10.1002/grl.50954, 2013.
Slusher, D. L., Huey, L. G., Tanner, D. J., Flocke, F. M., and Roberts, J. M.: A thermal dissociation–chemical ionization mass spectrometry (TD-CIMS) technique for the simultaneous measurement of peroxyacyl nitrates and dinitrogen pentoxide, J. Geophys. Res., 109, D19315, https://doi.org/10.1029/2004JD004670, 2004.
Stith, J. L., Ramanathan, V., Cooper, W. A., Roberts, G. C., DeMott, P. J., Carmichael, G., Hatch, C. D., Adhikary, B., Twohy, C. H., Rogers, D. C., Baumgardner, D., Prenni, A. J., Campos, T., Gao, R., Anderson, J., and Feng, Y.: An overview of aircraft observations from the Pacific Dust Experiment campaign, J. Geophys. Res., 114, D05207, https://doi.org/10.1029/2008JD010924, 2009.
Sueper, D.: ToF-AMS Data Analysis Software Webpage, available at: http://cires1.colorado.edu/jimenez-group/wiki/index.php/ToF-AMS_Analysis_Software (last access: 4 January 2017), 2018.
Talbot, R. W., Dibb, J. E., Lefer, B. L., Scheuer, E. M., Bradshaw, J. D., Sandholm, S. T., Smyth, S., Blake, D. R., Blake, N. J., Sachse, G. W., Collins, J. E., and Gregory, G. L.: Large-scale distributions of tropospheric nitric, formic, and acetic acids over the western Pacific basin during wintertime, J. Geophys. Res., 102, 28303–28313, 1997.
Tang, W., Arellano, A. F., DiGangi, J. P., Choi, Y., Diskin, G. S., Agustí-Panareda, A., Parrington, M., Massart, S., Gaubert, B., Lee, Y., Kim, D., Jung, J., Hong, J., Hong, J.-W., Kanaya, Y., Lee, M., Stauffer, R. M., Thompson, A. M., Flynn, J. H., and Woo, J.-H.: Evaluating high-resolution forecasts of atmospheric CO and CO2 from a global prediction system during KORUS-AQ field campaign, Atmos. Chem. Phys., 18, 11007–11030, https://doi.org/10.5194/acp-18-11007-2018, 2018.
Tkacik, D. S., Lambe, A. T., Jathar, S., Li, X., Presto, A. A., Zhao, Y., Blake, D., Meinardi, S., Jayne, J. T., Croteau, P. L., and Robinson, A. L.: Secondary Organic Aerosol Formation from in-Use Motor Vehicle Emissions Using a Potential Aerosol Mass Reactor, Environ. Sci. Technol., 48, 11235–11242, https://doi.org/10.1021/es502239v, 2014.
Tohjima, Y., Kubo, M., Minejima, C., Mukai, H., Tanimoto, H., Ganshin, A., Maksyutov, S., Katsumata, K., Machida, T., and Kita, K.: Temporal changes in the emissions of CH4 and CO from China estimated from CH4∕CO2 and CO∕CO2 correlations observed at Hateruma Island, Atmos. Chem. Phys., 14, 1663–1677, https://doi.org/10.5194/acp-14-1663-2014, 2014.
Tritscher, T., Dommen, J., DeCarlo, P. F., Gysel, M., Barmet, P. B., Praplan, A. P., Weingartner, E., Prévôt, A. S. H., Riipinen, I., Donahue, N. M., and Baltensperger, U.: Volatility and hygroscopicity of aging secondary organic aerosol in a smog chamber, Atmos. Chem. Phys., 11, 11477–11496, https://doi.org/10.5194/acp-11-11477-2011, 2011.
Tsimpidi, A. P., Karydis, V. A., Zavala, M., Lei, W., Molina, L., Ulbrich, I. M., Jimenez, J. L., and Pandis, S. N.: Evaluation of the volatility basis-set approach for the simulation of organic aerosol formation in the Mexico City metropolitan area, Atmos. Chem. Phys., 10, 525–546, https://doi.org/10.5194/acp-10-525-2010, 2010.
Tsimpidi, A. P., Karydis, V. A., Pandis, S. N., and Lelieveld, J.: Global-scale combustion sources of organic aerosols: sensitivity to formation and removal mechanisms, Atmos. Chem. Phys., 17, 7345–7364, https://doi.org/10.5194/acp-17-7345-2017, 2017.
Ulbrich, I. M., Canagaratna, M. R., Zhang, Q., Worsnop, D. R., and Jimenez, J. L.: Interpretation of organic components from Positive Matrix Factorization of aerosol mass spectrometric data, Atmos. Chem. Phys., 9, 2891–2918, https://doi.org/10.5194/acp-9-2891-2009, 2009.
UNDESA, P. D.: World Urbanization Prospects: The 2014 Revision, 2015.
Vay, S. A., Tyler, S. C., Choi, Y., Blake, D. R., Blake, N. J., Sachse, G. W., Diskin, G. S., and Singh, H. B.: Sources and transport of Δ14C in CO2 within the Mexico City Basin and vicinity, Atmos. Chem. Phys., 9, 4973–4985, https://doi.org/10.5194/acp-9-4973-2009, 2009.
Virkkula, A.: Correction of the Calibration of the 3-wavelength Particle Soot Absorption Photometer (3λ PSAP), Aerosol Sci. Technol., 44, 706–712, https://doi.org/10.1080/02786826.2010.482110, 2010.
Volkamer, R., Jimenez, J. L., San Martini, F., Dzepina, K., Zhang, Q., Salcedo, D., Molina, L. T., Worsnop, D. R., and Molina, M. J.: Secondary organic aerosol formation from anthropogenic air pollution: Rapid and higher than expected, Geophys. Res. Lett., 33, L17811, https://doi.org/10.1029/2006GL026899, 2006.
Wang, Y., Munger, J. W., Xu, S., McElroy, M. B., Hao, J., Nielsen, C. P., and Ma, H.: CO2 and its correlation with CO at a rural site near Beijing: implications for combustion efficiency in China, Atmos. Chem. Phys., 10, 8881–8897, https://doi.org/10.5194/acp-10-8881-2010, 2010.
Weibring, P., Richter, D., Walega, J. G., Rippe, L., and Fried, A.: Difference frequency generation spectrometer for simultaneous multispecies detection, Opt. Express, 18, 27670, https://doi.org/10.1364/OE.18.027670, 2010.
Weinheimer, A. J., Walega, J. G., Ridley, B. A., Gary, B. L., Blake, D. R., Blake, N. J., Rowland, F. S., Sachse, G. W., Anderson, B. E., and Collins, J. E.: Meridional distributions of NOx, NOy, and other species in the lower stratosphere and upper troposphere during AASE II, Geophys. Res. Lett., 21, 2583–2586, https://doi.org/10.1029/94GL01897, 1994.
WHO: Ambient air pollution: A global assessment of exposure and burden of disease, World Health Organization, Geneva, Switzerland, 2016.
Wisthaler, A., Hansel, A., Dickerson, R. R., and Crutzen, P. J.: Organic trace gas measurements by PTR-MS during INDOEX 1999, J. Geophys. Res., 107, 8024, https://doi.org/10.1029/2001JD000576, 2002.
Wood, E. C., Canagaratna, M. R., Herndon, S. C., Onasch, T. B., Kolb, C. E., Worsnop, D. R., Kroll, J. H., Knighton, W. B., Seila, R., Zavala, M., Molina, L. T., DeCarlo, P. F., Jimenez, J. L., Weinheimer, A. J., Knapp, D. J., Jobson, B. T., Stutz, J., Kuster, W. C., and Williams, E. J.: Investigation of the correlation between odd oxygen and secondary organic aerosol in Mexico City and Houston, Atmos. Chem. Phys., 10, 8947–8968, https://doi.org/10.5194/acp-10-8947-2010, 2010.
Woody, M. C., Baker, K. R., Hayes, P. L., Jimenez, J. L., Koo, B., and Pye, H. O. T.: Understanding sources of organic aerosol during CalNex-2010 using the CMAQ-VBS, Atmos. Chem. Phys., 16, 4081–4100, https://doi.org/10.5194/acp-16-4081-2016, 2016.
Wooldridge, P. J., Perring, A. E., Bertram, T. H., Flocke, F. M., Roberts, J. M., Singh, H. B., Huey, L. G., Thornton, J. A., Wolfe, G. M., Murphy, J. G., Fry, J. L., Rollins, A. W., LaFranchi, B. W., and Cohen, R. C.: Total Peroxy Nitrates (SPNs) in the atmosphere: the Thermal Dissociation-Laser Induced Fluorescence (TD-LIF) technique and comparisons to speciated PAN measurements, Atmos. Meas. Tech., 3, 593–607, https://doi.org/10.5194/amt-3-593-2010, 2010.
Wu, W., Zhao, B., Wang, S., and Hao, J.: Ozone and secondary organic aerosol formation potential from anthropogenic volatile organic compounds emissions in China, J. Environ. Sci., 53, 224–237, https://doi.org/10.1016/j.jes.2016.03.025, 2016.
Xu, W., Croteau, P., Williams, L., Canagaratna, M., Onasch, T., Cross, E., Zhang, X., Robinson, W., Worsnop, D., and Jayne, J.: Laboratory characterization of an aerosol chemical speciation monitor with PM2.5 measurement capability, Aerosol Sci. Technol., 51, 69–83, https://doi.org/10.1080/02786826.2016.1241859, 2017.
Zhang, Q., Jimenez, J. L., Canagaratna, M. R., Allan, J. D., Coe, H., Ulbrich, I., Alfarra, M. R., Takami, A., Middlebrook, A. M., Sun, Y. L., Dzepina, K., Dunlea, E., Docherty, K., DeCarlo, P. F., Salcedo, D., Onasch, T., Jayne, J. T., Miyoshi, T., Shimono, A., Hatakeyama, S., Takegawa, N., Kondo, Y., Schneider, J., Drewnick, F., Borrmann, S., Weimer, S., Demerjian, K., Williams, P., Bower, K., Bahreini, R., Cottrell, L., Griffin, R. J., Rautiainen, J., Sun, J. Y., Zhang, Y. M., and Worsnop, D. R.: Ubiquity and dominance of oxygenated species in organic aerosols in anthropogenically-influenced Northern Hemisphere midlatitudes, Geophys. Res. Lett., 34, L13801, https://doi.org/10.1029/2007gl029979, 2007.
Zhang, Q. J., Beekmann, M., Freney, E., Sellegri, K., Pichon, J. M., Schwarzenboeck, A., Colomb, A., Bourrianne, T., Michoud, V., and Borbon, A.: Formation of secondary organic aerosol in the Paris pollution plume and its impact on surrounding regions, Atmos. Chem. Phys., 15, 13973–13992, https://doi.org/10.5194/acp-15-13973-2015, 2015.
Zhang, X., Smith, K. A., Worsnop, D. R., Jimenez, J., Jayne, J. T., and Kolb, C. E.: A Numerical Characterization of Particle Beam Collimation by an Aerodynamic Lens-Nozzle System: Part I. An Individual Lens or Nozzle, Aerosol Sci. Technol., 36, 617–631, https://doi.org/10.1080/02786820252883856, 2002.
Zhang, X., Smith, K. A., Worsnop, D. R., Jimenez, J. L., Jayne, J. T., Kolb, C. E., Morris, J., and Davidovits, P.: Numerical Characterization of Particle Beam Collimation: Part II Integrated Aerodynamic-Lens–Nozzle System, Aerosol Sci. Technol., 38, 619–638, https://doi.org/10.1080/02786820490479833, 2004.
Zhang, X., Cappa, C. D., Jathar, S. H., McVay, R. C., Ensberg, J. J., Kleeman, M. J., Seinfeld, J. H., and Cappa, C. D.: Influence of vapor wall loss in laboratory chambers on yields of secondary organic aerosol., P. Natl. Acad. Sci. USA, 111, 1–6, https://doi.org/10.1073/pnas.1404727111, 2014.
Zhao, Y., Hennigan, C. J., May, A. A., Tkacik, D. S., de Gouw, J. A., Gilman, J. B., Kuster, W. C., Borbon, A., and Robinson, A. L.: Intermediate-volatility organic compounds: a large source of secondary organic aerosol, Environ. Sci. Technol., 48, 13743–13750, https://doi.org/10.1021/es5035188, 2014.
Zhao, Y., Nguyen, N. T., Presto, A. A., Hennigan, C. J., May, A. A., and Robinson, A. L.: Intermediate Volatility Organic Compound Emissions from On-Road Gasoline Vehicles and Small Off-Road Gasoline Engines, Environ. Sci. Technol., 50, 4554–4563, https://doi.org/10.1021/acs.est.5b06247, 2016.
Ziemba, L. D., Lee Thornhill, K., Ferrare, R., Barrick, J., Beyersdorf, A. J., Chen, G., Crumeyrolle, S. N., Hair, J., Hostetler, C., Hudgins, C., Obland, M., Rogers, R., Scarino, A. J., Winstead, E. L., and Anderson, B. E.: Airborne observations of aerosol extinction by in situ and remote-sensing techniques: Evaluation of particle hygroscopicity, Geophys. Res. Lett., 40, 417–422, https://doi.org/10.1029/2012GL054428, 2013.