the Creative Commons Attribution 4.0 License.
the Creative Commons Attribution 4.0 License.
 | 14 Dec 2018
Radiative effect and climate impacts of brown carbon with the Community Atmosphere Model (CAM5)
Hunter Brown
Xiaohong Liu
Yiquan Jiang
Mingxuan Wu
Zheng Lu
Chenglai Wu
Shane Murphy
Rudra Pokhrel
A recent development in the representation of aerosols in climate models is the realization that some components of organic aerosol (OA), emitted from biomass and biofuel burning, can have a significant contribution to shortwave radiation absorption in the atmosphere. The absorbing fraction of OA is referred to as brown carbon (BrC). This study introduces one of the first implementations of BrC into the Community Atmosphere Model version 5 (CAM5), using a parameterization for BrC absorptivity described in Saleh et al. (2014). Nine-year experiments are run (2003–2011) with prescribed emissions and sea surface temperatures to analyze the effect of BrC in the atmosphere. Model validation is conducted via model comparison to single-scatter albedo and aerosol optical depth from the Aerosol Robotic Network (AERONET). This comparison reveals a model underestimation of single scattering albedo (SSA) in biomass burning regions for both default and BrC model runs, while a comparison between AERONET and the model absorption Ångström exponent shows a marked improvement with BrC implementation. Global annual average radiative effects are calculated due to aerosol–radiation interaction (REari; 0.13±0.01 W m−2) and aerosol–cloud interaction (REaci; 0.01±0.04 W m−2). REari is similar to other studies' estimations of BrC direct radiative effect, while REaci indicates a global reduction in low clouds due to the BrC semi-direct effect. The mechanisms for these physical changes are investigated and found to correspond with changes in global circulation patterns. Comparisons of BrC implementation approaches find that this implementation predicts a lower BrC REari in the Arctic regions than previous studies with CAM5. Implementation of BrC bleaching effect shows a significant reduction in REari (0.06±0.008 W m−2). Also, variations in OA density can lead to differences in REari and REaci, indicating the importance of specifying this property when estimating the BrC radiative effects and when comparing similar studies.
- Article
(13621 KB) - Full-text XML
-
Supplement
(3938 KB) - BibTeX
- EndNote


One of the key areas of uncertainty in climate models is their representation of aerosols (Anderson et al., 2003; Myhre et al., 2013). Aerosols tend to absorb (scatter) incoming solar radiation, which leads to warming (cooling) of the atmosphere. The directly emitted aerosol species (i.e., primary aerosols) are black carbon (BC), mineral dust, sea salt, and primary organic aerosol (POA, or primary organic matter, POM) – the latter of which broadly defines carbon-containing compounds that contain hydrogen and possibly oxygen (Bond et al., 2013). Aerosols that are products of chemical reactions (i.e., secondary aerosols) include sulfate, nitrate, ammonium, and secondary organic aerosols (SOA) (Kanakidou et al., 2005; Boucher et al., 2013). There are large uncertainties in aerosol observation and modeling which include the formation of SOA (Farina et al., 2010), aerosol and precursor gas emissions, aerosol aging, wet removal (X. Liu et al., 2012), and aerosol optical properties. In modeling studies, POA and SOA (more broadly organic aerosol, OA) are considered to be strongly scattering, but recent studies have shown that components of organic aerosols, known as brown carbon (BrC), can have strong absorption of UV and short visible light in the atmosphere. This absorption coupled with its large burden in the atmosphere (>3 times that of BC; Feng et al., 2013) indicates that BrC, in addition to dust and BC, is a significant absorber in the atmosphere.
While BC light absorption is assumed to vary weakly with changing wavelengths (Bergstrom et al., 2002), the absorption of BrC can be identified by its spectrally dependent absorption at shorter wavelengths (Kirchstetter et al., 2004). Early studies noted the presence of BrC in smoldering combustion (Patterson and McMahon, 1984), certain nitrated and aromatic aerosols (Jacobson, 1999), and low temperature, domestic coal combustion (Bond, 2001). Many studies have analyzed BrC in biomass burning laboratory experiments (Chen and Bond, 2010; Saleh et al., 2014; Pokhrel et al., 2016, 2017), field studies in urban environments with biomass burning and urban aerosol sources (Kirchstetter et al., 2004; S. Liu et al., 2015), and aircraft measurements at different levels in the troposphere (J. Liu et al., 2014, 2015). In addition to primary BrC production, secondary BrC can be generated in aqueous-phase chemical reactions in clouds and from the photooxidation of volatile organic compounds (Limbeck et al., 2003; Ervens et al., 2011; Nakayama et al., 2013). There is also evidence that emissions from biomass burning (BB) and biofuels (BFs) have a stronger BrC signal than emissions from diesel (Kirchstetter et al., 2004; Saleh et al., 2014). This may be due to the different burning processes of the two fuels, whereby the high-pressure and high-heat scenario of diesel combustion results in a more efficient breakdown of the fuel than the lower temperature, lower pressure burning of BB and BFs; or it may be due to the different fuel types, whereby diesel consists of a mixture of smaller hydrocarbons and biomass consists of large polymers (Saleh et al., 2014).
While BrC production may change from fuel to fuel, its absorption strength can change even within a single fuel's emissions. The absorbing nature of BrC is correlated with the BC-to-OA ratio in BB emissions (Saleh et al., 2014; Lu et al., 2015), which corresponds to the burning conditions of the emission source. These studies show that higher BC-to-OA ratios correspond to stronger absorbing BrC, with higher BC-to-OA ratios indicating faster burning, hotter fires (e.g., savannah fires) and lower BC-to-OA ratios indicating slower burning, smoldering fires (e.g., South American forest fires, boreal fires) (Akagi et al., 2011).
An added complexity in the study of aerosol radiative forcing (RF) is how to represent an aerosol's mixing state. Emitted primary aerosols that are often externally mixed (each particle consisting of one species) may become internally mixed aerosols (mixtures of species in each particle) as higher volatility compounds condense on and coat the surface of the primary aerosols within hours after emission (Reid et al., 1998). In three-dimensional global and regional aerosol models, this internal mixture can be treated as a well-mixed aerosol, whereby the optical properties of the aerosol are treated as a volume-weighted mean of the optical properties of each internally mixed species (Ghan and Zaveri, 2007; X. Liu et al., 2016). Another treatment assumes a core-shell organization of aged aerosols whereby the primary aerosol core is coated by a volume mean internal mixture of higher volatility, stronger scattering secondary aerosols (Jacobson, 2001; Feng et al., 2013; Saleh et al., 2015). This can act to increase absorption given an absorbing center (e.g., BC) by refracting intercepted light into the primary core (Bond et al., 2006), also known as the lensing effect.
Lastly, BrC can undergo photochemical aging when oxidized by hydroxyl radicals (OH) and when exposed to incoming solar radiation (Zhong and Jang, 2011, 2014; Lee et al., 2014; Forrister et al., 2015; Zhao et al., 2015). This has the effect of an overall decrease in the absorption of BrC, with a half-life predicted at around 9–15 h by in situ aircraft observations (Forrister et al., 2015), and 3 min to 5 h from laboratory experiments (Zhong and Jang, 2011; Lee et al., 2014; Zhao et al., 2015). Studies of BrC during the Green Ocean Amazon campaign during the Brazilian BB season observed a photochemical lifetime for BrC in sunlight of ∼1 day (Wang et al., 2016). The initial aging of BrC can result in photo-enhancement or bleaching depending on the chemical composition of the aerosol, but with further photochemical aging the BrC absorption will decrease (Zhong and Jang, 2014; Zhao et al., 2015). This reduction is accelerated by higher relative humidities and is decelerated by the presence of nitrogen oxides (NOx), the latter of which are a major emission from fossil fuel combustion and may play a role in the formation of absorbing SOA in smoke (Zhong and Jang, 2014).
The radiative effect of BrC has been estimated in a number of modeling studies using global chemical transport models combined with radiative transfer models (Feng et al., 2013; Lin et al., 2014; X. Wang et al., 2014, 2018; Saleh et al., 2015; Jo et al., 2016). In Feng et al. (2013), global mean absorption aerosol optical depth (AAOD) increases with two different BrC absorption assumptions: moderately (Chen and Bond, 2010) and strongly (Kirchstetter et al., 2004) absorbing, with 66 % of BB and BF organic carbon emissions assumed to be BrC. In the case of strongly absorbing BrC, AAOD increases by 18 % at 550 nm and 56 % at 350 nm. This study also shows that while BC contributes about 72 % of the global atmospheric absorption, the strongly absorbing BrC could have a comparable effect (>20–50 %) in regions dominated by biomass and biofuel burning, corresponding to a direct RF of about +0.11 W m−2 due to strongly absorbing BrC (+0.04 W m−2 for moderately absorbing BrC). A similar study by Lin et al. (2014) assumes that all SOA and POA is BrC, showing even larger contributions by BrC to aerosol absorption: BrC RF of +0.22 to +0.57 W m−2 for the same moderate and strongly absorbing assumptions, respectively. These studies calculated RF by looking at the difference between top of the atmosphere (TOA) shortwave flux, with and without BrC, over the time period spanning the pre-industrial period to the present day. The higher RF in Lin et al. (2014) is likely due to the Lin et al. (2014) assumption of externally mixed aerosols as well as their consideration of SOA as absorbing (Saleh et al., 2015). In the modeling study by Saleh et al. (2015), BrC is incorporated by parameterizing the OA refractive index (RI) based on the emitted BC-to-OA ratio from fuels representative of important BB regions (boreal forests, grasslands, and croplands) (Saleh et al., 2014). This allows for spatial variation in BrC absorption as opposed to the globally constant moderate–strong absorption in Feng et al. (2013) and Lin et al. (2014). Use of this parameterization makes specifying the BrC fraction of OA unnecessary, as the BrC is dependent on the fuel source. Saleh et al. (2015) calculated the radiative effect due to aerosol–radiation interaction (REari), which represents the instantaneous effect of BrC on the Earth's energy balance and is calculated by comparing the energy balance at the TOA with and without BrC (Heald et al., 2014). The BrC REari calculated in Saleh et al. (2015) varied between +0.12 and +0.22 W m−2, with the variation attributed to core-shell and externally mixed assumptions, respectively. Recent work by Wang et al. (2018) included the Saleh et al. (2014) parameterization in addition to a BrC bleaching parameterization that ages BrC to 25 % of its original absorption over ∼1 day. This lower threshold reflects the observation that BrC does not fully bleach (Wang et al., 2016; Forrister et al., 2015). Including bleaching in the model resulted in a global REari of 0.05 W m−2, significantly reducing the BrC radiative effect.
All these model representations show positive radiative effects in the atmosphere. However, by using chemical transport models coupled with radiative transfer models, these past studies neglect important BrC effects on clouds and surface albedo, as well as the more complex atmospheric dynamics found in Earth system models (Lin et al., 2014). Furthermore, only one of these studies includes the effect of BrC optical aging, which can greatly reduce the climate impact of BrC in these models. In this study, we incorporate BB and BF BrC into the Community Earth System Model (CESM) and conduct an analysis of the radiative effect attributed to BrC over the time period 2003–2011. To simulate BrC we use the Saleh et al. (2014) parameterization to modify the BB and BF POA imaginary parts of the RI based on the BC-to-OA ratios in primary BB and BF emissions. The impacts of BrC on clouds through a semi-direct effect are analyzed. We also implement a BrC bleaching parameter in the model similar to Wang et al. (2018) to analyze its effect on the BrC direct and semi-direct effects. It is important to mention that this study does not include absorption by BB SOA (Lin et al., 2014; Saleh et al., 2015) or absorbing aromatic SOA (X. Wang et al., 2014, 2018; Jo et al., 2016). This is neglected due to the lack of aromatic SOA speciation in the model. As a result, the use of “OA” in regards to this study refers to primary organic aerosol. The paper is organized as follows: Sect. 2 describes the model and experimental setup as well as the modifications to the model; Sect. 3 introduces the model results of this study as a validation with the Aerosol Robotic Network (AERONET), radiative and climate effects due to BrC, and the sensitivity of the climate to BrC bleaching. Lastly, Sect. 4 discusses the results and presents conclusions from this study.
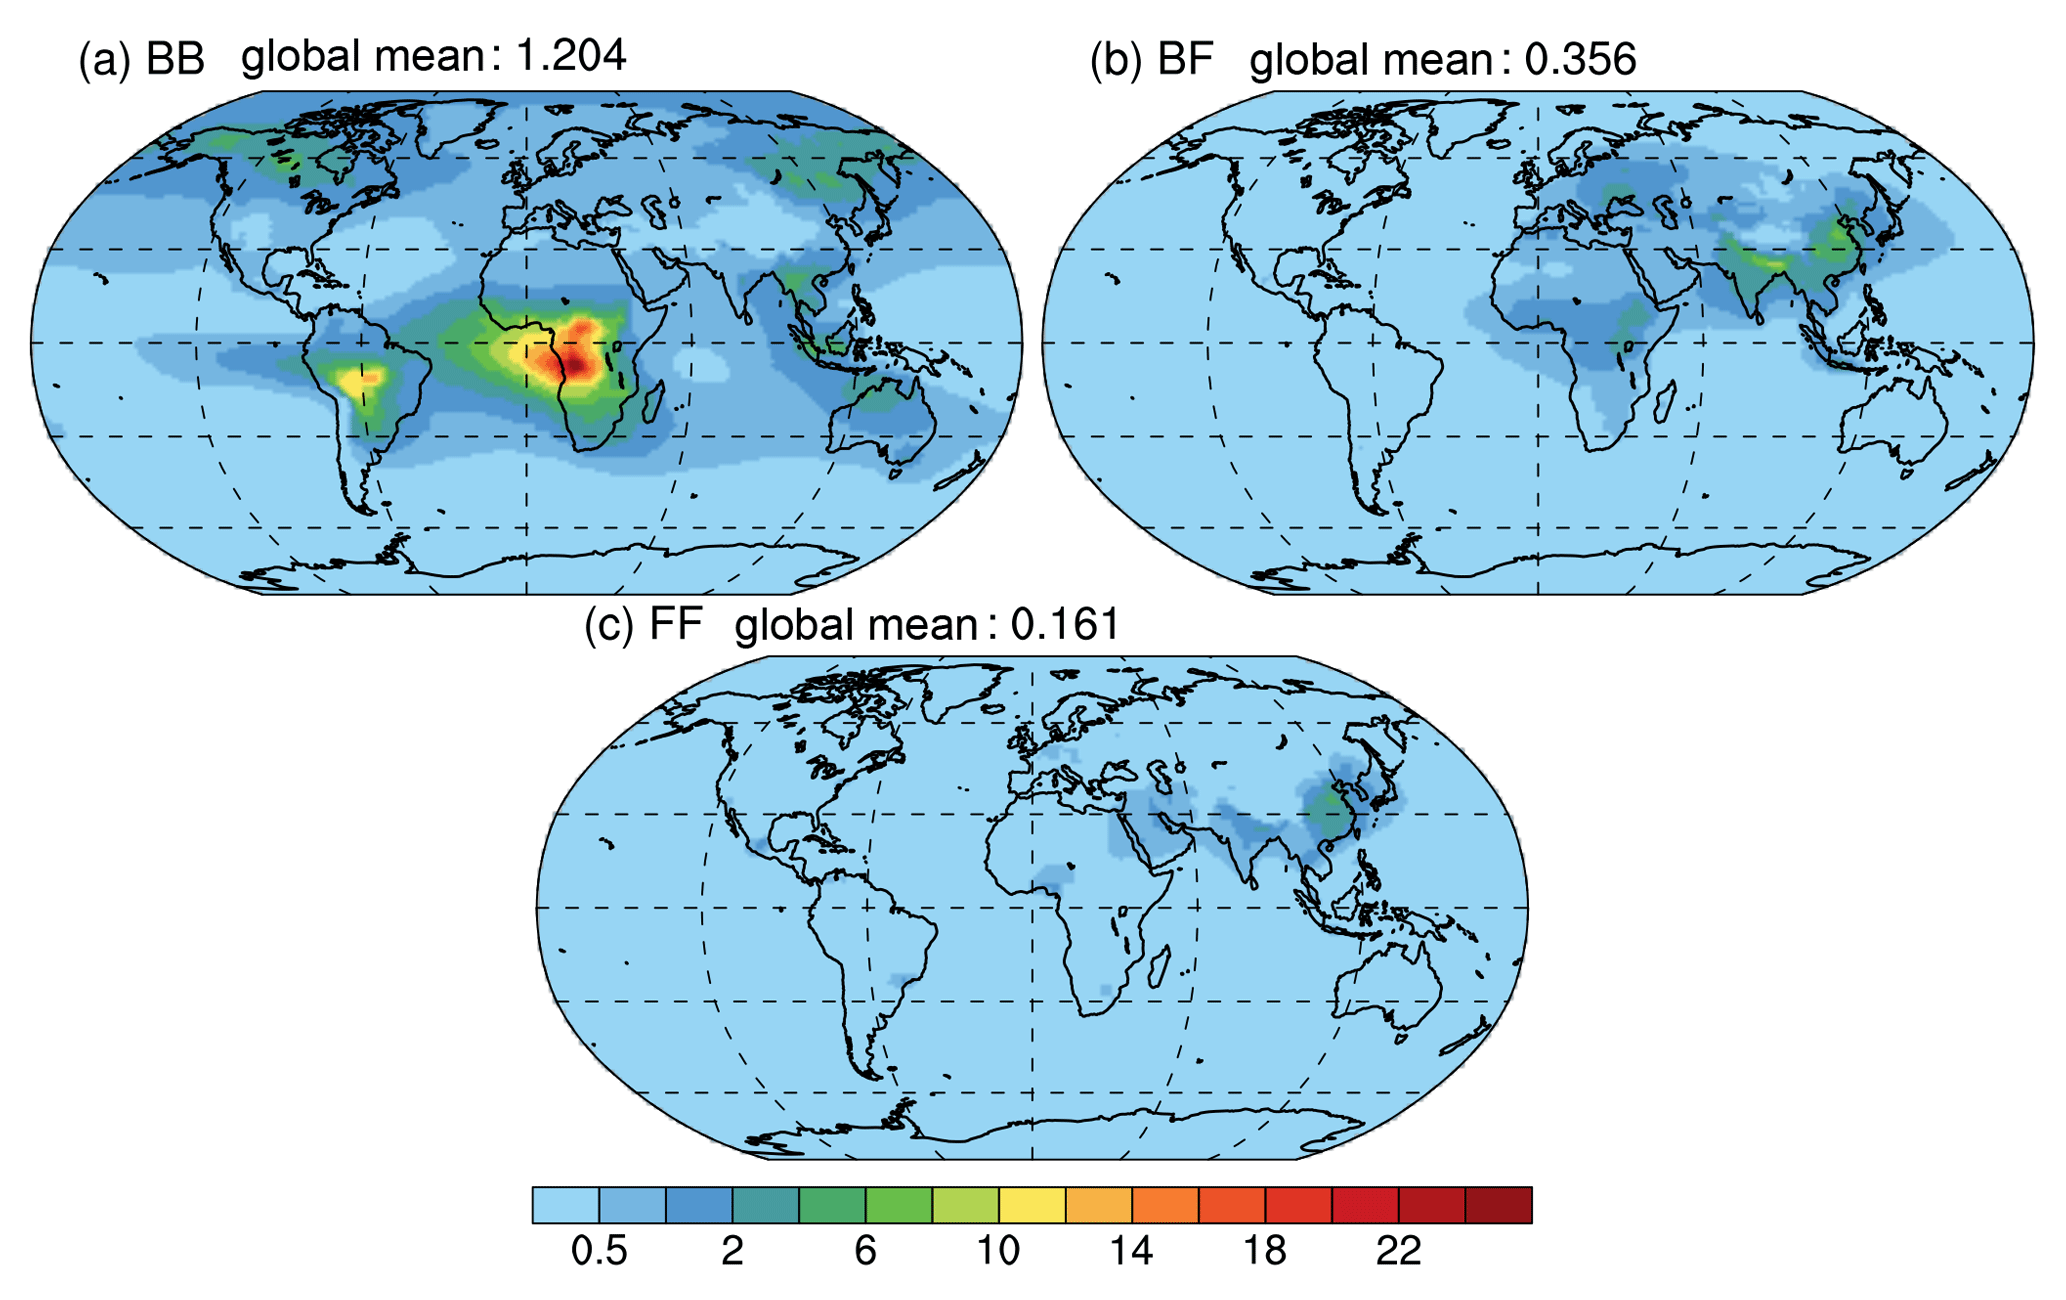
Figure 1The column burdens of POM from (a) biomass burning (BB), (b) biofuel (BF), and (c) fossil fuel emissions. Panels (a) and (b) represent BrC in the BRC, BRC_CNST, and BRC_BL model runs. The units are in mg m−2 and the values are a 9-year average from 2003 to 2011.
2.1 Model description
This study uses the Community Earth System Model (CESM), with the coupled Community Atmosphere Model version 5.4 (CAM5.4) (Hannay and Neale, 2015) and Community Land Model version 4 (CLM4) (Oleson et al., 2010). In Jiang et al. (2016) a similar model setup is used with the exception of its use of CAM5.3. CAM5.3 contains physics parameterization updates from the previous CAM versions, including a two-moment stratiform cloud microphysics scheme to predict mass and number mixing ratios of cloud liquid and cloud ice (Morrison and Gettelman, 2008), and a three-mode version of the Modal Aerosol Module (MAM3) to predict mass and number mixing ratios of aerosol components (X. Liu et al., 2012). Compared to the CAM5.3 version, some notable additions in the CAM5.4 version include a new prognostic precipitation scheme (Gettelman et al., 2015), new ice nucleation treatments (Y. Wang et al., 2014), and improved dust optical properties and emissions (Albani et al., 2014). This model also uses the four-mode version of MAM (MAM4) (X. Liu et al., 2016). MAM4 consists of the following four lognormal modes (shown with their median size ranges and standard deviations): Aitken (0.015–0.053 µm, σ=1.8), accumulation (0.058–0.27 µm, σ=1.6), coarse (0.80–3.65 µm, σ=1.8), and primary carbon (0.039–0.13 µm, σ=1.6). The median sizes of aerosol modes are changed due to the microphysical processes (e.g., condensation and coagulation) while standard deviations for each mode are fixed. The OA from accumulation and primary carbon modes, which is used to represent BrC depending on its source (mentioned later), has a density in the model of 1 g cm−3.
MAM4 differs from MAM3 in its inclusion of the primary carbon mode. This mode, which consists of the species BC and primary organic matter (POM), is emitted from the incomplete combustion of fossil and biomass fuels. In MAM4, this mode is transferred to the accumulation mode once it has aged. The primary carbon mode ages by acting as a nucleus for the condensation of sulfuric acid (H2SO4) vapor, ammonia (NH3), and semi-volatile organics, as well as through collision and coalescence with Aitken and accumulation modes. This acts to both increase the size of the aerosol as well as increase the hygroscopicity of hydrophobic aerosols such as BC. The optical calculations in the model consider these aged particles to be internal mixtures of aerosols within the mode, and the RI of the accumulation mode, as well as the other three modes, is calculated as a volume-weighted mean of the refractive indices of all of the aerosols' components within the mode (X. Liu et al., 2012, 2016).
2.2 Model modifications
2.2.1 Source separation
Code modifications were made to allow implementation of the new POM RI for BB and BF emissions. This involved separating the emissions of BC and POM into three sources: biomass burning (BB), fossil fuels (FFs), and biofuels (BFs). In the model, BB corresponds to the Global Fire Emissions Database version 3.1 (GFED 3.1; Giglio et al., 2013) fire emissions; FFs correspond to energy, industry, ship, and transport emissions from IPCC AR5; and BF corresponds to agricultural, domestic, and waste management emissions from IPCC AR5. This modification was based on a similar separation of emissions implemented in CAM5.3 (Jiang et al., 2016). Figure 1 shows the contributing regions and burdens of POM from BB, BF, and FF sources. The GFED 3.1 emissions were used in this study to allow for direct comparison between this study and Jiang et al. (2016). The more recent GFED 4 emission dataset shows an 11 % global increase in fire emissions from GFED 3.1 (Werf et al., 2017), which may result in a slightly stronger climate impact from biomass burning aerosols than that shown in this study.
2.2.2 BrC refractive index
Another modification involved the inclusion of a parameterization for BrC in CAM5.4. The parameterization is described in Saleh et al. (2014) and determines the imaginary refractive index (RI) of POM based on the BC-to-OA ratio of the BB and BF emissions. A later experiment by Lu et al. (2015) derives a similar parameterization based on many different BB datasets, including that of Saleh et al. (2014). The Saleh et al. (2014) RI is calculated based on the following equations:
where Eq. (1) describes the real (1.7) and imaginary (kOA) parts of the RI. Equation (2) represents the imaginary RI at 550 nm (kOA,550), and Eq. (3) represents the wavelength dependence of kOA(w). The parameterization describes decreasing wavelength dependence and increasing BrC absorption as the emission BC-to-OA ratio increases. This relationship was derived for the wavelengths of 370–950 nm and a laboratory-derived BC-to-OA ratio range of 0.01–0.5. In the model, the parameterization is applied over this BC-to-OA range and for the CAM waveband midpoints of 304–1010 nm (wavebands 8–12 in the CAM RRTMG_SW model; Neale et al., 2012). Uncertainty in kOA from this parameterization is associated with the lab measurements of the particle mass, the range in assumed complex refractive index for BC, the mixing state of BC and OA, the measured real part of the OA refractive index, and the measured absorption coefficients used in optical closure calculations (Saleh et al., 2014).
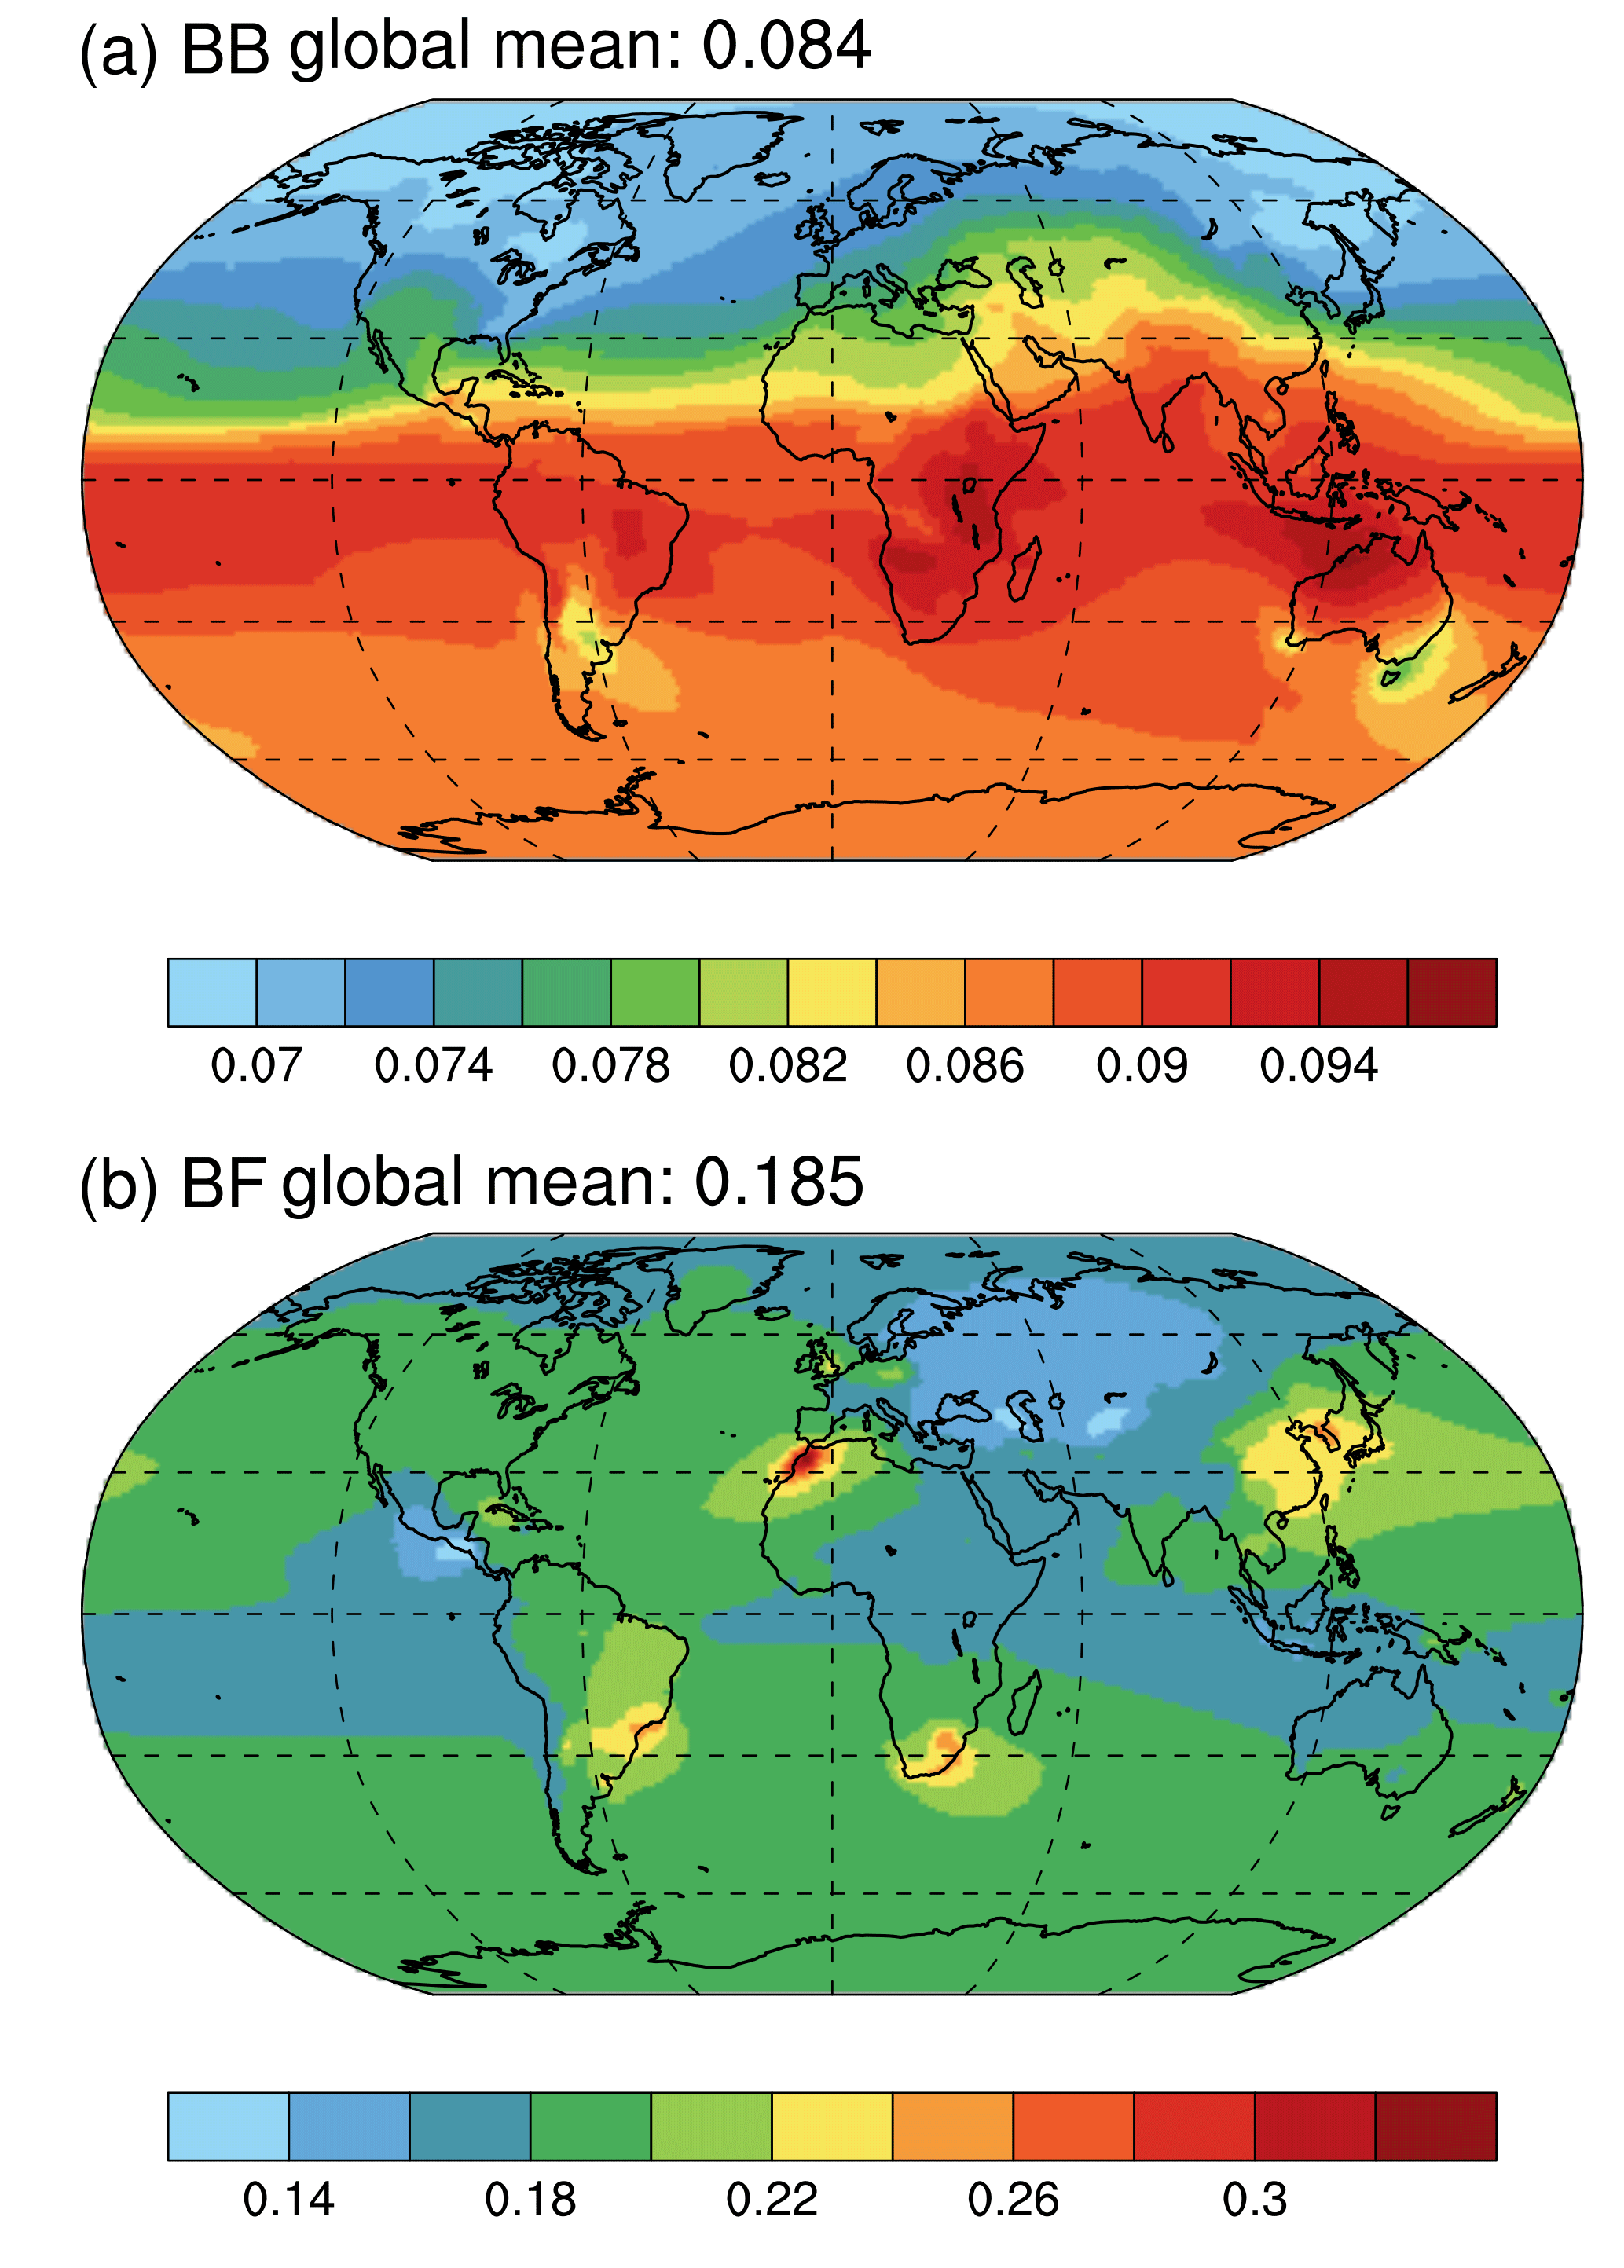
Figure 2The ratio of column averaged burden of black carbon to POM of (a) biomass burning (BB) and (b) biofuel burning (BF). Note the different scales.
The parameterization in CAM only changes the RI of POM (emissions of POM and density (1 g cm−3) remain unchanged) and was applied in the part of CAM5.4 that calculates modal aerosol optical properties using a parameterization described in Ghan and Zaveri (2007). This parameterization calculates the specific scattering, specific absorption, and asymmetry parameter of aerosols in a mode as a general internal mixture of components, bilinearly interpreting these optical properties from offline Mie calculations. These calculations are a function of the wet surface mode radius as well as the wet refractive index of each mode. The code modification to implement a changing RI for BrC is implemented before the bilinear interpretation. When the model calls the RI for BB or BF POM from an input physical properties (phys_prop) file, the parameterization changes the imaginary part of the RI at the wavelengths 304–1010 nm based on the calculated BC-to-OA ratio at each time-step for each grid point and level. The BC-to-OA ratio is calculated based on each source's ratio (BB or BF) to preserve the initial emission ratios and minimize error due to inter-source mixing (see Fig. 2 for BB and BF BC-to-OA ratios). As shown in Fig. 2, the BB BC-to-OA ratio is uniformly distributed in the range of 0.07 to 0.095 with a global mean of 0.084. The BF BC-to-OA ratio is much higher, varying in the range of 0.1–0.3 with a global mean of 0.185.
A modified BrC experiment was run with the same Saleh et al. (2014) RI parameterization, but the BC-to-OA ratio was set to 0.08 (approximate global column average biomass burning BC-to-OA) at each time step, grid point, and level (see Table 1). This results in a constant imaginary RI for BB and BF POM.
A few assumptions in this model simulation introduce uncertainty in the representation of BrC in CESM. One of those assumptions is neglecting absorption by BB SOA (Lin et al., 2014; Saleh et al., 2015) or absorbing aromatic SOA (X. Wang et al., 2014, 2018; Jo et al., 2016), which is neglected due to the lack of SOA speciation in the model. This assumption, in conjunction with the use of GFED 3.1 instead of GFED 4, may act to underestimate the climate effect due to BrC. Another assumption is the model use of a volume mixing assumption, which may act to overestimate aerosol light absorption (Jacobson, 2000; Adachi et al., 2010). We also assume that the BC-to-OA ratio in transported smoke is similar to BC-to-OA from the source region, allowing for the use of a BC-to-OA ratio at each grid cell at every time step to calculate kOA in each grid cell. The uncertainty in kOA associated with this assumption is small (<10 % for BB emissions assuming transport from the Equator to the Arctic (not shown)) and is assumed to be negligible.
Another source of uncertainty when considering an absorbing aerosol in the model is the aerosol's vertical distribution. CAM5.4 uses six vertical injection heights for wildfire emissions described in Detener et al. (2006): 0–100 m, 500–1000 m, 1–2 km, 2–3 km, and 3–6 km. These fire emission heights depend on the geographic location of the fire and the vegetation type derived from GFED, with the highest plumes corresponding to boreal fires. If BrC is lofted over a more reflective surface such as a cloud, its shortwave radiative forcing will be more positive than if it stays below the cloud or remains lower in the atmosphere. A counterbalancing effect is a more negative longwave forcing at higher levels in the atmosphere (Penner et al., 2003). The vertically sensitive semi-direct effects of BrC (i.e., changes in atmospheric stability and cloud cover due to atmospheric heating by BrC) are discussed in more detail in Sect. 3.2. Comparisons between the total OA (POA+SOA) vertical distribution and aircraft observations in Shrivastava et al. (2015) show that the standard CAM5 aerosol treatment largely underestimates Arctic biomass OA, possibly due to the model neglecting important SOA contributions from biomass burning. This could lead to an underestimation of BrC radiative effects due to lower BrC concentrations at all levels of the model. Vertical profiles of aerosols, cloud fraction, and heating rates in the model are shown over six regions with a strong BrC radiative effect due to aerosol–radiation interaction (Fig. S2 in the Supplement).
2.2.3 BrC bleaching parameterization
The BrC bleaching parameterization is based on that applied by Wang et al. (2018). The half-life of BrC is assumed to be about 1 day, with the aging of BrC dependent on the atmospheric concentration of OH ([OH], molec cm−3). Equation (4) describes this aging process in the model:
where and kOA,t are the imaginary part of the RI of BrC at times t and t+Δt, and 5×10⁵ represents the typical daytime [OH] (Wang et al., 2016). This parameterization was designed to match observed lifetimes of BrC in the two field campaigns SEAC4RS (Studies of Emissions and Atmospheric Composition, Clouds and Climate Coupling by Regional Surveys; Forrister et al., 2015) and GoAmazon2014/15 (Wang et al., 2016). While the parameterization depends on OH concentration in the atmosphere, by matching the BrC lifetime to observations, the parameterization also includes photochemical oxidation and other bleaching effects that may have been active in the observed smoke plumes. This is true of the regions in which the observations were taken, but may not hold true for global sites or seasons with lower insolation. Uncertainty in this parameterization is associated with the low availability of observational data, and could be improved with more field measurements of BB smoke aging at different latitudes.
2.3 Experimental design
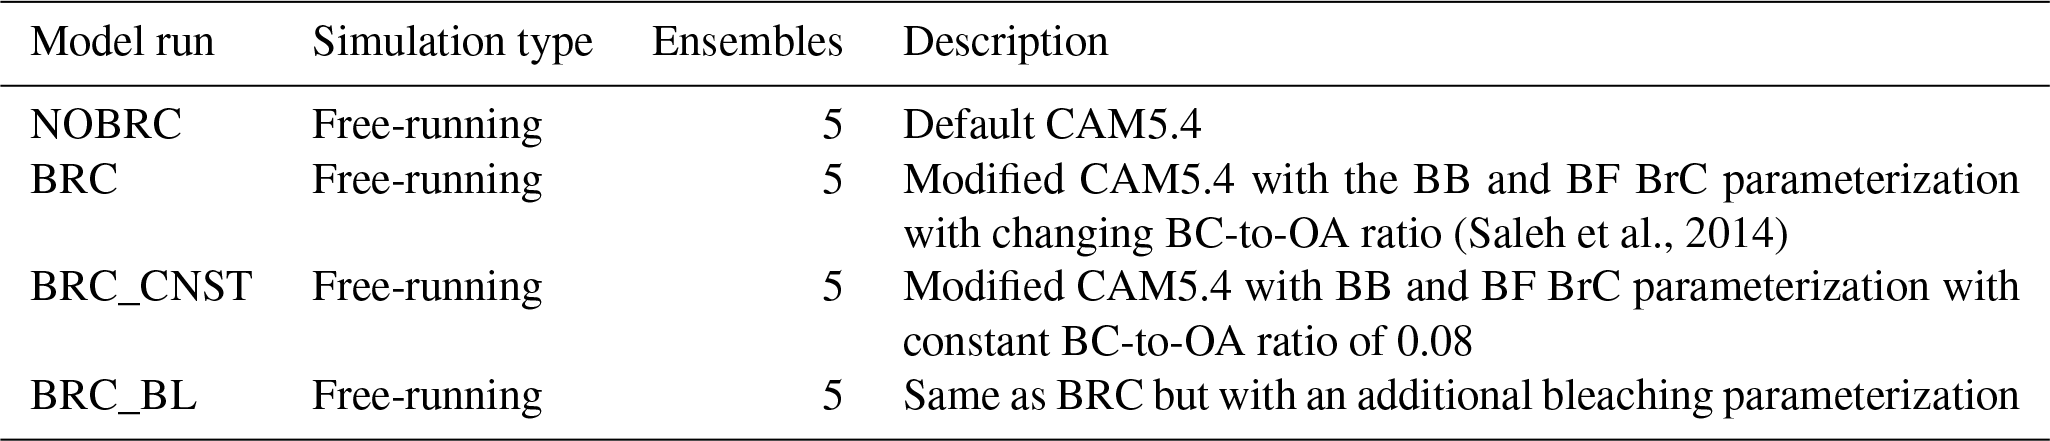
The model was run at a horizontal resolution of 0.9∘ latitude by 1.25∘ longitude with 30 vertical levels. The simulation period covers 9 years from 2003 to 2011 with prescribed monthly sea surface temperature and sea ice. The emissions consist of daily BC, POM, and sulfur dioxide (SO2) emissions from GFED 3.1 (Giglio et al., 2013), vertical distribution of fire emissions based on the AeroCom protocol (Detener et al., 2006), and anthropogenic aerosol and precursor gas emissions from IPCC AR5 (Lamarque et al., 2010). The model runs consist of a spin-up year (2003), followed by a 9-year run (2003–2011) using a concatenated version of the emissions files for each species and emission type. Four experiments, with five ensemble members each, were run following the aforementioned setup. Ensemble members are varied by applying different initial temperature perturbations of the order 10−14. “NOBRC” is the control experiment with the default model configuration, while “BRC” includes a parameterization for BrC that takes into account a varying RI that is dependent on the BC-to-OA ratio. “BRC_CNST” includes a parameterization for BrC that assumes a constant imaginary RI based on the approximate global average BC-to-OA ratio of 0.08, derived from biomass burning emissions. “BRC_BL” includes the BrC parameterization as well as a BrC bleaching parameterization. Table 1 describes the different model runs.
Table 1Description of the model simulations used in this study.
2.4 Radiative effect calculation
The direct radiative effect and indirect effect of BrC are calculated using the method recommended in Ghan (2013). This method breaks the total radiative effect into changes due to aerosol–radiation interaction (REari), aerosol–cloud interaction (REaci), and surface-albedo changes (REsac) (note that REsac are not analyzed in this paper because the model does not take into account snow albedo reduction via BrC deposition on snow).
In Eq. (5), Δ represents the difference between the model runs with and the model runs without BrC, in this case represented by BRC (BRC_CNST, BRC_BL) – NOBRC. The differences in each of the parentheses are conducted for each model run represented in Δ. The variable F represents all-sky, top of the atmosphere (TOA) radiative flux (longwave+shortwave); Fclean is the same but without aerosols, calculated from the diagnostic radiation call in the model run, and Fclean,clear removes both aerosols and clouds.
While this method calculates aerosol indirect effects – changes in cloud microphysics due to more/less numerous cloud condensation nuclei – and aerosol semi-direct effects – changes in cloud environments due to radiation interaction of the aerosols – (collectively REaci), when it is applied to the experiment with absorbing versus non-absorbing organics, REaci only represents the semi-direct effect of BrC (indirect effects of organics are already accounted for in these two experiments). This effect describes the ability of absorbing aerosols to change the lifetimes of clouds by changing the static stability of the troposphere and limiting incoming solar radiation to the surface; also, these aerosols may help to evaporate cloud droplets when heating the cloud levels (Ackerman et al., 2000; Koch and Del Genio, 2010).
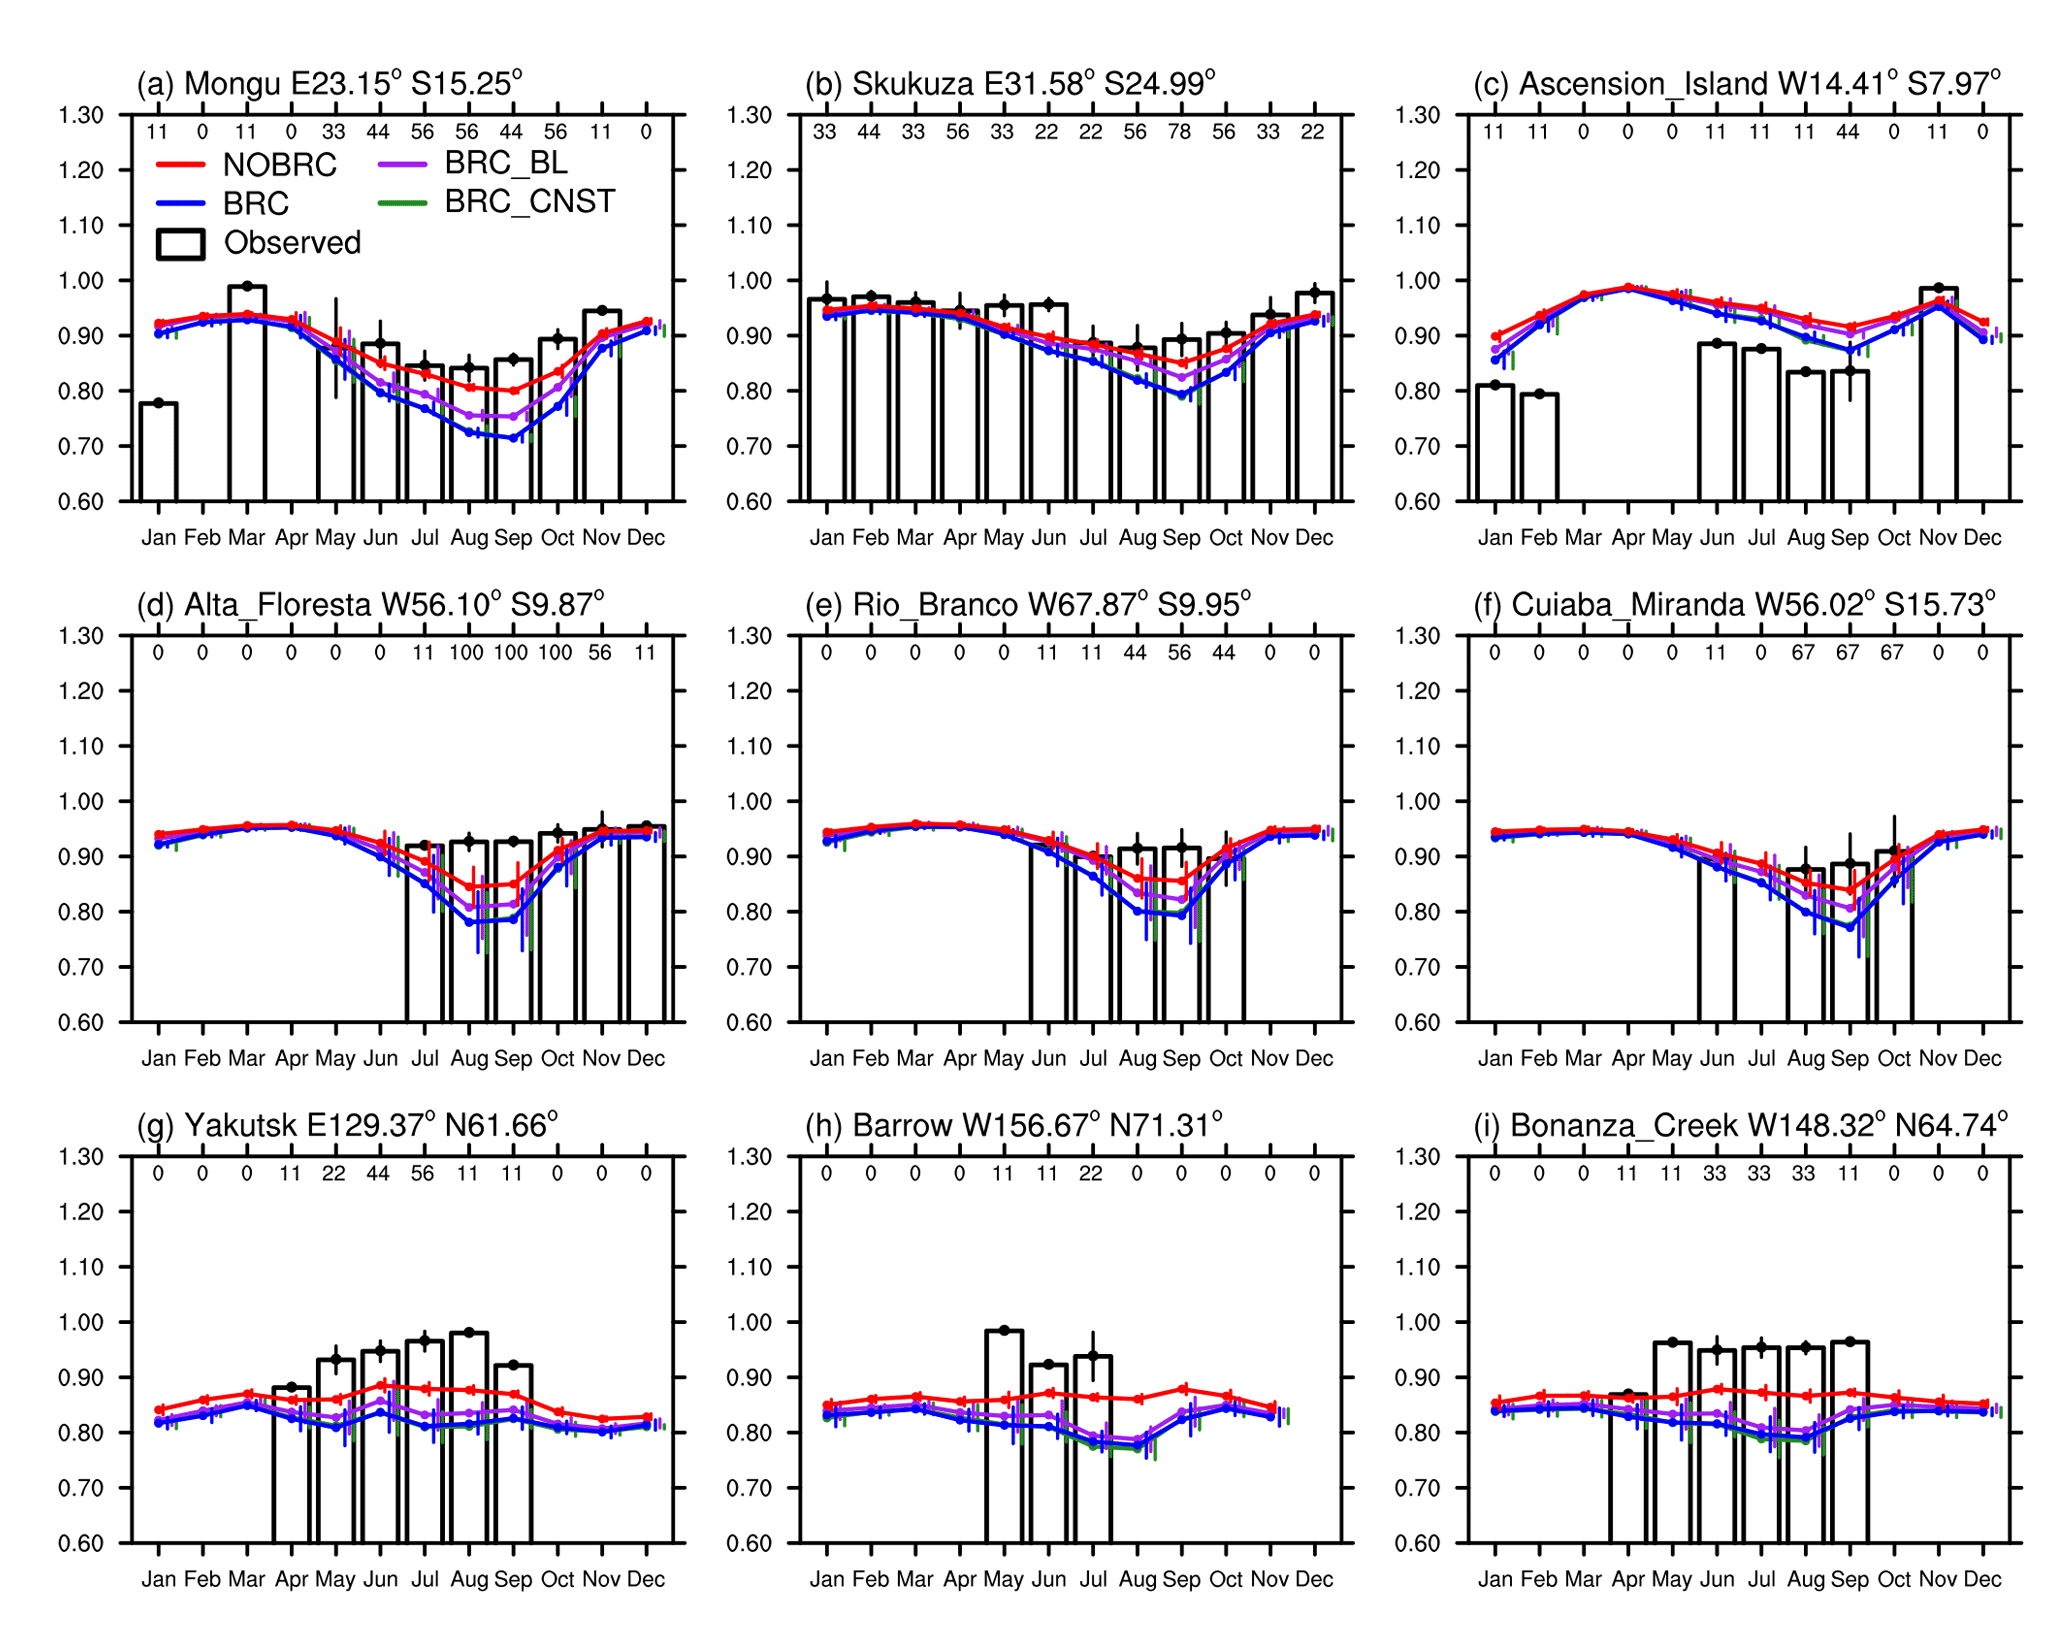
Figure 3AERONET SSA compared to CAM5.4 model output SSA, not including brown carbon (NOBRC), including brown carbon (BRC, BRC_CNST), and including brown carbon and a bleaching effect (BRC_BL). Vertical lines are color-coded error bars and run from left to right as follows: observed, NOBRC, BRC, BRC_BL, and BRC_CNST. Values below the upper x axis indicate percentage of available data in the 9-year period.
3.1 Model validation
Four model simulations (i.e., NOBRC, BRC, BRC_CNST, BRC_BL) are compared to Level 2.0 AERONET (http://aeronet.gsfc.nasa.gov, last access: 1 December 2018) observations from nine different sites, located in three different BB regions: North American and Asian boreal forests, South America (SA), and Africa. The AERONET data are averaged over the period 2003–2011 to match the model simulation period. The model directly outputs the 440 nm single scattering albedo (SSA), aerosol optical depth (AOD), and absorption aerosol optical depth (AAOD) used in this analysis.
The relationship between AERONET and SSA (Fig. 3) and AOD (Fig. S3) from the CAM5.4 NOBRC experiment is the same as in the Jiang et al. (2016) comparison with CAM5.3. As with Jiang et al. (2016), CAM5.4 does a reasonably good job of simulating AOD and SSA, although there are some regions of disagreement, possibly due to incorrect fire emissions, excessive aerosol scavenging by liquid-phase clouds, or inaccurate representation of aerosol optical properties and/or size (Jiang et al., 2016; Yu et al., 2016).
Another possibility for the disagreement between the model and AERONET may be due to error associated with AERONET. The AERONET cloud screening process may introduce error by screening aerosol plumes that have highly variable optical properties (Smirnov et al., 2000). Furthermore, the inversion algorithm used to calculate SSA from AOD (Dubovik and King, 2000) introduces error in retrieving BB SSA in low aerosol concentration situations (Dubovik et al., 2000). Also, the dynamics in the model are going to be different than those influencing the AERONET sites, which could lead to a difference in aerosol exposure at these locations.
When comparing the four model experiments to AERONET AOD (Fig. S3), there is good agreement between the model with and without BrC. This is due to the fact that model AOD is dominated by aerosol scattering, and any changes in absorption with the incorporation of BrC are small by comparison. Overall there is little obvious effect on AOD due to BrC. A much stronger effect can be seen when looking at AAOD, with peak BrC effects in biomass burning seasons (Fig. S4).
When looking at SSA (Fig. 3) the differences between the four model runs are more apparent. In all of the regions (Arctic, Africa, South America), incorporation of BrC (BRC, BRC_CNST, BRC_BL) decreases SSA with respect to the default CAM5.4 model (NOBRC). This is especially true of biomass burning seasons. One would expect this to be true given the large burdens of OA released at these times coupled with the modification to their RI. This seasonality is less apparent at Ascension Island, possibly due to less concentrated OA from diffusion and scavenging during transport to the island, leading to a smaller effect from BrC.
The bleaching effect in BRC_BL reduces its absorption during these seasonal peaks, placing it closer to the NOBRC simulation than either BRC or BRC_CNST. When looking at the African and South American sites, especially those further away from the BB source regions (Fig. 3b–c), the BRC_BL is more similar to NOBRC; in the Arctic, BRC_BL tends to be closer to the BRC simulation. This can be explained by the higher [OH] in the tropics resulting in a faster bleaching of BrC than in the Arctic. Table S1 in the Supplement shows [OH] in different regions and the half-life of BrC due to the bleaching effect in these regions, which ranges from 0.37 days (southeast Asia) to 2.09 days (Arctic).
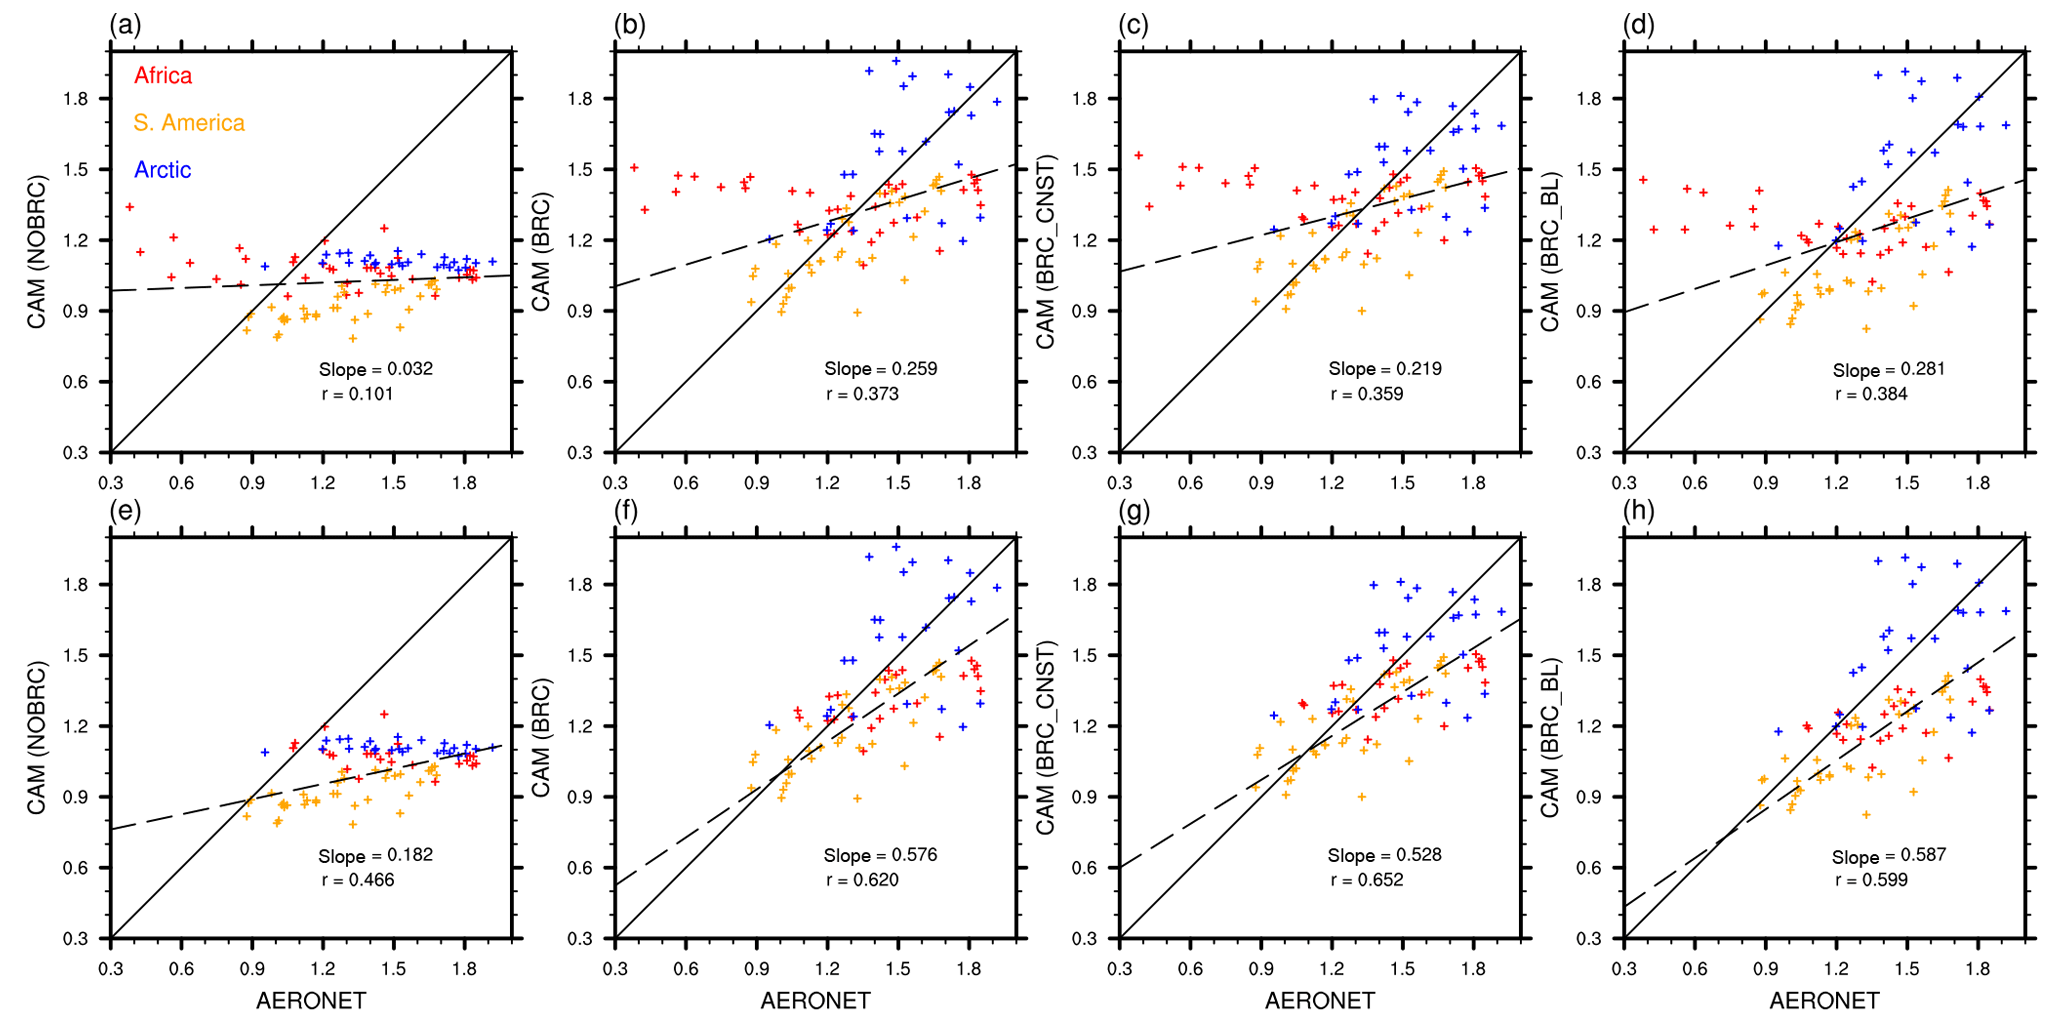
Figure 4Absorption Ångström exponent (AAE) comparison between all of the AERONET sites from Fig. 3 and the four model runs: (a) NOBRC, (b) BRC, (c) BRC_CNST, and (d) BRC_BL. The lower row looks at the same model comparisons neglecting the Ascension Island site. Red indicates African sites, orange indicates South American sites, and blue indicates Arctic sites. The solid line indicates a 1:1 fit and the dotted line is a best fit to the data with the slope and correlation coefficient shown.
Another effect that can be seen in the SSA plots is a subtly lower SSA (i.e., stronger absorption) in the Arctic regions (Fig. 3g–i) for BRC_CNST than for BRC. This may relate to the constant BC-to-OA of 0.08 in BRC_CNST, which is higher than the column burden average BC-to-OA at these high latitudes (Fig. 2). A higher BC-to-OA relates to stronger absorption based on the Saleh et al. (2014) parameterization. While the differences between BRC and BRC_CNST are quite small, this presents the possibility of overestimation of the BrC effect at northern high latitudes with BRC_CNST.
While the SSA comparison does not show improvement with BrC incorporation, agreement between the model and the AERONET absorption Ångström exponent (AAE) is better with BrC (Fig. 4). The AAE is calculated based on the two wavelengths 440 and 675 nm (λ1 and λ2, respectively) and the measured absorption coefficients at the two different wavelengths (babs(λ1) and babs(λ2)).
It describes the wavelength dependence of the measured emissions, with AAEs greater than 1 representing higher wavelength dependence (i.e., larger differences in babs(λ1) and babs(λ2)). As a result, higher AAEs can be used to identify the presence of BrC (Bond, 2001; Kirchstetter et al., 2004; Chen and Bond, 2010; Bond et al., 2013).
Table 2Comparisons between modeled AAE and the AAE from observations at Ascension Island during the LASIC (Layered Atlantic Smoke Interactions With Clouds (LASIC) campaign, the Las Conchas fire in New Mexico, and biomass burning and prescribed burns from the United States during SEAC4RS (Studies of Emissions and Atmospheric Composition, Clouds and Climate Coupling by Regional Surveys).
Default CAM (NOBRC) tends to overestimate the AAE of the previously mentioned biomass burning sites when AERONET predicts low values, and vice versa (Fig. 4a). In the BRC, BRC_CNST, and BRC_BL model runs, the underestimation of the AAE by CAM is improved, especially in the South American and Arctic regions (Fig. 4b–d). This is consistent with Feng et al. (2013) who showed that including different values for absorbing OA drives the model AAE closer to that of AERONET.
The large African outliers in this comparison are all from the Ascension Island site (Fig. 4e–h). A comparison of the AAE and the scattering Ångström exponent (SAE) for the AERONET sites (Fig. S5) suggests that the Ascension Island aerosols are a large particle–low absorption mixture (Fig. 8 in Cappa et al., 2016). When the same comparison is made for the BRC model run (Fig. S6), the Ascension Island aerosols are identified by the Cappa et al. (2016) classification as a large particle–BC mixture. The large particle trend at Ascension Island can likely be attributed to sea salt aerosol, while the difference between the model and AERONET may be due to more smoke transport to the island in the model. Two other possibilities for the disagreement were previously mentioned: error introduced to AERONET due to cloud screening processes and model bias in the circulation patterns.
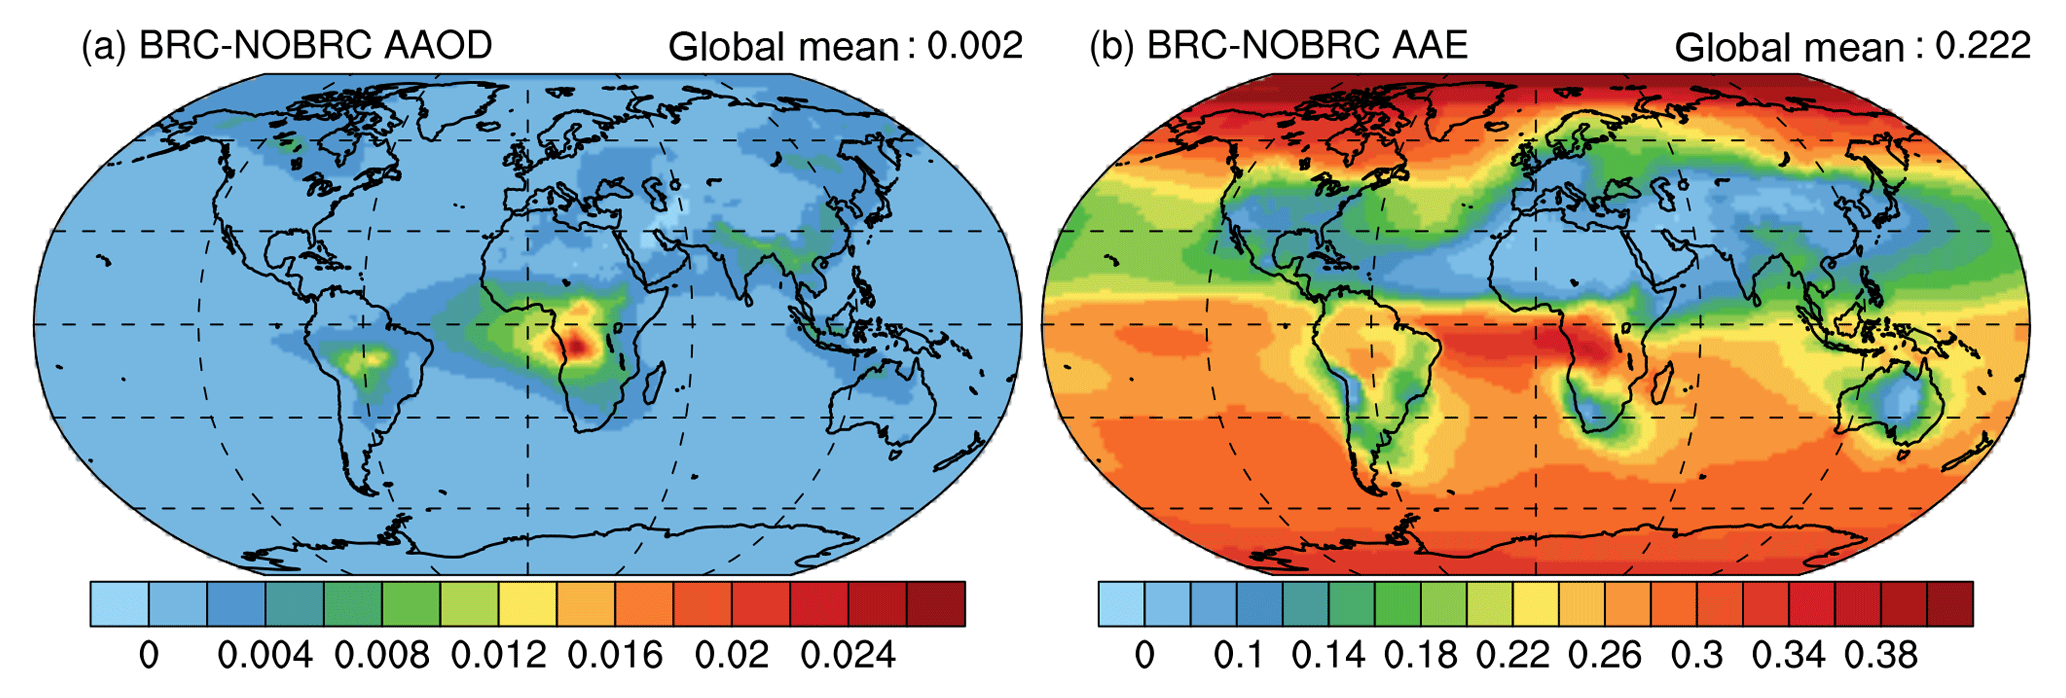
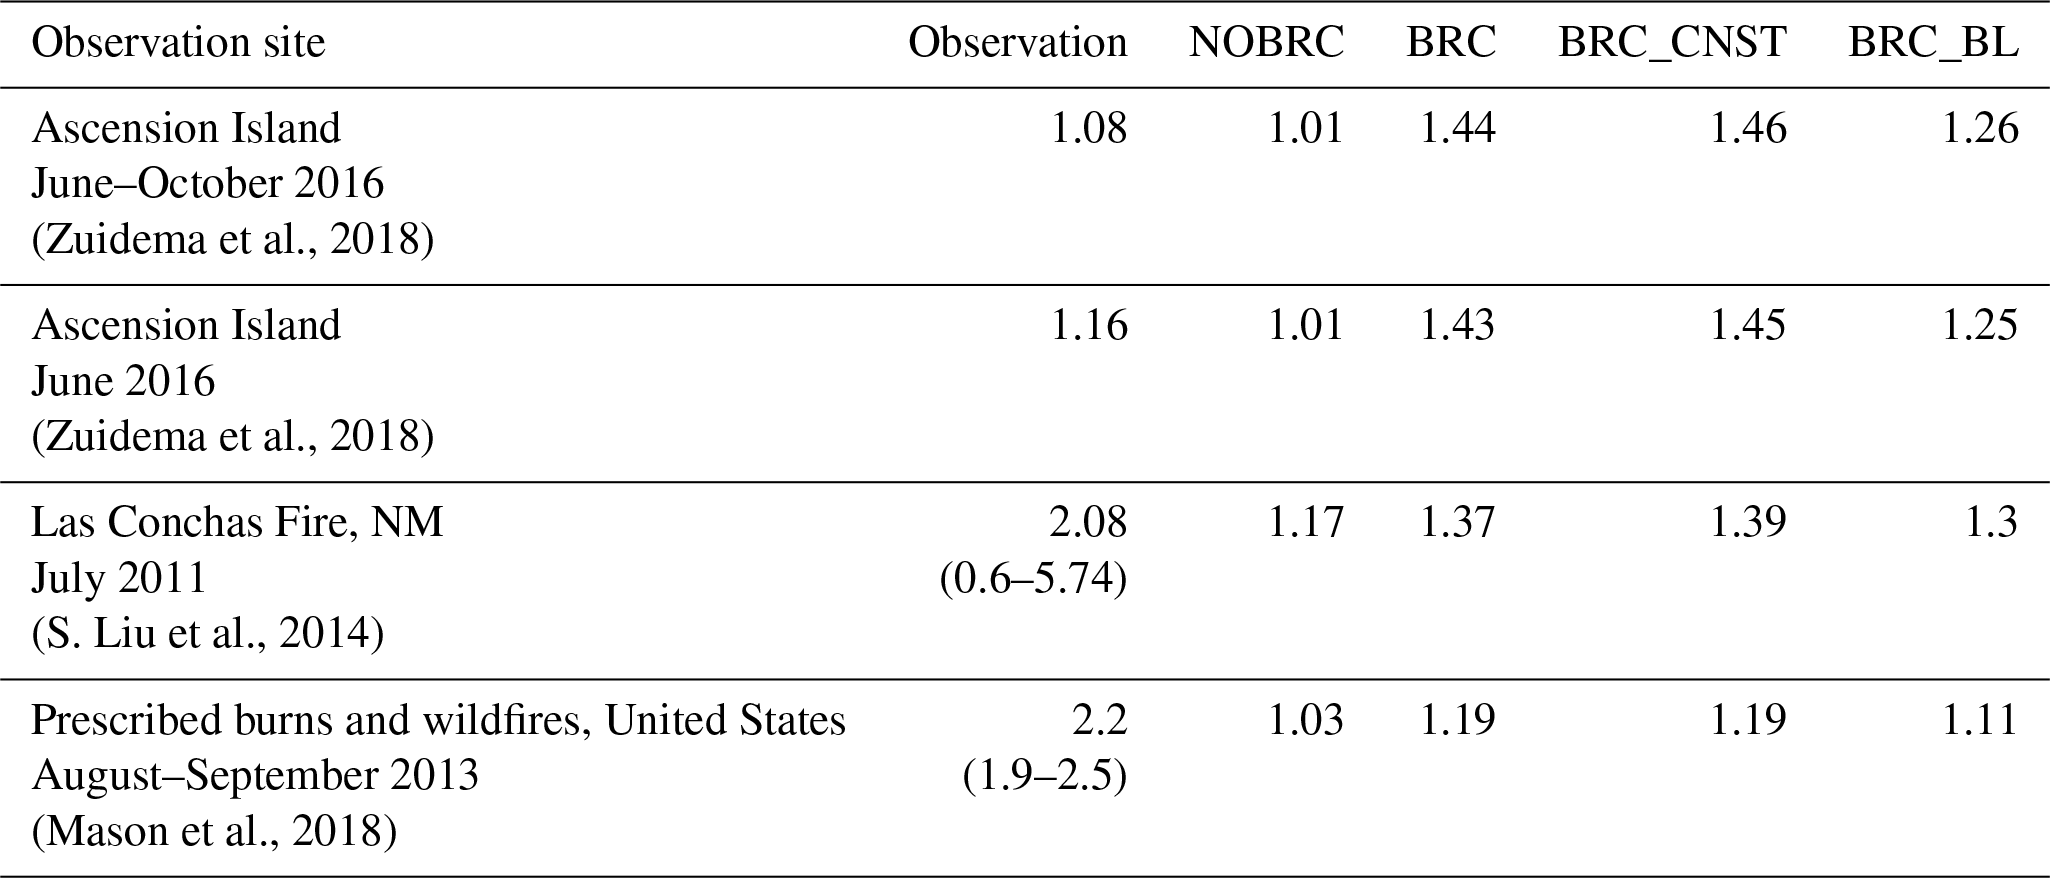
Figure 5Differences in (a) AAOD and (b) the AAE between the BRC model run and the NOBRC model run.
Other comparisons between the model and observational AAEs are shown in Table 2. These observations are from Ascension Island (Zuidema et al., 2018), a southwestern US (New Mexico) wildfire (S. Liu et al., 2014), and continental US BB and prescribed burns from the SEAC4RS campaign (Mason et al., 2018). These comparisons are largely qualitative given the coarse resolution of the model (∼100 km) compared to the much finer wildfire spatial resolution. Both the Ascension Island and New Mexico observations are from the surface, while the continental US observations are made via aircraft. The Ascension Island and SEAC4RS US BB and BF observations were made during different years than represented in the model run, so our comparison operates under the assumption that these regions have consistent seasonal smoke exposure from 2003 to 2016. The bleaching effect (BRC_BL) drives the model closer to the observations over Ascension Island, but still acts to overestimate the AAE along with BRC and BRC_CNST. This could suggest either too much BrC transport to this region in the model, too weak a bleaching effect, or too much of some other type of aerosol with a higher wavelength dependence (i.e., dust). The models underestimate the AAE over the United States, especially in the BRC_BL and NOBRC model runs. This could be due to the influence of fossil fuel emissions in the model grid cell driving the AAE closer to 1.
Other observations of forest fires from Los Alamos National Laboratory (LANL) in New Mexico from 2018 show the variability of the measured fire AAEs. These include the Buzzard fire, the Ute fire, and the San Antonio fire (with average AAEs of 1.44, 1.42, and 2.38, respectively) (Romonosky et al., 2018). Due to their being outside the model run period and their intermittent nature, these fires are not directly compared to the model. However the Las Conchas model comparison from Table 2 is compared to the other fires assuming a similar regional fuel composition in the model. The model with the bleaching effect is closer to the Ute and Buzzard fires than to the Las Conchas and San Antonio fires, and overall the inclusion of BrC brings model AAEs closer to the New Mexico fire measurements.
Figure 6Differences in (a) the zonally averaged absorption coefficient (m−1) and (b) the zonally averaged AAE between the BRC model run and the NOBRC model run.
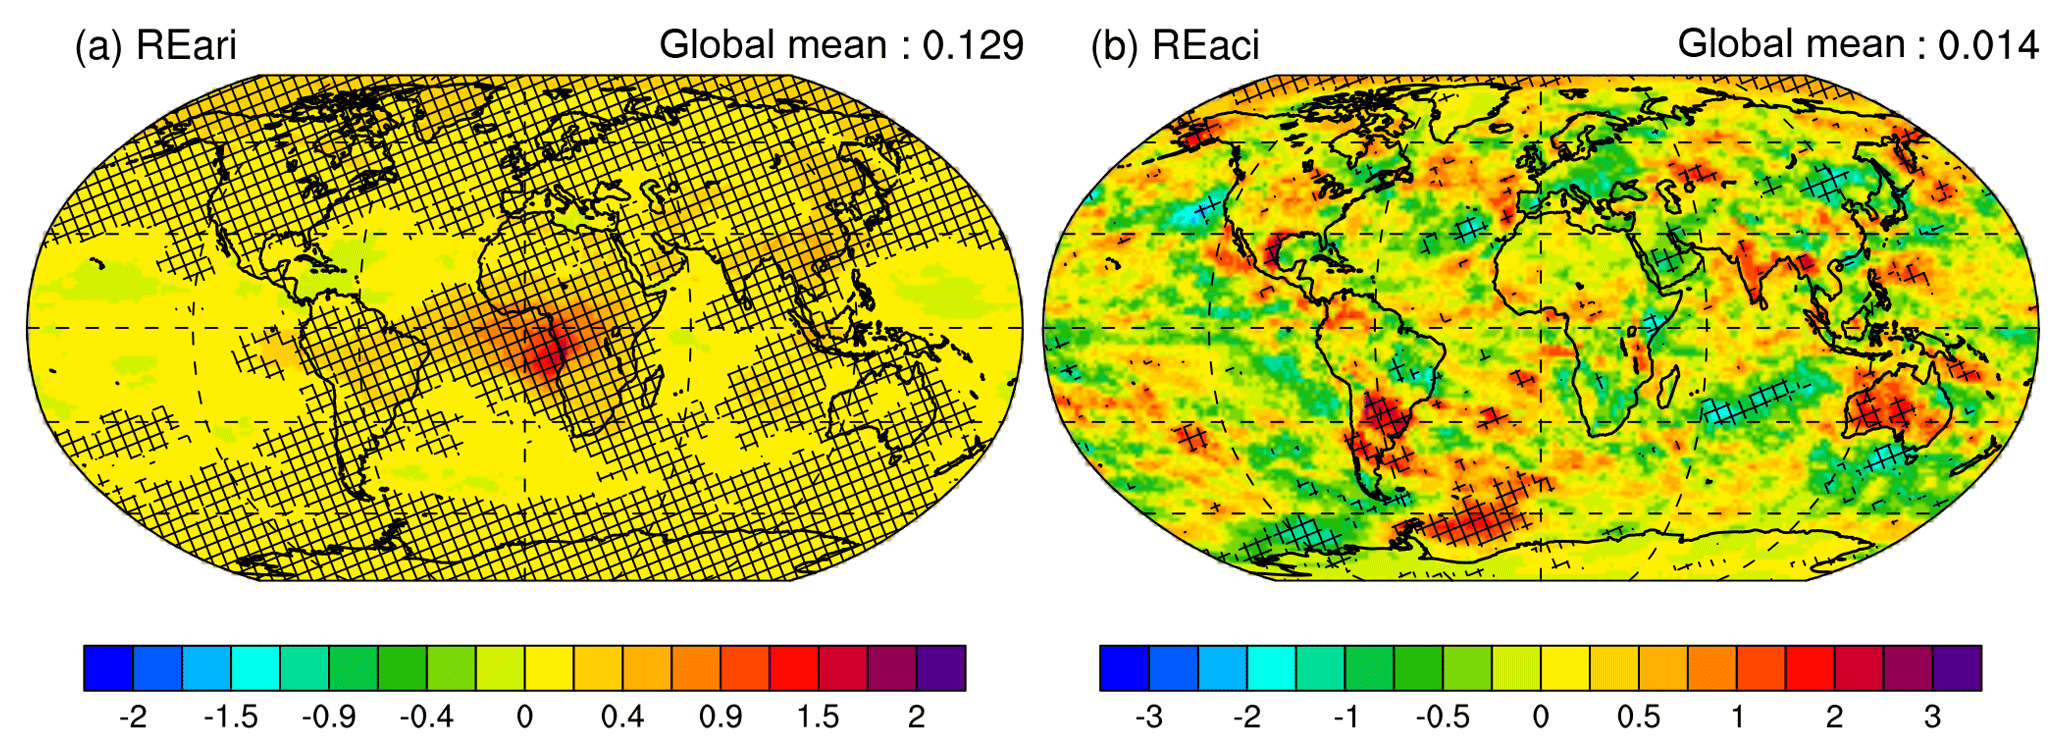
Figure 7Radiative effects from (a) aerosol–radiation interaction (REari) and (b) aerosol–cloud interaction (REaci) from the BRC model run. Units are W m−2. Note different scales. Hatching indicates regions where the change over the ensemble years is significant to the 0.05 (REari) and 0.1 (REaci) levels.
3.2 BrC radiative effect
One of the effects of adding BrC to the model is an increase in atmospheric absorption due to BB and BF emissions. This can be seen in Fig. 5a which shows the difference in AAOD between the BRC and NOBRC model runs. The max AAOD over southern Africa is about 0.024, which makes up approximately one-third of the total AAOD in this same region (Fig. S7a). As with Fig. 4, Fig. 5b shows a global increase in AAEs due to BrC. These effects are the strongest over the southern African BB region and in the Arctic, with the strongest AAE increases over the Arctic (Fig. 5b) correlated with weaker AAOD in Fig. 5a. Vertical cross sections of aerosol absorption coefficient and AAE changes due to BrC (Fig. 6) show the vertical extent of BrC. Zonal BrC absorption is dominated by the African and South American biomass burning regions, with visible aerosol transport to the Arctic from boreal fires (Fig. 6a). While absorption over the Antarctic is nearly zero, upper level transport of dilute BrC to the south can be inferred from the AAE changes in Fig. 6b.
Figure 7a shows REari of BrC from the BRC model run. The global annual average of REari is 0.13±0.01 W m−2 (±1σ standard deviation), which indicates a global warming effect due to BrC. The maximum forcing (∼1.75 W m−2) occurs off the west coast of southern Africa; lofted BB emissions are transported over a low-lying semi-permanent stratocumulus cloud deck off the coast of Namibia and Angola. This maximum forcing can be explained by an enhancement of BrC absorption, as incoming solar radiation is not only absorbed at the top of the smoke plumes, but is also reflected off the clouds and is absorbed by the smoke plumes as outgoing radiation from the cloud top (Abel et al., 2005; Zhang et al., 2016). Significant absorption also occurs over South American BB regions (∼0.3 W m−2), southeast Asian BF sources (∼0.5 W m−2), and regions over the Arctic Ocean and Greenland (0.1–0.3 W m−2).
While the effects of REari correspond well to emission sources of absorbing aerosol, REaci presents a more complicated picture to diagnose (Fig. 7b). There is a weakly positive REaci global average (0.014±0.04 W m−2), suggesting that the BrC absorption has a negative impact on low cloud formation and lifetimes in the model, reducing the cooling effect of clouds globally. Some regions where the REaci is positive include South America (∼2 W m−2), the Gulf of Mexico (GM; ∼2.5 W m−2), Kazakhstan (∼1.5 W m−2), parts of southwest Alaska (∼1.5 W m−2), much of Australia (∼2 W m−2), and the Weddell Sea (WS; ∼2 W m−2). This positive effect is almost balanced by the negative REaci (up to −2 W m−2) over the ocean (e.g., northeast Pacific (NEP), Indian Ocean, and Antarctic coast (AC)) and in parts of South America and northeastern China (NEC). A negative REaci suggests an increase in cloud formation as a result of the BrC addition to the model. We note that most of this REaci is not statistically significant.
Johnson et al. (2004) used high-resolution large eddy simulation model experiments of absorbing aerosols in and above the boundary layer to show that REaci could be positive if absorbing aerosols within the boundary layer heated the air, evaporating cloud liquid water and cutting off the surface moisture source via a decoupling of the boundary layer. They also found that REaci could be negative via an enhancement of an elevated stable layer due to absorbing aerosols above the boundary layer. By creating a strong inversion and increasing the potential temperature above the cloud top, the presence of elevated absorbing aerosols allowed for more persistent low-level clouds by creating less favorable conditions for cloud top entrainment. Another study by Sakaeda et al. (2011) looked at the semi-direct effect of BB aerosols over Africa and found that REaci was typically negative over the ocean and positive over land. In their study they found that the low-level marine cloud cover is increased as a result of increasing low-level tropospheric stability, caused by the direct radiative heating above clouds and the resulting cooling of the surface. This increases the relative humidity in the lower troposphere. Over land they found positive REaci to indicate an increased static stability due to warm aerosols aloft, which reduces convection and slows the development of convective precipitation. Possible mechanisms for the significant regional REaci will be addressed in Sect. 3.4.
Interestingly, semi-direct effects are absent from the southern African region where BrC absorption dominates. Within REaci, indirect effects such as cloud droplet effective radius reduction due to the enhanced concentrations of BB aerosols have greater effects than semi-direct effects (Jiang et al., 2016; Lu et al., 2018). With this in mind, the lack of semi-direct effects over Africa could be due to the dominating indirect aerosol effects in this region from OA, which may be acting to mask the smaller semi-direct effects of BrC. Another possibility is that the absorption of BC (∼4 W m−2; Jiang et al., 2016), being stronger in this region than the absorption due to BrC (∼1.75 W m−2), is the most important factor in semi-direct effects. Both of these hypotheses may lead to fewer occurrences of significant cloud change due to BrC.

Figure 8The effect of BrC addition in the BRC model run on (a) atmospheric absorption (W m−2), (b) surface solar flux (W m−2), (c) low-level cloud fraction (%; clouds below 700 mb), (d) mid-level cloud fraction (%; clouds between 700 and 400 mb), (e) large-scale precipitation (mm day−1), (f) convective precipitation (mm day−1), (g) liquid water path (g m−2), and (h) surface air temperature (∘K). Hatching indicates significance in ensemble year change to the 0.1 level.
3.3 BrC effects on SW radiation, surface temperature, clouds, and precipitation
Looking at differences between BRC and NOBRC for specific climate variables helps clarify possible mechanisms for the previously discussed radiative effects. In Fig. 8a, the distribution of atmospheric absorption is largely synonymous with REari with a global mean of 0.29±0.01 W m−2. The atmospheric absorption is most apparent over the southern African BB and southeast Atlantic outflow regions (∼3 W m−2), and over BF emission sources on the edge of the Tibetan Plateau (∼1.5 W m−2). Surface SW flux reduction due to BrC absorption can be seen in the southeast Atlantic outflow region and the African BB site (Fig. 8b). Also, surface SW flux change (Fig. 8b) corresponds well to the REaci, indicating an increase (decrease) in solar radiation reaching the surface with positive (negative) REaci. But what causes changes in REaci? To understand this, it is important to look at the driving forces behind these radiative effects: clouds and precipitation.
The vertically integrated low-level cloud fraction for clouds lower than 700 mb (LCF; Fig. 8c) shows an inverse correlation with REaci in some regions, indicating that a decrease in the LCF may be correlated partially with an increase in REaci, or vice versa. This is most apparent in South America, western Australia, the Middle East, and northeastern China, with smaller pockets of significant change in Kazakhstan, northern Canada, and Antarctica. The mid-level (between 700 and 400 mb) cloud fraction (MCF; Fig. 8d) is consistent with the LCF in the Arctic, parts of South America, western Australia, northeastern China, and Kazakhstan. Some of the regions where it differs from the LCF are off the northwest coast of the United States, in northern Russia, and off the southeast tip of Australia.
Globally there is little change in large-scale precipitation (PRECL; Fig. 8e) (0.0003±0.001 mm). Regionally, there are significant changes in PRECL corresponding to changes in the LCF. Examples include the Arctic Ocean (−0.15 to 0.1 mm day−1), Iran (0.15 mm day−1), off the east coast of the United States (0.2 mm day−1), parts of South America (0.2 mm day−1), near Kazakhstan (−0.15 mm day−1), and off the west coast of the United States (−0.4 mm day−1). Increases in PRECL in the Arctic may indicate increased snowfall due to colder temperatures at these latitudes. There is a significant decrease in PRECL off the west coast of the United States, and while this does not correspond to a LCF, it does agree with a decrease in the MCF (Fig. 8d).
Change in precipitation from convective clouds (PRECC; Fig. 8f) has a different distribution than PRECL. Significant regions of change are found in the tropics with large reductions in PRECC found along the Gulf Coast of Mexico (−0.4 mm day−1), in western Australia (−0.2 mm day−1), and in parts of South America (−0.1 mm day−1). There are also significant changes following the North Atlantic storm track (−0.3 mm day−1) and off the west coast of the United States (−0.2 mm day−1). While there are cells of significant PRECC increase in parts of Bangladesh (0.2 mm day−1), China (0.1 mm day−1), and Africa (0.1 mm day−1), the global mean of mm day−1 indicates a slight decrease in PRECC with the addition of BrC.
Changes in liquid water path (LWP; Fig. 8g) are consistent with changes in LCF and PRECC. The most negative LWP changes are over land in South America (−4.5 g m−2), Australia (−3.5 g m−2), and the Gulf of Mexico (−5 g m−2), corresponding to reductions in PRECC (Fig. 8f). This is consistent with Sakaeda et al. (2011), who correlated large reductions in convection with increased static stability resulting from elevated BB aerosols. Significant increases in surface air temperature (TS; Fig. 8h) appear in South America (0.4 ∘K), the Gulf of Mexico (0.4 ∘K), and Australia (0.4 ∘K). These regions correspond to decreasing PRECC, PRECL, and LCF, indicating surface warming in regions with decreasing cloud cover and precipitation. Significant increases in TS over Alaska (0.5 ∘K) and northern Africa (0.25) are not correlated with cloud cover change and may be due to surface changes due to changing dynamics in the model with BrC incorporation. Similarly, TS significantly decreases over the Rocky Mountains and the Northern Great Plains of the United States (−0.6 ∘K), but does not seem to correspond to significant changes in cloud cover or precipitation. This change is unclear but may indicate a change in surface albedo in the mountainous regions, possibly due to increased snowfall.
It is important to note that the model output does not give a complete picture of temperature or precipitation changes due to the prescription of sea surface temperatures. It would be worth revisiting this study with a fully coupled atmosphere and ocean model to allow BrC absorption to affect the air–sea interaction in the model.
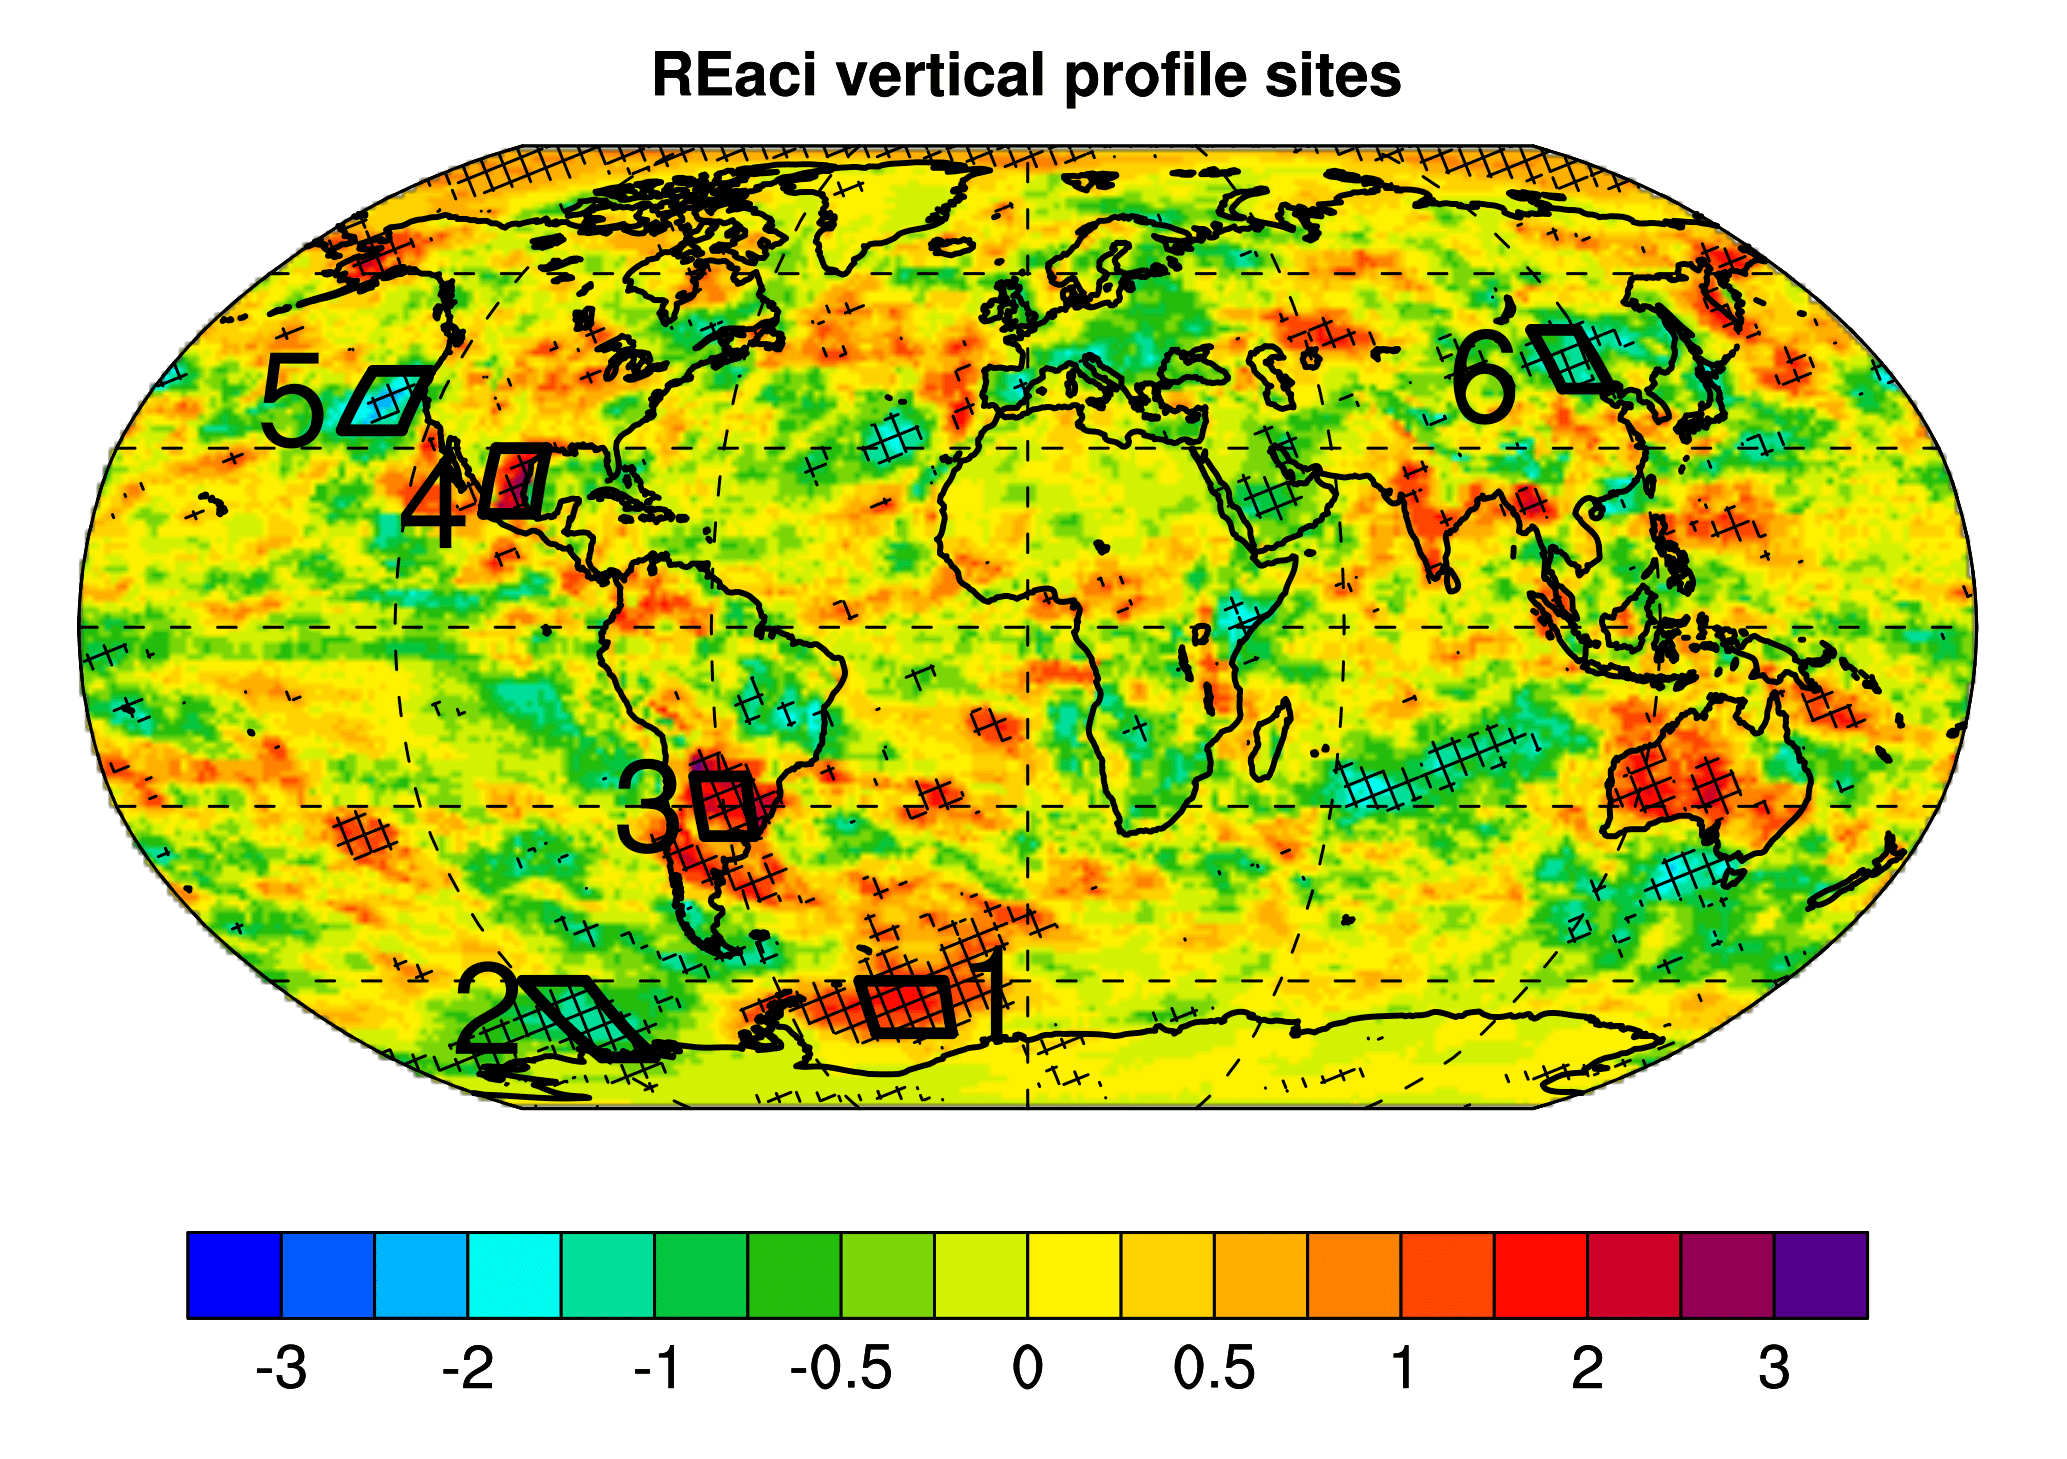
Figure 9Locations of the vertical profile sites influenced by significant REaci in the BRC model run. Sites are referenced herein as (1) Weddell Sea (WS), (2) Antarctic coast (AC), (3) South America (SA), (4) Gulf of Mexico (GM), (5) northeast Pacific (NEP), and (6) northeastern China (NEC). Hatching indicates significance in the ensemble year change to the 0.1 level.
3.4 Vertical changes due to BrC semi-direct effects
To understand how the BRC model BrC plays a role in aerosol–cloud interaction, we looked at vertical profiles of land (western Gulf of Mexico (GM), South America (SA), northeastern China (NEC)) and oceanic regions (Weddell Sea (WS), western Antarctic coast (AC), northeast Pacific (NEP)) with significant positive and negative BrC REaci (Fig. 9). The vertical profiles come from the averaged grids in these regions with greater than a 0.9 confidence level (Figs. 10 and 11).
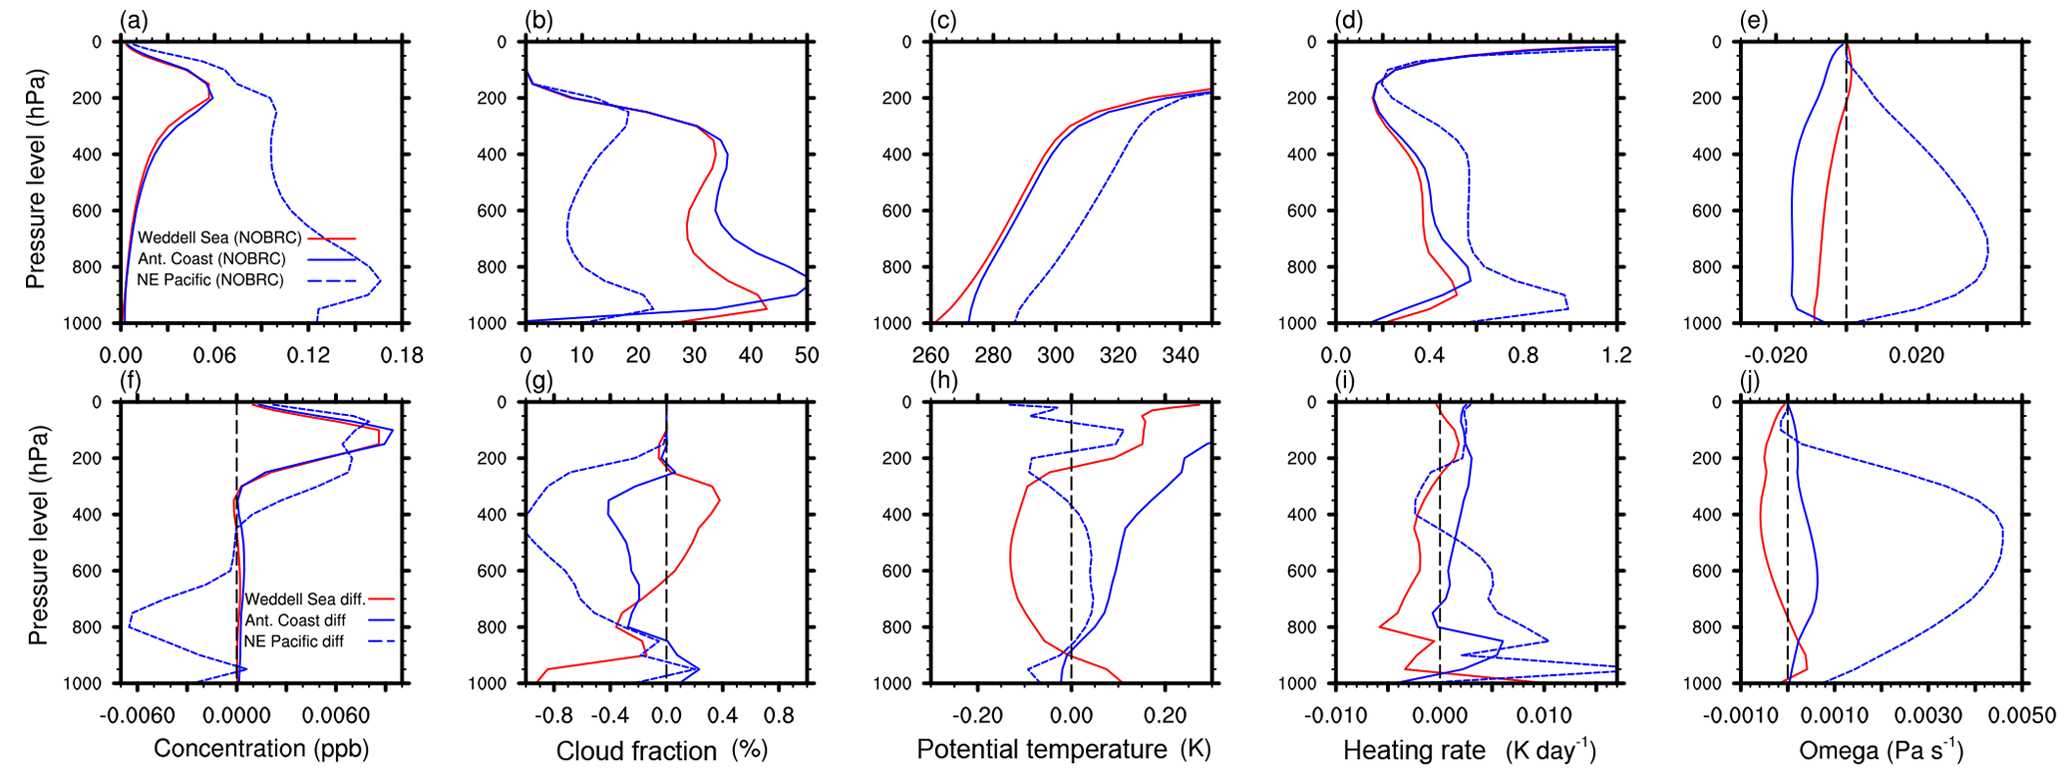
Figure 10Vertical profiles (a–e) and vertical profile perturbations (f–j) for the sites in the Weddell Sea (WC) and the Antarctic coast (AC). In (a)–(e) the model run NOBRC is plotted, and the difference between BRC and NOBRC is plotted in (f)–(j). Red represents regions with a positive REari and blue represents regions with a negative REari.
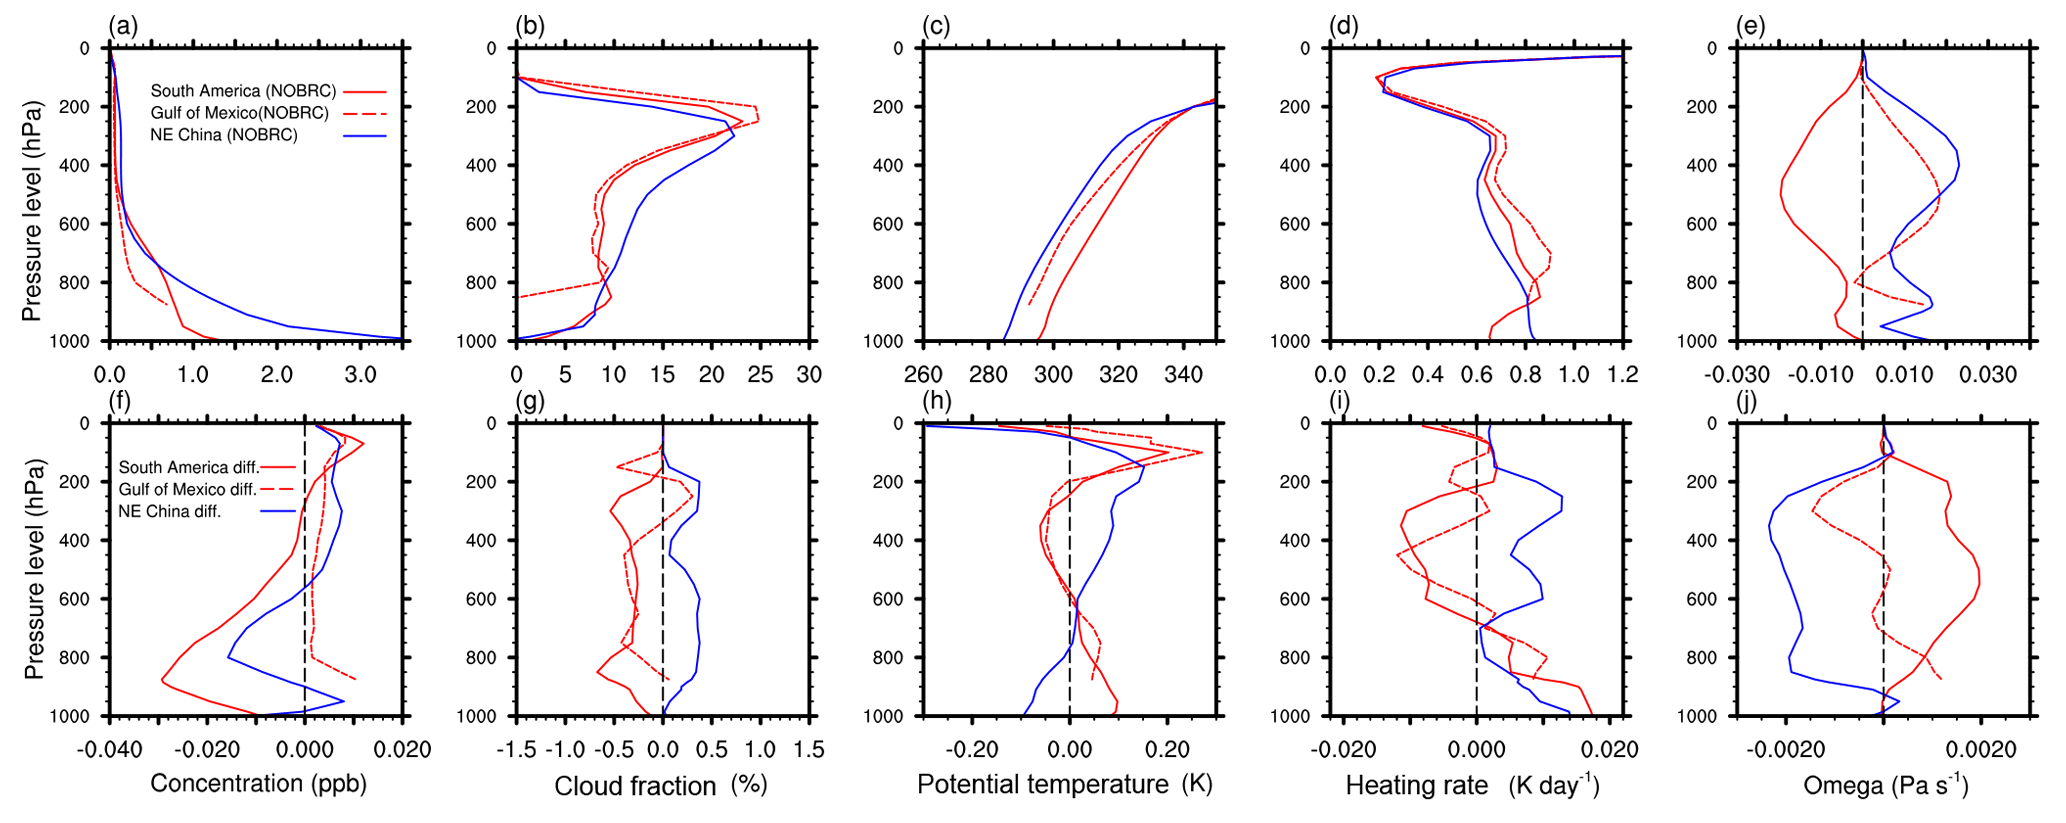
Figure 11Vertical profiles (a–e) and vertical profile perturbations (f–j) for the sites in South America (SA), the Gulf of Mexico (GM), and northeastern China (NEC). In (a)–(e) the model run NOBRC is plotted, and the difference between BRC and NOBRC is plotted in (f)–(j). Red represents regions with a positive REari and blue represents regions with a negative REari.
In the Antarctic oceanic regions, there is little influence from BB and BF POA (i.e., sources of BrC) (Fig. 10a) and there is a positive vertical motion associated with the Ferrel cell convergence zone (Fig. 10e). The NEP site has a larger aerosol influence as well as negative vertical motion due to the descending branch of the Hadley circulation. WS low-level cloud fraction (Fig. 10b) and potential temperature (Fig. 10c) correspond with the greater annual average ice fraction in the WS (63 % versus 15 % off the AC). The heating rate in all three regions corresponds to the local cloud fraction maxima, indicating strong contribution from latent heat release (Fig. 10d). In all of the regions, the upper level concentration of BB and BF POA increases by about 10 %–15 % (Fig. 10f), indicating a change in atmospheric circulation with BrC implementation. This is backed up by positive changes in omega (ω; ∼20 % max) (Fig. 10j) and decreases of ∼4 % (increases of ∼2 %) in high-level (low-level) clouds (Fig. 10g). The NEP region shows a decrease in aerosol concentration at lower levels (5 %), possibly indicating a strengthening of the Hadley cell downwelling, which may change advection of aerosol into the region or inhibit advection due to the high-pressure enhancement. In the WS there is a decrease in low-level clouds (3 % max) and an increase in upper level clouds (1 %), and off the AC the low-level clouds are enhanced (1 %) (Fig. 10g). Cloud fraction changes at all three sites can be related to changes in potential temperature (Fig. 10h) and heating rate (Fig. 10i). Due to low concentrations of aerosol in these regions, the main driving force behind the significant REaci may be due to changes in vertical motion (Fig. 10j).
Increased cloud cover near the surface may lead to the negative REaci off the AC, which is consistent with strengthening upward velocities and can also be seen by a slight significant increase in the LCF (Fig. 8c). The factors leading to a positive REaci in the WS may be the increased high cloud cover as well as the decreased low cloud cover correlating with descending air near the surface (Fig. 10j). Why the air descends in this region is unclear, but it may be related to the larger ice fraction in the region contributing to an inversion that may decouple the lower levels from the upper level circulation changes, as observed in a WS field campaign by Andreas et al. (2000).
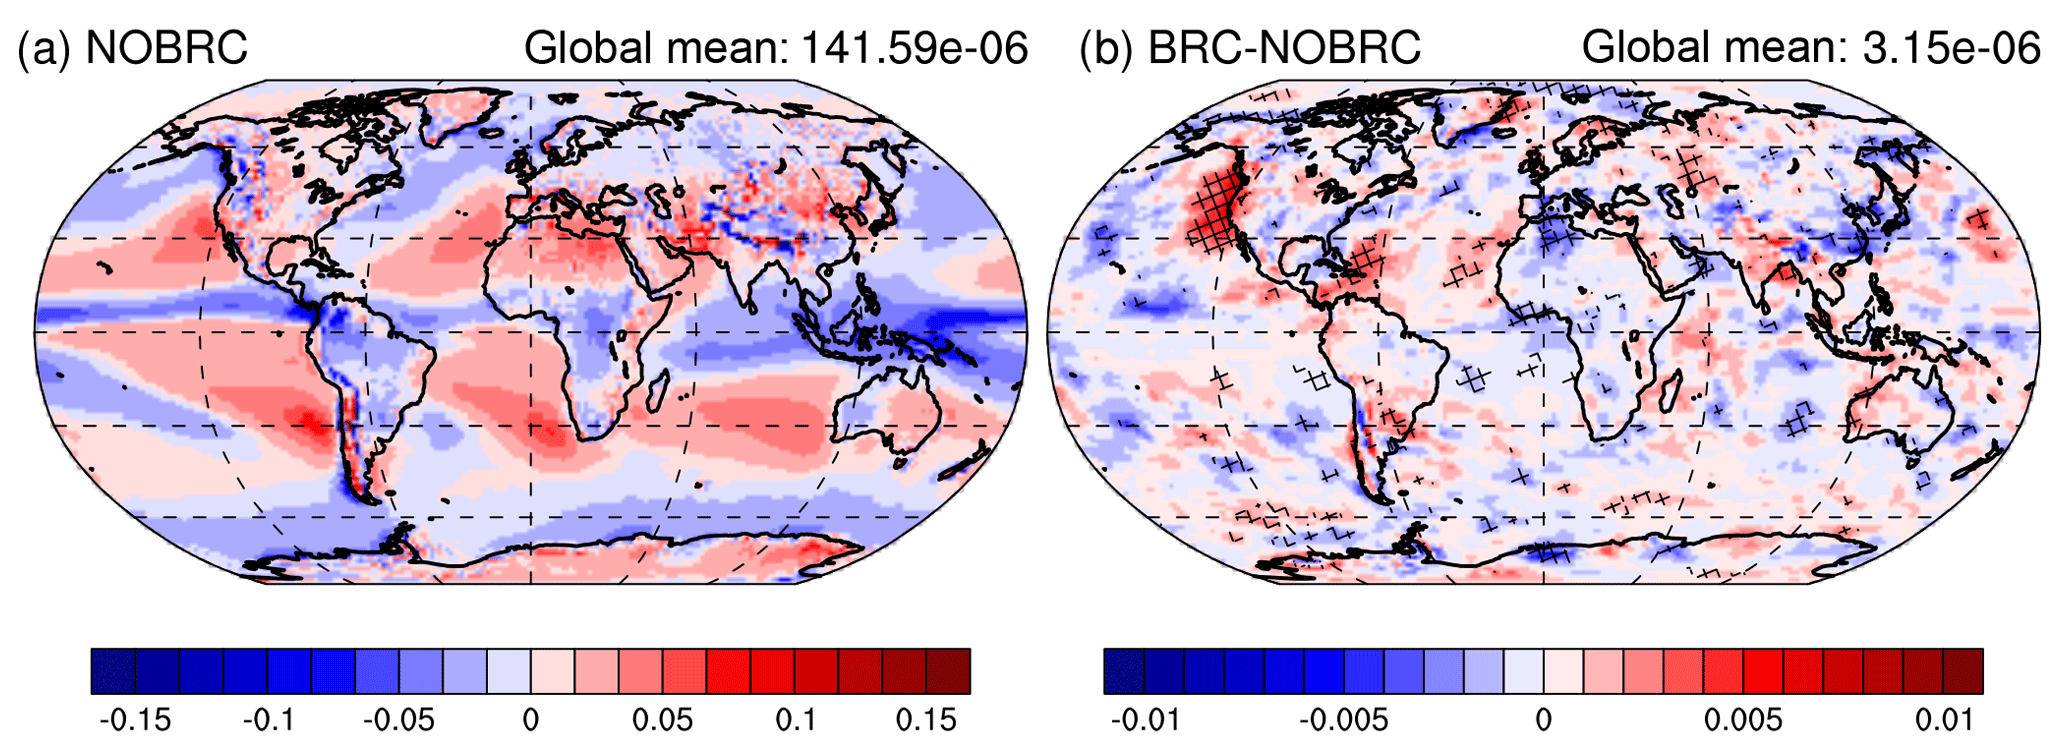
Figure 12500 mb ω in Pa s−1 from the BRC model run: (a) the default annual average and (b) the difference with the incorporation of BrC. Hatching indicates significance in the ensemble year change to the 0.1 level.
The land sites that are selected have a much stronger influence from BB and BF POA than the Antarctic Ocean sites (Fig. 11a). NEC is marked by slightly higher mid-level cloud fractions and lower temperatures than the GM or SA (Fig. 11b–c), and is in a region of descending air aloft (Fig. 11e). Both the GM and SA are located in latitudes near the descending branch of the Hadley circulation but are marked by different regional circulations: SA has an annual average upwelling (Figs. 11e, 12a) influenced by lee-side cyclogenesis (Mendes et al., 2007), while GM has annual average downwelling influenced by the Hadley circulation (Figs. 11e, 12a). Figure 11f shows changes in POA concentrations ranging from ∼4 % decrease to ∼1 % increase near the surface. Regions with positive REaci have a decreased cloud fraction (∼7 % max), while regions with negative REaci have an increased cloud fraction (∼5 % max) (Fig. 11g). In NEC the increased cloud fraction corresponds to cooler surface temperatures (Fig. 11h) and an increased heating rate (Fig. 11i; associated with latent heat release). In SA and GM, decreasing clouds at lower levels correspond to an increased heating rate (Fig. 11i), potentially due to the presence of absorbing BrC in the atmosphere overpowering the reduction in latent heating rate. Decreasing upper level clouds result in a cooling of the upper atmosphere, which may be attributed to a weakening of the high cloud atmospheric warming effect. Cloud fraction increase (decrease) corresponds to negative (positive) changes in ω in the selected regions (Fig. 11j). A strong enhancement of vertical velocity at the surface in the GM (Fig. 11j) may be attributed to the influx of BrC into the region below cloud level (Fig. 11f) and the high heating rate near the surface (Fig. 11i).
Figure 12b shows the change in 500 hPa ω with the incorporation of BrC. There is little significant change in ω over the regions selected here with the exception of AC, SA, and NEP, for which the incorporation of BrC acts to enhance both sinking (SA and NEP) and rising motion (AC). This may be due in part to an enhancement of the global rising and sinking motions due to an enhancement of convection by absorbing aerosol (Perlwitz and Miller, 2010). Of note is the large swath of sinking motion off the west coast of North America, which correlates to changes in MCF, PRECL, and PRECC in Fig. 8. The NEP cooling region corresponds to the significant increases in LCF (Fig. 8c) and LWP (Fig. 8g) within this region of increased ω.
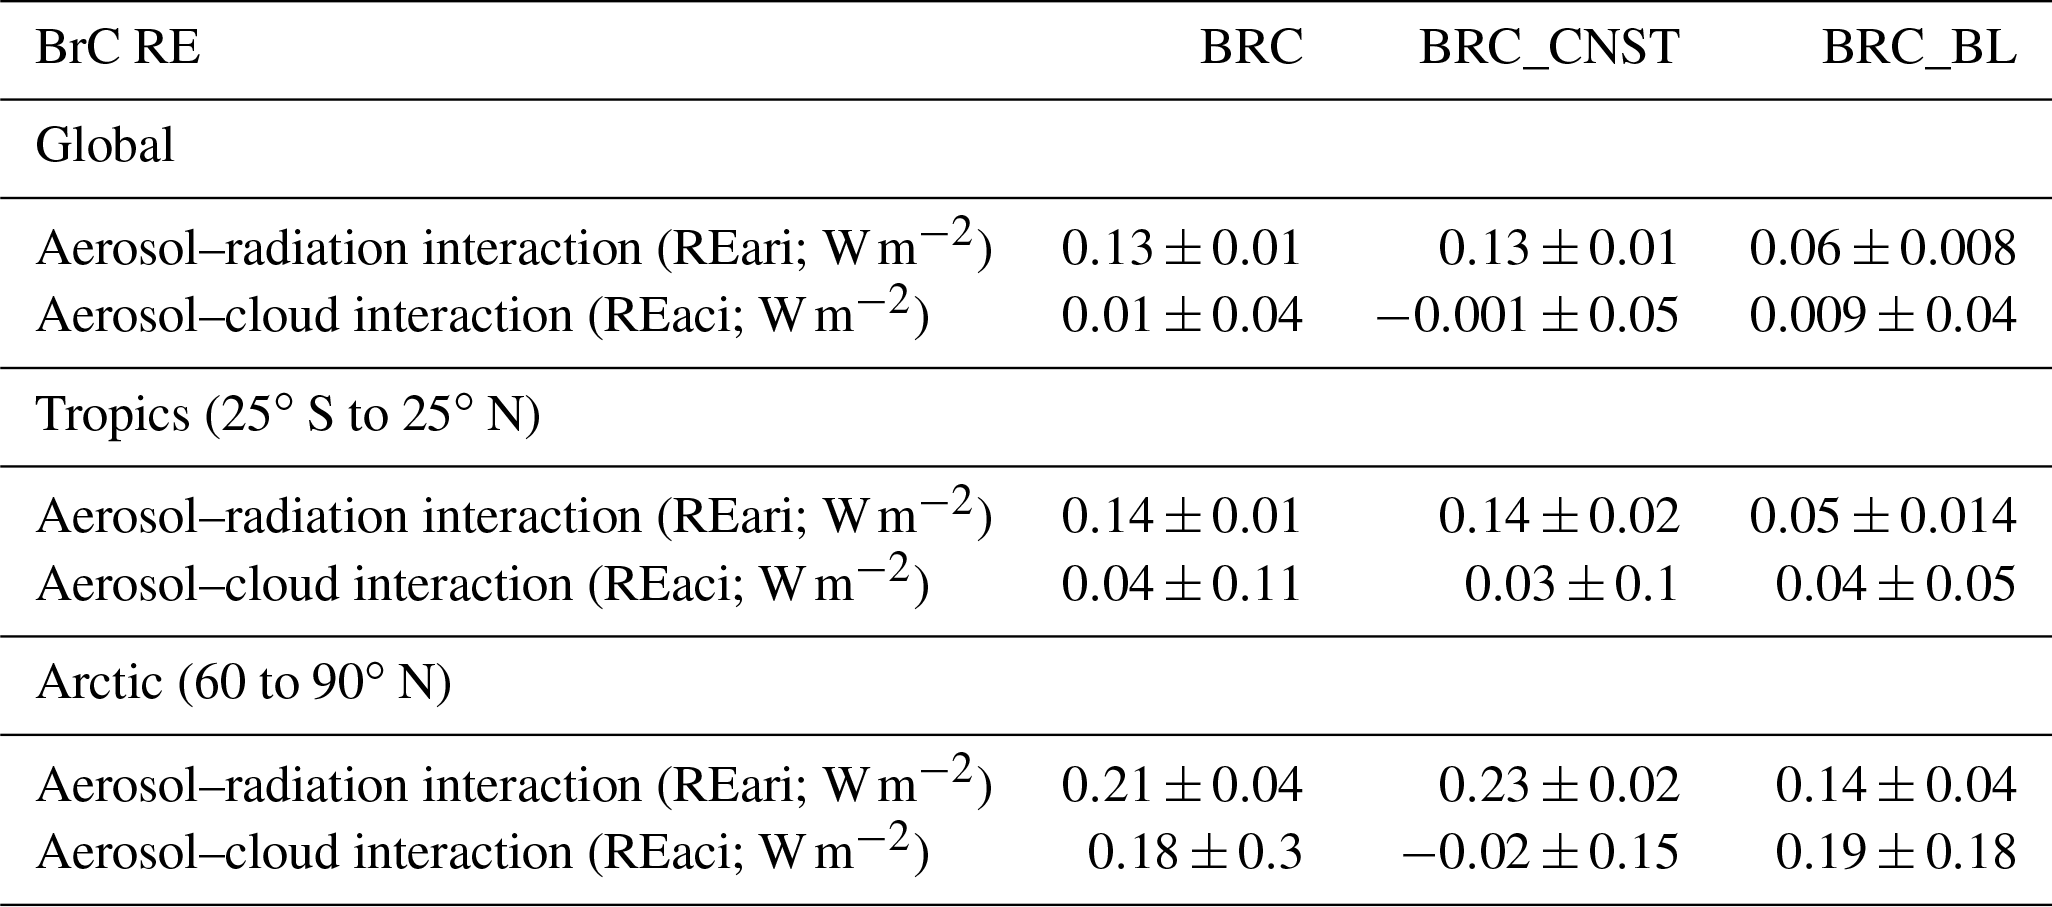
Table 3Different RE contributions globally, in the tropics (25∘ S to 25∘ N), and in the Arctic (60∘ N to 90∘ N) from BRC, BRC_CNST, and BRC_BL model runs. These values are from a 9-year period, 2003–2011. Standard deviations from the five-ensemble means are included.
3.5 Comparison of BRC, BRC_CNST, and BRC_BL climate effects
There are two methods of BrC implementation that have been used in CAM5. Other than the code modification described in Sect. 2.2.2 (BRC model run), the other option has been to use offline calculated phys_prop files with a constant OA RI that is calculated based on a constant BC-to-OA ratio of 0.08 (BRC_CNST model run; Yan Feng, personal communication, 20 April 2016–22 March 2017). The assumption of a constant BC-to-OA ratio may be inaccurate in regions that have a BC-to-OA ratio higher or lower than 0.08. To see if this results in a significant change between the different model simulations, the global climate effects of both methods are examined to determine how they differ. We also show the effect of bleaching (BRC_BL) on these regions but do not discuss it in this section.
Table 3 shows the average of different components of BrC RE for the tropics (25∘ S to 25∘ N), the Arctic (60∘ N to 90∘ N), and the entire globe. REari is similar between the two methods in the tropics ( W m−2) as well as globally (0.13±0.01 W m−2). In the Arctic, REari for BRC_CNST (0.23±0.02 W m−2) is slightly larger than REari for BRC (0.21±0.04 W m−2). This difference in the Arctic may be due to a larger BC-to-OA ratio in BRC_CNST when 0.08 is assumed. In the model, the BB BC-to-OA ratio ranges from <0.07 to 0.072 (Fig. 2a) in the Arctic, which leads to weaker absorption in BRC than BRC_CNST. This may also explain the similarity with REari in the tropics where the model BB BC-to-OA ratio is similar to 0.08, with a range of 0.076 to 0.096 (Fig. 2a). While BFs undoubtedly play a role in these regions, the effect is likely less important in large global sectors than BB due to its lower emissions.
Looking at the global and Arctic regions in Table 3, the REaci associated with BRC_CNST is lower than that associated with BRC. This comes with the caveat that both have very large standard deviations, lowering the significance of this comparison.
Table 4Global averages over the period 2003–2011 for select climate variables from BRC, BRC_CNST, and BRC_BL. Standard deviations from the five-ensemble means are included.
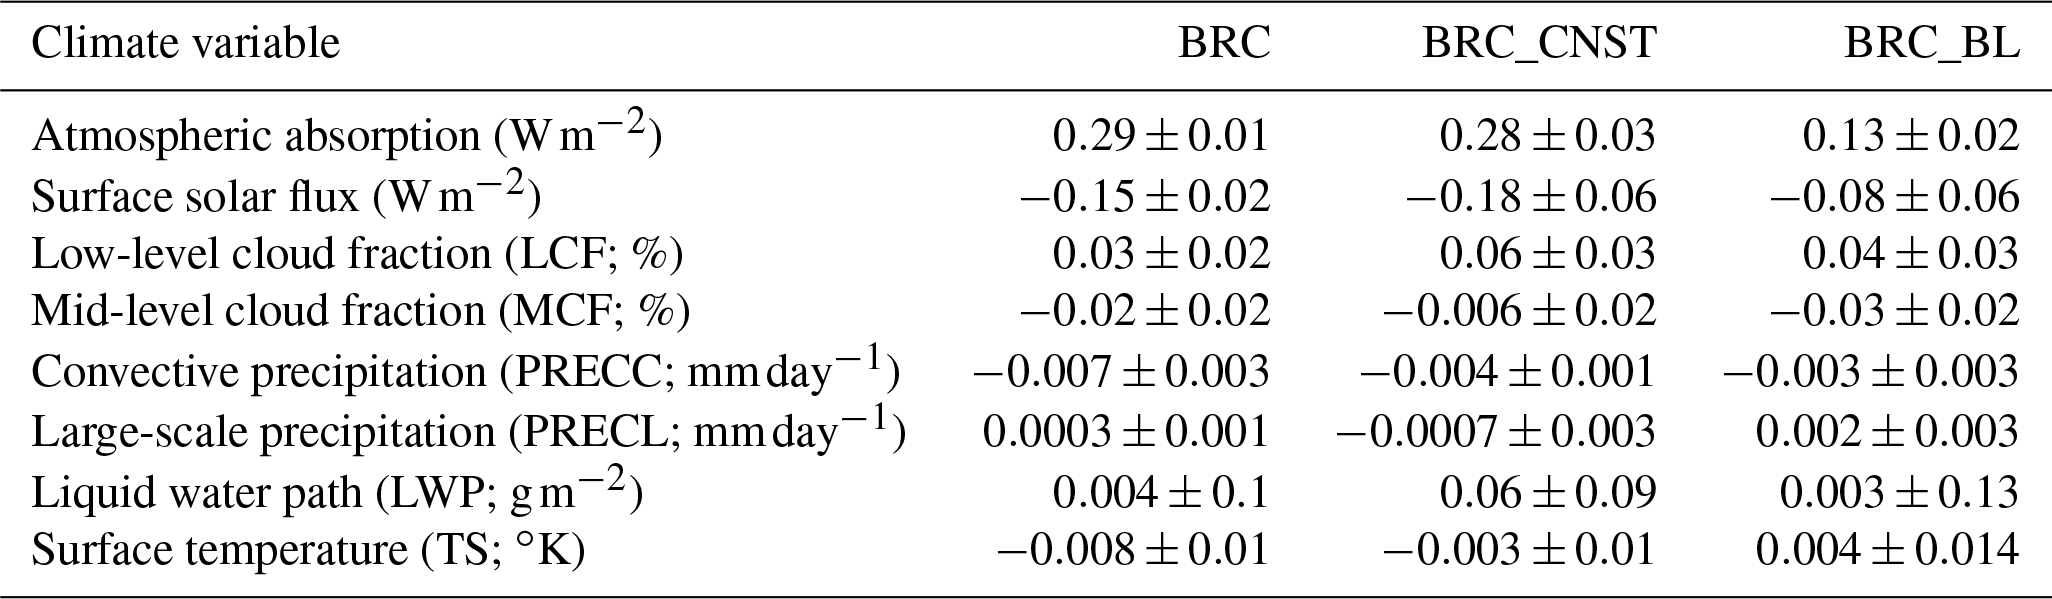
Table 4 shows the global averages of selected variables associated with atmospheric SW transmittance, clouds, precipitation, and surface temperature. Like REari, global atmospheric absorption is very similar between BRC (0.29±0.01 W m−2) and BRC_CNST (0.28±0.03 W m−2). The largest difference between the two model runs seems to be related to differences in aerosol–cloud interaction. In Table 4, LWP change is higher in the BRC_CNST (0.06±0.09 g m−2) than in the BRC (0.004±0.1 g m−2) model run, which seems to correspond to higher LCF (0.06±0.03 %) and MCF ( %) changes in BRC_CNST. Consistent with increased cloud cover and LWP is a lower surface flux in BRC_CNST ( W m−2). While cloud cover and LWP changes are higher in BRC_CNST, both PRECL and PRECC changes seem to differ less between the two model runs. This emphasizes the nonlinearity between cloud cover and the microphysical conditions necessary to generate precipitation.
Lastly, the global surface temperature change between the two models is similar and small (BRC: ∘K; BRC_CNST: ∘K).
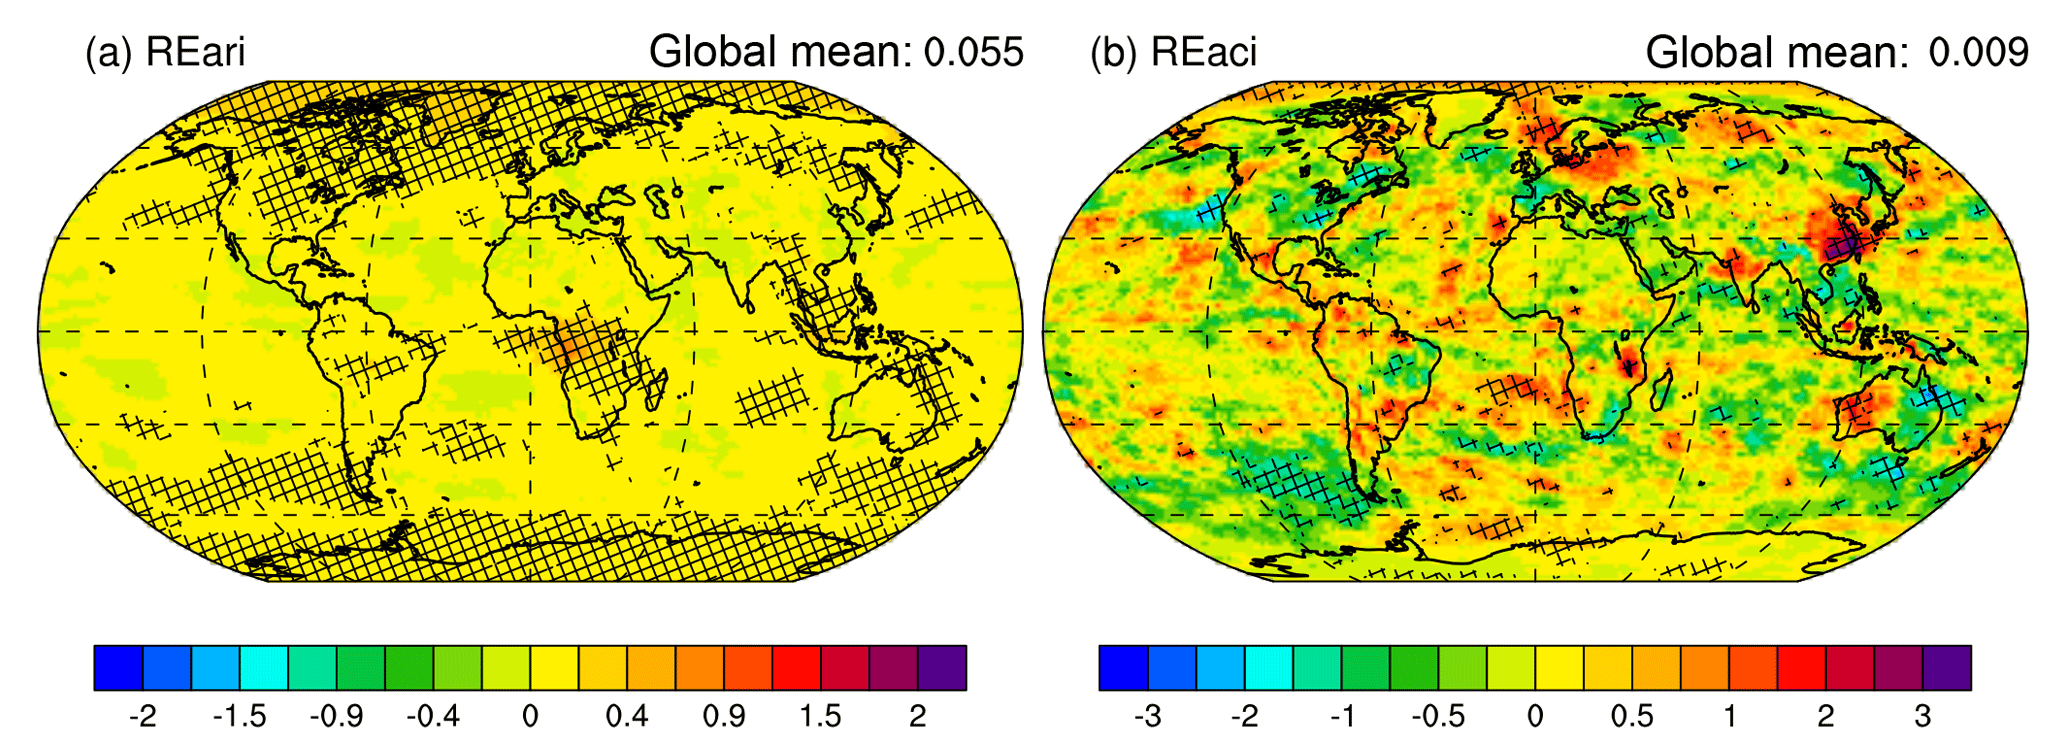
Figure 13Same as Fig. 6 but for the BRC_BL model run. Hatching indicates regions where the change over the ensemble years is significant to the 0.05 (REari) and 0.1 (REaci) levels.
3.6 Effects of BrC bleaching on REari and REaci
Figure 13a shows REari and REaci due to BrC with a bleaching parameterization from the BRC_BL model run. BrC bleaching significantly reduces REari from 0.13±0.01 W m−2 (Fig. 7a) to 0.06±0.008 W m−2 (Fig. 13a). What is readily apparent when comparing Fig. 13a to Fig. 7a is that the extent of BrC absorption is greatly constrained when BrC bleaching is incorporated in the model, especially in the tropics (Table 3). This is related to greater insolation in the tropics, leading to more OH formation and a more rapid BrC bleaching process (Eq. 4). Also, the direct effects associated with BF BrC are greatly reduced with bleaching such that significant effects over most of Asia do not occur.
BRC_BL REaci (Fig. 13b) shows some similar characteristics to BRC REaci (Fig. 7b). Some similar regions with negative REaci include the northeast Pacific, the south Australian coast, western South America, and near the southern tip of South America. Similar positive REaci regions include Australia, the Weddell Sea, parts of South America, the Gulf of Mexico, and off the coast of southern Africa. In most cases REaci due to aged BrC is smaller in magnitude than REaci without BrC aging. A notable exception to this is a strong warming signal in Fig. 13b over eastern China (∼3 W m−2). This correlates with a reduction in LWP over this region (−5 g m−2; Fig. S10g), which may also be related to enhanced atmospheric downwelling in this region (Fig. S11b). This indicates some of the nonlinear effects of BrC absorption reduction in the model simulations.
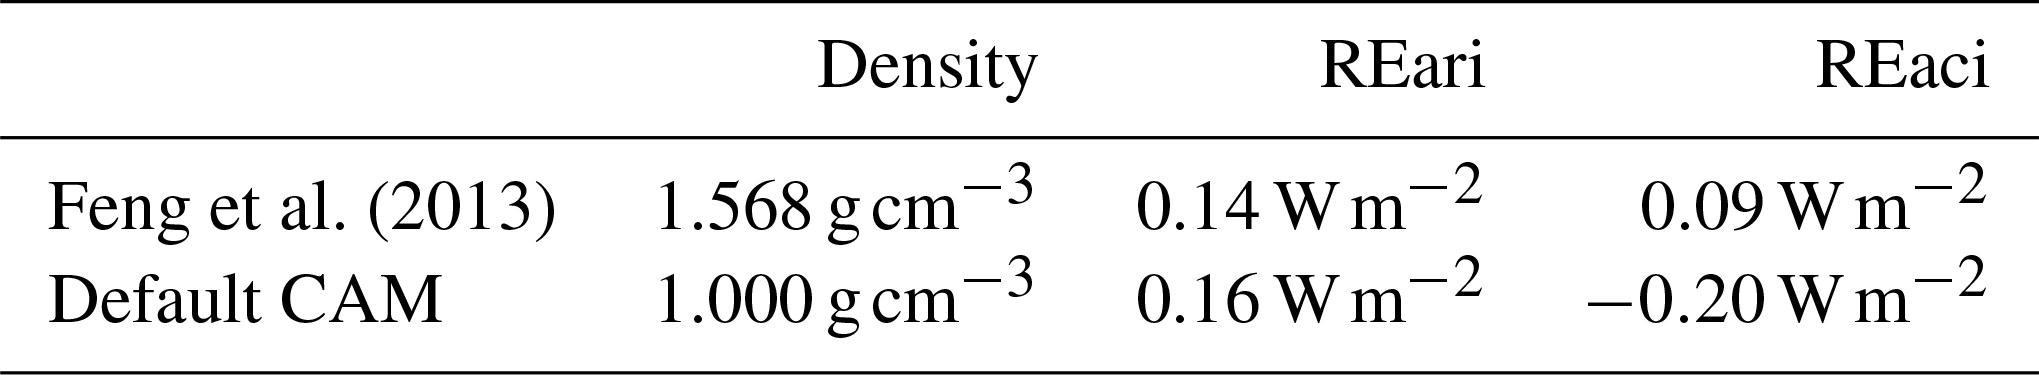
Table 5Comparison of different model runs for the year 2003 with varying OA density. The values are BB and BF OA density from Feng et al. (2013), and the default CAM OA properties (Hess et al., 1998). REari and REaci are annual averages calculated for the BRC_CNST model run.
3.7 Effects of changing OA density on REari and REaci
Another experiment to determine model sensitivity is a comparison of BRC_CNST model runs with altered input OA density for BB and BFs (Table 5). Species density is accessed in the model from the offline phys_prop files and is used to calculate the modal refractive index (Ghan and Zaveri, 2007) as well as calculate the number concentration of aerosols activated as cloud condensation nuclei (CCN) (Abdul-Razzak and Ghan, 2000). This is one of the few aerosol species physical properties used directly in the model code, as most of the aerosol physical properties are calculated for each aerosol mode. The inspiration for this comparison lies in the different values used by other modeling studies for OA density, ranging from 1 to ∼1.5 g cm−3. This comparison only looks at the densities used in the default CAM phys_prop file (from Hess et al., 1998) and the density of BB and BF OA used in Feng et al. (2013). Each model run is for the year 2003 and the REari and REaci are both 2003 annual averages.
By decreasing OA density, there is an increase in BrC REari. This is likely due to the use of inverse aerosol density (specific volume) when calculating the radiative effects of the internally mixed aerosol, with a smaller density indicating a larger specific volume and larger BrC absorption attributed to the mixed aerosol. Furthermore, given the same mass concentration and size distribution, an increase in density would reduce the number of particles per volume of air. This would reduce the aerosol optical depth and the RE. In Table 5, the sign on REaci changes dramatically depending on the density used, and is attributed to the alteration of the size of the modal aerosol and its droplet activation efficiency, as well as the number of particles at a given size distribution. The driving factor behind this difference is likely the number of particles per volume of air, which would result in a reduced cloud optical depth with fewer particles (i.e., higher density). A higher density aerosol will also lead to a smaller modal aerosol size, requiring a higher critical supersaturation, which results in lower activation of CCN and less cooling attributed to clouds. What this brief analysis indicates is that there is a need to better constrain OA physical properties if there are to be direct comparisons between simulations of OA radiative effects.
This study has shown that a BrC parameterization in CAM5.4 can bring about significant global radiative effects in CESM. Recent research working to detail the wavelength-dependent optical properties of BrC and its sources has led to its inclusion in chemical transport models and now Earth system models. This is an improvement to the models, which typically assume that OA is not a strong absorber of solar radiation. Furthermore, the incorporation of BrC in CESM allows for analysis of the semi-direct effects of BrC.
One of the first notable findings of this study is that incorporating BrC in CESM exacerbates underestimation of SSA in BB regions compared to AERONET observations. Model underestimation of SSA was found in Jiang et al. (2016) with the default CAM5.3 model. While also noting that the model underestimates BB AOD in the majority of the sites, Jiang et al. (2016) hypothesized that the underestimation of SSA may be due to the model emitting a lower ratio of scattering aerosols to absorbing aerosols than observed. In addition to the possibility of incorrect emission ratios, the model may also be emitting BB particles that are too large (Yu et al., 2016), which could increase absorption efficiency and decrease SSA. There is also evidence that emission inventories such as GFED 3.1 may underestimate small fire emissions (Werf et al., 2010; Kaiser et al., 2012), leading to model underestimation of absorption in these regions and compounding the model disagreement. Lastly, error introduced from the AERONET data processing for AOD measurement and SSA calculation may explain some of the disagreement between the model and observations. Identifying the cause of this problem would be an important step in improving the model in the future given that this stronger absorption is noted in both default and modified CAM code.
Where the BrC incorporation does improve the model compared to AERONET is in its AAE. This emphasizes that the incorporation of BrC in the model better represents aerosol optical properties observed in biomass burning regions. This comparison also revealed strong disagreement between CAM5.4 and AERONET AAEs over the Ascension Island site. This may be a factor of size distributions simulated in the model aging processes or of the AERONET cloud screening algorithms filtering out thick smoke days, and this requires further study. When comparing Mason et al. (2018) observations from Ascension Island, the BRC_BL AAE (1.25) has the best agreement to observations (1.16). Other observations show an underestimation of the AAE in the model over the United States, with improvement noted in the BrC model runs.
The model radiative effect calculations describe an overall warming effect due to BrC in the model as well as regional cooling and warming associated with the BrC semi-direct effect. The global BrC direct radiative effect (DRE; i.e., REari) is 0.13±0.01 W m−2. This value is very similar to the Feng et al. (2013) strongly absorbing BrC direct radiative forcing (DRF) of +0.11 W m−2 and the Saleh et al. (2015) core-shell mixing state BrC DRE of +0.12 W m−2. This effect is not negligible and is equivalent to more than half the BC DRE in CESM (0.25 W m−2; Jiang et al., 2016). That being said, incorporation of BrC bleaching in the model led to a significant reduction in globally averaged REari (0.06±0.008 W m−2). This value is quite similar to BrC DRE calculated with the same bleaching parameterization in the chemical transport model GEOS-Chem by Wang et al. (2018) (0.05 W m−2). The range in our in BrC REari is from 0 to 0.13 W m−2, representing the effect of emission of immediately bleached BrC (NOBRC) to no bleaching (BRC). Recent laboratory and observational studies have consistently shown BrC bleaching (Zhong and Jang, 2011, 2014; Lee et al., 2014; Forrister et al., 2015; Zhao et al., 2015; Wang et al., 2016), albeit with varying rates. More work needs to be done to validate bleaching parameterizations in global climate models, but the consistency in observations and the improvement of model performance with BrC bleaching (Wang et al., 2018) supports the inclusion of this parameterization in CESM. Furthermore, this study and that done by Wang et al. (2018) indicate that this process can lead to large differences in BrC direct radiative effects, indicating a smaller global effect due to BrC than has been previously reported in modeling studies.
Looking at the BrC semi-direct effects, the presence of BrC led to regional differences in REaci that spanned from about −2 to 2.5 W m−2, with an overall REaci of 0.01±0.04 W m−2 for the BRC model run. The REaci due to BrC with a bleaching parameter (i.e., BRC_BL model run) had a similar distribution, but many regions exhibited REaci of smaller magnitude and some regions exhibited REaci of larger magnitude. The global REaci for bleached BrC was very similar to the BRC model with a global average of 0.009±0.04 W m−2. These effects in both models may be due in part to increased lower tropospheric stability and increased relative humidity (−REaci), decreased entrainment aloft (−REaci), increased static stability and reduced convection (+REaci), and evaporation of cloud liquid due to absorbing cloud nuclei (+REaci) (Johnson et al., 2004; Sakaeda et al., 2011). However, perturbations in ω (Figs. 10j, 11j, 12b, S11b) suggest that the annual average REaci is due, to a large extent, to altered global circulations due to BrC. Changes in cloud cover, liquid water path, precipitation, and surface flux are also apparent with inclusion of BrC and are correlated with regional changes in REaci in some cases. However, the mechanisms behind BrC REaci in the model are still unclear due to the complex feedbacks leading to these changes, and nonlinear effects are present with a change in the distribution and magnitude of BrC absorption with the BrC bleaching parameter. Some of these uncertainties may be minimized with a nudged model run that minimizes the sensitivity of the model dynamics to the presence of BrC.
The impact of BrC deposition on snow albedo is not taken into account in this study and should be included before BrC REsac are considered. Another improvement to the model would be to incorporate this new BrC parameterization into the Snow, Ice, and Aerosol Radiative (SNICAR) model. The SNICAR model has been used in the CESM CLM to diagnose the BC-on-snow effect. This radiative effect has to do with the reduction in albedo of the snow surface due to deposited BC (Flanner et al., 2007). However, OA on snow is not treated in the SNICAR model, and studies have shown that BrC can have an important regional contribution to snow albedo reduction (Doherty et al., 2010).
In comparing the different methods of BrC implementation, BRC and BRC_CNST, we see similar behavior in the model. In Fig. 4, SSA agrees well between the two methods, with the exception of Arctic regions where BRC_CNST predicts slightly stronger absorption. This is likely due to a higher BC-to-OA ratio assumed for BRC_CNST than is seen in the fire emissions in the Arctic. One issue regarding the BRC_CNST implementation is that the model may be overestimating the effect of BrC in the sensitive Arctic regions due to its assumption of a higher BC-to-OA ratio than is typically observed.
This study also addresses different OA densities used in aerosol modeling studies, and how density affects the RE of BrC. The differing values used in the literature describe the uncertainty in prescribing density to OA. We argue that the variations in this value can lead to significant changes in aerosol direct radiative effect as well as aerosol–cloud interaction. A density of 1 g cm−3 can result in a 0.02 W m−2 higher global average REari than a density of 1.568 g cm−3. Changes in cloud microphysics as a result of changing aerosol density also have an effect on the radiative balance in the model, changing the sign of REaci from negative (1 g cm−3) to positive (1.568 g cm−3). Due to these effects it seems that deciding on OA physical properties would improve inter-model comparison of BrC radiative calculations.
The BrC improvements introduced in this study are a step towards increasing the accuracy of climate models and the information that they provide. There is also room to improve the accuracy of datasets that feed the model. For example, work done on the improvement of pre-industrial datasets suggests that BB emissions were higher and spatially different than pre-industrial datasets currently report (Douglas Hamilton, personal communication, 30 June 2017). This change would alter calculations of RF that have been done up to now, describing a different anthropogenic effect on the climate than our current understanding. Also, observational datasets looking at the vertical distribution of BrC in the atmosphere would help to determine whether the model is simulating similar processes to observations. This includes more information regarding the transport of BrC to upper levels by deep convection, and the in-cloud aqueous production of BrC (Zhang et al., 2017). GFED emission inventory accuracy is also important because the reported fuel type and location play a role in the model vertical injection heights of carbonaceous aerosols. More observations of BrC bleaching would help refine the bleaching parameterization used in this study by determining if there are geographic differences in the bleaching effect due to differences in solar irradiance. Lower BrC bleaching rates in the Arctic suggest important contributions from BrC deposition on snow. Including more measurements of the radiative effects of BrC impurities in snow could help in the validation of future models that include this surface effect. Lastly, measurements of combustion and non-combustion sources of BrC SOA, as well as their composition and evolution, could aid in the development of BrC SOA in CAM. These and the previously mentioned improvements to this study are steps towards improving the CESM and better understanding and predicting the effect that BrC has in the Earth system.
The fire emission data can be obtained from the Global Fire Emissions Database (GFED; http://www.globalfiredata.org, last access: 1 December 2018), and AERONET data can be obtained at http://aeronet.gsfc.nasa.gov, last access: 1 December 2018. Output files from the model runs are available on request from the corresponding authors. Source codes and model setups needed to repeat all simulations are also available upon request.
The supplement related to this article is available online at: https://doi.org/10.5194/acp-18-17745-2018-supplement.
HB, XL, YF, and YJ designed the experiment methodology. HB and XL performed the data analysis with input from YF, YJ, MW, ZL, CW, SM, and RP. HB wrote the paper with comments from all coauthors.
The authors declare that they have no conflict of interest.
This work was supported by the Environmental Protection Agency (EPA) grant
no. 83588301 as well as the Office of Science of the US Department of Energy
(DOE) as the NSF, DOE, and USDA Joint Earth System Modeling (EaSM) Program and the
Earth System Modeling Program. The authors would like to acknowledge the use
of computational resources (ark:/85065/d7wd3xhc) at the NCAR-Wyoming
Supercomputing Center provided by the National Science Foundation and the
State of Wyoming, and supported by NCAR's Computational and Information
Systems Laboratory. The authors would like to thank Manvendra Dubey and Dian Romonosky
from Los Alamos National Laboratory (LANL) for sharing their
biomass burning optical property data for model validation purposes.
Edited by: Kostas Tsigaridis
Reviewed by: three anonymous referees
Abdul-Razzak, H. and Ghan, S. J.: A parameterization of aerosol activation: 2. Multiple aerosol types, J. Geophys. Res., 105, 6837–6844, https://doi.org/10.1029/1999JD901161, 2000.
Abel, S. J., Highwood, E. J., Haywood, J. M., and Stringer, M. A.: The direct radiative effect of biomass burning aerosols over southern Africa, Atmos. Chem. Phys., 5, 1999–2018, https://doi.org/10.5194/acp-5-1999-2005, 2005.
Ackerman , A. S, Toon, O. B., Stevens, D. E., Heymsfield, A. J., Ramanathan, V., and Welton, E. J.: Reduction of Tropical Cloudiness by Soot, Science, 288, 1042–1047, https://doi.org/10.1126/science.288.5468.1042, 2000.
Adachi, K., Chung, S. H., and Buseck, P. R.: Shapes of soot aerosol particles and implications for their effects on climate, J. Geophys. Res.-Atmos., 115, D15206, https://doi.org/10.1029/2009JD012868, 2010.
Akagi, S. K., Yokelson, R. J., Wiedinmyer, C., Alvarado, M. J., Reid, J. S., Karl, T., Crounse, J. D., and Wennberg, P. O.: Emission factors for open and domestic biomass burning for use in atmospheric models, Atmos. Chem. Phys., 11, 4039–4072, https://doi.org/10.5194/acp-11-4039-2011, 2011.
Albani, S., Mahowald, N. M., Perry, A. T., Scanza, R. A., Zender, C. S., Heavens, N. G., Maggi, V., Kok, J. F., and Otto-Bliesner, B. L.: Improved dust representation in the Community Atmosphere Model, J. Adv. Model Earth Sy., 6, 541–570, https://doi.org/10.1002/2013MS000279, 2014.
Anderson, T. L., Charlson, R. J., Schwartz, S. E., Knutti, R., Boucher, O., Rodhe, H., and Heintzenberg, J.: Climate Forcing by Aerosol – a Hazy Picture, Science, 300, 1103–1104, https://doi.org/10.1126/science.1084777, 2003.
Andreas, E. L., Claffy, K. J., and Makshtas, A. P.: Low-Level Atmospheric Jets And Inversions Over The Western Weddell Sea, Bound.-Lay. Meteorol., 97, 459–486, https://doi.org/10.1023/A:1002793831076, 2000.
Bergstrom, R. W., Russell, P. B., and Hignett, P.: Wavelength Dependence of the Absorption of Black Carbon Particles: Predictions and Results from the TARFOX Experiment and Implications for the Aerosol Single Scattering Albedo, J. Atmos. Sci., 59, 567–577, https://doi.org/10.1175/1520-0469(2002)059<0567:WDOTAO>2.0.CO;2, 2002.
Bond, T. C.: Spectral Dependence of Visible Light Absorption by Carbonaceous Particles Emitted from Coal Combustion, Geophys. Res. Lett., 28, 4075–4078, https://doi.org/10.1029/2001GL013652, 2001.
Bond, T. C., Habib, G., and Bergstrom, R. W.: Limitations in the Enhancement of Visible Light Absorption due to Mixing State, J. Geophys. Res., 111, D20211, https://doi.org/10.1029/2006JD007315, 2006.
Bond, T. C., Doherty, S. J., Fahey, D. W., Forster, P. M., Berntsen, T., DeAngelo, B. J., Flanner, M. G., Ghan, S., Kärcher, B., Koch, D., Kinne, S., Kondo, Y., Quinn, P. K., Sarofim, M. C., Schultz, M. G., Schulz, M., Venkataraman, C., Zhang, H., Zhang, S., Bellouin, N., Guttikunda, S. K., Hopke, P. K., Jacobson, M. Z., Kaiser, J. W., Klimont, Z., Lohmann, U., Schwarz, J. P., Shindell, D., Storelvmo, T., Warren, S. G., and Zender, C. S.: Bounding the Role of Black Carbon in the Climate System: A Scientific Assessment, J. Geophys. Res.-Atmos., 118, 5380–5552, https://doi.org/10.1002/jgrd.50171, 2013.
Boucher, O., Randall, D., Artaxo, P., Bretherton, C., Feingold, G., Forster, P., Kerminen, V.-M., Kondo, Y., Liao, H., Lohmann, U., Rasch, P., Satheesh, S. K., Sherwood, S., Stevens, B., and Zhang, X. Y.: Clouds and Aerosols, in: Climate Change 2013: The Physical Science Basis. Contribution of Working Group I to the Fifth Assessment Report of the Intergovernmental Panel on Climate Change, edited by: Stocker, T. F., Qin, D., Plattner, G.-K., Tignor, M., Allen, S. K., Boschung, J., Nauels, A., Xia, Y., Bex, V., and Midgley, P. M., Cambridge University Press, Cambridge, United Kingdom and New York, NY, USA, 2013.
Cappa, C. D., Kolesar, K. R., Zhang, X., Atkinson, D. B., Pekour, M. S., Zaveri, R. A., Zelenyuk, A., and Zhang, Q.: Understanding the optical properties of ambient sub- and supermicron particulate matter: results from the CARES 2010 field study in northern California, Atmos. Chem. Phys., 16, 6511–6535, https://doi.org/10.5194/acp-16-6511-2016, 2016.
Chen, Y. and Bond, T. C.: Light absorption by organic carbon from wood combustion, Atmos. Chem. Phys., 10, 1773–1787, https://doi.org/10.5194/acp-10-1773-2010, 2010.
Dentener, F., Kinne, S., Bond, T., Boucher, O., Cofala, J., Generoso, S., Ginoux, P., Gong, S., Hoelzemann, J. J., Ito, A., Marelli, L., Penner, J. E., Putaud, J.-P., Textor, C., Schulz, M., van der Werf, G. R., and Wilson, J.: Emissions of primary aerosol and precursor gases in the years 2000 and 1750 prescribed data-sets for AeroCom, Atmos. Chem. Phys., 6, 4321–4344, https://doi.org/10.5194/acp-6-4321-2006, 2006.
Doherty, S. J., Warren, S. G., Grenfell, T. C., Clarke, A. D., and Brandt, R. E.: Light-absorbing impurities in Arctic snow, Atmos. Chem. Phys., 10, 11647–11680, https://doi.org/10.5194/acp-10-11647-2010, 2010.
Dubovik, O. and King, M. D.: A Flexible Inversion Algorithm for Retrieval of Aerosol Optical Properties from Sun and Sky Radiance Measurements, J. Geophys. Res.-Atmos., 105, 20673–20696, https://doi.org/10.1029/2000JD900282, 2000.
Dubovik, O., Smirnov, A., Holben, B. N., King, M. D., Kaufman, Y. J., Eck, T. F., and Slutsker, I.: Accuracy Assessments of Aerosol Optical Properties Retrieved from Aerosol Robotic Network (AERONET) Sun and Sky Radiance Measurements, J. Geophys. Res.-Atmos., 105, 9791–9806, https://doi.org/10.1029/2000JD900040, 2000.
Ervens, B., Turpin, B. J., and Weber, R. J.: Secondary organic aerosol formation in cloud droplets and aqueous particles (aqSOA): a review of laboratory, field and model studies, Atmos. Chem. Phys., 11, 11069–11102, https://doi.org/10.5194/acp-11-11069-2011, 2011.
Farina, S. C., Adams, P. J., and Pandis, S. N.: Modeling Global Secondary Organic Aerosol Formation and Processing with the Volatility Basis Set: Implications for Anthropogenic Secondary Organic Aerosol, J. Geophys. Res., 115, D09202, https://doi.org/10.1029/2009JD013046, 2010.
Feng, Y., Ramanathan, V., and Kotamarthi, V. R.: Brown carbon: a significant atmospheric absorber of solar radiation?, Atmos. Chem. Phys., 13, 8607–8621, https://doi.org/10.5194/acp-13-8607-2013, 2013.
Flanner, M. G., Zender, C. S., Randerson, J. T., and Rasch, P. J.: Present-Day Climate Forcing and Response from Black Carbon in Snow, J. Geophys. Res., 112, D11202, https://doi.org/10.1029/2006JD008003, 2007.
Forrister, H., Liu, J., Scheuer, E., Dibb, J., Ziemba, L., Thornhill, K. L., Anderson, B., Diskin, G., Perring, A. E., Schwarz, J. P., Campuzano-Jost, P., Day, D. A., Palm, B. B., Jimenez, J. L., Nenes, A., and Weber, R. J.: Evolution of brown carbon in wildfire plumes, Geophys. Res. Lett., 42, 4623–4630, https://doi.org/10.1002/2015GL063897, 2015.
Gettelman, A., Morrison, H., Santos, S., Bogenschutz, P., and Caldwell, P. M.: Advanced Two-Moment Bulk Microphysics for Global Models. Part II: Global Model Solutions and Aerosol–Cloud Interactions, J. Climate, 28, 1288–1307, https://doi.org/10.1175/JCLI-D-14-00103.1, 2015.
Ghan, S. J.: Technical Note: Estimating aerosol effects on cloud radiative forcing, Atmos. Chem. Phys., 13, 9971–9974, https://doi.org/10.5194/acp-13-9971-2013, 2013.
Ghan, S. J. and Zaveri, R. A.: Parameterization of Optical Properties for Hydrated Internally Mixed Aerosol, J. Geophys. Res., 112, D10201, https://doi.org/10.1029/2006JD007927, 2007.
Giglio, L., Randerson, J. T., and van der Werf, G. R.: Analysis of Daily, Monthly, and Annual Burned Area Using the Fourth-Generation Global Fire Emissions Database (GFED4), J. Geophys. Res.-Biogeo., 118, 317–328, https://doi.org/10.1002/jgrg.20042, 2013.
Hannay, C. and Neale, R.: CAM5.4 simulations: the good, the bad and the ugly, 20th Annual CESM Workshop, Breckenridge, Colorado, 15–18 June 2015.
Heald, C. L., Ridley, D. A., Kroll, J. H., Barrett, S. R. H., Cady-Pereira, K. E., Alvarado, M. J., and Holmes, C. D.: Contrasting the direct radiative effect and direct radiative forcing of aerosols, Atmos. Chem. Phys., 14, 5513–5527, https://doi.org/10.5194/acp-14-5513-2014, 2014.
Hess, M., Koepke, P., and Schult, I.: Optical Properties of Aerosols and Clouds: The Software Package OPAC, B. Am. Meteorol. Soc., 79, 831–844, https://doi.org/10.1175/1520-0477(1998)079<0831:OPOAAC>2.0.CO;2, 1998.
Jacobson, M. Z.: Isolating Nitrated and Aromatic Aerosols and Nitrated Aromatic Gases as Sources of Ultraviolet Light Absorption, J. Geophys. Res.-Atmos., 104, 3527–3542, https://doi.org/10.1029/1998JD100054, 1999.
Jacobson, M. Z.: A physically-based treatment of elemental carbon optics: Implications for global direct forcing of aerosols, Geophys. Res. Lett., 27, 217–220, https://doi.org/10.1029/1999GL010968, 2000.
Jacobson, M. Z.: Strong radiative heating due to the mixing state of black carbon in atmospheric aerosols, Nature, 409, 695–697, https://doi.org/10.1038/35055518, 2001.
Jiang, Y., Lu, Z., Liu, X., Qian, Y., Zhang, K., Wang, Y., and Yang, X.-Q.: Impacts of global open-fire aerosols on direct radiative, cloud and surface-albedo effects simulated with CAM5, Atmos. Chem. Phys., 16, 14805–14824, https://doi.org/10.5194/acp-16-14805-2016, 2016.
Jo, D. S., Park, R. J., Lee, S., Kim, S.-W., and Zhang, X.: A global simulation of brown carbon: implications for photochemistry and direct radiative effect, Atmos. Chem. Phys., 16, 3413–3432, https://doi.org/10.5194/acp-16-3413-2016, 2016.
Johnson, B. T., Shine, K. P., and Forster, P. M.: The Semi-Direct Aerosol Effect: Impact of Absorbing Aerosols on Marine Stratocumulus, Q. J. Roy. Meteor. Soc., 130, 1407–1422, https://doi.org/10.1256/qj.03.61, 2004.
Kaiser, J. W., Heil, A., Andreae, M. O., Benedetti, A., Chubarova, N., Jones, L., Morcrette, J.-J., Razinger, M., Schultz, M. G., Suttie, M., and van der Werf, G. R.: Biomass burning emissions estimated with a global fire assimilation system based on observed fire radiative power, Biogeosciences, 9, 527–554, https://doi.org/10.5194/bg-9-527-2012, 2012.
Kanakidou, M., Seinfeld, J. H., Pandis, S. N., Barnes, I., Dentener, F. J., Facchini, M. C., Van Dingenen, R., Ervens, B., Nenes, A., Nielsen, C. J., Swietlicki, E., Putaud, J. P., Balkanski, Y., Fuzzi, S., Horth, J., Moortgat, G. K., Winterhalter, R., Myhre, C. E. L., Tsigaridis, K., Vignati, E., Stephanou, E. G., and Wilson, J.: Organic aerosol and global climate modelling: a review, Atmos. Chem. Phys., 5, 1053–1123, https://doi.org/10.5194/acp-5-1053-2005, 2005.
Kirchstetter, T. W., Novakov, T., and Hobbs, P. V.: Evidence That the Spectral Dependence of Light Absorption by Aerosols Is Affected by Organic Carbon, J. Geophys., Res.-Atmos., 109, D21208, https://doi.org/10.1029/2004JD004999, 2004.
Koch, D. and Del Genio, A. D.: Black carbon semi-direct effects on cloud cover: review and synthesis, Atmos. Chem. Phys., 10, 7685–7696, https://doi.org/10.5194/acp-10-7685-2010, 2010.
Lamarque, J.-F., Bond, T. C., Eyring, V., Granier, C., Heil, A., Klimont, Z., Lee, D., Liousse, C., Mieville, A., Owen, B., Schultz, M. G., Shindell, D., Smith, S. J., Stehfest, E., Van Aardenne, J., Cooper, O. R., Kainuma, M., Mahowald, N., McConnell, J. R., Naik, V., Riahi, K., and van Vuuren, D. P.: Historical (1850–2000) gridded anthropogenic and biomass burning emissions of reactive gases and aerosols: methodology and application, Atmos. Chem. Phys., 10, 7017–7039, https://doi.org/10.5194/acp-10-7017-2010, 2010.
Lee, H. J., Aiona, P. K., Laskin, A., Laskin, J., and Nizkorodov, S. A.: Effect of Solar Radiation on the Optical Properties and Molecular Composition of Laboratory Proxies of Atmospheric Brown Carbon, Environ. Sci. Technol., 48, 10217–10226, https://doi.org/10.1021/es502515r, 2014.
Limbeck, A., Kulmala, M., and Puxbaum, H.: Secondary Organic Aerosol Formation in the Atmosphere via Heterogeneous Reaction of Gaseous Isoprene on Acidic Particles, Geophys. Res. Lett., 30, 1996, https://doi.org/10.1029/2003GL017738, 2003.
Lin, G., Penner, J. E., Flanner, M. G., Sillman, S., Xu, L., and Zhou, C.: Radiative Forcing of Organic Aerosol in the Atmosphere and on Snow: Effects of SOA and Brown Carbon, J. Geophys. Res.-Atmos., 119, 7453–7476, https://doi.org/10.1002/2013JD021186, 2014.
Liu, J., Scheuer, E., Dibb, J., Ziemba, L. D., Thornhill, K. L., Anderson, B. E., Wisthaler, A., Mikoviny, A., Devi, J. J., Bergin, M., and Weber, R. J.: Brown Carbon in the Continental Troposphere, Geophys. Res. Lett., 41, 2191–2195, https://doi.org/10.1002/2013GL058976, 2014.
Liu, J., Scheuer, E., Dibb, J., Diskin, G. S., Ziemba, L. D., Thornhill, K. L., Anderson, B. E., Wisthaler, A., Mikoviny, T., Devi, J. J., Bergin, M., Perring, A. E., Markovic, M. Z., Schwarz, J. P., Campuzano-Jost, P., Day, D. A., Jimenez, J. L., and Weber, R. J.: Brown carbon aerosol in the North American continental troposphere: sources, abundance, and radiative forcing, Atmos. Chem. Phys., 15, 7841–7858, https://doi.org/10.5194/acp-15-7841-2015, 2015.
Liu, S., Aiken, A. C., Arata, C., Dubey, M. K., Stockwell, C. E., Yokelson, R. J., Stone, E. A., Jayarathne, T., Robinson, A. L., DeMott, P. J., and Kreidenweis, S. M.: Aerosol single scattering albedo dependence on biomass combustion efficiency: Laboratory and field studies, Geophys. Res. Lett., 41, 742–748, https://doi.org/10.1002/2013GL058392, 2014.
Liu, S., Aiken, A. C., Gorkowski, K., Dubey, M. K., Cappa, C. D., Williams, L. R., Herndon, S. C., Massoli, P., Fortner, E. C., Chhaabra, P. S., Brooks, W. A., Onasch, T. B., Jayne, J. T., Worsnop, D. R., China, S., Sharma, N., Mazzoleni, C., Xu, L., Ng, N. L., Liu, D., Allan, J. D., Fleming, Z. L., Mohr, C., Zotter, P., Szidat, S., and Prevot, A. S. H.: Enhanced Light Absorption by Mixed Source Black and Brown Carbon Particles in UK Winter, Nat. Commun., 6, 8435, https://doi.org/10.1038/ncomms9435, 2015.
Liu, X., Easter, R. C., Ghan, S. J., Zaveri, R., Rasch, P., Shi, X., Lamarque, J.-F., Gettelman, A., Morrison, H., Vitt, F., Conley, A., Park, S., Neale, R., Hannay, C., Ekman, A. M. L., Hess, P., Mahowald, N., Collins, W., Iacono, M. J., Bretherton, C. S., Flanner, M. G., and Mitchell, D.: Toward a minimal representation of aerosols in climate models: description and evaluation in the Community Atmosphere Model CAM5, Geosci. Model Dev., 5, 709–739, https://doi.org/10.5194/gmd-5-709-2012, 2012.
Liu, X., Ma, P.-L., Wang, H., Tilmes, S., Singh, B., Easter, R. C., Ghan, S. J., and Rasch, P. J.: Description and evaluation of a new four-mode version of the Modal Aerosol Module (MAM4) within version 5.3 of the Community Atmosphere Model, Geosci. Model Dev., 9, 505–522, https://doi.org/10.5194/gmd-9-505-2016, 2016.
Lu, Zh., Liu, X., Zhang, Z., Zhao, C., Meyer, K., Rajapakshe, C., Wu, C., Yang, Z., and Penner, J. E.: Biomass smoke from southern Africa can significantly enhance the brightness of stratocumulus over the southeastern Atlantic Ocean, P. Natl. Acad. Sci. USA, 115, 2924–2929, https://doi.org/10.1073/pnas.1713703115, 2018.
Lu, Zi., Streets, D. G., Winijkul, E., Yan, F., Chen, Y., Bond, T. C., Feng, Y., Dubey, M. K., Liu, S., Pinto, J. P., and Carmichael, G. R.: Light Absorption Properties and Radiative Effects of Primary Organic Aerosol Emissions, Environ. Sci. Technol., 49, 4868–4877, https://doi.org/10.1021/acs.est.5b00211, 2015.
Mason, B., Wagner, N. L., Adler, G., Andrews, E., Brock, C. A., Gordon, T. D., Lack, D. A., Perring, A. E., Richardson, M. S., Schwarz, J. P., Shook, M. A., Thornhill, K. L., Ziemba, L. D., and Murphy, D. M.: An intercomparison of aerosol absorption measurements conducted during the SEAC4RS campaign, Aerosol Sci. Technol., 52, 1012–1027, https://doi.org/10.1080/02786826.2018.1500012, 2018.
Mendes, D., Souza, E. P., Trigo, I. F., and Miranda, P. M. A.: On Precursors of South American Cyclogenesis, Tellus A., 59, 114–121, https://doi.org/10.1111/j.1600-0870.2006.00215.x, 2007.
Morrison, H. and Gettelman, A.: A New Two-Moment Bulk Stratiform Cloud Microphysics Scheme in the Community Atmosphere Model, Version 3 (CAM3). Part I: Description and Numerical Tests, J. Climate, 21, 3642–3659, https://doi.org/10.1175/2008JCLI2105.1, 2008.
Myhre, G., Shindell, D., Bréon, F.-M., Collins, W., Fuglestvedt, J., Huang, J., Koch, D., Lamarque, J.-F., Lee, D., Mendoza, B., Nakajima, T., Robock, A., Stephens, G., Takemura, T., and Zhang, H.: Anthropogenic and Natural Radiative Forcing, in: Climate Change 2013: The Physical Science Basis. Contribution of Working Group I to the Fifth Assessment Report of the Intergovernmental Panel on Climate Change, edited by: Stocker, T. F., Qin, D., Plattner, G.-K., Tignor, M., Allen, S. K., Boschung, J., Nauels, A., Xia, Y., Bex, V., and Midgley, P. M., Cambridge University Press, Cambridge, United Kingdom and New York, NY, USA, 2013.
Nakayama, T., Sato, K., Matsumi, Y., Imamura, T., Yamazaki, A., and Uchiyama, A.: Wavelength and NOx dependent complex refractive index of SOAs generated from the photooxidation of toluene, Atmos. Chem. Phys., 13, 531–545, https://doi.org/10.5194/acp-13-531-2013, 2013.
Neale, R. B., Chen, C. C., Gettelman, A., Lauritzen, P. H., Park, S., Williamson, D. L., Conley, A. J., Garcia, R., Kinnison, D., Lamarque, J. F., Marsh, D., Mills, M., Smith, A. K., Tilmes, S., Vitt, F., Cameron-Smith, P., Collins, W. D., Iacono, M. J., Easter, R. C., Ghan, S. J., Liu, X., Rasch, P. J., and Taylor, M. A.: Description of the NCAR Community Atmosphere Model (CAM5.0), Tech. Rep. NCAR/TN-486+STR, National Center for Atmospheric Research, Boulder, CO, USA, 2012.
Oleson, K. W., Lawrence, D. M., Bonan, G. B., Flanner, M. G., Kluzek, E., Lawrence, P. J., Levis, S., Swenson, S. C., Thornton, P. E., Dai, A., Decker, M., DIckinson, R., Feddema, J., Heald, C. L., Hoffman, F., Lamarque, J. F., Mahowald, N., Niu, G.-Y., Qian, T., Randerson, J., Running, S., Sakaguchi, K., Slater, A., Stockli, R., Wang, A., Yang, Z.-L., Zeng, X., and Zeng, X.: Technical description of version 4.0 of the Community Land Model, NCAR Tech. Note NCAR/TN-478+STR, https://doi.org/10.5065/D6FB50WZ, 2010.
Patterson, E. M. and McMahon C. K.: Absorption Characteristics of Forest Fire Particulate Matter, Atmos. Environ., 18, 2541–2551, https://doi.org/10.1016/0004-6981(84)90027-1, 1984.
Penner, J. E., Zhang, S. Y., and Chuang, C. C.: Soot and smoke aerosol may not warm climate, J. Geophys. Res.-Atmos., 108, 4657, https://doi.org/10.1029/2003JD003409, 2003.
Perlwitz, J. and Miller, R. L.: Cloud Cover Increase with Increasing Aerosol Absorptivity: A Counterexample to the Conventional Semidirect Aerosol Effect, J. Geophys. Res.-Atmos., 115, D08203, https://doi.org/10.1029/2009JD012637, 2010.
Pokhrel, R. P., Wagner, N. L., Langridge, J. M., Lack, D. A., Jayarathne, T., Stone, E. A., Stockwell, C. E., Yokelson, R. J., and Murphy, S. M.: Parameterization of single-scattering albedo (SSA) and absorption Ångström exponent (AAE) with EC∕OC for aerosol emissions from biomass burning, Atmos. Chem. Phys., 16, 9549–9561, https://doi.org/10.5194/acp-16-9549-2016, 2016.
Pokhrel, R. P., Beamesderfer, E. R., Wagner, N. L., Langridge, J. M., Lack, D. A., Jayarathne, T., Stone, E. A., Stockwell, C. E., Yokelson, R. J., and Murphy, S. M.: Relative importance of black carbon, brown carbon, and absorption enhancement from clear coatings in biomass burning emissions, Atmos. Chem. Phys., 17, 5063–5078, https://doi.org/10.5194/acp-17-5063-2017, 2017.
Reid, J. S., Hobbs, P. V., Ferek, R. J., Blake, D. R., Martins, J. V., Dunlap, M. R., and Liousse, C.: Physical, Chemical, and Optical Properties of Regional Hazes Dominated by Smoke in Brazil, J. Geophys. Res.-Atmos., 103, 32059–32080, https://doi.org/10.1029/98JD00458, 1998.
Romonosky D., Gomez, S., Lam, J., Carrico, C., Aiken, A., Chylek, P., and Dubey, M.: Optical Properties of Laboratory and Ambient Biomass Burning Aerosols: Elucidating the Black, Brown, and Organic Carbon Components and Mixing Regimes, J. Geophys. Res.-Atmos., in review, 2018.
Sakaeda, N., Wood, R., and Rasch, P. J.: Direct and Semidirect Aerosol Effects of Southern African Biomass Burning Aerosol, J. Geophys. Res., 116, D12205, https://doi.org/10.1029/2010JD015540, 2011.
Saleh, R., Robinson, E. S., Tkacik, D. S., Ahern, A. T., Liu, S., Aiken, A. C., Sullivan, R. C., Presto, A. A., Dubey, M. K., Yokelson, R. J., Donahue, N. M., and Robinson, A., L.: Brownness of Organics in Aerosols from Biomass Burning Linked to Their Black Carbon Content, Nat. Geosci., 7, 647–650, https://doi.org/10.1038/ngeo2220, 2014.
Saleh, R., Marks, M., Heo, J., Adams, P. J., Donahue, N. M., and Robinson, A. L.: Contribution of Brown Carbon and Lensing to the Direct Radiative Effect of Carbonaceous Aerosols from Biomass and Biofuel Burning Emissions, J. Geophys. Res.-Atmos., 120, 2015JD023697, https://doi.org/10.1002/2015JD023697-T, 2015.
Shrivastava, M., Easter, R. C., Liu, X., Zelenyuk, A., Singh, B., Zhang, K., Ma, P.-L., Chand, D., Ghan, S., Jimenez, J. L., Zhang, Q., Fast, J., Rasch, P. J., and Tiitta, P.: Global transformation and fate of SOA: Implications of low-volatility SOA and gas-phase fragmentation reactions: Global Modeling of SOA, J. Geophys. Res.-Atmos., 120, 4169–4195, https://doi.org/10.1002/2014JD022563, 2015.
Smirnov, A., Holben, B. N., Eck, T. F., Dubovik, O., and Slutsker, I.: Cloud-Screening and Quality Control Algorithms for the AERONET Database, Remote Sens. Environ., 73, 337–349, https://doi.org/10.1016/S0034-4257(00)00109-7, 2000.
van der Werf, G. R., Randerson, J. T., Giglio, L., Collatz, G. J., Mu, M., Kasibhatla, P. S., Morton, D. C., DeFries, R. S., Jin, Y., and van Leeuwen, T. T.: Global fire emissions and the contribution of deforestation, savanna, forest, agricultural, and peat fires (1997–2009), Atmos. Chem. Phys., 10, 11707–11735, https://doi.org/10.5194/acp-10-11707-2010, 2010.
van der Werf, G. R., Randerson, J. T., Giglio, L., van Leeuwen, T. T., Chen, Y., Rogers, B. M., Mu, M., van Marle, M. J. E., Morton, D. C., Collatz, G. J., Yokelson, R. J., and Kasibhatla, P. S.: Global fire emissions estimates during 1997–2016, Earth Syst. Sci. Data, 9, 697–720, https://doi.org/10.5194/essd-9-697-2017, 2017.
Wang, X., Heald, C. L., Ridley, D. A., Schwarz, J. P., Spackman, J. R., Perring, A. E., Coe, H., Liu, D., and Clarke, A. D.: Exploiting simultaneous observational constraints on mass and absorption to estimate the global direct radiative forcing of black carbon and brown carbon, Atmos. Chem. Phys., 14, 10989–11010, https://doi.org/10.5194/acp-14-10989-2014, 2014.
Wang, X., Heald, C. L., Sedlacek, A. J., de Sá, S. S., Martin, S. T., Alexander, M. L., Watson, T. B., Aiken, A. C., Springston, S. R., and Artaxo, P.: Deriving brown carbon from multiwavelength absorption measurements: method and application to AERONET and Aethalometer observations, Atmos. Chem. Phys., 16, 12733–12752, https://doi.org/10.5194/acp-16-12733-2016, 2016.
Wang, X., Heald, C. L., Liu, J., Weber, R. J., Campuzano-Jost, P., Jimenez, J. L., Schwarz, J. P., and Perring, A. E.: Exploring the observational constraints on the simulation of brown carbon, Atmos. Chem. Phys., 18, 635–653, https://doi.org/10.5194/acp-18-635-2018, 2018.
Wang, Y., Liu, X., Hoose, C., and Wang, B.: Different contact angle distributions for heterogeneous ice nucleation in the Community Atmospheric Model version 5, Atmos. Chem. Phys., 14, 10411–10430, https://doi.org/10.5194/acp-14-10411-2014, 2014.
Yu, P., Toon, O. B., Bardeen, C. G., Bucholtz, A., Rosenlof, K. H., Saide, P. E., Da Silva, A., Ziemba, L. D., Thornhill, K. L., Jimenez, J.-L., Campuzano-Jost, P., Schwarz, J. P., Perring, A. E., Froyd, K. D., Wagner, N. L., Mills, M. J., and Reid, J. S.: Surface Dimming by the 2013 Rim Fire Simulated by a Sectional Aerosol Model: Rim 85 Fire Simulation, J. Geophys. Res.-Atmos., 121, 7079–7087, https://doi.org/10.1002/2015JD024702, 2016.
Zhang, Y., Forrister, H., Liu, J., Dibb, J., Anderson, B., Schwarz, J. P., Perring, A. E., Jimenez, J. L., Campuzano-Jost, P., Wang, Y., Nenes, A., and Weber, R. J.: Top-of-atmosphere radiative forcing affected by brown carbon in the upper troposphere, Nat. Geosci., 10, 486–489, https://doi.org/10.1038/ngeo2960, 2017.
Zhang, Z., Meyer, K., Yu, H., Platnick, S., Colarco, P., Liu, Z., and Oreopoulos, L.: Shortwave direct radiative effects of above-cloud aerosols over global oceans derived from 8 years of CALIOP and MODIS observations, Atmos. Chem. Phys., 16, 2877–2900, https://doi.org/10.5194/acp-16-2877-2016, 2016.
Zhao, R., Lee, A. K. Y., Huang, L., Li, X., Yang, F., and Abbatt, J. P. D.: Photochemical processing of aqueous atmospheric brown carbon, Atmos. Chem. Phys., 15, 6087–6100, https://doi.org/10.5194/acp-15-6087-2015, 2015.
Zhong, M. and Jang, M.: Light absorption coefficient measurement of SOA using a UV–Visible spectrometer connected with an integrating sphere, Atmos. Environ., 45, 4263–4271, https://doi.org/10.1016/j.atmosenv.2011.04.082, 2011.
Zhong, M. and Jang, M.: Dynamic light absorption of biomass-burning organic carbon photochemically aged under natural sunlight, Atmos. Chem. Phys., 14, 1517–1525, https://doi.org/10.5194/acp-14-1517-2014, 2014.
Zuidema, P., Sedlacek, A. J., Flynn, C., Springston, S., Delgadillo, R., Zhang, J., Aiken, A. C., Koontz, A., and Muradyan, P.: The Ascension Island Boundary Layer in the Remote Southeast Atlantic is Often Smoky, Geophys. Res. Lett., 45, 4456–4465, https://doi.org/10.1002/2017GL076926, 2018.