the Creative Commons Attribution 4.0 License.
the Creative Commons Attribution 4.0 License.
 | 13 Dec 2018
Large contrast in the vertical distribution of aerosol optical properties and radiative effects across the Indo-Gangetic Plain during the SWAAMI–RAWEX campaign
Surendran Nair Suresh Babu
Venugopalan Jayachandran
Mukunda M. Gogoi
Naduparambil Bharathan Lakshmi
Krishnaswamy Krishna Moorthy
Sreedharan Krishnakumari Satheesh
Measurements of the vertical profiles of the optical properties (namely the extinction coefficient and scattering and absorption coefficients respectively σext ∕ σscat ∕ σabs) of aerosols have been made across the Indo-Gangetic Plain (IGP) using an instrumented aircraft operated from three base stations – Jodhpur (JDR), representing the semi-arid western IGP; Varanasi (VNS), the central IGP characterized by significant anthropogenic activities; and the industrialized coastal location in the eastern end of the IGP (Bhubaneswar, BBR) – just prior to the onset of the Indian summer monsoon. The vertical profiles depicted region-specific absorption characteristics, while the scattering characteristics remained fairly uniform across the region, leading to a west–east gradient in the vertical structure of single-scattering albedo (SSA). Integrated from near the ground to 3 km, the highest absorption coefficient and hence the lowest SSA occurred in the central IGP (Varanasi). Size distribution, inferred from the spectral variation of the scattering coefficient, showed a gradual shift from coarse-particle dominance in the western IGP to strong accumulation dominance in the eastern coast with the central IGP coming in between, arising from a change in the aerosol type from a predominantly natural (dust and sea salt) type in the western IGP to a highly anthropogenic type (industrial emissions, fossil fuel and biomass combustion) in the eastern IGP, with the central IGP exhibiting a mixture of both. Aerosol-induced short-wave radiative forcing, estimated using altitude-resolved SSA information, revealed significant atmospheric warming in the central IGP, while a top-of-atmosphere cooling is seen, in general, in the IGP. Atmospheric heating rate profiles, estimated using altitude-resolved SSA and column-averaged SSA, revealed considerable underestimation in the latter case, emphasizing the importance and necessity of having altitude-resolved SSA information as against a single value for the entire column.
- Article
(4131 KB) - Full-text XML
-
Supplement
(694 KB) - BibTeX
- EndNote


Ground-based, as well as space-borne observations, have established that the Indo-Gangetic Plain (IGP) (the vast stretch of apparently contiguous plain land along the east–west with an area of approximately 7 million km2 bounded between the Iranian Plateau to the west, the Bay of Bengal to the east, the Himalayas to the north and Chota Nagpur Plateau and Aravalli ranges to the south) remains one of the aerosol hotspots in the world, depicting persistently high aerosol loading (Babu et al., 2013; Gautam et al., 2010; Dey and Di Girolamo, 2010), especially during the dry winter and pre-monsoon seasons. The increasing demographic pressure (being one of the most densely populated regions of the world), large-scale agricultural activities (among the world's most intense farming areas), consequent high demand on energy (approximately 70 % of the coal-fired thermal power plants of India are located in this region) and extensive industrial activities (steel mills, cement factories, manufacturing units and a number of small- and medium-scale industries) are believed to be leading to consistently increasing anthropogenic emissions and hence a persistent increasing trend in the aerosol loading as reported in Babu et al. (2013). The loose alluvial soil, which is characteristic of this region, and the semi-arid and arid regions along its western part including the Thar Desert, and the prevailing complex meteorology with extreme temperatures and dry winds (except during the Indian summer monsoon (ISM) season) contribute their share of natural mineral aerosols. The peculiar topography of this region, which slopes down from west to east and is bound on either side by the Himalayas to the north and the Deccan Plateau to the south, leading to a narrowing of its width from west to east, aids in spatially confining and channelling these emissions until they are flushed out to the Bay of Bengal. All the above make this region a cauldron of complex aerosol types (Moorthy et al., 2016 and references there in), which have been attracting immense scientific interest from environmental and climate scientists because of the known complex climate implications (Gautam et al., 2009, 2010; Lau and Kim, 2010; Lal et al., 2013; Das et al., 2015a).
Recent studies using in situ and remote-sensing methods have shown a springtime enhancement in the aerosol optical depth and black carbon (BC) concentration in the lower free troposphere (below 5 km) over the plains and also over the Himalayas (Prijith et al., 2016; Kompalli et al., 2016; Gogoi et al., 2014), and a northward-increasing gradient in the amplitude and altitude of the aerosol-induced atmospheric heating (Satheesh et al., 2008). In a recent study, Nair et al. (2016) have found a large enhancement in aerosol absorption in the lower free troposphere over the IGP during spring. Enhanced absorption by these climatically critical and highly absorbing elevated aerosols would have significant radiative implications. A very recent work, synergizing these measurements with models and satellite data (Govardhan et al., 2017) has highlighted the potential of these elevated absorbing aerosols to aggravate stratospheric ozone loss or in delaying the recovery of ozone depletion in the past. Sarangi et al. (2016) reported enhanced stability of the lower free troposphere due to these elevated aerosols over the IGP, while Dipu et al. (2013) found an alteration in cloud water content due to these layers.
Dust aerosols are significant contributors to elevated aerosol load over the IGP during the pre-monsoon season (PMS) (Gautam et al., 2010) and along with BC constitute the major absorbing aerosol species. Desert dust aerosols from the Arabian and Thar Desert regions, driven by winds across the IGP, are found to form elevated layers of dust around 850 hPa and above (Das et al., 2013). Studies have revealed the absorbing nature of this dust (in contrast to their Saharan counterpart) (Moorthy et al., 2007), which is attributed to the Fe (iron) enrichment in the aerosols advected from Thar Desert and adjoining semi-arid regions (Srinivas and Sarin, 2013). Modelling studies have shown a teleconnection between the advected dust and Indian summer monsoon (ISM) (Vinoj et al., 2014). Padmakumari et al. (2013) suggested that the potential role of these aerosols is to act as ice nuclei.
However, most of the impact assessments of aerosols over this region have used optical properties of aerosols, especially the most important parameter, the single-scattering albedo (SSA), derived either indirectly (Ramachandran et al., 2006) or from surface measurements (Ram et al., 2016), while information on the vertical structure of the optical properties (scattering, absorption, SSA) has been very sparse. This information is very important to accurately estimate the vertical structure of atmospheric heating rate resulting from absorption by aerosols. This is also necessitated by the fact that, for a given amount of absorbed solar radiation, more heating would be produced if the absorbing species was higher in the atmosphere, due to the lower density of air at higher altitudes, and trigger local convection. Knowledge of aerosol properties prior to the onset of the ISM is also essential for delineating the role of aerosols as cloud condensation nuclei and their impact on cloud formation, properties and associated precipitation. With this objective, an Indo–UK field campaign, South West Asian Aerosol Monsoon Interactions (SWAAMI), has been formulated to be carried out during the onset phase of the ISM jointly with the Regional Aerosol Warming Experiment (RAWEX) being pursued in India under the ARFI project of ISRO's Geosphere Biosphere Programme. One of the main aims was to characterize the vertical structure of aerosol radiative properties and estimate its impact on atmospheric thermal structure in the IGP. For this, extensive airborne measurements of the extinction, scattering and absorption coefficients (respectively σext ∕ σscat ∕ σabs) were carried out across the IGP (from west to east) from three base stations in the west, centre and east. The details are provided in this paper, followed by a presentation of the results and estimation of the short-wave aerosol radiative forcing and vertical profile of aerosol-induced atmospheric heating rates. These results are examined in light of available information and the implications are discussed.
2.1 Campaign details
During the field experiment, the vertical structure of aerosol optical properties were measured using an instrumented aircraft (Beechcraft, B200 of the National Remote Sensing Centre (NRSC) of the Indian Space Research Organisation – ISRO) from 1 to 20 June 2016, just before the onset of the ISM. The vertical profiling have been carried out from three base stations, Jodhpur (JDR), Varanasi (VNS) and Bhubaneswar (BBR), representing respectively the western (arid), central (anthropogenic) and eastern (industrialized coastal) IGP. The geographical locations of these stations are shown by the solid circles in Fig. 1, which also shows the mean wind field at 850 hPa that prevailed during the campaign period. The flight tracks over each of these locations are superimposed and shown in colour-coded form JDR (green), VNS (red) and BBR (blue). Five sorties each were made (on consecutive days or in close succession) at Bhubaneswar and Varanasi, while four sorties were made from Jodhpur; the dates of sorties from each station are detailed in Table 1 along with the base station details and the measurement details. Each sortie took ∼ 3.5 h, in view of the endurance of the aircraft (∼ 4 h) flying in the unpressurized mode and comprised of measurements at six vertical levels (500, 1000, 1500, 2000, 2500 and 3000 m a.g.l.; above mean ground level); a typical profiling path is shown in Fig. 2. After taking off from the base station, the aircraft reached the desired flight level, and after stabilizing the attitude, measurements were made to ensure a minimum duration of 25 min before the aircraft climbed to the next level. For the present analysis, 5 min of measurements were removed as a precaution after a stable level was achieved. This was done in order to avoid any spurious measurements due to a sudden change in the course of a flight. It was found that, due to the occasional appearance of clouds, aerosol number concentration increased from otherwise stable values. In order to remove such unavoidable incidences from influencing aerosol properties, 2σ criteria was applied wherein data points at a particular level lying outside 2σ values of the level average were removed. Overall, < ∼ 3 % of the measurements were screened out due to this criteria. The measurements were then repeated at the new level after the aircraft had stabilized its attitude. In this way, 20 min of useful data was ensured at each level. After measurement at the last level, the aircraft returned to the base station. All the aircraft sorties, at all the sites, were made between ∼ 10:00 and 14:00 IST (Indian Standard Time). This was done in order to ensure that the convective boundary layer is evolved, aerosols are well mixed within the column, and there is no residual layer aloft. Planetary boundary layer (PBL) heights were obtained for the flight sortie days from the NCEP/NCAR global reanalysis product at 0.25 × 0.25∘ grid resolution data. Mean PBL heights, at local noon time, over the IGP regions for the campaign period were 1.3 ± 0.5 km for JDR (western IGP), 2.3 ± 0.5 km for VNS (central IGP), and 1.4 ± 0.2 km for BBR (eastern IGP).
Near the ground, at 0–200 m, data represent measurements when aircraft altitude was below 200 m, as confirmed from Global Positioning System (GPS) data. Near-ground data duration was between 3 to 8 min each day. The measurement track had a horizontal span of ∼ 150 km and the region of measurement was within 300 km diameter circle centred at the base station. Details of the flight configuration are available in earlier papers (e.g. for Babu et al., 2016; Moorthy et al., 2004; Nair et al., 2016).
Table 1Details of the stations and dates on which flight sorties were launched and instruments were operated.

* CAPS PMex: Cavity Attenuated Phase Shift Extinction Monitor, CPC: condensation particle counter, APS: Aerodynamic Particle Sizer, CCNc: cloud condensation nuclei counter, GPS: Global Positioning System.
All the aerosol instruments aspirated ambient air through a shrouded solid diffuser inlet, configured as detailed in Babu et al. (2016), which maintained isokinetic flow, and the air was supplied to the instruments through isokinetic flow splitters. The inlet was connected to an external pump that maintained a volumetric flow of 70 L min−1 (litres per minute). More details are available in Babu et al. (2016) and references therein.
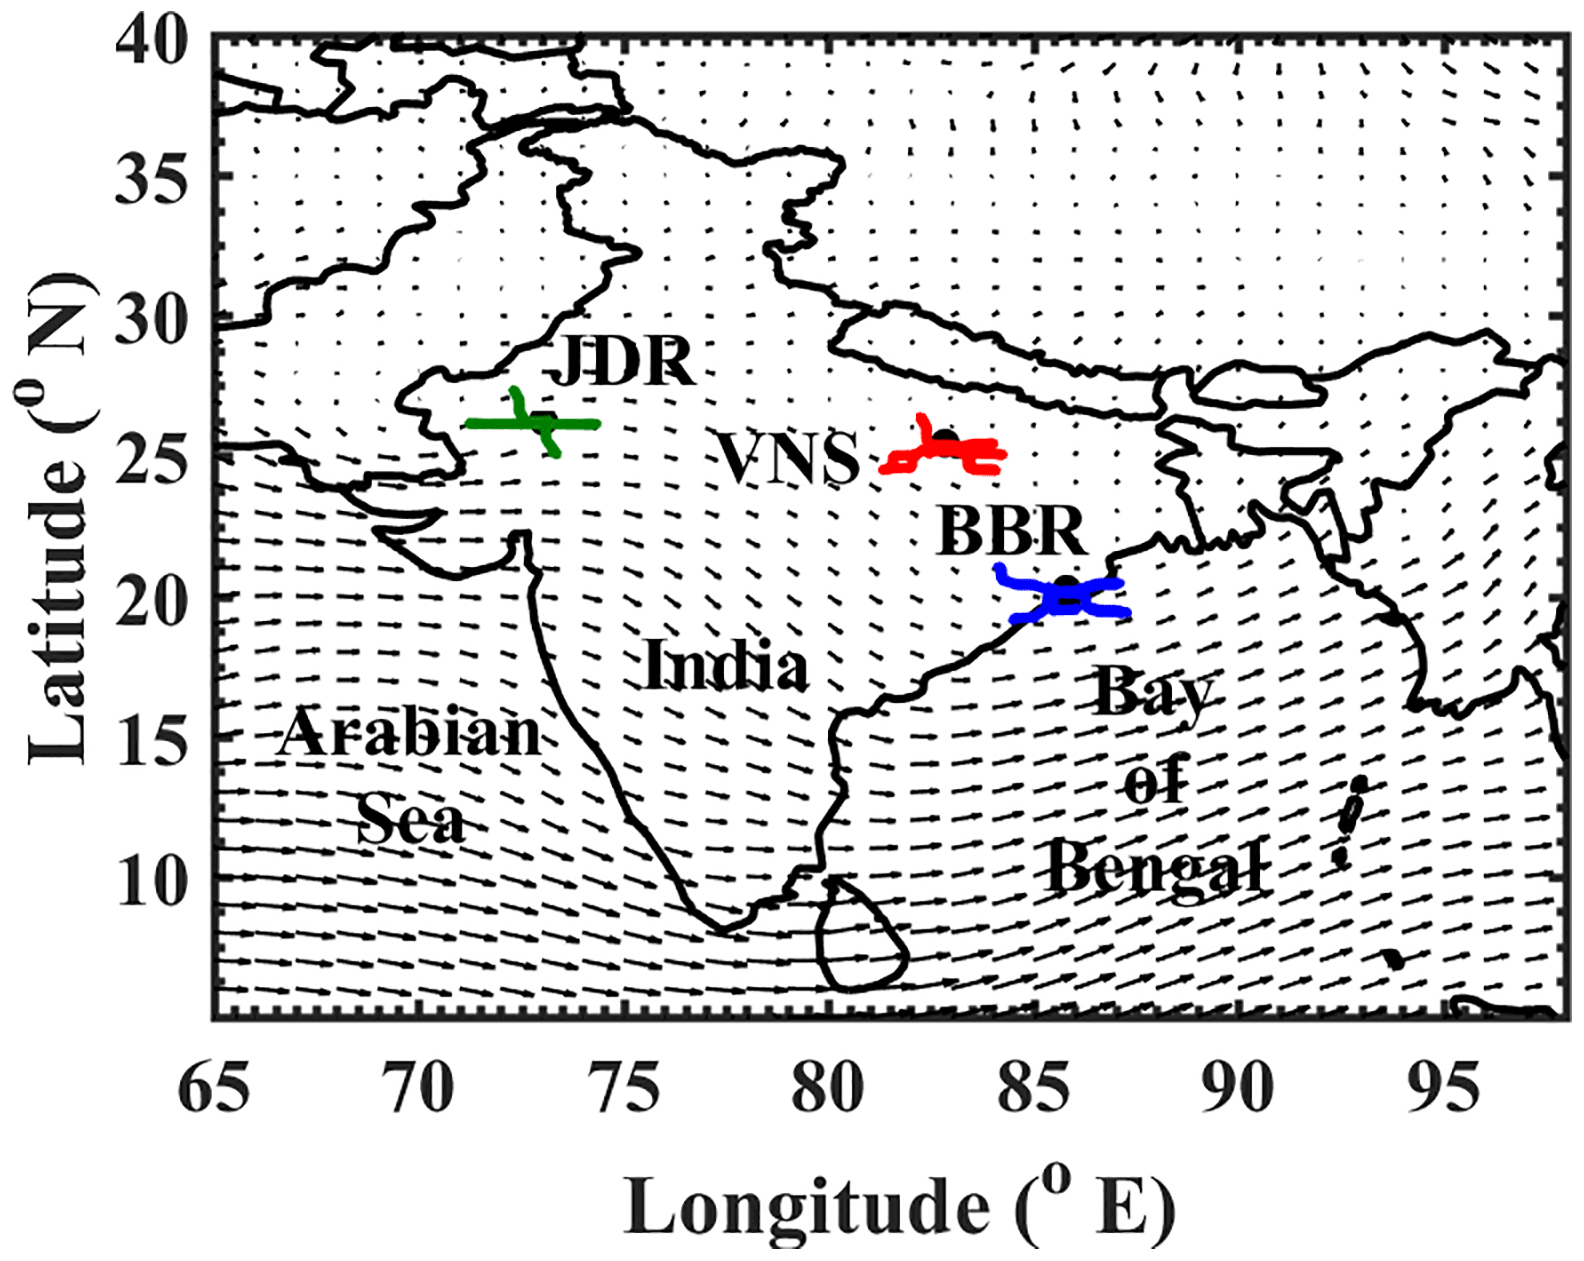
Figure 1Geographical location of the aircraft campaign stations (solid circle) in the Indo-Gangetic Plain superimposed on the mean wind field at 850 hPa during the campaign period. JDR, VNS and BBR stand for Jodhpur, Varanasi and Bhubaneswar. Daily flight tracks are superimposed on the stations JDR (green), VNS (red) and BBR (blue) from left to right. Each measurement track has a horizontal span of ∼ 150 km from the base station.
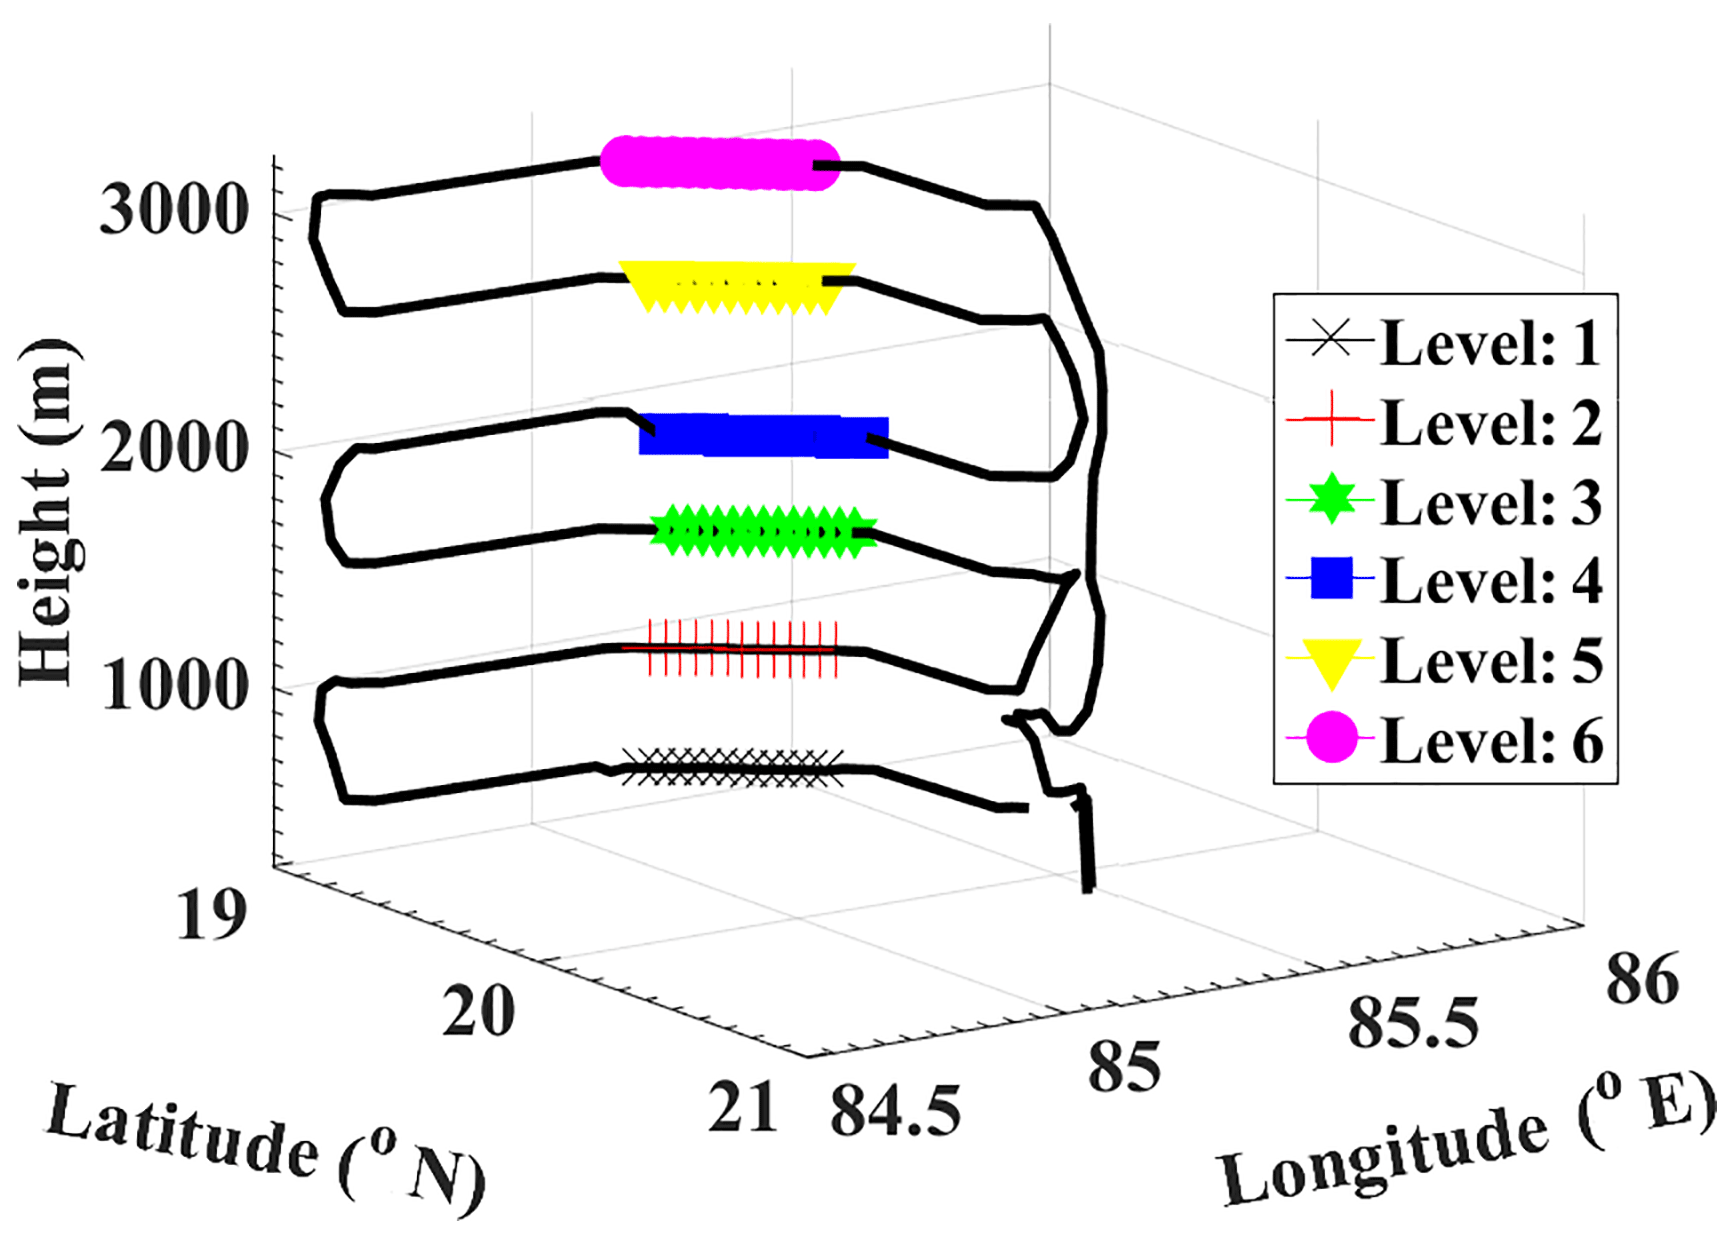
Figure 2Typical course of the aircraft during a campaign sortie. Symbols represent stable levels. Each stable level represents a minimum of 20 min of scientifically useful measurements.
2.2 Base stations
Each base station represented a distinct region of the IGP, as has already been mentioned. Jodhpur (26.25∘ N, 73.04∘ E; 219 m a.m.s.l.) represented the western IGP, which stretches from eastern Pakistan to northern parts of the Aravalli Range, ending in Delhi, is characteristically arid region, dominated by natural aerosols (mineral dust). It also contains the Great Indian Desert or Thar Desert. Consequently, during summer the temperature often exceeds 40 ∘C during daytime, with maximum values reaching as high as 48 ∘C. Pre-monsoon aerosol system over this region is dominated by dust, primarily produced locally and that transported from Arabia, the Middle East and eastern Africa (Prasad and Singh, 2007).
The central IGP, extending from the north-eastern boundaries of the Aravalli range up to the north-western regions of the Chota Nagpur Plateau, is represented by Varanasi (25.45∘ N, 82.85∘ E; 81 m a.m.s.l.). The central IGP hosts numerous coal-fired thermal power plants, large-scale industries including steel and cement factories and has the highest population density compared to other regions of the IGP. Approximately ∼ 65 % of the area in the central IGP is under cultivation. Central IGP is frequented by local dust storms and transported dust (Prasad and Singh, 2007) during the pre-monsoon season.
The eastern IGP, geographically bound by Chota Nagpur Plateau in the west, Himalayas in the north, Purvanchal hills in the east and the Bay of Bengal in the south, is represented by Bhubaneswar (20.24∘ N, 85.81∘ E; 42 m a.m.s.l.), located about 70 km inland. It encompasses a large swath of land with numerous water bodies, dense forested regions, and the great Sundarbans delta. Apart from local emissions from industries, vehicles and other household practices, the eastern IGP receives a significant portion of its aerosol load from the western and central IGP (Nair et al., 2007) due to its location in the continental outflow from the central IGP. Bhubaneswar and adjoining regions are hosts to several heavy industries and thermal power plants, and as such, high aerosol optical depth (∼ 0.5 at 500 nm) prevails over this region (Das et al., 2009).
2.3 Instruments, measurements and database
A suite of instruments has been used aboard for measuring the aerosol properties (see Table 1) of which the data from those dealing with the optical properties are used in this study. These included aerosol light extinction coefficient (σext) measurements at 530 nm, carried using a Cavity Attenuated Phase Shift Extinction Monitor (CAPS PMex) (model PMex of Aerodyne Research Inc.); aerosol light scattering coefficient (σscat) measured using a 3-wavelength (450, 500 and 700 nm) integrating nephelometer (TSI; model: 3563); and aerosol absorption coefficient (σabs) derived from the measurements made using a 7-channel Aethalometer (model AE-33, Magee Scientific). CAPS PMex employs the cavity-attenuated phase shift technology (Herbelin and McKay, 1981; Kebabian et al., 2007) and measures the phase shift in the light leaving a highly reflective optical cell illuminated by a square wave modulated light-emitting diode source (Massoli et al., 2010). σext is calculated from the differences of phase shift between the particle-free air and particle-laden air in the optical chamber. Details are given by Massoli et al. (2010). This instrument was operated at a flow rate of 0.85 L min−1. Auto baseline measurements were taken every 2 min. Massoli et al. (2010) have established that the CAPS PMex has a detection limit of 3 Mm−1 or lower at a 1 s time resolution and has an uncertainty of ±3 %.
Details of the nephelometer operation and principle of measurement are given by Anderson et al. (1996) and Heintzenberg and Charlson (1996). The instrument was operated at a flow rate of 16 L min−1 and calibrated with CO2 span gas before and after the campaign to ascertain consistency in performance. Besides this, zero background measurements were taken with filtered air on hourly basis to ascertain the health of the instrument. The measurements are corrected for the well-known truncation error (due to non-availability of measurements for angles < 7 and > 170∘ following Anderson and Ogren (1998) methodology as detailed in earlier papers (Nair et al., 2009; Babu et al., 2012). Uncertainties in measured σscat are within % (Anderson et al., 1996).
Aethalometer measures attenuation of light by aerosols deposited on a filter spot. Absorption coefficient is then calculated from the rate of change of attenuation, filter spot area and volumetric flow rate using Eq. (1) given below (Weingartner et al., 2003).
where A is the filter spot area, Q is the volumetric flow rate, and ΔATN is change in attenuation in time Δt. The Aethalometer was operated at a flow rate of 2 L min−1 and data frequency was set to 1 min. Measurements by the Aethalometer are known to have the instrument artefacts, viz. multiple scattering, loading effect and assumption of mBC (Weingartner et al., 2003; Liousse et al., 1993). The underestimation of BC due to a loading effect is compensated for in the instrument, which uses the dual-spot technique, following Drinovec et al. (2015). A factor of 1.57 is used to compensate for the enhanced light absorption arising due to multiple scattering within the filter fibre matrix (Drinovec et al., 2015). Uncertainties related to the measurement of the absorption coefficient, using filter-based techniques, have been discussed in a series of literature (Müller et al., 2011; Drinovec et al., 2015; Collaud Coen et al., 2010; Segura et al., 2014; Lack et al., 2014). These uncertainties mainly stem from two major causes:
- i.
multiple-scattering within the filter fibre matrix, and
- ii.
lower attenuation coefficients for higher filter loadings, also called the filter loading effect (Weingartner et al., 2003).
Lack et al. (2014) have estimated an uncertainty of 12 %–30 % in σabs measured using filter-based techniques. However, this assumption is on the higher side for the present study for two reasons:
- i.
the new-generation Aethalometer (Drinovec et al., 2015) has in place real-time compensation of the loading effect, which earlier was assumed as a constant; and
- ii.
advanced filter tape material is used, which minimizes the effect due to multiple scattering and can be better characterized.
After taking into consideration uncertainties introduced due to flow instabilities (Drinovec et al., 2015) and an uncertainty of ∼ 10 % is expected in the absorption coefficient measurements. Details of the Aethalometer data analysis can also be found in earlier publications (Babu and Moorthy, 2002; Moorthy et al., 2004). The Aethalometer data were corrected for volumetric flow in order to sample the same volume of air at each altitude, following Moorthy et al. (2004).
All on-board computers and instruments were time synchronized with the GPS time during each sortie. After each sortie, the measured data were georeferenced using high time resolution (1 s) GPS data, available from a GPS receiver on board.
3.1 Vertical and spatial distribution of aerosol radiative properties
The raw data of σext, σscat and σabs, after all necessary corrections and time tagging, from all the sorties at a particular station, have been grouped in terms of the different altitude levels chosen for the sortie (as described in Sect. 2.4) and averaged to construct the mean, station-specific altitude profile. All the three parameters, σext, σscat and σabs, are presented for 530 nm wavelengths (the wavelength used by the CAPS), and for this the σscat and σabs values were interpolated (between at 450 and 550 nm for σscat and between 520 and 590 nm for σabs) using the corresponding Ångström power-law relation (Ångström, 1964):
where βscat∕abs is a constant, λ is wavelength and αscat∕abs is the scattering and absorption Ångström exponent.
Figure 3a–c show the vertical distributions of σext, σscat and σabs, over the three stations. In all the figures, square, triangle and circle symbols correspond to measurements over JDR, VNS and BBR respectively. Error bars represent the standard error at that level for the station.
A vertical heterogeneity is clearly seen in all the properties across the IGP. While the altitude variation is very weak at JDR (western IGP) and moderate at BBR, it is rather strong at the central IGP (VNS). The weak vertical variation at JDR is attributed to the strong convective mixing over this arid region, where the solar heating is very intense during this season. Above around 1.5 km, there is a decrease in σext and σscat, which is stronger than that seen in σabs. This is likely to be due to rapid sedimentation of heavier dust particles, which contribute largely to σext and σscat, compared to their anthropogenic counterpart, which contributes dominantly to σabs. The extinction at 3 km is just half of that at 0.5 km or even at 1.5 km. The day-to-day variability over the western IGP is smaller compared to that at the other two regions as evidenced by the shorter error bars. This is also attributed to the near-uniform dominance of dust aerosols in this region and the scarcity of anthropogenic sources of aerosols, e.g. industries, coal-fired power plants. In contrast, VNS in the central IGP shows significantly higher values of σext, σscat and σabs close to the surface (clearly attributed to the large abundance of anthropogenic emissions in this region, as has been stated earlier) and a rather sharp decrease with altitude, with σext at 3 km falling by a factor of 4 of the near-surface value (similar for σscat and σabs). As the central IGP is dotted with numerous coal-fired power plants (http://www.ntpc.co.in, last access: 10 May 2018) and heavy industries, and has the highest population density in the range 800–1200 km−2, the resulting large emissions are reflected in the high values and the large day-to-day variability (large standard error bars) of the optical properties of aerosols over this region. While close to the surface, the extinction values are considerably higher over the central and eastern IGP (compared to the western part) at the higher levels (above 2 km) the values are of comparable magnitude at all three stations, showing a larger spatial homogeneity in the lower free troposphere. The absorption coefficient over BBR, in the eastern IGP, remains nearly steady with altitudes up to around 2 km, above which it marginally increases (unlike at the other two stations), albeit the increase is within the natural variability of the lower levels, showing more absorbing aerosols aloft.
Spatially, the column-averaged values of σscat, σabs and σext (up to the maximum height up to which measurements were made) are the highest in the central IGP compared to the eastern and western IGP, primarily due to the very high values near the surface. Station-averaged values of σext, σscat and σabs along with the standard error are given in Table 2.
Table 2Mean ± standard error of column-averaged (from near the ground to 3000 m) aerosol radiative properties.
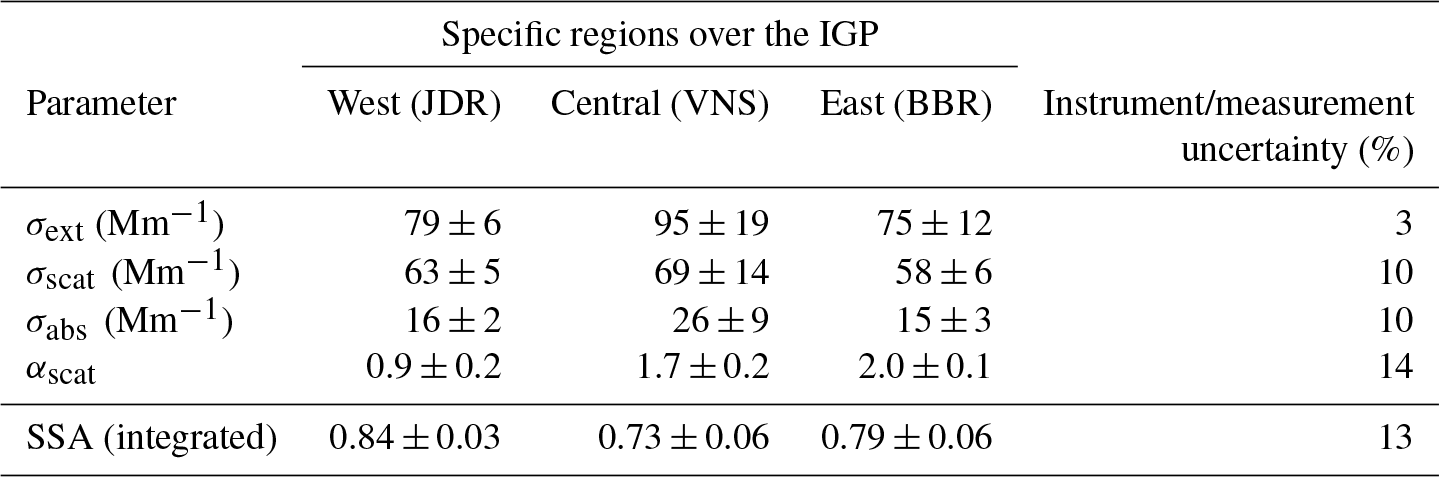
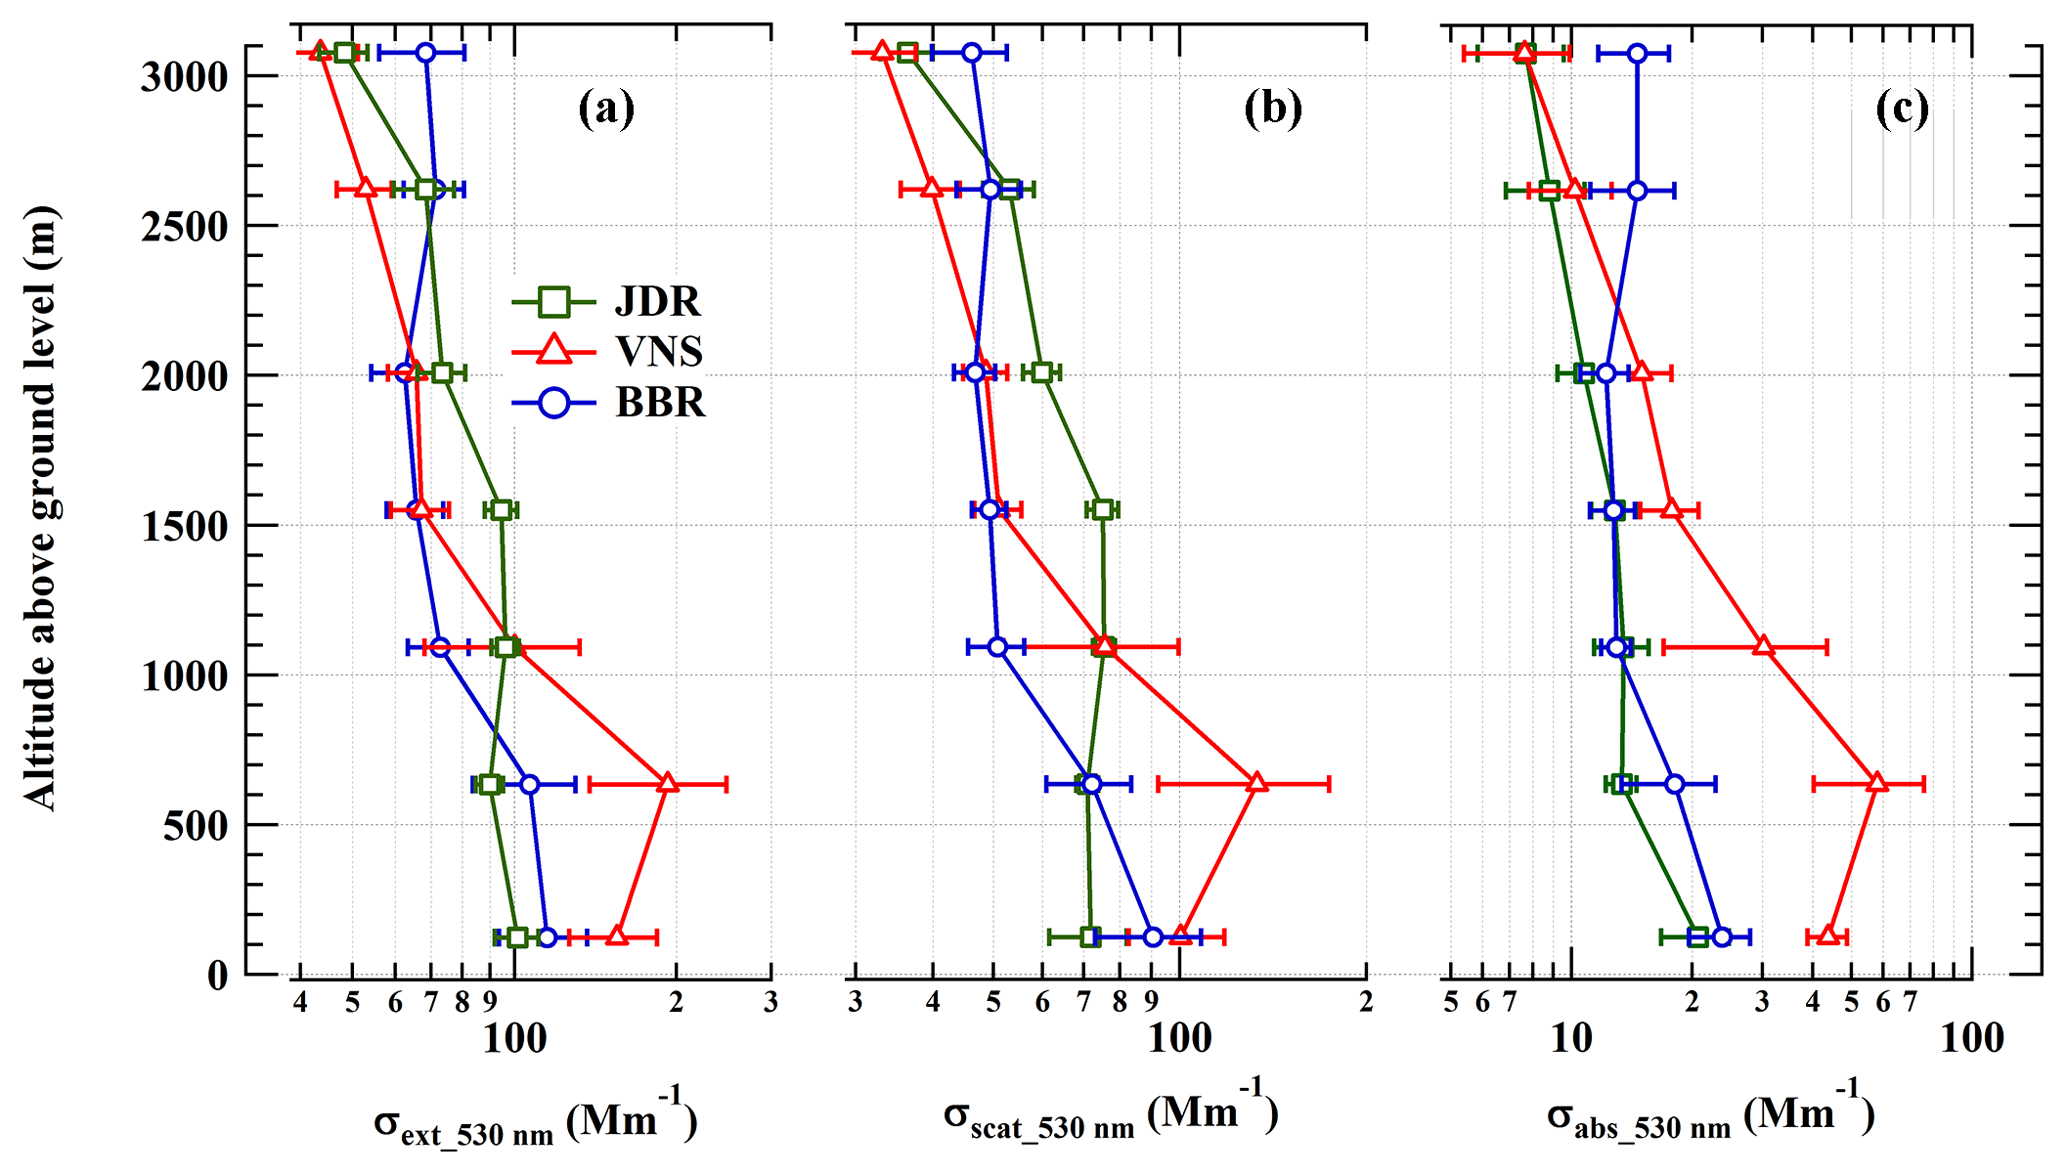
Figure 3Mean altitudinal variation of (a) σext, (b) σscat and (c) σabs over JDR (square), VNS (triangle) and BBR (circle) in logarithmic scale. Error bars represent the corresponding standard errors (standard deviation of the mean).
Aerosol scattering/absorption Ångström exponents (αscat∕abs) were derived from the respective coefficients as a function of wavelength using the relation,
Based on the uncertainties in the measurement of σscat and σabs, as described in Sect. 2.3 above, an uncertainty of up to 14 % is expected in the estimation of αscat∕abs.
αabs values are indicators of potential aerosol types. αabs value ∼ 1 indicates absorbing aerosols mainly from fossil fuel sources (Kirchstetter et al., 2004; Russell et al., 2010), whereas values > 2 are indicative of absorbing aerosols from biomass sources and dust (Russell et al., 2010; Weinzierl et al., 2011). The range of αabs values decreased gradually from desert regions of the western IGP, 1.1–2.4, with anthropogenic aerosols that dominated the central IGP, 1.1–1.6, to the coastal eastern IGP, 1.1–1.5. A detailed analysis of this aspect will be presented in subsequent works. αscat gives an indication of the dominant particle size mode (Schuster et al., 2006). A higher αscat value suggests increased submicron dominance and vice versa. In the present case, we calculated αscat using σscat at wavelengths 450 and 700 nm. αscat values < 0.4 indicate a super-micron-mode aerosol dominance (Smirnov et al., 2002) and values > 2 suggest submicron aerosol dominance (Schuster et al., 2006), while values in between 0.4 and 2 are due to a mix of aerosol distribution with varying degrees of super-micron and submicron particles. Figure 4 shows the altitudinal variation of αscat for the three regions. It clearly reveals a gradual change in aerosol type across the IGP during the pre-monsoon. The optical properties over the western IGP is mostly controlled by the coarse-mode (dust) aerosols, leading to remarkably low values of αscat in the entire altitude regime (values lying in the range 0.7 to 1.0 with extremely weak altitude variation) compared to the other two regions. On the other hand, despite its coastal proximity, the industrialized eastern IGP (BBR) has the highest value of αscat values, remaining well above 2.0 for the altitude region below 2 km, with a weak decrease above. The weak observed decrease may be due to the presence of long-range advection of dust aerosols, at higher altitudes, across the IGP. Such long-distance travel resulted in gravitational settling of coarser dust, leaving behind fine-accumulation-mode aerosols. The central IGP, with its strong anthropogenic emissions adding to the advected dust, reveals a transition from the coarse-mode-dominant western IGP to the fine-mode-dominant eastern IGP; with αscat lying in the range 1.4 to 1.9, depicting a conspicuous decrease with an increase in altitude. While the higher values of αscat closer to the surface signify the strong contribution of anthropogenic emissions from the region, leading to a significant increase in the submicron aerosol loading (as also evidenced by the large values of scattering and absorption coefficients in Fig. 3), the increase in fractional contribution of advected dust results in a decrease in αscat of the composite aerosols at higher altitudes.
The column-averaged values of αscat (Table 2) increases from ∼ 0.9 in the western IGP to 1.7 over the central IGP to 2.0 over the eastern IGP. In summary, as we move from west to east in the IGP the aerosol type changes from super-micron-mode-dominant natural aerosols (desert dust) to submicron-mode-dominant anthropogenic aerosols (mix of aerosols from industrial sources, fossil fuel and biomass burning.
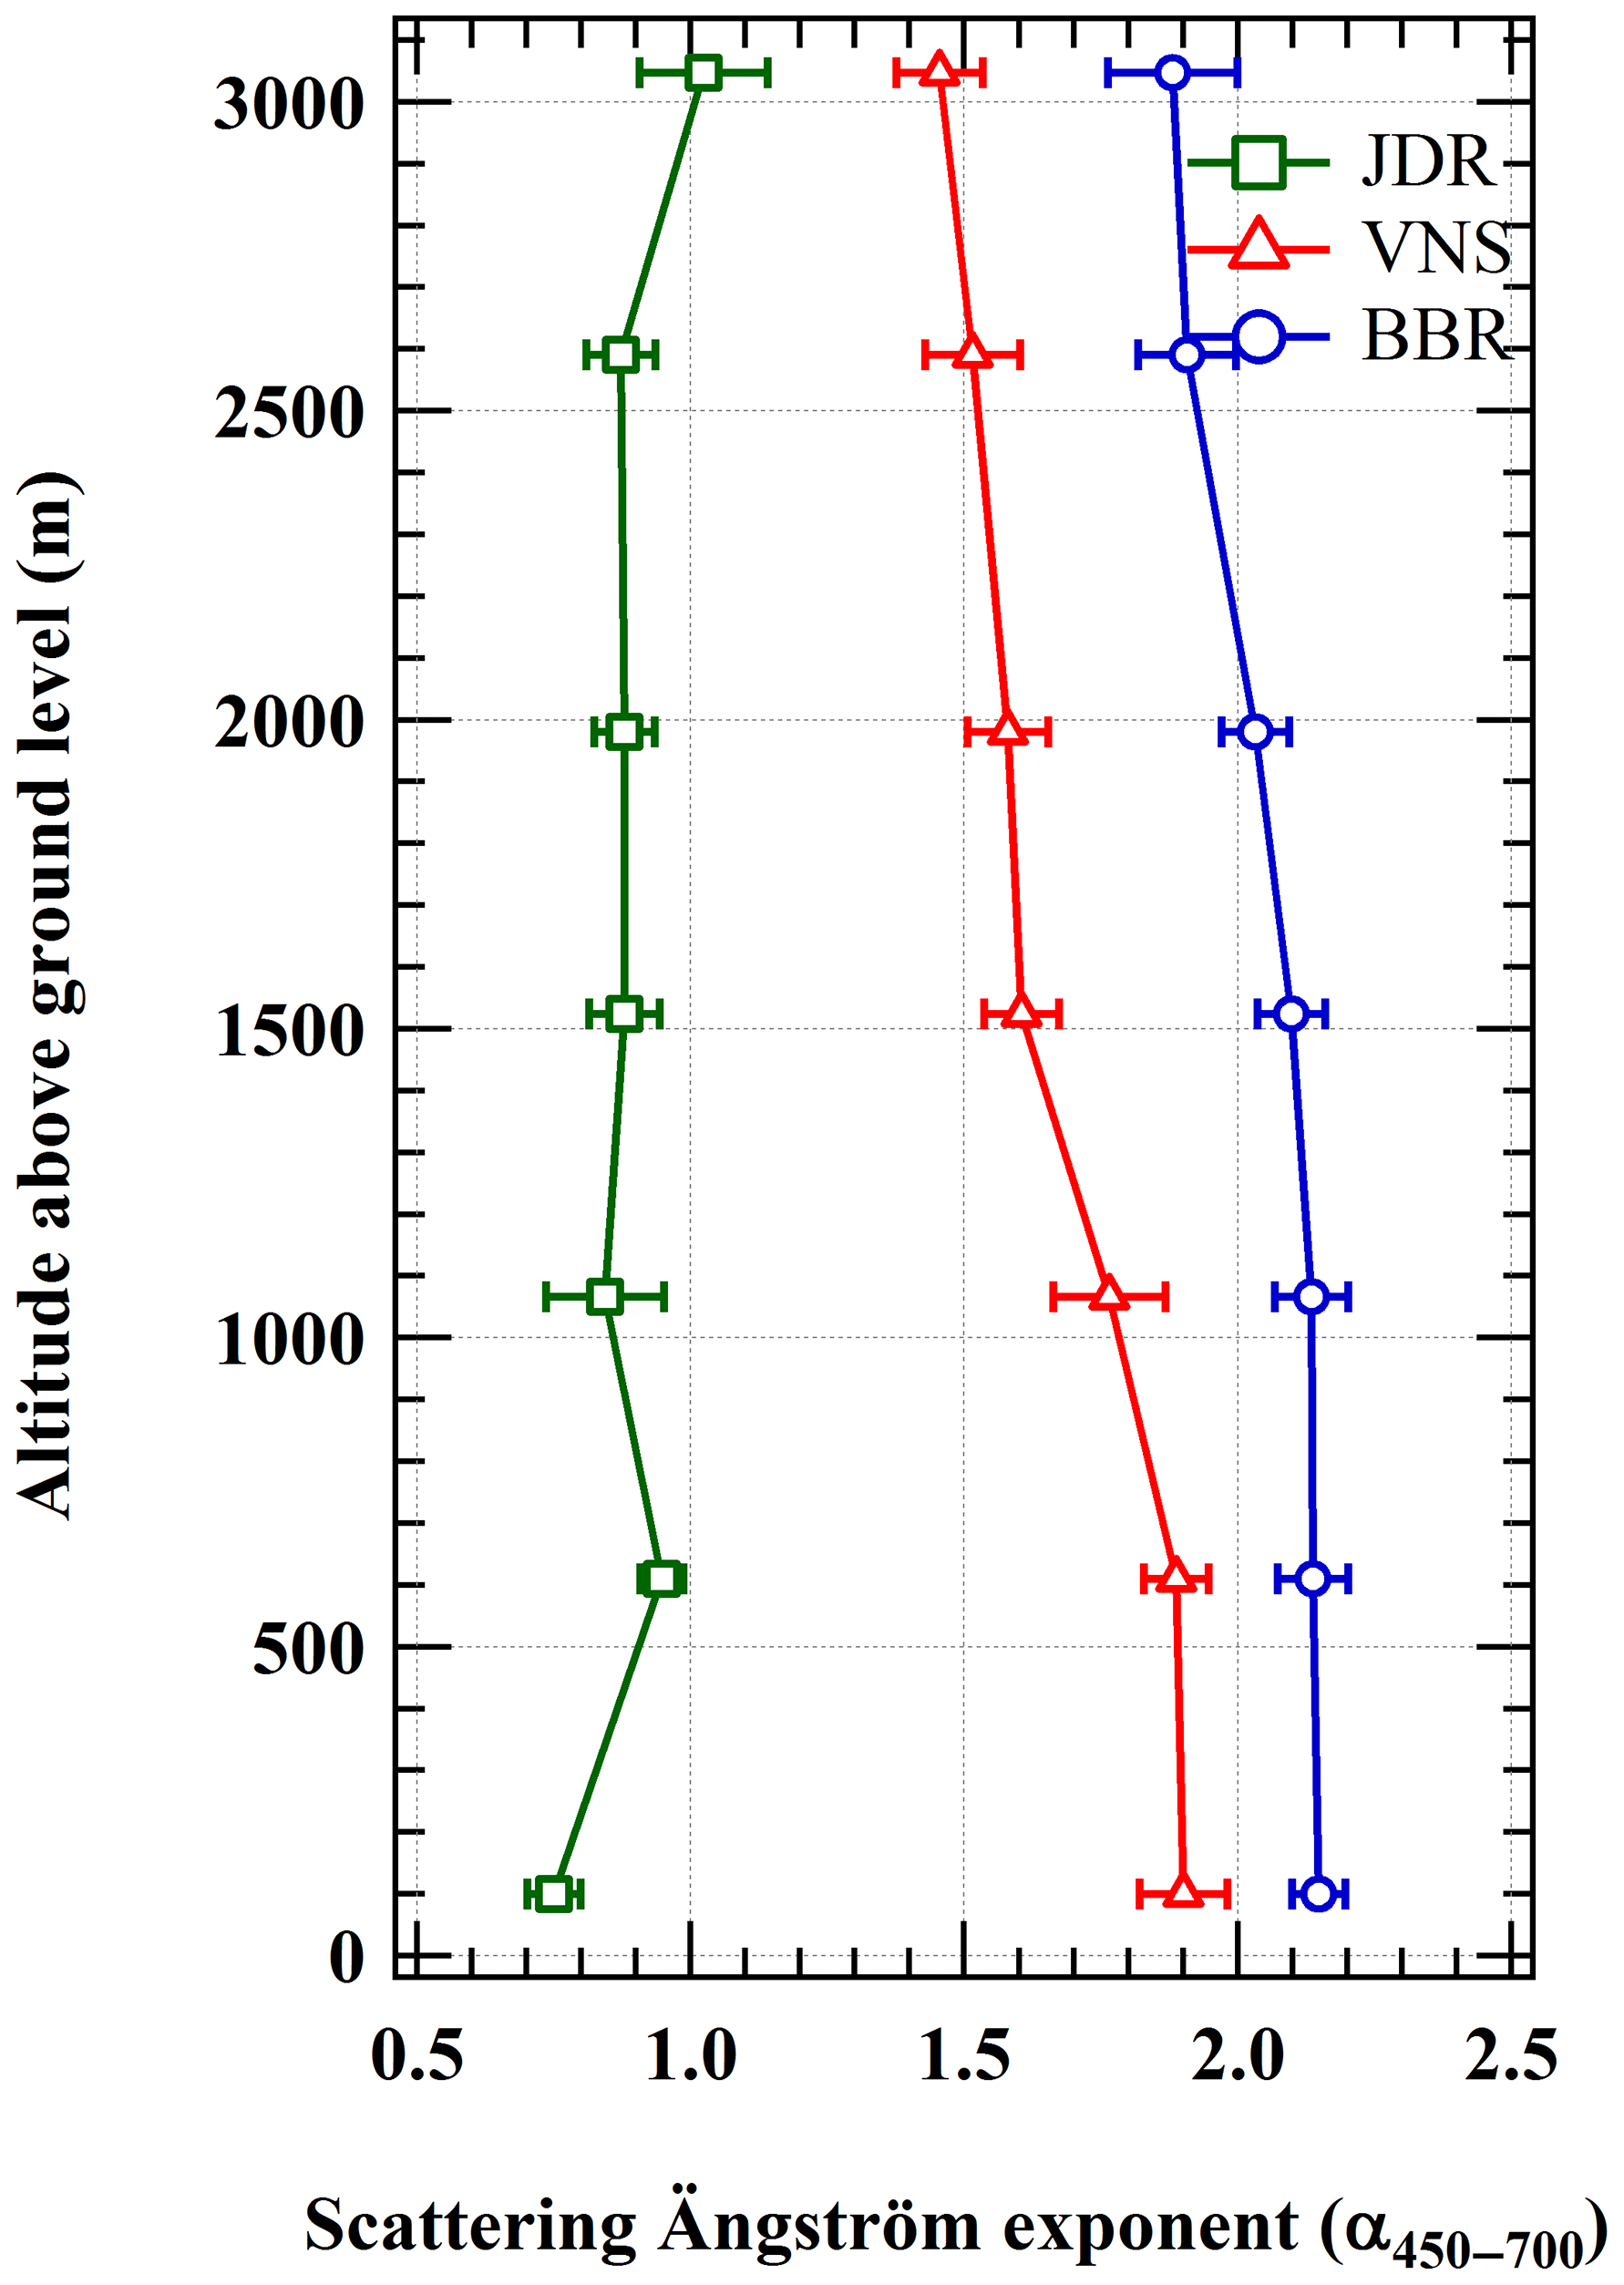
Figure 4Altitudinal variation of α for the aircraft campaign stations: JDR (square), VNS (triangle) and BBR (circle). Error bars represent the standard error in the mean of level-averaged α.
SSA at 530 nm has been estimated (SSA) from the concurrently measured spectral σscat and σabs, the coefficients interpolated to 530 nm using the Ångström power-law relation described in Eq. (2). Uncertainties in the calculation of SSA are estimated to be in the range of 12 %–13 %. SSA values were then layer averaged over each location and the mean altitude profiles are shown in Fig. 5, which shows the strikingly differing absorption properties of aerosols over different regions of the IGP as well as distinctly differing vertical variation. The highest SSA and lowest absorption occurs over the arid regions of the western IGP (JDR), dominated by natural mineral dust aerosols. The SSA values here are well above 0.8, with the exception of near-ground SSA values which dipped to a low of ∼ 0.78, and little or very weak altitude variation, though a very weak decrease is indicated above 2.5 km. The column-integrated SSA in the western IGP is 0.84. In sharp contrast, the lowest value of SSA (with a column-integrated value of 0.73) occurs over the central IGP region (VNS), indicating strong aerosol absorption. The SSA values go below 0.75 (as low as 0.7 at 500 m altitude), closer to the surface, increase steadily with altitude and reach values close to those over JDR, where the altitude reached ∼ 3 km. Interestingly, over the industrialized eastern IGP represented by BBR, where fine submicron aerosols dominated throughout the profiled altitude, the aerosols are only moderately absorbing. Close to the surface, moderately high SSA values are seen (0.8), decreasing marginally with altitude to reach 0.79 at 2 km. Above this, SSA decreases more rapidly, indicating increased aerosol absorption in the lower free troposphere, and the values drop to 0.76 by the time the altitude increased to 3 km (and is the lowest among the three regions at this altitude). Above about 2.5 km, the strongest aerosol absorption occurs in the eastern IGP, even though the column-integrated value (0.79) lies between that seen for the western and central IGP and this will have implications on layer-heating by aerosol absorption.
SSA values found in the present study for the western IGP are lower than those reported by Verma el al. (2013), ∼ 0.89, from AERONET retrievals, where the SSA values were for severe dust storm episodes when coarse-mode scattering dust is dominant. For the central IGP, Ram et al. (2016) have a reported an SSA value of ∼ 0.77 prior to the onset of the ISM, which is in line with the findings of the present study. Quite in contrast to the central IGP, the eastern IGP shows a reduction in SSA values, albeit within the uncertainty range, with enhanced variability as we move to higher altitudes.
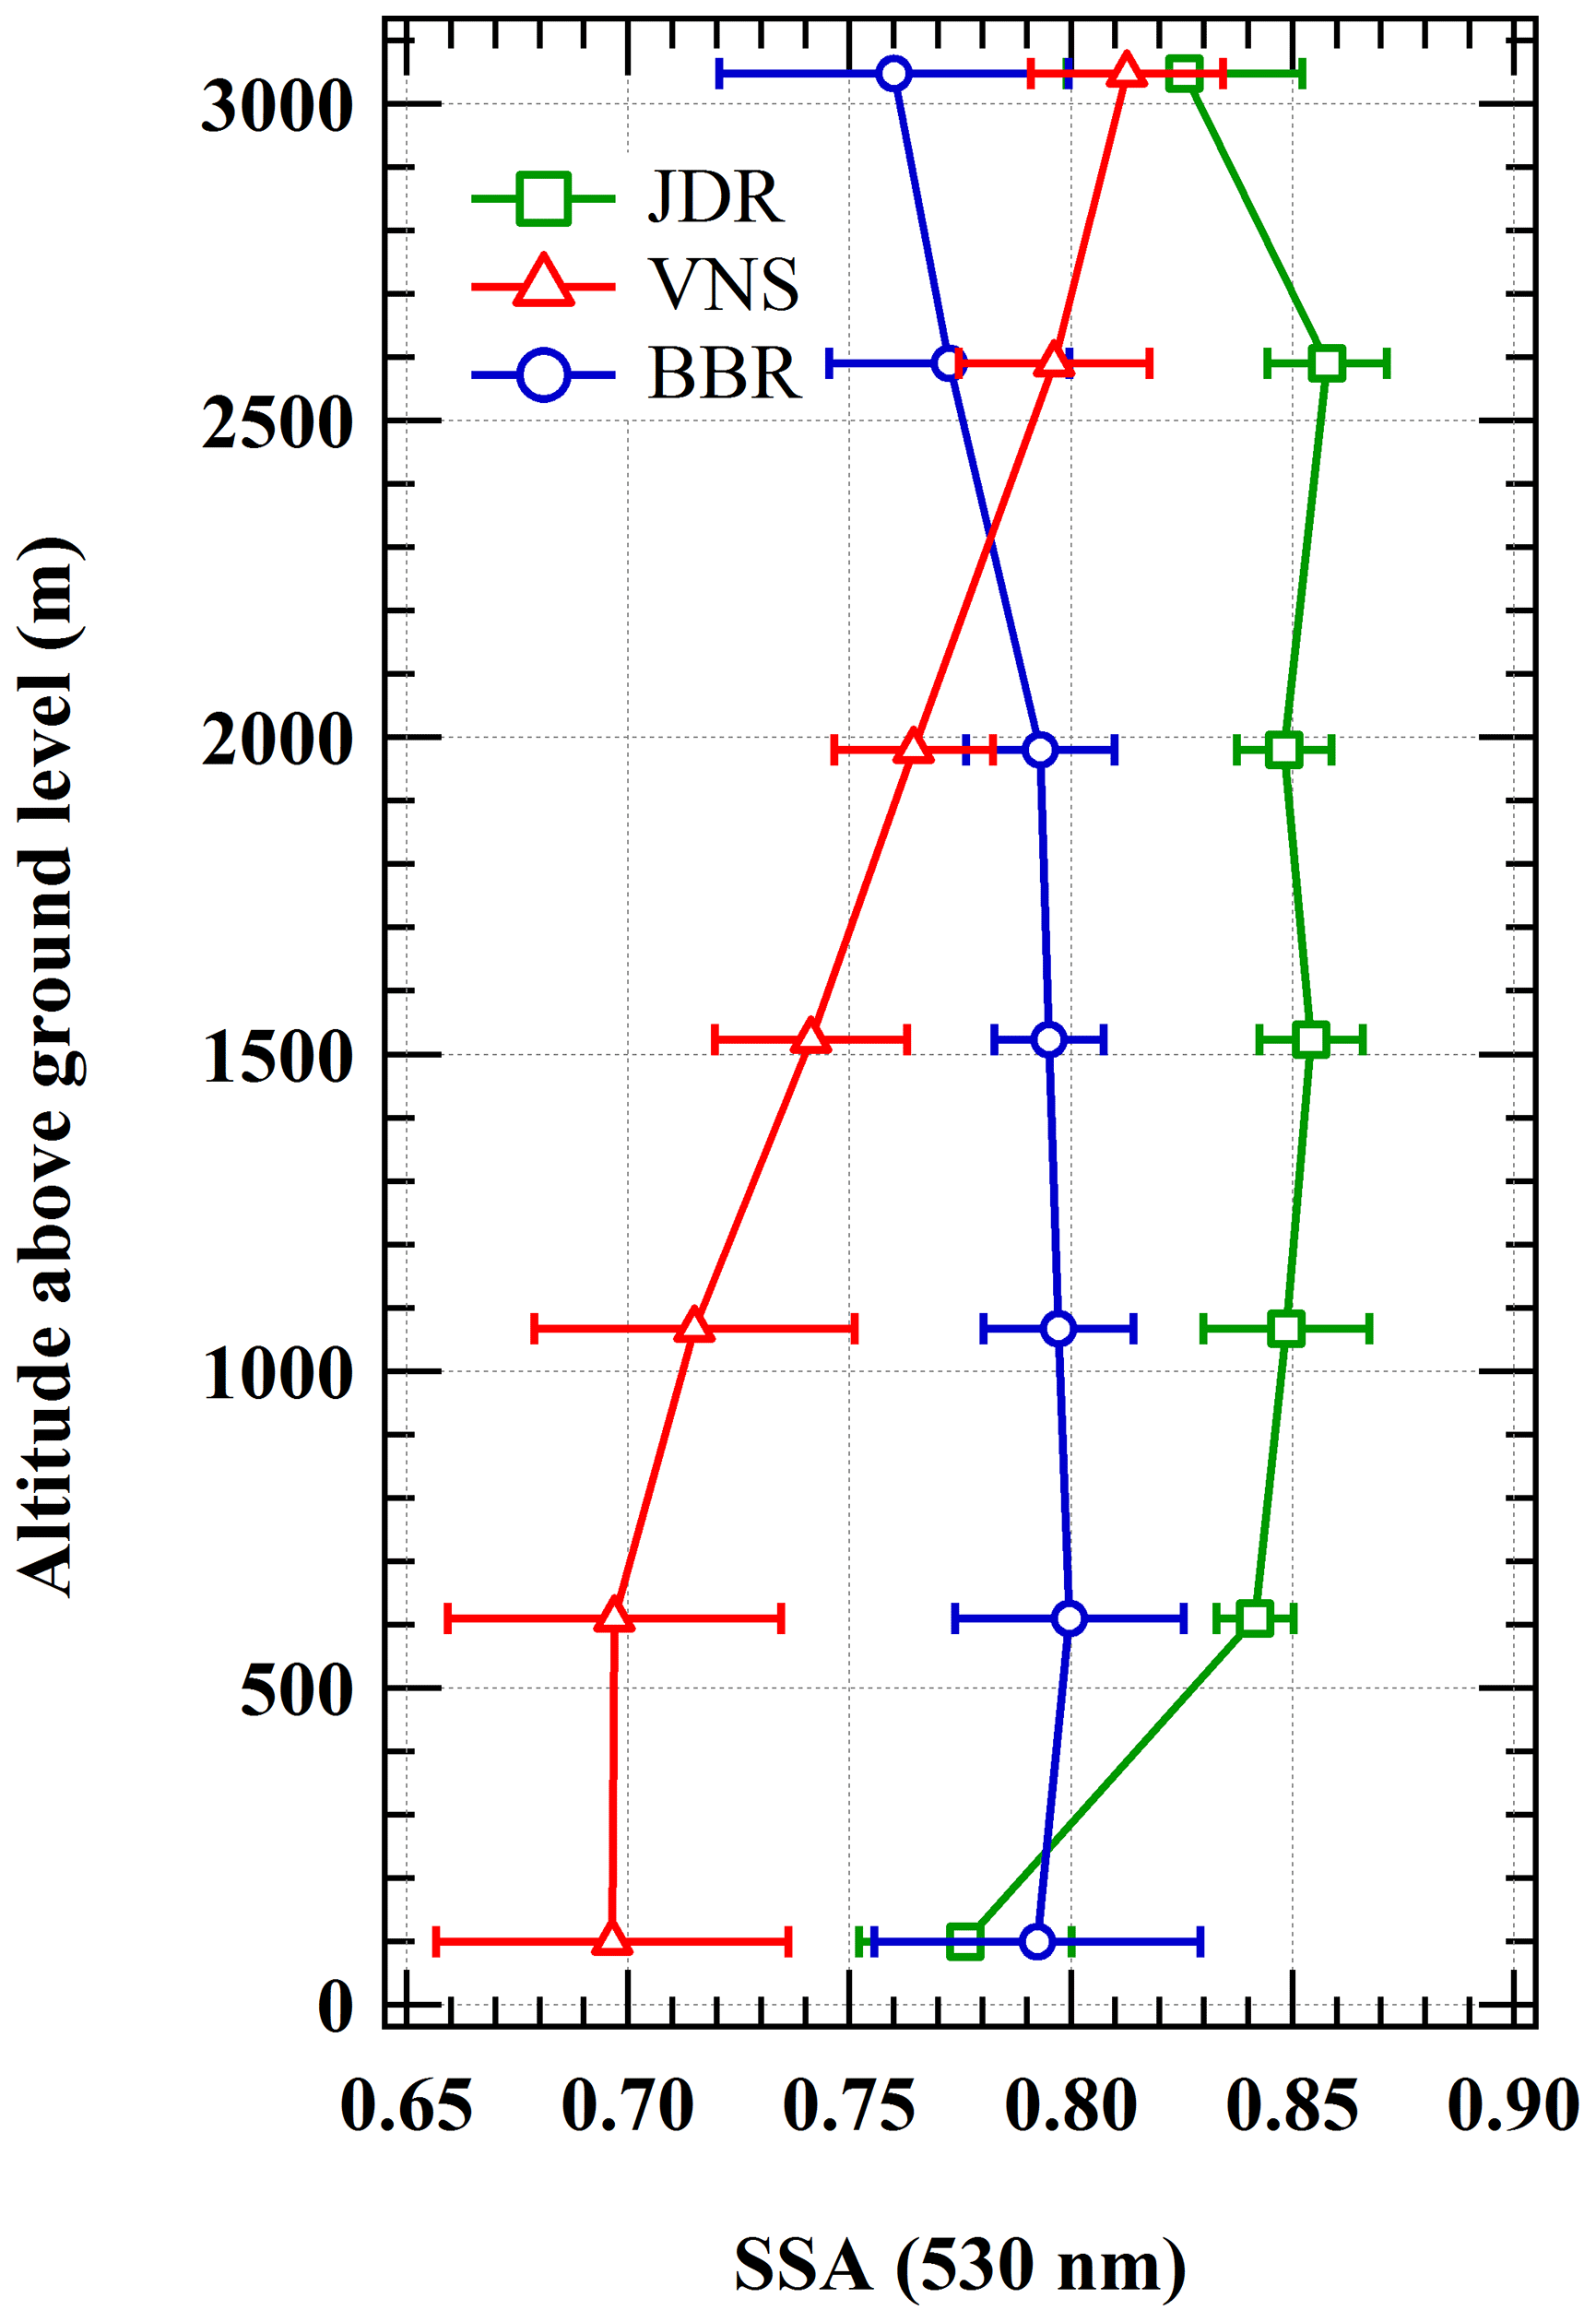
Figure 5Altitudinal variation of SSA at 530 nm for the aircraft campaign stations: JDR (square), VNS (triangle) and BBR (circle). Error bars represent the standard errors.
This suggests that inaccuracies may arise in the estimation of aerosol absorption and atmospheric forcing and heating rates when using a single-columnar SSA value (derived from, for example sun photometer measurements) and brings out the need for region-specific, altitude-resolved values of SSA and estimate layer-by-layer forcing and heating rates for more accurate climate impact assessment. This is addressed in a subsequent section.
Based on airborne measurements during the winter of 2012 and spring of 2013, Babu et al. (2016) have reported altitudinal profiles of SSA and its seasonality over the central Indian regions. They found an enhancement in aerosol absorption in the free troposphere during spring over the IGP in general. Combining our results with those reported by Babu et al. (2016) and assuming the interannual variations to be less significant, in Fig. 6 we present the temporal evolution of aerosol absorption (integrated over the altitude region up to about 3.5 km above mean sea level) over the IGP from winter to spring to just prior to the onset of the ISM. While a significant reduction in SSA, indicating an increase in aerosol absorption, occurs from winter to pre-monsoon; the change from spring to “prior to onset of the ISM” period (i.e. from March–April to June) is stronger. This may be due to lower horizontal ventilation in the IGP due to wind field reversal prior to the onset of the ISM, thus leading to a build-up of absorbing aerosols (Vaishya et al., 2017).
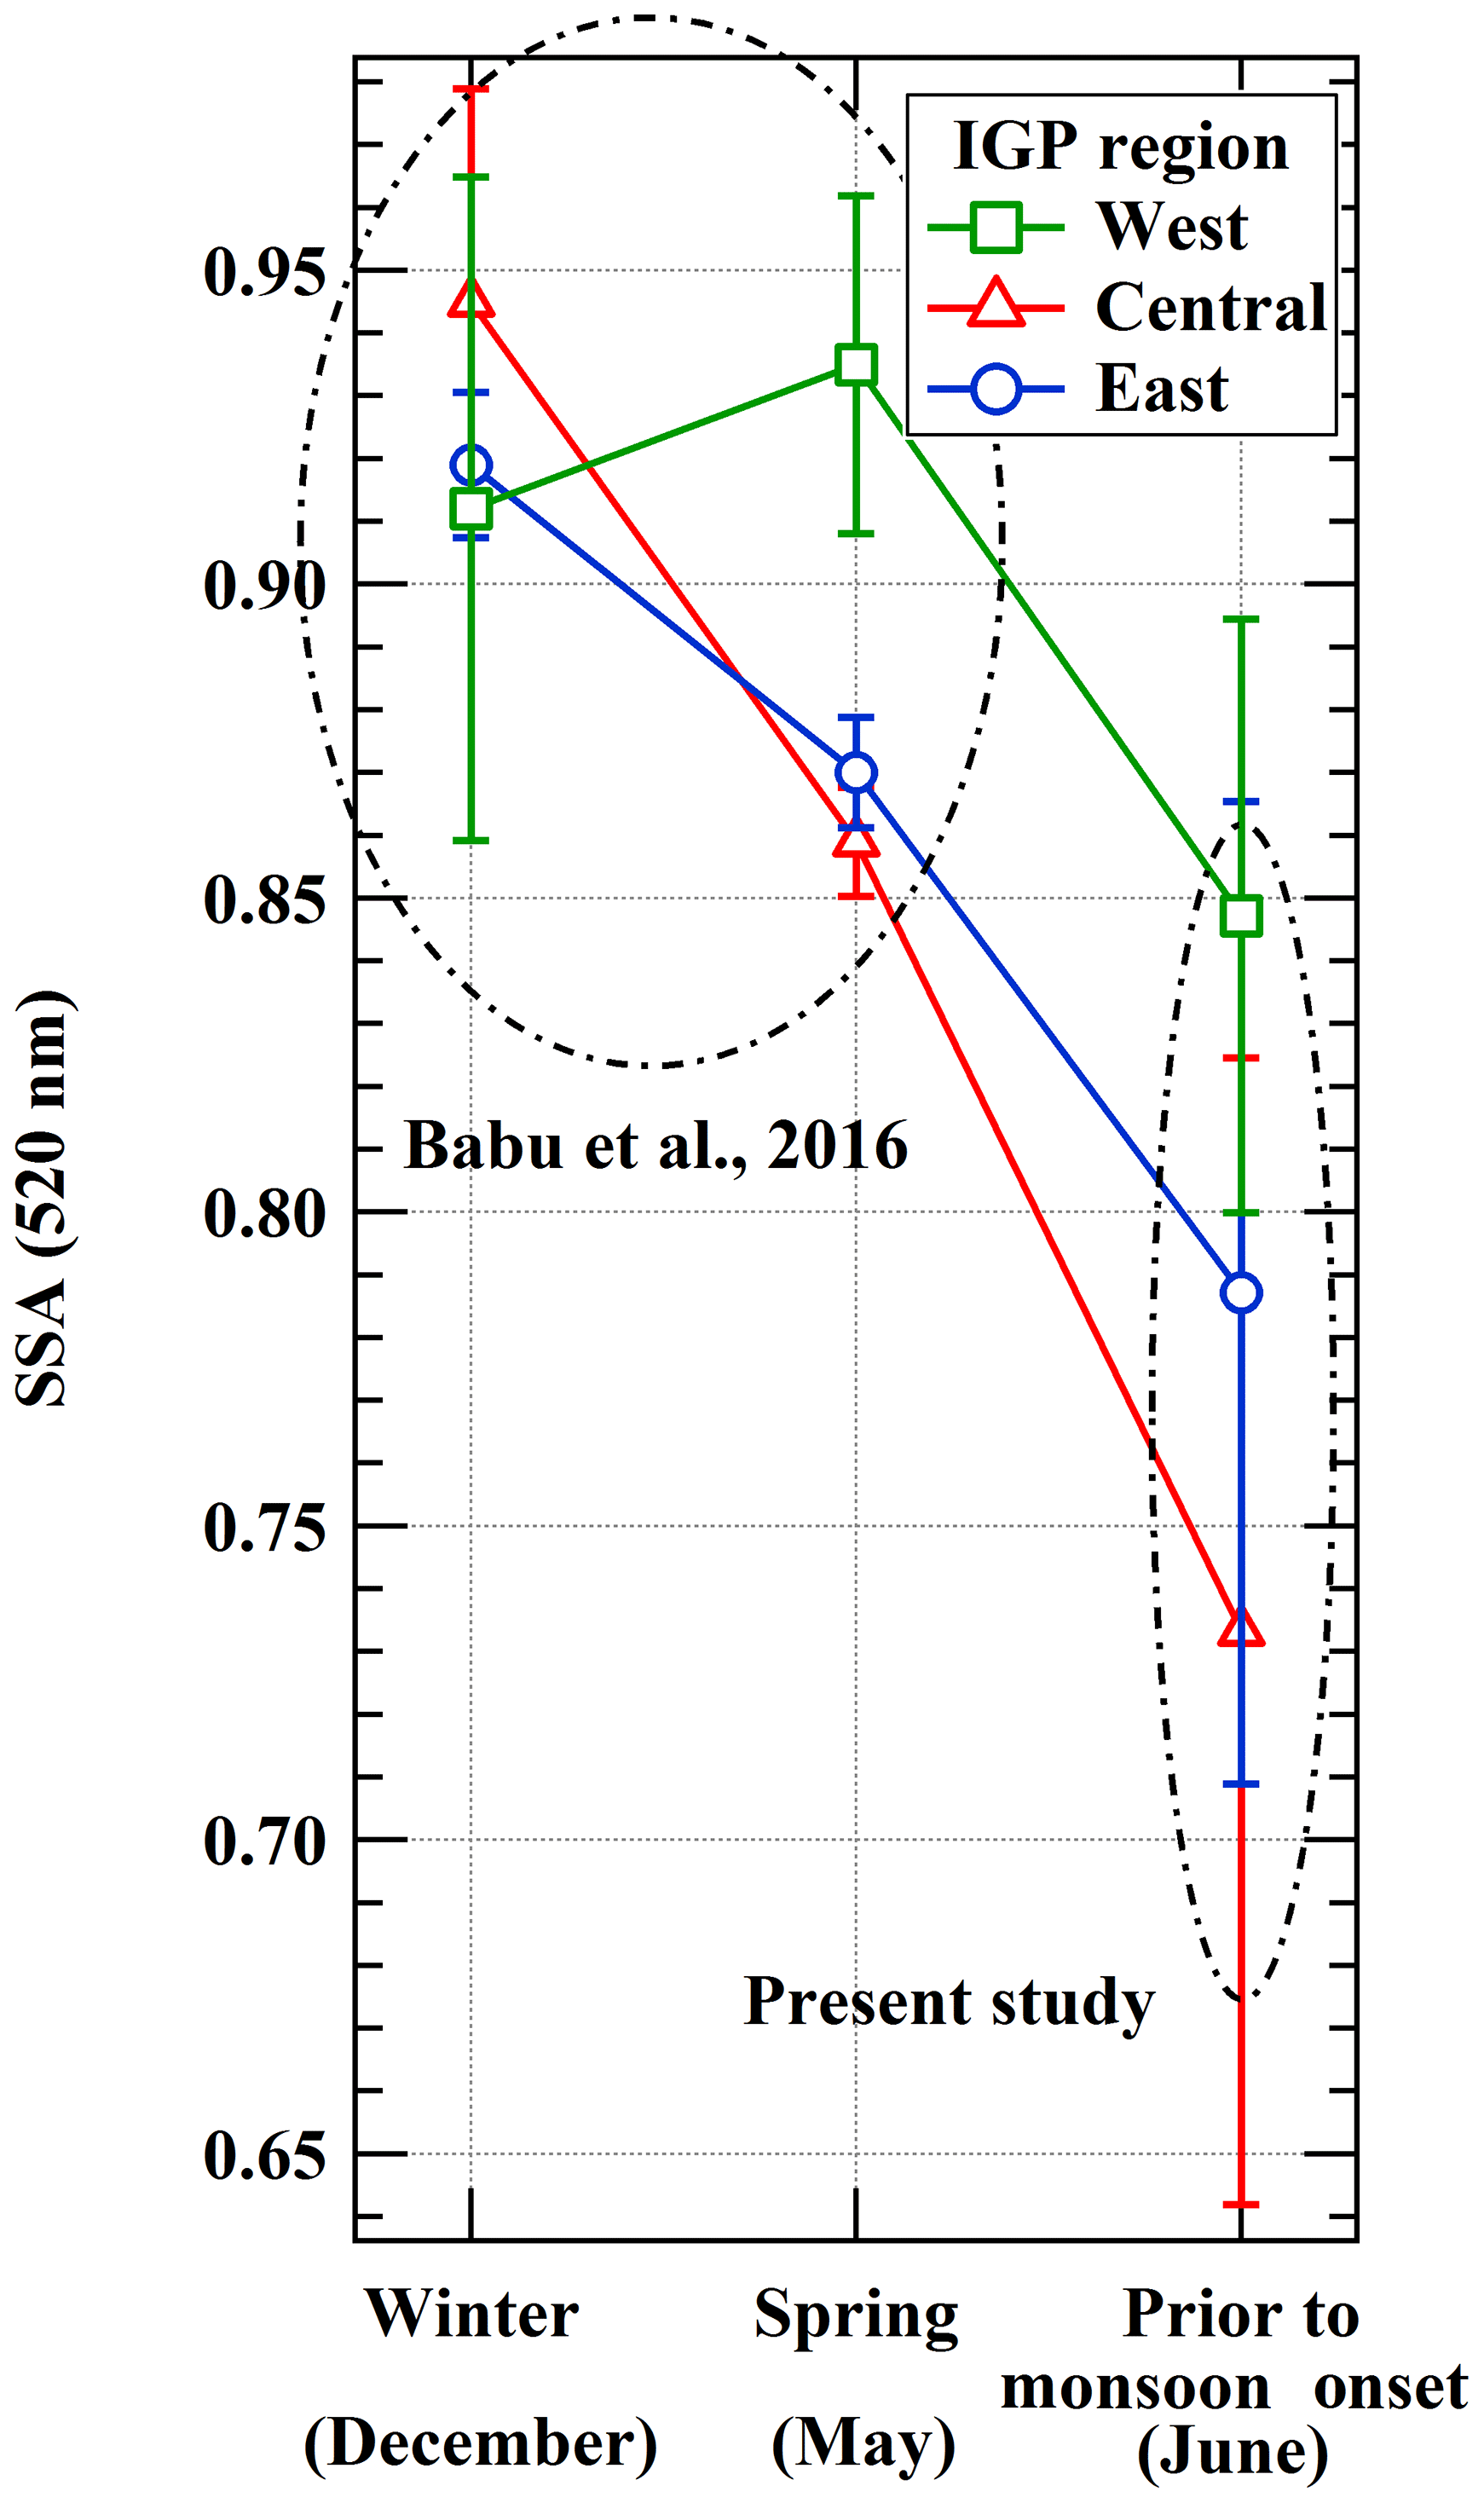
Figure 6Seasonal variation of columnar (500–3000 m) SSA over different regions of the IGP: western (square), central (triangle) and eastern (circle). Values in the upper-left circle are calculated from Babu et al. (2016).
Our values are compared with the values of SSA reported over different regions of the Indian mainland and adjoining region, as reported by different investigators, in Table 3. The methodologies and techniques used to compute it are indicated by symbols, the explanations of which are given at the foot of the table.
Table 3SSA values reported over the Indian landmass and adjoining oceans.
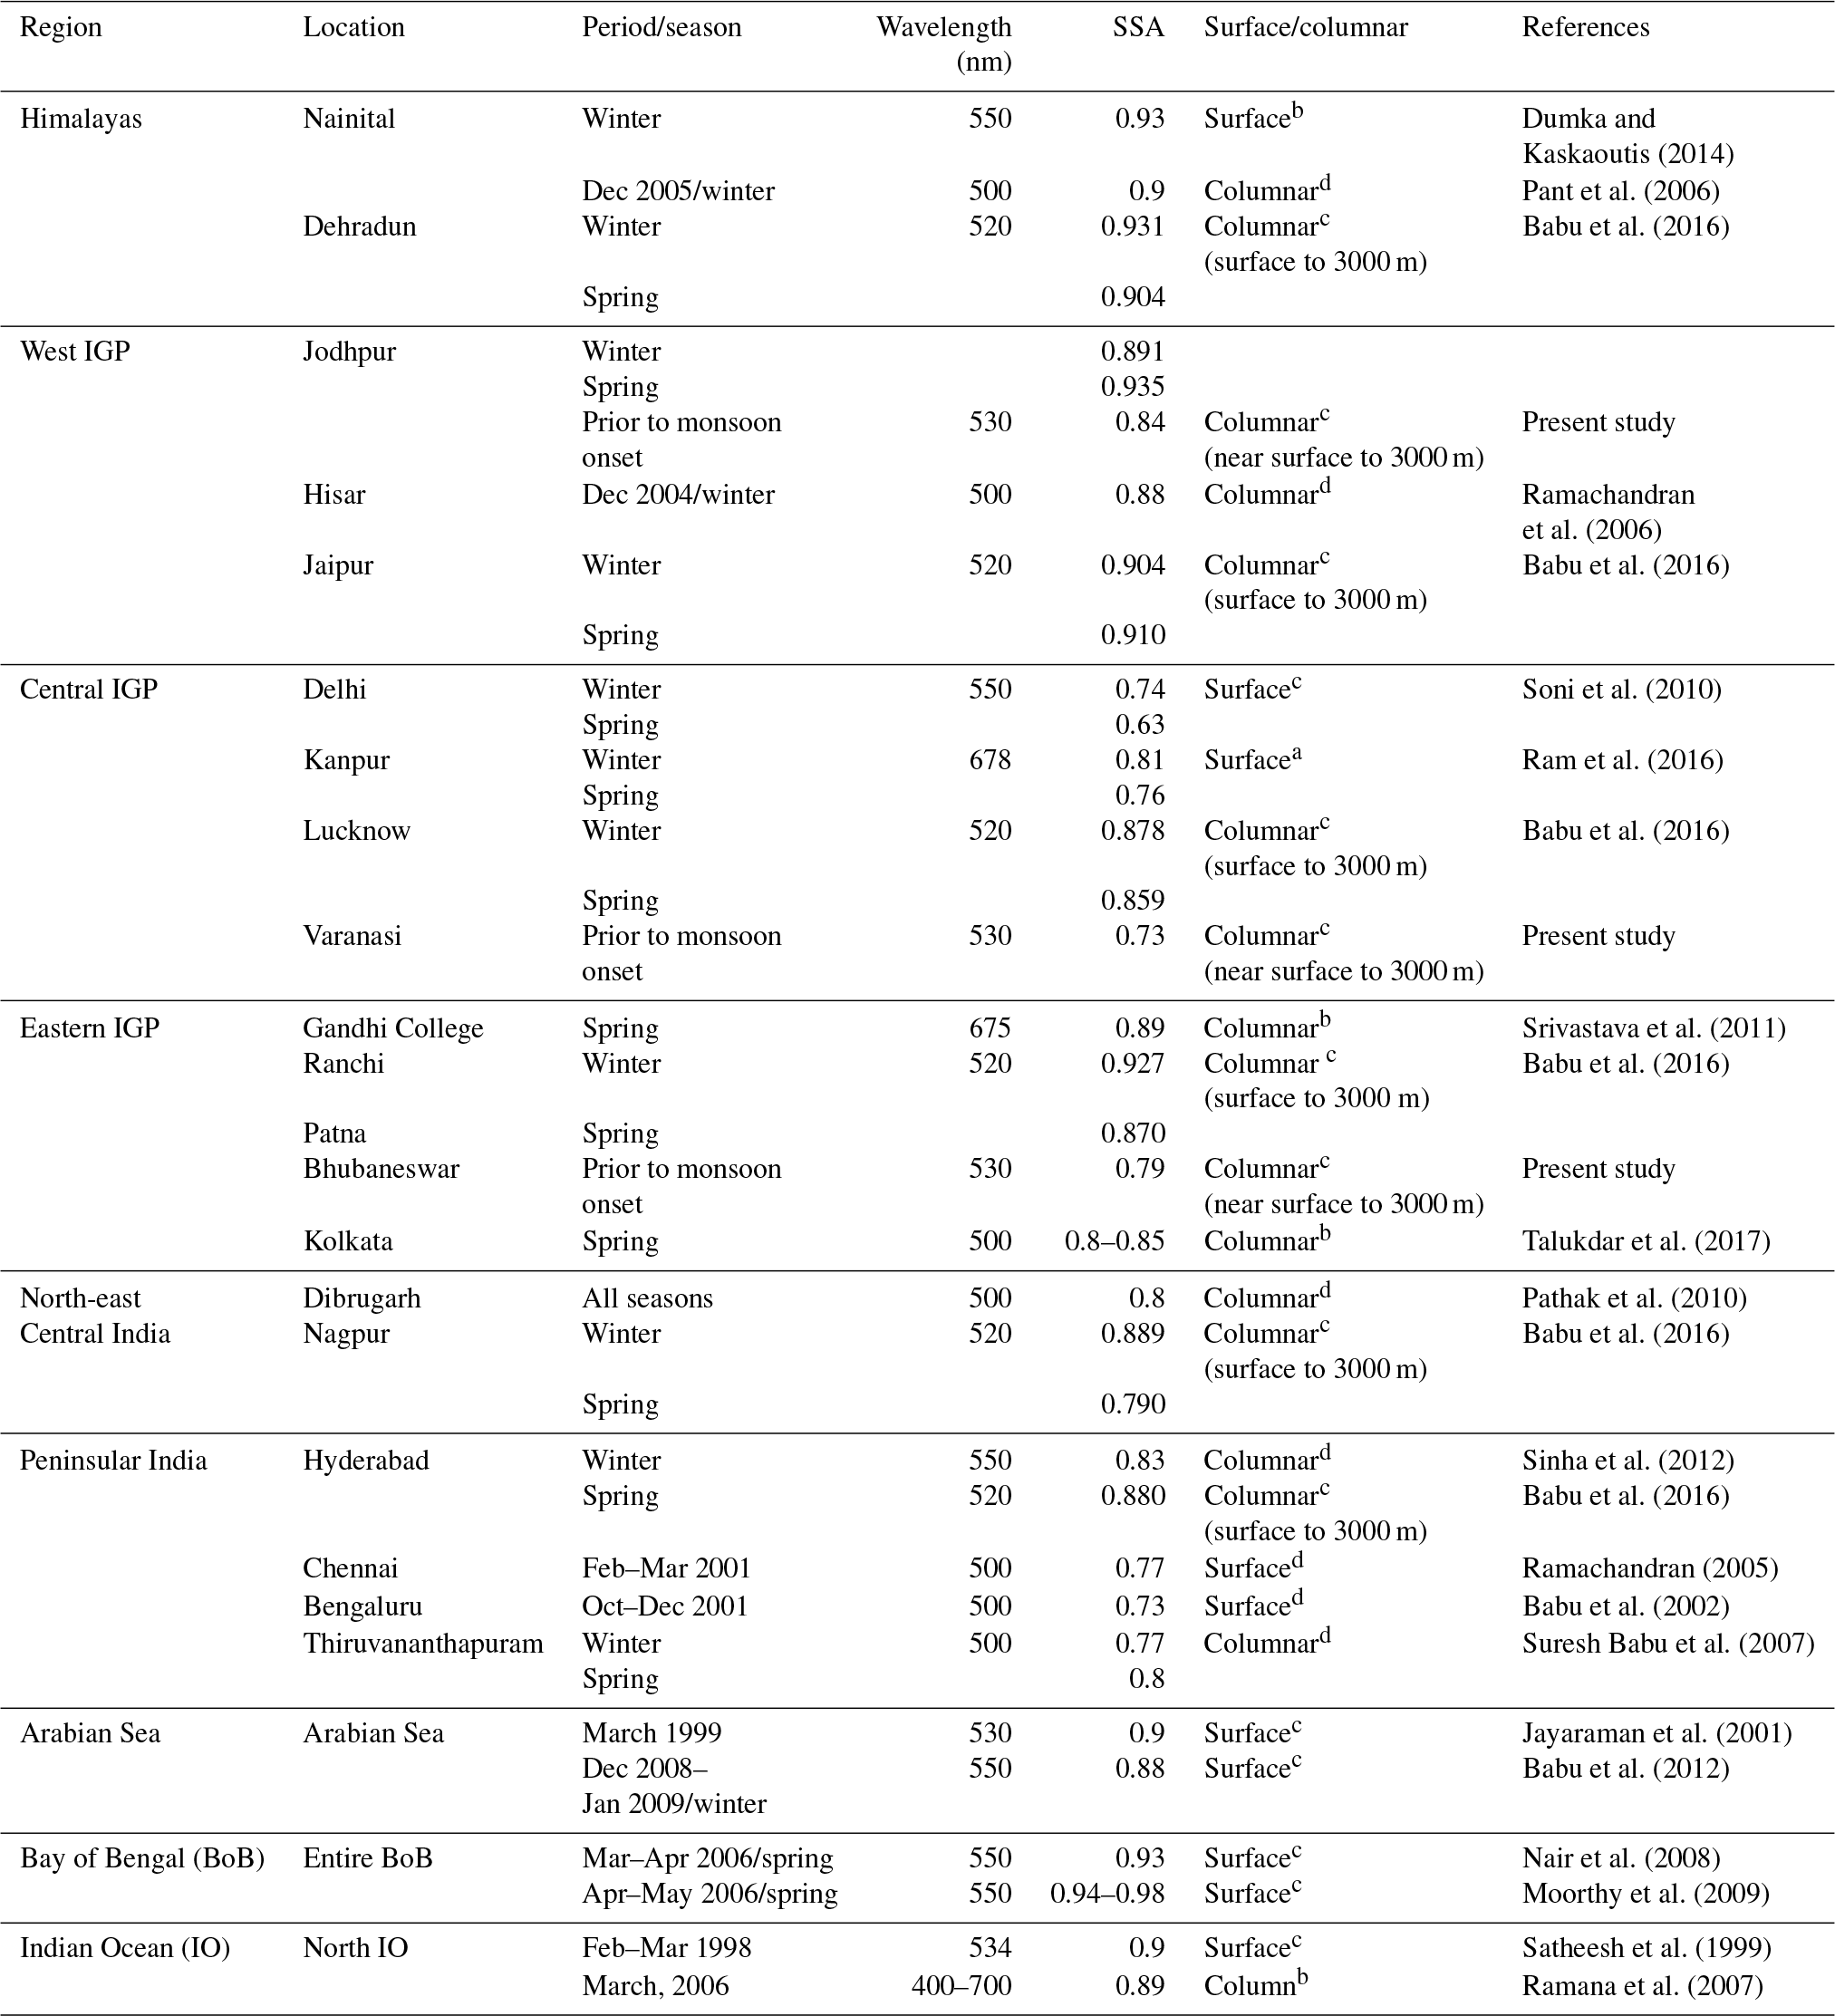
a: Derived from attenuation measurement of filter samples. b: Retrieved from sun/sky radiometer. c: Retrieved from in situ absorption and scattering. d: Using a combination of in situ aerosol optical depth and constrained OPAC model output.
One consistent feature that emerges from Table 3 is that there is a significant reduction in the SSA (or increase in aerosol absorption) over the Himalayan foothills, the IGP regions and central India in spring and towards the pre-monsoon season, compared to the winter season. This is not the case with peninsular India and adjoining oceanic regions where springtime SSA values show an increase indicating less absorbing aerosol in the atmosphere. This apparent dichotomous behaviour of SSA from north to south needs further investigation in terms of the possible role of transported dust. Satheesh et al. (2008) reported an increase in aerosol-induced heating rates from the northern Indian Ocean to central India concomitant with an increase in σext at 3 km altitude. This, they concluded, was due to the presence of elevated aerosols at increasingly higher altitudes as one moves from the northern Indian Ocean to central India. SSA from simultaneous and direct measurements of σscat and σabs is more accurate when compared to those retrieved from sun photometer sky radiance measurements or estimated from modelling studies. Most of the SSA values reported for the Indian region are retrieved indirectly and are hence susceptible to inversion or model uncertainties. In this context, the results from the present study assume great significance.
3.2 Dust fraction over the IGP
In order to delineate the possible role of long-range transported dust to the observed vertical heterogeneity over the IGP regions, cloud-free vertical profiles of σext were examined at 532 nm from the space-borne lidar CALIOP (Cloud-Aerosol Lidar with Orthogonal Polarization) aboard CALIPSO (Cloud-Aerosol Lidar and Infrared Pathfinder Satellite Observations) satellite. Cloudy profiles were screened out based on Liu et al. (2010) using a cloud aerosol discrimination (CAD) score in the range −70 to −100. The dust extinction coefficient was estimated from CALIPSO level-2 depolarization measurements over a period of 1 month from 20 May up to 20 June 2016, overlapping with the aircraft campaign measurement period, over a 2∘ × 2∘ spatial grid centred at the campaign base stations. Reported values of the depolarization ratio of dust aerosols are in the range 0.2–0.3, while non-dust ∕ spherical aerosols have a much lower depolarization ratio of magnitude in the range 0.02–0.07 (Yu, 2015). Based on this criterion, the dust extinction coefficient (σd) is obtained from the CALIOP measurements of particulate depolarization ratio (δp), total back-scattering coefficient (β), and with the a priori information on the typical values of depolarization ratio of dust (δd) ∕ non-dust particles (δnd) and the lidar ratio of dust aerosols (Sd) following Tesche et al. (2009). This method is advantageous in separating the pure dust extinction coefficient in mixed systems. CALIOP profiles of aerosol extinction coefficient averaged during the measurement period were normalized using the mean MODIS (Collection 6 – MYD08_D3_6_AOD_550_Dark_Target_Deep_Blue_ Combined_Mean) AOD (aerosol optical depth) during the same period over the study regions (Levy et al., 2013). Uncertainties in the CALIPSO retrievals are discussed in the Supplement.
Figure 7 shows the mean altitudinal profiles of aerosol extinction coefficient (dash line) and dust extinction coefficient (dot line), derived from CALIPSO as mentioned above. The profiles are smoothed by performing a 3-point running average. The dust fraction, or the contribution of dust extinction to total extinction, is also shown (solid line). The highest dust fraction (dust contribution to the total extinction) occurs over the western IGP (JDR), where it shows a steady increase with altitude from ∼ 10 % to 20 % at 300 m to close to 100 % above 2 km, vindicating the earlier inference drawn from the spectral variation of αscat. As we move to the central IGP, the dust seems to be well mixed throughout the column (with a small peak at ∼ 1.5 km). Moreover, it should also be kept in mind that, while the dust over the western IGP is pristine in nature, over the central IGP it is more absorbing in nature because of its mixing with other anthropogenic emissions (such as BC) (Srivastava et al., 2012), as also has been indicated by high αscat values in the range 1.4–1.9. The smallest dust fraction (< 10 %) is observed over BBR (eastern IGP), which is far away from dust source regions, has αscat values of ∼ 2.0 and has significant industrial and anthropogenic emissions.
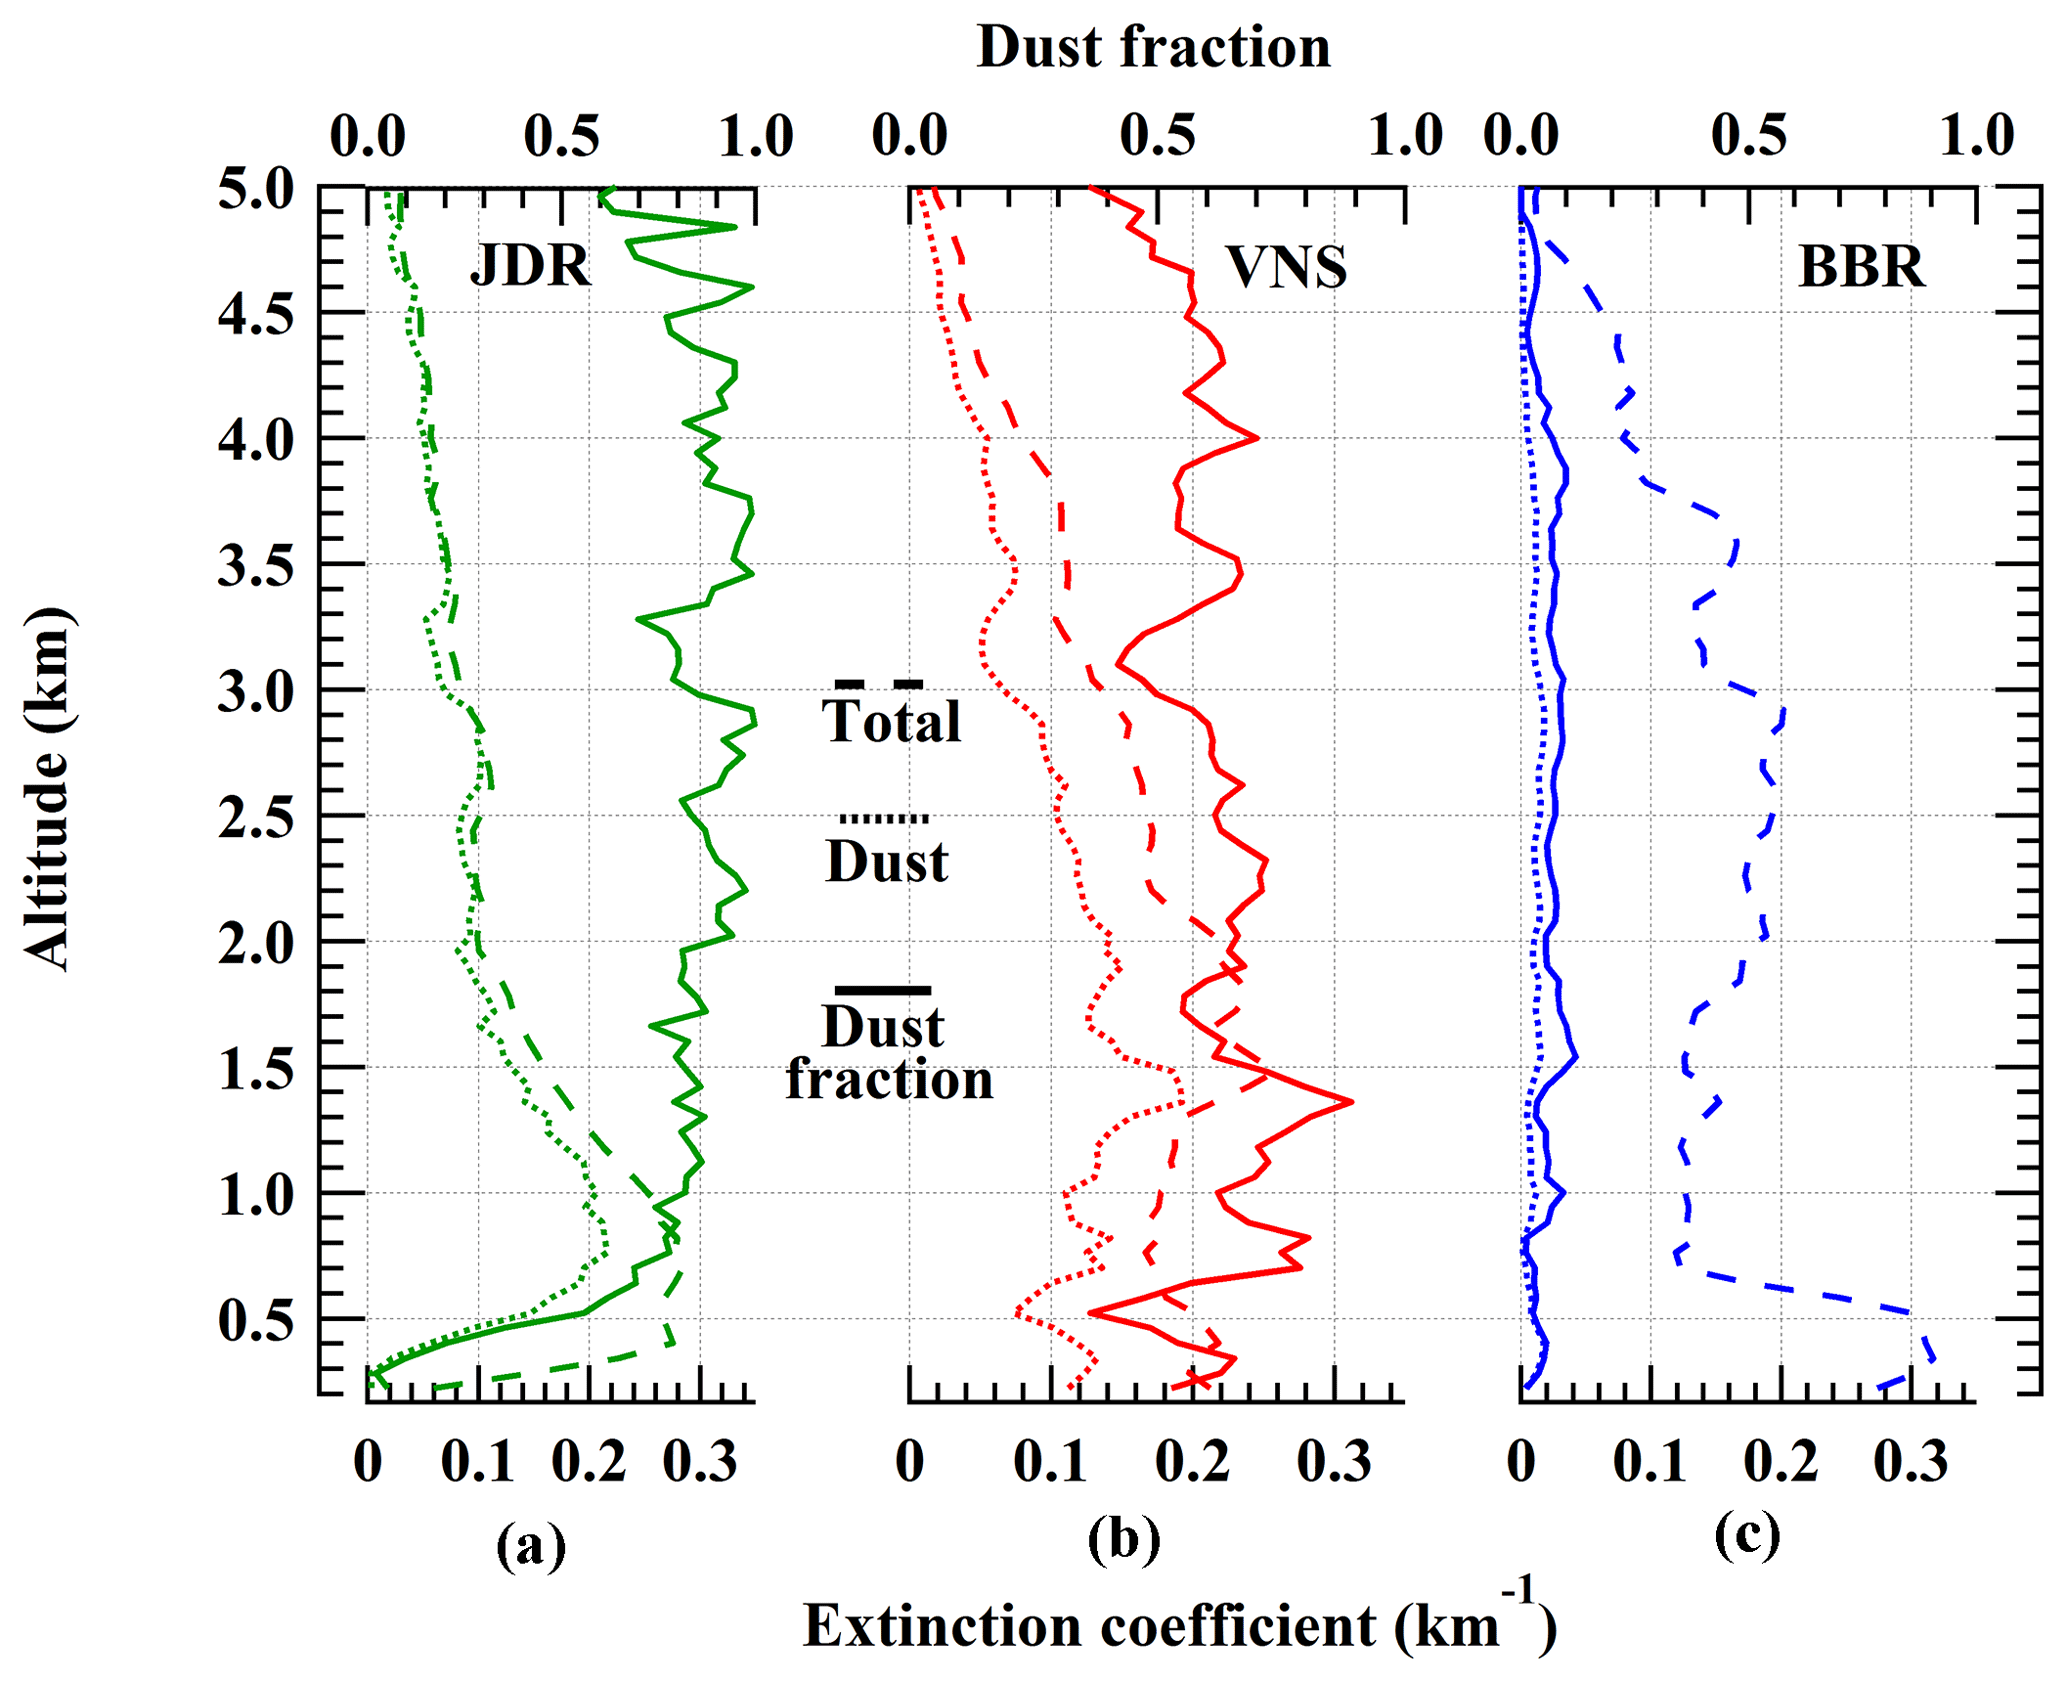
Figure 7CALIPSO-derived total (dashed line) and dust (dotted line) extinction profiles over the stations (a) JDR, (b) VNS and (c) BBR. Also shown is the dust fraction (solid line) for the three stations.
3.3 Aerosol radiative forcing and atmospheric heating
A discrete ordinate radiative transfer (DISORT)-based model (Santa Barbara DISORT Atmospheric Radiative Transfer (SBDART), Ricchiazzi et al., 1998) was used to estimate aerosol forcing on short-wave fluxes. Inputs to the model were latitude, longitude, day of year, surface pressure at the station, surface albedo, spectral values of AOD and SSA and Legendre moments of the aerosol phase function. Spectral surface albedo values for all the stations were taken from the MODIS Albedo product (level 3; MCD43C) (Schaaf et al., 2002). Spectral values of AOD for each level were obtained from the sum total of layer-integrated values of in situ spectral σscat and σabs, assuming a well-mixed layer of 200 m above and below the measurement altitude. SSA values for each level were obtained from the ratio of spectral σscat to the sum of spectral σscat and σabs. Legendre moments of the aerosol phase function were calculated using the asymmetry parameter (g), which was obtained using the Henyey–Greenstein approximation (Wiscombe and Grams, 1976). The SBDART model simulation for short-wave radiative flux was estimated with and without aerosols with eight radiation streams at intervals of 1 h and then diurnally averaged. The net short-wave aerosol radiative forcing (ARF) at the top of atmosphere (TOA) and surface (SUR) was then computed as ΔFTOA∕SUR = Flux_withaerosol TOA∕SUR − Flux_withoutaerosol TOA∕SUR. The difference between TOA and surface forcing is the atmospheric forcing represented as . McComiskey et al. (2008) estimated uncertainty in the calculation of ΔF to be in the range 20 %–80 %. The wide range of uncertainties in ΔF is due to uncertainties associated with measurements of AOD, SSA, g and surface reflectance. They assumed 3 % uncertainty in the SSA calculation. In the present case SSA uncertainties are ∼ 13 %; hence the uncertainties in ΔF calculations are likely to be on the higher side.
Figure 8 shows the aerosol-induced short-wave radiative forcing (ΔF) at TOA – filled black bar, at SUR – filled white bar, and in the atmosphere (ATM) – filled grey bar, for the three regions of the IGP: west (JDR), central (VNS) and east (BBR). Vertical error bars represent the standard deviation around the mean. The net effect of aerosols on the (ΔF)TOA and (ΔF)SUR is cooling, with −8.2 and −16.9 W m−2 in the west IGP, −6.5 and −22.9 W m−2 in the central IGP and −5.4 and −15.3 W m−2 in the eastern IGP, with decreasing magnitudes of the TOA forcing from west to east and a sharp peak in the central IGP at the surface. The atmospheric forcing (ΔF)ATM (W m−2), which represents the amount of radiation absorbed or trapped by the atmosphere and thus results in heating of the atmospheric layer, is maximum in the central IGP (16.4 ± 0.2), followed by the eastern and western IGP, where the (ΔF)ATM values are 10 ± 2 and 9 ± 3. Significant variability in (ΔF)ATM values over the western and eastern IGP stems from high vertical variation in σext, whereas the central IGP has significant variability in σext only near the surface. Over the eastern IGP scattering coefficient (58 ± 6) is comparable to that over the west (63 ± 5) and central (69 ± 14) IGP. However, the absorption coefficient is lower than in the central IGP. Due to significant industrial activities in the eastern IGP, a source of sulfate, combined with a sea breeze, source of sea salt, aerosols over the region are scattering in nature, as indicated by relatively high SSA values of 0.79 compared to the central IGP SSA (0.73). TOA forcing in the eastern IGP is −5.4 Wm−2 compared to −6.5 Wm−2 over central IGP. TOA cooling over the eastern IGP is lower than in the central IGP due to its lower abundance.
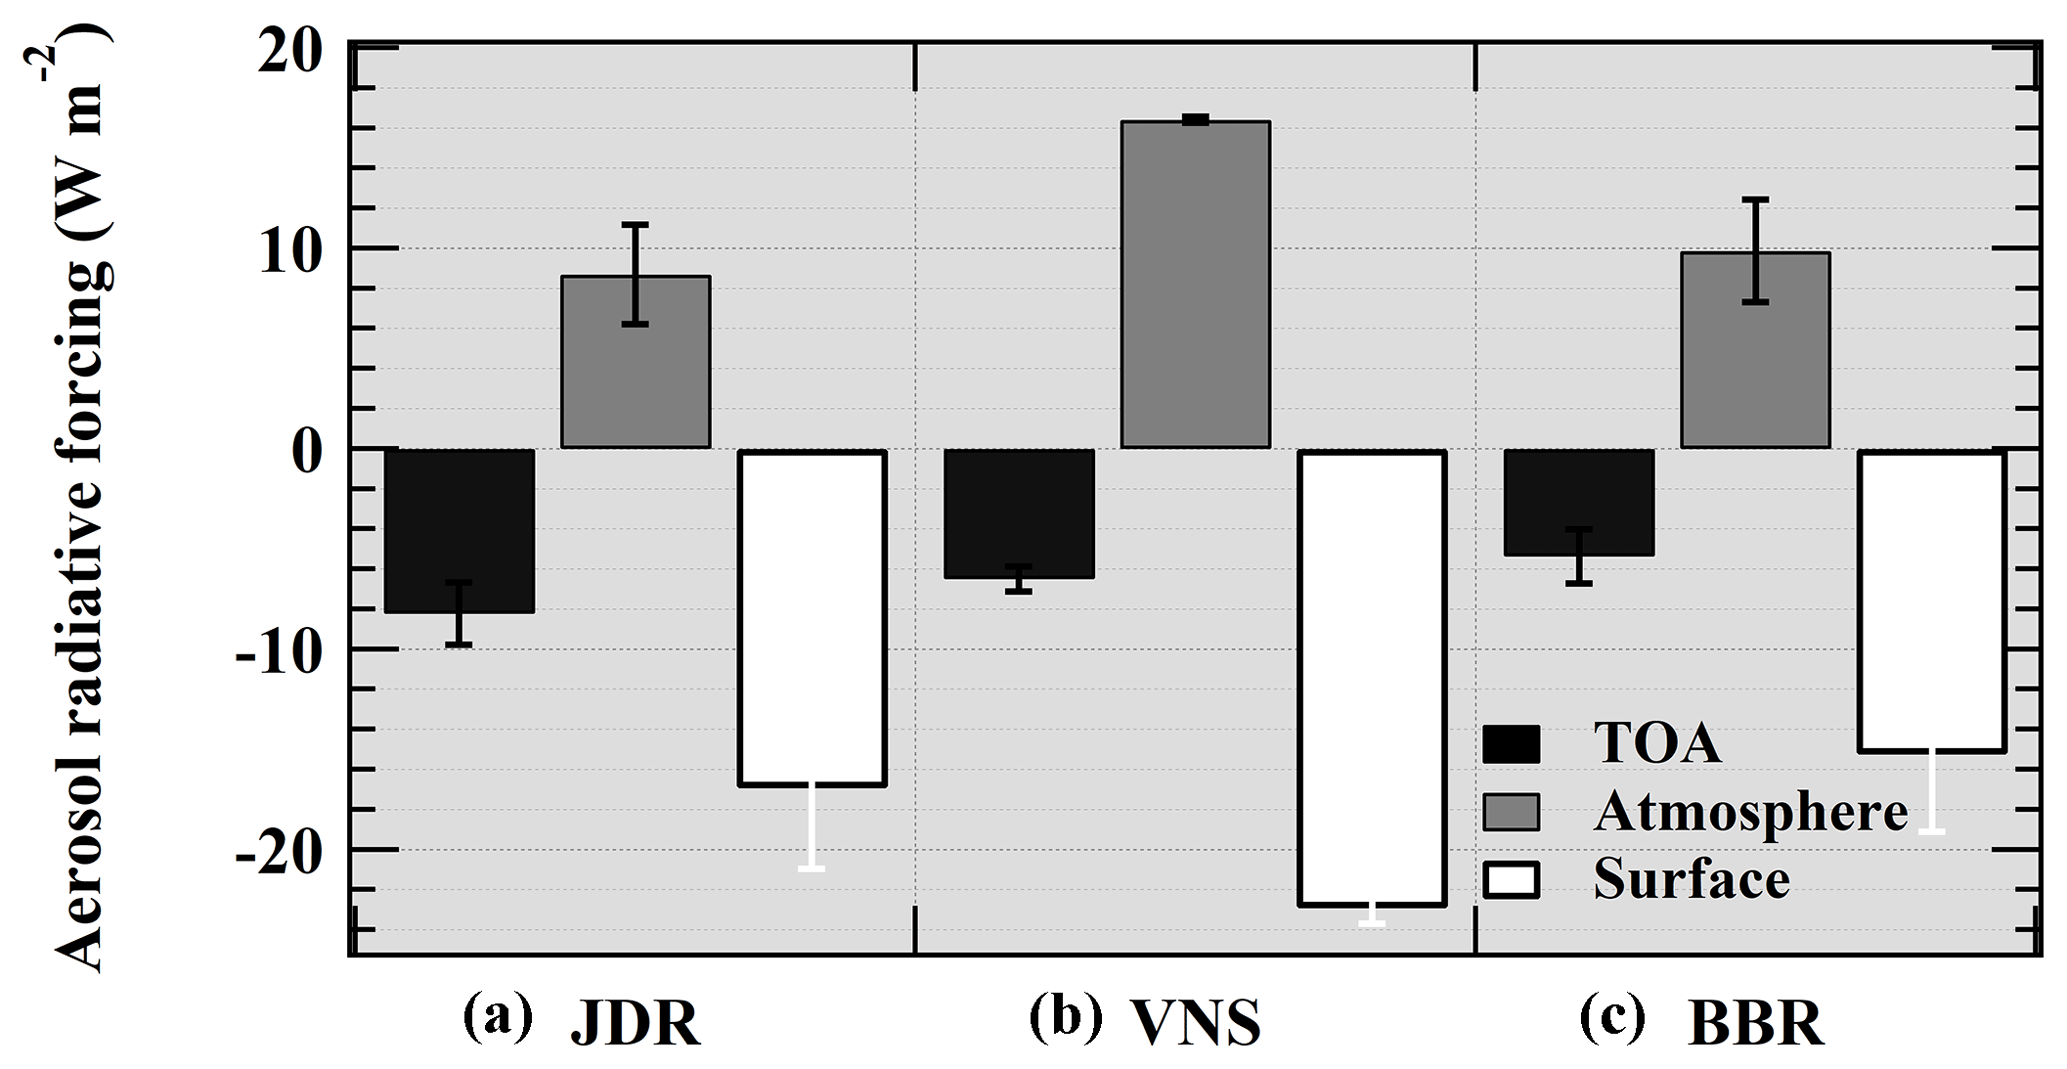
Figure 8Aerosol-induced short-wave radiative forcing at the top of atmosphere (TOA) (filled black bar), surface (filled white bar) and atmosphere (filled grey bar) for the regions of the IGP: (a) west (JDR), (b) centre (VNS), (c) and east (BBR). Error bars represent standard deviation around the mean.
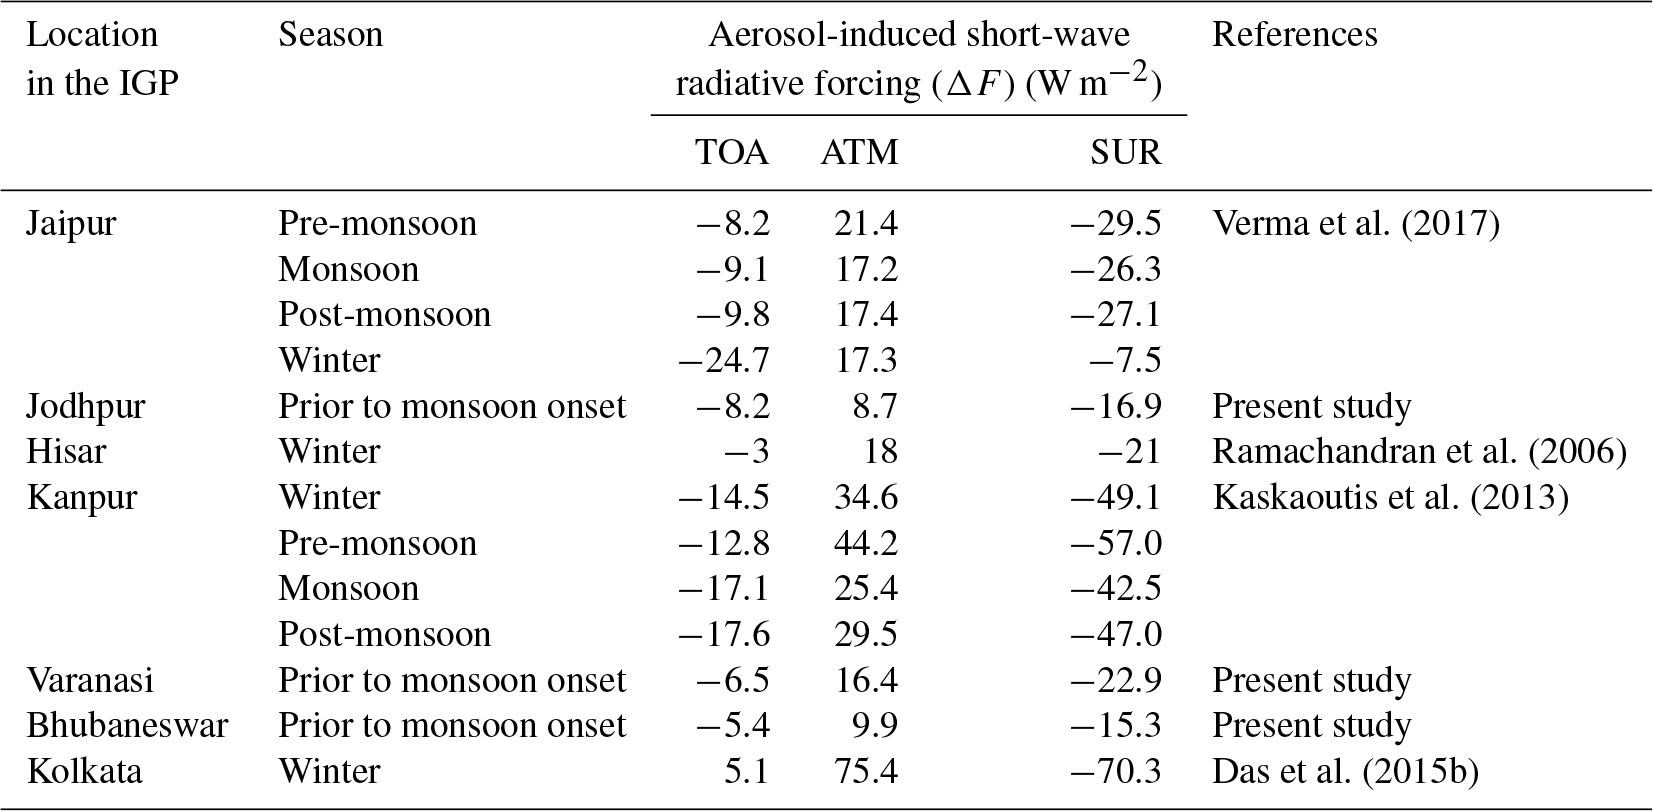
The forcing values found in the present study are examined against those reported from other stations in the IGP, as listed in Table 4. The (ΔF)TOA for Jodhpur is comparable with Jaipur for the pre-monsoon season but the (ΔF)ATM and (ΔF)SUR are significantly different. ΔF for Varanasi and Kanpur, both in the central IGP, are in good agreement for pre-monsoon seasons. For Bhubaneswar and Kolkata, both in the eastern IGP, there are significant differences in (ΔF)TOA, (ΔF)ATM and (ΔF)SUR values. While (ΔF)TOA is negative for Bhubaneswar its positive for Kolkata, but for the winter season, indicating a net gain of energy by the earth–atmosphere system. The differences in the ΔF estimates are likely due to change in surface type, variation in column abundance of aerosols and their vertical distribution, SSA, etc.
Table 4Aerosol-induced short-wave radiative forcing at various locations in the IGP.
The impact of radiation absorbed by an aerosol layer in the atmosphere is represented in terms of atmospheric heating rate (Liou, 2002). Aerosol-induced heating rate was calculated using Eq. (5):
where is the heating rate (K d−1), g is the acceleration due to gravity, Cp is the specific heat capacity of air at constant pressure, and ΔP is the atmospheric pressure difference between the top and bottom boundaries of the layer, and ΔF is aerosol-induced forcing in the layer.
Figure 9 shows altitudinal profile of the heating rates, thus estimated, over each of the regions. While the solid line in the figure represents heating rate profiles calculated using in situ level-averaged values of aerosol properties, the dashed-dotted line represents an identical calculation but with single-columnar SSA values for each station. Heating rate profiles for the western, central and eastern IGP regions are distinctively different. The western IGP shows a gradual increase in heating as we move away from the surface, attains maxima at 1.5 km and then reduces as we go up. The central IGP has maximum heating near the surface and it decreases with altitude. The eastern IGP exhibits an increase in heating with altitude. Near-surface (500–1000 m) heating maxima in the western IGP (JDR) is due to enhanced absorption by dust aerosols which are present in a significant amount near the surface (JDR, Fig. 7), as evident from high extinction coefficient and high dust fraction. In central IGP (VNS) significantly absorbing aerosol layer, with SSA ∼ 0.7, is present from surface to ∼ 1 km. This combined with enhanced aerosol loading at 500 m layer, results in high absorption and thereby significant heating of the layer. Over the eastern IGP (BBR) coarse-mode dust subsides due to the gravitational setting but fine-mode dust mixed/coated with anthropogenic aerosols may still be present in appreciable amount at higher altitudes. This results in significant layer heating at ∼ 3000 m over BBR where the dust fraction increases from ∼ 0 % at surface to ∼ 10 % at 3 km.
Comparing the heating rate profiles obtained using altitude-resolved SSA with those estimated using the columnar SSA in Fig. 9 emphasizes the importance of the knowledge of the altitude profile. The use of a single SSA value for the entire column overestimates the heating at higher levels in the western IGP and largely underestimates, by as much as 0.2 K day−1, in the eastern IGP. In the central IGP it underestimates the heating rates at lower altitudes, specifically at layers with significant absorbing aerosol loading. Uncertainties in the calculation of the heating rate stem from uncertainties associated with the measurements of AOD, SSA, surface reflectance and calculation of g. An uncertainty of 20 %–80 % in the calculation of ΔF is reported by McComiskey et al. (2008). Hence, heating rate profiles presented here are likely to have the same uncertainty bands as associated with ΔF. Considering the uncertainties, the underestimation or overestimation of heating rates may not be statistically significant in the central and the west IGP but is significant at upper levels in eastern IGP.
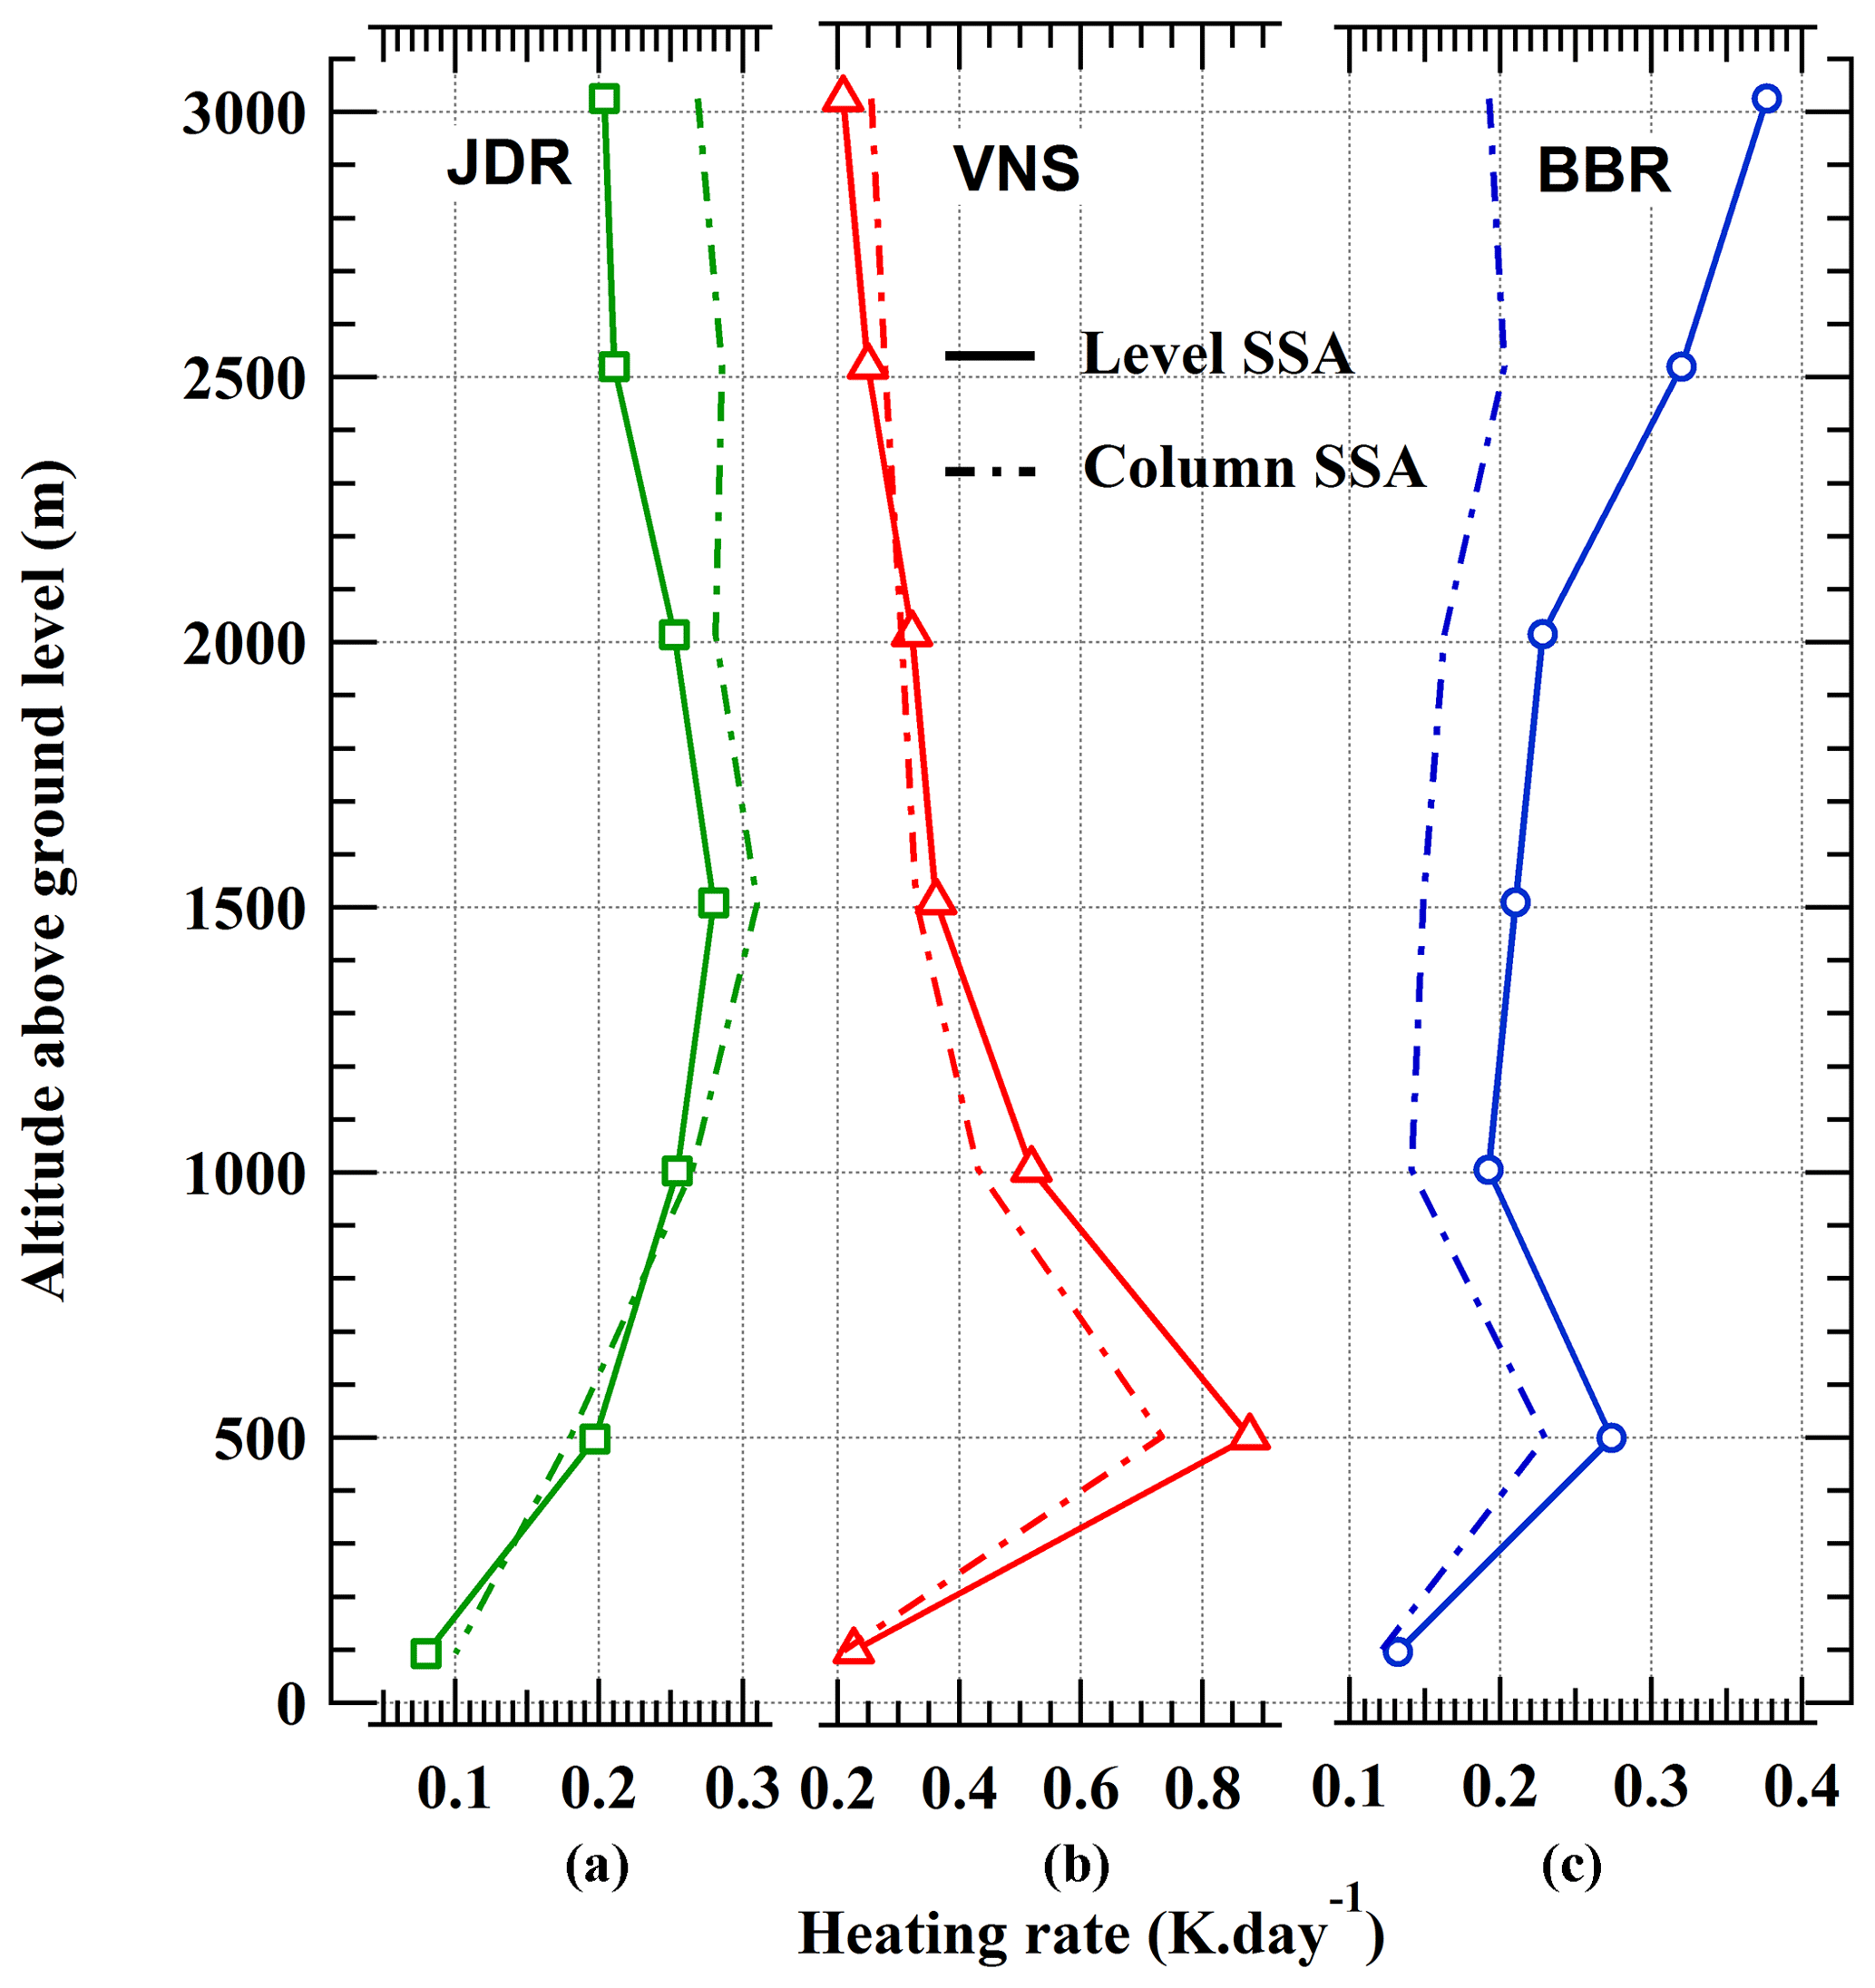
Figure 9Altitudinal heating rate profiles for the stations (a) JDR, (b) VNS and (c) BBR. Solid lines are for heating profiles calculated using in situ aircraft profile data and layer-averaged aerosol properties. Dashed-dotted lines represent heating profiles calculated using in situ aircraft profile data and column-averaged aerosol SSA.
Contrary to the findings of Kuhlmann and Quaas (2010), who found a peak in heating rate in the IGP at around ∼ 2.5 km, our study shows that over the central IGP maximum heating occurs around 0.5 km and in the eastern IGP it is around 2.5–3.0 km, bringing out a spatial variation across the IGP. A reduction in SSA values at higher altitudes in the eastern IGP may result in enhanced atmospheric heating and surface dimming. This might reduce the temperature gradient between surface and atmosphere, leading to reduced boundary layer convection (Feng et al., 2016). Analysis of a decadal (2001–2010) aerosol data set from the AERONET station in Kanpur revealed mean and peak heating rates in the ranges 0.6–1.1 and 0.9–1.7 K d−1 (Kaskaoutis et al., 2013) in the central IGP. Sarangi et al. (2016) have shown that, due to enhanced absorption by aerosols at altitudes of 1.5 km and above, there is reduction in incoming solar flux in the lower troposphere and associated cooling of about 2 to 3 K in the IGP. The horizontal and vertical gradients in the heating rate found in the present study depict the complex nature of the influence of aerosols on atmospheric stability over the Indian landmass. A similar scenario exists over the adjoining oceanic regions, the Arabian Sea and Bay of Bengal as well, where a gradient in aerosol-induced atmospheric heating rate was found which increased from ∼ 0.1 K d−1 in the south-western Arabian Sea to as high as ∼ 0.5 K d−1 over the north-eastern Bay of Bengal (Nair et al., 2013).
Radiative and hydrological implications of the observed decrease in SSA over the entire IGP, prior to the onset of the ISM, needs detailed investigation using numerical models. A gradient in vertical heating rates, both regionally and longitudinally in the IGP, might induce anomalous radiative effects, leading to reduced land–atmosphere thermal contrast (Feng et al., 2016) and enhanced stratification of the lower troposphere (Barbaro et al., 2013; Babu et al., 2002). This in a cumulative way can alter regional precipitation patterns (Chung and Zhang, 2004). Ignoring the vertically resolved SSA, and instead using column average values, may lead to considerable underestimations and overestimations of aerosol-induced heating rates for atmospheric layers with highly absorbing and scattering aerosols respectively. The significant findings, detailed in earlier sections, have implications for atmospheric stability, associated circulation patterns and possible modulations to the onset of the ISM and regional precipitation.
An aircraft campaign was conducted from 1 to 20 June 2016 to characterize aerosol radiative properties, both intensive and extensive, and its impact on atmospheric thermal structure prior to the onset of the Indian summer monsoon (ISM). The three base stations, Jodhpur (JDR), Varanasi (VNS) and Bhubaneswar (BBR) were aptly selected to represent the western, central and eastern IGP respectively. Exhaustive measurements of aerosol light scattering and light absorption properties were carried out to quantify enhanced absorption by aerosols. Major findings from the study are as follows:
-
As we move from west to east in the IGP, the aerosol type changes from super-micron-mode-dominant natural aerosols (desert dust), αscat ∼ 0.9, to submicron-mode-dominant anthropogenic aerosols (mix of aerosols from industrial sources, fossil fuel and biomass burning, etc.), αscat ∼ 2.0.
-
The central and eastern IGP have opposite SSA trends. While SSA in central IGP increases vertically that in the eastern IGP decreases. A reduction in SSA values, from ∼ 0.8 to ∼ 0.76, at higher altitudes in the eastern IGP may results in enhanced atmospheric heating and surface dimming.
-
The heterogeneous altitudinal SSA points towards inaccuracies that may arise in the estimation of aerosol absorption and atmospheric forcing and heating rates using a single-columnar SSA value and highlights the need for region-specific, altitude-resolved values of SSA and estimate layer-by-layer forcing and heating rates for a more accurate climate impact assessment.
-
Aerosols across the Indo-Gangetic Plain become highly absorbing prior to the onset of the Indian summer monsoon, compared to winter and spring, due to a change in source strength and transport patterns.
-
Aerosol-induced short-wave radiative forcing at the top of atmosphere, surface and atmosphere were −8.2, −16.9, 8.7 W m−2 for west IGP (JDR), −6.5, −22.9, 16.4 W m−2 for central IGP (VNS), and −5.36, −15.3, 9.9 W m−2 for the eastern IGP (BBR) respectively.
-
Atmospheric heating rate profiles with layer-resolved SSA and column-averaged SSA values differed remarkably for highly absorbing and scattering aerosol layers. While usage of column-averaged SSA underestimated the heating for highly absorbing aerosol layers, it did the opposite for scattering aerosol layers.
To sum up, a system of highly absorbing aerosols, with SSA values as low as ∼ 0.7, prevails over the IGP prior to the onset of the ISM. This, combined with the fact that elevated absorbing aerosol layers may occur at different altitudes across the IGP, has implications for atmospheric stability, time of monsoon onset and regional precipitation patterns. Further studies, combining aerosols radiative properties with cloud parameters, viz. cloud optical depth, cloud albedo and fraction, etc. will help to discern the effects of enhanced absorption prior to the onset of the ISM on the regional climate.
Details of aircraft data used in this manuscript and the point of contact are available at http://spl.gov.in; “Research Themes”; “Aerosols and Radiative Forcing”.
The supplement related to this article is available online at: https://doi.org/10.5194/acp-18-17669-2018-supplement.
SSB, SKS and KKM conceptualized the experiment and finalized the methodology. SSB,AV, VJ and MMG conducted the measurement on board aircraft. AV carried out the scientific analysis of the aircraft data and drafted the manuscript. NBL carried out the CALIPSO data analysis and drafted the section on “Dust fraction over the IGP”. KKM, SSB and SKS carried out the review and editing of the manuscript.
The authors declare that they have no conflict of interest.
This article is part of the special issue “Interactions between aerosols and the South West Asian monsoon”. It is not associated with a conference.
This study was carried out as part of the SWAAMI–RAWEX campaigns. We thank
the director of the National Remote Sensing Centre (NRSC), Hyderabad and the
Aerial Services and Digital Mapping Area (AS & DMA) for providing the
aircraft support for this experiment. The authors wish to thank the crew of
the aircraft for their help throughout the field campaign and the
wholehearted support of the NRSC aircraft team. Aditya Vaishya is supported
by the Department of Science and Technology, Government of India, through its
INSPIRE Faculty Programme. MERRA data were obtained from the website
http://mirador.gsfc.nasa.gov/ (last access: 10 May 2018). MODIS albedo
products were obtained from NASA's Earth data portal. CALIPSO extinction
profiles are obtained from
http://www-calipso.larc.nasa.gov/tools/data_avail (last access: 10 May
2018). Details of ARFINET data and aircraft data used in this manuscript and
the point of contact are available at http://spl.gov.in (last access:
15 June 2018), Research Themes, Aerosol Radiative Forcing Section. The SWAAMI
project was supported by MoES.
Edited by:
Manvendra K. Dubey
Reviewed by: V. Rao Kotamarthi and one
anonymous referee
Anderson, T. L., Covert, D. S., Marshall, S. F., Laucks, M. L., Charlson, R. J., Waggoner, A. P., Ogren, J. A., Caldow, R., Holm, R. L., Quant, F. R., Sem, G. J., Wiedensohler, A., Ahlquist, N. A., and Bates, T. S.: Performance characteristics of a high-sensitivity, three-wavelength, total scatter/backscatter nephelometer, J. Atmos. Ocean. Tech., 13, 967–986, https://doi.org/https://doi.org/10.1175/1520-0426(1996)013<0967:PCOAHS>2.0.CO;2, 1996.
Anderson, T. L. and Ogren, J. A.: Determining aerosol radiative properties using the TSI 3563 integrating nephelometer, Aerosol Sci. Technol., 29, 57–69, 1998.
Ångström, A.: The parameters of atmospheric turbidity, Tellus, 16, 64–75, 1964.
Babu, S. S. and Moorthy, K. K.: Aerosol black carbon over a tropical coastal station in India, Geophys. Res. Lett., 29, 13–11, 2002.
Babu, S. S., Satheesh, S. K., and Moorthy, K. K.: Aerosol radiative forcing due to enhanced black carbon at an urban site in India, Geophys. Res. Lett., 29, 27–21, 2002.
Babu, S. S., Gogoi, M. M., Kumar, V. H. A., Nair, V. S., and Moorthy, K. K.: Radiative properties of Bay of Bengal aerosols: Spatial distinctiveness and source impacts, J. Geophys. Res.-Atmos., 117, D06213, https://doi.org/10.1029/2011JD017355, 2012.
Babu, S. S., Manoj, M. R., Moorthy, K. K., Gogoi, M. M., Nair, V. S., Kompalli, S. K., Satheesh, S. K., Niranjan, K., Ramagopal, K., Bhuyan, P. K., and Singh, D.: Trends in aerosol optical depth over Indian region: Potential causes and impact indicators, J. Geophys. Res.-Atmos., 118, 11794–11806, https://doi.org/10.1002/2013JD020507, 2013.
Babu, S. S., Nair, V. S., Gogoi, M. M., and Krishna Moorthy, K.: Seasonal variation of vertical distribution of aerosol single scattering albedo over Indian sub-continent: RAWEX aircraft observations, Atmos. Environ., 125, 312–323, https://doi.org/10.1016/j.atmosenv.2015.09.041, 2016.
Barbaro, E., Vilà-Guerau de Arellano, J., Krol, M. C., and Holtslag, A. A. M.: Impacts of Aerosol Shortwave Radiation Absorption on the Dynamics of an Idealized Convective Atmospheric Boundary Layer, Bound.-Lay. Meteorol., 148, 31–49, https://doi.org/10.1007/s10546-013-9800-7, 2013.
Chung, C. E. and Zhang, G. J.: Impact of absorbing aerosol on precipitation: Dynamic aspects in association with convective available potential energy and convective parameterization closure and dependence on aerosol heating profile, J. Geophys. Res.-Atmos., 109, 1–10, https://doi.org/10.1029/2004JD004726, 2004.
Collaud Coen, M., Weingartner, E., Apituley, A., Ceburnis, D., Fierz-Schmidhauser, R., Flentje, H., Henzing, J. S., Jennings, S. G., Moerman, M., Petzold, A., Schmid, O., and Baltensperger, U.: Minimizing light absorption measurement artifacts of the Aethalometer: evaluation of five correction algorithms, Atmos. Meas. Tech., 3, 457–474, https://doi.org/10.5194/amt-3-457-2010, 2010.
Das, N., Baral, S. S., Sahoo, S. K., Mohapatra, R. K., Ramulu, T. S., Das, S. N., and Chaudhury, G. R.: Aerosol physical characteristics at Bhubaneswar, East coast of India, Atmos. Res., 93, 897–901, https://doi.org/10.1016/j.atmosres.2009.04.013, 2009.
Das, S., Dey, S., Dash, S. K., and Basil, G.: Examining mineral dust transport over the Indian subcontinent using the regional climate model, RegCM4.1, Atmos. Res., 134, 64–76, https://doi.org/10.1016/j.atmosres.2013.07.019, 2013.
Das, S., Dey, S., Dash, S. K., Giuliani, G., and Solmon, F.: Dust aerosol feedback on the Indian summer monsoon: Sensitivity to absorption property, J. Geophys. Res.-Atmos., 120, 9642–9652, https://doi.org/10.1002/2015JD023589, 2015a.
Das, S. K., Chatterjee, A., Ghosh, S. K., and Raha, S.: An integrated campaign for investigation of winter-time continental haze over Indo-Gangetic Basin and its radiative effects, Sci. Total Environ., 533, 370–382, https://doi.org/10.1016/j.scitotenv.2015.06.085, 2015b.
Dey, S. and Di Girolamo, L.: A climatology of aerosol optical and microphysical properties over the Indian subcontinent from 9 years (2000–2008) of Multiangle Imaging Spectroradiometer (MISR) data, J. Geophys. Res.-Atmos., 115, D15204, https://doi.org/10.1029/2009JD013395, 2010.
Dipu, S., Prabha, T. V., Pandithurai, G., Dudhia, J., Pfister, G., Rajesh, K., and Goswami, B. N.: Impact of elevated aerosol layer on the cloud macrophysical properties prior to monsoon onset, Atmos. Environ., 70, 454–467, https://doi.org/10.1016/j.atmosenv.2012.12.036, 2013.
Drinovec, L., Mocnik, G., Zotter, P., Prévôt, A. S. H., Ruckstuhl, C., Coz, E., Rupakheti, M., Sciare, J., Müller, T., Wiedensohler, A., and Hansen, A. D. A.: The “dual-spot” Aethalometer: an improved measurement of aerosol black carbon with real-time loading compensation, Atmos. Meas. Tech., 8, 1965–1979, https://doi.org/10.5194/amt-8-1965-2015, 2015.
Dumka, U. C. and Kaskaoutis, D. G.: In-situ measurements of aerosol properties and estimates of radiative forcing efficiency over Gangetic-Himalayan region during the GVAX field campaign, Atmos. Environ., 94, 96–105, https://doi.org/10.1016/j.atmosenv.2014.05.021, 2014.
Feng, Y., Kotamarthi, V. R., Coulter, R., Zhao, C., and Cadeddu, M.: Radiative and thermodynamic responses to aerosol extinction profiles during the pre-monsoon month over South Asia, Atmos. Chem. Phys., 16, 247–264, https://doi.org/10.5194/acp-16-247-2016, 2016.
Gautam, R., Hsu, N. C., Lau, K.-M., and Kafatos, M.: Aerosol and rainfall variability over the Indian monsoon region: distributions, trends and coupling, Ann. Geophys., 27, 3691–3703, https://doi.org/10.5194/angeo-27-3691-2009, 2009.
Gautam, R., Hsu, N. C., and Lau, K. M.: Premonsoon aerosol characterization and radiative effects over the Indo-Gangetic plains: Implications for regional climate warming, J. Geophys. Res.-Atmos., 115, D17208, https://doi.org/10.1029/2010JD013819, 2010.
Gogoi, M. M., Moorthy, K. K., Kompalli, S. K., Chaubey, J. P., Babu, S. S., Manoj, M. R., Nair, V. S., and Prabhu, T. P.: Physical and optical properties of aerosols in a free tropospheric environment: Results from long-term observations over western trans-Himalayas, Atmos. Environ., 84, 262–274, https://doi.org/10.1016/j.atmosenv.2013.11.029, 2014.
Govardhan, G., Satheesh, S. K., Nanjundiah, R., Moorthy, K. K., and Babu, S. S.: Possible climatic implications of high-altitude black carbon emissions, Atmos. Chem. Phys., 17, 9623–9644, https://doi.org/10.5194/acp-17-9623-2017, 2017.
Heintzenberg, J. and Charlson, R. J.: Design and applications of the integrating nephelometer: A review, J. Atmos. Ocean. Tech., 13, 987–1000, https://doi.org/10.1175/1520-0426(1996)013<0987:DAAOTI>2.0.CO;2, 1996.
Herbelin, J. M. and McKay, J. A.: Development of laser mirrors of very high reflectivity using cavity-attenuated phase-shift method, Appl. Opt., 20, 3341–3344, 1981.
Jayaraman, A., Satheesh, S., Mitra, A., and Ramanathan, V.: Latitude gradient in aerosol properties across the Inter Tropical Convergence Zone: Results from the joint Indo-US study onboard Sagar Kanya, Curr. Sci., 80, 128–137, 2001.
Kaskaoutis, D. G., Sinha, P. R., Vinoj, V., Kosmopoulos, P. G., Tripathi, S. N., Misra, A., Sharma, M., and Singh, R. P.: Aerosol properties and radiative forcing over Kanpur during severe aerosol loading conditions, Atmos. Environ., 79, 7–19, https://doi.org/10.1016/j.atmosenv.2013.06.020, 2013.
Kebabian, P. L., Robinson, W. A., and Freedman, A.: Optical extinction monitor using cw cavity enhanced detection, Rev. Sci. Instrum., 78, p. 063102, 2007.
Kirchstetter, T. W., Novakov, T., and Hobbs, P. V.: Evidence that the spectral dependence of light absorption by aerosols is affected by organic carbon, J. Geophys. Res.-Atmos., 109, D21208, https://doi.org/10.1029/2004JD004999, 2004.
Kompalli, S. K., Suresh Babu, S., Bharatan, L. N., and Krishna Moorthy, K.: Spring-time enhancement in aerosol burden over a high-altitude location in western trans-Himalaya: Results from long-term observations, Curr. Sci., 111, 117–131, https://doi.org/10.18520/cs/v111/i1/117-131, 2016.
Kuhlmann, J. and Quaas, J.: How can aerosols affect the Asian summer monsoon? Assessment during three consecutive pre-monsoon seasons from CALIPSO satellite data, Atmos. Chem. Phys., 10, 4673–4688, https://doi.org/10.5194/acp-10-4673-2010, 2010.
Lack, D. A., Moosmüller, H., McMeeking, G. R., Chakrabarty, R. K., and Baumgardner, D.: Characterizing elemental, equivalent black, and refractory black carbon aerosol particles: A review of techniques, their limitations and uncertainties, Anal. Bioanal. Chem., 406, 99–122, https://doi.org/10.1007/s00216-013-7402-3, 2014.
Lal, D. M., Patil, S. D., Singh, H. N., Ghude, S. D., Tiwari, S., and Srivastava, M. K.: Influence of aerosol on clouds over the Indo-Gangetic Plain, India, Clim. Dynam., 41, 601–612, https://doi.org/10.1007/s00382-013-1775-z, 2013.
Lau, W. K. M. and Kim, K. M.: Fingerprinting the impacts of aerosols on long-term trends of the Indian summer monsoon regional rainfall, Geophys. Res. Lett., 37, L16705, https://doi.org/10.1029/2010GL043255, 2010.
Levy, R. C., Mattoo, S., Munchak, L. A., Remer, L. A., Sayer, A. M., Patadia, F., and Hsu, N. C.: The Collection 6 MODIS aerosol products over land and ocean, Atmos. Meas. Tech., 6, 2989–3034, https://doi.org/10.5194/amt-6-2989-2013, 2013.
Liou, K.-N.: An introduction to atmospheric radiation, Academic Press, USA, International Geophysics Series, 84, 1–583, 2002.
Liousse, C., Cachier, H., and Jennings, S. G.: Optical and thermal measurements of black carbon aerosol content in different environments: Variation of the specific attenuation cross-section, sigma (σ), Atmos. Environ., 27A, 1203–1211, 1993.
Liu, Z., Kuehn, R., Vaughan, M., Winker, D., Omar, A., Powell, K., Trepte, C., Hu, Y., and Hostetler, C.: The CALIPSO cloud and aerosol discrimination: Version 3 algorithm and test results, 25th International Laser Radar Conference, St. Petersburg, Russia, 5–9 July 2010, 155–158, 2010.
Massoli, P., Kebabian, P. L., Onasch, T. B., Hills, F. B., and Freedman, A.: Aerosol light extinction measurements by Cavity Attenuated Phase Shift (CAPS) spectroscopy: Laboratory validation and field deployment of a compact aerosol particle extinction monitor, Aerosol Sci. Technol., 44, 428–435, https://doi.org/10.1080/02786821003716599, 2010.
McComiskey, A., Schwartz, S. E., Schmid, B., Guan, H., Lewis, E. R., Ricchiazzi, P., and Ogren, J. A.: Direct aerosol forcing: Calculation from observables and sensitivities to inputs, J. Geophys. Res.-Atmos., 113, D09202, https://doi.org/10.1029/2007JD009170, 2008.
Moorthy, K. K., Babu, S. S., Sunilkumar, S. V., Gupta, P. K., and Gera, B. S.: Altitude profiles of aerosol BC, derived from aircraft measurements over an inland urban location in India, Geophys. Res. Lett., 31, 1–4, https://doi.org/10.1029/2004GL021336, 2004.
Moorthy, K. K., Babu, S. S., Satheesh, S. K., Srinivasan, J., and Dutt, C. B. S.: Dust absorption over the “Great Indian Desert” inferred using ground-based and satellite remote sensing, J. Geophys. Res.-Atmos., 112, D09206, https://doi.org/10.1029/2006JD007690, 2007.
Moorthy, K. K., Nair, V. S., Babu, S. S., and Satheesh, S. K.: Spatial and vertical heterogeneities in aerosol properties over oceanic regions around india: Implications for radiative forcing, Q. J. Roy. Meteor. Soc., 135, 2131–2145, https://doi.org/10.1002/qj.525, 2009.
Moorthy, K. K., Satheesh, S. K., and Kotamarthi, V. R.: Evolution of aerosol research in India and the RAWEX-GVAX: An overview, Curr. Sci., 111, 53–75, https://doi.org/10.18520/cs/v111/i1/53-75, 2016.
Müller, T., Henzing, J. S., de Leeuw, G., Wiedensohler, A., Alastuey, A., Angelov, H., Bizjak, M., Collaud Coen, M., Engström, J. E., Gruening, C., Hillamo, R., Hoffer, A., Imre, K., Ivanow, P., Jennings, G., Sun, J. Y., Kalivitis, N., Karlsson, H., Komppula, M., Laj, P., Li, S.-M., Lunder, C., Marinoni, A., Martins dos Santos, S., Moerman, M., Nowak, A., Ogren, J. A., Petzold, A., Pichon, J. M., Rodriquez, S., Sharma, S., Sheridan, P. J., Teinilä, K., Tuch, T., Viana, M., Virkkula, A., Weingartner, E., Wilhelm, R., and Wang, Y. Q.: Characterization and intercomparison of aerosol absorption photometers: result of two intercomparison workshops, Atmos. Meas. Tech., 4, 245–268, https://doi.org/10.5194/amt-4-245-2011, 2011.
Nair, V. S., Moorthy, K. K., Alappattu, D. P., Kunhikrishnan, P. K., George, S., Nair, P. R., Babu, S. S., Abish, B., Satheesh, S. K., Tripathi, S. N., Niranjan, K., Madhavan, B. L., Srikant, V., Dutt, C. B. S., Badarinath, K. V. S., and Reddy, R. R.: Wintertime aerosol characteristics over the Indo-Gangetic Plain (IGP): Impacts of local boundary layer processes and long-range transport, J. Geophys. Res.-Atmos., 112, D13205, https://doi.org/10.1029/2006JD008099, 2007.
Nair, V. S., Babu, S. S., and Moorthy, K. K.: Spatial distribution and spectral characteristics of aerosol single scattering albedo over the Bay of Bengal inferred from shipborne measurements, Geophys. Res. Lett., 35, L10806, https://doi.org/10.1029/2008GL033687, 2008.
Nair, V. S., Moorthy, K. K., Babu, S. S., and Satheesh, S. K.: Optical and physical properties of atmospheric aerosols over the Bay of Bengal during ICARB, J. Atmos. Sci., 66, 2640–2658, https://doi.org/10.1175/2009JAS3032.1, 2009.
Nair, V. S., Babu, S. S., Moorthy, K. K., and Prijith, S. S.: Spatial gradients in aerosol-induced atmospheric heating and surface dimming over the oceanic regions around India: Anthropogenic or natural?, J. Clim., 26, 7611–7621, https://doi.org/10.1175/JCLI-D-12-00616.1, 2013.
Nair, V. S., Babu, S. S., Gogoi, M. M., and Moorthy, K. K.: Large-scale enhancement in aerosol absorption in the lower free troposphere over continental India during spring, Geophys. Res. Lett., 43, 11453–11461, https://doi.org/10.1002/2016GL070669, 2016.
Padmakumari, B., Maheskumar, R. S., Morwal, S. B., Harikishan, G., Konwar, M., Kulkarni, J. R., and Goswami, B. N.: Aircraft observations of elevated pollution layers near the foothills of the Himalayas during CAIPEEX-2009, Q. J. Roy. Meteor. Soc., 139, 625–638, https://doi.org/10.1002/qj.1989, 2013.
Pant, P., Hegde, P., Dumka, U. C., Sagar, R., Satheesh, S. K., Moorthy, K. K., Saha, A., and Srivastava, M. K.: Aerosol characteristics at a high-altitude location in central Himalayas: Optical properties and radiative forcing, J. Geophys. Res.-Atmos., 111, D17206, https://doi.org/10.1029/2005JD006768, 2006.
Pathak, B., Kalita, G., Bhuyan, K., Bhuyan, P. K., and Moorthy, K. K.: Aerosol temporal characteristics and its impact on shortwave radiative forcing at a location in the Northeast of India, J. Geophys. Res.-Atmos., 115, D19204, https://doi.org/10.1029/2009JD013462, 2010.
Prasad, A. K. and Singh, R. P.: Changes in aerosol parameters during major dust storm events (2001–2005) over the Indo-Gangetic Plains using AERONET and MODIS data, J. Geophys. Res.-Atmos., 112, D09208, https://doi.org/10.1029/2006JD007778, 2007.
Prijith, S. S., Suresh Babu, S., Lakshmi, N. B., Satheesh, S. K., and Krishna Moorthy, K.: Meridional gradients in aerosol vertical distribution over Indian Mainland: Observations and model simulations, Atmos. Environ., 125, 337–345, https://doi.org/10.1016/j.atmosenv.2015.10.066, 2016.
Ram, K., Singh, S., Sarin, M. M., Srivastava, A. K., and Tripathi, S. N.: Variability in aerosol optical properties over an urban site, Kanpur, in the Indo-Gangetic Plain: A case study of haze and dust events, Atmos. Res., 174–175, 52–61, https://doi.org/10.1016/j.atmosres.2016.01.014, 2016.
Ramachandran, S.: Aerosol radiative forcing over Bay of Bengal and Chennai: Comparison with maritime, continental, and urban aerosol models, J. Geophys. Res.-Atmos., 110, 1–9, https://doi.org/10.1029/2005JD005861, 2005.
Ramachandran, S., Rengarajan, R., Jayaraman, A., Sarin, M. M., and Das, S. K.: Aerosol radiative forcing during clear, hazy, and foggy conditions over a continental polluted location in north India, J. Geophys. Res.-Atmos., 111, D20214, https://doi.org/10.1029/2006JD007142, 2006.
Ramana, M. V., Ramanathan, V., Kim, D., Roberts, G. C., and Corrigan, C. E.: Albedo, atmospheric solar absorption and heating rate measurements with stacked UAVs, Q. J. Roy. Meteorol. Soc., 133, 1913–1931, https://doi.org/10.1002/qj.172, 2007.
Ricchiazzi, P., Yang, S., Gautier, C., and Sowle, D.: SBDART: A research and teaching software tool for plane-parallel radiative transfer in the Earth's atmosphere, B. Am. Meteor. Soc., 79, 2101–2114, 1998.
Russell, P. B., Bergstrom, R. W., Shinozuka, Y., Clarke, A. D., DeCarlo, P. F., Jimenez, J. L., Livingston, J. M., Redemann, J., Dubovik, O., and Strawa, A.: Absorption Angstrom Exponent in AERONET and related data as an indicator of aerosol composition, Atmos. Chem. Phys., 10, 1155–1169, https://doi.org/10.5194/acp-10-1155-2010, 2010.
Sarangi, C., Tripathi, S. N., Mishra, A. K., Goel, A., and Welton, E. J.: Elevated aerosol layers and their radiative impact over Kanpur during monsoon onset period, J. Geophys. Res.-Atmos., 121, 7936–7957, https://doi.org/10.1002/2015JD024711, 2016.
Satheesh, S. K., Ramanathan, V., Li-Jones, X., Lobert, J. M., Podgorny, I. A., Prospero, J. M., Holben, B. N., and Loeb, N. G.: A model for the natural and anthropogenic aerosols over the tropical Indian Ocean derived from Indian Ocean Experiment data, J. Geophys. Res.-Atmos., 104, 27421–27440, 1999.
Satheesh, S. K., Moorthy, K. K., Babu, S. S., Vinoj, V., and Dutt, C. B. S.: Climate implications of large warming by elevated aerosol over India, Geophys. Res. Lett., 35, L19809, https://doi.org/10.1029/2008GL034944, 2008.
Schaaf, C. B., Gao, F., Strahler, A. H., Lucht, W., Li, X., Tsang, T., Strugnell, N. C., Zhang, X., Jin, Y., and Muller, J.-P.: First operational BRDF, albedo nadir reflectance products from MODIS, Remote Sens. Environ., 83, 135–148, 2002.
Schuster, G. L., Dubovik, O., and Holben, B. N.: Angstrom exponent and bimodal aerosol size distributions, J. Geophys. Res.-Atmos., 111, D07207, https://doi.org/10.1029/2005JD006328, 2006.
Segura, S., Estellés, V., Titos, G., Lyamani, H., Utrillas, M. P., Zotter, P., Prévôt, A. S. H., Mocnik, G., Alados-Arboledas, L., and Martínez-Lozano, J. A.: Determination and analysis of in situ spectral aerosol optical properties by a multi-instrumental approach, Atmos. Meas. Tech., 7, 2373–2387, https://doi.org/10.5194/amt-7-2373-2014, 2014.
Sinha, P. R., Dumka, U. C., Manchanda, R. K., Kaskaoutis, D. G., Sreenivasan, S., Krishna Moorthy, K., and Suresh Babu, S.: Contrasting aerosol characteristics and radiative forcing over Hyderabad, India due to seasonal mesoscale and synoptic-scale processes, Q. J. Roy. Meteor. Soc., 139, 434–450, https://doi.org/10.1002/qj.1963, 2012.
Smirnov, A., Holben, B. N., Kaufman, Y. J., Dubovik, O., Eck, T. F., Slutsker, I., Pietras, C., and Halthore, R. N.: Optical properties of atmospheric aerosol in maritime environments, J. Atmos. Sci., 59, 501–523, https://doi.org/10.1175/1520-0469(2002)059<0501:OPOAAI>2.0.CO;2, 2002.
Soni, K., Singh, S., Bano, T., Tanwar, R. S., Nath, S., and Arya, B. C.: Variations in single scattering albedo and Angstrom absorption exponent during different seasons at Delhi, India, Atmos. Environ., 44, 4355–4363, https://doi.org/10.1016/j.atmosenv.2010.07.058, 2010.
Srinivas, B. and Sarin, M. M.: Atmospheric dry-deposition of mineral dust and anthropogenic trace metals to the Bay of Bengal, J. Mar. Syst., 126, 56–68, https://doi.org/10.1016/j.jmarsys.2012.11.004, 2013.
Srivastava, A. K., Tiwari, S., Devara, P. C. S., Bisht, D. S., Srivastava, M. K., Tripathi, S. N., Goloub, P., and Holben, B. N.: Pre-monsoon aerosol characteristics over the Indo-Gangetic Basin: implications to climatic impact, Ann. Geophys., 29, 789–804, https://doi.org/10.5194/angeo-29-789-2011, 2011.
Srivastava, A. K., Tripathi, S. N., Dey, S., Kanawade, V. P., and Tiwari, S.: Inferring aerosol types over the Indo-Gangetic Basin from ground based sunphotometer measurements, Atmos. Res., 109–110, 64–75, https://doi.org/10.1016/j.atmosres.2012.02.010, 2012.
Suresh Babu, S., Krishna Moorthy, K., and Satheesh, S. K.: Temporal heterogeneity in aerosol characteristics and the resulting radiative impacts at a tropical coastal station – Part 2: Direct short wave radiative forcing, Ann. Geophys., 25, 2309–2320, https://doi.org/10.5194/angeo-25-2309-2007, 2007.
Talukdar, S., Jana, S., and Maitra, A.: Dominance of pollutant aerosols over an urban region and its impact on boundary layer temperature profile, J. Geophys. Res.-Atmos., 122, 1001–1014, https://doi.org/10.1002/2016JD025770, 2017.
Tesche, M., Ansmann, A., Müller, D., Althausen, D., Engelmann, R., Freudenthaler, V., and Groß, S.: Vertically resolved separation of dust and smoke over Cape Verde using multiwavelength Raman and polarization lidars during Saharan Mineral Dust Experiment 2008, J. Geophys. Res.-Atmos., 114, D13202, https://doi.org/10.1029/2009JD011862, 2009.
Vaishya, A., Singh, P., Rastogi, S., and Babu, S. S.: Aerosol black carbon quantification in the central Indo-Gangetic Plain: Seasonal heterogeneity and source apportionment, Atmos. Res., 185, 13–21, https://doi.org/10.1016/j.atmosres.2016.10.001, 2017.
Verma, S., Payra, S., Gautam, R., Prakash, D., Soni, M., Holben, B., and Bell, S.: Dust events and their influence on aerosol optical properties over Jaipur in Northwestern India, Environ. Monitor. Assess., 185, 7327–7342, https://doi.org/10.1007/s10661-013-3103-9, 2013.
Verma, S., Prakash, D., Srivastava, A. K., and Payra, S.: Radiative Forcing Estimation of Aerosols at an Urban Site near the Thar Desert Using Ground-Based Remote Sensing Measurements, Aerosol Air Qual. Res., 17, 1294–1304, https://doi.org/10.4209/aaqr.2016.09.0424, 2017.
Vinoj, V., Rasch, P. J., Wang, H., Yoon, J. H., Ma, P. L., Landu, K., and Singh, B.: Short-term modulation of Indian summer monsoon rainfall by West Asian dust, Nat. Geosci., 7, 308–313, https://doi.org/10.1038/ngeo2107, 2014.
Weingartner, E., Saathoff, H., Schnaiter, M., Streit, N., Bitnar, B., and Baltensperger, U.: Absorption of light by soot particles: Determination of the absorption coefficient by means of aethalometers, J. Aerosol Sci., 34, 1445–1463, 2003.
Weinzierl, B., Sauer, D., Esselborn, M., Petzold, A., Veira, A., Rose, M., Mund, S., Wirth, M., Ansmann, A., Tesche, M., Gross, S., and Freudenthaler, V.: Microphysical and optical properties of dust and tropical biomass burning aerosol layers in the Cape Verde region-an overview of the airborne in situ and lidar measurements during SAMUM-2, Tellus B, 63, 589–618, https://doi.org/10.1111/j.1600-0889.2011.00566.x, 2011.
Wiscombe, W. J. and Grams, G. W.: The backscattered fraction in two-stream approximations, J. Atmos. Sci., 33, 2440–2451, 1976.
Yu, H., Chin, M., Bian, H., Yuan, T., Prospero, J., Omar, A. H., Remer, L., Winker, D., Yang, W., Zhang, Y., and Zhang, Z.: Quantification of trans-Atlantic dust transport from seven-year (2007–2013) record of CALIPSO lidar measurements, Remote Sens. Environ, 159, 232–249, https://doi.org/10.1016/j.rse.2014.12.010, 2015.