the Creative Commons Attribution 4.0 License.
the Creative Commons Attribution 4.0 License.
 | 12 Dec 2018
Marine boundary layer aerosol in the eastern North Atlantic: seasonal variations and key controlling processes
Yang Wang
Allison C. Aiken
Francesca Gallo
Michael P. Jensen
Pavlos Kollias
Chongai Kuang
Edward Luke
Stephen Springston
Janek Uin
Robert Wood
Jian Wang
The response of marine low cloud systems to changes in aerosol concentration represents one of the largest uncertainties in climate simulations. Major contributions to this uncertainty are derived from poor understanding of aerosol under natural conditions and the perturbation by anthropogenic emissions. The eastern North Atlantic (ENA) is a region of persistent but diverse marine boundary layer (MBL) clouds, whose albedo and precipitation are highly susceptible to perturbations in aerosol properties. In this study, we examine MBL aerosol properties, trace gas mixing ratios, and meteorological parameters measured at the Atmospheric Radiation Measurement Climate Research Facility's ENA site on Graciosa Island, Azores, Portugal, during a 3-year period from 2015 to 2017. Measurements impacted by local pollution on Graciosa Island and during occasional intense biomass burning and dust events are excluded from this study. Submicron aerosol size distribution typically consists of three modes: Aitken (At, diameter nm), accumulation (Ac, Dp within ∼100 to ∼300 nm), and larger accumulation (LA, nm) modes, with average number concentrations (denoted as NAt, NAc, and NLA below) of 330, 114, and 14 cm−3, respectively. NAt, NAc, and NLA show contrasting seasonal variations, suggesting different sources and removal processes. NLA is dominated by sea spray aerosol (SSA) and is higher in winter and lower in summer. This is due to the seasonal variations of SSA production, in-cloud coalescence scavenging, and dilution by entrained free troposphere (FT) air. In comparison, SSA typically contributes a relatively minor fraction to NAt (10 %) and NAc (21 %) on an annual basis. In addition to SSA, sources of Ac-mode particles include entrainment of FT aerosols and condensation growth of Aitken-mode particles inside the MBL, while in-cloud coalescence scavenging is the major sink of NAc. The observed seasonal variation of NAc, being higher in summer and lower in winter, generally agrees with the steady-state concentration estimated from major sources and sinks. NAt is mainly controlled by entrainment of FT aerosol, coagulation loss, and growth of Aitken-mode particles into the Ac-mode size range. Our calculation suggests that besides the direct contribution from entrained FT Ac-mode particles, growth of entrained FT Aitken-mode particles in the MBL also represent a substantial source of cloud condensation nuclei (CCN), with the highest contribution potentially reaching 60 % during summer. The growth of Aitken-mode particles to CCN size is an expected result of the condensation of sulfuric acid, a product from dimethyl sulfide oxidation, suggesting that ocean ecosystems may have a substantial influence on MBL CCN populations in the ENA.
- Article
(9838 KB) - Full-text XML
-
Supplement
(1482 KB) - BibTeX
- EndNote


Low clouds, especially stratocumulus, are the dominant cloud type in terms of spatial coverage of the Earth's surface, and are of vital importance to the Earth's climate (Wood, 2012). Major climate effects of low clouds are derived from their reflection of solar radiation (Seinfeld and Pandis, 2016). The key parameters for quantifying climate effects of low clouds are the albedo (i.e., cloud reflectivity) and the cloud coverage, both of which are particularly sensitive to perturbations of aerosols. The concentration of cloud condensation nuclei (CCN) strongly influences the number concentration and sizes of cloud droplets and therefore the effective albedo of low clouds (i.e., first indirect effect of aerosol) (Twomey, 1974; Seinfeld and Pandis, 2016; Dong et al., 2015), especially in clean environments such as the remote marine boundary layer (MBL) (Reutter et al., 2009). In addition, CCN concentration and aerosol size distribution also influence cloud amount by impacting drizzle formation and precipitation (i.e., second indirect effect of aerosol) (Albrecht, 1989; Liu and Daum, 2004; Liu et al., 2006; Wood, 2005; Rémillard et al., 2012; Dong et al., 2014).
Currently, the aerosol indirect effects of marine low cloud systems remain one of the major uncertainties in climate change simulations (Lohmann and Feichter, 2005; Bony and Dufresne, 2005; Bony et al., 2006; Wood, 2012). This large uncertainty is to a large degree a result of the incomplete understanding, and therefore representations, of aerosol properties, and the response of marine low clouds to aerosol changes. Therefore, it is imperative to understand MBL aerosol properties under natural conditions, the perturbation due to anthropogenic emissions, and the underlying controlling processes. The properties of aerosols in the remote MBL can be influenced by a variety of processes, including entrainment from the free troposphere (FT), production of sea spray aerosol (SSA), processing of aerosol particles both inside clouds and in clear air, depositions, and horizontal advection (Quinn and Bates, 2011; Wood et al., 2012). Previous studies (O'Dowd et al., 2004; Clarke et al., 2013; Quinn et al., 2017; Wood et al., 2017; Pierce et al., 2015; Prather et al., 2013; Russell et al., 2010; Sanchez et al., 2018; Phinney et al., 2006; Langley et al., 2010) have greatly advanced our understanding of MBL aerosols, especially in the relative contributions of SSA versus long-range transported pollution in terms of the CCN budget (Blot et al., 2013; Clarke and Kapustin, 2010; Clarke et al., 2013; Quinn et al., 2017), and the removal of CCN by in-cloud coalescence scavenging (Wood et al., 2012). However, we are still lacking a quantitative understanding of the controlling processes sufficient to serve as a reliable foundation for developing global climate model parameterizations and representations that will adequately simulate aerosol in past, current, and future climates. The relative importance, the influence on different particle size ranges, and spatiotemporal variations of these processes are still not well quantified.
The eastern North Atlantic (ENA) is a region of persistent but diverse subtropical MBL clouds (Wood et al., 2015). Aerosols arriving in the ENA are of diverse origins, varying from marine clean air masses to air masses that are strongly influenced by continental emissions from North America or northern Europe (O'Dowd and Smith, 1993; Wood et al., 2015). As a result, ENA is among the regions with strong but uncertain aerosol indirect forcing (Carslaw et al., 2013). Several field campaigns, including the North Atlantic Regional Experiment (NARE) campaign during 1991 to 2001 (Parrish et al., 1998), the Atlantic Stratocumulus Transition Experiment (ASTEX) during June 1992, the second Aerosol Characterization Experiment (ACE-2) during summer 1997, and the Clouds, Aerosol, and Precipitation in the Marine Boundary Layer (CAP-MBL) campaign (Wood et al., 2015) from May 2009 to December 2010 took place in the ENA. However, they are either more focused on other subjects (e.g., ozone chemistry for NARE (Parrish et al., 1998) and cloud properties for CAP-MBL (Wood et al., 2015) or are short-term studies (e.g., ACE-2; Raes et al., 2000, ASTEX; Albrecht et al., 1995). To our knowledge, the variation of aerosol properties and their controlling processes have not been systematically studied using long-term observation in the ENA.
Recently, a permanent ENA site was established by the Department of Energy Atmospheric Radiation Measurement (ARM) (Mather and Voyles, 2013) Climate Research Facility on Graciosa Island in the Azores, Portugal, providing an invaluable opportunity to study MBL aerosol properties and their interactions with low clouds. In this study, we examine the long-term variation of aerosol properties, trace gas mixing ratios, and meteorological parameters measured at the ARM ENA site from 2015 to 2017 (Sect. 2). The characteristics of the aerosol properties and their seasonal variations are summarized (Sect. 3). The governing equations of number concentration are established for different modes of MBL aerosol at the ENA site (Sect. 4). Subsequently, the seasonal variations of aerosol properties for different particle size modes are explained using key processes identified (Sects. 5 and 6). Finally, we present an overall picture of the processes that drive MBL aerosol properties in the ENA, and the implications are discussed (Sect. 7).
Table 1Measurements of aerosol and cloud properties at the ENA site used in this study.
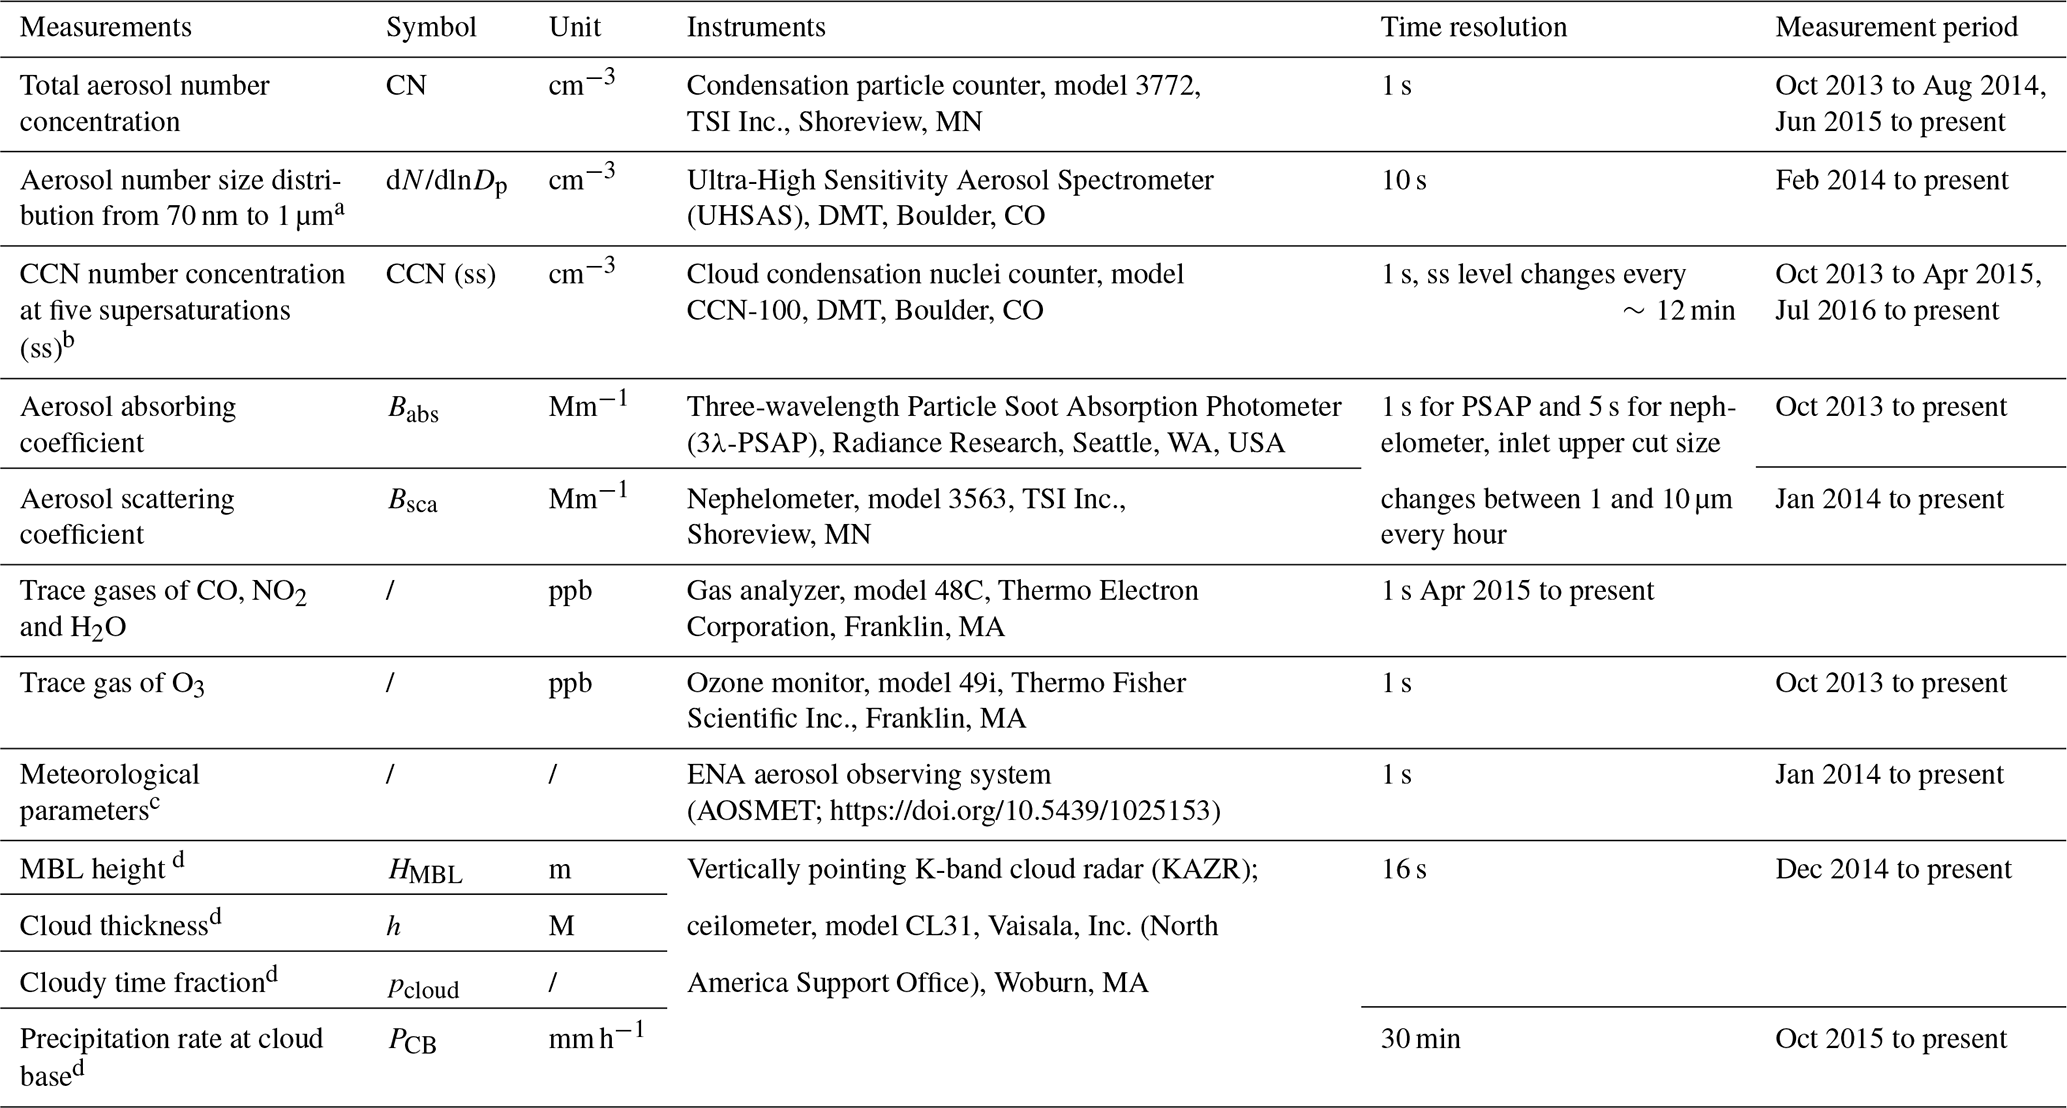
a In fact, the lower size limit of UHSAS is 60 nm. Here, we used only data larger than 70 nm to avoid noise sometimes observed in the first several channels of the UHSAS. b Measured at ss levels of 0.1 %, 0.2 %, 0.5 %, 0.8 %, and 1 %. c Including wind speed (WS) and wind direction (WD), temperature (T), pressure, relative humidity (RH), and rain rate at ground. d See details in Sect. 2.2.2.
2.1 Measurement overview
Measurements of trace gases, meteorological parameters, and aerosol and cloud properties are conducted at the ENA site, located on Graciosa Island in the Azores, Portugal (39∘5 N, 28∘1 W; 30.48 m above mean sea level). The ENA site was initially set up in late 2013, with additional measurements added subsequently. The primary measurements used in this study and the available time periods are listed in Table 1. The measurements of trace gases (e.g., CO) and aerosol properties were first screened for impact from local pollution sources (see Sect. S1 in the Supplement). All measurements are then averaged into 1 h intervals. Here, we use 3 years of data from January 2015 to December 2017 to show the long-term variations and correlations among different parameters. For evaluation of the contributions of different controlling processes (Sect. 4), 1 year of data from September 2016 to August 2017 is used, during which most of the measurements are available.
2.2 Data corrections and derivations
2.2.1 Optical properties
Aerosol absorbing (Babs) and scattering (Bsca) coefficients are measured by a three-wavelength Particle Soot Absorption Photometer (PSAP) and a nephelometer, respectively (Table 1). These two instruments share a common inlet, and the 50 % cut size of the inlet switches between 1 and 10 µm every hour (Springston, 2016). The corresponding Bsca and Babs are denoted by “PM1” and “PM10”, respectively. In addition, properties of coarse-mode ( µm) aerosols, PMc, were derived by the difference between PM10 and PM1. For example, “PMc Bsca” refers to the difference between PM10 Bsca and PM1 Bsca hereafter, and PMc Babs is defined similarly.
The mass flow calibration and filter loading correction are already applied to the PSAP data in the ARM data archive (Springston, 2016). In this study, additional corrections of contribution due to scattering for Babs (Bond et al., 1999; Virkkula et al., 2005; Virkkula, 2010; Costabile et al., 2013), and truncation and angular illumination for Bsca (Anderson and Ogren, 1998; Müller et al., 2011) are applied, and the procedure is detailed in Sect. S2. The corrected PM1 Bsca shows strong correlation (correlation coefficient being 0.84) with the volume of PM1 derived from the Ultra-High Sensitivity Aerosol Spectrometer (UHSAS) size distribution (Fig. S2). Potential particle losses for large particles (i.e., in the diameter range of 5–10 µm) are not corrected. However, we do not expect the losses to affect the relative trends of PMc Bsca presented here (Sect. 5), or the correlation among PMc Bsca and VLA (Fig. 6c).
2.2.2 Cloud and MBL properties
Properties of cloud and MBL, including MBL height, cloud thickness, and cloud fraction, are needed to estimate some of the key controlling processes that drive aerosol properties (see Sect. 4 for more details). The MBL height, HMBL, is derived from the backscatter signal from the ceilometer CL31 (Morris, 2012). Briefly, it is determined from the gradient of an idealized backscatter profile, the parameters of which are derived from fitting of the observed profile (Eresmaa et al., 2006). As the first boundary layer height given in the ceilometer data product is usually the surface layer (Lewis and Schwartz, 2004) below 100 m (Münkel et al., 2007; Emeis et al., 2007, 2008; Haeffelin et al., 2012; Morris, 2012), HMBL is chosen as the highest boundary layer height below 3 km (Zhou et al., 2015; Rémillard and Tselioudis, 2015; Rémillard et al., 2012).
Cloud thickness h is derived by combining HMBL and the cloud-base height derived from ceilometer data. In the ENA, HMBL usually represents the top height of boundary layer clouds (Rémillard et al., 2012). When multiple layers of clouds are detected, the layers with cloud-base heights higher than HMBL are first excluded, after which the highest layer is chosen to exclude potential influence of near-ground thin clouds. The cloud thickness h is then defined as the difference between HMBL (cloud top) and the base height of the chosen cloud. The value of h derived using the above approach is in general agreement with previous observations (Rémillard et al., 2012).
The cloud fraction, pcloud, is determined by the detection status information from the ceilometer (Morris, 2012). It is equal to the fraction of time with a detected boundary layer cloud base, or a determined full obscuration. Precipitation rate at cloud base is retrieved from the vertically pointing K-band cloud radar (Atmospheric Radiation Measurement Climate Research Facility, 1990) and the ceilometer (Morris, 2012) following the method of O'Connor et al. (2005).
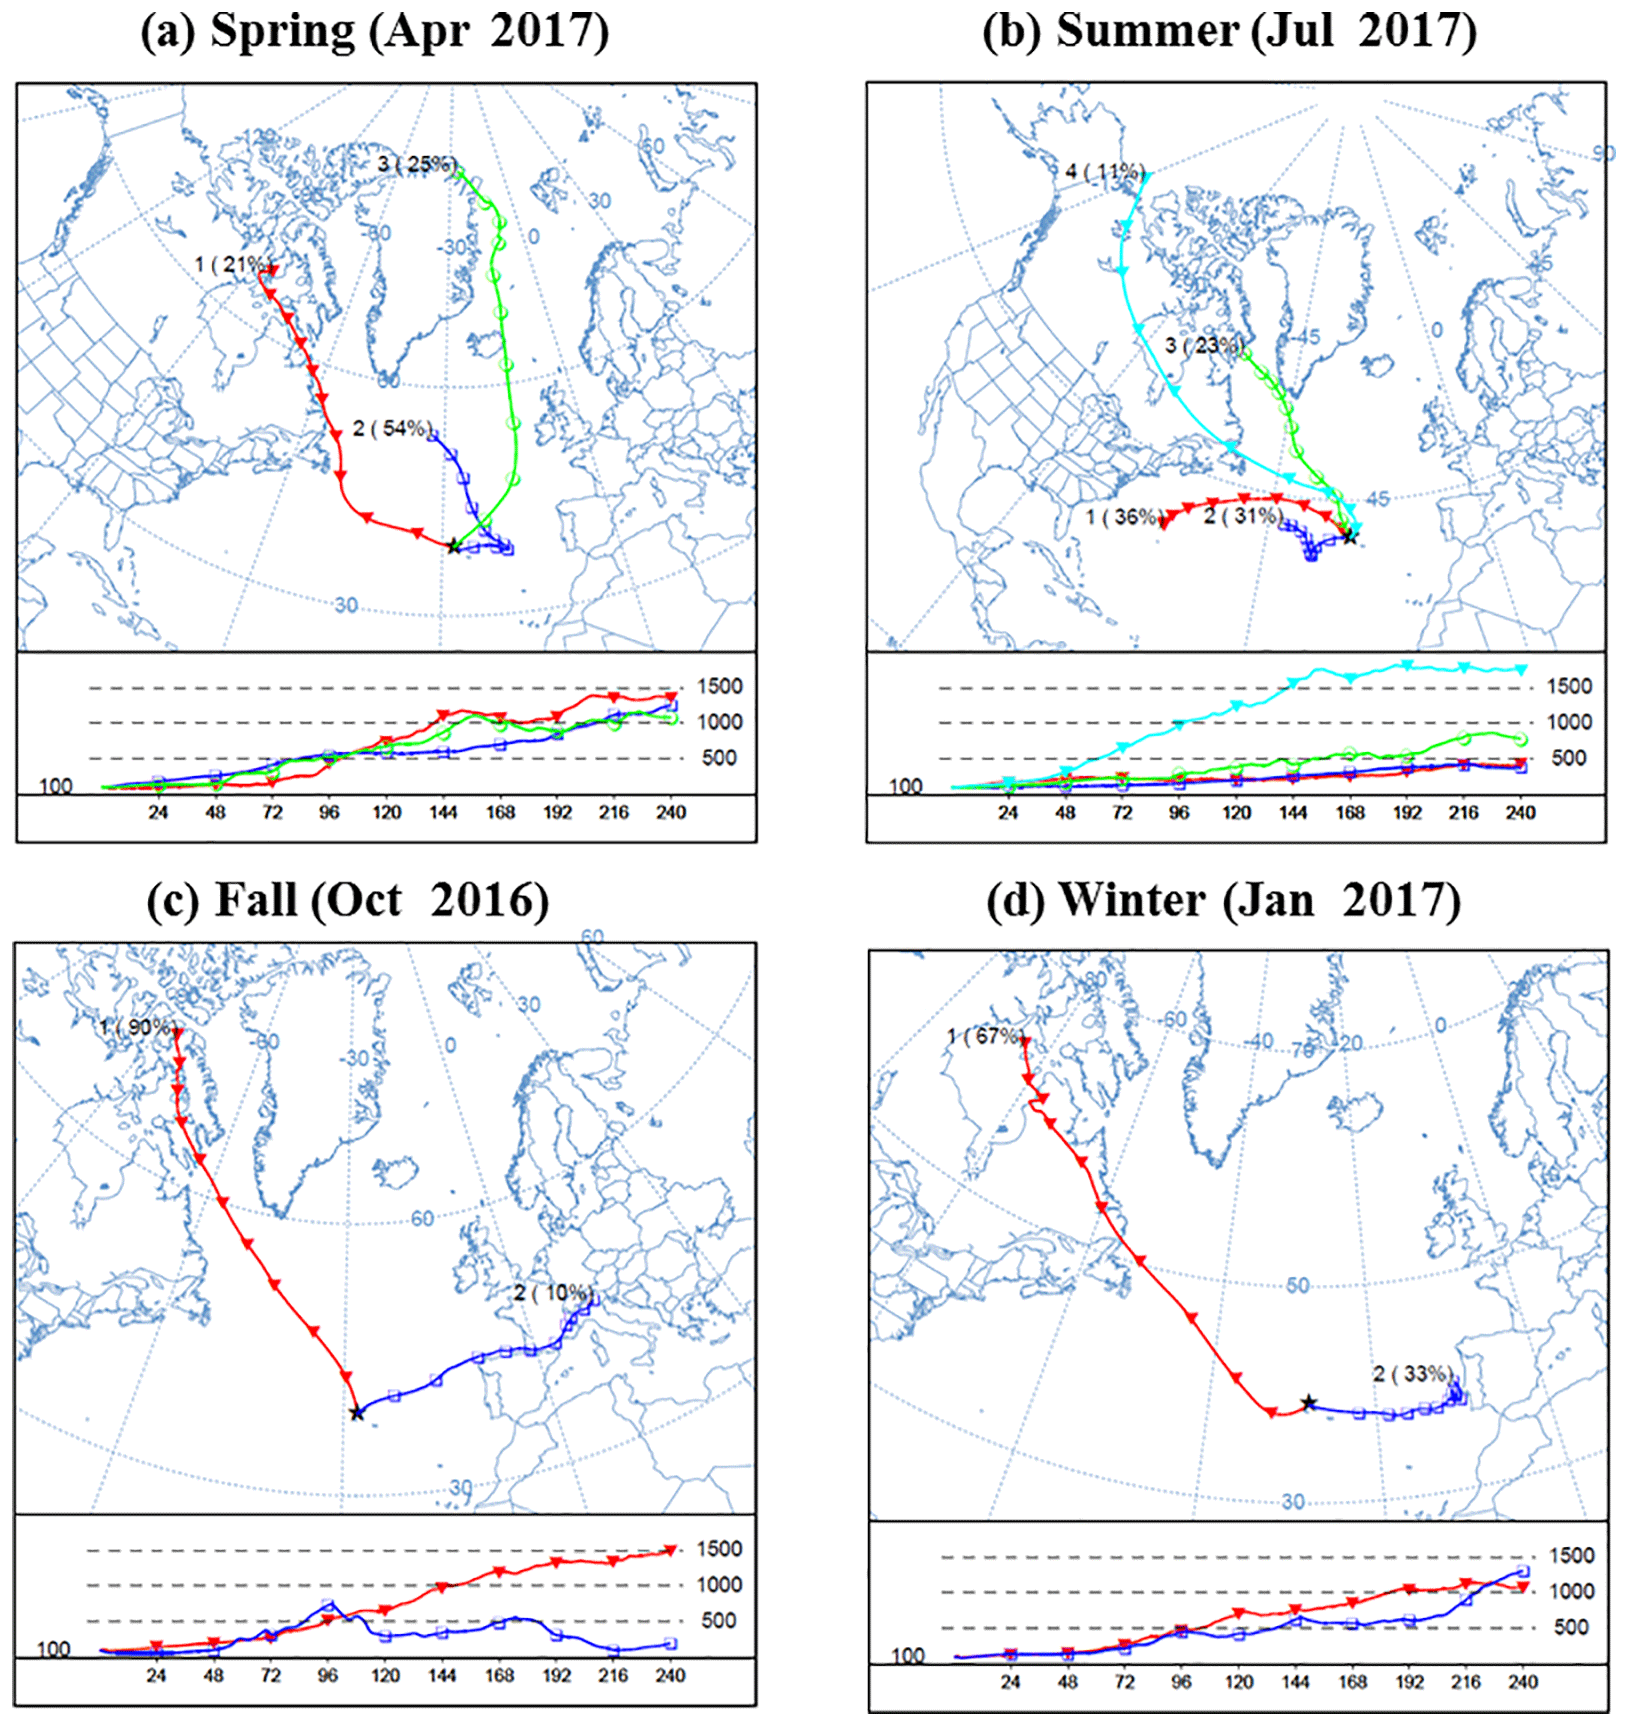
Figure 1Cluster analysis of 10-day back trajectories arriving at 100 m above the ENA site in different seasons. The analysis was conducted using the Hybrid Single-Particle Lagrangian Integrated Trajectory (HYSPLIT) version 4 model (Stein et al., 2015). The 10-day back trajectories were simulated with a time step of 6 h using National Centers for Environmental Prediction (NCEP) Global Data Assimilation System (GDAS) meteorological data as input. A cluster analysis of these trajectories was then performed, and for each season, the solution that captures most of the variance (e.g., Abdalmogith and Harrison, 2005) and has less than five identified clusters is chosen. The average trajectories of the clusters are represented by different colors, and the associated numbers denoted the arbitrarily given cluster ID and the occurrence percentages of this cluster. For example, the number “1” (90 %) beside the red trajectories indicates that the no. 1 cluster has an average trajectory shown by the red lines, and 90 % of the time the air masses arriving at the ENA site belong to this cluster.
3.1 Air mass origin
One major source of MBL aerosol in the ENA is the entrainment of FT air, which contains both particles from long-range transport of continental pollution and those formed through new particle formation (NPF) in the FT (Quinn and Bates, 2011; Sanchez et al., 2018). To examine the contribution from continental emissions and its seasonal variation, we analyze the back trajectories of air masses arriving at the ENA site. The cluster analysis results of four representative months from September 2016 to August 2017 (i.e., the main study period; see Sect. 2.1) are shown in Fig. 1. Results from other periods from 2015 to 2017 are similar (not shown).
Most of the air masses arriving at the ENA site can be classified as one of the four clusters originating from North America, northern Europe, the Arctic, and the recirculating flow around the Azores High, respectively (O'Dowd and Smith, 1993; Wood et al., 2015). Among these clusters, the Azores High air masses usually linger within the MBL, as indicated by their stable and low-level trajectories (e.g., blue and red trajectory clusters in Fig. 1b). In comparison, other air masses usually undergo long-range transport within the FT before descending into the MBL. In addition, some air masses originating in the continental boundary layer were lofted up and then subsided into the MBL within 10 days (e.g., blue trajectory cluster in Fig. 1c).
The percentage of occurrence for each cluster shows strong seasonal variations (Figs. 1, S3). During fall (Figs. 1c, S3c) and winter (Figs. 1d, S3d), air masses influenced by anthropogenic emissions from North American (red lines) dominate, with the influence of clean maritime flow and northern European flow. In spring (Figs. 1a, S3a), contributions from Arctic/northern Europe air masses are more pronounced than during other seasons. For the summer months (Figs. 1b, S3b), the ENA site is dominated by the clean maritime flow associated with the recirculating Azores High. As the recirculating Azores High clusters are usually not associated with long-range transport, a reduced contribution to MBL aerosol from continental pollution through FT entrainment is expected during the summertime in ENA.
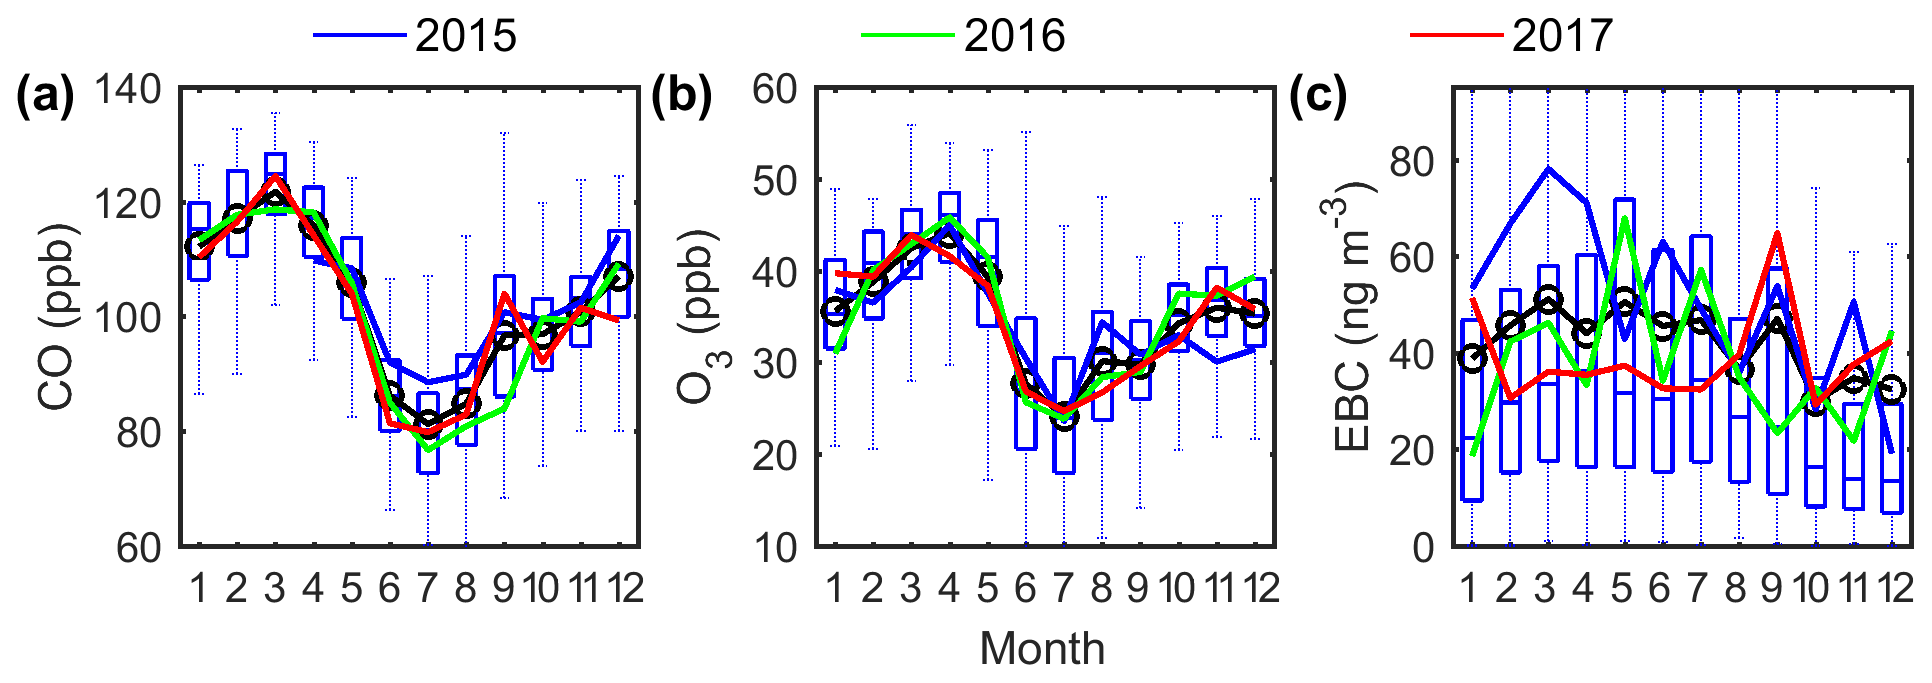
Figure 2Seasonal variations of (a) CO mixing ratio, (b) O3 mixing ratio, and (c) EBC concentration at the ENA site. The blue, green, and red lines represent the monthly average for the years 2015, 2016, and 2017, respectively. The whiskers and boxes show the 90th, 75th, median, 25th, and 10th percentiles, and the black circle and line represent the mean value of each month for the entire 3 years.
3.2 Mixing ratios of CO, O3, and water vapor
The mixing ratios of CO, O3, and water vapor within the MBL are expected to be strongly influenced by entrainment of FT air in the ENA. CO is a long-lived species with a lifetime of approximately 1 month (Seinfeld and Pandis, 2016) and therefore is a good indicator of long-range transported continental emissions for remote sites. At the ENA site, the influence of local emissions on trace gases and aerosol measurements is expected to be minimal after filtering of the data (Sect. S1). The lifetime of O3 varies from hours in polluted urban regions (due to the high rate of photochemical reactions) to several weeks in the FT (Monks et al., 2015). Given its long lifetime in the FT, O3 may also serve as a tracer for long-range transported pollutants. The local photochemical activities can be inferred from the correlation between O3 and CO. In regions with strong local sources and sinks, O3 and CO show a strong positive correlation during summer daytime due to photochemical reactions but a negative correlation during winter nights due to the stronger dry deposition of O3 than CO (Poulida et al., 1991; Chin et al., 1994). In contrast, at the ENA site, CO and O3 are positively correlated all year round, even in winter in nighttime with low wind speed (WS) <2 m s−1 (Mao and Talbot, 2004) (Fig. S4a). This suggests that the variation of O3 concentration observed at the ENA site is mainly influenced by the entrainment of FT air, in agreement with findings from previous modeling studies (Cooper et al., 2002; Voulgarakis et al., 2011). In addition, the strong anticorrelation (correlation coefficient being −0.75) of CO and O3 with water vapor (Fig. S4b) also confirms this picture, as water mixing ratio usually negatively correlates with the extent of FT entrainment at remote marine sites (Helmig et al., 2002). Furthermore, the seasonal variations of O3 and CO in the ENA (Fig. 2a, b) differ much from those observed at anthropogenic-influenced urban or rural sites, where ozone usually exhibits a summer peak due to strong photochemical production, while CO usually shows no clear seasonal variation (Poulida et al., 1991). In contrast, both CO and O3 in the ENA show a summer minimum and spring–winter maximum, which is consistent with the FT entrainment as the dominant source and the seasonal variation of tropopause height. This suggests minor contributions from local emissions and in situ photochemistry (Parrish et al., 1998; Fischer et al., 2003; Mao and Talbot, 2004). The seasonal variations of CO and O3 concentrations are also consistent with the cluster analysis of back trajectories, which indicates more influence from long-range transported pollution in winter–spring than in summer.
3.3 Absorbing aerosols
In the ENA boundary layer, absorbing aerosols, including black carbon, brown carbon, and dust, are likely entrained from the FT following transport from continental sources. Occasionally, air masses with very strong influence from biomass burning or dust are observed at the ENA site. These episodes are excluded from the analyses presented here to focus on the long-term background variations. These episodes are identified using the aerosol optical properties (Logan et al., 2013, 2014; Cazorla et al., 2013), particle chemical compositions (Clarke et al., 2007), and trace gas mixing ratios (Honrath et al., 2004). Identification of these dust and biomass burning episodes and characterization of aerosol properties during them will be discussed elsewhere. With these episodes excluded, the equivalent black carbon (EBC, following the naming convection suggested by Petzold et al., 2013) mass concentrations were estimated from PM1 Babs with an assumed mass absorbing cross section of 7.5 m2 g−1 at 529 nm (Bond et al., 2013).
While absorbing particles are entrained from the FT, the seasonal variation of EBC mass concentration is different from those of CO and O3 (Fig. 2). As evidenced from a decreasing EBC∕CO ratio with increasing precipitation rate at cloud base, PCB (Fig. S5), such differences are due to in-cloud coalescence scavenging (Sect. 4.2) both during the long-range transport and/or after entrainment into the MBL, which removes EBC but not CO or O3. Therefore, EBC mass concentration can be indicative of the overall effect of FT contribution from continental emissions and in-cloud coalescence scavenging. As shown in Fig. 2c, EBC mass concentrations are similar in all seasons but show larger annual variations than CO or O3, which are attributed to the larger annual variations of precipitation.
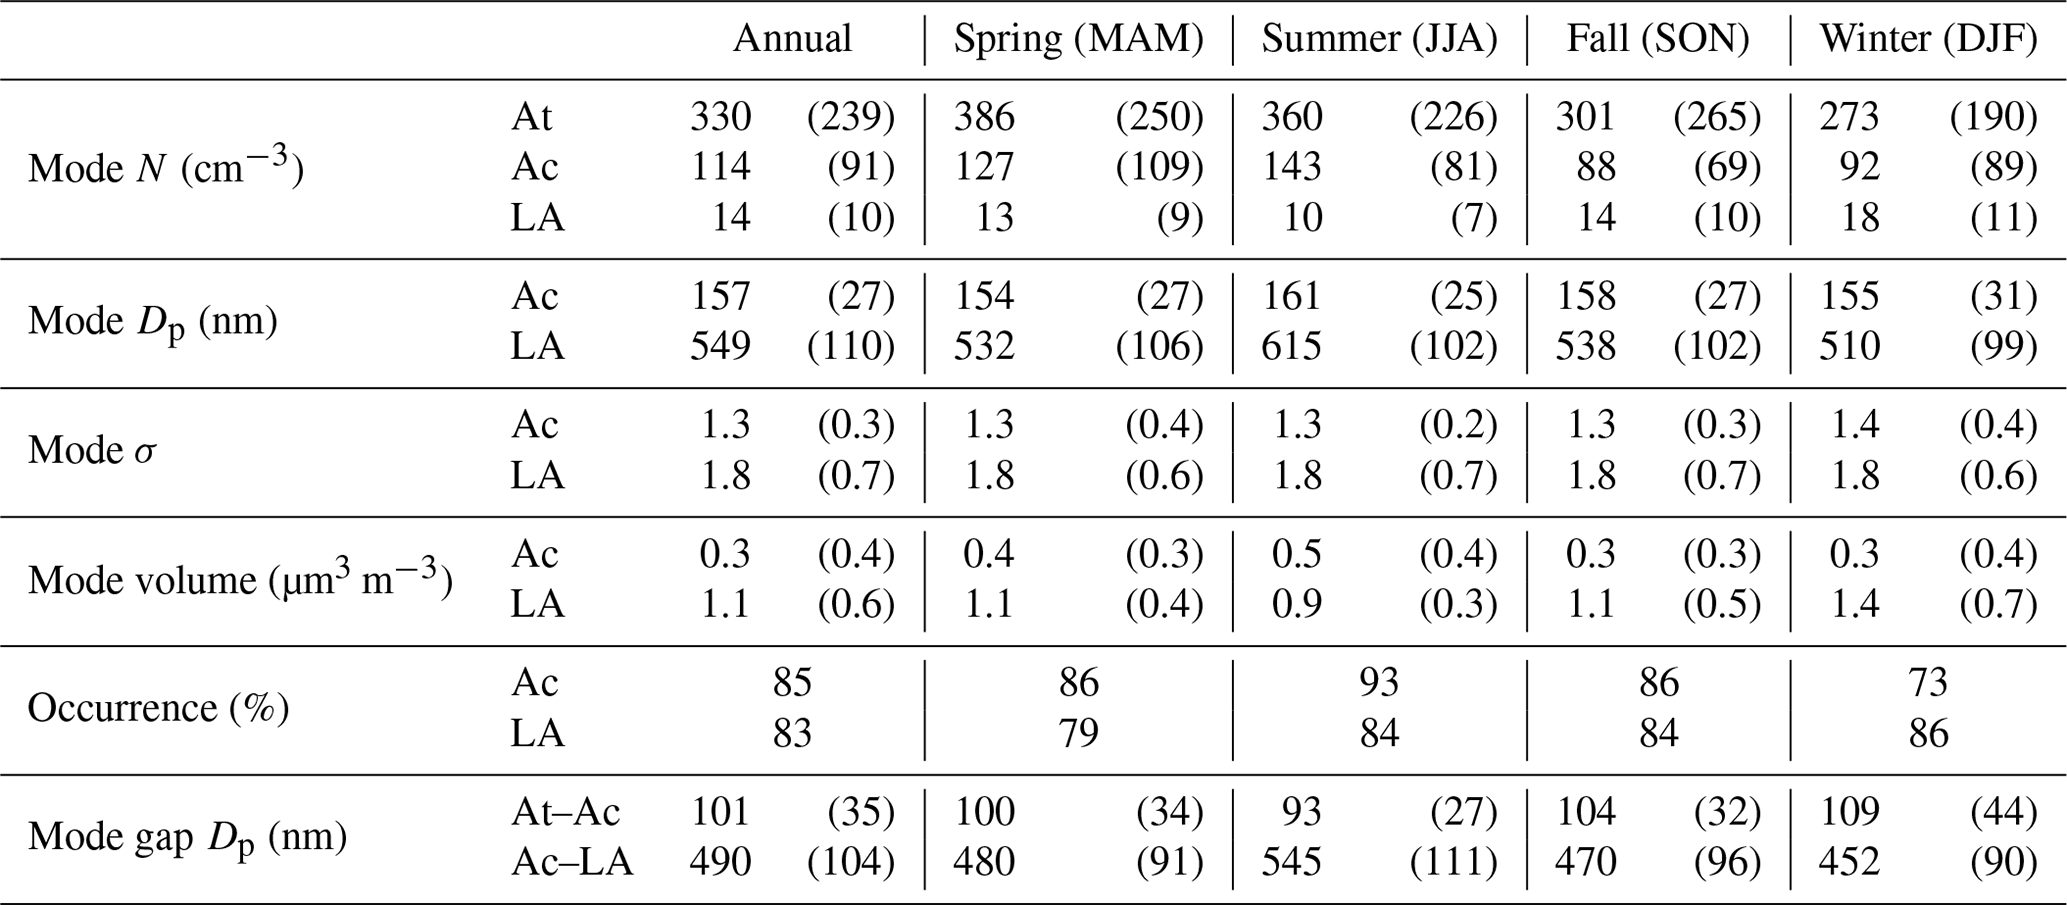
Table 2Statistics of the fitted lognormal mode parameters of the number size distribution measured at the ENA site. The numbers are shown as “mean (standard derivation)” for September 2016 to August 2017 and each of the four seasons during the 1-year period. Mode Dp and mode σ are the mean and standard deviation of the fitted lognormal distribution of that mode, respectively.
3.4 Aerosol size distributions
3.4.1 Modes of aerosol size distributions
The aerosol size distribution from 70 nm to 1 µm at the ENA site typically consists of three modes (Fig. 3): an Aitken (At) mode below ∼100 nm, an accumulation mode (Ac) which resides mostly from 100 to 300 nm, and a larger accumulation mode (LA) above ∼300 nm. Note that, due to the lower size limit of UHSAS, the Aitken mode is often not fully characterized. Therefore, its number concentration is derived by deducting fitted number concentrations of the other two modes from the total number concentration CN measured by the condensation particle counter (CPC), namely NAt= CN–NAc–NLA. With this definition, the derived Aitken-mode concentration also includes nucleation-mode particles (i.e., Dp<20 nm). However, previous studies have shown that NPF events within remote MBLs like the ENA are infrequent (Raes, 1995; Bates et al., 2000); therefore, nucleation-mode particles likely represent a small fraction of the derived Aitken-mode number concentration for long-term measurements (Wood et al., 2012). The Ac mode is absent in 15 % of cases (Table 2), likely due to in-cloud coalescence scavenging or lack of cloud processing (Sect. 4). Among these three modes, aerosol number concentration is dominated by At (72.0 %) and Ac (24.9 %) modes (Fig. 3b1), while the volume concentration is controlled by the LA (74.3 %) and Ac (25.1 %) modes (Fig. 3b2). Based on the average volume size distributions (Fig. 3b2) and results shown in Sect. 5, the LA mode is essentially the sea spray aerosol coarse mode under vast majorities of the conditions.
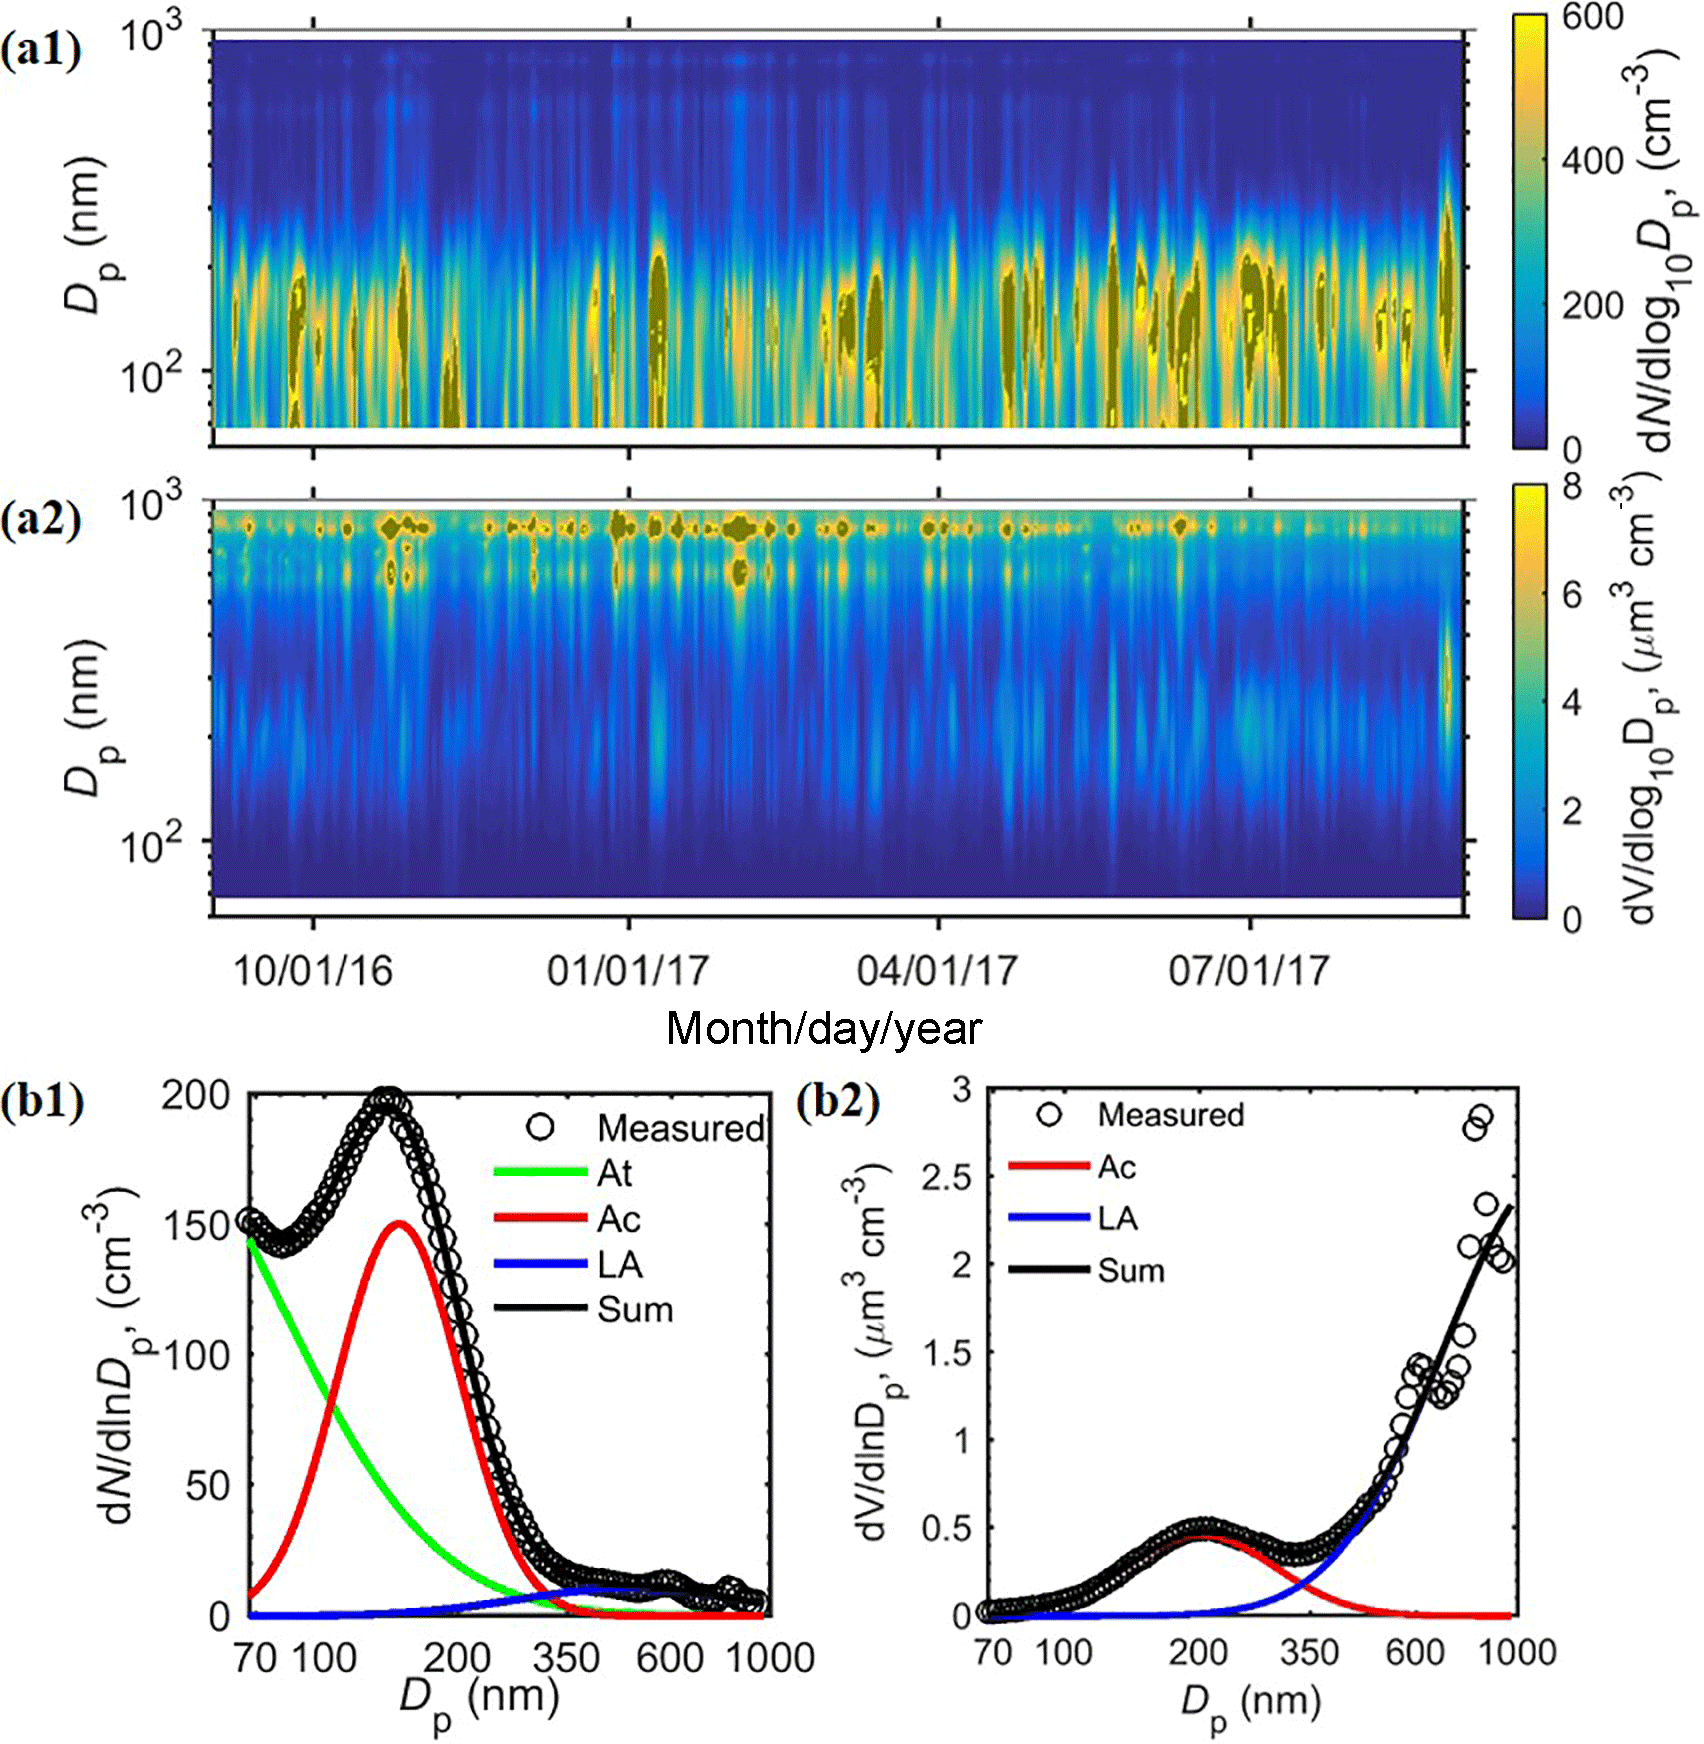
Figure 3Representative aerosol size distribution measured at the ENA site. Time series of the (a1) number and (a2) volume size distributions during the study period from September 2016 to August 2017, and the fitted lognormal modes of (b1) number and (b2) volume distributions averaged over the 1-year period. The fluctuations at ∼600 nm (also seen in Fig. 4) are considered as instrumental artifacts.
3.4.2 Seasonal variations of each mode
Different seasonal variations are observed for the three particle modes. While there is substantial variation within each season, on average, the Ac mode exhibits higher number concentration, larger mode Dp, and higher occurrence in summer than in winter (Table 2). In contrast, the LA mode shows opposite seasonal trends, with the number and volume concentrations in winter 1.5 times greater than those in summer (Table 2). These seasonal trends are also evident in the seasonally averaged size distributions (Fig. 4a). The monthly average concentrations and the seasonal trends of the Ac and LA modes are very consistent from 2015 to 2017, showing little annual variation (Fig. 4b). Despite the higher NAc in summer, CN usually peaks in spring as a result of elevated NAt (Fig. 4b). In comparison, the monthly average NAt and CN exhibit some minor difference among the 3 years, while their seasonal trends remain the same (Fig. 4b).
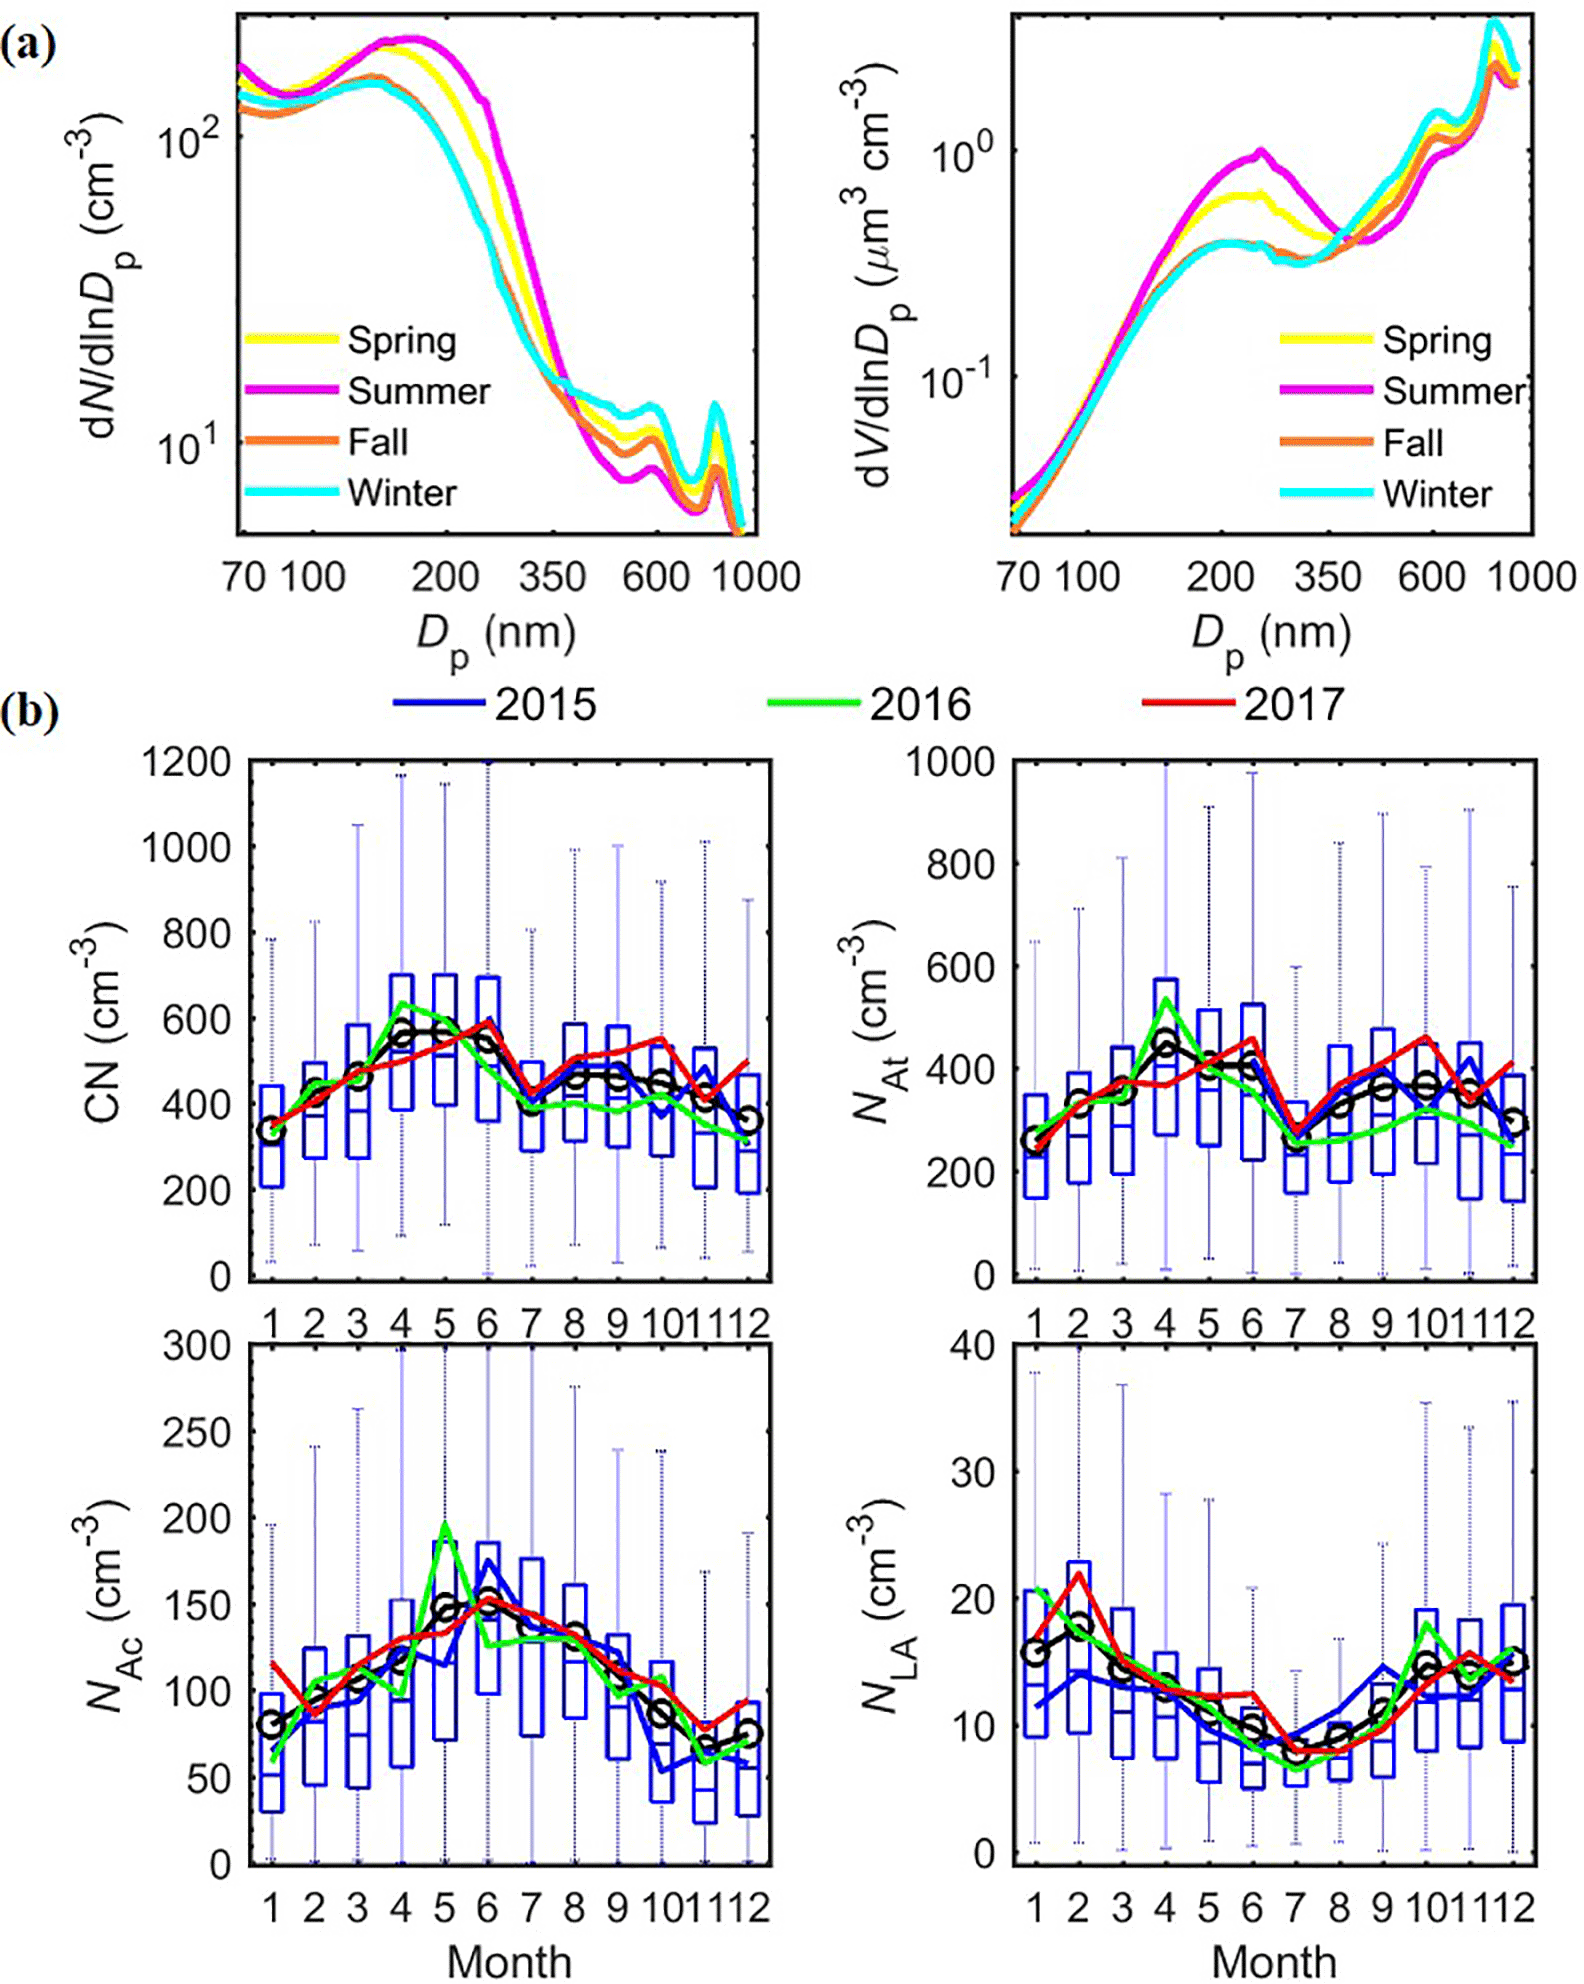
Figure 4Annual and seasonal variations of aerosol size distributions at the ENA site from 2015 to 2017. (a) Seasonal-averaged number and volume distribution; (b) similar to Fig. 2 but for total aerosol number CN, and the number concentrations of At, Ac, and LA modes (NAt, NAc, and NLA).
4.1 Governing equations of At-, Ac-, and LA-mode concentrations
The mode-dependent seasonal trends indicate that the variations of NAt, NAc, and NLA are driven by different processes. Processes that may influence aerosol number concentrations in remote MBL are entrainment of the particles from the FT, SSA production, NPF inside the MBL, condensational growth (COND), coagulation (COAG), in-cloud scavenging of interstitial particles by droplets (INT), aqueous-phase chemistry (AQ_CHEM), wet deposition, dry deposition, and advection. Among these processes, NPF within the MBL was shown to be infrequent in previous studies (Raes, 1995; Bates et al., 2000) and is neglected in the calculations of the long-term budget terms (Wood et al., 2012). Also, at remote marine sites like the ENA, the influence of advection is “averaged” out for long-term trends of particle concentrations. In addition, dry deposition is usually much slower compared to wet deposition for submicron particles, even after taking into account the time and spatial discontinuity of the wet deposition processes (see the discussion of in-cloud scavenging in Sect. 4.2) (Lewis and Schwartz, 2004; Henzing et al., 2006; Wood et al., 2012; Mohrmann et al., 2018). Thus, it is neglected in further analysis. Wet deposition includes both in-cloud coalescence scavenging of activated droplets and therefore effectively CCN inside clouds (COALES) and the collection of aerosol particles by falling hydrometeors below clouds (i.e., washout). For aerosols between 10 nm and 1 µm, below-cloud washout is usually much less efficient than in-cloud coalescence scavenging (Garrett et al., 2006; Seinfeld and Pandis, 2016; Wood et al., 2012) and is neglected here. Earlier study suggests that the Ac mode in the MBL is formed through aqueous-phase chemistry inside cloud droplets (Hoppel et al., 1990). Therefore, we treat both Ac- and LA-mode particles as CCN, and At-mode particles as non-CCN (i.e., they remain as interstitial particles inside clouds). This treatment is also supported by the strong correlation between NAc plus NLA and CCN concentration at 0.2 % ss, representative of marine low clouds (Leaitch et al., 2010; Wood et al., 2012; Clarke and Kapustin, 2010) during all seasons (Fig. S6). As NAc is usually 1 order of magnitude higher than NLA (Fig. 4), the CCN concentration at the ENA site is well represented by NAc alone (Fig. S6). Therefore, the overall governing equation for each mode of MBL aerosol can be written as
as depicted in Fig. 5 and discussed in detail below.

Figure 5Potential key controlling processes of MBL aerosol number concentrations considered in this study.
4.2 Key aerosol sources and sinks
SSA
The change rate of MBL aerosol concentration due to SSA production flux, , can be expressed as (de Leeuw et al., 2011; Wood et al., 2012)
where WS3.41 is the white cap fraction on the sea surface (Monahan et al., 1986) with WS in units of m s−1, FSSA is the total SSA number production flux per white cap area in units of m−2 s−1, HMBL is the MBL height in meters, and fSSA (lnDp) is the lognormal number size distribution of SSA production flux curve. Thus, WS is the most important parameter in estimating total SSA contributions, while the detailed size distribution could differ with the fSSA (lnDp) used (Gong, 2003; Lewis and Schwartz, 2004; Clarke et al., 2006; Grythe et al., 2014).
In-cloud coalescence scavenging
The rate of in-cloud coalescence scavenging of cloud droplets is given by (Wood, 2006; Wood et al., 2012)
where E|X represents (, namely the percentage processing efficiency of process X. Nd is cloud droplet number concentration which is assumed to be the same as CCN, or NAc plus NLA (Sect. 3.4.2), and K is a constant of 2.25 m2 kg−1, while h represents the in-cloud volume fraction of MBL aerosols (Mårtensson et al., 2010). Note that by setting the precipitation rate at cloud base, PCB, as 0 when there is no precipitation, the precipitation time fraction is already included in Eq. (3).
In-cloud scavenging of interstitial particles by activated droplets
Inside clouds, interstitial particles are scavenged when coagulating with cloud droplets. This process directly reduces At-mode particle number concentration, while also indirectly reducing CCN (i.e., Ac- and LA-mode) number concentration by removing particles that could otherwise grow and become CCN later (Pierce et al., 2015). The rate of scavenging scales with the probability that the particles are inside clouds, fcloud. Here, fcloud is defined as
where pcloud is the probability that MBL cloud is encountered and is approximated by the in-cloud time fraction (Table 1), while h is again indicative of the volume fraction of MBL aerosol particles inside the clouds (Mårtensson et al., 2010).
As At-mode particles are treated as non-CCN and remain as interstitial particles inside the clouds, the rate of the scavenging can be estimated by (Pierce et al., 2015)
where Nd is number concentration of cloud droplets assumed to be the sum of NAc and NLA (Sect. 3.4.2), Kint,d is the coagulation coefficient between Dp,int and Dp,d, where Dp,int and Dp,d represent the diameter of interstitial particles and cloud droplets, respectively. Dp,d is assumed to be 10 µm (Pierce et al., 2015), while Dp,int is assumed to be the corresponding wet diameter of Dpg,At under a supersaturation (ss) of 0.12 % (Korolev and Mazin, 2003), where Dpg,At is the geometric mean dry diameter of the At mode. The maximum supersaturation near the cloud base where CCN activation occurs is typically 0.2 % for marine low clouds (Wood et al., 2012; Clarke and Kapustin, 2010; Leaitch et al., 2010). However, the supersaturation is usually lower above the cloud base where most of the interstitial scavenging occurs. Here, we assume the in-cloud ss of 0.12 % based on the work of Korolev and Mazin (2003). Assuming the At mode has a minimum Dp of 23 nm (Pandis et al., 1994), the Dpg,At is estimated as 48 nm, and the corresponding wet particle diameter inside clouds, Dp,int, is around 190 nm. Sensitivity of the interstitial scavenging rate to these parameters is discussed in Sect. 6.3.
Aqueous-phase chemistry
The aqueous-phase reaction (i.e., in-cloud production of sulfate) rate is positively related to the liquid water content (Seinfeld and Pandis, 2016; Meng and Seinfeld, 1994; Pandis et al., 1990; Cheng et al., 2016). As the liquid water content of cloud droplets is orders of magnitude higher than that of interstitial aerosols, only aqueous-phase reactions inside the cloud droplets are considered here (Pandis et al., 1990). As a result, the aqueous-phase reactions only promote the growth of CCN (i.e., Ac- and LA-mode particles). The influence of aqueous-phase reactions on the Aitken-mode particles is neglected until they reach CCN sizes through condensational growth (Hoppel et al., 1994; Pandis et al., 1990).
Aqueous-phase reactions inside cloud droplets do not change total particle number concentration. On the other hand, they efficiently add mass to CCN and grow them into larger diameters when cloud droplets evaporate following the reactions. Therefore, the only influence of AQ_CHEM on number size distribution considered here is the growth of Ac-mode particles into the LA-mode size ranges. The magnitude of the influence depends on fcloud, liquid water content, precursor concentrations, and radiation which influences oxidant concentrations (Mårtensson et al., 2010).
Condensation growth
While condensation does not change the total particle number concentration, it grows the particles and therefore changes the number distribution among different modes (Seinfeld and Pandis, 2016). In this aspect, it functions similarly to aqueous-phase reactions, with the difference being that condensation acts on particles of all sizes, while aqueous-phase reactions influence only CCN. The rate of a smaller mode A growing into a larger mode B through condensation can be estimated as (Pandis et al., 1994)
where ΔVA (in µm3) is the volume difference between a particle with the minimum Dp of mode B and a particle with the volume average of mode A, namely
where the integrals are calculated from the binned aerosol size distribution using the binned simplification described in Pandis et al. (1994).
JV (A) is the volume condensation rate of mode A in µm3 m−3 s−1, which can be estimated as (Seinfeld and Pandis, 2016)
where KCOND (A) is the condensation rate constant of mode A in s−1, R is the gas constant of 8.314 J mol−1, T is temperature in K, P is the atmospheric pressure being 1.013×10⁵ Pa, ρp is the aerosol density assumed to be g µm−3, vi and veq are the volume mixing ratio of condensate in the bulk gas-phase and at the aerosol surface, and mi is the molar mass of condensate. Here, we assume that the condensate is H2SO4, and thus mi=98 g mol−1, and veq is 0 (Pandis et al., 1994). Annual mean vi is assumed to be 1.0 ppt (Pandis et al., 1994), while being 1.4, 1.3, 1.1, and 0.2 ppt in spring, summer, fall, and winter, respectively. This seasonal variation in vi is based on the monthly dimethyl sulfide (DMS) fluxes (assumed to be 7.0, 5.4, 2.9, and 1.0 µmol m−2 day−1 in spring, summer, fall, and winter, respectively) given in previous studies in the North Atlantic Ocean (Tarrasón et al., 1995), and the proposed dependence of H2SO4 on DMS flux at the observed fluxes ranges (Pandis et al., 1994; Russell et al., 1994). Here, we assume that H2SO4 is the dominant condensate. However, recent studies suggest that organics may play an important role in the growth of particles inside the MBL, and this is discussed later in Sect. 6.2.
KCOND (A) can be estimated by (Seinfeld and Pandis, 2016)
where 10−4 is the unit converter of µm cm−1, D is the gas diffusivity of condensate in air equaling 0.1 cm2 s−l, gf is the aerosol hygroscopic growth factor at ambient RH, Dp is the dry aerosol diameter in µm, n(Dp) is the number size distribution of mode A in µm−1 cm−3, Dp1 and Dp2 are the diameter boundaries of mode A and defined as the corresponding mode gap Dp in Table 2 here, and Kn is the Knudsen number given by 2λmfp(gf Dp)−1, where λmfp is the air mean free path. At the ENA site, observed ambient RH shows a modest diurnal variation of 75 % ± 10 %. Accordingly, the hygroscopic growth factor, gf, is assumed to be 1.3, based on the Hygroscopic Tandem Differential Mobility Analyzer measurements of At- and Ac-mode particles at the ENA site. The increased particle surface area due to hygroscopic growth leads to a factor of ∼1.7 increase in the estimated KCOND compared with that under dry conditions. The term f(Kn, α) is the correction due to non-continuum effects (scaled by Kn) and imperfect surface accommodation (scaled by the mass accommodation coefficient α) estimated by the Fuchs–Sutugin approach as (Seinfeld and Pandis, 2016)
where α is assumed to be 0.02 for H2SO4 (Pandis et al., 1994).
Coagulation
Unlike condensation, coagulation does not change the total mass concentration but reduces aerosol number concentrations. The intra-modal coagulation of particles in a smaller mode A (e.g., At mode) serves as both a source of particles in a larger mode B (corresponding rate denoted as JAA→B hereinafter) and a sink for particles of mode A. Given the typical aerosol size distribution observed at the ENA site, intra-modal coagulation of mode-A particles is usually negligible when compared to inter-modal coagulation between mode A and another mode (B) with a different size range (corresponding rate denoted as JAB hereinafter) (Dal Maso et al., 2002). Therefore, we focus on the intra-modal coagulation as a source of a larger mode particles and inter-modal coagulation as a particle sink. The corresponding rates, JAA→B and JAB, are, respectively, estimated as
where K12 is the coagulation coefficient between two particles with diameters of gfDp1 and gfDp2, respectively, and is calculated using the Fuchs form (Seinfeld and Pandis, 2016). Similarly to the estimation of KCOND, the growth factor under ambient RH, gf, is assumed to be 1.3. This increase in particle diameter results in a ∼20 % decrease in estimated K12. Dp,min,A and Dp,max,A are the boundary diameter of mode A (defined as the corresponding mode gap Dp in Table 2 here), while Dp,min,B and Dp,max,B are defined similarly. Dpc is defined by
The coagulation loss rate of NA is thus
while the coagulation production rate of NB is
Table 3Estimated terms of the governing equations for three modes using size distribution parameters in Table 2a.
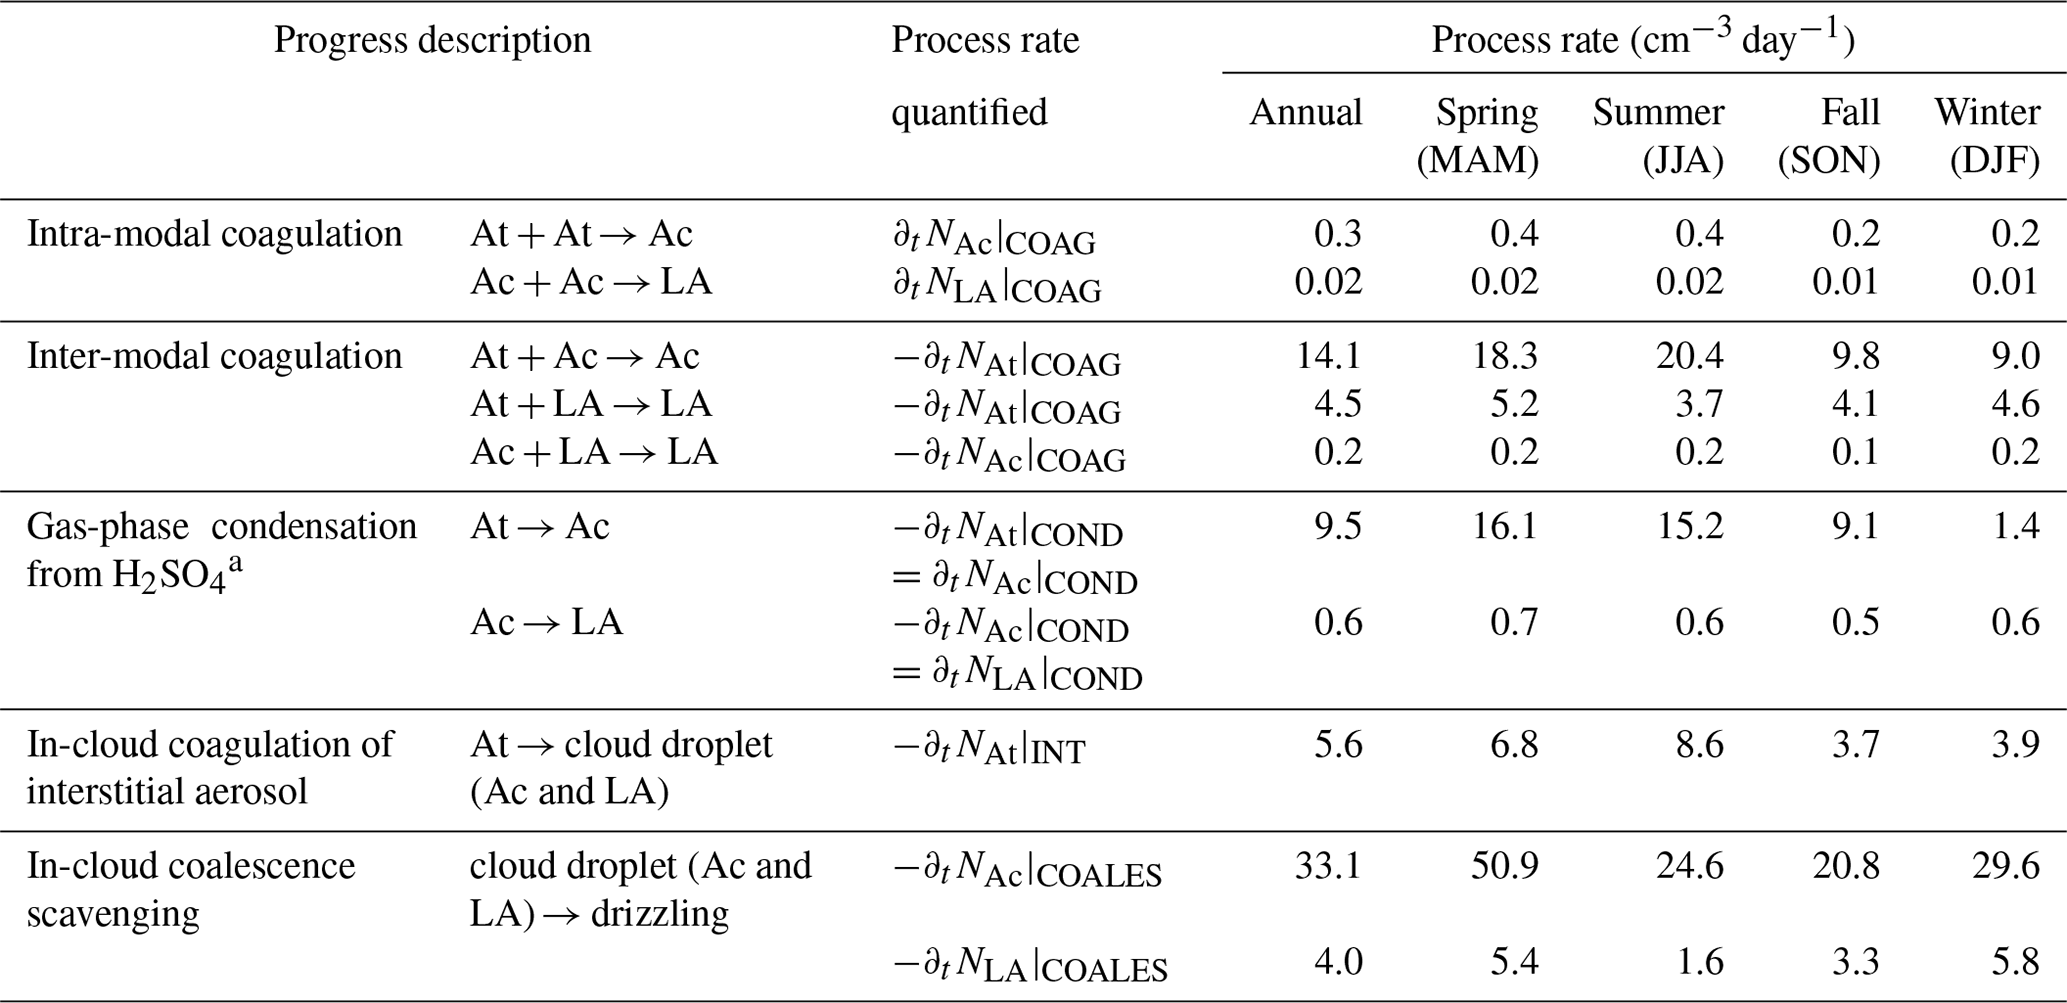
a Gas-phase H2SO4 is assumed to be 1.35 ppt (Pandis et al., 1994); see sensitivity analysis in Sect. 6.2.
4.3 Estimated rate of the potential key processes
The terms in the governing Eq. (1a–c) due to condensation, coagulation, scavenging of interstitial aerosol, and in-cloud coalescence scavenging of CCN are estimated using the equations described above and the size distribution parameters listed in Table 2. The values are listed in Table 3. The discussions of these estimates follow in Sects. 5 and 6.
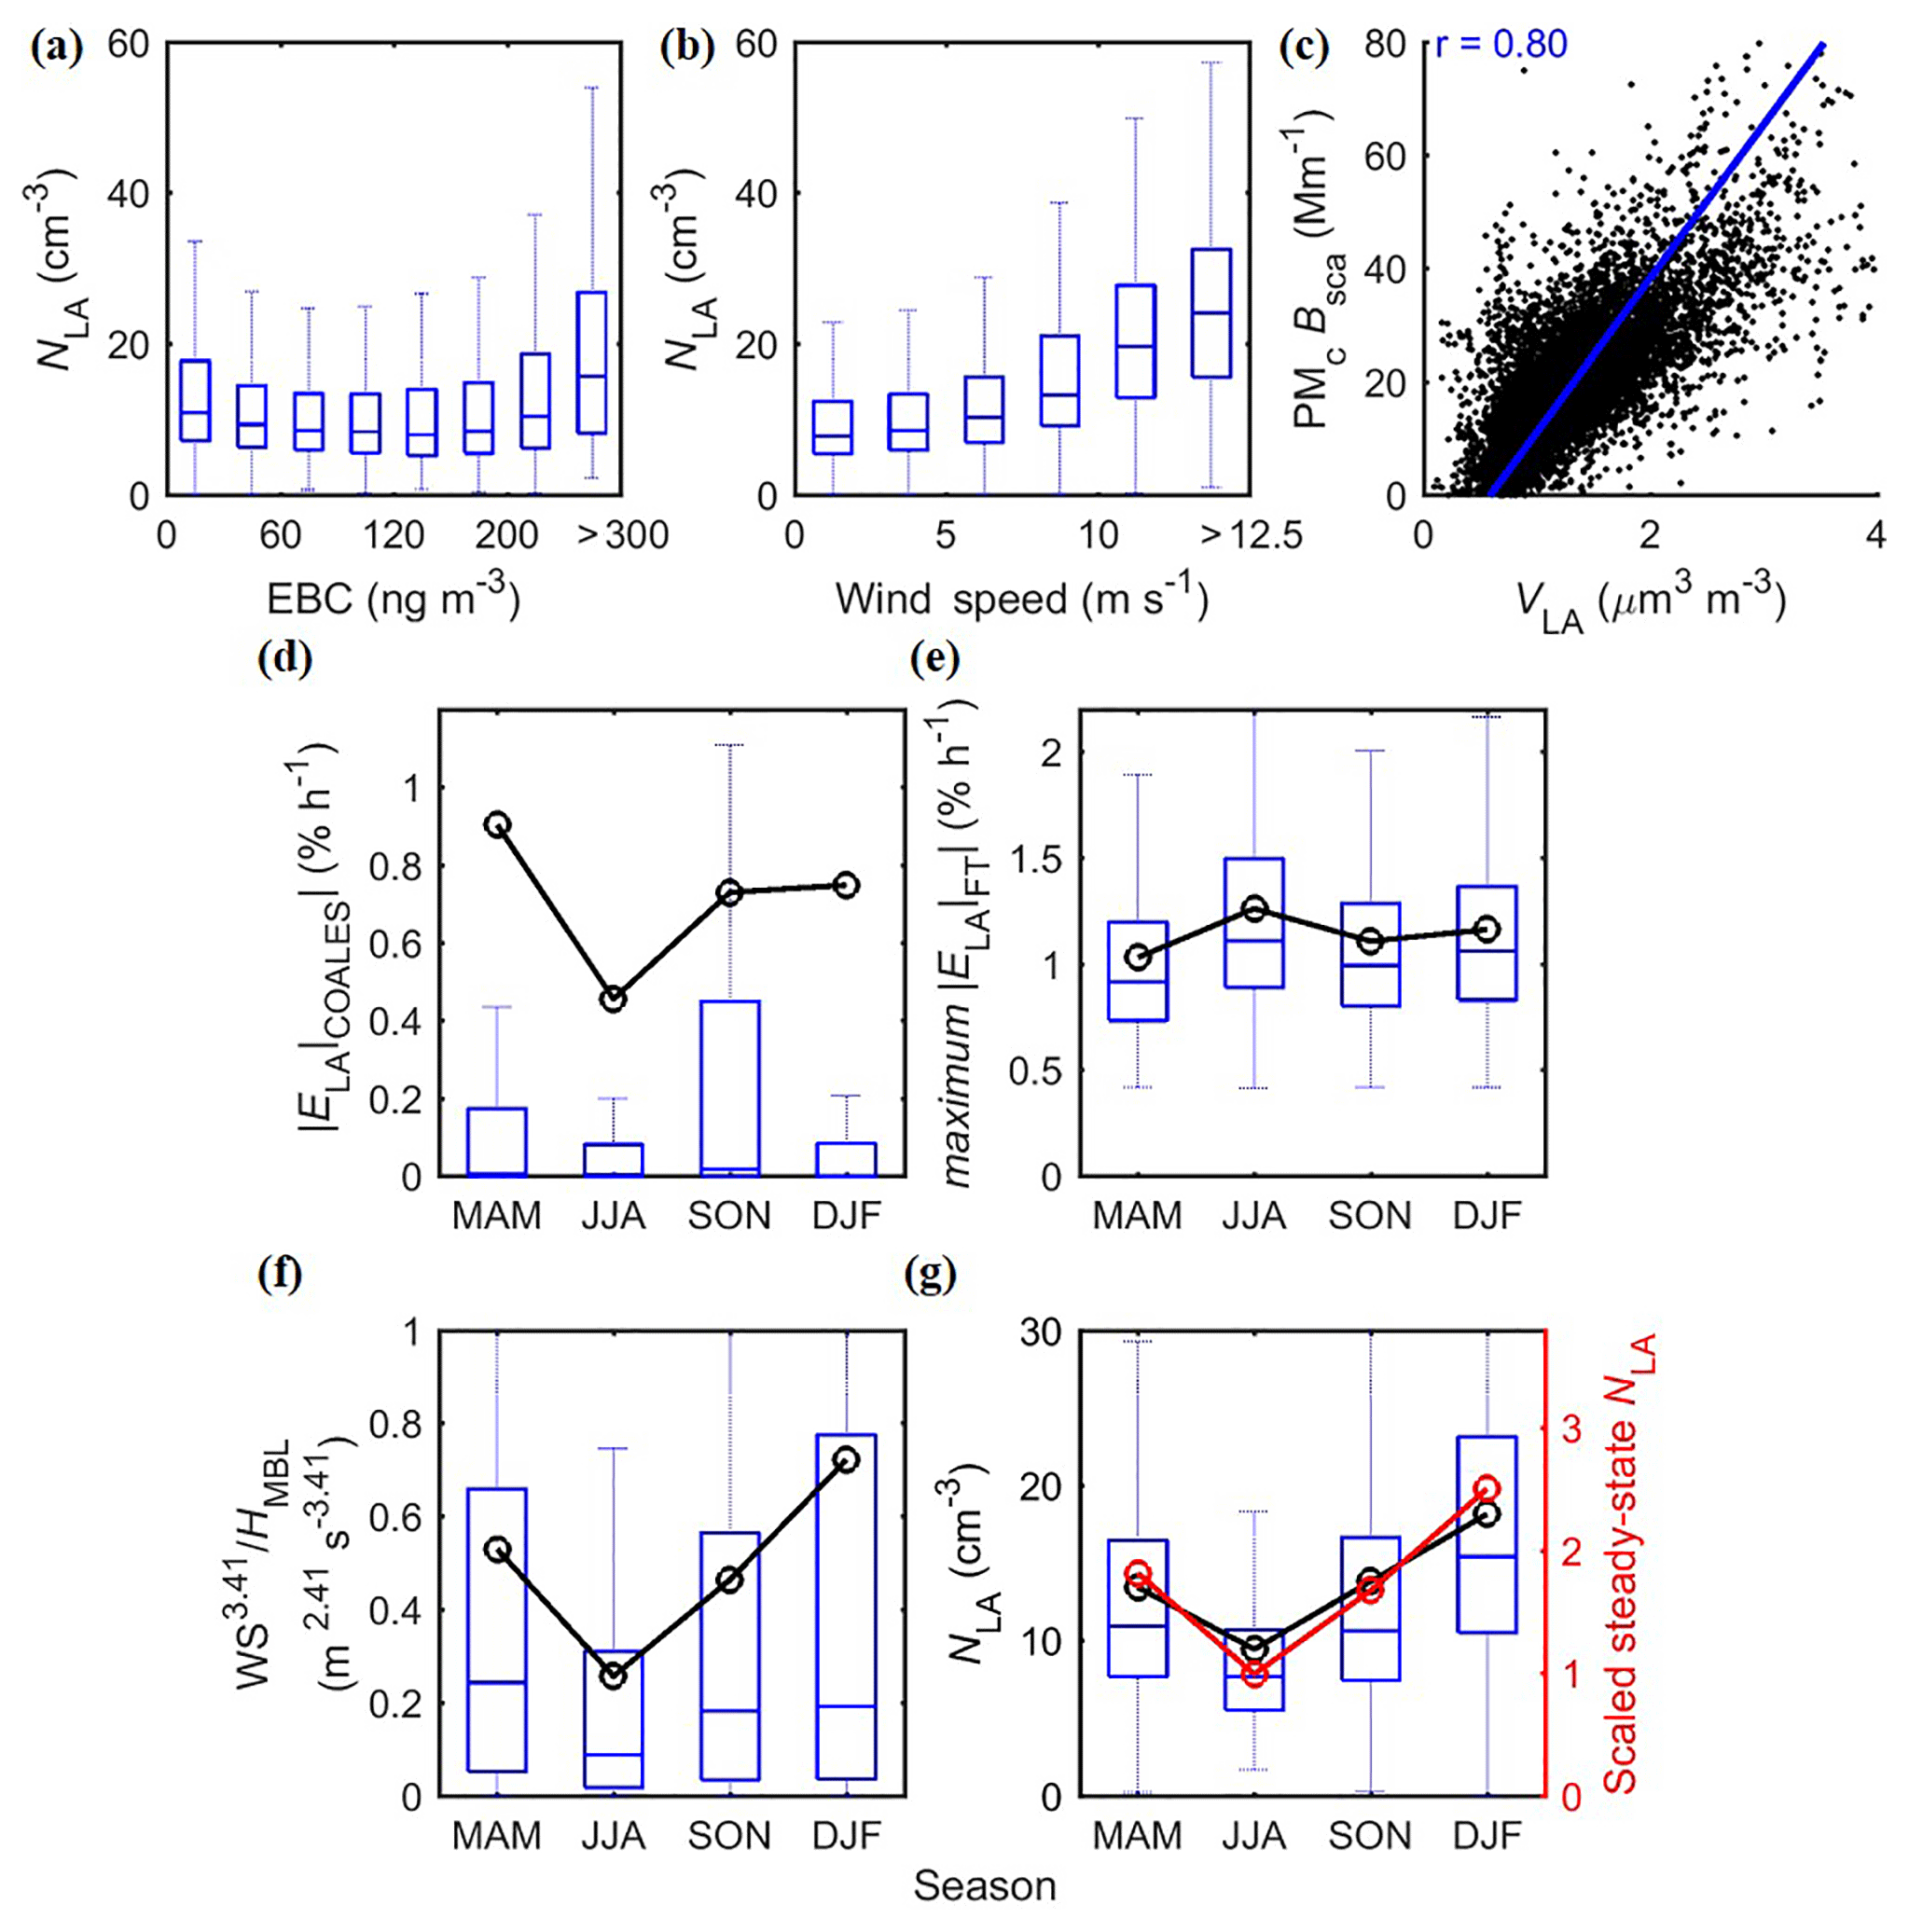
Figure 6Evidence of key controlling processes of LA mode as SSA and in-cloud coalescence scavenging. (a, b) Dependencies of NLA with EBC and WS for data in 2015 to 2017; (c) correlation between VLA and PMc Bsca for data in 2015 to 2017. The value of r given referred to the Pearson correlation coefficient, while the regression line based on York et al. (2004) is also shown for reference. (d, e) Estimated NLA sinking efficiency due to (d) in-cloud coalescence scavenging and (e) dilution of FT entrainment. (f) Indicators of the major NLA source of SSA, and (g) the corresponding scaled ratios in comparison with observed NLA seasonal patterns. Data shown in panels (d–g) are from September 2016 to August 2017. The whiskers and boxes indicate the 90th, 75th, median, 25th, and 10th percentiles, respectively. The black circle and lines indicate overall means.
Potential processes that influence the LA-mode number concentration include
Among these processes, SSA is expected to be the dominant source of NLA in the MBL, as suggested by the strong correlation between NLA and WS (Fig. 6b), a key parameter of SSA production flux (Sect. 4). Aqueous-phase reactions have been reported to produce “droplet-mode” particles in the LA-mode size range (Pandis et al., 1990; Meng and Seinfeld, 1994). However, if aqueous-phase reactions present a major source, we would expect the volume size distribution to exhibit a mode Dp of 0.6–0.8 µm, corresponding to the size ranges that have the largest access to cloud water (Pandis et al., 1990; Seinfeld and Pandis, 2016). In contrast, the volume size distribution indicates that the LA mode is actually the leading edge of a larger mode with peak Dp in the supermicron range (Fig. 3b2). This is also supported by the strong correlation between VLA and PMc Bsca (Fig. 6c). The PMc Bsca is a surrogate for the supermicron mode (PMc,Dp 1–10 µm) volume concentration (Sect. 2.2), while supermicron particles are dominated by SSA in remote MBL (Campuzano-Jost et al., 2003). Therefore, the strong correlation suggests that LA particles are also dominated by SSA, and the LA mode is essentially the sea spray aerosol coarse mode under vast majorities of the conditions. The contribution of aqueous-phase reactions to the LA-mode number concentration is likely minor and is neglected from the governing equation (Eq. 1c) in following analysis.
Given the large sizes of LA-mode particles and that dust and biomass burning episodes are already excluded, we do not expect any significant FT sources. The lack of correlation between NLA and EBC mass concentration also suggests a low concentration of LA-mode particles in long-range transported continental pollution plumes. Here, we assume that the concentration of LA-mode particles in the FT is negligible when compared to that in the boundary layer. In such a case, the entrainment of FT air dilutes the MBL LA particles, serving as a sink rather than a source. At a typical entrainment velocity, ωe, of 3.5 mm s−1 (Mohrmann et al., 2018; Wood and Bretherton, 2004), the maximum dilution rate, , equaling (Mohrmann et al., 2018), reaches ∼20 % per day. That is comparable to in-cloud coalescence scavenging, making the FT dilution an important sink of NLA. The sensitivity of the rate to entrainment velocity is discussed at the end of this section.
The terms of intra-modal coagulation ( and condensation ( from the Ac mode are estimated as 0.02 and 0.6 cm−3 day−1, respectively (Table 3). Both processes are too slow to exert significant influence on NLA during the typical aerosol lifetime of 7–10 days. The governing equation of NLA (Eq. 1c) can therefore be simplified into
The seasonal variation of NLA is a result of the balance among the three processes (Fig. 6). Production flux of SSA is proportional to WS (Eq. 2), in-cloud coalescence scavenging efficiency is (Eq. 3), and FT dilution efficiency is estimated as . Among these three terms, the FT entrainment term (Fig. 6e) shows little seasonal variation. In comparison, both the in-cloud coalescence scavenging (Fig. 6d) and the SSA production (Fig. 6f) terms are lower in summer and higher in winter, with the SSA production exhibiting a stronger seasonal variation. The value of NLA under the quasi-steady state (i.e., when ) can be scaled using the three terms for each season. The scaled steady-state NLA (red markers in Fig. 6g) successfully produces the observed seasonal trend of NLA (box plots and black lines; Fig. 6g). Varying the value of the assumed entrainment velocity within the typical range of 2–5 mm s−1 does not affect the overall seasonal trend of the scaled NLA.
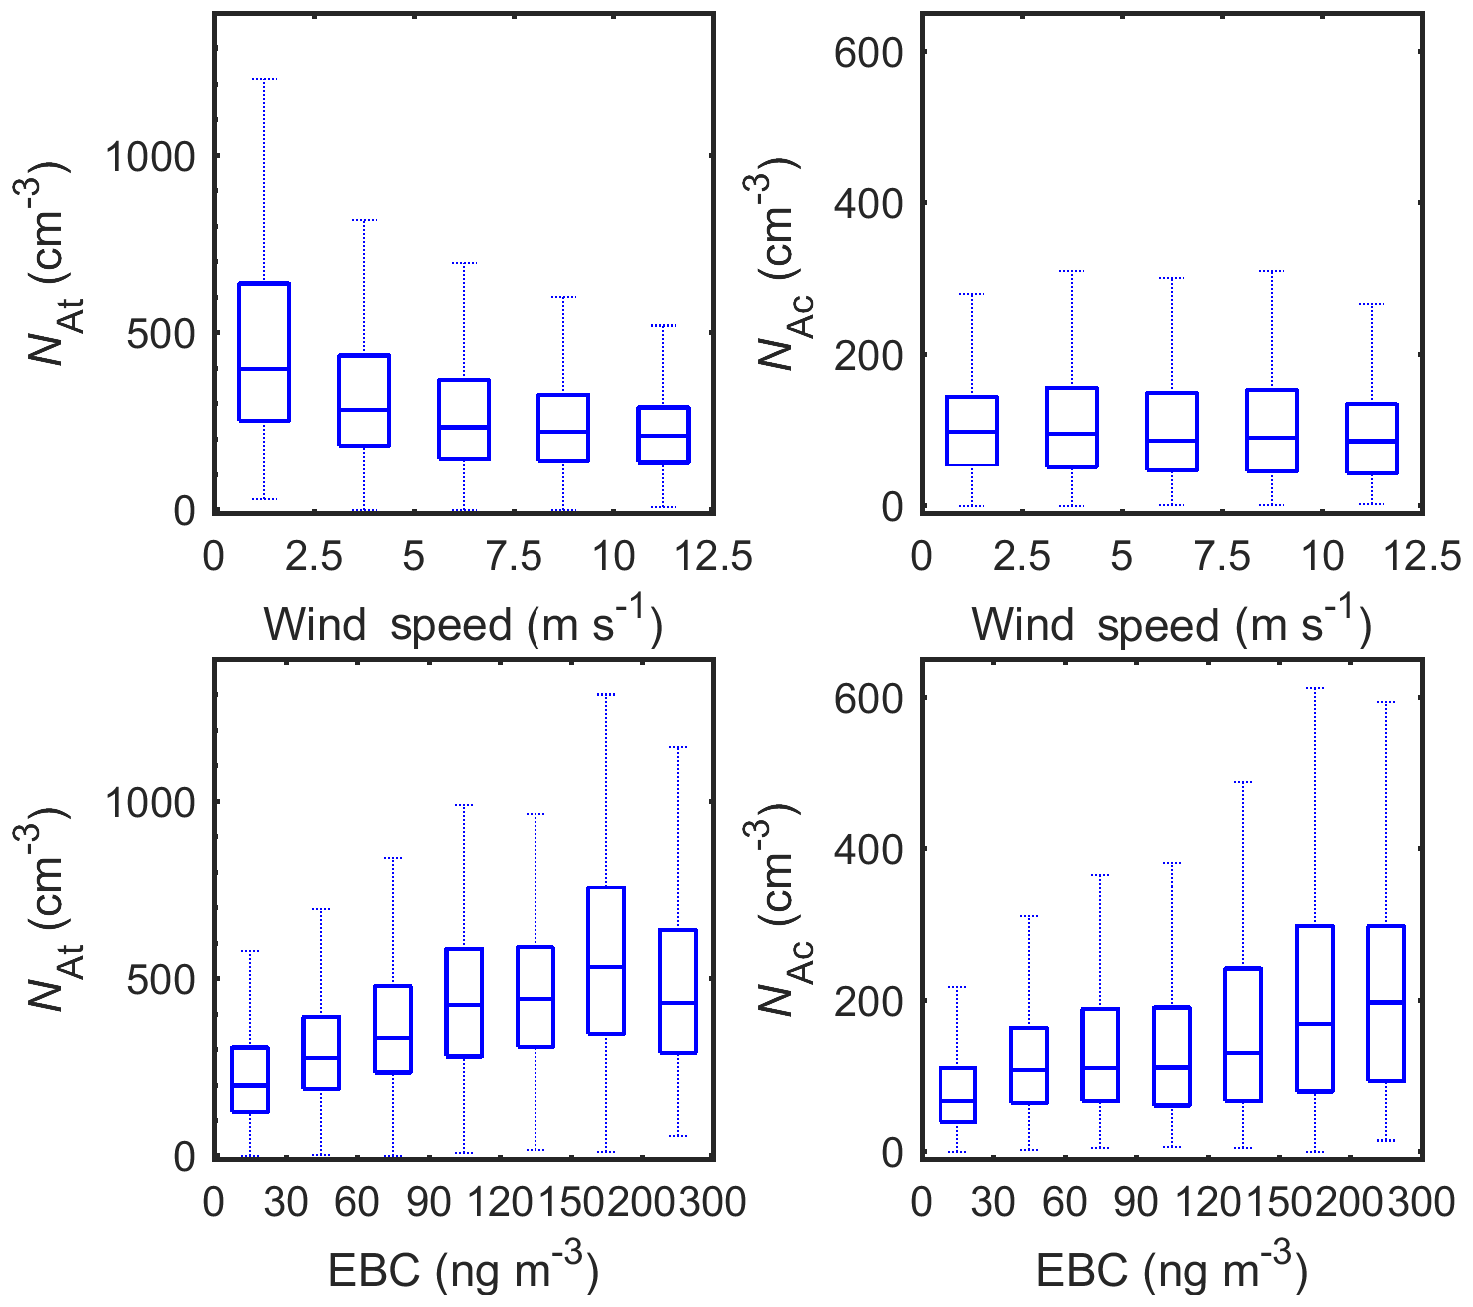
Figure 7Dependence of NAt and NAc on WS and EBC in 2015 to 2017. The whiskers and boxes indicate the 90th, 75th, median, 25th, and 10th percentiles, respectively.
6.1 Contributions of SSA to Aitken and accumulation modes
Unlike NLA, NAc is independent of the WS, and NAt decreases with increasing WS (Fig. 7), indicating relatively minor contributions from SSA to At and Ac modes. The negative correlation between NAt and WS may be due to the enhanced NLA with increasing WS (Fig. 6) and thus enhanced coagulation loss for Aitken-mode particles (see Sects. 4.2 and 6.3). In comparison, both NAt and NAc increase monotonically with EBC mass concentration (Fig. 7), suggesting the long-range transported anthropogenic aerosol is a major source of At- and Ac-mode particles in ENA.

Figure 8Estimation of SSA contributions to CN and CCN (0.1 %), namely CCN concentration at 0.1% supersaturation level. (a) Previously published SSA production flux functions used here, and (b) SSA contribution to observed CN and CCN (0.1 %) estimated with each of the four SSA production flux functions.
A semi-quantitative estimation of SSA contribution also supports the above conclusion. Assuming all LA-mode particles are from SSA, by combining NLA and an established size distribution of SSA production flux, one can estimate the upper limit of the SSA contribution to At and Ac modes (Fig. 8). For simplification, here we use number concentration of particles with Dp in the range from 400 to 1000 nm, N400, to represent the observed SSA number concentration in the same Dp range. SSA larger than ∼100 nm is CCN under ss of 0.1 % (Petters and Kreidenweis, 2007), while the measured CN has a cutoff diameter of roughly 10 nm. The contribution of SSA to CCN (0.1 %) and CNSSA can therefore be estimated by
where kCCN and kINT are factors that account for the size dependence of removal rate (see derivations in Sect. S3). The estimated kCCN is around 1, while kINT can vary from 1.7 to 4.4 as the removal efficiency is higher for CCN than non-CCN (Table 4, Fig. 9).
Table 4Parameters and results in estimation of SSA contribution to NAt and NAc.
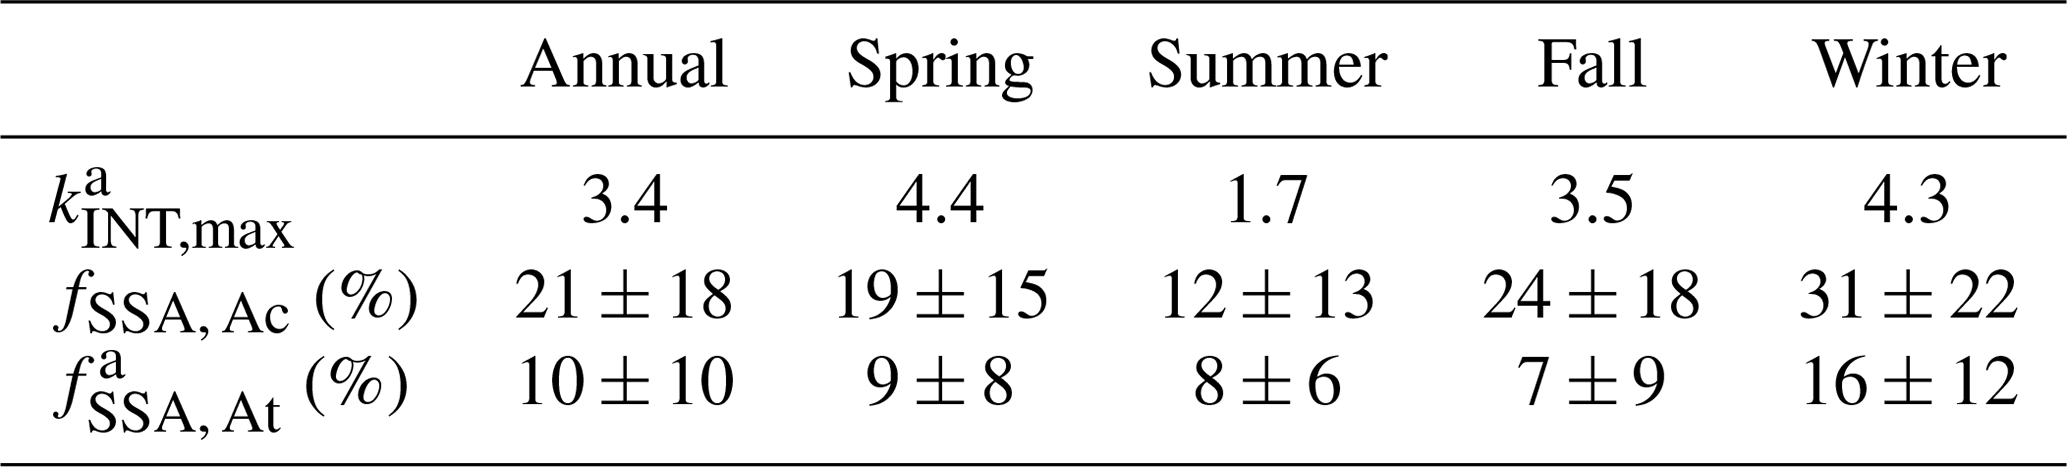
a Here, only an upper limit of kINT without considering the condensation growth is estimated. Correspondingly, the fSSA, At is also expected to be an upper limit.
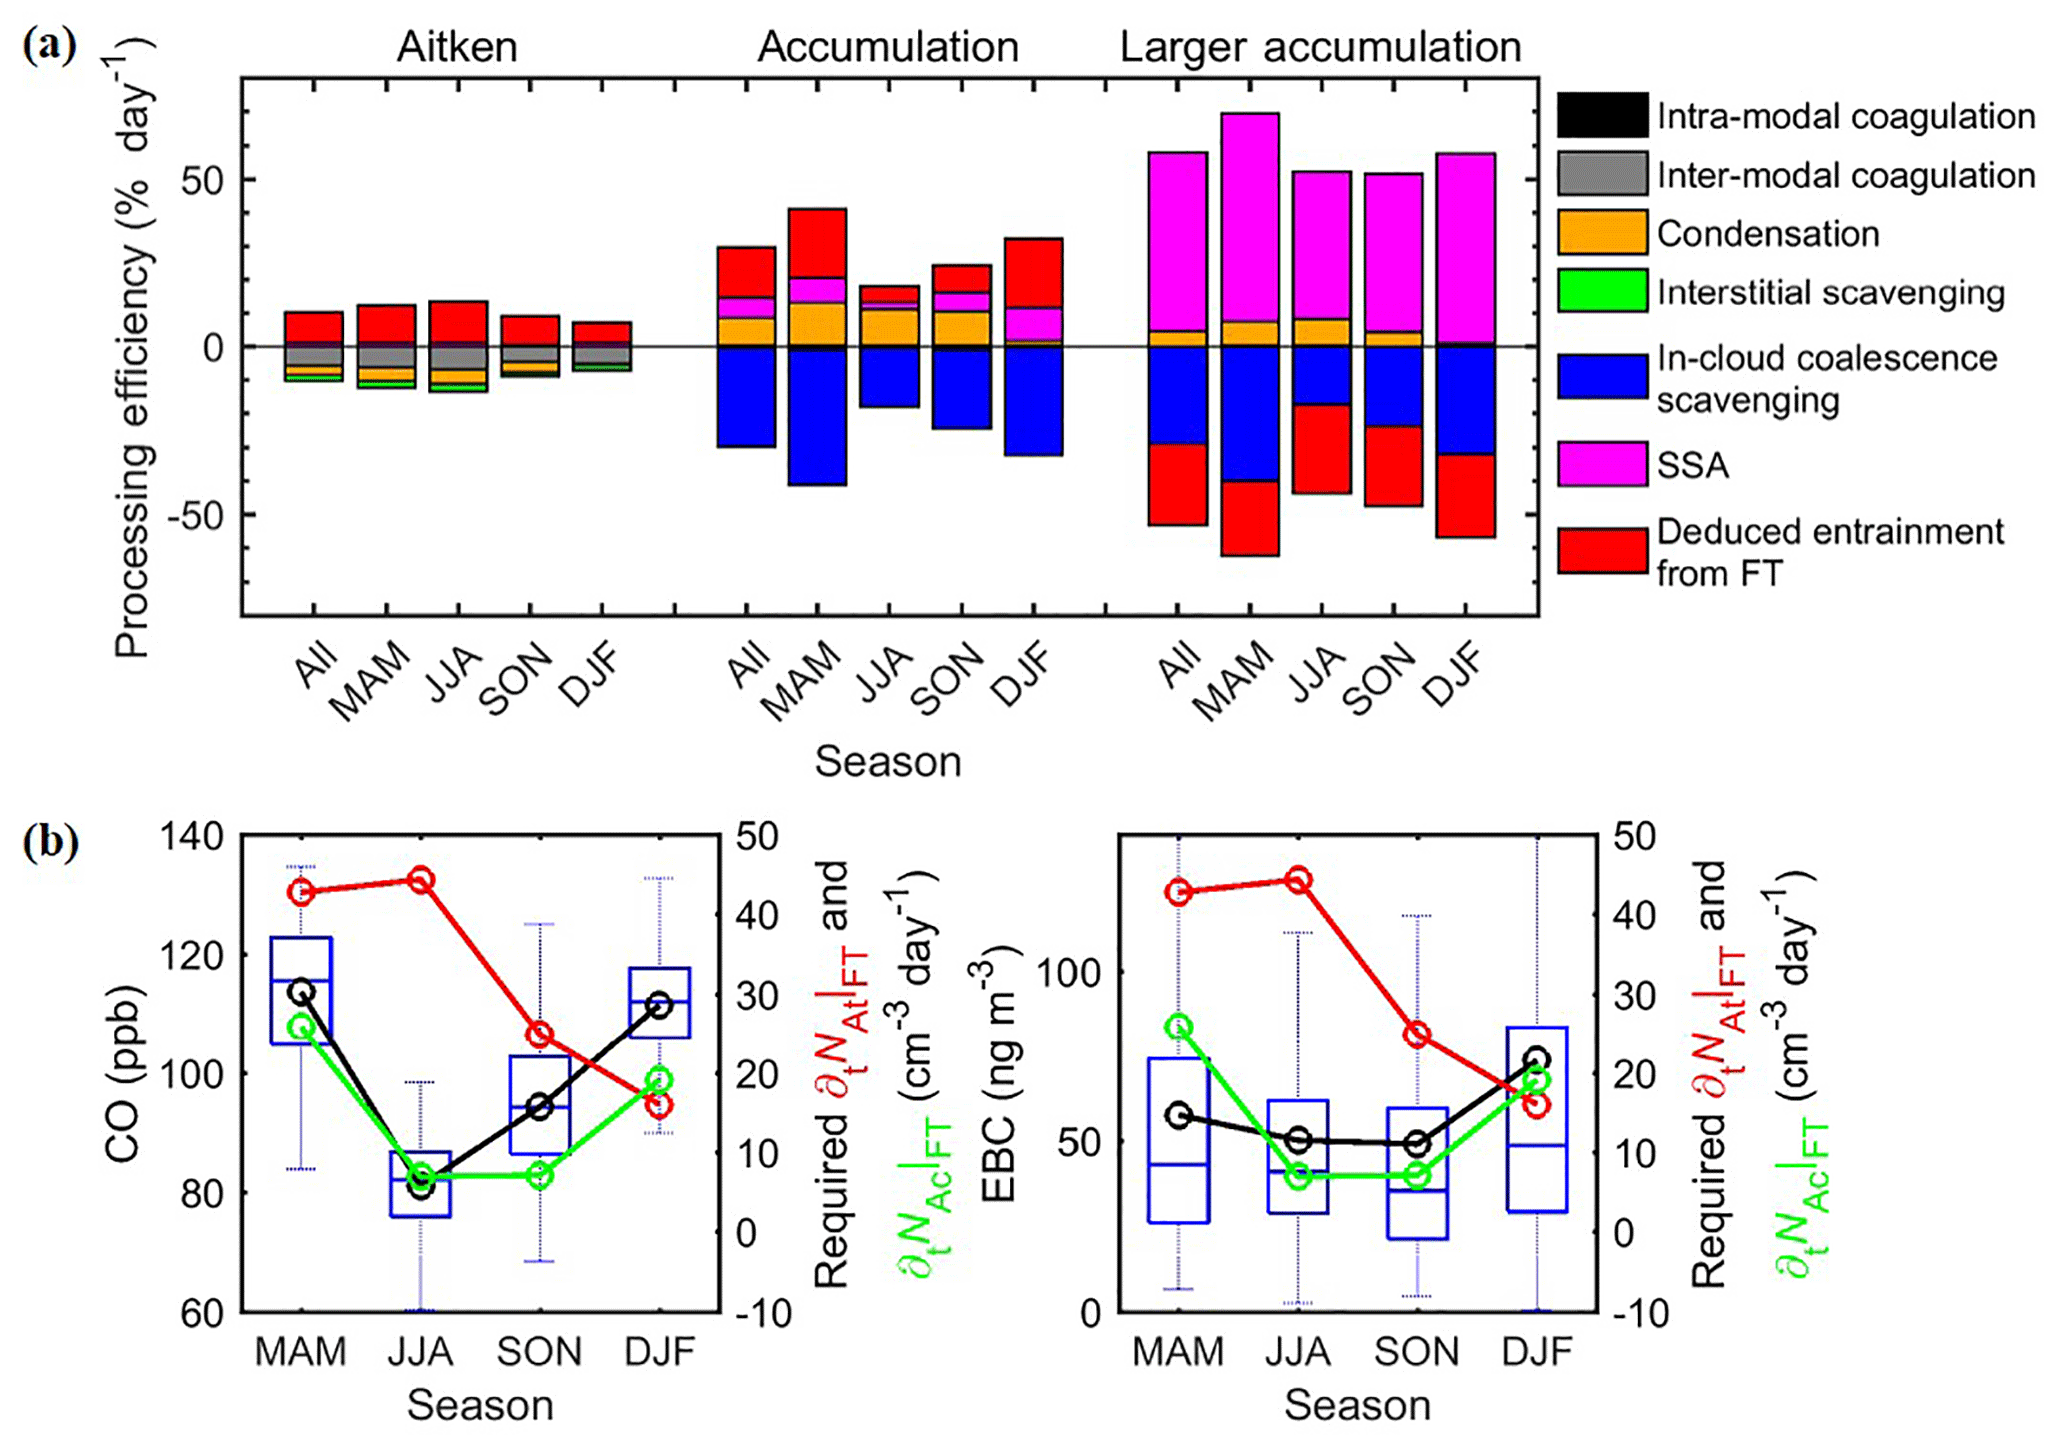
Figure 9Major controlling processes for each mode. (a) Estimated processing efficiency of each mode in different seasons. (b) Comparison of required seasonal-average FT entrainment rate to NAt and NAc, with CO and EBC. The whiskers and boxes indicate the 90th, 75th, median, 25th, and 10th percentiles, respectively. The black circle and lines indicate overall means.
Here, we used four published fSSA (lnDp) schemes (Gong, 2003; Lewis and Schwartz, 2004; Clarke et al., 2006; Grythe et al., 2014) to calculate the contribution of SSA to observed CCN (0.1 %) and CN (Fig. 8a). The initial calculation neglects the size dependence of the particle removal rate; therefore, the results represent lower limits on the contributions (Fig. 8b). This approach essentially assumes that the shape of the SSA size distribution in the MBL is the same as that of the SSA flux. Even for these lower limit estimates, CCN (0.1 %)SSA and CNSSA calculated using fSSA (lnDp) from Gong et al. (2003) and Clark et al. (2006) exceed the observed total CCN (0.1 %) and CN for a substantial fraction of the data, suggesting that these two fSSA(lnDp) functions result in overestimation of SSA contributions over the 10–400 nm size range at the ENA site. This may be partially due to the parameter dependencies of sea surface temperatures, etc. (Gantt and Meskhidze, 2013; Gantt et al., 2015; Quinn et al., 2015), which are not considered here. The value of CCN (0.1 %)SSA and CNSSA are therefore estimated as the averages of predictions based on flux size distributions reported by Grythe et al. (2014) and Lewis and Schwartz (2004), with kCCN and kINT taken into consideration. The corresponding mean fractions of CCN (0.1 %)SSA and CNSSA in observed CCN (0.1 %) and CN are 24 % and 11 %, respectively. The estimated CCN (0.1 %)SSA fraction is consistent with a recent study that shows that the SSA contribution to CCN is smaller than 30 % globally (Quinn et al., 2017). In that study, the size distribution of SSA was derived by fitting the aerosol size distribution. If we follow the same approach (Quinn et al., 2017), the estimated SSA number concentration is actually NLA shown in this study, which represents 19 % of CCN (0.1 %).
Based on the estimated SSA contribution to CN and CCN (Eq. 8a, b), we can further estimate the SSA contribution to NAc and NAt, fAc,SSA and fAt,SSA, as
and the corresponding annual mean fAc,SSA and fAt,SSA are 21 % and 10 %, respectively (Table 4).
6.2 Controlling processes of the accumulation mode
As shown in Sect. 6.1, the contribution of SSA to the Ac mode is likely substantial (annual average ∼21 %; Table 4). For the Ac mode, both intra-modal and inter-modal coagulations are much slower than in-cloud coalescence scavenging (Table 3) and can therefore be neglected from the governing equation of NAc. On the other hand, condensational growth of Aitken-mode particles may represent a substantial source of the Ac mode. AQ_CHEM reduces NAc by growing particles into LA size range. As discussed in Sect. 5, this process only makes a minor contribution to NLA. Given that NAc is about 1 order of magnitude higher than NLA, the impact of AQ_CHEM on NAc is therefore expected to be negligible. The governing equation of NAc (Eq. 1b) can be simplified into
The estimated values of and are listed in Table 3. In-cloud coalescence scavenging is the only sink of Ac-mode particles among the four main processes, while the other three are sources. Under steady-state conditions, (), we have
Namely,
The contribution due to the entrainment of FT air, , can be estimated as a residual using the fSSA,Ac value derived in the previous section (Table 4):
The normalized rates of different processes are compared in Fig. 9a. The derived is stronger in winter–spring and lower in summer–fall, in general agreement with the seasonal trends of observed CO and EBC (Fig. 9b), consistent with the picture that anthropogenic emissions represent the main source of entrained FT Ac-mode particles. This agreement also suggests that the above analysis captures the major seasonal variation of the contribution of FT entrainment to Ac-mode particles.
Based on the first-order estimates shown in Fig. 9, we can see that, on an annual basis, entrainment from the FT represents the major source of NAc, followed by condensational growth of Aitken-mode particles and SSA production. However, the relative importance of these three sources shows substantial seasonal variations. Contributions from SSA production are the lowest in summer (12 %) and the highest during winter (31 %; Table 4), a result of strong seasonal variation of surface wind speed. In contrast, condensation is negligible in winter due to the substantially lower DMS emissions and thus H2SO4 concentrations (Sect. 4.2). In summer and fall, however, the contribution from condensational growth (60 % in summer and 42 % in fall) exceeded that from FT entrainment and became the dominate source of the Ac mode. This suggests that ocean ecosystems may have a substantial influence on Ac-mode particles and therefore MBL CCN populations in the ENA. The variation in relative importance despite similar EAc|COND in spring to fall (Fig. 9a) is mainly due to the large seasonal variation in FT entrainment efficiencies. The estimated contribution from condensation is consistent with observations of individual aerosol particles in the western Atlantic (Sanchez et al., 2018) but is substantially higher than that simulated over the remote Southern Hemisphere oceans during summertime (Hannele et al., 2008). This difference is likely due to the much higher DMS sea surface concentration in the ENA (∼7.5 nM) than that in the southern oceans (∼2.5 nM) (Kettle et al., 1999), or due to the difference between observed and model-simulated aerosol size distributions, etc.
Major uncertainty in the above estimates comes from the concentration of condensates. First, there can be condensates other than H2SO4, such as organics. Common biogenic volatile organic compounds (BVOCs) such as isoprene and monoterpenes typically have a very low mixing ratio, and secondary organic aerosol (SOA) formation from these BVOCs is generally minor in the remote marine environment (Kavouras and Stephanou, 2002; Arnold et al., 2009; Gantt et al., 2009; Myriokefalitakis et al., 2010). However, recent studies suggest that photochemistry or heterogeneous oxidation at the sea surface microlayer may represent a substantial source of oxygenated gas-phase organic compounds (OVOCs), which potentially plays an important role in SOA formation and particle growth in the Arctic MBL (Burkart et al., 2017; Willis et al., 2017; Mungall et al., 2017). It is possible that the SOA formation from these OVOCs can contribute to the growth of Aitken-mode particles in the ENA as well. If so, the contribution to CCN by the growth of Aitken-mode particles would be even higher than the estimate here, which is based on condensation of H2SO4 only. Second, several studies (Langley et al., 2010; Corbett and Fischbeck, 1997; Capaldo et al., 1999; Corbett et al., 2007; Wang et al., 2008; Johansson et al., 2017) have shown ship emissions represent a significant source of SO2 in the MBL. In this study, the concentrations of SO2 and H2SO4 are estimated using DMS–SO2–H2SO4 yields based on an observation-based parameterization (Russell et al., 1994; Pandis et al., 1994). Therefore, H2SO4 formed from ship-emitted SO2, and its contribution to condensational particle growth is implicitly included.
6.3 Controlling processes of the Aitken mode
The governing equation of NAt is given by
Following the same approach in Sect. 6.2, we have
The contribution of SSA to the Aitken mode is even smaller than it is to the Ac mode, which is estimated to be no larger than 10 % (Table 4). As a result, the entrainment of FT At-mode particles represents the dominant source (Fig. 9a). is higher in spring–summer and lower in fall–winter, and such seasonal variation is somewhat different from that of the CO mixing ratio and EBC mass concentrations (Fig. 9b). These differences may be partially due to stronger new particle formation from biogenic precursors in the FT during spring and summer seasons (Sanchez et al., 2018). The strength of new particle formation is not correlated with CO or EBC concentrations, which are tracers for anthropogenic emissions. The contribution of NPF versus anthropogenic emissions to FT Aitken-mode particles cannot be quantitatively determined using data presented here alone and will be a subject of future study.
On an annual basis, inter-modal coagulation is the major (55 %) sink of NAt (Fig. 9), followed by condensation growth (28 %) and interstitial scavenging (16 %). While it is less important when compared to inter-modal coagulation, interstitial scavenging is substantial and cannot be neglected. This is consistent with the finding of Pierce et al. (2015). The overall removal efficiency of NAt (∼10 % day−1) is substantially lower than those of NAc and NLA, which corresponds to a longer lifetime (∼10 days) for At-mode particles in the MBL. The NAt removal efficiency is higher in summer and lower in winter, which is opposite that of Ac and LA modes. This is partially due to the less efficient removal of At-mode particles by coagulation and interstitial scavenging in winter, as a result of lower NAc and therefore droplet number concentrations. In addition, the low DMS fluxes during winter (Sect. 4.2) lead to substantially weakened condensation growth of At-mode particles into Ac-mode size ranges, which also contribute to the lower overall removal efficiency in winter. Relative importance of these three removal processes is quite consistent in spring to fall, with contributions from coagulation, condensation, and interstitial scavenging being around 51 %, 33 %, and 16 %, respectively. In winter, condensation becomes a negligible (7 %) removal processes, while the contribution of coagulation dominates (71 %), with the remaining 22 % due to interstitial scavenging.
We note that there may be some uncertainties in the above estimates, especially the rate of interstitial scavenging, which depends on Aitken-mode size distribution and the supersaturation inside clouds, as well as the effective cloud droplet diameters. Based on the assumed baseline conditions (effective cloud droplet diameters of 10 µm, average dry interstitial aerosols of 48 nm, and average ss of 0.12 %; see Sect. 4.1), relative sensitivities of the Kint,d are 10 %/µm, −5 %/ nm, and −8 %/ % with respect to changes in droplet diameter, dry interstitial aerosol diameter, and average ss, respectively. For average cloud droplet diameter at 15 µm, geometrical mean Aitken-mode diameter of 45 nm, and average ss of 0.1 %, a condition that is more favorable for intestinal scavenging, corresponding interstitial scavenging rate would increase by a factor of 1.8.
Given the low contribution of SSA to the At-mode particles, the governing equation for Aitken mode (Eq. 1b) can be simplified into
We examine the seasonal variations of aerosol properties, trace gas mixing ratios, and meteorological parameters measured at the ARM ENA site on Graciosa Island over a 3-year period from 2015 to 2017. Aerosol size distributions from 70 nm to 1 µm typically consist of three modes: At (<100 nm), Ac (100 to ∼300 nm), and LA (>300 nm) modes. Observed CCN number concentrations are in general agreement with the sum of NAc and NLA. The particle number concentration and mode diameter of the three modes exhibit different seasonal variations, suggesting that they are controlled by different processes.
Sources of LA-mode particles are dominated by SSA. The major sinks of NLA are in-cloud coalescence scavenging and dilution by entrained FT air. NLA is higher in winter and lower in summer. The higher NLA during winter is attributed to strong SSA production flux due to high wind speed, which prevails over an increase in in-cloud coalescence scavenging. The seasonal variation of steady-state NLA is derived from scaling the rates of the major processes, and the result agrees well with the observation.
In comparison, SSA represents a relatively minor fraction of NAc and NAt, with estimated annual mean contributions being 21 % and no larger than 10 %, respectively. For NAc, the other sources are entrained FT Ac-mode particles and condensational growth of Aitken-mode particles inside the MBL, while the major sink is in-cloud coalescence scavenging. The derived FT contribution to NAc generally follows the seasonal trends of CO and EBC, namely higher in spring–winter and lower in summer, consistent with the picture that anthropogenic emissions represent the main source of entrained FT Ac-mode particles. While entrainment from the FT is the major source on the annual basis, the relative importance of the different sources varies strongly with the season. In summer and fall, condensation growth of the At mode may become the dominant source, contributing 60 % and 42 % of the Ac-mode particles in the MBL. In winter, SSA contributes to ∼31 % of the Ac mode, surpassing the contribution due to condensational growth. This is due to a combination of strong surface wind speed and lower DMS emissions during winter season.
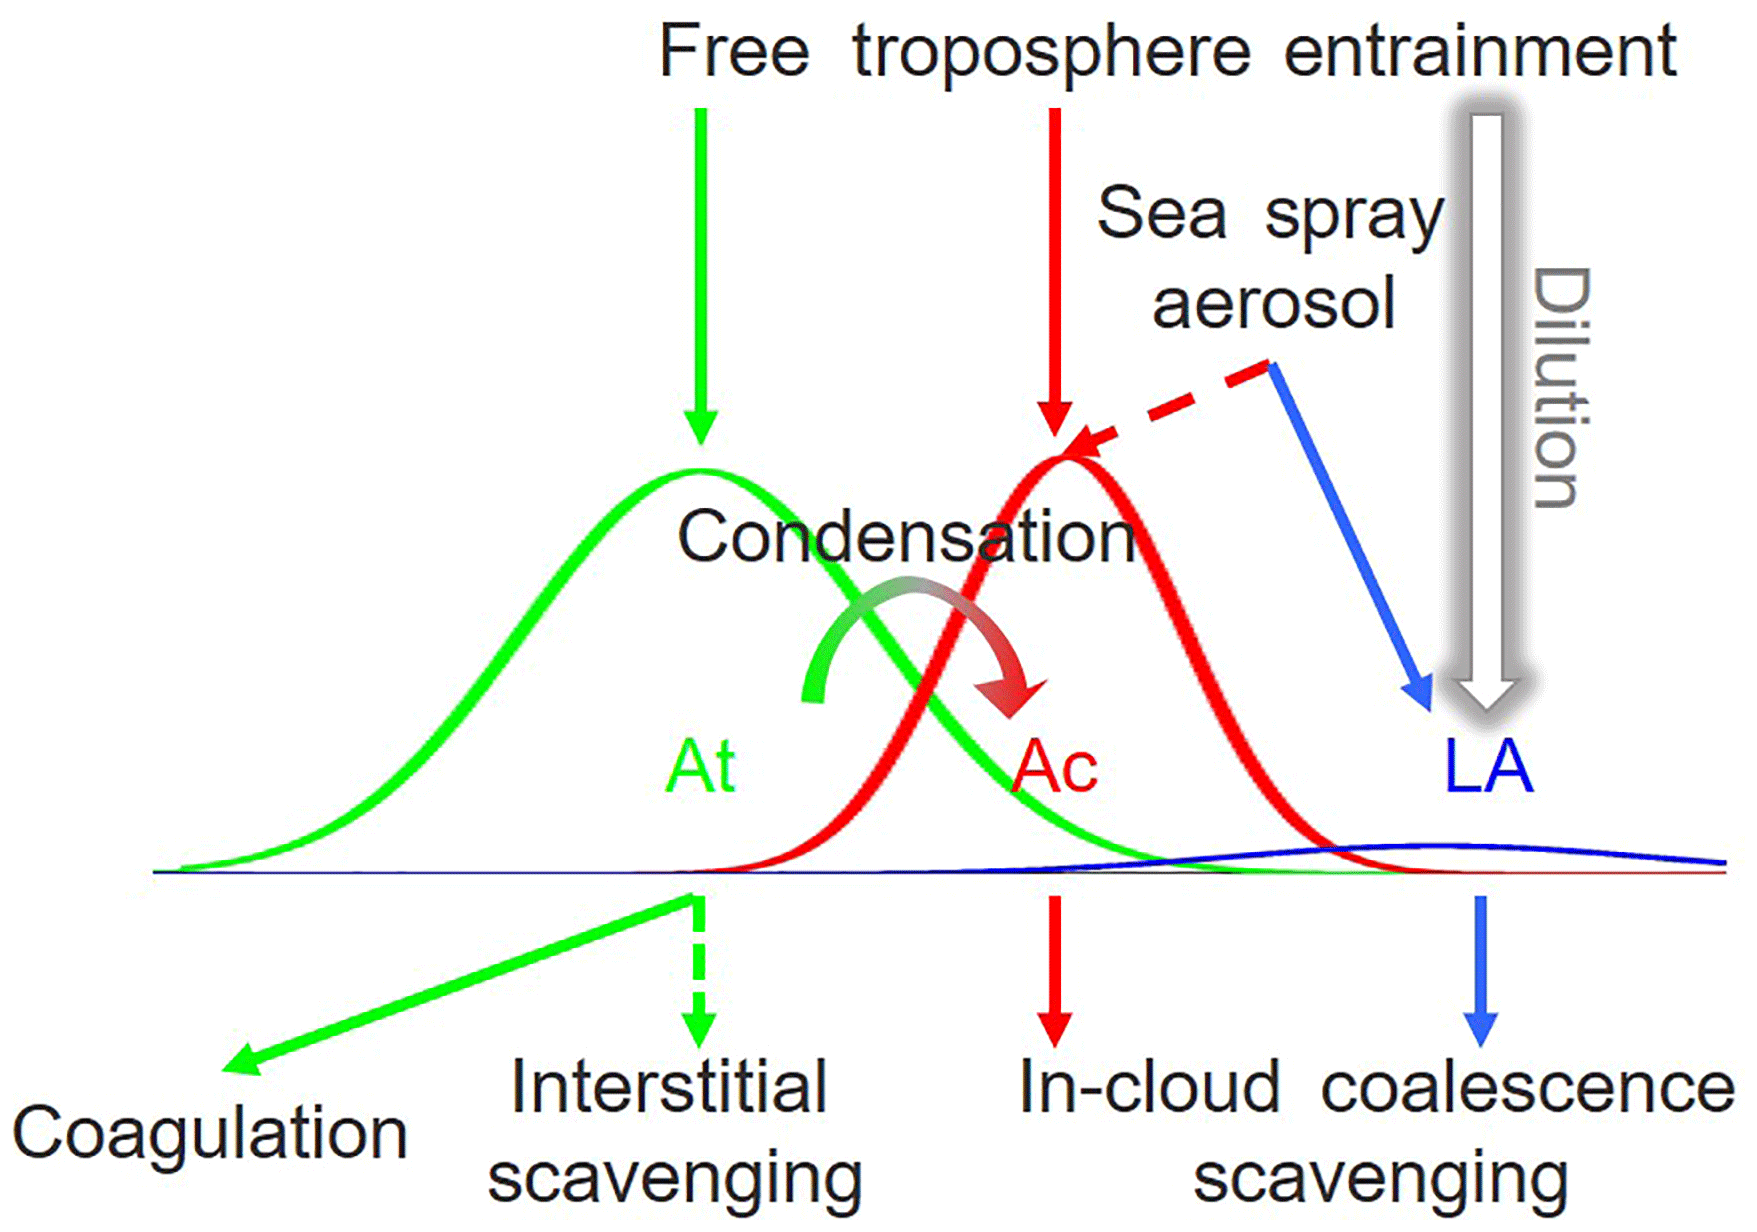
Figure 10Concept model of key controlling processes of MBL aerosol number concentrations for each mode at ENA. Dashed lines indicate the non-dominating but contributing processes. Negligible processes are not shown here.
For NAt, entrainment from the FT is expected to be the dominant source, and coagulation represents the major sink. The derived FT contribution to NAt is higher in spring–summer and lower in fall–winter, possibly due to stronger NPF from biogenic precursors in the FT during spring and summer seasons (Tarrasón et al., 1995). The relative importance of NPF and long-range transported continental emissions to FT Aitken- and nucleation-mode particles, and the subsequent contribution to the MBL CCN population will be examined in future studies. On an annual basis, 52 %, 32 %, and 16 % of NAt are removed by inter-modal coagulation, condensational growth, and interstitial scavenging, respectively. Relative importance of these three removal processes is quite similar from spring to fall. In winter, condensation becomes a negligible (7 %) removal process due to the low DMS fluxes, while contribution of coagulation increases to 71 %.
Based on the above results, the processes that control the concentrations of the different particle modes are summarized in Fig. 10. These results suggest particles entrained from the free troposphere represent the major source of CCN in the marine boundary layer. Some of the entrained particles directly contribute to the Ac-mode population in the MBL and are sufficiently large to serve as CCN. In addition, Aitken-mode particles in the free troposphere, which are attributed to NPF and long-range transported continental emissions, can grow and form CCN after their entrainment into the MBL. Our calculation suggests that this represents a significant source of MBL CCN all year, with the highest contribution of nearly 60 % during summer seasons. As the growth of Aitken-mode particles to CCN size is to a large degree the result of the condensation of sulfuric acid, a product of DMS oxidation, this suggests that ocean ecosystems may have a substantial influence on MBL CCN population in the ENA through emission of DMS.
Data used in this study are publicly accessible at the permanent archive of data collected at the eastern North Atlantic site of the Atmospheric Radiation Measurement (ARM) user facility (available at https://www.archive.arm.gov/discovery; last access: 8 December 2018).
The supplement related to this article is available online at: https://doi.org/10.5194/acp-18-17615-2018-supplement.
JW and GZ designed the research. GZ led the analyses. GZ and JW wrote the manuscript with major input from YW and MPJ, and further input from all other authors.
The authors declare that they have no conflict of interest.
The research was conducted with funding from the Atmospheric System Research
(ASR) and Atmospheric Radiation Measurement (ARM) programs (Office of
Biological and Environmental Research of US DOE, under contract
DE-AC02-98CH10886). We acknowledge the ARM Climate Research Facility, a user
facility of the United States Department of Energy (US DOE), Office of
Science, sponsored by the Office of Biological and Environmental Research.
Robert Wood acknowledges funding from ASR grant DE-SC0013489 (ENA Site
Science).
Edited by: Aijun Ding
Reviewed by: two anonymous referees
Abdalmogith, S. S. and Harrison, R. M.: The use of trajectory cluster analysis to examine the long-range transport of secondary inorganic aerosol in the UK, Atmos. Environ., 39, 6686–6695, https://doi.org/10.1016/j.atmosenv.2005.07.059, 2005.
Albrecht, B. A.: Aerosols, Cloud Microphysics, and Fractional Cloudiness, Science, 245, 1227–1230, https://doi.org/10.1126/science.245.4923.1227, 1989.
Albrecht, B. A., Bretherton, C. S., Johnson, D., Scubert, W. H., and Frisch, A. S.: The Atlantic Stratocumulus Transition Experiment – ASTEX, B. Am. Meteorol. Soc., 76, 889–904, https://doi.org/10.1175/1520-0477(1995)076<0889:taste>2.0.co;2, 1995.
Anderson, T. L. and Ogren, J. A.: Determining Aerosol Radiative Properties Using the TSI 3563 Integrating Nephelometer, Aerosol Sci. Technol., 29, 57–69, https://doi.org/10.1080/02786829808965551, 1998.
Arnold, S. R., Spracklen, D. V., Williams, J., Yassaa, N., Sciare, J., Bonsang, B., Gros, V., Peeken, I., Lewis, A. C., Alvain, S., and Moulin, C.: Evaluation of the global oceanic isoprene source and its impacts on marine organic carbon aerosol, Atmos. Chem. Phys., 9, 1253–1262, https://doi.org/10.5194/acp-9-1253-2009, 2009.
Atmospheric Radiation Measurement (ARM) Climate Research Facility: KAZR Corrected Data (KAZRCORGE), 1 October 2015 to 1 January 2018, Eastern North Atlantic (ENA) Graciosa Island, Azores, Portugal (C1), updated hourly, compiled by: Matthews, A., Isom, B., Nelson, D., Lindenmaier, I., Hardin, J., Johnson, K., Bharadwaj, N., Giangrande, S., and Toto, T., Atmospheric Radiation Measurement (ARM) Climate Research Facility Data Archive: Oak Ridge, Tennessee, USA, https://doi.org/10.5439/1350632, 1990.
Bates, T. S., Quinn, P. K., Covert, D. S., Coffman, D. J., Johnson, J. E., and Wiedensohler, A.: Aerosol physical properties and processes in the lower marine boundary layer: a comparison of shipboard sub-micron data from ACE-1 and ACE-2, Tellus B, 52, 258–272, https://doi.org/10.1034/j.1600-0889.2000.00021.x, 2000.
Blot, R., Clarke, A. D., Freitag, S., Kapustin, V., Howell, S. G., Jensen, J. B., Shank, L. M., McNaughton, C. S., and Brekhovskikh, V.: Ultrafine sea spray aerosol over the southeastern Pacific: open-ocean contributions to marine boundary layer CCN, Atmos. Chem. Phys., 13, 7263–7278, https://doi.org/10.5194/acp-13-7263-2013, 2013.
Bond, T. C., Anderson, T. L., and Campbell, D.: Calibration and Intercomparison of Filter-Based Measurements of Visible Light Absorption by Aerosols, Aerosol Sci. Technol., 30, 582–600, https://doi.org/10.1080/027868299304435, 1999.
Bond, T. C., Doherty, S. J., Fahey, D. W., Forster, P. M., Berntsen, T., DeAngelo, B. J., Flanner, M. G., Ghan, S., Kärcher, B., Koch, D., Kinne, S., Kondo, Y., Quinn, P. K., Sarofim, M. C., Schultz, M. G., Schulz, M., Venkataraman, C., Zhang, H., Zhang, S., Bellouin, N., Guttikunda, S. K., Hopke, P. K., Jacobson, M. Z., Kaiser, J. W., Klimont, Z., Lohmann, U., Schwarz, J. P., Shindell, D., Storelvmo, T., Warren, S. G., and Zender, C. S.: Bounding the role of black carbon in the climate system: A scientific assessment, J. Geophys. Res.-Atmos., 118, 5380–5552, https://doi.org/10.1002/jgrd.50171, 2013.
Bony, S. and Dufresne, J.-L.: Marine boundary layer clouds at the heart of tropical cloud feedback uncertainties in climate models, Geophys. Res. Lett., 32, L20806, https://doi.org/10.1029/2005GL023851, 2005.
Bony, S., Colman, R., Kattsov, V. M., Allan, R. P., Bretherton, C. S., Dufresne, J.-L., Hall, A., Hallegatte, S., Holland, M. M., Ingram, W., Randall, D. A., Soden, B. J., Tselioudis, G., and Webb, M. J.: How Well Do We Understand and Evaluate Climate Change Feedback Processes?, J. Climate, 19, 3445–3482, https://doi.org/10.1175/jcli3819.1, 2006.
Burkart, J., Hodshire, A. L., Mungall, E. L., Pierce, J. R., Collins, D. B., Ladino, L. A., Lee, A. K. Y., Irish, V., Wentzell, J. J. B., Liggio, J., Papakyriakou, T., Murphy, J., and Abbatt, J.: Organic Condensation and Particle Growth to CCN Sizes in the Summertime Marine Arctic Is Driven by Materials More Semivolatile Than at Continental Sites, Geophys. Res. Lett., 44, 10725–710734, https://doi.org/10.1002/2017GL075671, 2017.
Campuzano-Jost, P., Clark, C. D., Maring, H., Covert, D. S., Howell, S., Kapustin, V., Clarke, K. A., Saltzman, E. S., and Hynes, A. J.: Near-Real-Time Measurement of Sea-Salt Aerosol during the SEAS Campaign: Comparison of Emission-Based Sodium Detection with an Aerosol Volatility Technique, J. Atmos. Ocean. Technol., 20, 1421–1430, https://doi.org/10.1175/1520-0426(2003)020<1421:nmosad>2.0.co;2, 2003.
Capaldo, K., Corbett, J. J., Kasibhatla, P., Fischbeck, P., and Pandis, S. N.: Effects of ship emissions on sulphur cycling and radiative climate forcing over the ocean, Nature, 400, 743–746, https://doi.org/10.1038/23438, 1999.
Carslaw, K. S., Lee, L. A., Reddington, C. L., Pringle, K. J., Rap, A., Forster, P. M., Mann, G. W., Spracklen, D. V., Woodhouse, M. T., Regayre, L. A., and Pierce, J. R.: Large contribution of natural aerosols to uncertainty in indirect forcing, Nature, 503, 67–71, https://doi.org/10.1038/nature12674, 2013.
Cazorla, A., Bahadur, R., Suski, K. J., Cahill, J. F., Chand, D., Schmid, B., Ramanathan, V., and Prather, K. A.: Relating aerosol absorption due to soot, organic carbon, and dust to emission sources determined from in-situ chemical measurements, Atmos. Chem. Phys., 13, 9337–9350, https://doi.org/10.5194/acp-13-9337-2013, 2013.
Cheng, Y., Zheng, G., Wei, C., Mu, Q., Zheng, B., Wang, Z., Gao, M., Zhang, Q., He, K., Carmichael, G., Pöschl, U., and Su, H.: Reactive nitrogen chemistry in aerosol water as a source of sulfate during haze events in China, Sci. Adv., 2, E1601530, https://doi.org/10.1126/sciadv.1601530, 2016.
Chin, M., Jacob, D. J., Munger, J. W., Parrish, D. D., and Doddridge, B. G.: Relationship of ozone and carbon monoxide over North America, J. Geophys. Res.-Atmos., 99, 14565–14573, https://doi.org/10.1029/94JD00907, 1994.
Clarke, A., McNaughton, C., Kapustin, V., Shinozuka, Y., Howell, S., Dibb, J., Zhou, J., Anderson, B., Brekhovskikh, V., Turner, H., and Pinkerton, M.: Biomass burning and pollution aerosol over North America: Organic components and their influence on spectral optical properties and humidification response, J. Geophys. Res.-Atmos., 112, D12S18, https://doi.org/10.1029/2006JD007777, 2007.
Clarke, A. and Kapustin, V.: Hemispheric Aerosol Vertical Profiles: Anthropogenic Impacts on Optical Depth and Cloud Nuclei, Science, 329, 1488–1492, https://doi.org/10.1126/science.1188838, 2010.
Clarke, A. D., Owens, S. R., and Zhou, J.: An ultrafine sea-salt flux from breaking waves: Implications for cloud condensation nuclei in the remote marine atmosphere, J. Geophys. Res.-Atmos., 111, D06202, https://doi.org/10.1029/2005JD006565, 2006.
Clarke, A. D., Freitag, S., Simpson, R. M. C., Hudson, J. G., Howell, S. G., Brekhovskikh, V. L., Campos, T., Kapustin, V. N., and Zhou, J.: Free troposphere as a major source of CCN for the equatorial pacific boundary layer: long-range transport and teleconnections, Atmos. Chem. Phys., 13, 7511–7529, https://doi.org/10.5194/acp-13-7511-2013, 2013.
Cooper, O. R., Moody, J. L., Parrish, D. D., Trainer, M., Ryerson, T. B., Holloway, J. S., Hübler, G., Fehsenfeld, F. C., and Evans, M. J.: Trace gas composition of midlatitude cyclones over the western North Atlantic Ocean: A conceptual model, J. Geophys. Res.-Atmos., 107, ACH1-1–ACH1-13, https://doi.org/10.1029/2001JD000901, 2002.
Corbett, J. J. and Fischbeck, P.: Emissions from Ships, Science, 278, 823–824, https://doi.org/10.1126/science.278.5339.823, 1997.
Corbett, J. J., Winebrake, J. J., Green, E. H., Kasibhatla, P., Eyring, V., and Lauer, A.: Mortality from Ship Emissions: A Global Assessment, Environ. Sci. Technol., 41, 8512–8518, https://doi.org/10.1021/es071686z, 2007.
Costabile, F., Barnaba, F., Angelini, F., and Gobbi, G. P.: Identification of key aerosol populations through their size and composition resolved spectral scattering and absorption, Atmos. Chem. Phys., 13, 2455–2470, https://doi.org/10.5194/acp-13-2455-2013, 2013.
Dal Maso, M., Kulmala, M., Lehtinen, K. E. J., Mäkelä, J. M., Aalto, P., and O'Dowd, C. D.: Condensation and coagulation sinks and formation of nucleation mode particles in coastal and boreal forest boundary layers, J. Geophys. Res.-Atmos., 107, PAR2-1–PAR2-10, https://doi.org/10.1029/2001JD001053, 2002.
de Leeuw, G., Andreas, E. L., Anguelova, M. D., Fairall, C. W., Lewis, E. R., O'Dowd, C., Schulz, M., and Schwartz, S. E.: Production flux of sea spray aerosol, Rev. Geophys., 49, RG2001, https://doi.org/10.1029/2010RG000349, 2011.
Dong, X., Xi, B., Kennedy, A., Minnis, P., and Wood, R.: A 19-Month Record of Marine Aerosol–Cloud–Radiation Properties Derived from DOE ARM Mobile Facility Deployment at the Azores. Part I: Cloud Fraction and Single-Layered MBL Cloud Properties, J. Climate, 27, 3665–3682, https://doi.org/10.1175/jcli-d-13-00553.1, 2014.
Dong, X., Schwantes, A. C., Xi, B., and Wu, P.: Investigation of the marine boundary layer cloud and CCN properties under coupled and decoupled conditions over the Azores, J. Geophys. Res.-Atmos., 120, 6179–6191, https://doi.org/10.1002/2014JD022939, 2015.
Emeis, S., Jahn, C., Münkel, C., Münsterer, C., and Schäfer, K.: Multiple atmospheric layering and mixing-layer height in he Inn valley observed by remote sensing, Meteorologische Z., 16, 415–424, https://doi.org/10.1127/0941-2948/2007/0203, 2007.
Emeis, S., Schäfer, K., and Münkel, C.: Surface-based remote sensing of the mixing-layer height – a review, Meteorologische Z., 17, 621–630, https://doi.org/10.1127/0941-2948/2008/0312, 2008.
Eresmaa, N., Karppinen, A., Joffre, S. M., Räsänen, J., and Talvitie, H.: Mixing height determination by ceilometer, Atmos. Chem. Phys., 6, 1485–1493, https://doi.org/10.5194/acp-6-1485-2006, 2006.
Fischer, H., Kormann, R., Klüpfel, T., Gurk, C., Königstedt, R., Parchatka, U., Mühle, J., Rhee, T. S., Brenninkmeijer, C. A. M., Bonasoni, P., and Stohl, A.: Ozone production and trace gas correlations during the June 2000 MINATROC intensive measurement campaign at Mt. Cimone, Atmos. Chem. Phys., 3, 725–738, https://doi.org/10.5194/acp-3-725-2003, 2003.
Gantt, B. and Meskhidze, N.: The physical and chemical characteristics of marine primary organic aerosol: a review, Atmos. Chem. Phys., 13, 3979–3996, https://doi.org/10.5194/acp-13-3979-2013, 2013.
Gantt, B., Meskhidze, N., and Kamykowski, D.: A new physically-based quantification of marine isoprene and primary organic aerosol emissions, Atmos. Chem. Phys., 9, 4915–4927, https://doi.org/10.5194/acp-9-4915-2009, 2009.
Gantt, B., Kelly, J. T., and Bash, J. O.: Updating sea spray aerosol emissions in the Community Multiscale Air Quality (CMAQ) model version 5.0.2, Geosci. Model Dev., 8, 3733–3746, https://doi.org/10.5194/gmd-8-3733-2015, 2015.
Garrett, T. J., Avey, L., Palmer, P. I., Stohl, A., Neuman, J. A., Brock, C. A., Ryerson, T. B., and Holloway, J. S.: Quantifying wet scavenging processes in aircraft observations of nitric acid and cloud condensation nuclei, J. Geophys. Res.-Atmos., 111, D23S51, https://doi.org/10.1029/2006JD007416, 2006.
Gong, S. L.: A parameterization of sea-salt aerosol source function for sub- and super-micron particles, Global Biogeochem. Cy., 17, 1097, https://doi.org/10.1029/2003GB002079, 2003.
Grythe, H., Ström, J., Krejci, R., Quinn, P., and Stohl, A.: A review of sea-spray aerosol source functions using a large global set of sea salt aerosol concentration measurements, Atmos. Chem. Phys., 14, 1277–1297, doI;10.5194/acp-14-1277-2014, 2014.
Haeffelin, M., Angelini, F., Morille, Y., Martucci, G., Frey, S., Gobbi, G. P., Lolli, S., O'Dowd, C. D., Sauvage, L., Xueref-Rémy, I., Wastine, B., and Feist, D. G.: Evaluation of Mixing-Height Retrievals from Automatic Profiling Lidars and Ceilometers in View of Future Integrated Networks in Europe, Bound.-Lay. Meteorol., 143, 49–75, https://doi.org/10.1007/s10546-011-9643-z, 2012.
Korhonen, H., Carslaw, K. S., Spracklen, D. V., Mann, G. W., and Woodhouse, M. T.: Influence of oceanic dimethyl sulfide emissions on cloud condensation nuclei concentrations and seasonality over the remote Southern Hemisphere oceans: A global model study, J. Geophys. Res.-Atmos., 113, D15204, https://doi.org/10.1029/2007JD009718, 2008.
Helmig, D., Boulter, J., David, D., Birks, J. W., Cullen, N. J., Steffen, K., Johnson, B. J., and Oltmans, S. J.: Ozone and meteorological boundary-layer conditions at Summit, Greenland, during 3–21 June 2000, Atmos. Environ., 36, 2595–2608, https://doi.org/10.1016/S1352-2310(02)00129-2, 2002.
Henzing, J. S., Olivié, D. J. L., and van Velthoven, P. F. J.: A parameterization of size resolved below cloud scavenging of aerosols by rain, Atmos. Chem. Phys., 6, 3363–3375, https://doi.org/10.5194/acp-6-3363-2006, 2006.
Honrath, R. E., Owen, R. C., Val Martín, M., Reid, J. S., Lapina, K., Fialho, P., Dziobak, M. P., Kleissl, J., and Westphal, D. L.: Regional and hemispheric impacts of anthropogenic and biomass burning emissions on summertime CO and O3 in the North Atlantic lower free troposphere, J. Geophys. Res.-Atmos., 109, D24310, https://doi.org/10.1029/2004JD005147, 2004.
Hoppel, W. A., Fitzgerald, J. W., Frick, G. M., Larson, R. E., and Mack, E. J.: Aerosol size distributions and optical properties found in the marine boundary layer over the Atlantic Ocean, J. Geophys. Res.-Atmos., 95, 3659–3686, https://doi.org/10.1029/JD095iD04p03659, 1990.
Hoppel, W. A., Frick, G. M., Fitzgerald, J. W., and Larson, R. E.: Marine boundary layer measurements of new particle formation and the effects nonprecipitating clouds have on aerosol size distribution, J. Geophys. Res.-Atmos., 99, 14443–14459, https://doi.org/10.1029/94JD00797, 1994.
Johansson, L., Jalkanen, J.-P., and Kukkonen, J.: Global assessment of shipping emissions in 2015 on a high spatial and temporal resolution, Atmos. Environ., 167, 403–415, https://doi.org/10.1016/j.atmosenv.2017.08.042, 2017.
Kavouras, I. G. and Stephanou, E. G.: Particle size distribution of organic primary and secondary aerosol constituents in urban, background marine, and forest atmosphere, J. Geophys. Res.-Atmos., 107, AAC7-1–AAC7-12, https://doi.org/10.1029/2000JD000278, 2002.
Kettle, A. J., Andreae, M. O., Amouroux, D., Andreae, T. W., Bates, T. S., Berresheim, H., Bingemer, H., Boniforti, R., Curran, M. A. J., DiTullio, G. R., Helas, G., Jones, G. B., Keller, M. D., Kiene, R. P., Leck, C., Levasseur, M., Malin, G., Maspero, M., Matrai, P., McTaggart, A. R., Mihalopoulos, N., Nguyen, B. C., Novo, A., Putaud, J. P., Rapsomanikis, S., Roberts, G., Schebeske, G., Sharma, S., Simó, R., Staubes, R., Turner, S., and Uher, G.: A global database of sea surface dimethylsulfide (DMS) measurements and a procedure to predict sea surface DMS as a function of latitude, longitude, and month, Global Biogeochem. Cy., 13, 399–444, https://doi.org/10.1029/1999GB900004, 1999.
Korolev, A. V. and Mazin, I. P.: Supersaturation of Water Vapor in Clouds, J. Atmos. Sci., 60, 2957–2974, https://doi.org/10.1175/1520-0469(2003)060<2957:sowvic>2.0.co;2, 2003.
Langley, L., Leaitch, W. R., Lohmann, U., Shantz, N. C., and Worsnop, D. R.: Contributions from DMS and ship emissions to CCN observed over the summertime North Pacific, Atmos. Chem. Phys., 10, 1287–1314, https://doi.org/10.5194/acp-10-1287-2010, 2010.
Leaitch, W. R., Lohmann, U., Russell, L. M., Garrett, T., Shantz, N. C., Toom-Sauntry, D., Strapp, J. W., Hayden, K. L., Marshall, J., Wolde, M., Worsnop, D. R., and Jayne, J. T.: Cloud albedo increase from carbonaceous aerosol, Atmos. Chem. Phys., 10, 7669–7684, https://doi.org/10.5194/acp-10-7669-2010, 2010.
Lewis, E. R. and Schwartz, S. E.: Sea salt aerosol production: mechanisms, methods, measurements, and models-A critical review, American geophysical union, 2004.
Liu, Y. and Daum, P. H.: Parameterization of the Autoconversion Process.Part I: Analytical Formulation of the Kessler-Type Parameterizations, J. Atmos. Sci., 61, 1539–1548, https://doi.org/10.1175/1520-0469(2004)061<1539:potapi>2.0.co;2, 2004.
Liu, Y., Daum, P. H., McGraw, R., and Wood, R.: Parameterization of the Autoconversion Process. Part II: Generalization of Sundqvist-Type Parameterizations, J. Atmos. Sci., 63, 1103–1109, https://doi.org/10.1175/jas3675.1, 2006.
Logan, T., Xi, B., Dong, X., Li, Z., and Cribb, M.: Classification and investigation of Asian aerosol absorptive properties, Atmos. Chem. Phys., 13, 2253–2265, https://doi.org/10.5194/acp-13-2253-2013, 2013.
Logan, T., Xi, B., and Dong, X.: Aerosol properties and their influences on marine boundary layer cloud condensation nuclei at the ARM mobile facility over the Azores, J. Geophys. Res.-Atmos., 119, 4859–4872, https://doi.org/10.1002/2013JD021288, 2014.
Lohmann, U. and Feichter, J.: Global indirect aerosol effects: a review, Atmos. Chem. Phys., 5, 715–737, https://doi.org/10.5194/acp-5-715-2005, 2005.
Mao, H. and Talbot, R.: O3 and CO in New England: Temporal variations and relationships, J. Geophys. Res.-Atmos., 109, D21304, https://doi.org/10.1029/2004JD004913, 2004.
Mårtensson, E. M., Tunved, P., Korhonen, H., and Nilsson, E. D.: The role of sea-salt emissions in controlling the marine Aitken and accumulation mode aerosol: a model study, Tellus B, 62, 259–279, https://doi.org/10.1111/j.1600-0889.2010.00465.x, 2010.
Mather, J. H. and Voyles, J. W.: The Arm Climate Research Facility: A Review of Structure and Capabilities, B. Am. Meteorol. Soc., 94, 377–392, https://doi.org/10.1175/bams-d-11-00218.1, 2013.
Meng, Z. and Seinfeld, J. H.: On the Source of the Submicrometer Droplet Mode of Urban and Regional Aerosols, Aerosol Sci. Technol., 20, 253–265, https://doi.org/10.1080/02786829408959681, 1994.
Mohrmann, J., Wood, R., McGibbon, J., Eastman, R., and Luke, E.: Drivers of Seasonal Variability in Marine Boundary Layer Aerosol Number Concentration Investigated Using a Steady State Approach, J. Geophys. Res.-Atmos., 123, 1097–1112, https://doi.org/10.1002/2017JD027443, 2018.
Monahan, E. C., Spiel, D. E., and Davidson, K. L.: A model of marine aerosol generation via whitecaps and wave disruption, in: Oceanic whitecaps, Springer, 167–174, 1986.
Monks, P. S., Archibald, A. T., Colette, A., Cooper, O., Coyle, M., Derwent, R., Fowler, D., Granier, C., Law, K. S., Mills, G. E., Stevenson, D. S., Tarasova, O., Thouret, V., von Schneidemesser, E., Sommariva, R., Wild, O., and Williams, M. L.: Tropospheric ozone and its precursors from the urban to the global scale from air quality to short-lived climate forcer, Atmos. Chem. Phys., 15, 8889–8973, https://doi.org/10.5194/acp-15-8889-2015, 2015.
Morris, V.: Vaisala ceilometer (VCEIL) handbook ARM Climate Research Facility, DOE/SC-ARM-TR-020, 2012.
Müller, T., Laborde, M., Kassell, G., and Wiedensohler, A.: Design and performance of a three-wavelength LED-based total scatter and backscatter integrating nephelometer, Atmos. Meas. Tech., 4, 1291–1303, https://doi.org/10.5194/amt-4-1291-2011, 2011.
Mungall, E. L., Abbatt, J. P. D., Wentzell, J. J. B., Lee, A. K. Y., Thomas, J. L., Blais, M., Gosselin, M., Miller, L. A., Papakyriakou, T., Willis, M. D., and Liggio, J.: Microlayer source of oxygenated volatile organic compounds in the summertime marine Arctic boundary layer, Proc. Natl. Acad. Sci. USA, 114, 6203–6208, https://doi.org/10.1073/pnas.1620571114, 2017.
Münkel, C., Eresmaa, N., Räsänen, J., and Karppinen, A.: Retrieval of mixing height and dust concentration with lidar ceilometer, Bound.-Lay. Meteorol., 124, 117–128, https://doi.org/10.1007/s10546-006-9103-3, 2007.
Myriokefalitakis, S., Vignati, E., Tsigaridis, K., Papadimas, C., Sciare, J., Mihalopoulos, N., Facchini, M. C., Rinaldi, M., Dentener, F. J., Ceburnis, D., Hatzianastasiou, N., O'Dowd, C. D., van Weele, M., and Kanakidou, M.: Global Modeling of the Oceanic Source of Organic Aerosols, Adv. Meteorol., 2010, 16 939171, https://doi.org/10.1155/2010/939171, 2010.
O'Connor, E. J., Hogan, R. J., and Illingworth, A. J.: Retrieving Stratocumulus Drizzle Parameters Using Doppler Radar and Lidar, J. Appl. Meteorol., 44, 14–27, https://doi.org/10.1175/jam-2181.1, 2005.
O'Dowd, C. D. and Smith, M. H.: Physicochemical properties of aerosols over the northeast Atlantic: Evidence for wind-speed-related submicron sea-salt aerosol production, J. Geophys. Res.-Atmos., 98, 1137–1149, https://doi.org/10.1029/92JD02302, 1993.
O'Dowd, C. D., Facchini, M. C., Cavalli, F., Ceburnis, D., Mircea, M., Decesari, S., Fuzzi, S., Yoon, Y. J., and Putaud, J.-P.: Biogenically driven organic contribution to marine aerosol, Nature, 431, 676–680, 2004.
Pandis, S. N., Seinfeld, J. H., and Pilinis, C.: Chemical composition differences in fog and cloud droplets of different sizes, Atmos. Environ. Part A, 24, 1957–1969, https://doi.org/10.1016/0960-1686(90)90529-V, 1990.
Pandis, S. N., Russell, L. M., and Seinfeld, J. H.: The relationship between DMS flux and CCN concentration in remote marine regions, J. Geophys. Res.-Atmos., 99, 16945–16957, https://doi.org/10.1029/94JD01119, 1994.
Parrish, D. D., Trainer, M., Holloway, J. S., Yee, J. E., Warshawsky, M. S., Fehsenfeld, F. C., Forbes, G. L., and Moody, J. L.: Relationships between ozone and carbon monoxide at surface sites in the North Atlantic region, J. Geophys. Res.-Atmos., 103, 13357–13376, https://doi.org/10.1029/98JD00376, 1998.
Petters, M. D. and Kreidenweis, S. M.: A single parameter representation of hygroscopic growth and cloud condensation nucleus activity, Atmos. Chem. Phys., 7, 1961–1971, https://doi.org/10.5194/acp-7-1961-2007, 2007.
Petzold, A., Ogren, J. A., Fiebig, M., Laj, P., Li, S. M., Baltensperger, U., Holzer-Popp, T., Kinne, S., Pappalardo, G., Sugimoto, N., Wehrli, C., Wiedensohler, A., and Zhang, X. Y.: Recommendations for reporting “black carbon” measurements, Atmos. Chem. Phys., 13, 8365–8379, https://doi.org/10.5194/acp-13-8365-2013, 2013.
Phinney, L., Richard Leaitch, W., Lohmann, U., Boudries, H., Worsnop, D. R., Jayne, J. T., Toom-Sauntry, D., Wadleigh, M., Sharma, S., and Shantz, N.: Characterization of the aerosol over the sub-arctic north east Pacific Ocean, Deep Sea Res. Part II, 53, 2410–2433, https://doi.org/10.1016/j.dsr2.2006.05.044, 2006.
Pierce, J. R., Croft, B., Kodros, J. K., D'Andrea, S. D., and Martin, R. V.: The importance of interstitial particle scavenging by cloud droplets in shaping the remote aerosol size distribution and global aerosol-climate effects, Atmos. Chem. Phys., 15, 6147–6158, https://doi.org/10.5194/acp-15-6147-2015, 2015.
Poulida, O., Dickerson, R. R., Doddridge, B. G., Holland, J. Z., Wardell, R. G., and Watkins, J. G.: Trace gas concentrations and meteorology in rural Virginia: 1. Ozone and carbon monoxide, J. Geophys. Res.-Atmos., 96, 22461–22475, https://doi.org/10.1029/91JD02353, 1991.
Prather, K. A., Bertram, T. H., Grassian, V. H., Deane, G. B., Stokes, M. D., DeMott, P. J., Aluwihare, L. I., Palenik, B. P., Azam, F., Seinfeld, J. H., Moffet, R. C., Molina, M. J., Cappa, C. D., Geiger, F. M., Roberts, G. C., Russell, L. M., Ault, A. P., Baltrusaitis, J., Collins, D. B., Corrigan, C. E., Cuadra-Rodriguez, L. A., Ebben, C. J., Forestieri, S. D., Guasco, T. L., Hersey, S. P., Kim, M. J., Lambert, W. F., Modini, R. L., Mui, W., Pedler, B. E., Ruppel, M. J., Ryder, O. S., Schoepp, N. G., Sullivan, R. C., and Zhao, D.: Bringing the ocean into the laboratory to probe the chemical complexity of sea spray aerosol, P. Natl. Acad. Sci. USA, 110, 7550–7555, https://doi.org/10.1073/pnas.1300262110, 2013.
Quinn, P. K. and Bates, T. S.: The case against climate regulation via oceanic phytoplankton sulphur emissions, Nature, 480, 51–56, https://doi.org/10.1038/nature10580, 2011.
Quinn, P. K., Collins, D. B., Grassian, V. H., Prather, K. A., and Bates, T. S.: Chemistry and related properties of freshly emitted sea spray aerosol, Chem. Rev., 115, 4383–4399, https://doi.org/10.1021/cr500713g, 2015.
Quinn, P. K., Coffman, D. J., Johnson, J. E., Upchurch, L. M., and Bates, T. S.: Small fraction of marine cloud condensation nuclei made up of sea spray aerosol, Nat. Geosci., 10, 674–679, https://doi.org/10.1038/ngeo3003, 2017.
Raes, F.: Entrainment of free tropospheric aerosols as a regulating mechanism for cloud condensation nuclei in the remote marine boundary layer, J. Geophys. Res.-Atmos., 100, 2893–2903, https://doi.org/10.1029/94JD02832, 1995.
Raes, F., Bates, T., McGovern, F., and Van Liedekerke, M.: The 2nd Aerosol Characterization Experiment (ACE-2): general overview and main results, Tellus B, 52, 111–125, https://doi.org/10.3402/tellusb.v52i2.16088, 2000.
Rémillard, J. and Tselioudis, G.: Cloud Regime Variability over the Azores and Its Application to Climate Model Evaluation, J. Climate, 28, 9707–9720, https://doi.org/10.1175/jcli-d-15-0066.1, 2015.
Rémillard, J., Kollias, P., Luke, E., and Wood, R.: Marine Boundary Layer Cloud Observations in the Azores, J. Climate, 25, 7381–7398, https://doi.org/10.1175/jcli-d-11-00610.1, 2012.
Reutter, P., Su, H., Trentmann, J., Simmel, M., Rose, D., Gunthe, S. S., Wernli, H., Andreae, M. O., and Pöschl, U.: Aerosol- and updraft-limited regimes of cloud droplet formation: influence of particle number, size and hygroscopicity on the activation of cloud condensation nuclei (CCN), Atmos. Chem. Phys., 9, 7067–7080, https://doi.org/10.5194/acp-9-7067-2009, 2009.
Russell, L. M., Pandis, S. N., and Seinfeld, J. H.: Aerosol production and growth in the marine boundary layer, J. Geophys. Res.-Atmos., 99, 20989–21003, https://doi.org/10.1029/94JD01932, 1994.
Russell, L. M., Hawkins, L. N., Frossard, A. A., Quinn, P. K., and Bates, T. S.: Carbohydrate-like composition of submicron atmospheric particles and their production from ocean bubble bursting, P. Natl. Acad. Sci. USA, 107, 6652–6657, https://doi.org/10.1073/pnas.0908905107, 2010.
Sanchez, K. J., Chen, C.-L., Russell, L. M., Betha, R., Liu, J., Price, D. J., Massoli, P., Ziemba, L. D., Crosbie, E. C., Moore, R. H., Müller, M., Schiller, S. A., Wisthaler, A., Lee, A. K. Y., Quinn, P. K., Bates, T. S., Porter, J., Bell, T. G., Saltzman, E. S., Vaillancourt, R. D., and Behrenfeld, M. J.: Substantial Seasonal Contribution of Observed Biogenic Sulfate Particles to Cloud Condensation Nuclei, Sci. Rep., 8, 3235, https://doi.org/10.1038/s41598-018-21590-9, 2018.
Seinfeld, J. H. and Pandis, S. N.: Atmospheric chemistry and physics: from air pollution to climate change, John Wiley & Sons, 2016.
Springston, S.: Radiance Research Particle Soot/Absorption Photometer Instrument Handbook, DOE ARM Climate Research Facility, Washington, DC (United States), DOE/SC-ARM-TR-176, 2016.
Stein, A. F., Draxler, R. R., Rolph, G. D., Stunder, B. J. B., Cohen, M. D., and Ngan, F.: NOAA's HYSPLIT Atmospheric Transport and Dispersion Modeling System, B. Am. Meteorol. Soc., 96, 2059–2077, https://doi.org/10.1175/bams-d-14-00110.1, 2015.
Tarrasón, L., Turner, S., and Fløisand, I.: Estimation of seasonal dimethyl sulphide fluxes over the North Atlantic Ocean and their contribution to European pollution levels, J. Geophys. Res.-Atmos., 100, 11623–11639, https://doi.org/10.1029/95JD00849, 1995.
Twomey, S.: Pollution and the planetary albedo, Atmos. Environ. 8, 1251–1256, https://doi.org/10.1016/0004-6981(74)90004-3, 1974.
Virkkula, A.: Correction of the Calibration of the 3-wavelength Particle Soot Absorption Photometer (3λ PSAP), Aerosol Sci. Technol., 44, 706–712, https://doi.org/10.1080/02786826.2010.482110, 2010.
Virkkula, A., Ahlquist, N. C., Covert, D. S., Arnott, W. P., Sheridan, P. J., Quinn, P. K., and Coffman, D. J.: Modification, Calibration and a Field Test of an Instrument for Measuring Light Absorption by Particles, Aerosol Sci. Technol., 39, 68–83, https://doi.org/10.1080/027868290901963, 2005.
Voulgarakis, A., Telford, P. J., Aghedo, A. M., Braesicke, P., Faluvegi, G., Abraham, N. L., Bowman, K. W., Pyle, J. A., and Shindell, D. T.: Global multi-year O3−CO correlation patterns from models and TES satellite observations, Atmos. Chem. Phys., 11, 5819–5838, https://doi.org/10.5194/acp-11-5819-2011, 2011.
Wang, C., Corbett, J. J., and Firestone, J.: Improving Spatial Representation of Global Ship Emissions Inventories, Environ. Sci. Technol., 42, 193–199, https://doi.org/10.1021/es0700799, 2008.
Willis, M. D., Köllner, F., Burkart, J., Bozem, H., Thomas, J. L., Schneider, J., Aliabadi, A. A., Hoor, P. M., Schulz, H., Herber, A. B., Leaitch, W. R., and Abbatt, J. P. D.: Evidence for marine biogenic influence on summertime Arctic aerosol, Geophys. Res. Lett., 44, 6460–6470, https://doi.org/10.1002/2017GL073359, 2017.
Wood, R.: Drizzle in Stratiform Boundary Layer Clouds. Part I: Vertical and Horizontal Structure, J. Atmos. Sci., 62, 3011–3033, https://doi.org/10.1175/jas3529.1, 2005.
Wood, R.: Rate of loss of cloud droplets by coalescence in warm clouds, J. Geophys. Res.-Atmos., 111, D21205, https://doi.org/10.1029/2006JD007553, 2006.
Wood, R.: Stratocumulus Clouds, Mon. Weather Rev., 140, 2373–2423, https://doi.org/10.1175/mwr-d-11-00121.1, 2012.
Wood, R. and Bretherton, C. S.: Boundary Layer Depth, Entrainment, and Decoupling in the Cloud-Capped Subtropical and Tropical Marine Boundary Layer, J. Climate, 17, 3576–3588, https://doi.org/10.1175/1520-0442(2004)017<3576:bldead>2.0.co;2, 2004.
Wood, R., Leon, D., Lebsock, M., Snider, J., and Clarke, A. D.: Precipitation driving of droplet concentration variability in marine low clouds, J. Geophys. Res.-Atmos., 117, D19210, https://doi.org/10.1029/2012JD018305, 2012.
Wood, R., Wyant, M., Bretherton, C. S., Rémillard, J., Kollias, P., Fletcher, J., Stemmler, J., Szoeke, S. D., Yuter, S., Miller, M., Mechem, D., Tselioudis, G., Chiu, J. C., Mann, J. A. L., O'Connor, E. J., Hogan, R. J., Dong, X., Miller, M., Ghate, V., Jefferson, A., Min, Q., Minnis, P., Palikonda, R., Albrecht, B., Luke, E., Hannay, C., and Lin, Y.: Clouds, Aerosols, and Precipitation in the Marine Boundary Layer: An Arm Mobile Facility Deployment, B. Am. Meteorol. Soc., 96, 419–440, https://doi.org/10.1175/bams-d-13-00180.1, 2015.
Wood, R., Stemmler, J. D., Rémillard, J., and Jefferson, A.: Low-CCN concentration air masses over the eastern North Atlantic: Seasonality, meteorology, and drivers, J. Geophys. Res.-Atmos., 122, 1203–1223, https://doi.org/10.1002/2016JD025557, 2017.
Zhou, X., Kollias, P., and Lewis, E. R.: Clouds, Precipitation, and Marine Boundary Layer Structure during the MAGIC Field Campaign, J. Climate, 28, 2420–2442, https://doi.org/10.1175/jcli-d-14-00320.1, 2015.
- Abstract
- Introduction
- Measurement
- Seasonal variation in synoptic conditions, trace gas mixing ratios, and aerosol properties in the ENA
- Governing equation of MBL aerosol number budgets and estimation of the key process terms
- Controlling processes of the larger accumulation mode
- Controlling processes of the Aitken–accumulation mode
- Conclusions
- Data availability
- Author contributions
- Competing interests
- Acknowledgements
- References
- Supplement