the Creative Commons Attribution 4.0 License.
the Creative Commons Attribution 4.0 License.
 | 12 Dec 2018
Anthropogenic and natural drivers of a strong winter urban heat island in a typical Arctic city
Pavel Konstantinov
Alexander Baklanov
Igor Esau
Victoria Miles
Richard Davy
The Arctic has rapidly urbanized in recent decades with 2 million people currently living in more than a hundred cities north of 65∘ N. These cities have a harsh but sensitive climate and warming here is the principle driver of destructive thawing, water leakages, air pollution and other detrimental environmental impacts. This study reports on the urban temperature anomaly in a typical Arctic city. This persistent warm anomaly reaches up to 11 K in winter with the wintertime mean urban temperature being 1.9 K higher on average in the city center than in the surrounding natural landscape. An urban temperature anomaly, also known as an urban heat island (UHI), was found using remote sensing and in situ temperature data. High-resolution (1 km) model experiments run with and without an urban surface parameterization helped to identify the leading physical and geographical factors supporting a strong temperature anomaly in a cold climate. The statistical analysis and modeling suggest that at least 50 % of this warm anomaly is caused by the UHI effect, driven mostly by direct anthropogenic heating, while the rest is created by natural microclimatic variability over the undulating relief of the area. The current UHI effect can be as large as the projected, and already amplified, warming for the region in the 21st century. In contrast to earlier reports, this study found that the wintertime UHI in the Arctic should be largely attributed to direct anthropogenic heating. This is a strong argument in support of energy efficiency measures, urban climate change mitigation policy and against high-density urban development in polar settlements. The complex pattern of thermal conditions, as revealed in this study, challenges urban planners to account for the observed microclimatic diversity in perspective sustainable development solutions.
- Article
(9582 KB) - Full-text XML
-
Supplement
(2366 KB) - BibTeX
- EndNote


Rapid urbanization of the Arctic in recent decades (NORDREGIO, 2011) has strongly modified social (Parente et al., 2012) and environmental (Yu et al., 2015) conditions in the region. At present, there are more than a hundred urban settlements north of 65∘ N with a total of around 2 million residents. The largest of these settlements are the Russian cities of Murmansk (303 000 inhabitants), Norilsk and Novy Urengoy (> 100 000 inhabitants). The more typical Arctic city has a population between 30 and 70 thousand people who predominantly work in the mining industry. Although jobs in these cities are generally well-payed and the populations are highly skilled, the cities are vulnerable to the known “extractivism” setback (Wilson et al., 2016) whereby their management is driven by external economic markets and sociopolitical agendas, and urban planning employs construction standards taken directly from those used in the temperate midlatitudes (Shubenkov and Blagodeteleva, 2015; Parente et al., 2012). Importantly, urban planning does not account for the formation of the urban heat island (UHI) – an area of persistent warm anomalies of surface and air temperatures within cities.
The UHI phenomenon is frequently considered as a detrimental local climate effect that induces excessive thermal stress on humans and ecosystems in mid- and low-latitude cities (see e.g., Tan et al, 2010; Konstantinov et al., 2014; Wouters et al., 2017; EPA, 2018). The UHI impact can be particularly severe in megacities during summer heat waves. However, the winter UHI has not been considered as a problem in climate literature. Studies of midlatitude UHIs have concluded that the urban temperature anomalies are not as strong in the winter months when there is less solar radiation and calm weather events are less frequent (e.g., Wilby, 2003; Gedzelman et al., 2003; Zhou et al., 2013; Choi et al., 2014; Kuznetsova et al., 2017).
However, the winter UHI has been found in all Arctic cities which have been studied, e.g., in Fairbanks (Magee et al., 1999), Norilsk (Varentsov et al., 2014), in all 28 cities in northwest Siberia (Esau and Miles, 2016; Miles and Esau, 2017; Konstantinov et al., 2018) and in Apatity (Konstantinov at al., 2015). Apatity is a typical, medium-sized Arctic city that has been densely built-up with centrally heated, 5 to 9 storey apartment and public buildings. An earlier analysis for Apatity, based on a short observation campaign, reported that the surface air temperature can be up to 5–10 K higher in the city in winter than in the surrounding countryside (Konstantinov et al., 2015), which is surprisingly high for a medium-sized city.
Higher winter temperatures in Arctic cities may induce both beneficial and detrimental socioeconomic effects. Higher urban temperatures decrease negative health effects from frost bite and infrastructure damage from frost, increase the number of outdoor activity hours, and alleviate climatic pressure on urban green spaces. However, higher temperatures also decrease soil bearing capacity, precursor urban flooding and enable the proliferation of invasive species and diseases (Callaghan et al., 2011).
The UHIs in Arctic cities develop on the background of the already amplified Arctic warming and environmental changes (IPCC, 2013; Lappalainen et al., 2016; Esau et al., 2016). Currently there is no consensus about the magnitude and extent of Arctic UHIs or the physical mechanisms driving the higher urban temperatures. This is not surprising since, prior to this study, high-resolution in situ observations had only been reported for the relatively small settlement of Barrow, Alaska (Hinkel and Nelson, 2007) and for some southern Finnish (Järvi et al., 2009; Hjort et al., 2016) and northern European cities (Baklanov et al., 2005; Piringer et al., 2007). Moreover, the larger and more comprehensive surveys of UHIs (e.g., Peng et al., 2012), which indicated the increasing magnitude of UHI with latitude (Wienert and Kuttler, 2005), did not extend into the polar regions.
There is a clear and urgent need to improve urban resilience and infrastructure sustainability in cities (Pressman, 2006; Nelson et al., 2001) particularly in the rapidly changing Arctic climate (Streletskiy et al., 2012). This requires closing knowledge gaps on UHIs and equipping city managers with an adequate understanding of the challenges of urban planning in cold climates. There is a need to establish the existence, spatial extent, magnitude and physical mechanisms driving wintertime Arctic UHIs. Previous analysis of UHIs have used standards which have been widely criticized (Stewart, 2011); therefore, in this study we seek to improve on this through synchronized investigation of in situ and satellite data, exploring the long-term climate statistics for Apatity, and running several model sensitivity experiments with and without an urban scheme. The observational network of the World Meteorological Organization (WMO) is too sparse to capture UHIs in high latitudes; furthermore, there are no urban WMO stations in Arctic cities.
This study reports new results obtained from a unique, dense, in situ observational network in Apatity – the Urban Heat Island Arctic Research Campaign (UHIARC). The UHIARC network was deployed in Apatity in 2015 and created the opportunity for a comprehensive study of a typical polar UHI combining dense and continuous in situ observations, satellite remote sensing data and high-resolution meteorological modeling. This study reveals a previously underestimated magnitude of anthropogenic effects on the winter UHI in Apatity. The effects are thought to be similar to those in other polar cities, but they are distinct from the combination and weights of the various causes of UHIs in the more temperate climates of China (Choi et al., 2014; Zhou et al., 2015), Europe (Piringer et al., 2007; Schwarz et al., 2011) and North America (Sailor and Lu, 2004; Zhao et al., 2014).
This study is structured as follows. Section 2 describes the study area, climate, datasets and methods. Section 3 presents the results of the statistical data analysis. Section 4 interprets and discusses the results using numerical experiments with the COSMO-CLM model, while the final section (Sect. 5) outlines the conclusions of this study. In addition, there is a Supplement that addresses some technical details of the UHIARC network, data analysis and modeling.
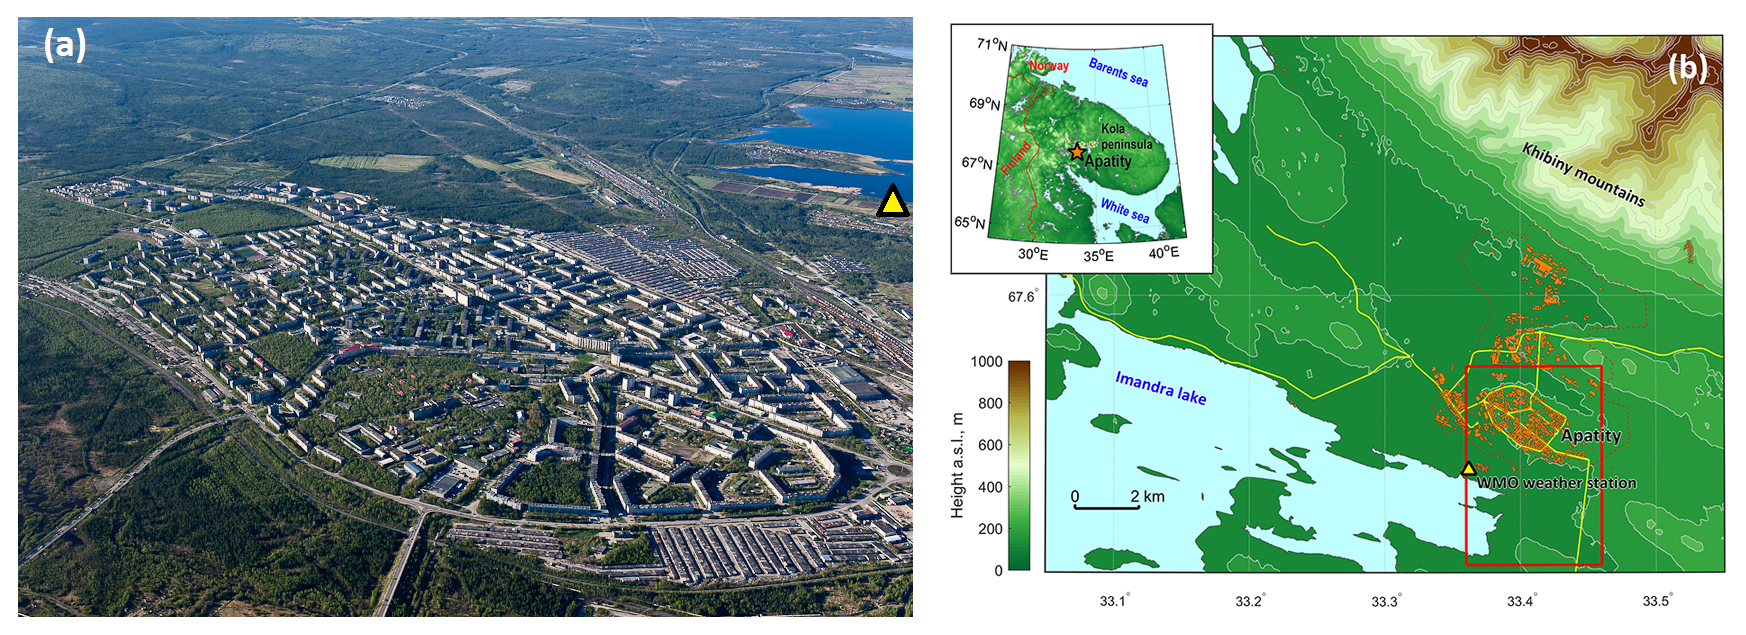
Figure 1(a) An aerial view of Apatity in summer taken from the northern side of the city (photo credit: Boris Vakhmistov); (b) a relief map of Apatity. Colors show the elevation above sea level. Buildings are indicated in orange, major roads by yellow lines and the red dotted line shows the city administrative border. The red rectangle corresponds to the area shown in the aerial view (a). The yellow triangles in (a) and (b) mark the location of the WMO weather station R1.
2.1 The study area
Apatity (67.567∘ N, 33.393∘ E) is a city in the Murmansk Oblast region of the Russian Federation. It is located on the Kola Peninsula inside the Arctic Circle, meaning that the mid-winter is characterized by polar night conditions. The city lies on a low hill amid an undulating landscape between Lake Imandra and the higher Khibiny mountains (Fig. 1). The lake was fully frozen during the winter periods considered. The landscape elevations vary from 150 to 200 m a.s.l (above sea level). Apatity has a cold and humid continental climate (Kottek et al., 2006) with the coldest monthly mean temperature (January) of −13.5 ∘C and a record minimum temperature of −47 ∘C observed in 1985. The winter mean temperature is −8.8 ∘C, which implies persistent snow cover. The annual mean temperature of −0.4 ∘C is below the water freezing point, but there are only isolated patches of permafrost according to the International Permafrost Association (Brown et al., 1997). The warmest summer month is July with an average temperature of +14.1 ∘C.
The built-up city area comprises 4.5 km2 (excluding the industrial areas). Following the definitions from Stewart and Oke (2012), the major part of the city can be classified as local climate zone 5 (LCZ5), or open midrise buildings, while the outskirts of the city could be classified as LCZ7, or lightweight low-rise buildings. An industrial complex to the north of the city could be classified as LCZ8 (large low-rise buildings) and LCZ10 (heavy industry). The city's population was 59 672 according to the 2010 census. Apatity has a relatively diversified economy compared with other polar cities, which includes a significant number of jobs in the education and research sector. Nevertheless, as the city's name itself suggests, its main industry is organized around the production of phosphorus mineral fertilizers.
2.2 In situ observational data
Apatity is the only polar Eurasian city that has a sufficiently dense multi-year urban observational network to comprehensively quantify the Arctic UHI and its driving factors. In situ meteorological observations in urban and rural areas were collected with a network of Davis Vantage Pro 2 automatic weather stations (AWS) and a number of small temperature sensors (iButton loggers). The AWSs and loggers were deployed in the city and surroundings (see their description in the Supplement Sect. S1) during three winters: 2013/14 (from 29 January 2013 to 3 February 2014), 2014/15 (from 29 January 2014 to 4 February 2015) and for a longer period in 2015–2016 (from 10 December 2015 to 28 February 2016). The deployed network of stations, abbreviated here as UHIARC, continues to collect data. Figure 2 shows the locations of the UHIARC network and the WMO station in and around the city.
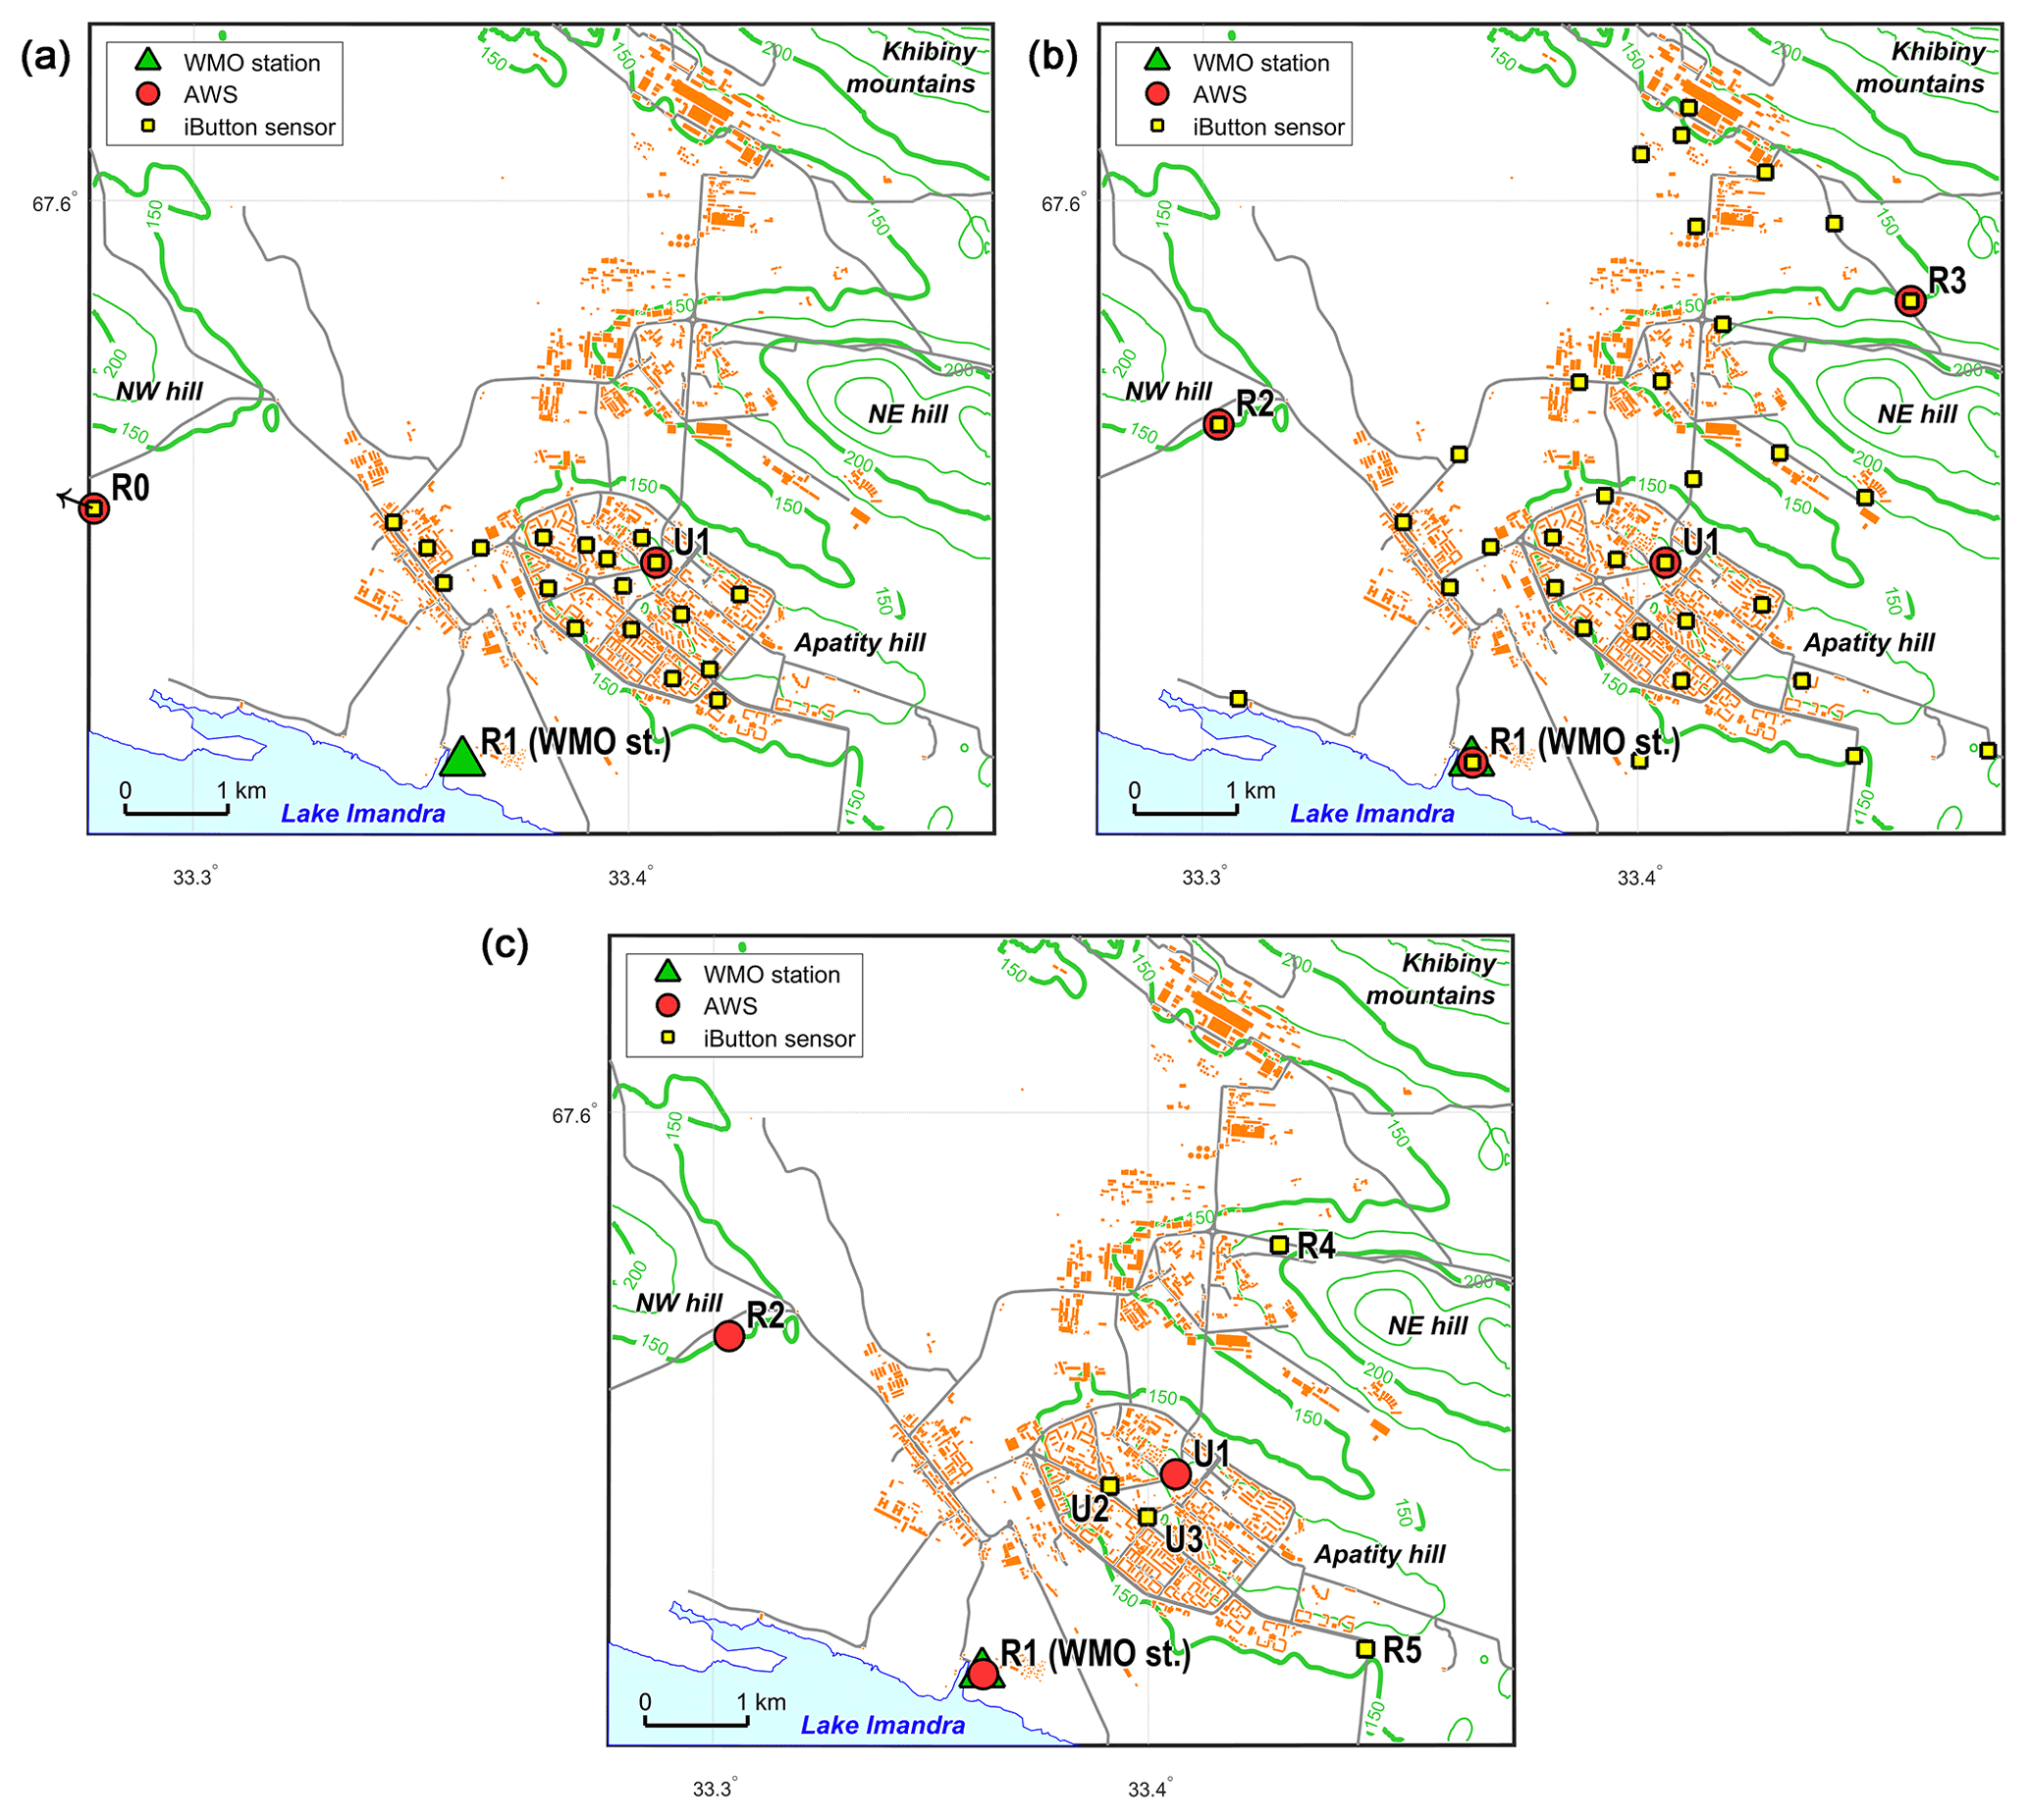
Figure 2Maps of the observation sites from the (a) 2014, (b) 2015 and (c) 2015/16 field campaigns. The details of the location and a description of individual sensors are given in Table S1 in the Supplement. Elevation is shown using green contour lines, which are indicated every 25 m, with the 150 and 200 m contour lines displayed in bold.
There is only one WMO station in the Apatity region (WMO ID 22 213). It is located at the R1 site (on the shore of Lake Imandra) 2 km from the city at a lower elevation (132 m a.s.l). The standard meteorological observations at the WMO station were available for all intensive observational periods. The standard WMO temperature data at a height of 2 m were sampled at 1 min intervals in 2014 and 2015 and at 6 h intervals in 2015–2016. They were used to run the quality control of the AWS observations. The wind speed at a height of 10 m and cloud cover measurements were available at 6 h intervals.
2.3 Remote sensing data products
The satellite remote sensing data complement the dense but still highly fragmented in situ observations. For this study we utilized land surface temperature (LST) data products from the Moderate Resolution Imaging Spectroradiometer (MODIS) sensors aboard the Terra (EOS AM) and Aqua (EOS PM) NASA satellites (Hu and Brunsell, 2015). The MODIS LST data characterize the surface temperature during clear-sky weather conditions. In this sense, the LST data are also incomplete, differ from the in situ air temperature data and are therefore only complementary to the ground-based observations.
The LST data are in reasonable correspondence to, and rather well correlated with, 2 m air temperatures as was shown in a comparison with observations (see Sect. S2). Two MODIS products, MOD11A1 and MYD11A1, supply instantaneous views of the LST at a 1 km resolution, twice a day (one nighttime and one daytime image). As the availability of the LST is controlled by objective factors (e.g., cloudiness), we filtered out images with a fraction of gaps that was too large (more than 20 %) within the area. On the remaining images we filled the spatial gaps with the nearest neighbor algorithm and then averaged them over the study period. The documented MODIS LST accuracy is higher than 1 ∘C in the −10 to +50 ∘C range (Wan et al., 2004).
2.4 Sensitivity runs with a limited-area mesoscale meteorological model
We used the limited-area mesoscale meteorological model COSMO-CLM (Rockel et al., 2008) coupled with a bulk urban scheme TERRA_URB (Wouters et al., 2016) to look at the UHI spatial variability and sensitivity to physical drivers. The TERRA_URB scheme accounts for physical features of the urban surface using semiempirical urban canopy dependences in terms of roughness length, albedo, emissivity, heat capacity, an so on. The anthropogenic heat flux (AHF) is calculated according to the Flanner approach (Flanner, 2009). This approach is based on a city-specific annual mean value of the flux, , and the prescribed amplitudes of the diurnal and seasonal cycles for the given geographical location. We set to 50 W m−2 for the entire urban area and then scaled it for each model grid cell accounting for the cell's urban fraction. It gives 90 W m−2 for the fully urbanized grid cells during the winter months. Such high AHF values are consistent with estimates for other high-altitude cities and with simple estimates for Apatity based on coal consumption data (see Sect. S3 for details). The COSMO-CLM model with the TERRA_URB scheme has previously been successfully used to simulate UHIs in Belgian cities (Wouters et al., 2016) and in Moscow (Varentsov et al., 2018).
The COSMO-CLM model was used to carry out nested dynamical downscaling of ERA-Interim reanalysis data (Dee et al., 2011), which is available at 0.75∘ spatial resolution at 6 h intervals. Three nested domains were utilized with the spatial grid resolutions of 12, 4 and 1 km (see Sect. S3). The model was run with 50 vertical levels, 11 of which were in the lowest 1 km of the atmosphere. The model top was set at the 20 hPa level. The model simulations were conducted for the winter season of 2015/16. They included three separate numerical experiments: the URB_AHF run with the TERRA_URB scheme switched on and the AHF defined as described above; the URB_noAHF run with TERRA_URB switched on and zero AHF; and the noURB run designed according to annihilation approach (Baklanov et al., 2016), which means that the TERRA_URB scheme was switched off, AHF was set to zero and land-cover parameters for the urban grid cells were set equal to the nearest non-urban grid cells.
3.1 Dynamics and controlling factors of the Arctic UHI
UHIARC observations show the strong and persistent urban temperature anomaly for all three winter periods (Fig. 3). The urban stations are always warmer than the rural stations, although the magnitude of this positive anomaly strongly varies depending on the weather conditions. We use a temperature difference to quantify the urban temperature anomaly. A difference such as this represents the deviation of the air temperature in the city center (U1 site) from the nearest WMO station (R1 site). The WMO station is used as a baseline source of weather- and climate-related information in the study area, meaning that represents the deviation of the actual temperature in the city from the regional baseline value. In many UHI studies such temperature differences are associated with UHI intensity. However, the R1 and U1 sites are found at different elevations (132 and 180 m a.s.l, respectively) and are situated differently with respect to the local orographic features. In addition, the WMO station is situated close to Lake Imandra; however our analysis only considers winter conditions which correspond to a frozen lake surface, so the influence of the water area can be excluded. In the following, we will examine the effects induced by the 48 m elevation difference and the orographic effects as well as by the anthropogenic UHI drivers.

Figure 3Observations of the surface air temperature in the city center (the red line for the U1 station) and the rural sites outside the city (the black, blue and green lines) in the (a) 2014 and (b) 2015 winters and (c) the longer observations in the winter 2015–2016. The UHI magnitude (area shaded in orange) is defined as . For the 2014 and 2015 data, 30 min running means are shown, whereas 3 h running means are shown for the longer experiment over the 2015–2016 period. The six case study periods indicated in black were selected for further study (see Figs. 4 and S4). The weather factor Wf (the blue line on the lower panel) was calculated from observations at R1 using 6-hourly data. The solar angle is indicated by the orange line with shading indicating the periods with positive values. The light blue shading indicates the anticyclonic weather periods with Wf > 0.7. The geographical locations of the stations are shown in Fig. 2.

Figure 4The observed daily mean (a) and daily maximum (b) temperature difference (circles) as a function of (a) the daily mean and (b) the daily minimum temperature at the R1 station during the winter of 2015–2016. The red line shows the linear regression. The blue vertical bars show the probability distribution of the (a) daily mean and (b) daily minimum temperature at the R1 station for the winter months (DJF) of 1986–2016. Probability is calculated for temperature bins with a 2 K step.
Co-variability between the UHI and the controlling meteorological variables such as wind speed (u) and low and total cloud fraction (nl and nt respectively) is presented using a weather factor, Wf. This index was adopted from Oke (1988) and was made applicable to a set of observed parameters available from the WMO station data:
The high values of Wf correspond to calm (anticyclonic) weather and clear-sky conditions. Specific climate conditions at high latitudes, such as low winter temperatures, deep snow cover and the near absence of direct solar radiation, make many of the proposed UHI scalings (e.g., Theeuwes et al., 2016) inapplicable for this study. During two short observational periods, the sun was above the horizon for less than 5 h per day with the maximum solar angle being less than 5∘; therefore, the direct shortwave radiation flux during this period was close to zero. The long-term observations even cover the polar-night period when there is an absence of direct solar radiation. The small or absent shortwave radiation flux in all three observational periods results in a negligible diurnal temperature cycle as the temperature varies irregularly following the synoptic variability.
There were large differences in the synoptic conditions during the three winters considered. There was a strong anticyclone for most of the first observational period from 26 January to 1 February 2014 (Konstantinov et al., 2015). The persistent clear-sky weather in the anticyclone led to intense radiative cooling and the surface air temperature dropped to −22 ∘C in the city and to between −27 and −30 ∘C in the nearby suburbs. A strong atmospheric temperature inversion developed with the temperature increasing by 20 K across the lowermost 1 km of the atmosphere. During this period, the average value exceeded 5 K with a maximum of 10 K observed on 31 January 2014. In contrast, there were rather persistent cyclonic conditions with notable wind gusts and multilevel cloud cover during the second observational period in 2015. Nevertheless, a brief period of calm and clear conditions (from 31 January to 2 February 2015) led to strong radiative cooling and a rapid amplification of the UHI.
The third winter with the longest observations (from 10 December 2015 to 28 January 2016) was characterized by several periods of anticyclonic conditions of which the four longest, with reaching up to 11 K, were selected for more detailed case studies (see Sect. S4). The mean value of over the winter period was 1.9 K with a 95 % quantile of 7.8 K. Values higher than 5 K were observed 20 % of time. The largest values were observed during periods with Wf>0.7, which correspond to the persistent anticyclonic conditions.
Using the historical WMO records for the R1 site we were able to quantify the overall importance of the large winter UHI in the urban climatology. Figure 4 illustrates that the high frequency and long-term persistency of the cold spells in the polar areas – the heavy tails in the temperature distribution that are a distinct feature of the polar continental climates (Timlin and Walsh, 2007) – make conditions with an intense UHI rather common; therefore, they regularly impact human life and urban management. A strong linear regression is found between mean (maximum) values and the daily mean (minimum) temperatures, with R2=0.71 (0.69) and p < 0.01. The largest contribution to the regression, and to the observed urban temperature anomaly, is provided by the observations at the lowest temperatures, typically below −10 ∘ C. The probability distribution of the observed temperatures shows that such low temperatures occur rather frequently in the winter months.
The urban temperature anomalies calculated in relation to other rural sites were also positive, but less pronounced. We note that and are about half as strong as (see Sects. S5 and S6). The U1, R2 and R5 stations are found at elevations of 180, 155 and 170 m, respectively. They are situated in similar landscape with respect to the local orographic features. Thus, these observations suggest that other factors, primarily the anthropogenic heat flux (AHF), should create about half of the observed values. The other half of the difference is likely induced by the elevation difference and local orographic features.
3.2 Spatial structure of the observed temperature anomalies
The dense UHIARC network revealed that the positive temperature anomalies are indeed located within the built-up areas (Fig. 5). Moreover, the larger positive values are collocated with the densely built, central parts of the city. The large number of rural sensors in 2015 showed that the lower temperatures are generally found outside the urban environment, particularly in the lower-altitude locations.
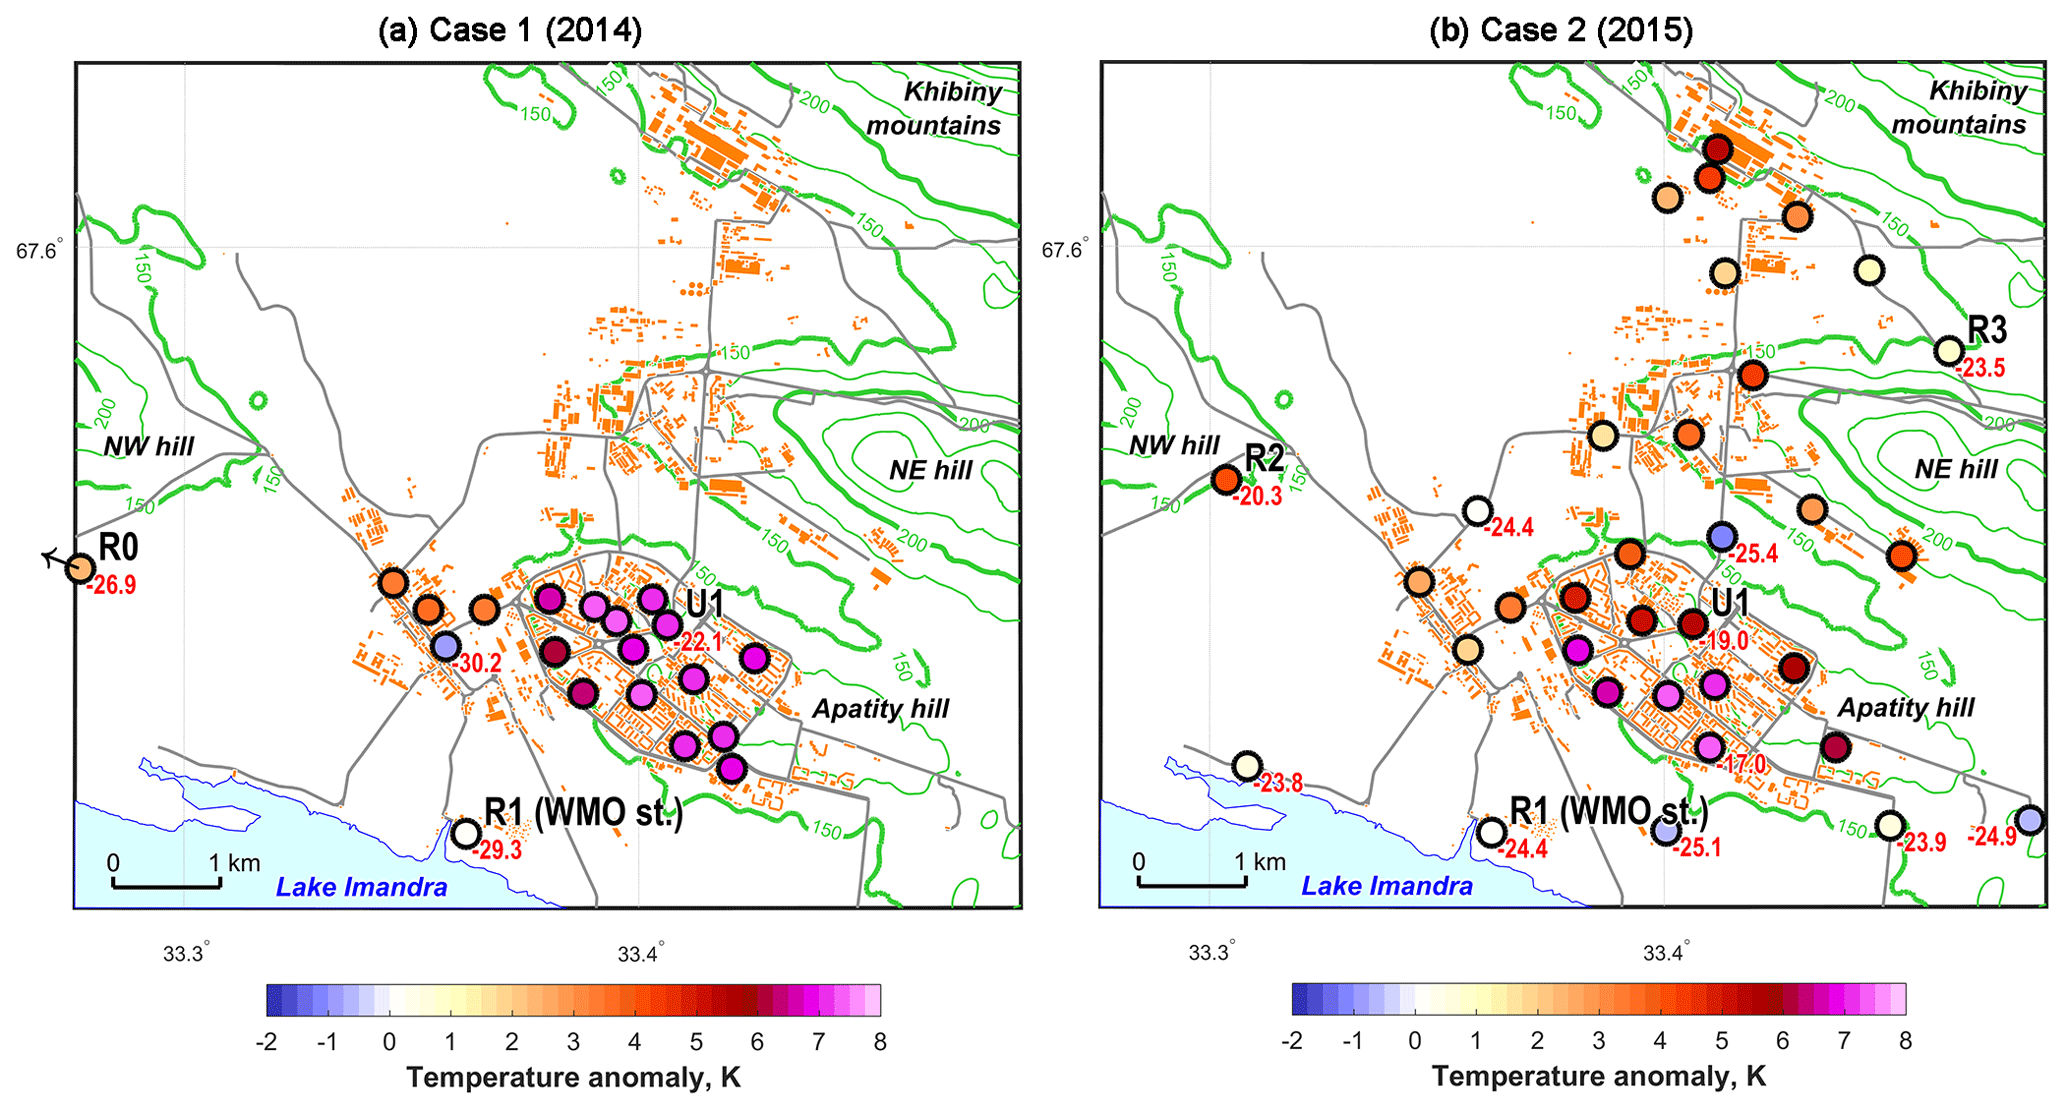
Figure 5Spatial patterns of the air temperature anomalies at each station with respect to the temperature at the R1 station. The anomalies were averaged over 3 h time intervals which included the maximum temperature anomaly during the observation periods in (a) 2014 (Case 1 from Fig. 3) and (b) 2015 (Case 2). The color scales show the magnitude of the temperature anomaly. The red numbers indicate the absolute temperatures in ∘C. The temperatures were measured at a height of 2 m above the ground, i.e., they correspond to significantly different elevations above sea level. The surface elevation is shown by the green contour lines (drawn every 25 m), and the 150 and 200 m contour lines are shown in bold.
To gain a broader and more consistent, albeit less detailed, view of the spatial temperature field in the area, we performed an analysis using MODIS land surface temperature (LST) data. This analysis showed that the positive temperature anomalies are not only collocated with the urbanized hill where the city is located, but are also collocated with other hills in the area including the higher Khibiny mountains (Fig. 6). The LST contrasts are even higher during anticyclonic periods with a high weather factor (see Fig. S6 in the Supplement). The observed spatial distribution of the LST confirms that the regional-scale temperature inversion is a significant factor determining the LST variability over an undulating surface in polar areas which results in a clear relationship between the LST and the surface elevation (Fig. S7). Despite this clear tendency for higher locations to be warmer than the lowlands, urbanized and industrial areas are warmer than most non-urban areas located at a similar elevation. Only the southern slopes of the Khibiny mountains, which are covered with darker and denser coniferous forest, exhibit a warmer LST than urban or industrial areas located at a similar elevation.
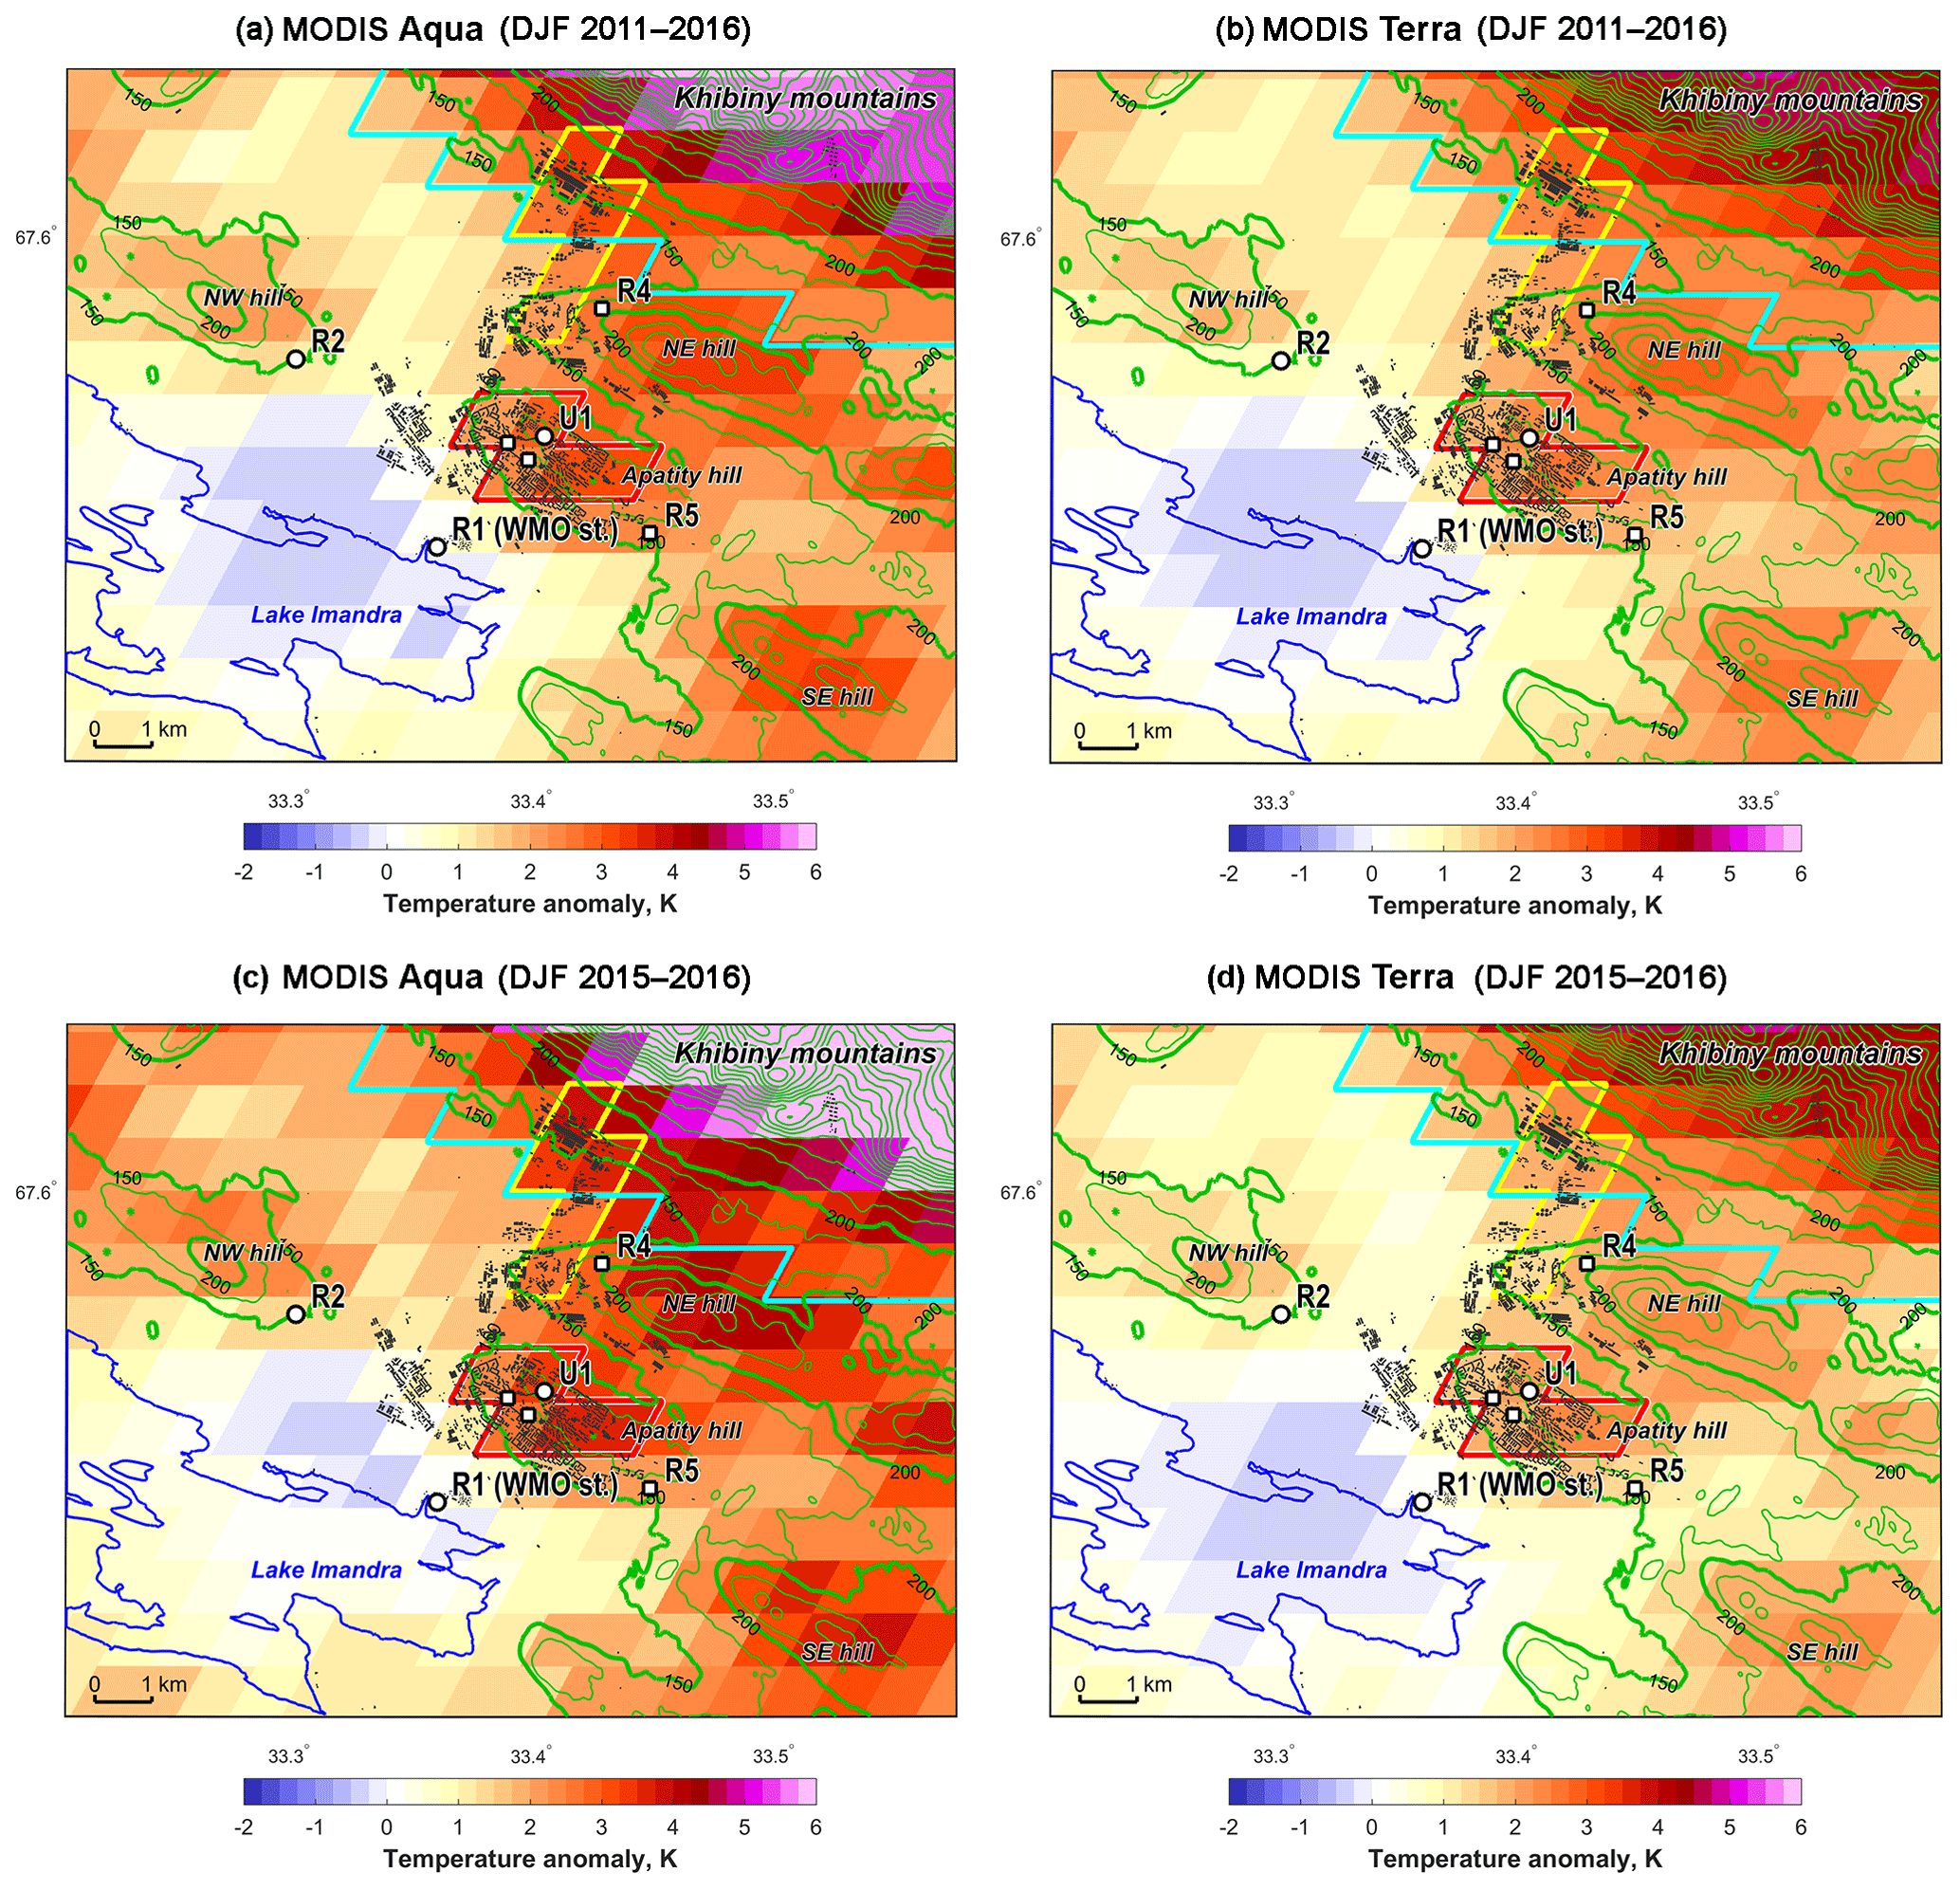
Figure 6The mean winter (DJF – December, January, February) land surface temperature (LST) anomaly obtained from satellite remote sensing with the MODIS instruments onboard the Terra and Aqua satellite platforms for (a, b) the longer period from 2011 to 2016 and for (c, d) the period from 2015 to 2016, which is synchronized with the long-term UHIARC in situ measurements in Apatity. The LST anomaly is calculated as the difference in temperature from the temperature of the pixel collocated with the R1 station. The red lines encompass the pixels classified as the urban area, the yellow lines denote the industrial area and the cyan lines encompass the Khibiny mountain area.
4.1 Driving factors of the strong UHI in Apatity
The analysis of both in situ and satellite temperature data have shown a strong and persistent winter temperature anomaly that is collocated with the urbanized area of Apatity. The winter values of are comparable with the UHI intensity observed in Moscow (Lokoshchenko et al., 2014; Varentsov et al., 2018), London (Wilby, 2003), New York (Gedzelman et al., 2003), Beijing, Seoul (Choi et al., 2014) and other world megacities. This warm anomaly is particularly intense in the coldest weather conditions, but it becomes much weaker under stronger winds. As the polar climate frequently experiences anticyclonic weather, significant and persistent warm temperature anomalies are ubiquitous during wintertime in Arctic cities (Fig. 4). Although the UHI has also been reported for other polar cities, its physical drivers remained unclear. In contrast to mid- and low-latitude cities, polar night conditions exclude the urban trapping of solar radiation and lower evapotranspiration rates (Ruy and Baik, 2012) from considerations of UHI driving factors. In addition, the solar heating deficit causes a cooling of deforested surfaces at high latitudes (Lee et al., 2011), which could also be expected for mostly deforested urban areas. Nevertheless, our urban data firmly establish the emergence of pronounced warm anomalies under calm, clear-sky weather conditions.
A pattern such as this is compatible with two different, but not necessarily alternative, physical drivers proposed in the literature. Firstly, an UHI could be caused by direct anthropogenic factors, including the heat released from buildings and industrial processes, which would explain why the largest temperature anomalies were observed in the most built-up areas of the city. Alternatively, the warm anomaly could be caused by elevated orography, such as the hill on which Apatity is situated, under near-surface atmospheric temperature inversion conditions, which are a common meteorological phenomenon at high latitudes (Wetzel and Brummer, 2011), and are favorable for cold air drainage to lowlands (Daly et al., 2010). Indeed, the remote sensing data show warmer land patches in the surrounding territory with the temperature anomalies being strongly correlated with surface elevation (Figs. 6, S6, S7).
To clarify the relative contribution of the different physical drivers, we ran several sensitivity experiments with the high-resolution meteorological model COSMO-CLM (see Sect. 2 and Sect. S3). The finest resolution (1 km) model run reproduces the local temperature and wind variability in the considered domain reasonably well (Fig. S8). The model performance deteriorates under calm weather conditions with a high weather factor, Wf. This well known, but still poorly understood, effect is traced to the breakdown of the turbulence closure schemes under stable stratification (Fay and Neunhäuserer, 2006; Baklanov et al., 2011; Atlaskin and Vihma, 2012; Davy and Esau, 2014). In the model, the temperature tends to cool significantly slower than in observations under conditions where the UHI is expected to be the largest. Despite these model inaccuracies, the COSMO-CLM model with the TERRA_URB scheme and a prescribed AHF (URB_AHF run) was able to simulate the UHI (Fig. 7).
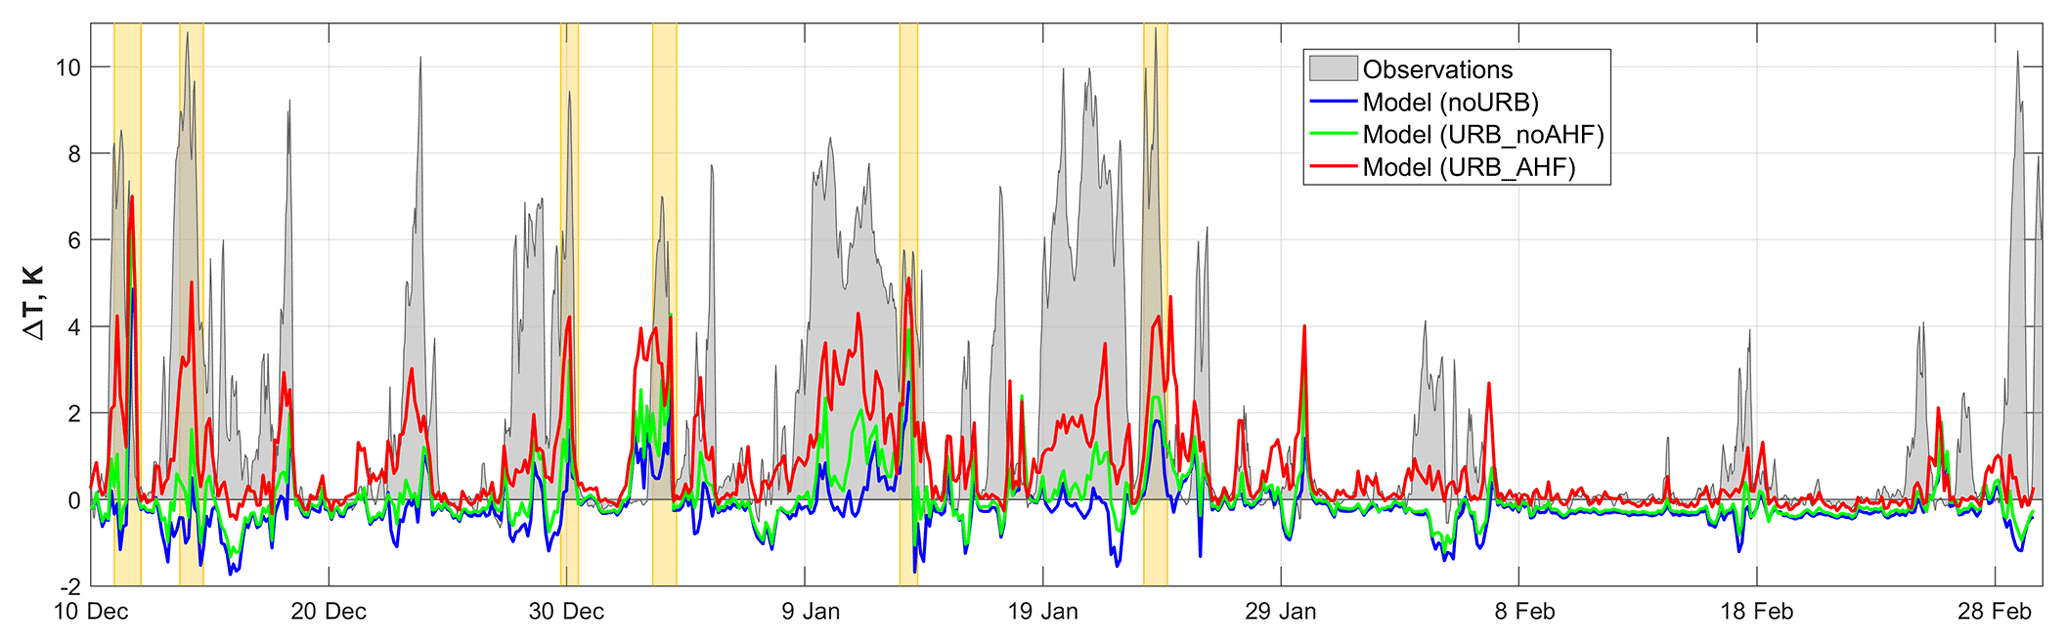
Figure 7Intercomparison of the observed (gray shading) and modeled (the red, green and blue lines for URB_AHF, URB_noAHF and noURB runs, respectively) UHI intensity. The UHI intensity is taken as for the observations and the corresponding ΔT values for the grid cells collocated with the U1 and R1 sites in the model. The model output was sampled at 3 h intervals. The orange shading identifies the cold periods with a strong UHI which were selected for sensitivity studies. These periods differ from cases 1–6 that were used previously.
The modeled urban temperature anomaly is defined as the difference between the temperatures of the model grid cells which include the U1 and R1 sites. The modeled was 2–5 K or about 50 % of the observed values for the majority of the anticyclonic events with Wf > 0.7. The mean modeled over the simulated period of the 2015–2016 winter was 0.8 K with the 95 % quantile of 3.2 K, while the observed values were 1.9 and 7.8 K for the mean and the 95 % quantile, respectively. The correlation coefficient between the simulated and observed values was 0.6 (p < 0.05). This overall underestimation of the urban temperature anomaly (Fig. 7), the cooling rates and the weather factor Wf (Fig. S8) could be partially due to the cloud cover overestimation, which is typical for the COSMO model (Jaeger et al., 2008; Pfeifroth et al., 2012). Moreover, the model does not take into account that anthropogenic heating intensifies during the coldest conditions, as the coal consumption increases (see Fig. 10). Finally, the model resolution (1 km) seems to be insufficient to resolve the local air circulation between the hills, which occupy 1–2 model grid cells.
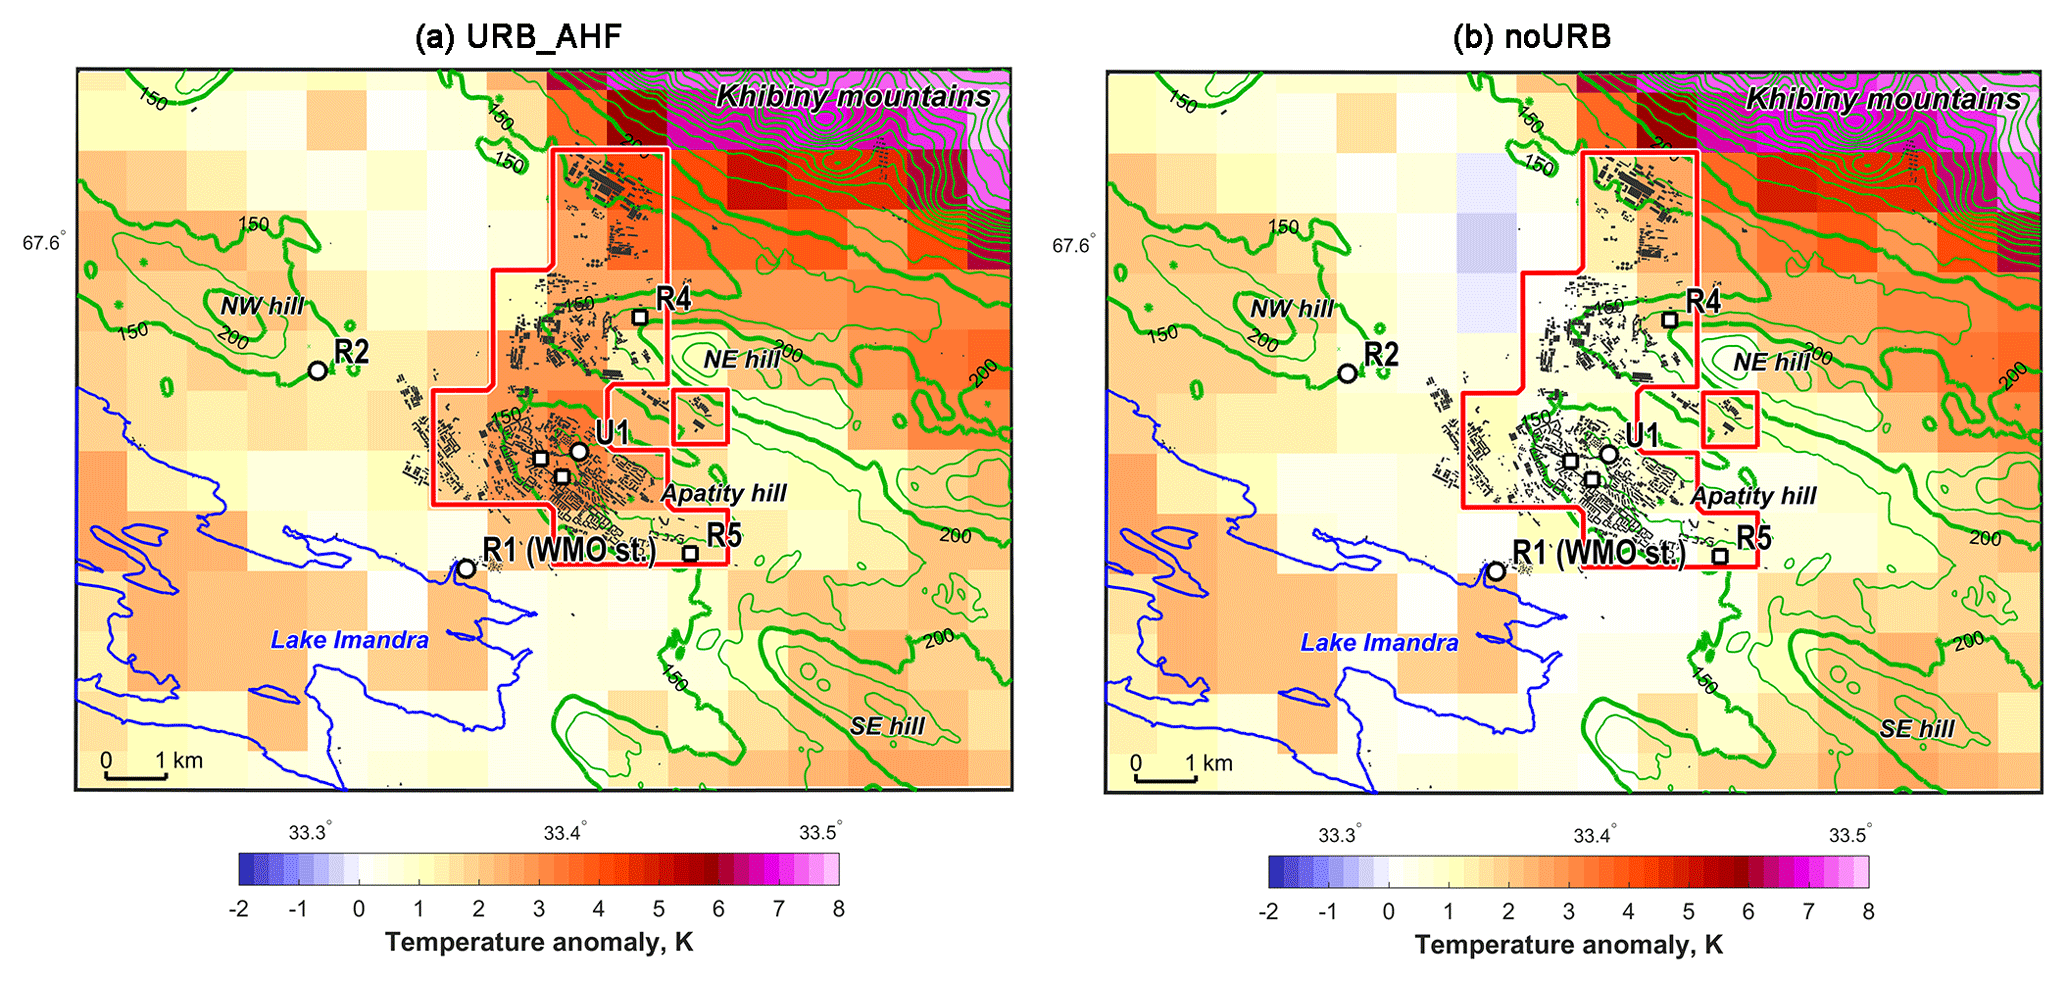
Figure 8The maps of the simulated surface air temperature anomalies, averaged over all six selected cold periods as indicated in Fig. 7. The COSMO-CLM simulations with the TERRA_URB urban scheme and prescribed anthropogenic heat flux (URB_AHF) is shown in (a), and those without the urban scheme (noURB) are shown in (b). The anomalies were defined as the deviation from the model grid cell corresponding to the R1 site. The urban land use/land cover was introduced in the grid cells encompassed by the red outline.
We compared these results to the runs without the TERRA_URB scheme (noURB run), i.e., when the model was not provided information about the anthropogenic heat fluxes and specific urban land use/land cover types, and runs with the TERRA_URB scheme, but without the AHF (URB_ noAHF run). These additional runs were unable to reproduce the UHI. The mean in the noURB and URB_noAHF runs were −0.25 and 0.06 K, respectively, with a respective 95 % quantile of 0.85 and 1.5 K. The correlation coefficients were 0.36 in the URB_noAHF run and nearly 0.0 in the noURB run.
To investigate the geographical pattern of the temperature sensitivity we chose six shorter cases with very intensive observed UHIs, which persisted for over 150 h in total. The model output and the observations agreed rather well for these six cases (Figs. 7 and S8). Mean observed values of and over all six cases are 5.3 and 2.9 K, correspondingly. The UHI over Apatity is clearly distinguishable in the URB_AHF simulations where four patches of lower temperature can be pinpointed (Fig. 8). In contrast, in the noURB simulations the cold temperature patches are connected and fully occupy the lowland area including the Apatity hill, while the other hills and mountains remain warm. These results indicate that orography-induced circulations are likely under-resolved in the simulations.

Figure 9Maps of the simulated surface air temperature difference between the COSMO-CLM runs: URB_AHF – noURB (a) and URB_noAHF – noURB (b). The differences are averaged over the six selected periods identified in Fig. 7. Similar differences averaged over the whole winter are shown in the Fig. S9. The urban land use/land cover was introduced in the grid cells encompassed by the red lines.
The differences between the runs with and without the urban scheme (i.e., URB_AHF – noURB and URB_noAHF – noURB) demonstrate that the temperature anomalies due to both the AHF and the land use/land cover modification are collocated with the urbanized areas (Figs. 9 and S9). Such properties of the UHI are consistent with the widely accepted explanation that the additional urban heating is trapped within the city in the shallow and stably stratified atmospheric boundary layer (Baklanov et al., 2005, 2008; Piringer et al., 2007; Davy and Esau, 2016). This exercise showed that the AHF is the dominant factor driving the winter UHI. Indeed, the URB_AHF run was 2.5 K warmer in the central grid cell containing the U3 site than the noURB run. The difference between the URB_noAHF and noURB runs was only 0.6 K.
Coherent evidence from the modeling results, the in situ measurements and the remote sensing data indicate that the anthropogenic contribution to the observed urban temperature anomaly in Apatity () is about 50 % (and likely more on the very cold days). Hence, the intensity of the anthropogenic UHI for Apatity could be estimated as 1 K for the wintertime average with extremes of up to 6 K. The rest of the observed temperature anomaly is caused by the local orographic variations. The sensitivity model runs confirmed that the dominant fraction of the anthropogenic contribution comes directly from the AHF. This contribution is larger in the central urbanized areas, but it could also be identified in the surrounding non-urban areas, which are 2–3 times the size of the built-up area. Similar and even more pronounced results have been reported in large-scale studies of Chinese cities (Choi et al., 2014; Zhou et al., 2015).
4.2 Impacts of a strong UHI in Arctic cities
The model and observations both show that there is a considerably milder winter microclimate inside Apatity, and that the largest difference with the surroundings is found during the coldest periods. This intense UHI may cause several environmental and socioeconomic effects, although not all of them are necessarily detrimental. Among the most impactful effects are the higher soil temperatures and deeper active soil layers. Although there is no permafrost around Apatity, a number of medium-sized or bigger cities (e.g., Nadym, Novy Urengoy and Norilsk) with similar urban planning exhibited strong signs of degrading permafrost (Streletskiy et al., 2012). The northern ecosystems and soil microbiota are also sensitive to this warmer microclimate. Therefore, the city becomes a corridor for invasive southern species that were introduced on purpose with the intention of creating urban green space (Byalt and Byalt, 2011) with blossoming trees and bushes.
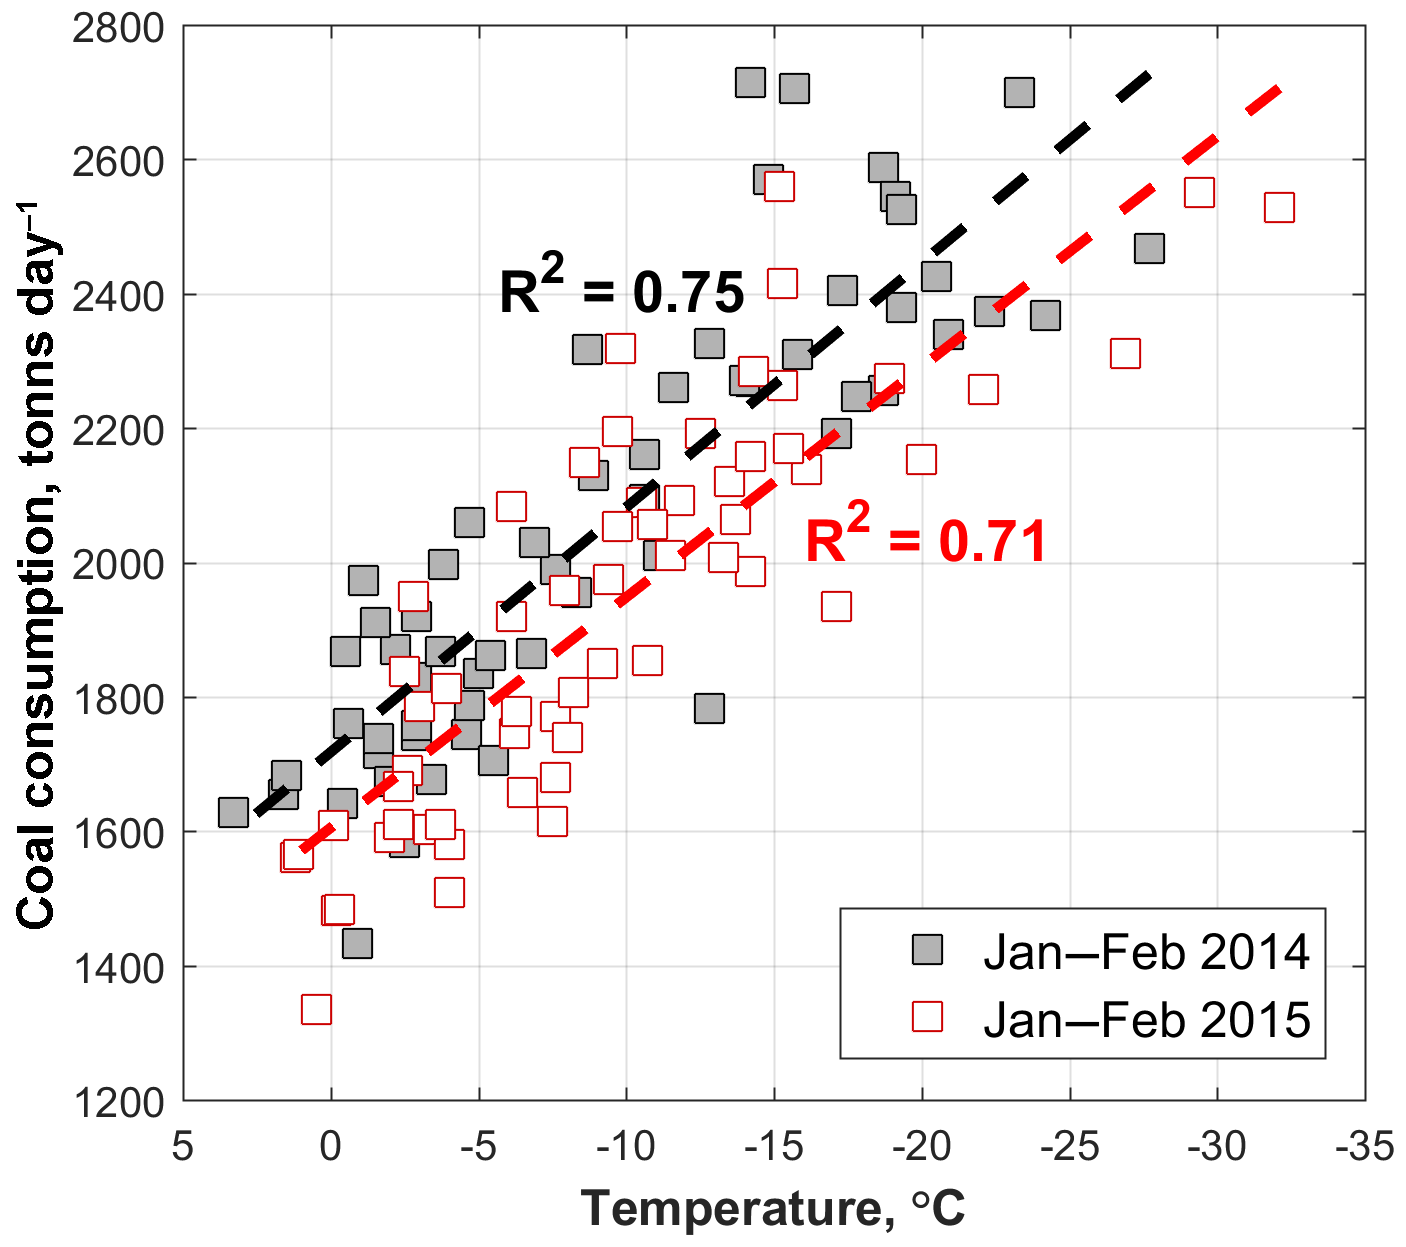
Figure 10Daily coal consumption as a function of the mean air temperature for the winters of 2014 and 2015. Data were provided by the administration of Apatity combined heat and power plant.
The UHI can also trigger a direct economic effect. Warmer temperatures increase the number of outdoor working hours and decrease the risk of frostbite for city dwellers. Such conditions are also welcome for outdoor recreational activities. Considering the urban metabolism, Fig. 10 shows that the daily coal consumption for anthropogenic heating in the city strongly depends on the air temperature. If the UHI effect was fully accounted for in the production and distribution of heat, average coal consumption in the city could be reduced by about 1.5 %. Following this linear relationship of 33 t of coal consumption per 1 ∘C of temperature change, coal consumption could be reduced by 12 % on the coldest days when consumption is at its highest. A more flexible heating schedule and infrastructural improvements would not only be more economical, but would also be a municipal climate change mitigation action.
Studies of urban socio-environmental phenomena, pollution from urban sources and stability of frozen soils are of high importance in the strategical implementation plan of the Pan-Eurasian Experiment (PEEX) as stated in Lappalainen et al. (2016) and Melnikov et al. (2018). Clear-sky events not only cause the strongest deviations of the local urban climate, but also affect particle nucleation (Dada et al., 2017). Processes of turbulent mixing of atmospheric pollution in cold winter conditions remain a future focus of studies for the international research community (Arnold et al., 2016; Kim et al., 2017). Moreover, warmer climate conditions are suspected to fundamentally change vegetation responses and carbon storage processes in Arctic soils (Arneth et al., 2016). These processes have already been observed, and hence observationally studied, in territories covered by UHIs.
The model sensitivity study, unique new in situ observations and remote sensing data analysis presented here comprise the first comprehensive analysis and attribution of the Arctic UHI effect during the polar winter. An understanding of the driving factors behind UHIs is urgently needed to inform urban planning and management, and to optimize heating and energy consumption. Here we showed that the largest contributing factor to the UHI in the typical medium-sized polar city of Apatity was from direct anthropogenic heating effects and land-use modifications, which could be additionally amplified by the local orography and the presence of atmospheric inversions.
Wintertime Arctic UHIs can be much stronger than those found in the midlatitudes. The wintertime average temperature difference between the Apatity city center and the local WMO weather station is 1.9 K with extremes of up to 11 K and an excess of 5 K occurring on one out of every five days in winter. At least 50 % of this warm anomaly is caused by the UHI effect, driven mostly by direct anthropogenic heating. This means that the anthropogenic urban heat fluxes warm the city by about 1 K on average in wintertime. The AHF during extremely cold days may warm the city center by up to 6 K. The UHI is more intense on the cold and calm days such as those that were frequently observed during polar anticyclonic intrusions. The warm anomalies are larger in the central parts of the city, but the UHI also has an impact on the non-urban surroundings. The high latitude regions and the Arctic experience intense warming. The urban temperature anomalies add an additional contribution on top of this regional warming.
This strong Arctic UHI makes the urban microclimate significantly milder, reduces soil freezing and changes the soil hydrology. This can put buildings at risk, which is a widespread problem for more than 50 similar and larger cities in the Arctic. Many of these settlements are located in more severe climates and have been constructed on artificial sandy ground or permafrost that is highly sensitive to warming (Nelson et al., 2001; Streletskiy et al., 2012). The physical impact of the UHI also brings economic and ecosystem impacts. The mild microclimate inside Arctic cities can act as a corridor for invasive species, paving the way for broader regional ecosystem changes in a warming climate. The negative impacts of this large UHI clearly show that the construction, maintenance and energy-efficiency standards need to be significantly improved if we are to achieve sustainable city planning in this sensitive environment. This is a strong argument in support of energy-efficiency efforts and against high-density urban development in polar settlements. However, not all UHI impacts are negative, and our study also illustrates a pathway to take specific climate change mitigation actions. The consumption of coal for urban heating could be substantially reduced if the UHI is accounted for in local urban management.
The UHIARC datasets and modeling results generated during this study are available from the corresponding author upon reasonable request.
The supplement related to this article is available online at: https://doi.org/10.5194/acp-18-17573-2018-supplement.
IE and RD wrote the paper and guided the data analysis. AB, PK, MV and IE worked on the idea and the hypothesis for the study. PK and MV collected and processed the data, and prepared the illustrations and tables. MV ran the model and analyzed the model results. VM and MV processed the satellite data. AB, IE and VM provided the socio-environmental context for and described the impact of the study. RD, VM, PK and MV provided the physical climatic context for the study. PK, VM, IE, and AB discussed and interpreted the results.
The authors declare that they have no conflict of interest.
This article is part of the special issue “Pan-Eurasian Experiment (PEEX)”. It is not associated with a conference.
This study was supported by the Belmont Forum and the Norwegian Research
Council grant HIARC: Anthropogenic Heat Islands in the Arctic: Windows to the
Future of the Regional Climates, Ecosystems, and Societies (grant
no. 247268), by the Russian Foundation for Basic Research (RFBR; project nos. 15-55-77004,
17-05-01221, 18-05-60126 and 18-05-00715) and by the project TRAKT-2018
(Transferable Knowledge and Technologies for High-Resolution Environmental
Impact Assessment and Management). The first stage of experimental campaign
in Apatity in 2014 was supported by the Russian Geographic Society (project no.
27/2013-H3). The numerical simulations with the COSMO-CLM model were carried out
using the equipment from the shared research facilities of HPC computing
resources at Lomonosov Moscow State University.
Edited by: Veli-Matti Kerminen
Reviewed by:
three anonymous referees
Arneth, A., Makkonen, R., Olin, S., Paasonen, P., Holst, T., Kajos, M. K., Kulmala, M., Maximov, T., Miller, P. A., and Schurgers, G.: Future vegetation-climate interactions in Eastern Siberia: an assessment of the competing effects of CO2 and secondary organic aerosols, Atmos. Chem. Phys., 16, 5243–5262, https://doi.org/10.5194/acp-16-5243-2016, 2016.
Arnold, S. R., Law, K. S., Brock, C. A., Thomas, J. L., Starkweather, S. M., von Salzen, K., Stohl, A., Sharma, S., Lund, M. T., Flanner, M. G., Petäjä, T., Tanimoto, H., Gamble, J., Dibb, J. E., Melamed, M., Johnson, N., Fidel, M., Tynkkynen, V.-P., Baklanov, A., Eckhardt, S., Monks, S. A., Browse, J., and Bozem, H.: Arctic air pollution: challenges and opportunities for the next decade, Elementa: Science of the Anthropocene, 4, 000104, https://doi.org/10.12952/journal.elementa.000104, 2016.
Atlaskin, E. and Vihma, T.: Evaluation of NWP results for wintertime nocturnal boundary-layer temperatures over Europe and Finland, Q. J. Roy. Meteor. Soc., 138, 1440–1451, https://doi.org/10.1002/qj.1885, 2012.
Baklanov, A., Burzynski, J., Christen, A., Deserti, M., De Ridder, K., Emeis, S., Joffre, S., Karppinen, A., Mestayer, P., Middleton, D., Piringer, M., and Tombrou, M.: The urban surface energy budget and mixing height in European cities: Data, models and challenges for urban meteorology and air quality, edited by: Piringer, M. and Joffre, S., WG2 COST Action 715, Demetra Ltd Publishers, ISBN: 954-9526-29-1, 239 pp., 2005.
Baklanov, A., Mestayer, P. G., Clappier, A., Zilitinkevich, S., Joffre, S., Mahura, A., and Nielsen, N. W.: Towards improving the simulation of meteorological fields in urban areas through updated/advanced surface fluxes description, Atmos. Chem. Phys., 8, 523–543, https://doi.org/10.5194/acp-8-523-2008, 2008.
Baklanov, A., Molina, L. T., and Gauss, M.: Megacities, air quality and climate, Atmos. Environ., 126, 235–249, https://doi.org/10.1016/j.atmosenv.2015.11.059, 2016.
Baklanov A., Grisogono, B., Bornstein, R., Mahrt, L., Zilitinkevich, S., Taylor, P., Larsen, S. E., Rotach, M. W., and Fernando, H. J. S.: The Nature, Theory, and Modeling of Atmospheric Planetary Boundary Layers, B. Am. Meteorol. Soc., 92, 123–128, https://doi.org/10.1175/2010BAMS2797.1, 2011.
Brown, J., Ferrians Jr., O. J., Heginbottom, J. A., and Melnikov, E. S. (Eds.): Circum-Arctic map of permafrost and ground-ice conditions. Washington, DC: U.S. Geological Survey in Cooperation with the Circum-Pacific Council for Energy and Mineral Resources, Circum-Pacific Map Series CP-45, scale 1:10,000,000, 1 sheet, 1997.
Byalt, A. V. and Byalt, V. V.: The adventive species of Caprifoliaceae Juss. s.l. Family on the territory of St. Petersburg and Leningrad oblast, Russian J. Biological Invasions, 2, 35–39, https://doi.org/10.1134/S2075111711030040, 2011.
Callaghan, T. V., Johansson, M., Brown, R. D., Groisman, P. Y., Labba, N., Radionov, V., Bradley, R. S., Blangy, S., Bulygina, O. N., Christensen, T. R., Colman, J. E., Essery, R. L. H., Forbes, B. C., Forchhammer, M. C., Golubev, V. N., Honrath, R. E., Juday, G. P., Meshcherskaya, A. V., Phoenix, G. K., Pomeroy, J., Rautio, A., Robinson, D. A., Schmidt, N. M., Serreze, M. C., Shevchenko, V. P., Shiklomanov, A. I., Shmakin, A. B., Skold, P., Sturm, M., Woo, M.-K., and Wood, E. F.: Multiple Effects of Changes in Arctic Snow Cover, AMBIO, 40, 32–45, 2011.
Choi, Y.-Y., Suh, M.-S., and Park, K.-H.: Assessment of Surface Urban Heat Islands over Three Megacities in East Asia Using Land Surface Temperature Data Retrieved from COMS, Remote Sens., 6, 5852–5867, https://doi.org/10.3390/rs6065852, 2014.
Dada, L., Paasonen, P., Nieminen, T., Buenrostro Mazon, S., Kontkanen, J., Peräkylä, O., Lehtipalo, K., Hussein, T., Petäjä, T., Kerminen, V.-M., Bäck, J., and Kulmala, M.: Long-term analysis of clear-sky new particle formation events and nonevents in Hyytiälä, Atmos. Chem. Phys., 17, 6227–6241, https://doi.org/10.5194/acp-17-6227-2017, 2017.
Daly, C., Conklin, D. R., and Unsworth, M. H.: Local atmospheric decoupling in complex topography alters climate change impacts, Int. J. Climatol., 30, 1857–1864, https://doi.org/10.1002/joc.2007, 2010.
Davy, R. and Esau, I.: Global climate models' bias in surface temperature trends and variability, Environ. Res. Lett., 9, 114024, https://doi.org/10.1088/1748-9326/9/11/114024, 2014.
Davy, R. and Esau, I.: Differences in the efficacy of climate forcings explained by variations in atmospheric boundary layer depth, Nat. Comm., 7, 11690, https://doi.org/10.1038/ncomms11690, 2016.
Dee, D. P., Uppala, S. M., Simmons, A. J., Berrisford, P., Poli, P., Kobayashi, S., Andrae, U., Balmaseda, M. A., Balsamo, G., Bauer, P., Bechtold, P., Beljaars, A. C. M., van de Berg, L., Bidlot, J., Bormann, N., Delsol, C., Dragani, R., Fuentes, M., Geer, A. J., Haimberger, L., Healy, S. B., Hersbach, H., Holm, E. V., Isaksen, L., Kållberg, P., Köhler, M., Matricardi, M., Mcnally, A. P., Monge-Sanz, B. M., Morcrette, J. J., Park, B. K., Peubey, C., de Rosnay, P., Tavolato, C., Thepaut, J. N., and Vitart, F.: The ERA-Interim reanalysis: Configuration and performance of the data assimilation system, Q. J. Roy. Meteor. Soc., 137, 553–597, https://doi.org/10.1002/qj.828, 2011.
Esau, I. and Miles, V.: Warmer urban climates for development of green spaces in northern Siberian cities, Geography, Environment, Sustainability, 9, 48–62, 2016.
Esau, I., Miles, V. V., Davy, R., Miles, M. W., and Kurchatova, A.: Trends in normalized difference vegetation index (NDVI) associated with urban development in northern West Siberia, Atmos. Chem. Phys., 16, 9563–9577, https://doi.org/10.5194/acp-16-9563-2016, 2016.
EPA, 2018: USA Environmental protection agency, available at: https://www.epa.gov/heat-islands/heat-island-impacts, last access: 30 May 2018.
Fay, B. and Neunhäuserer, L.: Evaluation of high-resolution forecasts with the non-hydrostaticnumerical weather prediction model Lokalmodell for urban air pollutionepisodes in Helsinki, Oslo and Valencia, Atmos. Chem. Phys., 6, 2107–2128, https://doi.org/10.5194/acp-6-2107-2006, 2006.
Flanner, M. G.: Integrating anthropogenic heat flux with global climate models, Geophys. Res. Lett., 36, L02801, https://doi.org/10.1029/2008GL036465, 2009.
Gedzelman, S. D., Austin, S., Cermak, R., Stefano, N., and Partridge, S.: Mesoscale aspects of the Urban Heat Island around New York City, Theor. Appl. Climatol. 75, 29–42, https://doi.org/10.1007/s00704-002-0724-2, 2003.
Hinkel, K. M. and Nelson, F. E.: Anthropogenic heat island at Barrow, Alaska, during winter: 2001–2005, J. Geophys. Res., 112, D06118, https://doi.org/10.1029/2006JD007837, 2007.
Hjort, J., Suomi, J., and Käyhkö, J.: Extreme urban-rural temperatures in the coastal city of Turku, Finland: Quantification and visualization based on a generalized additive model, Sci. Total Environ., 569–570, 507–517 https://doi.org/10.1016/j.scitotenv.2016.06.136, 2016.
Hu, L. and Brunsell, N. A.: A new perspective to assess the urban heat island through remotely sensed atmospheric profiles, Remote Sens. Environ., 158, 393–406, https://doi.org/10.1016/j.rse.2014.10.022, 2015.
IPCC: Climate Change: The Physical Science Basis. Working Group I Contribution to the Fifth Assessment Report of the Intergovernmental Panel on Climate Change, edited by: Stocker, T. F., Qin, D., Plattner, G.-K., Tignor, M., Allen, S. K., Boschung, J., Nauels, A., Xia, Y., Bex, V., and Midgley, P. M., Cambridge University Press, Cambridge, UK and New York, NY, US, 2013.
Jaeger, E. B., Anders, I., Lüthi, D., Rockel, B., Schär, C., and Seneviratne, S. I.: Analysis of ERA40-Driven CLM Simulations for Europe, Meteorol. Z., 17, 349–367, https://doi.org/10.1127/0941-2948/2008/0301, 2008.
Järvi, L., Hannuniemi, H., Hussein, T., Junninen, H., Aalto, P. P., Hillamo, R., Mäkelä, T., Keronen, P., Siivola, E., Vesala, T., and Kulmala, M.: The urban measurement station SMEAR III: Continuous monitoring of air pollution and surface-atmosphere interactions in Helsinki, Finland, Boreal Environ. Res., 14, 86–109, 2009.
Kim, H., Zhang, Q., Bae, G.-N., Kim, J. Y., and Lee, S. B.: Sources and atmospheric processing of winter aerosols in Seoul, Korea: insights from real-time measurements using a high-resolution aerosol mass spectrometer, Atmos. Chem. Phys., 17, 2009–2033, https://doi.org/10.5194/acp-17-2009-2017, 2017.
Konstantinov, P. I., Varentsov, M. I., and Malinina, E. P.: Modelling of thermal comfort conditions inside the urban boundary layer during Moscow's 2010 summer heat wave (case-study), Urban Climate, 10, 563–572, https://doi.org/10.1016/j.uclim.2014.05.002, 2014.
Konstantinov, P. I., Grishchenko, M. Y., and Varentsov, M. I.: Mapping Urban Heat Islands of Arctic Cities Using Combined Data on Field Measurements and Satellite Images Based on the Example of the City of Apatity (Murmansk Oblast), Izv. Atmos. Ocean Phy., 51, 992–998, https://doi.org/10.1134/S000143381509011X, 2015.
Konstantinov, P., Varentsov, M., and Esau, I.: A high density urban temperature network deployed in several cities of Eurasian Arctic, Environ. Res. Lett., 13, 75007, https://doi.org/10.1088/1748-9326/aacb84, 2018.
Kottek, M., Grieser, J., Beck, C., Rudolf, B., and Rubel, F.: World map of Koeppen-Geiger climate classification updated, Meteorol. Z., 15, 259–263, https://doi.org/10.1127/0941-2948/2006/0130, 2006.
Kuznetsova, I. N., Brusova, N. E., and Nakhaev, M. I.: Moscow Urban Heat Island: Detection, boundaries, and variability, Russ. Meteorol. Hydrol., 42, 305–313, https://doi.org/10.3103/S1068373917050053, 2017.
Lappalainen, H. K., Kerminen, V.-M., Petäjä, T., Kurten, T., Baklanov, A., Shvidenko, A., Bäck, J., Vihma, T., Alekseychik, P., Andreae, M. O., Arnold, S. R., Arshinov, M., Asmi, E., Belan, B., Bobylev, L., Chalov, S., Cheng, Y., Chubarova, N., de Leeuw, G., Ding, A., Dobrolyubov, S., Dubtsov, S., Dyukarev, E., Elansky, N., Eleftheriadis, K., Esau, I., Filatov, N., Flint, M., Fu, C., Glezer, O., Gliko, A., Heimann, M., Holtslag, A. A. M., Hõrrak, U., Janhunen, J., Juhola, S., Järvi, L., Järvinen, H., Kanukhina, A., Konstantinov, P., Kotlyakov, V., Kieloaho, A.-J., Komarov, A. S., Kujansuu, J., Kukkonen, I., Duplissy, E.-M., Laaksonen, A., Laurila, T., Lihavainen, H., Lisitzin, A., Mahura, A., Makshtas, A., Mareev, E., Mazon, S., Matishov, D., Melnikov, V., Mikhailov, E., Moisseev, D., Nigmatulin, R., Noe, S. M., Ojala, A., Pihlatie, M., Popovicheva, O., Pumpanen, J., Regerand, T., Repina, I., Shcherbinin, A., Shevchenko, V., Sipilä, M., Skorokhod, A., Spracklen, D. V., Su, H., Subetto, D. A., Sun, J., Terzhevik, A. Y., Timofeyev, Y., Troitskaya, Y., Tynkkynen, V.-P., Kharuk, V. I., Zaytseva, N., Zhang, J., Viisanen, Y., Vesala, T., Hari, P., Hansson, H. C., Matvienko, G. G., Kasimov, N. S., Guo, H., Bondur, V., Zilitinkevich, S., and Kulmala, M.: Pan-Eurasian Experiment (PEEX): towards a holistic understanding of the feedbacks and interactions in the land-atmosphere-ocean-society continuum in the northern Eurasian region, Atmos. Chem. Phys., 16, 14421–14461, https://doi.org/10.5194/acp-16-14421-2016, 2016.
Lee, X., Goulden, M. L., Hollinger, D. Y., Barr, A., Black, T. A., Bohrer, G., Bracho, R., Drake, B., Goldstein, A., Gu, L., Katul, G., Kolb, T., Law, B. E., Margolis, H., Meyers, T., Monson, R., Munger, W., Oren, R., Paw U, K. T., Richardson, A. D., Schmid, H. P., Staebler, R., Wofsy, S., and Zhao, L.: Observed increase in local cooling effect of deforestation at higher latitudes, Nature, 479, 384–387, https://doi.org/10.1038/nature10588, 2011.
Lokoshchenko, M. A.: Urban “heat island” in Moscow, Urban Climate, 10, 550–562, https://doi.org/10.1016/j.uclim.2014.01.008, 2014.
Magee, N., Curtis, J., and Wendler, G.: The Urban Heat Island Effect at Fairbanks, Alaska, Theor. Appl. Climatol., 64, 39–47, https://doi.org/10.1007/s007040050109, 1999.
Melnikov, V., Gennadinik, V., Kulmala, M., Lappalainen, H. K., Petäjä, T., and Zilitinkevich, S.: Cryosphere: a kingdom of anomalies and diversity, Atmos. Chem. Phys., 18, 6535–6542, https://doi.org/10.5194/acp-18-6535-2018, 2018.
Miles, V. and Esau, I.: Seasonal and spatial characteristics of Urban Heat Islands (UHI) in northern West Siberian cities, Remote Sensing, 9, p. 989, https://doi.org/10.3390/rs9100989, 2017.
Nelson, F. E., Anisimov, O. A., and Shiklomanov, N. I.: Subsidence risk from thawing permafrost, Nature, 410, p. 889, https://doi.org/10.1038/35073746, 2001.
NORDREGIO: MEGATRENDS, NORDREGIO report for the Nordic Council of Ministers, TemaNord, Copenhagen, 2011:527, https://doi.org/10.6027/TN2011-527 207 pp., 2011.
Oke, T. R.: An algorithmic scheme to estimate hourly heat island magnitude, in: Preprints, 2nd Urban Environ. Symp., Albuquerque, NM, 2–5 November 1998, 80–83, 1998.
Parente, G., Shiklomanov, N., and Streletskiy, D.: Living in the New North: Migration to and from Russian Arctic Cities, Focus on Geography, 55, 77–89, https://doi.org/10.1111/j.1949-8535.2012.00048.x, 2012.
Peng, S., Piao, S., Ciais, P., Friedlingstein, P., Ottle, C., Breìon, F.-M., Nan, H., Zhou, L., and Myneni, R. B.: Surface Urban Heat Island Across 419 Global Big Cities, Eviron. Sci. Technol., 46, 796–703, https://doi.org/10.1021/es2030438, 2012.
Pfeifroth, U., Hollmann, R., and Ahrens, B. Cloud Cover Diurnal Cycles in Satellite Data and Regional Climate Model Simulations, Meteorol. Z., 21, 551–560, https://doi.org/10.1127/0941-2948/2012/0423, 2012.
Piringer, M., Joffre, S., Baklanov, A., Christen, A., Deserti, M., De Ridder, K., Emeis, S., Mestayer, P., Tombrou, M., Middleton, D., Baumannstanzer, K., Dandou, A., Karppinen, A., and Burzynski, J.: The surface energy balance and the mixing height in urban areas – activities and recommendations of COST Action 715. Bound.-Lay. Meteorol., 124, 3–24, https://doi.org/10.1007/s10546-007-9170-0, 2007.
Pressman, N. E.: Sustainable winter cities: Future directions for planning, policy and design, Atmos. Environ., 30, 521–529, https://doi.org/10.1016/1352-2310(95)00012-7, 2006.
Rockel, B., Will, A., and Hense, A.: The regional climate model COSMO-CLM (CCLM). Meteorol. Z., 17, 347–348, https://doi.org/10.1127/0941-2948/2008/0309, 2008.
Ryu, Y.-H. and Baik, J.-J.: Quantitative Analysis of Factors Contributing to Urban Heat Island Intensity, J. Appl. Meteorol. Clim., 51, 842–854, https://doi.org/10.1175/JAMC-D-11-098.1, 2012.
Sailor, D. J. and Lu, L.: A top–down methodology for developing diurnal and seasonal anthropogenic heating profiles for urban areas, Atmos. Environ., 38, 2737–2748, https://doi.org/10.1016/j.atmosenv.2004.01.034, 2004.
Schwarz, N., Lautenbach, S., and Seppelt, R.: Exploring indicators for quantifying surface urban heat islands of European cities with MODIS land surface temperatures, Remote Sens. Environ., 115, 3175–3186, https://doi.org/10.1016/j.rse.2011.07.003, 2011.
Shubenkov, M. V. and Blagodeteleva, O. M.: In search for urban planning principles for development of northern settlements. Gradostroitelstvo, 3, 76–81, 2015 (in Russian).
Stewart, I. D.: A systematic review and scientific critique of methodology in modern urban heat island literature, Int. J. Climatol., 31, 200–217, https://doi.org/10.1002/joc.2141, 2011.
Stewart, I. D. and Oke, T. R.: Local climate zones for urban temperature studies, B. Am. Meteorol. Soc., 93, 1879–1900, https://doi.org/10.1175/BAMS-D-11-00019.1, 2012.
Streletskiy, D. A., Shiklomanov, N. I., and Nelson, F. E.: Permafrost, Infrastructure, and Climate Change: A GIS-Based Landscape Approach to Geotechnical Modeling, Arct. Antarct. Alp. Res., 44, 368–380, https://doi.org/10.1657/1938-4246-44.3.368, 2012.
Tan, J., Zheng, Y., Tang, X., Guo, C., Li, L., Song, G., Zhen, X., Yuan, D., Kalkstein, A. J., Li, F., and Chen, H.: The urban heat island and its impact on heat waves and human health in Shanghai, Int. J. Biometeorol., 54, 75–84, https://doi.org/10.1007/s00484-009-0256-x, 2010.
Theeuwes, N. E., Steeneveld, G.-J., Ronda, R. J., and Holtslag, A. A. M.: A diagnostic equation for the daily maximum urban heat island effect for cities in northwestern Europe, Int. J. Climatol., 37 , 443–454, 2016.
Timlin, M. S. and Walsh, J. E.: Historical and Projected Distributions of Daily Temperature and Pressure in the Arctic, Arctic, 60, 389–400, http://www.jstor.org/stable/40512962 (last access: 30 November 2018), 2007.
Varentsov, M., Konstantinov, P., Samsonov, T., and Repina, I: Investigation of the urban heat island phenomenon during polar night based on experimental measurements and remote sensing of Norilsk city, Sovremennye problemy distantsionnogo zondirovaniya Zemli iz kosmosa, 11, 329–337, 2014 (in Russian).
Varentsov, M., Wouters, H., Platonov, V., and Konstantinov, P.: Megacity-Induced Mesoclimatic Effects in the Lower Atmosphere: A Modeling Study for Multiple Summers over Moscow, Russia, Atmosphere, 9, p. 50, https://doi.org/10.3390/atmos9020050, 2018.
Wan, Z., Zhang, Y., Zhang, Q., and Li, Z.-L.: Quality assessment and validation of the MODIS global land surface temperature, Int. J. Remote Sens,, 25, 261–274, https://doi.org/10.1080/0143116031000116417, 2004.
Wetzel, C. and Brummer, B.: An Arctic inversion climatology based on the European Centre Reanalysis ERA-40, Meteorol. Z., 20, 589–600, https://doi.org/10.1127/0941-2948/2011/0295, 2011.
Wienert, U. and Kuttler, W.: The dependence of the urban heat island intensity on latitude – A statistical approach, Meteorol. Z., 14, 677–686, https://doi.org/10.1127/0941-2948/2005/0069, 2005.
Wilby, R. L.: Past and projected trends in London's urban heat island, Weather, 58, 251–260, https://doi.org/10.1256/wea.183.02, 2003.
Wilson, E. and Stammler, F.: Beyond extractivism and alternative cosmologies: Arctic communities and extractive industries in uncertain times, The Extractive Industries and Society, 3, 1–8, https://doi.org/10.1016/j.exis.2015.12.001, 2016.
Wouters, H., Demuzere, M., Blahak, U., Fortuniak, K., Maiheu, B., Camps, J., Tielemans, D., and van Lipzig, N. P. M.: The efficient urban canopy dependency parametrization (SURY) v1.0 for atmospheric modelling: description and application with the COSMO-CLM model for a Belgian summer, Geosci. Model Dev., 9, 3027–3054, https://doi.org/10.5194/gmd-9-3027-2016, 2016.
Wouters, H., De Ridder, K., Poelmans, L., Willems, P., Brouwers, J., Hosseinzadehtalaei, P., Tabari, H., Vanden Broucke, S., van Lipzig, N. P. M., and Demuzere, M.: Heat stress increase under climate change twice as large in cities as in rural areas: A study for a densely populated midlatitude maritime region, Geophys. Res. Lett., 44, 8997–9007, https://doi.org/10.1002/2017GL074889, 2017.
Yu, Q., Epstein, H. E., Engstrom, R., Shiklomanov, N., and Streletskiy, D.: Land cover and land use changes in the oil and gas regions of Northwestern Siberia under changing climatic conditions, Environ. Res. Lett., 10, 124020, https://doi.org/10.1088/1748-9326/10/12/124020, 2015.
Zhao, L., Lee, X., Smith, R. B., and Oleson, K.: Strong contributions of local background climate to urban heat islands, Nature, 511, 214–219, 2014.
Zhou, B., Rybski, D., and Kropp, J. P.: On the statistics of urban heat island intensity, Geophys. Res. Lett., 40, 5486–5491, https://doi.org/10.1002/2013GL057320, 2013.
Zhou, D., Zhao, S., Zhang, L., Sun, G., and Liu, Y.: The footprint of urban heat island effect in China, Sci. Rep.-UK, 5, 11160, https://doi.org/10.1038/srep11160, 2015.