the Creative Commons Attribution 4.0 License.
the Creative Commons Attribution 4.0 License.
 | 05 Dec 2018
The influence of particle composition upon the evolution of urban ultrafine diesel particles on the neighbourhood scale
Irina Nikolova
Xiaoming Cai
Mohammed Salim Alam
Soheil Zeraati-Rezaei
Jian Zhong
A. Rob MacKenzie
Roy M. Harrison
A recent study demonstrated that diesel particles in urban air undergo evaporative shrinkage when advected to a cleaner atmosphere (Harrison et al., 2016). We explore, in a structured and systematic way, the sensitivity of nucleation-mode diesel particles (diameter < 30 nm) to changes in particle composition, saturation vapour pressure, and the mass accommodation coefficient. We use a multicomponent aerosol microphysics model based on surrogate molecule (C16−C32 n-alkane) volatilities. For standard atmospheric conditions (298 K, 1013.25 hPa), and over timescales (ca. 100 s) relevant for dispersion on the neighbourhood scale (up to 1 km), the choice of a particular vapour pressure dataset changes the range of compounds that are appreciably volatile by two to six carbon numbers. The nucleation-mode peak diameter, after 100 s of model runtime, is sensitive to the vapour pressure parameterisations for particles with compositions centred on surrogate molecules between C22H46 and C24H50. The vapour pressure range, derived from published data, is between 9.23 × 10⁻³ and 8.94 × 10⁻⁶ Pa for C22H46 and between 2.26 × 10⁻³ and 2.46 × 10⁻⁷ Pa for C24H50. Therefore, the vapour pressures of components in this range are critical for the modelling of nucleation-mode aerosol dynamics on the neighbourhood scale and need to be better constrained. Laboratory studies have shown this carbon number fraction to derive predominantly from engine lubricating oil. The accuracy of vapour pressure data for other (more and less volatile) components from laboratory experiments is less critical. The influence of a core of non-volatile material is also considered; non-volatile core fractions of more than 5 % are inconsistent with the field measurements that we test the model against. We consider mass accommodation coefficient values less than unity and find that model runs with more volatile vapour pressure parameterisations and lower accommodation coefficients are similar to runs with less volatile vapour pressure parameterisations and higher accommodation coefficients. The new findings of this study may also be used to identify semi-volatile organic compound (SVOC) compositions that play dominating roles in the evaporative shrinkage of the nucleation mode observed in field measurements (Dall'Osto et al., 2011).
- Article
(1580 KB) - Full-text XML
-
Supplement
(1700 KB) - BibTeX
- EndNote


Ultrafine particles (UFPs, with particle diameter Dp<100 nm) have become an increasingly important focus of urban air research over the last 2 decades. The main source of UFPs in outdoor urban air is typically road traffic (Kumar et al., 2014). Harrison et al. (2011) reported that on a busy highway in central London, UK, 71.9 % of particles by number were traffic-generated; of this 71.9 %, 27.4 % were found in the semi-volatile exhaust nucleation mode (size between 15 and 30 nm), 38 % were in the exhaust solid mode (size >30 nm), and the remaining 6.5 % were from brake dust and resuspension (size >2000 nm). Hereafter, nucleation-mode particles are defined as particles with a diameter of less than 30 nm, whilst Aitken-mode particles have a diameter in the range of 30–100 nm. Health-related research – prompted by the proximity of the UFP traffic source to the public, and the large number of UFPs emitted by traffic – has accrued evidence pointing to the toxicity and potentially harmful effects of UFPs on human health (Atkinson et al., 2010). Experimental and modelling studies have advanced our understanding of the behaviour of urban air UFPs, e.g. the relevant aerosol dynamics important to the evolution of UFPs in space and time (Jacobson, 2005; Allen et al., 2007; Biswas et al., 2007; Dall'Osto et al., 2011; Nikolova et al., 2011; Karnezi et al, 2014; Karl et al., 2016).
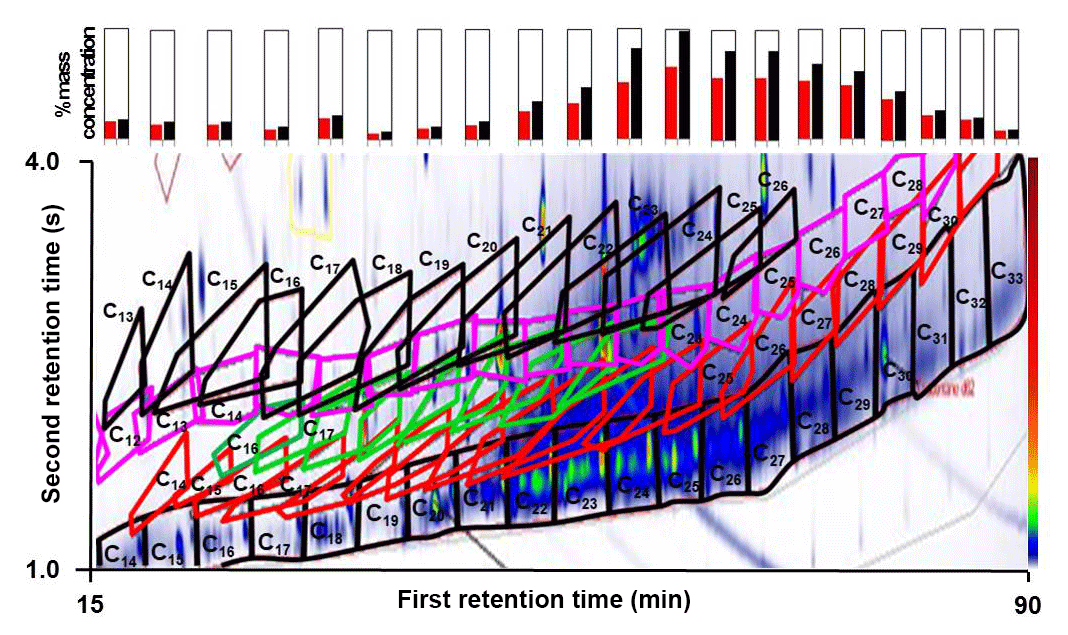
Figure 1A GC × GC chromatogram (contour plot) indicating homologous series of compounds identified in diesel engine exhaust emissions. Emissions from a light-duty diesel engine operating at 1800 revolutions per minute and 1.4 bar brake mean effective pressure. Compounds identified in the contour plot are indicated by the coloured polygons – lower black polygons are n+i-alkanes; red polygons are monocyclic alkanes; green polygons are bicyclic alkanes; pink polygons are aldehydes + ketones; and upper black polygons are monocyclic aromatics. Each peak in the contour plot represents a compound present in the emissions; warmer colours (e.g. red) are more intense peaks while colder colours (e.g. blue) are smaller peaks. The contour plot were produced by GC Image v2.5. The bar charts above the contour plot show the volatility distribution of total alkanes (red) and total identified species (black), indicating that the majority of the emissions consist of alkanes. For details of the compound attribution method, see Alam et al. (2017).
Nonetheless, key information regarding the size-resolved composition of UFPs is missing, which limits our ability to determine the impact of gas-transfer processes on UFP evolution. Progress has been made in modelling traffic-generated particles (including the ultrafine fraction) using a volatility basis set, defined using the effective saturation concentration (Donahue et al., 2006). Progress in identifying the precise chemical composition of traffic-generated particles has been made by resolving the so-called “unresolved complex mixture” (largely uncharacterised organics in traditional gas chromatography) via two-dimensional gas chromatography (GC × GC; Chan et al., 2013). Alam et al. (2016) show that emitted ultrafine diesel particles consist of a substantial amount of organic material from both unburnt diesel fuel and engine lubricating oil. They attribute the low-molecular-weight semi-volatile organic compounds (SVOCs, with a carbon number < 18) predominantly to unburnt diesel fuel, whereas heavier SVOCs (carbon number >18) are attributed predominantly to engine lubricating oil. A typical GC × GC separation is shown in the chromatogram (Fig. 1) for diesel engine exhaust emissions in the particulate-phase Aitken mode ( nm). Compounds are separated by volatility along the x axis (first separation dimension) and by polarity in the y axis (second dimension). Peak identification is based on retention indices and mass spectral data from the National Institute of Standards and Technology (NIST) library. The majority of chromatography peaks (identified as aliphatic alkanes, lower black polygons) are present between C18 and C26, corresponding to the compounds identified in the engine lubricating oil and particulate phase engine emissions (Alam et al., 2017). Bar charts above the chromatogram show the volatility distribution of total alkanes (red) and total identified compounds (black), indicating that, although many hundreds of individual chemical compounds are detected, the majority of SVOC emissions consist of alkanes. Both the alkane composition and the total composition distributions show a broad peak centred at C25.
Most primary organic particle emissions are semi-volatile in nature; thus, they are likely to evaporate due to atmospheric dilution and increased distance from the source (Robinson et al., 2007). This was observed by Dall'Osto et al. (2011; Fig. S1 in the Supplement) as part of the REPARTEE campaign (Harrison et al., 2012). Dall'Osto et al. (2011) reported a remarkable decrease in the measured nucleation-mode peak particle diameter (Dpg,nuc) between a street canyon (Dpg,nuc=23 nm) and the downwind neighbourhood ( nm) that were located ca. 650 m from one another in central London (UK). The travel time, depending on the wind speed, can vary from ∼ 100 to ∼ 300 s. Nucleation formation of new particles in the atmosphere was ruled out as a possible reason for the observed behaviour. Instead, the decrease in particle diameter was attributed to the effect of evaporation and substantial mass loss from the particle surface (hereafter referred to as REPARTEE-like aerosol dynamics). Alam et al. (2016) present the composition of diesel UFPs measured on a laboratory test-rig (cf. Fig. S2); however, the range of variability of the particle composition in emissions is still unknown. It is also not known how the organic material is distributed onto the nucleation and Aitken modes of the UFP distribution in the atmosphere.
Numerical experiments can test the plausibility of possible missing components of the system, and can advise on which experimental studies will be most likely to resolve the existing knowledge gaps. Nikolova et al. (2016) describe a modelling framework that can produce nucleation-mode dynamics consistent with observations. However, missing in that study, which was carried out before the test-rig experimental results (Alam et al., 2016, 2017) were available, is a systematic sweep of critical thermodynamic parameters and a size-resolved composition that could determine or point to REPARTEE-like aerosol dynamics.
In the present study, in an extensive new set of model runs moving beyond Nikolova et al. (2016), we develop a method to search the particle composition space – i.e. the volatility parameter space – to identify a group of surrogate n-alkanes in the C16H34–C32H66 range that could explain a decrease in the nucleation-mode particle diameter to 10 nm or below, as seen in the measurements in London (Dall'Osto et al., 2011). The model simulations are focused on events after dilution and cooling of the exhaust-pipe plume. We provide a more robust approach to identify crucial parameters responsible for the UFP behaviour in the atmosphere on the neighbourhood scale including the identification of parameter sets that are incompatible with the observed behaviour of nucleation-mode UFPs in urban air. We describe a new way of simulating and evaluating the role of the SVOC composition on the atmospheric behaviour of the size-resolved urban UFPs and examine more complex sets of compositions involving a non-volatile core. We extend our model run set to assess the critical and interacting roles of the saturation vapour pressure parameterisation and the mass accommodation coefficient on the size-resolved aerosol dynamics.
In this study we use Lagrangian box-model simulations of the evolution of urban ultrafine diesel particles on the neighbourhood scale (up to 1 km). Key results are presented and discussed in the main body of the text, whilst more details are provided in the Supplement. Section 2 describes the modelling approach, Sect. 3 presents the model output, and Sect. 4 summarises the key findings and outlines suggestions for further work.
We adopt a “surrogate molecule” approach to UFP composition, based on the chemical speciation shown in analyses such as Fig. 1. The composition of UFPs is simulated as comprising n-alkanes from C16H34 to C32H66, which are the most abundant compounds in Fig. 1. Previously (Nikolova et al., 2016), we initialised the n-alkane abundance in gas and particle phases in a different way, using roadside and urban background observations in Birmingham, U.K. (Harrad et al., 2003). In the following, we retain this roadside gas-phase initialisation (see below), but choose a more general method for initialising the particle composition, in order to test the sensitivity of the results to the initialisation in a systematic way. By adopting a surrogate molecule approach, we are effectively anchoring our model volatility basis set in physico-chemical data, as discussed further below.
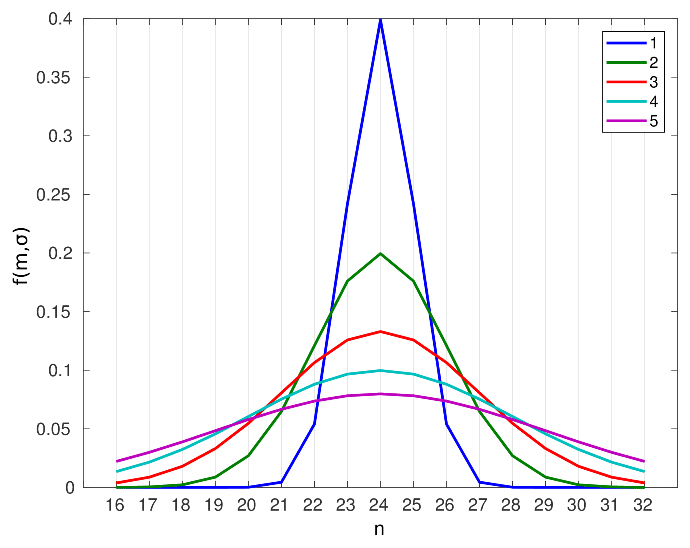
Figure 2An example of nucleation-mode UFP compositions, represented as mass fractions for surrogate compounds CnH(2n+2), , and described by a Gaussian distribution centred on C24H50 with a standard deviation, σ, from 1 to 5.
The SVOC mass fractions in a particle are represented by a truncated Gaussian distribution that is centred for each model run at a given n-alkane in the range from C16H34 to C32H66 with a standard deviation, σ, varying from 1 to 5. In the following we call the surrogate n-alkane on which the composition distribution is centred, the “modal composition”. Example compositions are shown in Fig. 2 for a Gaussian distribution centred at C24H50. A narrower mass distribution, with σ=1, focuses predominantly (ca. 40 %) on the component, j (C24H50), at which the distribution is centred, with a smaller (ca. 24 %) contribution from the adjacent compounds C23H48 and C25H52, and a minor contribution (ca. 5 %) from C22H46 and C26H54. The contribution of the remaining compounds from the tail of the distribution is very low (less than 1 %). However, a wider mass distribution (e.g. ≃5) approximates a flat distribution and includes a contribution from the majority or all of the compounds in the n-alkane range from C16H34 to C32H66. Monotonically decreasing distributions occur for distributions centred at either end of the C16H34 to C32H66 range. Overall, if one excludes the compounds with less than a 1 % contribution, modal compositions centred at carbon number, j, with , and 5 σ, contain surrogate compounds , and 11 carbon numbers of j (formally, to remain in the 16–32 carbon number range, [max(16, j−2), min(32, j+2)], [max(16, j−4), min(32, j+4)], [max(16, j−7), min(32, j+7], [max(16, j−9), min(32, j+9], and [max(16, j−11), min(32, j+11)]), respectively. Multi-modal compositions, or other compositions differing strongly from Gaussian, are not investigated in the present study, but could be accommodated by a simple extension of the method.
We use a Gaussian distribution to represent the composition of the particles because it provides a structured and systematic way to evaluate the organic-aerosol phase partitioning and the amount of organic matter in the UFP. This is important for the behaviour and evolution of the UFP at various timescales relevant for the urban atmosphere. Although there is no reason to discount other functional forms for the composition distribution (e.g. skew Gaussian, log-normal, Pareto, linear, among others), the Gaussian distributions chosen represent a simple two-parameter approach to explore the volatility/composition space available.
2.1 Box model
The model used in this study is the UFP version (Nikolova et al., 2016) of CiTTy-Street (Pugh et al., 2012); that is, a box-model configuration that accounts for the multicomponent nature of the urban ultrafine particles. The CiTTy-Street UFP model is used with 15 discrete size bins, with an initial diameter range between 5.8 and 578 nm in a uniform log-scale. The model can operate in two modes with respect to the aerosol dynamics: Eulerian (fixed particle-diameter grid) or Lagrangian (moving particle-diameter grid). The Eulerian mode is selected when the UFP size distribution is evaluated in the presence of emissions and exchange of particles between spatial boxes (Nikolova et al., 2016). The Lagrangian mode can be selected when the UFP size distribution is evaluated for an isolated air parcel, i.e. when no emissions or transport between spatial boxes are present. In this study, the Lagrangian mode is selected in a zero-dimensional configuration with no emissions or transport in/out of the box. The UFP dynamics (only condensation/evaporation) are simulated such that particles are allowed to grow/shrink to their exact size without any redistribution onto fixed bins in a grid with bin bounds left open in a fully moving diameter scheme (see, for example, Jacobson et al., 1997). Our earlier work (Nikolova et al., 2016) showed that deposition and coagulation have a minor effect in the current scenario, and so these factors were switched off to allow a more straightforward diagnosis of model behaviour. The condensation/evaporation process applies Raoult's law (for an ideal solution of the volatile compounds) and a default mass accommodation coefficient α=1 (Julin et al., 2014) for all SVOCs. The effect of changing α is investigated in Sect. 3.4. The Kelvin effect is also considered, which alters the saturation vapour pressure of the compounds as a function of the particle diameter, the surface tension of the SVOC mixture/solution, and the molecular weight of the participating compounds. The Kelvin effect is pronounced for particles with a diameter less than 20 nm and substantial for particles with diameter less than 10 nm. The Kelvin term accelerates the evaporation for all compounds under consideration in this study and more notably for the high-molecular-weight compounds due to their larger molar volume.
The model results are evaluated at 1, 10, and 100 s. The timescale of 100 s is based on estimate of the travel time on the neighbourhood scale (i.e. horizontal travel distances ≪1 km).
2.2 Modal composition and initial size-resolved UFP distribution
The initial size-resolved UFP distribution is based on the measurements of Dall'Osto et al. (2011) and reproduced in Fig. S1. This ultrafine size distribution represents the typical street canyon bimodal size distribution found next to a traffic site, e.g. next to Marylebone Road in London (UK). The distribution has a well-defined nucleation mode with a peak number concentration at nm. The Aitken mode appears as a shoulder attached to the nucleation mode with a peak number concentration found at Dpg,aim between 50 and 60 nm.
The initial UFP size-resolved composition is represented by modal compositions in the range from C16H34 to C32H66, as detailed above, and a standard deviation σ from 1 to 5. A non-volatile core is included in the UFPs. While studies broadly agree on the existence of a non-volatile core in the Aitken mode (Biswas et al., 2007; Wehner et al., 2004; Ronkko et al., 2013), it is unclear if nucleation-mode particles contain some non-volatile material or if they are entirely composed of SVOCs. We tested the sensitivity to the existence of non-volatile material in the nucleation-mode particles by initialising with 1 %, 5 %, or 10 % by mass non-volatile material for each modal composition (see Supplement); results are discussed later in this paper. Simulations are performed by considering the initialised Aitken mode predominantly non-volatile and coated only with 10 % volatile material. This is based on the observations made during the REPARTEE campaign (Harrison et al., 2012) that show a fairly stable Aitken mode between the street canyon and the neighbourhood. The initial size-resolved modal compositions, composition standard deviations, and non-volatile core in the nucleation and Aitken modes are detailed in Tables S1–S4 in the Supplement. We also provide information on the input parameters of the log-normal UFP size distribution for the nucleation and Aitken modes.
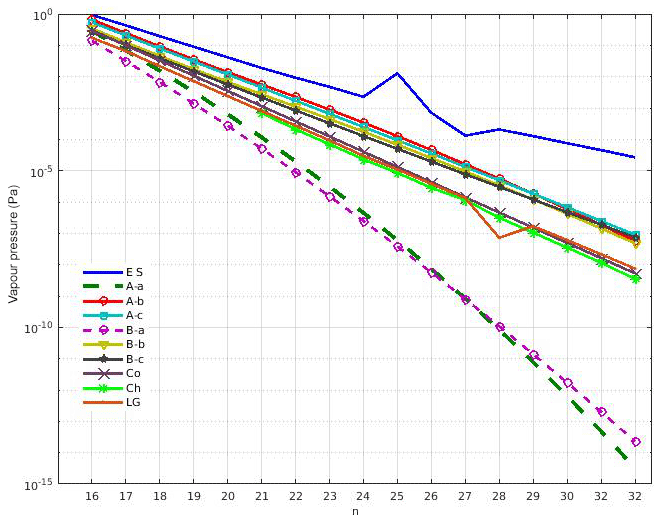
Figure 3Vapour pressure data for selected n-alkanes CnH(2n+2) where at 298 K. Abbreviations in the legend indicate the source as follows: A and B refer to the vapour pressure data from Nannoolal et al. (2008) and Myrdal and Yalkowsky (1997), respectively; -a, -b, and -c refer to the boiling point of Joback and Reid (1987), Stein and Brown (1994), and Nannoolal et al. (2004), respectively; ES refers to the EPI Suite calculator (U.S. Environmental Protection Agency); Co refers to Compernolle et al. (2011); Ch refers to Chickos and Lipkind (2008); and LG refers to Lemmon and Goodwin (2000).
2.3 Saturation vapour pressures and gas-phase concentrations
The driving force for condensation/evaporation is the difference between the partial pressure of each representative SVOC and its saturation vapour pressure (hereafter vapour pressure) over the ideal solution in the nucleation-mode condensed phase. Figure 3 shows vapour pressures above pure, flat, supercooled liquids for n-alkanes in the range from C16H34 to C32H66, following Chickos and Lipkind (2008), Compernolle et al. (2011), Lemmon and Goodwin (2000), the EPI Suite calculator (US EPA, 2017), and the UManSysProp tool (Topping et al., 2016). The UManSysProp tool provides vapour pressure data based on the work of Nannoolal et al. (2008) and Myrdal and Yalkowsky (1997) with the boiling points of Joback and Reid (1987), Stein and Brown (1994), and Nannoolal et al. (2004). There is a very substantial range of estimated vapour pressures for the same compounds in Fig. 3, especially for the high-molecular-weight n-alkanes. The reported data agrees within 1 order of magnitude between C16H34 and C19H40, but discrepancies of much more than 1 order of magnitude are evident for the high-molecular-weight compounds. The vapour pressure ranges of C22H46 and C24H50 are between [9.23 × 10⁻³ and 8.94 × 10⁻⁶ Pa] and [2.26 × 10⁻³ and 2.46 × 10⁻⁷ Pa], respectively. An enormous difference in the vapour pressure for C32H66 (from 2.66 × 10⁻⁵ Pa in EPI Suite, to 3.20 × 10⁻¹⁵ Pa in Nannoolal et al., 2008 with the boiling point of Joback and Reid, 1987, referred to as A-a hereafter) is clearly seen in Fig. 3. EPI Suite (U.S. Environmental Protection Agency) provides the highest vapour pressures for all selected species in comparison with the rest of the data. Data from Nannoolal et al. (2008) and Myrdal-Yalkowsky (1997), which both use the boiling point of Joback and Reid (1987), provide similar results and present the lowest vapour pressures among the selected n-alkanes. For the purpose of our sensitivity study, the three following representative datasets are nominated as input: Myrdal-Yalkowsky (1997) with the boiling point of Nannoolal et al. (2004, referred to as B-c in Fig. 3 and hereafter); Compernolle et al. (2011), referred to as “Co” in the following; and A-a. Hereafter we use the legend abbreviations in Fig. 3 when referring to these selected vapour pressures, which are towards the upper, middle, and lower extents of the reported data. The vapour pressure from the EPI Suite calculator has been omitted from the analysis below to provide complementarity and no duplication of our previous study (Nikolova et al., 2016).
The gas-phase concentration in the box is initialised with measured gas-phase concentrations in the C16H34 to C32H66 range from a traffic site (Harrad et al., 2003) and reported in Table S6. For the hydroxyl (OH) radical concentration ∼106 molec cm−3, the timescale for atmospheric oxidation of C16H34 is about 106 s (Atkinson and Arey, 2003). Therefore oxidation of SVOCs is neglected given the timescale in our study (100 s). The urban background gas-phase concentration is kept at zero. All model simulations are run at 298 K; the effects of temperature on vapour pressure differences as a function of carbon number are discussed in the Supplement.
We performed a total of (17 modal compositions) × (5 σ-values) × (3 non-volatile core amounts) × (3 vapour pressures) = 765 + (3 mass accommodation coefficients × 3 vapour pressure parameterisations) = 774 model runs to explore the sensitivity of particle dynamics on the neighbourhood scale.
The Supplement contains information regarding the initial size distribution, modal composition in the nucleation and Aitken modes, and gas-phase concentrations. Accumulation-mode aerosol (particles diameter Dp>100 nm) is not considered in this study. Accumulation-mode particles have much smaller number concentrations than the nucleation and Aitken modes in polluted urban areas, and are influenced by ageing and transport over larger scales.
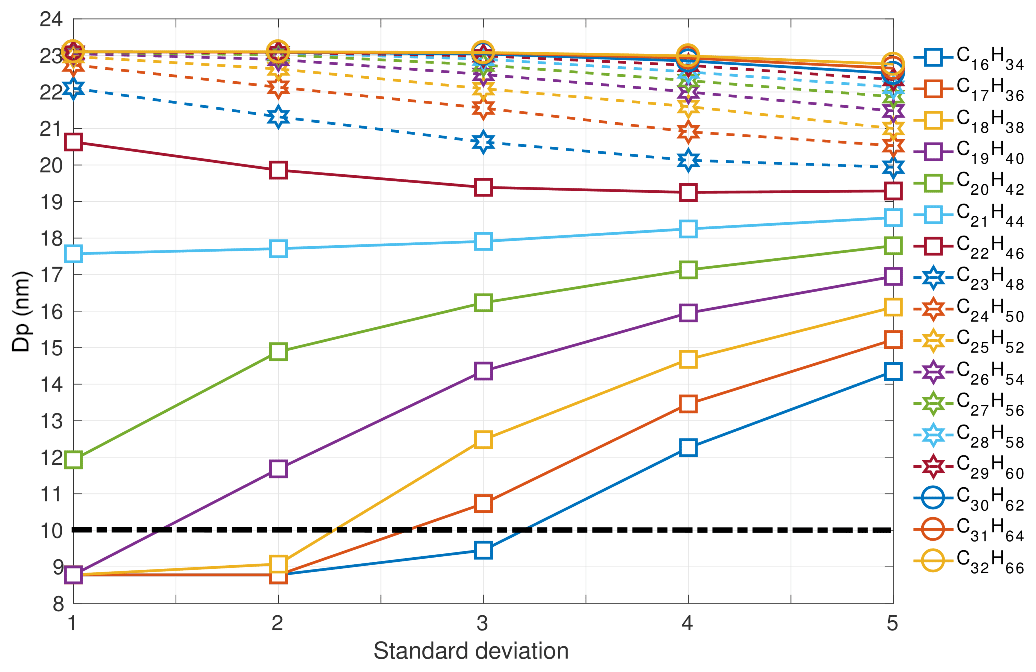
Figure 4Nucleation-mode peak diameter Dp (nm) at 1 s of simulation depending on the modal composition and the composition standard deviation. The initial nucleation-mode peak diameter is at 23 nm (not shown on the figure). Vapour pressure data follows Compernolle et al. (2011).
3.1 Effect of composition on nucleation-mode peak diameter
We consider first model runs in which the vapour pressure data follows the mid-range Co parameterisation (Compernolle et al., 2011), α=1, and nucleation-mode particles are initialised with 1 % non-volatile material. The nucleation-mode peak diameter Dpg,nuc is evaluated at 1 and 100 s of model run-time in runs with varying modal composition and composition standard deviations. Figure 4 shows Dpg,nuc (y axis) at 1 s simulation time, for each model run, plotted with respect to the modal composition and composition standard deviation, σ.
Figure 4 maps out the effect of nucleation-mode composition at this very early stage in the model simulation. For example, at σ=1 and initial mass distribution centred at C20H42 (the green solid line with square markers), the Dpg,nuc decreased from 23 nm (initial diameter at t=0 s) to 12 nm in 1 s due to evaporation of volatile material from the particles. At σ=2, Dpg,nuc = 15 nm, a somewhat larger diameter than for σ=1, due to the inclusion of material of lesser volatility in the particle composition and, hence, a decrease in evaporation overall. For modal compositions between C16H34 and C20H44, an increase in σ leads to a pronounced deceleration in overall evaporation and, therefore, a much larger nucleation-mode peak diameter at 1 s simulation time. The opposite effect occurs for modal compositions of C22H46 and above, i.e. increasing σ for a given modal composition decreases Dpg,nuc at 1 s. This is due to the addition of quickly evaporating lower molecular weight n-alkanes.
For a modal composition of C21H44, increasing σ makes almost no difference to the model outcome at 1 s. In the following, we call the modal composition that shows insensitivity to σ for a given model output time, the threshold modal composition. The threshold modal composition points to the composition compound that is in equilibrium between gas and particulate phases for the selected timescale. Lower carbon-number compositions than the threshold modal composition evaporate quicker and have therefore reached equilibrium with their respective gas concentrations on a much shorter timescale. The higher carbon-number compositions evaporate slowly and are out of equilibrium with their respective gas concentrations for the selected timescale.
The model output time of 1 s corresponds to the evaporation timescale of C21H44 under the current model setting, in analogy to the e-folding time for an exponentially decaying process. That is, at this time, a significant proportion (e.g. 1−e % for one e-folding time, and 1−e % for two e-folding times) of the initial mass has been evaporated. Furthermore, the timescales are much shorter for those lower than C21H44 carbon-number compositions (e.g. C20H42, C19H40 …) and much longer for those higher than C21H44 carbon-number compositions (e.g. C22H46, C23H48 …).
To continue the previous example of the modal composition of C20H42, the case with σ=2 includes not only less volatile materials (i.e. higher carbon-number SVOCs), but also an equal amount of more volatile materials (i.e. lower carbon-number SVOCs), as indicated by Fig. 2. One might suppose that the inclusion of the more volatile material would balance the effect of including less volatile materials. However, following our argument above, most of the lower carbon-number compounds including C20H42 will have evaporated before the given time of 1 s due to their shorter evaporation timescales with respect to C21H44. Thus, any material repartitioned from C20H42 to the lower carbon-number compounds, in changing the model settings from to σ=1 to σ=2, will not alter the total amount of evaporation nor the shrinkage rate.
A second example is outlined in the following: for C22H46, any material reallocated from C22H46 to the higher carbon-number compounds (due to changing the model setting from σ=1 to σ=2) will contribute negligibly to the shrinkage simply because the evaporation timescales for those higher carbon-number components are much longer than 1 s. Conversely, the materials repartitioned from C22H46 to the lower-carbon compounds will contribute significantly to evaporation in the first 1 s of model run-time, causing the decreasing trend of the curve shown in Fig. 4.
One implication of this finding is that, if a timescale of 1 s is of interest, the aerosol dynamics of the system are dominated by the threshold modal composition of C21H44. Those lower carbon-number compositions evaporate in less than 1 s and are approximately in equilibrium with their respective gas concentrations in the environment. The higher carbon-number compositions evaporate slowly and at 1 s only a small or a negligible proportion has been evaporated. A few compositions with the highest carbon numbers (e.g. C31H64, C32H66) have scarcely evaporated. Therefore these compositions are effectively non-volatile for these conditions.
Table 1Total mass M (ng m−3) of nucleation-mode peak particles at 1 and 100 s of simulation time for modal compositions C16H34–siC32H66 and composition standard deviations, σ. For comparison, the initial mass of the non-volatile material in the nucleation-mode peak particles is 2.9 ng m−3.
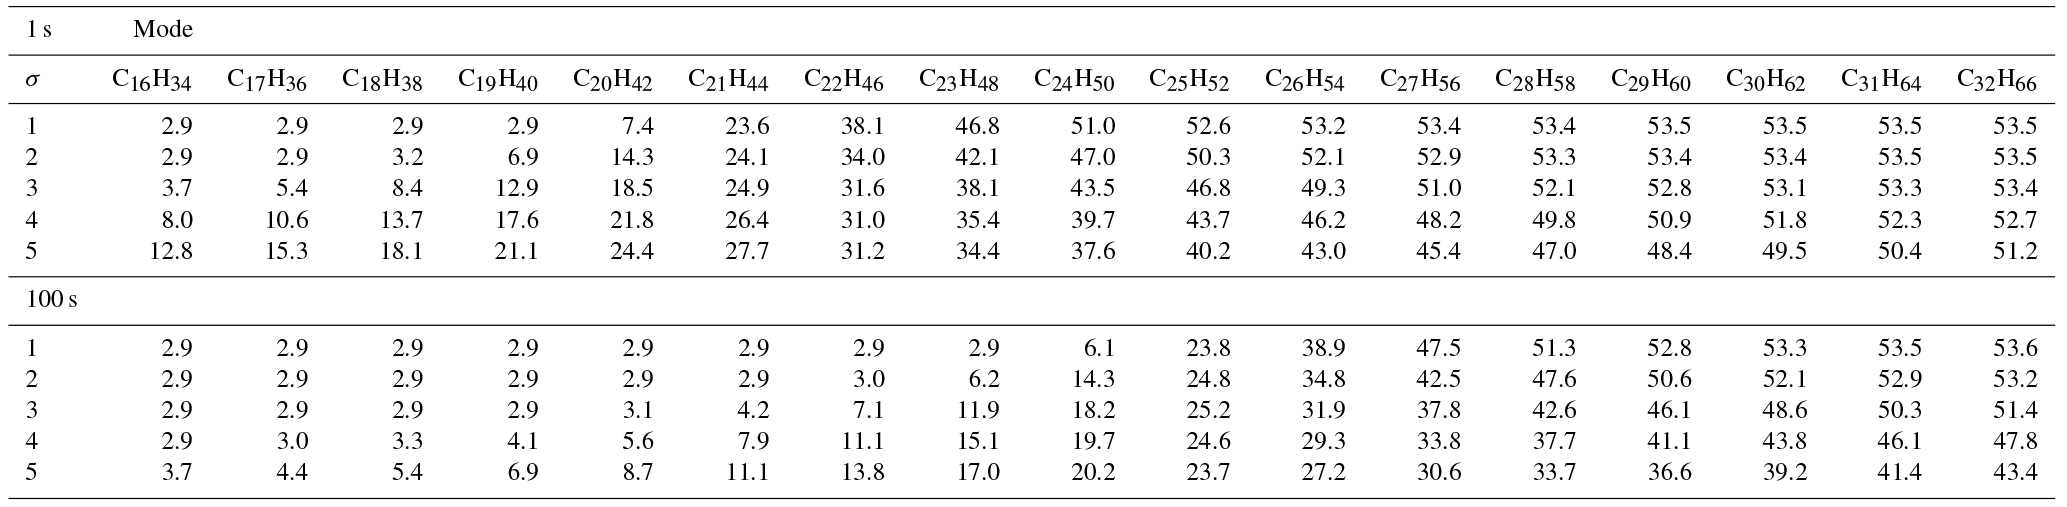
Nucleation-mode particles have an initial non-volatile mass of 2.9 ng m−3. Modal compositions from C16H34 to C19H40 and σ=1 will lose all their volatile mass in 1 s (Table 1). The initial Dpg,nuc decreases from 23 to 9 nm and no volatile material is present, i.e. particles are composed of non-volatile core only. Little or no change is simulated in terms of mass and diameter for modal composition C32H66.
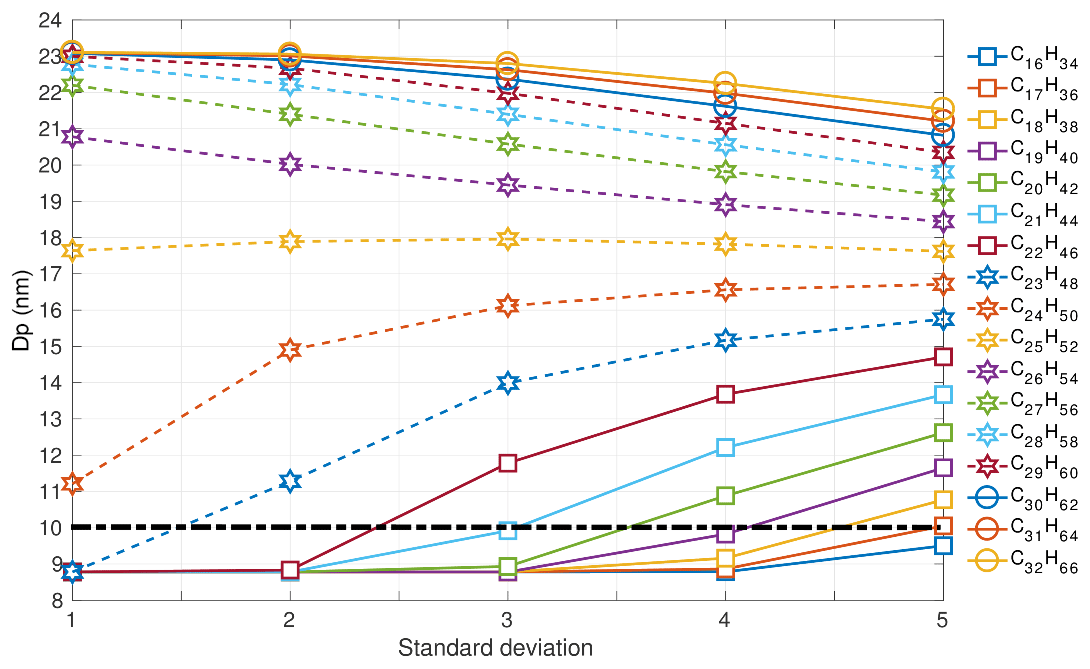
Figure 5Nucleation-mode peak diameter Dp (nm) at 100 s of simulation depending on the modal composition and the composition standard deviation. The initial nucleation-mode peak diameter is at 23 nm (not shown on the figure).Vapour pressure data follows Compernolle et al. (2011).
At 100 s, the evaporation of existing mass from the surface of the particles is also evident for higher molecular-weight components (Table 1). The Dpg,nuc at 100 s is plotted in Fig. 5. The diameter has further decreased with a more pronounced drop for all σ and modal compositions up to C25H52. Therefore, C25H52 is the threshold modal composition at this model output time.
The horizontal line drawn at 10 nm in Fig. 5 corresponds to evaporation approximating REPARTEE-like behaviour. At σ=1, modal compositions in the range from C16H34 to C23H48 – and vapour pressures and gas-phase partial pressures as detailed in the methodology – could plausibly explain a particle diameter decrease from 23 to ∼9 nm. Such a narrow range of surrogate molecular compounds is incompatible with experimental observations such as Fig. 1. At σ=2 and σ=3, modal compositions from C16H34 up to C22H46 and C21H44, respectively, can plausibly approximate REPARTEE-like behaviour. At σ=4 and σ=5 modal compositions from C16H34 up to C19H40 and C17H36, respectively, plausibly simulate REPARTEE-like behaviour.
3.2 Effect of vapour pressure on the nucleation-mode peak diameter
We compare the simulated nucleation-mode peak diameter, Dpg,nuc, at 100 s using the vapour pressure parameterisations B-c, Co, and A-a (cf. Fig. 3). The nucleation-mode particles are initialised with 1 % non-volatile material in these simulations and α=1. The diameter change when using the Co vapour pressure was discussed in the previous section. The vapour pressure values in the Co data are intermediate between the B-c and A-a data. Hence, Dpg,nuc at 100 s using vapour pressure parameterisations A-a and B-c (see Supplement), as expected, shows the same general behaviour as for the vapour pressure parameterisation Co, but with a marked change in the threshold modal composition. In order of decreasing vapour pressure (Fig. 3), the 100 s threshold modal composition value changes from C27H56 for the B-c parameterisation (Fig. S4), to C25H52 for Co (Fig. 5), to C22H46 for A-a (Fig. S5). We restrict ourselves to integer values of the threshold modal composition to maintain a straightforward connection back to the homologous chemical series in Fig. 1, although there is nothing in principle to prevent us from attributing real number values to the threshold modal composition.
There is no composition with σ=4 or σ=5, at the lower volatility A-a vapour pressure parameterisation, which produces REPARTEE-like behaviour; i.e. the decrease of the nucleation-mode peak diameter from 23 to 10 nm or below. At σ=5, the nucleation-mode particles can lose a maximum of ∼ 9 nm of their initial diameter for modal composition C16H34 (please refer to Fig. S5). Little or no change in mode diameter is simulated for modal compositions between C24H50 and C32H66 and σ=1, indicating that these combinations of composition and vapour pressure parameterisation are essentially non-volatile for the 100 s simulation time. Modal compositions C20H42 (σ=1), C19H40 (σ=2), and C17H36 (σ=3) can produce REPARTEE-like aerosol dynamics.
Table 2Modal composition ranges and composition standard deviations, σ, producing model results that approximate REPARTEE-like behaviour (see main text), for different vapour pressure parameterisations. Initial non-volatile core in the nucleation mode is set to 1 %.
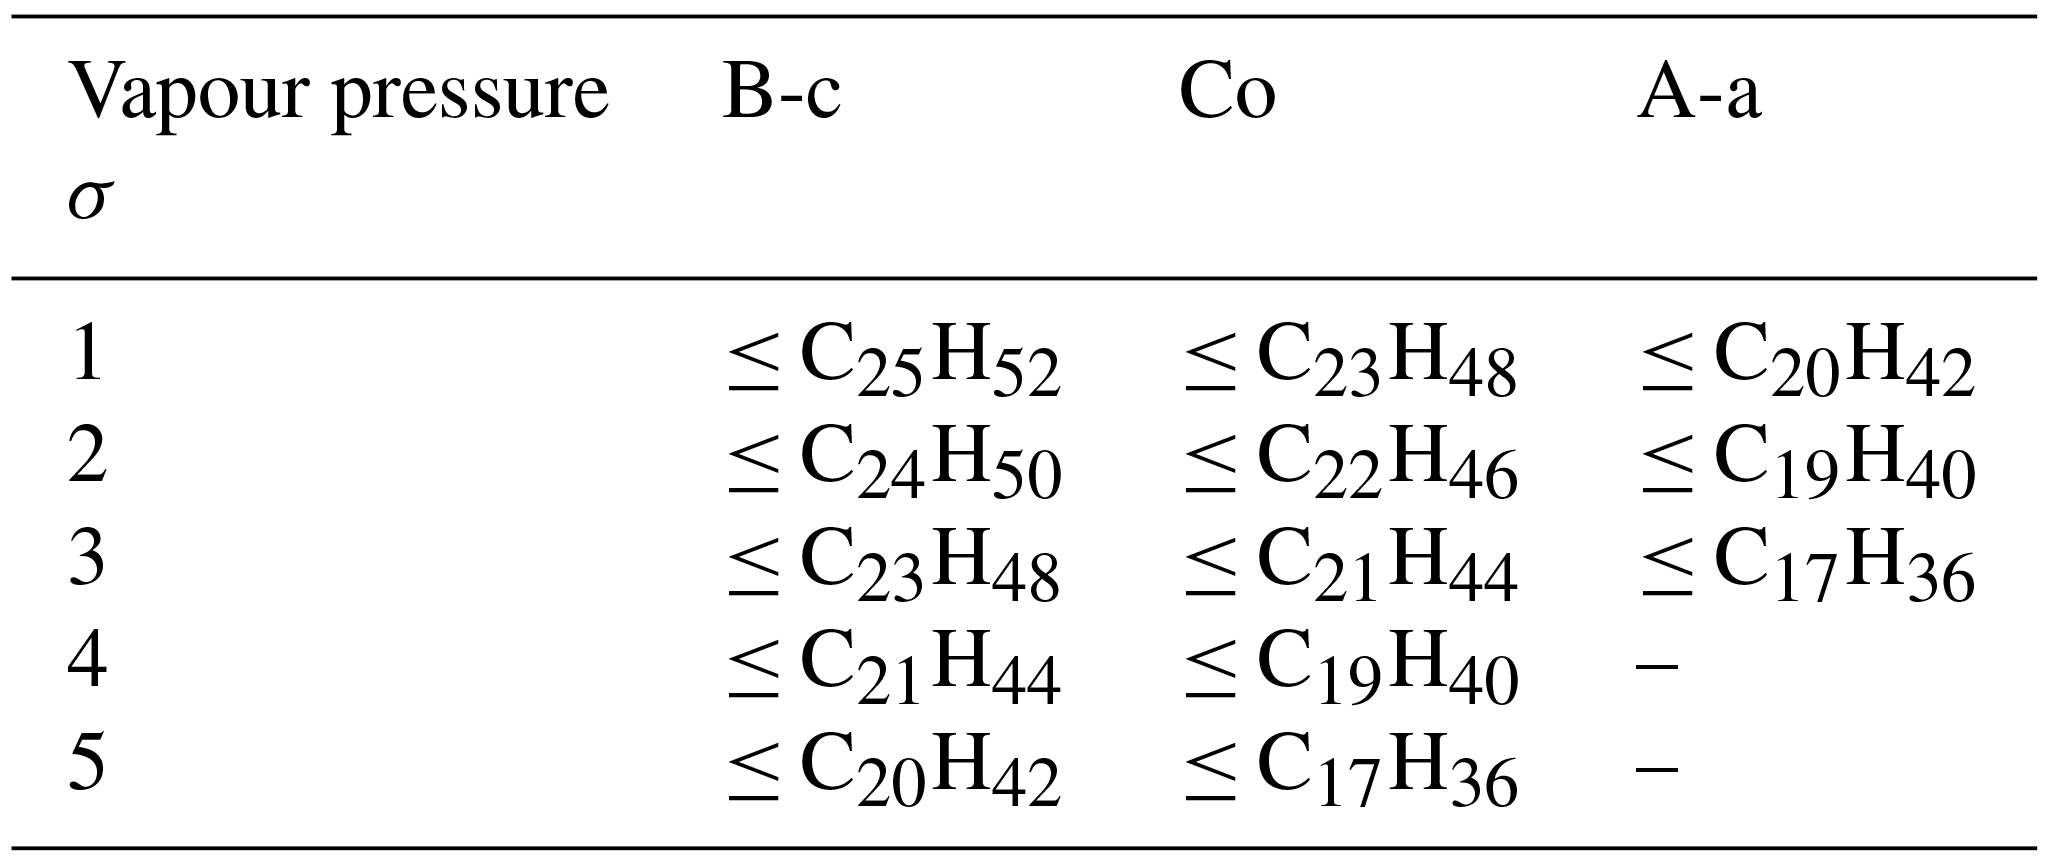
Vapour pressure parameterisation B-c has the highest vapour pressure for all compounds in comparison with Co and A-a. Hence, particles in the nucleation mode are subject to a more pronounced evaporation, even for modal compositions C28H58 to C32H66. Nonetheless, only modal compositions C25H52 (σ=1), C24H50 (σ=2), C23H48 (σ=3), C21H44 (σ=4), and C20H42 (σ=5) are able to produce the REPARTEE-like behaviour. Table 2 provides details on the modal compositions and composition standard deviations that approximate the REPARTEE-like aerosol dynamics for B-c, Co, and A-a vapour pressure parameterisations.
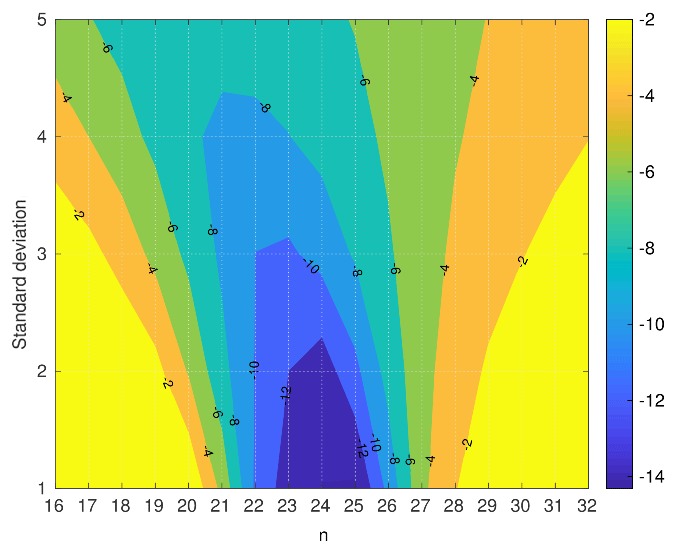
Figure 6Dpg,nuc difference between the nucleation-mode peak diameter (nm) when using B-c vapour pressure and the nucleation-mode peak diameter when using A-a vapour pressure for modal compositions CnH(2n+2), where .
The difference in 100 s Dpg,nuc between the highest vapour pressure (B-c) and the lowest vapour pressure (A-a) for all values of σ, is shown in Fig. 6. The largest differences (10–14 nm) between the Dpg,nuc occur for modal compositions between C22H46 and C24H50 and and 3. For a model run-time of 100 s, the variability of the UFP shrinkage due to the uncertainty of vapour pressure data is highest for the compositions between C22H46 and C24H50. From Fig. 3, we see that the uncertainty of the vapour pressure data increases monotonically with carbon number and is highest for C32H66. However, the large vapour-pressure uncertainties for high-carbon compositions do not exert a significant impact on the model results for this scenario. Thus, we conclude that the accuracies of vapour pressure values for very high or very low carbon-number compositions are not important for neighbourhood-scale aerosol dynamics.
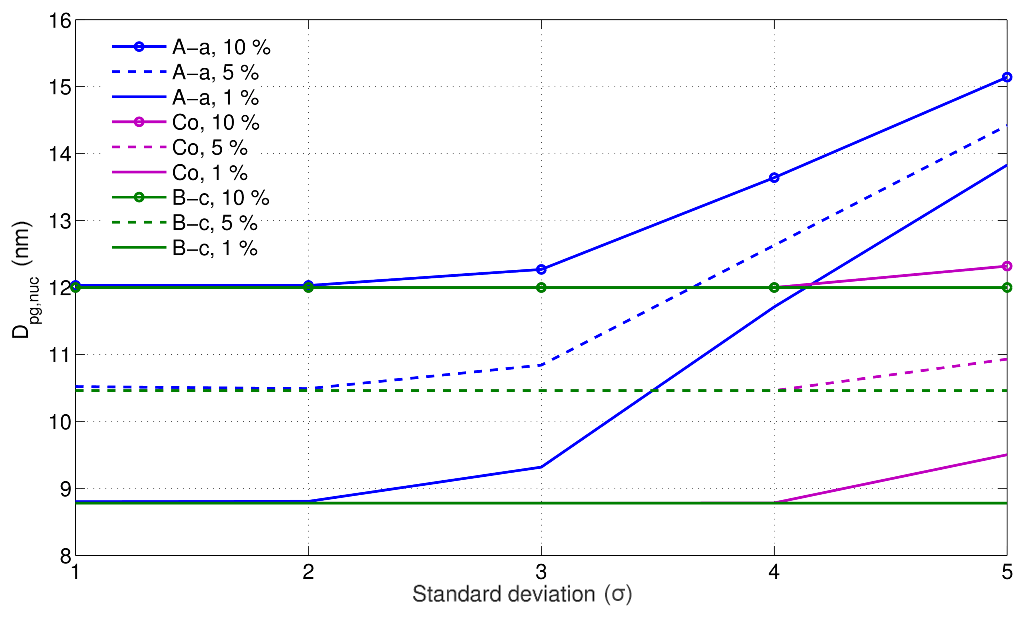
Figure 7Nucleation-mode peak diameter Dp (nm) at 100 s: the “100 s effective non-volatile core” for the nucleation mode. Results are shown at 1 %, 5 %, and 10 % initial non- volatile material in the nucleation-mode particles, modal composition C16H34, and for various composition standard deviations.
3.3 Effect of non-volatile core on the nucleation-mode peak particle diameter
To consider how the fraction of non-volatile core interacts with the composition of SVOCs and the vapour pressure parameterisations, we define a “100 s effective non-volatile core”: the nucleation-mode peak diameter at 100 s of evaporation. Figure 7 shows the results for three non-volatile fractions (initial 1 %, 5 %, and 10 % based on mass) and vapour pressures A-a, B-c, and Co (cf. Fig. 3) for a modal composition of C16H34. Results for the remaining modal compositions are not plotted here because using modal composition C16H34 and an evaporation time of 100 s gives the maximum reduction of the nucleation-mode peak diameter for all σ in our model runs. However, we show the results for modal compositions C24H50 and C32H66 for completeness in the Supplement (Fig. S7).
Because the mass-size distribution is held constant for each model initialisation (see Supplement), an increase of the non-volatile material in the nucleation mode leads to a decrease in the total amount of n-alkane SVOCs available for evaporation, and subsequently leads to an increase in the nucleation-mode “dry” (i.e. non-volatile core only) diameter from ∼ 9 to ∼ 12 nm. For the lowest volatility parameterisation (A-a), only the lightest surrogate compounds near C16H34 are sufficiently volatile over the timescale of the model run to drive the evaporation of nucleation-mode particles. As σ increases, an increasing number of lower volatility components are added into the particle composition, causing the 100 s effective non-volatile core to increase.
Considering REPARTEE-like behaviour, i.e. shrinkage of the nucleation-mode diameter to ca. 10 nm, initial non-volatile core fractions of 5 % or greater do not reproduce the observed behaviour.

Figure 8Nucleation-mode peak diameter Dp (nm) at 100 s of simulation depending on the mass accommodation coefficient, the vapour pressure parameterisation, and the composition standard deviation. The initial nucleation-mode peak diameter is at 23 nm (not shown in the figure). Results are shown for 1 % initial non-volatile material in the nucleation-mode particles, modal composition C16H34, and for various composition standard deviations. The vapour pressure parameterisations are labelled as in Fig. 3.
3.4 Effect of a mass accommodation coefficient less than unity
The effect of reducing the value of the mass accommodation coefficient, from the default value of unity, is shown in Fig. 8 as a function of the modal standard deviation and vapour pressure, for a modal composition of C16H34. Considering our default Co vapour pressure parameterisation first, using α=1 results in rapid evaporation and a small Dpg,nuc for . As discussed in Sect. 3.1, such combinations of modal composition and vapour pressure parameterisation produce a very volatile nucleation-mode aerosol that evaporates “to dryness” over the course of the model run. Decreasing the value of the mass accommodation coefficient decreases the effective volatility of the model runs with Co vapour pressure (Fig. 8), leading to larger values of Dpg,nuc. Similarly, end-of-run values of Dpg,nuc increase with decreasing values of α for the A-a and B-c vapour pressure parameterisations. The overall effect is such that model runs using the higher volatility B-c parameterisation and α=0.1 match results using the Co vapour pressures and α=1. Similarly, model runs using the lower volatility A-a parameterisation and α=1 match results using the Co vapour pressures and α=0.01. Determining which combination of vapour pressure and mass accommodation is more realistic requires further laboratory experiments to constrain these properties.
The purpose of this study was to evaluate the importance of particle composition and saturation vapour pressure on the evolution of urban ultrafine diesel particles on the neighbourhood scale (≪1 km) by means of numerical simulations. We presented the effect of evaporation on the size-resolved ultrafine particles and looked at the evolution of the nucleation-mode peak diameter (Dpg,nuc) depending on particle SVOC composition, vapour pressure, fraction of non-volatile core in the particles, and the value of the mass accommodation coefficient. We used laboratory measurements of the size-resolved composition of UFPs as an additional strong constraint on the plausibility of model parameter sets. We identified a group of surrogate n-alkane compounds in the range from C16H34 to C32H66 that could explain REPARTEE-like aerosol dynamics measured in London (Dall'Osto et al., 2011): i.e. a final nucleation-mode peak diameter at 10 nm or below when particles were subject to evaporation on a timescale of 100 s. Table 2 highlights the set of parameters in terms of vapour pressure and modal compositions that produce such REPARTEE-like behaviour.
Table 2 also presents the sets of model parameters consistent with diameter reduction due to evaporation. However, the question regarding the extent to which these results are realistic and relevant for the real-world atmosphere remains. The standard deviation σ=1 for all vapour pressures significantly narrows the contribution from the n-alkanes ([max(16, j−2), min(32, j+2)] for modal composition j), present in the initial composition of the nucleation-mode particles. At σ=2, the main contributing compounds involved in particle composition are the modal composition j and the surrogate molecules [max(16, j−4), min(32, j+4)]. This means that for the given vapour pressure parameterisation, A-a, and modal composition C19H40, the compounds found in the particles would be between C15H32 and C23H48. However, C16H34 is the lower limit of surrogate compounds in the model, so the Gaussian distribution of the composition is truncated at the low carbon-number end in this case. At σ=3, the contributing compounds found in the particles are the surrogate molecules in the range [max(16, j−7), min(32, j+7)]. For a modal composition C17H36 and A-a vapour pressure, the range of participating compounds is C16H34–C24H50, similar to the case of σ=2. At σ=4 and 5, the majority of the surrogate molecules in our range of n-alkanes participate in the composition of particles; thus, a reasonable range is provided over the contribution from diesel fuel and engine lubricating oil. The range at σ=3 could be considered as a transition range, while examples at σ=2 would have compositions that are rather more limited than available measurements in the Aitken mode (e.g. Fig. 1), with a focus on the contribution from the engine lubricating oil. Overall, narrow compositions would imply a strong gradient of SVOCs across the nucleation and Aitken modes whereas broad compositions imply that SVOCs are more or less evenly distributed across the ultrafine size range.
Table 3Modal composition range and composition standard deviations, σ, producing more realistic results that approximate REPARTEE-like behaviour. The vapour pressure parameterisations follow Myrdal and Yalkowski (1997; B-c in Fig. 3), Compernolle et al. (2011; Co in Fig. 3), and Nannoolal 2008; A-a in Fig. 3). Column “cn” indicates the carbon number of compounds n in the modal composition with a contribution bigger than 1 %.
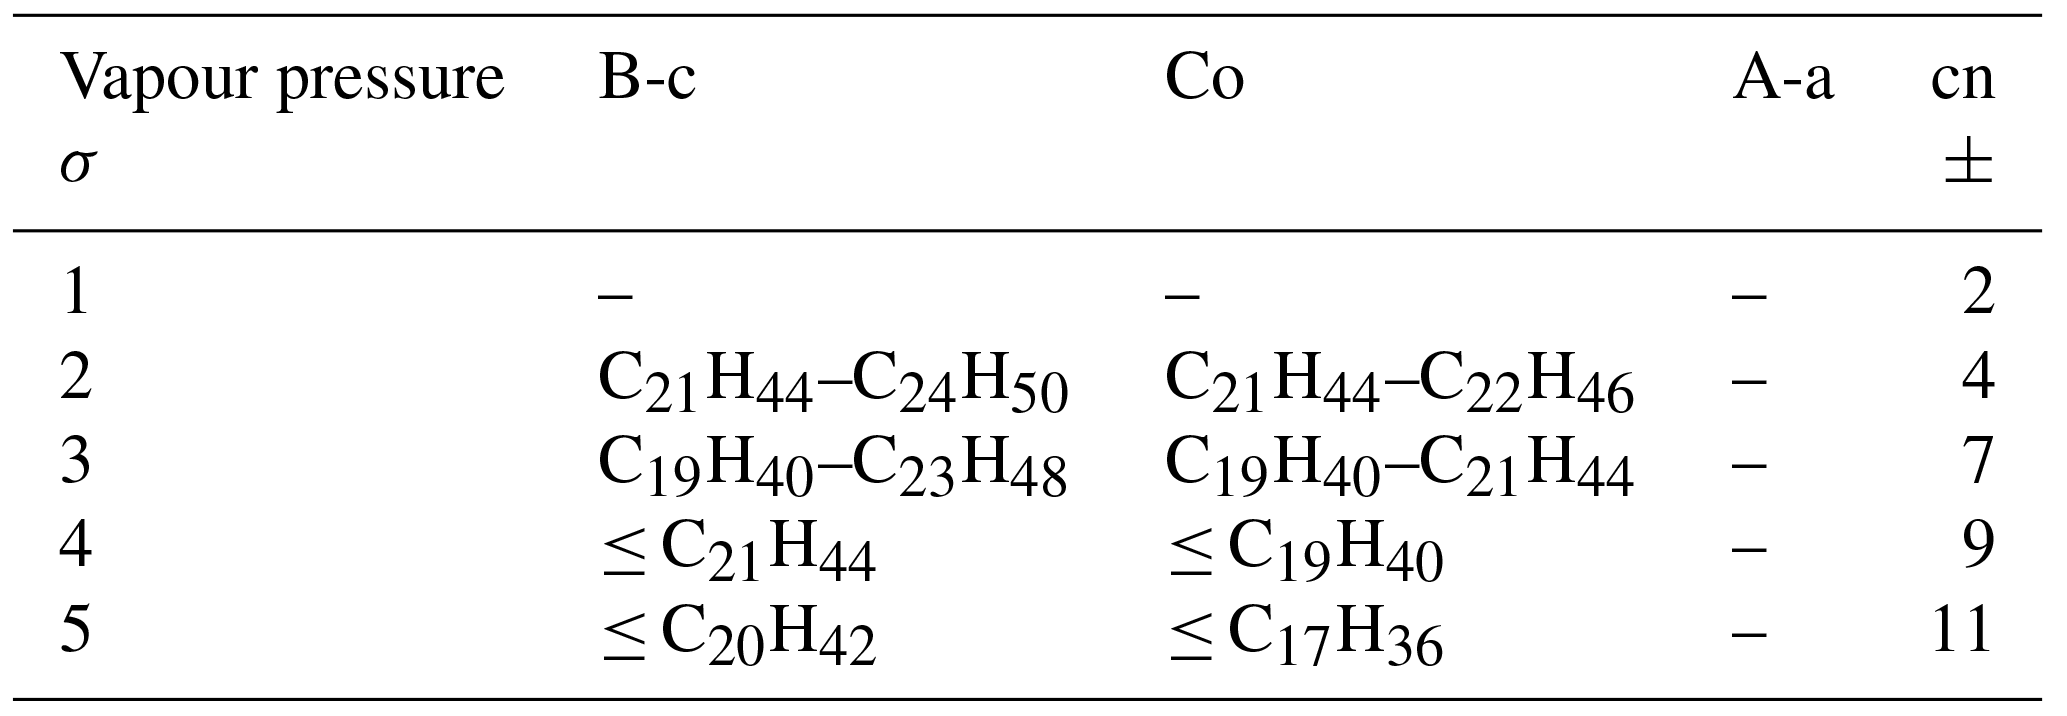
Table 3 shows an additionally constrained range of modal compositions consistent with what we know from field and laboratory measurements combined. The lowest vapour pressure parameterisations (A-a and the very similar B-a, see Fig. 3) are less likely, at any modal composition standard deviation (σ) and mass accommodation coefficient, to represent the laboratory and field observations together. The results reported in Alam et al. (2016) and in Fig. 1 show that diesel ultrafine particle emissions are composed of a wealth of SVOCs that are mainly identified as straight and branched alkanes in the range from C11 to C33, cycloalkanes (C11–C25), polycyclic aromatic hydrocarbons, various cyclic aromatics, alkyl benzenes and decalins. They report emitted particulate size fractionated concentrations of n-alkanes (cf. Fig. S2) and point out that particles in the 5–100 nm diameter range mainly consist of high-molecular-weight SVOCs (> C24H50) associated with engine lubricating oil. The work of Robinson et al. (2007), Grishop et al. (2009), and May et al. (2013) also point to a Gaussian-type distribution of the exhaust particle composition centred at a SVOC, which has a wide standard deviation.
Vapour pressure parameterisations used in this study and plotted in Fig. 3, are one of the crucial input parameters in assessing the rate at which condensation/evaporation can occur, although they are poorly constrained. We introduced a new concept of threshold modal composition, i.e. a modal composition that is not sensitive to σ for a given model output time. In an order of decreasing vapour pressure (Fig. 3) and timescale of 100 s, the threshold modal composition value changes from C27H56 for the B-c parameterisation (Fig. S4), to C25H52 for Co (Fig. 5), to C22H46 for A-a (Fig. S5). Overall, the largest differences (∼ 14 nm) in the 100 s Dpg,nuc occur between the highest (B-c) and the lowest (A-a) vapour pressure parameterisations for modal compositions between C22H46 and C24H50 and a composition standard deviation from 1 to 3. The vapour pressures of components in this range are therefore critical for the modelling of nucleation-mode aerosol dynamics on the neighbourhood scale. For components with a volatility less than that of the C22H46 surrogate compound used here, all available vapour pressure parameterisations render these compounds volatile over the 100 s timescale. These components will equilibrate with the gas phase on these short timescales. Components with volatility lower than that of the C24H50 surrogate are effectively non-volatile over this timescale for all vapour pressure parameterisations, and will consequently remain condensed and out of equilibrium with the gas phase on these timescales.
The other variable which will influence evaporation rate is the concentration of vapour surrounding the particles. In this work, measured roadside vapour concentrations reported by Harrad et al. (2003) are used (see also Nikolova et al., 2016). These represent an upper estimate of gas-phase partial pressures away from the roadside. Mixing of cleaner urban background air into the simulated air parcel would lower partial pressures and increase evaporation rates.
The 100 s effective non-volatile core (the nucleation-mode peak diameter at 100 s of evaporation) increased from ∼ 9 to ∼ 12 nm. This was attributed to the decrease in the total amount of n-alkane surrogate compounds present for evaporation. As composition standard deviation σ increased, an increasing number of lower volatility components added into the particle composition caused the 100 s effective non-volatile core to further increase. Considering REPARTEE-like behaviour, i.e. shrinkage of the nucleation-mode diameter to ca. 10 nm, an initial non-volatile core of 5 % by mass or greater was not capable of reproducing the observed behaviour in the atmosphere. Because the higher molecular-weight (lower volatility) surrogate molecules in the model are essentially non-volatile over the modelling timescale, the nucleation-mode dynamics due to SVOCs are confounded with the dynamics due to the size of any non-volatile core present in the particles.
We find that the model results for a given vapour-pressure parameterisation vary markedly depending on the choice of the mass accommodation coefficient value, α. Higher volatility vapour-pressure parameterisations with low values of α give model results similar to runs with less volatile vapour-pressure parameterisations and higher values of α. Such equifinality in model runs awaits further laboratory work to disambiguate.
Results (Fig. 7) suggest that urban nucleation-mode particles should be predominantly volatile in order to produce REPARTEE-like behaviour. In these numerical experiments, the nature of the non-volatile core need not be specified. This core could be composed of one or more low vapour pressure compounds, not affected by condensation/evaporation on the timescale of the model and measurements. Conversely, as discussed in Nikolova et al. (2016), a non-volatile core could be composed mainly of carbon and possibly some contribution from metal oxides and sulphates. This difference in composition could be relevant to effects on human health. Li et al. (2010) show that diesel truck emissions during idle induce a high level of oxidative stress in human aortic endothelial cells, due to the type of metals and trace metals found in the exhaust; furthermore Xia et al. (2015) argue that traffic-related UFPs act to promote airway inflammation due to the rich content of organic species. The relative importance of these particles in affecting human health merits further investigations.
Laboratory exhaust diesel UFP measurements are highly dependent on the sampling methods. Measurements of the UFP composition from a diesel-fuelled engine are still at an early stage; therefore, more effort should be put into developing sampling protocols that target the composition of the nucleation- and Aitken-mode particles in a realistic manner. There are no robust UFP chemical composition measurements at street scale and therefore such measurements devoted to address in detail the composition of the traffic emitted UFP in the atmosphere are urgently needed. Saturation vapour pressure is another source of large uncertainties; our study lays out a strategy to determine which vapour pressures are most significant in a given modelling scenario.
Please see Nikolova et al. (2018; https://doi.org/10.25500/eData.bham.00000275) for model code and output.
The supplement related to this article is available online at: https://doi.org/10.5194/acp-18-17143-2018-supplement.
The study was conceived by ARM, XC, and RMH; IN and JZ wrote code and ran model simulations; MSA and SZR provided laboratory data to compare with the model results; RMH and MSA provided field data to compare with the model results; all authors contributed to writing the paper.
The authors declare that they have no conflict of interest.
This work is part of the FASTER project, ERC-2012-AdG, proposal no. 320821
sponsored by the European Research Council (ERC). A. Rob MacKenzie, Jian
Zhong, and Mohammed Salim Alam gratefully acknowledge additional support from
the UK Natural Environment Research Council (NERC grant nos. NE/N003195/1 and
NE/P016499/1).
Edited by: Alma
Hodzic
Reviewed by: three anonymous referees
Alam, M. S, Rezaei, S. Z., Stark, C. P., Liang, Z., Xu, H. M., and Harrison, R. M.: The characterisation of diesel exhaust particles – composition, size distribution and partitioning, Faraday Discuss., 189, 69–84, 2016.
Alam, M. S., Zeraati-Rezaei, S., Liang, Z., Stark, C., Xu, H., MacKenzie, A. R., and Harrison, R. M.: Mapping and quantifying isomer sets of hydrocarbons (≥ C12) in diesel exhaust, lubricating oil and diesel fuel samples using GC × GC-ToF-MS, Atmos. Meas. Tech., 11, 3047–3058, https://doi.org/10.5194/amt-11-3047-2018, 2018.
Allen, L. R., Donahue, N. M., Shrivastava, M. K., Weitkamp, E. A., Sage, A. M., Grieshop, A. P., Lane, T. E., Pierce, J. R., and Pandis, S. N.: Rethinking organic aerosols: semivolatile emissions and photochemical aging, Science, 315, 1259–1262, 2007.
Atkinson, R. W., Fuller, G. W., Anderson, H. R., Harrison, R. M., and Armstrong, B.: Urban ambient particle metrics and health: a time-series analysis, Epidemiology, 21, 501–511, 2010.
Biswas, S., Ntziachristos, L., Moore, K. F., and Sioutas, C.: Particle volatility in the vicinity of a freeway with heavy-duty diesel traffic, Atmos. Environ., 41, 3479–3493, 2007.
Chan, A. W. H., Isaacman, G., Wilson, K. R., Worton, D. R., Ruehl, C. R., Nah, T., Gentner, D. R., Dallmann, T. R., Kirchstetter, T. W., Harley, R. A., Gilman, J. B., Kuster, W. C., de Gouw, J. A., Offenberg, J. H., Kleindienst, T. E., Lin, Y. H., Rubitschun, C. L., Surratt, J. D., Hayes, P. L., Jimenez, J. L., and Goldstein, A. H.: Detailed chemical characterization of unresolved complex mixtures in atmospheric organics:insights into emission sources, atmospheric processing, and secondary organic aerosol formation, J. Geophys. Res.-Atmos., 118, 6783–6796, 2013.
Chickos, J. and Lipkind, D.: Hypothetical thermodynamic properties: vapour pressures and vaporization enthalpies of the even n alkanes from C78 to C92 at T=298.15 K by correlation-gas chromatography, J. Chem. Eng. Data, 53, 2432–2440, 2008.
Compernolle, S., Ceulemans, K., and Müller, J.-F.: EVAPORATION: a new vapour pressure estimation methodfor organic molecules including non-additivity and intramolecular interactions, Atmos. Chem. Phys., 11, 9431–9450, https://doi.org/10.5194/acp-11-9431-2011, 2011.
Dall'Osto, M., Thorpe, A., Beddows, D. C. S., Harrison, R. M., Barlow, J. F., Dunbar, T., Williams, P. I., and Coe, H.: Remarkable dynamics of nanoparticles in the urban atmosphere, Atmos. Chem. Phys., 11, 6623–6637, https://doi.org/10.5194/acp-11-6623-2011, 2011.
Donahue, N. M., Robinson, A. L., Stanier, C. O., and Pandis, S. N.: Coupled partitioning, dilution, and chemical aging of semivolatile organics, Environ. Sci. Technol., 40, 2635–2643, 2006.
Grieshop, A. P., Miracolo, M. A., Donahue, N. M., and Robinson, A. L.: Constraining the Volatility Distribution and Gas-Particle Partitioning of Combustion Aerosols Using Isothermal Dilution and Thermodenuder Measurements, Environ. Sci. Technol., 43, 4750–4756, https://doi.org/10.1021/es8032378, 2009.
Harrad, S., Hassoun, S., Callen Romero, M. S., and Harrison, R. M.: Characterisation and source attribution of the semi-volatile organic content of atmospheric particles and associate vapour phase in Birmingham, UK, Atmos. Environ., 37, 4985–4991, 2003.
Harrison, R. M., Beddows, D. S., and Dall'Osto, M.: PMF analysis of wide-range particle size spectra collected on a major highway, Environ. Sci. Technol., 45, 5522–5528, 2011.
Harrison, R. M., Dall'Osto, M., Beddows, D. C. S., Thorpe, A. J., Bloss, W. J., Allan, J. D., Coe, H., Dorsey, J. R., Gallagher, M., Martin, C., Whitehead, J., Williams, P. I., Jones, R. L., Langridge, J. M., Benton, A. K., Ball, S. M., Langford, B., Hewitt, C. N., Davison, B., Martin, D., Petersson, K. F., Henshaw, S. J., White, I. R., Shallcross, D. E., Barlow, J. F., Dunbar, T., Davies, F., Nemitz, E., Phillips, G. J., Helfter, C., Di Marco, C. F., and Smith, S.: Atmospheric chemistry and physics in the atmosphere of a developed megacity (London): an overview of the REPARTEE experiment and its conclusions, Atmos. Chem. Phys., 12, 3065–3114, https://doi.org/10.5194/acp-12-3065-2012, 2012.
Harrison, R. M., Jones, A. M., Beddows, D. C. S., Dall'Osto, M., and Nikolova, I.: Evaporation of traffic-generated nanoparticles during advection from source, Atmos. Environ., 125, 1–7, 2016.
Jacobson, M. Z.: Development and application of a new air pollution modeling system, 2. Aerosol module structure and design, Atmos. Environ., 31, 131–144, 1997.
Jacobson, M. Z., Kittelson, D. B., and Watts, W. F.: Enhanced coagulation due to evaporation and its effect on nanoparticle evolution, Environ. Sci. Technol., 39, 9486–9492, 2005.
Joback, K. and Reid, R.: Estimation of Pure-component properties from group-contributions, Chem. Eng. Commun., 57, 233–243, 1987.
Julin, J., Winkler, P. M., Donahue, N. M., Wagner, P. E., and Riipinen, I.: Nera-unity mass accomodation coefficient of organic molecules of varying structure, Environ. Sci. Technol., 48, 12083–12089, 2014.
Karl, M., Kukkonen, J., Keuken, M. P., Lützenkirchen, S., Pirjola, L., and Hussein, T.: Modeling and measurements of urban aerosol processes on the neighborhood scale in Rotterdam, Oslo and Helsinki, Atmos. Chem. Phys., 16, 4817–4835, https://doi.org/10.5194/acp-16-4817-2016, 2016.
Karnezi, E., Riipinen, I., and Pandis, S. N.: Measuring the atmospheric organic aerosol volatility distribution: a theoretical analysis, Atmos. Meas. Tech., 7, 2953–2965, https://doi.org/10.5194/amt-7-2953-2014, 2014.
Kumar, P., Morawska, L., Birmili, W., Paasonen, P., Hu, M., Kulmala, M., Harrison, R. M., Norford, L., and Britter, R.: Ultrafine particles in cities, Environ. Intl., 66, 1–10, 2014.
Lemmon, E. W. and Goodwin, A. R. H.: Critical properties and vapour pressure equation for alkanes CnH2n+2: normal alkanes with n≤36 and isomers for n=4 through n=9, J. Phys. Chem. Ref. Data, 29, 1–39, 2000.
Li, R., Ning, Z., Majumdar, R., Cui, J., Takabe, W., Jen, N., Sioutas, C. and Hsiai, T.: Ultrafine particles from diesel vehicle emissions at different driving cycles induce differential vascular pro-inflamatory responses: implications of chemical components and NF-kB signaling, Part. Fibre Toxicol., 7, 6, https://doi.org/10.1186/1743-8977-7-6, 2010.
May, A. A., Presto, A. A., Hennigan, C. J., Nguyen, N. T., Gordon, T. D., and Robinson, A. L.: Gas-particle partitioning of primary organic aerosol emissions: (2) Diesel vehicles, Environ. Sci. Technol., 47, 8288–8296, 2013.
Myrdal, P. B. and Yalkowsky, S. H.: Estimating pure component vapor pressures of complex organic molecules, Ind. Eng. Chem. Res., 36, 2494–2499, 1997.
Nannoolal, Y., Rarey, J., Ramjugernath, D. and Cordes, W.: Estimation of pure component properties: Part 1. Estimation of the normal boiling point of non-electrolyte organic compounds via group contributions and group interactions, Fluid Phase Equilibr., 226, 45–63, 2004.
Nannoolal, Y., Rarey, J., and Ramjugernath, D.: Estimation of pure component properties: Part 3. Estimation of the vapor pressure of non-electrolyte organic compounds via group contributions and group interactions, Fluid Phase Equilibr., 269, 117–133, 2008.
Nikolova, I., Janssen S., Vos, P., Vrancken, K., Mishra, V., and Berghmans, P.: Dispersion modelling of traffic induced ultrafine particles in a street canyon in Antwerp, Belgium and comparison with observations, Sci. Total Environ., 412–413, 336–343, 2011.
Nikolova, I., MacKenzie, A. R., Cai, X., Alam, M. S., and Harrison, R. M.: Modelling component evaporation and coposition change of traffic-induced ultrafine particles during travel from street canyon to urban background, Faraday Discuss., 189, 529–546, 2016.
Nikolova, I., Zhong, J., Harrison, R. M., Alam, M. S., Zeraati Rezaei, S., Cai, X., and Mackenzie, A. R.: The influence of particle composition upon the evolution of urban ultrafine diesel particles on the neighbourhood scale, University of Birmingham data repository, https://doi.org/10.25500/eData.bham.00000275, 2018.
Pugh, T. A. M., MacKenzie, A. R., Whyatt, J. D., and Hewitt, C. N.: Effectiveness of green infrastructure for improvement of air quality in urban street canyons, Environ. Sci. Technol., 46, 7692–7699, 2012.
Robinson,. A. L., Donahue, N. M., Shrivastava, M. K., Weitkamp, E. A., Sage, A. M., Grieshop, A. P., Lane, T. E., Pierce, J. R., and Pandis, S. N.: Rethinking organic aerosols: semivolatile emissions and photochemical aging, Science, 315, 1259–1262, 2007.
Ronkko, T., Lahde, T., Heikkila, J., Pirjola, L., Bauschke, U., Arnold, F., Schager, H., Rothe, D., Yli-Ojanpera, J., and Keskinen, J.: Effects of Gaseous Sulphuric Acid on Diesel Exhaust Nanoparticle Formation and Characteristics, Environ. Sci. Technol., 47, 11882–11889, 2013.
Stein, S. E. and Brown, R. L.: Estimation of normal boiling points from group contributions, J. Chem. Inf. Comp. Sci., 34, 581–558, 1994.
Topping, D., Barley, M., Bane, M. K., Higham, N., Aumont, B., Dingle, N., and McFiggans, G.: UManSysProp v1.0: an online and open-source facility for molecular property prediction and atmospheric aerosol calculations, Geosci. Model Dev., 9, 899–914, https://doi.org/10.5194/gmd-9-899-2016, 2016.
US EPA: Estimation Programs Interface Suite™ for Microsoft® Windows, v 4.11, United States Environmental Protection Agency, Washington, DC, USA, 2017.
Wehner, B., Philippin, S., Wiedensohler, A., Scheer, V., and Vogt, R.: Variability of non-volatile fractions of atmospheric aerosol particles with traffic influence, Atmos. Environ., 38, 6081–6090, 2004.
Xia, M., Viera-Hutchins, L., Garcia-Lloret, M., Rivas, M. N., Wise, P., McGhee, S. A., Chatila, Z. K., Daher, N., Sioutas, C., and Chatila, T. A.: Vehicular exhaust particles promote allergic airway inflammation through an aryl hydrocarbon receptor-notch signaling cascade, J. Allergy Clin. Immun., 136, 441–453, 2015.