the Creative Commons Attribution 4.0 License.
the Creative Commons Attribution 4.0 License.
 | 19 Nov 2018
Source apportionment of carbonaceous aerosols in Xi'an, China: insights from a full year of measurements of radiocarbon and the stable isotope 13C
Haiyan Ni
Ru-Jin Huang
Junji Cao
Weiguo Liu
Ting Zhang
Meng Wang
Harro A. J. Meijer
Ulrike Dusek
Sources of organic carbon (OC) and elemental carbon (EC) in Xi'an, China, are investigated based on 1-year radiocarbon and stable carbon isotope measurements. The radiocarbon results demonstrate that EC is dominated by fossil sources throughout the year, with a mean contribution of 83±5 % (7±2 µg m−3). The remaining 17±5 % (1.5±1 µg m−3) is attributed to biomass burning, with a higher contribution in the winter (∼24 %) compared to the summer (∼14 %). Stable carbon isotopes of EC (δ13CEC) are enriched in winter ( ‰) and depleted in summer ( ‰), indicating the influence of coal combustion in winter and liquid fossil fuel combustion in summer. By combining radiocarbon and stable carbon signatures, relative contributions from coal combustion and liquid fossil fuel combustion are estimated to be 45 % (median; 29 %–58 %, interquartile range) and 31 % (18 %–46 %) in winter, respectively, whereas in other seasons more than one half of EC is from liquid fossil combustion. In contrast with EC, the contribution of non-fossil sources to OC is much larger, with an annual average of 54±8 % (12±10 µg m−3). Clear seasonal variations are seen in OC concentrations both from fossil and non-fossil sources, with maxima in winter and minima in summer because of unfavorable meteorological conditions coupled with enhanced fossil and non-fossil activities in winter, mainly biomass burning and domestic coal burning. δ13COC exhibited similar values to δ13CEC, and showed strong correlations (r2=0.90) in summer and autumn, indicating similar source mixtures with EC. In spring, δ13COC is depleted (1.1 ‰–2.4 ‰) compared to δ13CEC, indicating the importance of secondary formation of OC (e.g., from volatile organic compound precursors) in addition to primary sources. Modeled mass concentrations and source contributions of primary OC are compared to the measured mass and source contributions. There is strong evidence that both secondary formation and photochemical loss processes influence the final OC concentrations.
- Article
(1183 KB) - Full-text XML
-
Supplement
(2091 KB) - BibTeX
- EndNote


Carbonaceous aerosols, an important component of fine particulate matter (PM2.5, particles with aerodynamic diameter <2.5 µm) in almost all environments, have been identified as critical contributors to severe air pollution events (Cao et al., 2003; R. J. Huang et al., 2014; Elser et al., 2016; Liu et al., 2016a). In urban areas in China, they typically constitute 20 %–50 % of PM2.5 mass (Cao et al., 2007; R. J. Huang et al., 2014; Tao et al., 2017). Carbonaceous aerosols are of importance because they have adverse impacts on human health (Nel, 2005; Cao et al., 2012; Lelieveld et al., 2015) and climate (Chung and Seinfeld, 2002; Bond et al., 2013), in addition to air quality (Watson, 2002). Carbonaceous aerosols contain a large number of organic species and are operationally divided into organic carbon (OC) and elemental carbon (EC) (Pöschl, 2005). EC can significantly absorb incoming solar radiation and is the most important light-absorbing aerosol component (Bond et al., 2013). On the other hand, OC mainly scatters light, but there is also OC found with light absorbing properties, referred to as brown carbon (Pöschl, 2005; Laskin et al., 2015). Carbonaceous aerosols are believed to contribute large uncertainties in climate radiative forcing (IPCC, 2013). EC and OC are mainly emitted from incomplete combustion of biomass (e.g., wood, crop residues, and grass) and fossil fuels (e.g., coal, gasoline, and diesel). Biomass burning is the only non-fossil source for EC, but OC also has other sources, for example, biogenic emissions and cooking. Unlike EC that is exclusively emitted as primary aerosols, OC includes both primary and secondary OC, where secondary OC is formed in the atmosphere via atmospheric oxidation of volatile organic compounds from non-fossil (e.g., biomass burning, biogenic emissions, and cooking) and fossil sources (Jacobson et al., 2000; Pöschl, 2005; Hallquist et al., 2009). So far, sources and evolution of carbonaceous aerosols remain poorly characterized. A better understanding of OC and EC sources is important for the mitigation of particulate air pollution and improvement of our understanding of their role in climate radiative forcing.
Radiocarbon (14C) analyses of OC and EC allow a quantitative and unambiguous measurement of their fossil and non-fossil contributions, based on the fact that emissions from fossil sources are 14C-free, whereas non-fossil emissions contain the contemporary 14C content (e.g., Szidat, 2009; Dusek et al., 2013, 2017). The 14C∕12C ratio of an aerosol sample is usually reported as fraction modern (F14C). F14C relates the 14C∕12C ratio of the sample to the ratio of the unperturbed atmosphere in the reference year of 1950 (Stuiver and Polach, 1977; Mook and van der Plicht, 1999; Reimer et al., 2004). In practice, this is usually done by relating the 14C/12C ratio of the sample to the ratio of oxalic acid OXII calibration material multiplied by a factor of 0.7459:
where the 14C∕12C ratios of the sample and standard are both corrected for machine background and normalized for fractionation to to correct for isotopic fractionation during sample pre-treatment and measurements. Aerosol carbon from living material should have F14C∼1 in an undisturbed atmosphere, and carbon from fossil sources has F14C=0. However, F14C values of the contemporary (or non-fossil) carbon sources are bigger than 1 due to the nuclear bomb tests that nearly doubled the 14CO2 in the atmosphere in the 1960s and 1970s. Currently, F14C of the atmospheric CO2 is approximately 1.04 (Levin et al., 2010). This value is decreasing every year because the 14CO2 produced by bomb testing is taken up by oceans and the biosphere and diluted by 14C-free CO2 produced by fossil fuel burning. For biogenic aerosols, aerosols emitted from cooking as well as annual crops, F14C is close to the value of current atmospheric CO2. F14C of wood burning is higher than that because a significant fraction of carbon in the wood burned today was fixed during times when atmospheric 14C∕12C ratios were substantially higher than today. Estimates of F14C for wood burning are based on tree-growth models (e.g., Lewis et al., 2004; Mohn et al., 2008) and found to range from 1.08 to 1.30 (Szidat et al., 2006; Genberg et al., 2011; Gilardoni et al., 2011; Minguillón et al., 2011; Dusek et al., 2013). When F14C is measured on OC and EC separately, contributions from non-fossil and fossil sources to carbonaceous aerosols can be separated. Previous 14C measurements of carbonaceous aerosols in China found that EC in urban areas is dominated by fossil sources, which account for 66 %–87 % of EC mass, whereas OC is more influenced by non-fossil sources, with fossil sources accounting for only 35 %–67 % (Table 1). Despite a fair number of 14C studies in China in recent years, only a few 14C datasets have so far reported annual results and seasonal variations of OC and EC (Y. L. Zhang et al., 2014a, 2015b, 2017).
Table 1Relative fossil source contribution to OC and EC (ffossil(OC) and ffossil(EC) in percentage) in China.
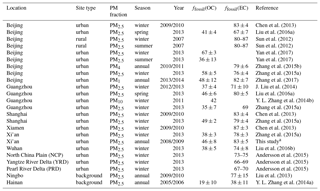
a The ffossil(OC) and ffossil(EC) values in this study are calculated from the F14C data (see details in Sect. 2.5).
In addition to 14C source apportionment, analysis of the stable carbon isotope composition (namely the 13C∕12C ratio, expressed as δ13C in Eq. 2) can provide further information regarding sources and atmospheric processing of carbonaceous aerosol (Bosch et al., 2014; Kirillova et al., 2014b; Andersson et al., 2015; Masalaite et al., 2017). Different emission sources have their own source signature: carbonaceous aerosol from coal combustion is enriched in 13C (i.e., has higher δ13C values of ‰ to −21 ‰) compared to aerosol from liquid fossil fuel combustion ( to −24 ‰) and from burning of C3 plants (δ13C ‰ to −24 ‰) (Andersson et al., 2015, and references therein). Complementing 14C source apportionment with 13C measurements allows a better constraint of the contribution of different emission sources to carbonaceous aerosols (Kirillova et al., 2013, 2014a; Bosch et al., 2014; Andersson et al., 2015; Winiger et al., 2015, 2016; Bikkina et al., 2016, 2017; Yan et al., 2017). For example, EC is inert to chemical or physical transformations; thus the δ13CEC preserves the signature of emission sources (L. Huang et al., 2006; Andersson et al., 2015; Winiger et al., 2015, 2016). EC from fossil sources (e.g., coal combustion, liquid fossil fuel burning) can be first separated from biomass burning by F14C of EC. Further, δ13C of EC allows separation of fossil sources into coal and liquid fossil fuel burning (Andersson et al., 2015; Winiger et al., 2015, 2016), due to their different source signatures. Typical δ13C values for EC from previous studies are summarized in Table S1 in the Supplement. The interpretation of the stable carbon isotope signature for OC source apportionment is more difficult because OC is chemically reactive and δ13C signatures of OC are not only determined by the source signatures but also influenced by atmospheric processing. During formation of secondary organic aerosol (SOA), molecules depleted in heavy isotopes are expected to react faster, leading to SOA depleted in δ13C compared to its gaseous precursors, if the precursor is only partially reacted (Anderson et al., 2004; Irei et al., 2006; Fisseha et al., 2009). For example, Irei et al. (2006) found that the δ13C values of particulate SOA formed by OH-radical-induced reactions of toluene ranged from −32.9 ‰ to −32.2 ‰, on average 5.8 ‰ lighter than those of parent toluene, when the 7 %–29 % toluene was reacted. On the other hand, photochemical aging of particulate organics leads to δ13C enrichment in the remaining aerosols due to a faster loss of the lighter carbon isotope 12C (Irei et al., 2011; Pavuluri and Kawamura, 2016). For example, Bosch et al. (2014) observed the more enriched δ13C signature of water-soluble OC ( ‰) than EC ( ‰) at a receptor station for the South Asian outflow, due to aging of OC during the long-range transport of aerosols.
We present, to the best of our knowledge, the first 1-year radiocarbon and stable carbon isotopic measurements to constrain OC and EC sources in China. PM2.5 samples were collected in Xi'an (33∘29′–34∘44′ N, 107∘40′–109∘49′ E), one of the most polluted megacities in the world (Zhang and Cao, 2015a). The aims of this study are (1) to quantify the contributions from fossil and non-fossil sources to OC and EC by radiocarbon measurements; (2) to further distinguish the fossil sources of EC into coal and liquid fossil fuel combustion by complementing radiocarbon with the stable carbon signature; (3) to assess the sources and atmospheric processing of OC qualitatively using its stable carbon signature. Further, mass concentrations and source contributions of primary OC are estimated based on the apportioned EC and compared with measured OC mass concentrations and source contributions to give insights into OC sources and formation mechanisms (4).
2.1 Sampling
Sampling was carried out at Xi'an High-Tech Zone (34.23∘ N, 108.88∘ E; ∼10 m above the ground), on a building rooftop of the Institute of Earth Environment, Chinese Academy of Sciences. The sampling site is surrounded by a residential area ∼15 km south of downtown and has no major industrial activities. Details about the sampling site can be found elsewhere (Bandowe et al., 2014; T. Zhang et al., 2014).
PM2.5 samples of 24 h duration (from 10:00 to 10:00 the next day, local standard time, LST) were collected every sixth day from 5 July 2008 to 27 June 2009 using a high-volume sampler (TE-6070 MFC, Tisch Inc., Cleveland, OH, USA) operating at 1.0 m3 min−1. PM2.5 samples were collected on Whatman quartz fiber filters (20.3 cm×25.4 cm, Whatman QM/A, Clifton, NJ, USA) that were pre-baked at 900 ∘C for 3 h to remove absorbed organic vapors (Watson et al., 2009; Chow et al., 2010). After sampling, we immediately removed the filter from the sampler. All filters were packed in pre-baked aluminum foil, sealed in polyethylene bags, and stored at in a freezer. To be consistent with previous studies (Han et al., 2016; T. Zhang et al., 2014), we designated 15 November to 14 March as winter, 15 March to 31 May as spring, 1 June to 31 August as summer, and 1 September to 14 November as autumn, based on the meteorological characteristics and the typical residential heating period. In total, 58 PM2.5 samples were collected, with 13 in spring, 15 in summer, 12 in autumn, and 18 in winter. Six samples with varying PM2.5 mass and carbonaceous aerosol loading were selected per season for 14C analysis. We selected the samples carefully to cover periods of low, medium, and high PM2.5 concentrations to get samples representative of the various pollution conditions that did occur in each season. The 24 selected samples are highlighted in Fig. S1 in the Supplement with their OC and EC concentrations. In total, there are 48 radiocarbon data, including 24 for OC and 24 for EC. Details on sample selection for 14C analysis are presented in the Supplement S1.
2.2 Organic carbon (OC), elemental carbon (EC), and source markers' measurement
Filter pieces of 0.5 cm2 were used to measure OC and EC using a Desert Research Institute (DRI) Model 2001 Thermal/Optical Carbon Analyzer (Atmoslytic Inc., Calabasas, CA, USA) following the IMPROVE_A (Interagency Monitoring of Protected Visual Environments) thermal/optical reflectance (TOR) protocol (Chow et al., 1993, 2007, 2011). Details of the OC∕EC measurement were described in Cao et al. (2005). The differences between the replicated analyses for the same sample (n=10) are smaller than 5 % for TC, 5 % for OC, and 10 % for EC, respectively.
Organic markers including levoglucosan, picene, and hopanes were quantified using gas chromatography–mass spectrometry (GC/MS). Water-soluble potassium (K+) was measured in water extracts using ion chromatography (Dionex 600, Thermal Scientific-Dionex, Sunnyvale, CA, USA). Details on the measurements are described in the Supplement S2.
2.3 Stable carbon isotopic composition of OC and EC
The stable carbon isotopic composition of OC and EC was determined using a Finnigan MAT 251 mass spectrometer with a dual inlet system (Bremen, Germany) at the Stable Isotope Laboratory at the Institute of Earth Environment, Chinese Academy of Sciences. For OC, filter pieces were heated at 375 ∘C for 3 h in a vacuum-sealed quartz tube in the presence of CuO catalyst grains. The evolved CO2 from OC was isolated by a series of cold traps and quantified manometrically. The stable carbon isotopic composition of the CO2 was determined as δ13COC by offline analysis with a Finnigan MAT-251 mass spectrometer. Extraction of EC was done by heating the carbon that remained on the filters at 850 ∘C for 5 h. The resulting CO2 was purified in cold traps and then quantified as the EC fraction. The isotopic ratios of the purified CO2 of EC were measured and determined as δ13CEC. A routine laboratory working standard with a known δ13C value was measured every day. The quantitative levels of 13C and 12C isotopes were characterized using a ratio of peak intensities of m∕z 45 (13C16O2) and 44 (12C16O2) in the mass spectrum of CO2. Samples were analyzed at least in duplicate, and all replicates showed differences less than 0.3 ‰. δ13C values are reported in the delta notation as per mil (‰) differences with respect to the international standard Vienna Pee Dee Belemnite (V-PDB):
V-PDB is the primary reference material for measuring natural variations of 13C isotopic content. It is composed of calcium carbonate from a Cretaceous belemnite rostrum of the Pee Dee Formation in South Carolina, USA. Its absolute isotope ratio 13C∕12C (or ) is 0.0112372, and it is established as δ13C value =0. Details of stable carbon isotope measurements are described in our previous studies (Cao et al., 2008, 2011, 2013).
2.4 Radiocarbon (14C) measurement of OC and EC
2.4.1 Combustion of OC, EC, and standards
OC and EC were extracted separately by our aerosol combustion system (ACS) (Dusek et al., 2014). In brief, the ACS consists of a combustion tube, in which aerosol filter pieces are combusted at different temperatures in pure O2, and a purification line at which the resulting CO2 is isolated and separated from other gases, such as water vapor and NOx. The purified CO2 is then stored in flame-sealed ampoules until graphitization.
OC is combusted by heating filter pieces at 375 ∘C for 10 min. EC is combusted after complete OC removal. To remove OC completely, water-soluble OC is first removed from the filter by water extraction (Dusek et al., 2014) to minimize charring of organic material (Yu et al., 2002). Subsequently, most water-insoluble OC is removed by heating the filter pieces at 375 ∘C for 10 min. Then the oven temperature is increased to 450 ∘C for 3 min, and in this step a mixture of the most refractory OC and less refractory EC is removed from the filter. The remaining EC is then combusted by heating at 650 ∘C for 5 min (Zenker et al., 2017).
Two standards with known 14C content are combusted as quality control for the combustion process: an oxalic acid standard and a graphite standard. Small amounts of solid standard material are directly put on the filter holder of the combustion tube and heated at 650 ∘C for 10 min. In the further 14C analysis, the CO2 derived from combustion of the standards is treated exactly like the samples. Therefore, the contamination introduced by the combustion process can be estimated from the deviation of measured values from the nominal values of the standards. The contamination is below 1.5 µg C per combustion, which is relatively small compared with the samples ranging between 50 and 270 µg C in this study.
2.4.2 14C analysis of OC and EC
Graphitization and AMS measurements were conducted at the Centre for Isotope Research (CIO) at the University of Groningen. The extracted CO2 is reduced to graphite by reaction with H2 (g) at a molecular ratio H2∕CO2 of 2 using a porous iron pellet as a catalyst at 550 ∘C (de Rooij et al., 2010). The water vapor from the reduction reaction is cryogenically removed using Peltier cooling elements. The yield of graphite is higher than 90 % for samples of >50 µg C. Graphite formed on the iron pellet is then pressed into a 1.5 mm target holder, which is introduced into the AMS system for subsequent measurement. The AMS system (van der Plicht et al., 2000) is dedicated to 14C analysis, and simultaneously measures 14C∕12C and 13C∕12C ratios.
Varying amounts of reference materials covering the range of sample mass are graphitized and analyzed together with samples in the same wheel of AMS. Two such materials with known 14C content are used: the oxalic acid OXII calibration material (F14C=1.3406) and a 14C-free CO2 gas (F14C=0). The differences between measured and nominal F14C values are used to correct the sample values (de Rooij et al., 2010; Dusek et al., 2014) for contamination during graphitization and AMS measurement (Supplement S3). The modern carbon contamination is between 0.35 and 0.50 µg C, and the fossil carbon contamination is around 2 µg C for samples bigger than 100 µg C.
2.5 Source apportionment methodology using 14C
F14C of EC (F14C(EC)) was converted to the fraction of biomass burning (fbb(EC)) by dividing with F14C of biomass burning (F14C; Lewis et al., 2004; Mohn et al., 2008; Palstra and Meijer, 2014) given that biomass burning is the only non-fossil source of EC, to eliminate the effect from nuclear bomb tests in the 1960s. EC is primarily produced from biomass burning (ECbb) and fossil fuel combustion (ECfossil), and absolute EC concentrations from each source can be estimated once fbb(EC) is known:
Analogously, F14C of OC (F14C(OC)) was converted to the fraction of non-fossil OC (fnf(OC)) by dividing the F14C of non-fossil sources including both biogenic and biomass burning (F14C; Lewis et al., 2004; Levin et al., 2010; Y. L. Zhang et al., 2014a). The lower limit of 1.04 corresponds to current biospheric sources as the source of OC, and the upper limit corresponds to burning of wood as the main source of OC, with only little input from annual crops. OC can be apportioned between OC from non-fossil sources (OCnf) and from fossil-dominated combustion sources (OCfossil) using fnf(OC):
A Monte Carlo simulation with 10 000 individual calculations was conducted to propagate uncertainties. For each individual calculation, F14C(OC), F14C(EC), OC, and EC concentrations are randomly chosen from a normal distribution symmetric around the measured values, with the experimental uncertainties as standard deviation (SD). Random values for for F14Cbb and F14Cnf are chosen from a triangular frequency distribution, with its maximum at the central value, and 0 at the lower limit and upper limit. In this way 10 000 different estimations of fbb(EC), fnf(OC), ECbb, ECfossil, OCnf, and OCfossil can be calculated. The derived average represents the best estimate, and the standard deviation represents the combined uncertainties.
2.6 Source apportionment of EC using Bayesian statistics
F14C and δ13C signatures of EC and a mass balance calculation were used in combination with a Bayesian Markov chain Monte Carlo (MCMC) scheme to further constrain EC sources into biomass burning (fbb), liquid fossil fuel combustion (fliq.fossil), and coal combustion (fcoal):
where f represents the fraction of EC mass contributed by a given source, and subscripts denote investigated sources; “bb” denotes biomass burning, “liq.fossil” is liquid fossil, and “coal” is fossil coal. F14C(EC) is included in this model which allows the contribution from biomass (fbb) to be separated from fossil sources (fliq.fossil and fcoal). F14Cbb is the F14C of biomass burning (1.10±0.05 as mentioned in Sect. 2.5). F14Cliq.fossil and F14Ccoal are zero due to the long-term decay. δ13Cbb, δ13Cliq.fossil, and δ13Ccoal are the δ13C signature of EC emitted from biomass burning, liquid fossil fuel combustion, and coal combustion, respectively. The means and the standard deviations for δ13Cbb ( ‰ for C3 plants, and ‰ for corn stalk), δ13Cliq.fossil ( ‰), and δ13Ccoal ( ‰) are presented in Table S1 (Andersson et al., 2015, and reference therein; Sect. 4.3.1), and serve as input for MCMC. The source endmembers for δ13C are less well constrained than for F14C, as δ13C varies with fuel types and combustion conditions. For example, the range of possible δ13C values for liquid fossil fuel combustion overlaps to a small extent with the range for coal combustion, although liquid fossil fuels are usually more depleted than coal. The MCMC technique takes into account the variability in the source signatures of F14C and δ13C (Table S1), where δ13C introduces a larger uncertainty than F14C. Uncertainties of both source endmembers for each source and the measured ambient δ13CEC and F14C(EC) are propagated.
MCMC-driven Bayesian approaches have been recently implemented to account for multiple sources of uncertainties and variabilities for isotope-based source apportionment applications (Parnell et al., 2010; Andersson, 2011). MCMC works by repeatedly guessing the values of the source contributions and finding those values which fit the data best. The initial guesses are usually poor and are discarded as part of an initial phase known as the burn-in. Subsequent iterations are then stored and used for the posterior distribution. MCMC was implemented in the freely available R software (https://cran.r-project.org/, last access: 15 May 2016), using the simmr package (https://CRAN.R-project.org/package=simmr, last access: 14 June 2017). Convergence diagnostics were created to make sure the model has converged properly. The simulation for each sample was run with 10 000 iterations, using a burn-in of 1000 steps, and a data thinning of 100.
3.1 Temporal variation of OC and EC mass concentrations
During the sampling period, extremely high OC and EC mass concentrations were sometimes observed (Fig. S1). OC mass concentrations ranged from 3.3 to 67.0 µg m−3, with an average of 21.5 µg m−3. EC mass concentrations ranged from 2 to 16 µg m−3, with an average of 7.6 µg m−3 (Table S2). OC and EC mass concentrations were comparable to those reported in previous studies for Xi'an, which had an average of 19.7±10.7 µg m−3 (average±standard deviation) OC and 8.0±4.7 µg m−3 EC from March 2012 to March 2013 (Han et al., 2016).
OC and EC concentrations showed a clear seasonal variation, with higher concentrations in cold periods than those in warm periods. The differences between winter and summer concentrations were significant (p<0.05). The mean winter to summer concentration ratios were 3 for OC and 1.5 for EC. Similar seasonal trends of OC and EC were also observed in Xi'an, China, in earlier studies (e.g., Han et al., 2016; Niu et al., 2016).
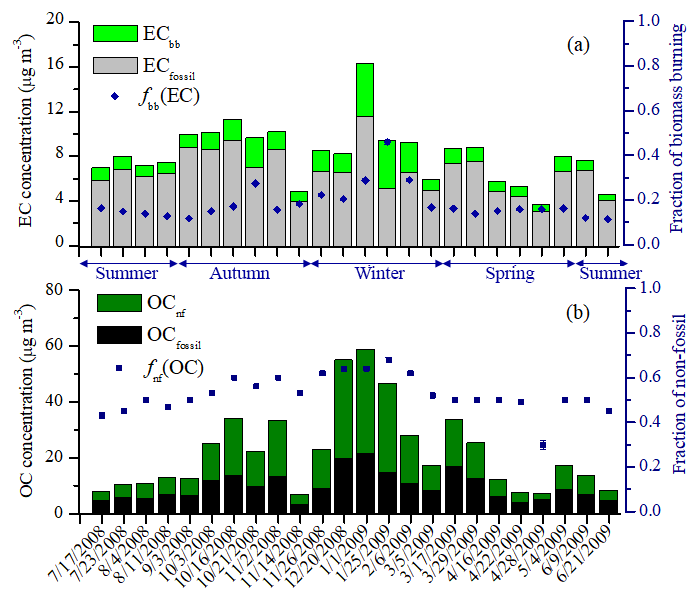
Figure 1(a) Temporal variation of EC mass concentrations from biomass burning (ECbb) and fossil fuel combustion (ECfossil), and fraction of biomass burning contribution to EC (fbb(EC)). (b) Temporal variation of OC mass concentrations from non-fossil sources (OCnf) and fossil sources (OCfossil), and fraction of non-fossil OC to total OC (fnf(OC)).
3.2 Temporal variation of fossil and non-fossil fractions of OC and EC
To investigate the sources of OC and EC, 24 samples representing different loadings of carbonaceous aerosols from different seasons were selected for radiocarbon measurement (Supplement S1, Fig. S2, Table S3). The highest biomass burning contribution to EC (fbb(EC)) of 46 % was detected on 25 January 2009 (Fig. 1a). This can be related to enhanced biomass burning emissions indicated by the comparably high biomass-indicative levoglucosan∕EC ratio, and relatively low fossil fuel associated Σhopanes∕EC ratio and picene∕EC ratio (Supplement S2 and Fig. S3), along with unfavorable meteorological conditions (e.g., substantially low wind speed (∼1 m s−1) and low temperature (−0.5 ∘C)). The highest non-fossil contribution to OC (fnf(OC)) of 70 % was observed on the same day. Note that 25 January 2009 was Chinese New Year's Eve with many fireworks. Since the influence of fireworks on the F14C signature is not known yet, the following source apportionment will not include Chinese New Year's Eve.
EC is predominantly influenced by fossil sources, with the relative contribution of fossil fuel to EC (ffossil(EC)) ranging from 71 % to 89 %, with an annual average of 83±5 %. Lower ffossil(EC) values were observed in winter (77±5 %) compared with other seasons. This is due to the substantial contribution from biomass burning to EC in winter, with a larger fbb(EC) in winter (23±5 %) than other seasons (14±2 %, 16±1 %, and 18±5 % in summer, spring, and autumn, respectively; Fig. 1a). This is consistent with the evaluated levoglucosan∕EC ratios observed in winter (96 ng µg−1), 1.6 times higher than that of the yearly average (Fig. S3). The lowest fbb(EC) in summer (14±2 %) suggests the importance of fossil fuel combustion for EC concentrations. Since the residential usage of coal in summer is much reduced compared with other seasons, we can expect higher contribution from vehicle emissions than coal burning to fossil EC in summer. EC concentrations from fossil fuel (ECfossil) varied by a factor of 4, ranging from 3.1 to 11.6 µg m−3, with a mean of 6.7±2.0 µg m−3, which was 4 times higher than averaged biomass burning EC concentrations (EC µg m−3). A stronger variation was observed in the ECbb, varying 9-fold from 0.5 to 4.7 µg m−3 (Tables S4, S5).
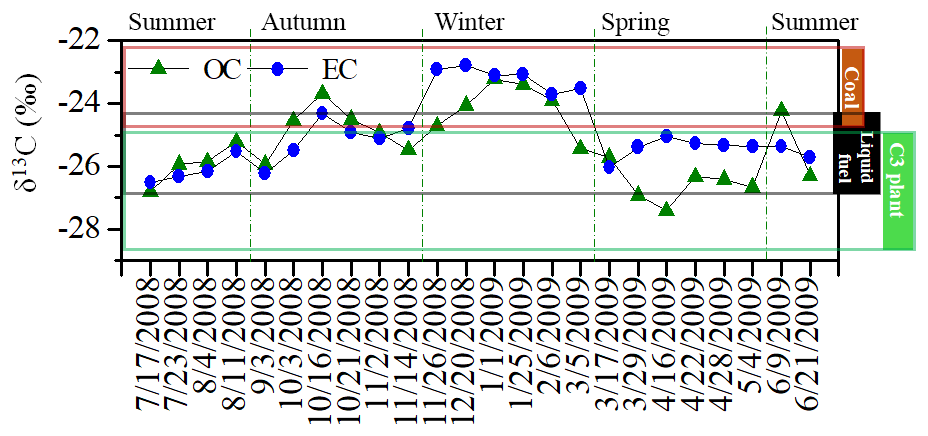
Figure 2Stable carbon signatures (δ13C) in OC and EC for the samples selected for 14C measurements. The δ13C signatures of burning C3 plants (green rectangle), liquid fossil fuel (e.g., oil, diesel, and gasoline, black rectangle), and coal (brown rectangle) are indicated as mean±standard deviation in Table S1. The δ13C endmember ranges for C4 plant burning ( ‰; Table S1) are much more enriched than other sources, and are not shown in this figure.
The relative contribution of non-fossil sources to OC (fnf(OC)) ranged from 31 % to 66 %, with an annual average of 54±8 %, which was larger than that to EC (yearly average of 17±5 %). Higher fnf(OC) was observed in winter (62±5 %) and autumn (57±4 %), compared to summer and spring, when about half of OC was contributed by non-fossil sources (48±3 % and 48±8 %, respectively; Table S5). The lowest fnf(OC) of 31 % was detected on 28 April 2009 (Fig. 1b), caused by the enhanced fossil emissions indicated by the highest Σhopanes∕EC ratio (5 ng µg−1; Fig. S3). Averaged OC concentration from non-fossil sources (OCnf) was 12±10 µg m−3, ranging from 2.3 to 38.6 µg m−3. OC concentrations from fossil sources (OCfossil) varied from 3.2 to 20.4 µg m−3, with an average of 9.0±4.8 µg m−3. Clear seasonal variations were seen in OC concentrations both from fossil and non-fossil sources, with maxima in winter (OC µg m−3, OC µg m−3) and minima in summer (OC µg m−3, OC µg m−3) because of enhanced fossil and non-fossil activities in winter, mainly biomass burning and domestic coal burning (Cao et al., 2009, 2011; Han et al., 2010, 2016).
3.3 13C signature of OC and EC
The δ13CEC preserves the signature of emission sources, as EC is inert to chemical or physical transformations (Huang et al., 2006; Andersson et al., 2015; Winiger et al., 2015, 2016). Major EC sources in Xi'an include biomass burning, coal combustion, and liquid fossil fuel (e.g., diesel and gasoline) combustion (i.e., vehicular emissions) (Cao et al., 2005, 2009, 2011; Han et al., 2010; Wang et al., 2016). C3 plants and C4 plants, biomass subtypes, have a different δ13C signature. Aerosols from burning C4 plants are more enriched in δ13C ( ‰) than C3 plants ( ‰, Table S1). C3 plants are the dominant biomass type (e.g., wood, wheat straw) in northern China (Cheng et al., 2013; Cao et al., 2016). This is also evident from our observation that δ13C values of the ambient aerosol fall within the range of C3 plant, coal, and liquid fossil fuel combustion (i.e., vehicular emissions; Fig. 2).
The annually averaged δ13CEC is ‰, varying between −26.5 ‰ and −22.8 ‰. Considerable seasonal variation is observed, suggesting a shift among combustion sources. The δ13CEC signature for winter ( ‰) is clearly located in the δ13C range for coal combustion ( ‰, Table S1), and is more enriched compared to other seasons. This indicates a strong influence of coal combustion in winter, but the 14C values indicate that coal combustion cannot be the only source of EC. Moreover, the δ13CEC values in winter ranging from −23.7 ‰ to −22.8 ‰ are at the higher (i.e., enriched) end of coal combustion, indicating some additional contributions from C4 plants, such as corn stalk burning. In northern China, large quantities of coal are used for heating during a formal residential “heating season” in winter (Cao et al., 2007), and in rural Xi'an, burning corn stalks (C4 plant) in the “heated kang” (Zhuang et al., 2009) is a traditional way of heating in winter (Sun et al., 2017). The most depleted δ13CEC values in summer ( ‰) and spring ( ‰) fall into the overlap of liquid fossil fuel emission ( ‰) and C3 plant combustion ( ‰, Fig. 2), when little or no coal is used for residential heating but there are some coal emissions from industries. As the biomass burning contribution to EC in summer and spring is relatively low (14±2 % and 16±1 %, respectively), we can expect that liquid fossil fuel combustion dominates EC emissions. δ13CEC signatures in autumn ( ‰) fall in the overlapped area of C3 plant, liquid fossil fuel, and coal, implying that EC is influenced by the mixed sources.
δ13COC was in general similar to δ13CEC. This suggests that biogenic OC is probably not very important, as could be expected from the high TC concentrations. 14C analysis indicates a considerably higher fraction of non-fossil OC than non-fossil EC, and it would seem that this is mainly related to the biomass burning, which has higher OC∕EC ratios than fossil fuel burning. If the contribution of biogenic OC plays an important role, then the biogenic δ13C signatures should be relatively similar to the source mixture of EC, which is rather unlikely, especially as this source mixture is not constant. δ13COC varies from −27.4 ‰ to −23.2 ‰, with an annual average of ‰ (Fig. 2). This range overlaps with C3 plants, liquid fossil fuel, and coal combustion. Influence from marine sources ( ‰; Chesselet et al., 1981; Miyazaki et al., 2011) should be minimal, as Xi'an is a far inland city in China. δ13COC shows a similar seasonal variation pattern to δ13CEC. δ13COC is most enriched in winter ( ‰), followed by autumn ( ‰), summer ( ‰), and spring ( ‰). In addition to source mixtures, atmospheric processing also influences δ13COC (Irei et al., 2006, 2011; Fisseha et al., 2009). In spring, δ13COC is much more depleted than δ13CEC (1.1 ‰–2.4 ‰), indicating the importance of the secondary formation of OC (e.g., from volatile organic compound precursors) in addition to primary sources (Anderson et al., 2004; Iannone et al., 2010). In summer and autumn 2008, δ13COC was very similar to δ13CEC (Table S3), and showed strong correlations (r2=0.90), indicating that OC originates from a similar source mixture as EC. There are no depleted δ13COC values in summer and autumn as would be expected from significant secondary OC formation. In summer this could be partially due to the high temperature: (i) high temperature favors equilibrium shifts to the gas phase, and the SOA less efficiently partitions to the particle phase; (ii) aging processes also intensify which causes enriched δ13COC in the particle phase. This is further discussed in Sect. 4.5.
4.1 Aerosol characteristics in Xi'an compared to other Chinese cities
There are few annual 14C measurements in China (Table 1). The annual average ffossil(EC) derived from 14C data in Xi'an is 83 %. This falls in the range of annual ffossil(EC) measured in China, depending on the location. Comparable annual ffossil(EC) was reported at an urban site of Beijing (79±6%; Zhang et al., 2015b; 82±7 %; Zhang et al., 2017) and a background receptor site of Ningbo (77±15 %; Liu et al., 2013). Much lower ffossil(EC) was found at a regional background site in Hainan (38±11 %; Y. L. Zhang et al., 2014a). The big differences between the two background sites are due to different air mass transport to the receptor site. The background site in Ningbo was more often influenced by air masses transported from highly urbanized regions of eastern China associated with lots of fossil fuel combustion, whereas the decreased fossil contribution observed in Hainan could be attributed to enhanced open burning of biomass in Southeast Asia or southeastern China.
In this study, ffossil(EC) was lowest in winter (77 %). This is comparable with previously reported ffossil(EC) in Xi'an at the same sampling site during winter 2013 (78±3 %; Zhang et al., 2015a), Shanghai (79±4 %; Zhang et al., 2015a), Wuhan (74±8 %; Liu et al., 2016b), North China Plain (73 %–75 %; Andersson et al., 2015), and Guangzhou (71±10 %; J. Liu et al., 2014). Higher ffossil(EC) in winter was reported for Beijing (80 %–87%; Sun et al., 2012; 83±4 %; Chen et al., 2013) and Xiamen (87±3 %; Chen et al., 2013). Lower winter ffossil(EC) was observed in Guangzhou (69 %; Zhang et al., 2015a), Yangtze River Delta (66 %–69 %; Andersson et al., 2015), and Pearl River Delta (67 %–70 %; Andersson et al., 2015), indicating different influence of biomass burning emissions over China during winter. 14C measurements in other seasons are still very scarce in China.
The annual average ffossil(OC) in Xi'an is 46 %, with the lowest values in winter (38 %) and the highest in summer (52 %). The annual average ffossil(OC) in this study is comparable to the results found at an urban site of Beijing (48±12 %) (Zhang et al., 2017), but higher than 19±10 % at a background site of Hainan (Y. L. Zhang et al., 2014a). Similar contributions from fossil sources to OC were reported for the same sampling site in Xi'an in winter 2013 (38±3%; Zhang et al., 2015a), Wuhan in January 2013 (38±5 %; Liu et al., 2016b), and Guangzhou in winter 2012/2013 (37±4 %; J. Liu et al., 2014). A higher fossil contribution to OC was found in Beijing with ffossil(OC) of 58±5 % in winter 2013 and 59±6 % in winter 2013/2014 (Zhang et al., 2015a, 2017), and in Shanghai with ffossil(OC) of 49±2 % in winter 2013 (Zhang et al., 2015a). Previous studies in Beijing observed different seasonal trends, with a higher contribution of fossil sources in winter (higher ffossil(OC)) than in other seasons (Yan et al., 2017; Zhang et al., 2017). This is consistent with findings using online aerosol mass spectrometer analysis in winter 2013/2014 (Elser et al., 2016) that organic matter in Xi'an was found to be dominated by biomass burning, in contrast to Beijing where it is dominated by coal burning. This implies different pollution patterns over Chinese cities.
The δ13CEC is most enriched in winter ( ‰), and most depleted in summer ( ‰). This is consistent with previous studies in northern China, with the winter–summer difference ranging from 0.76 ‰ to 2.79 ‰ for all the seven northern Chinese cities (e.g., Cao et al., 2011; Table S6), supporting the important influence on EC from coal combustion in winter. By contrast, no notable difference between winter and summer δ13CEC is reported in southern China, where there is no official heating season. (e.g., Ho et al., 2006; Cao et al., 2011; Table S6). δ13COC showed a seasonal variation pattern similar to δ13CEC. δ13COC is most enriched in winter ( ‰), comparable with previously reported winter data in northern China, for example, Beijing ( ‰) by Yan et al. (2017), and seven northern cities in China (−25.54 ‰ to −23.08 ‰) by Cao et al. (2011), but our winter δ13COC is more enriched than those found in southern China, for example, Hong Kong ( ‰) by Ho et al. (2006), and seven southern cities in China (−26.62 ‰ to −25.79 ‰) by Cao et al. (2011) (Table S6). The differences in northern and southern China reveal the influence of coal burning on OC.
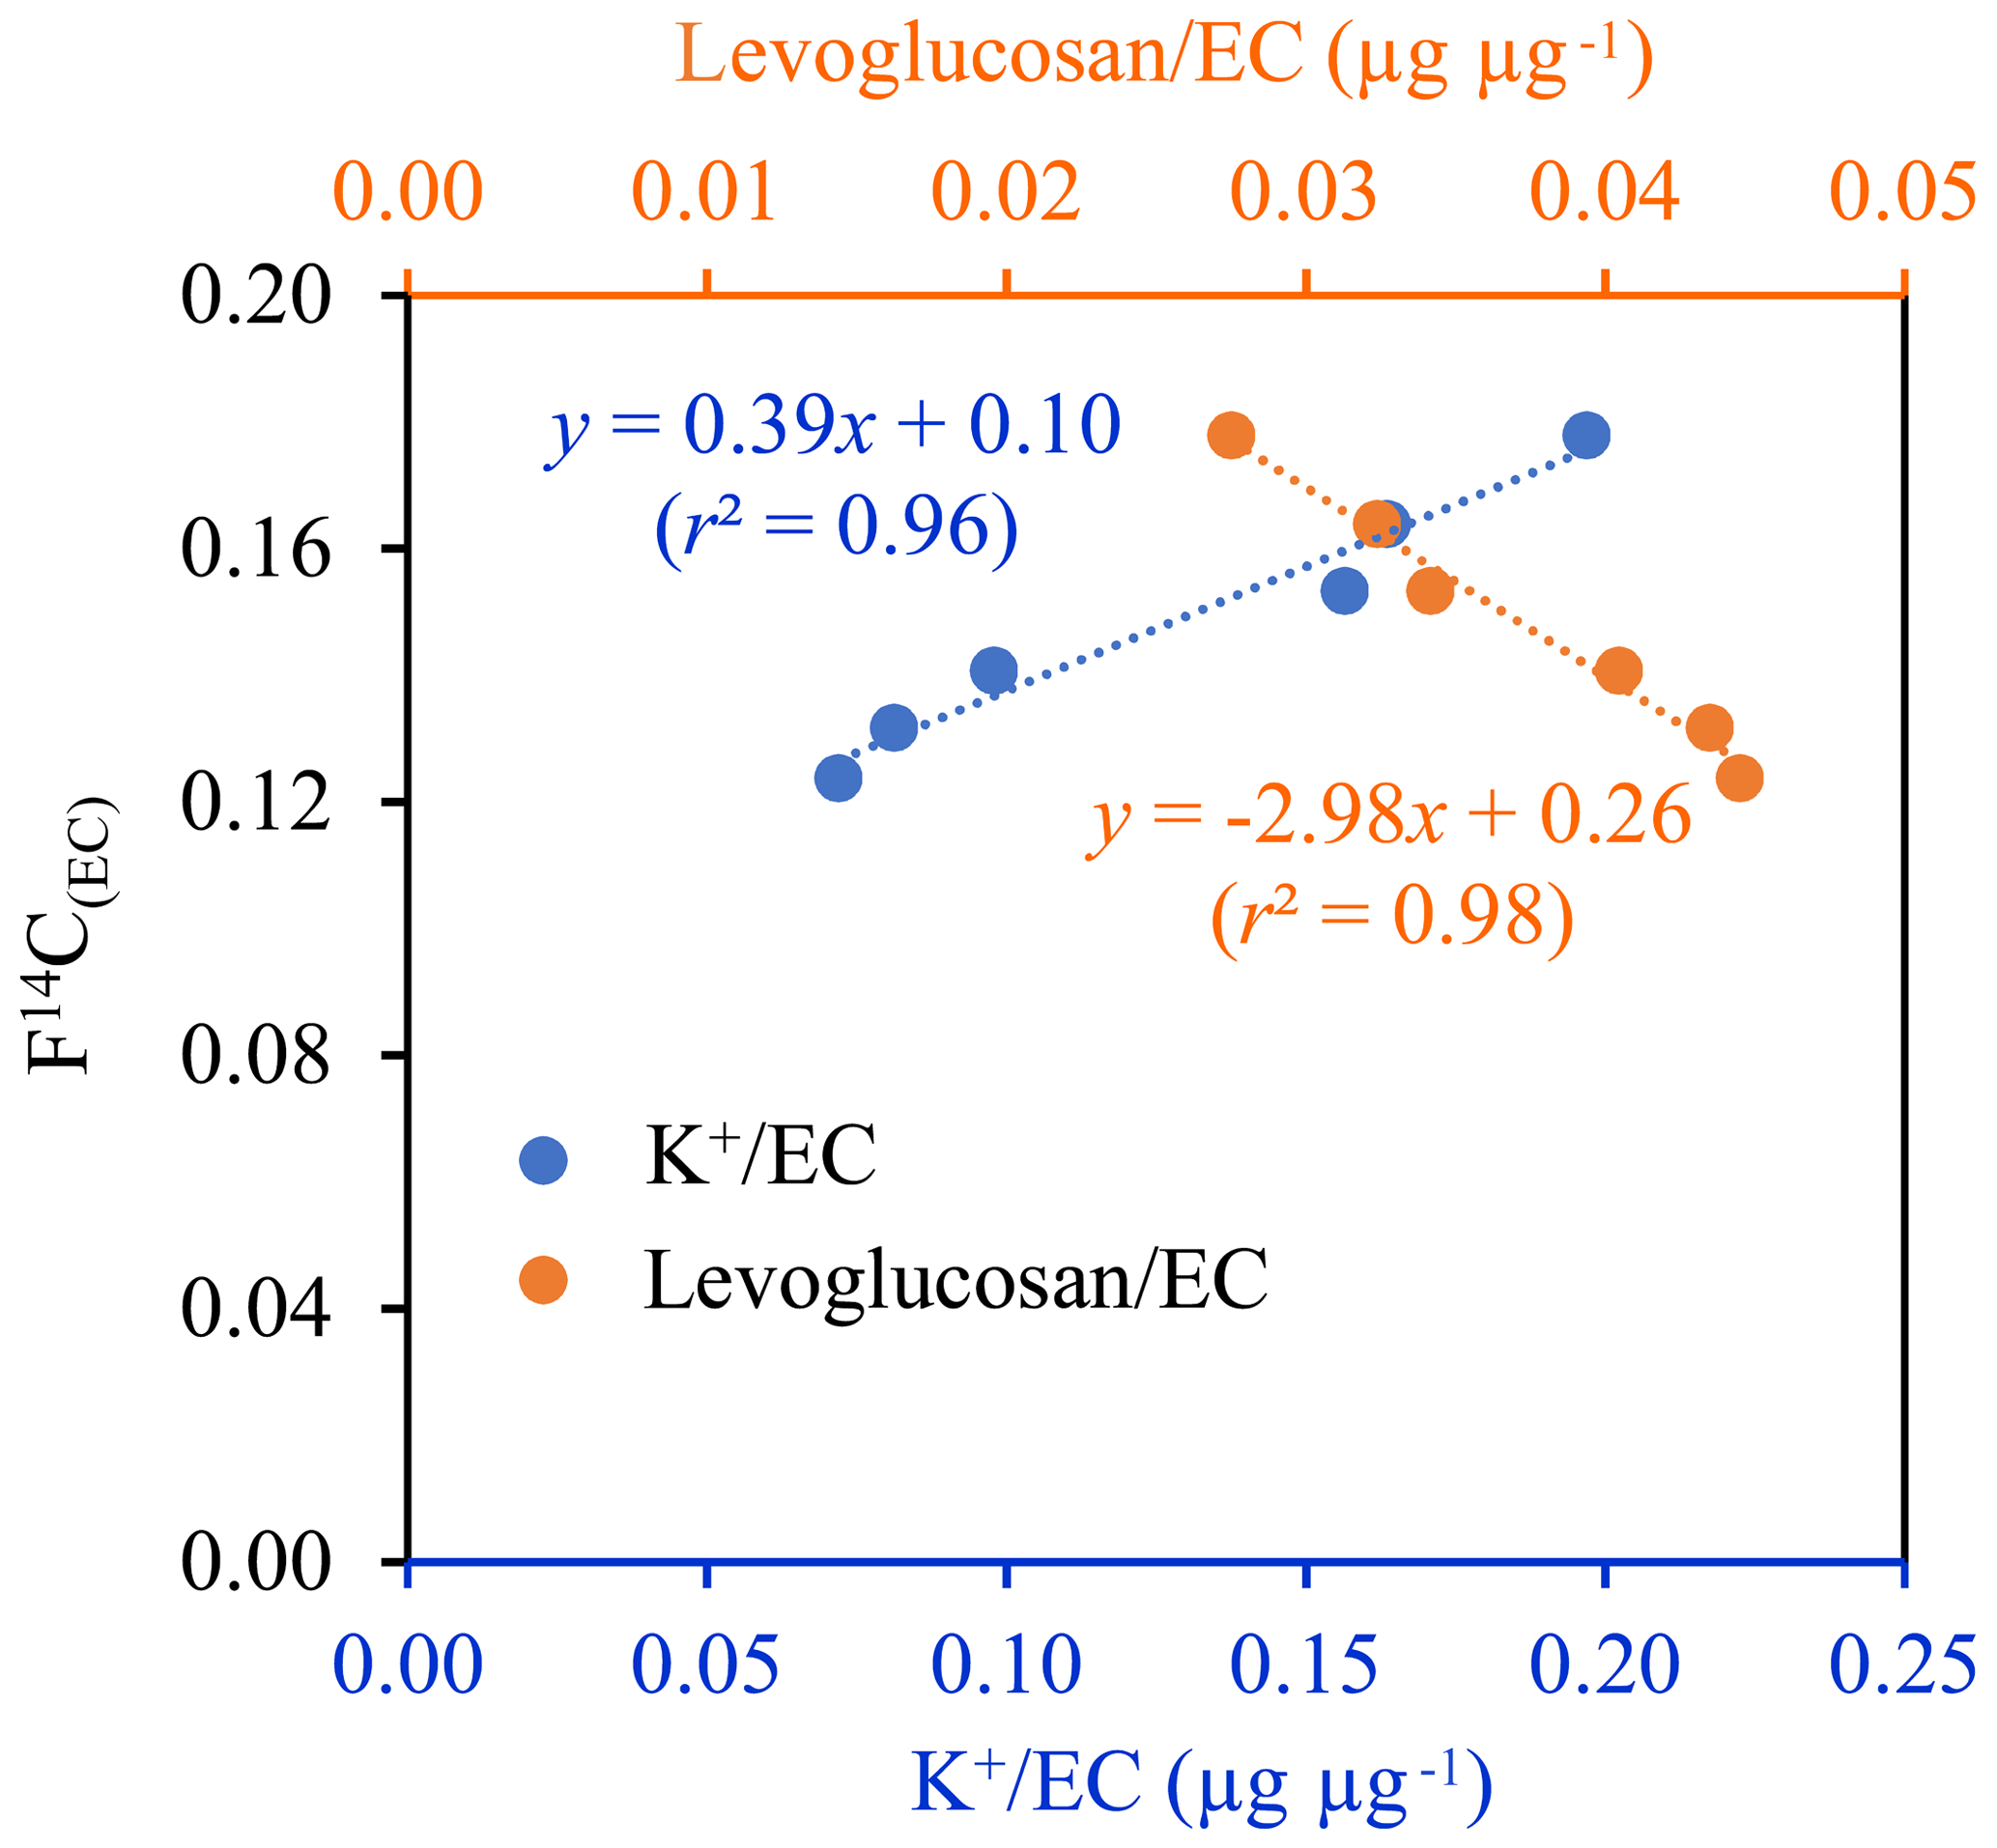
Figure 3Correlation between F14C(EC) and ratios and levoglucosan∕EC ratios in summer. Data in other seasons are presented in Fig. S5.
4.2 Correlations between F14C(EC) and biomass burning markers
In 14C-based source apportionment, biomass burning is considered the only source of non-fossil EC. Here we evaluate F14C(EC) with other biomass burning markers, including levoglucosan and water-soluble potassium (K+). In summer, a very strong positive correlation (r2=0.96) was found between F14C(EC) and ratios, in contrast to the significant negative correlation (r2=0.98) between F14C(EC) and levoglucosan∕EC ratios (Fig. 3). Previous studies have found that burning of crop residues emitted more K+ than levoglucosan, with significantly lower ratios than burning of wood (Cheng et al., 2013; Zhu et al., 2017). The ratio for wood is 24.0±1.8, much higher than those for crop residues (0.10±0.00 for wheat straw, 0.21±0.08 for corn straw, 0.62±0.32 for rice straw; Cheng et al., 2013). Emissions from crop residue burning therefore increase both the fraction of EC from non-fossil sources and K+. This results in a positive correlation between ratios and F14C(EC). At the same time emissions from crop residue burning contain relatively little levoglucosan, and atmospheric levoglucosan concentrations are expected to be dominated by wood burning emissions. If wood burning emissions stay relatively constant, an increase in crop burning emissions will increase EC concentrations, but have little effect on levoglucosan concentrations, leading to lower levoglucosan∕EC ratios. The significant positive correlation of F14C(EC) with ratios coinciding with a negative correlation of F14C(EC) with levoglucosan∕EC ratios in summer therefore suggests strong impacts from crop residues' burning and little influence from wood burning on the variability of EC. Variable crop burning activities superimposed on a relatively constant background contribution from wood burning can explain the observed correlations. In summer, extensive open burning in croplands is also detected in the MODIS fire counts map (NASA, 2017) (Fig. S4), when farmers in the surrounding area of Xi'an (i.e., Guanzhong Plain) burned crop residues in fields. No significant correlations of F14C(EC) with or levoglucosan∕EC were found in other seasons (Fig. S5), suggesting a changing mixture of biomass subtypes with different ratios. In this case, the same amount of non-fossil carbon contribution in EC (i.e., same F14C(EC)) can be associated with very different and levoglucosan∕EC ratios, depending on which type of biomass is dominating at a given time.
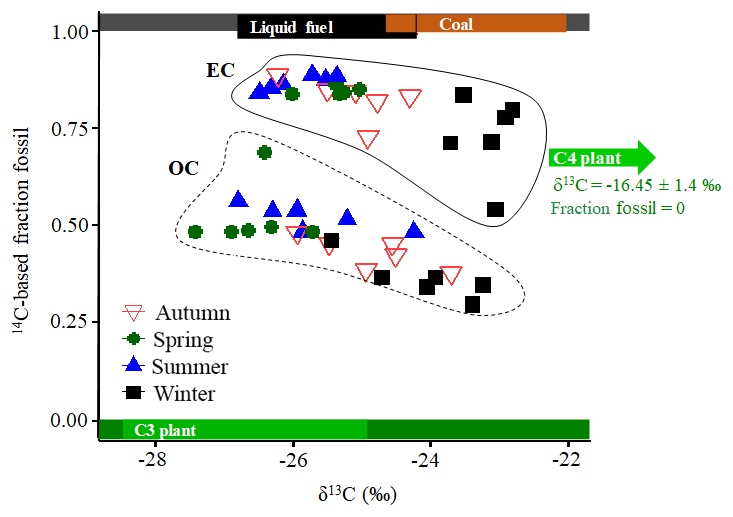
Figure 4Two-dimensional isotope-based source characterization plot of OC and EC in different seasons. The fraction fossil (ffossil(EC) and ffossil(OC)) were calculated using radiocarbon data. The expected δ13C and 14C endmember ranges for biomass burning emissions, liquid fossil fuel combustion, and coal combustion are shown as green, black, and brown bars, respectively, within the 14C-based endmember ranges for non-fossil (dark green rectangle, bottom) and fossil fuel combustion (grey rectangle, top). The δ13C signatures of C3 plants (green rectangle), liquid fossil fuel (e.g., oil, diesel, and gasoline, black rectangle), and coal (brown rectangle) are indicated as mean±standard deviation in Table S1. The δ13C signature of C4 plants burning is ‰ and is not shown on the x axis.
4.3 δ13C/F14C-based statistical source apportionment of EC
Figure 4 shows 14C-based ffossil(EC) against δ13CEC together with the isotopic signature of their source endmembers. The source endmembers for δ13C are less well constrained than for 14C. For example, δ13C values for liquid fossil fuel combustion overlap with δ13C values for both coal and C3 plant combustion. In contrast to δ13C, fbb and ffossil are clearly different and the uncertainties in the endmembers are related to the combined uncertainties of 14C measurements and the factor used to eliminate the bomb test effect (F14Cbb; see Sect. 2.5). All data points fall reasonably well within the “source triangle” of C3 plant, liquid fossil fuel (e.g., traffic or vehicular emission), and coal combustion, except that δ13CEC values in winter are on the higher (i.e., enriched) end of coal combustion, indicating the possible influence of C4 plants' combustion as discussed above in Sect. 3.3.
4.3.1 Selection of δ13C endmembers for aerosols from corn stalk burning in the study area
To incorporate the possible contribution from C4 plants to source apportionment, we need to estimate the δ13C signature of aerosols emitted by C4 biomass burning. Corn stalk is the dominant C4 plant in Xi'an and its surrounding areas (Guanzhong Plain), with little sugarcane and other C4 plants (Sun et al., 2017; Zhu et al., 2017). Estimates of δ13C of corn stalk burning emissions range from −19.3 ‰ to −13.6 ‰ (Chen et al., 2012; Kawashima and Haneishi, 2012; G. Liu et al., 2014; Guo et al., 2016). δ13C values of aerosols from corn stalk burning were compiled from literature (Fig. S6). The mean was computed as the average of the different datasets, and standard deviation analogously calculated. The δ13C source signature for corn stalk burning is ‰ (Fig. S6).
Table 2MCMC4 resultsa from the F14C- and δ13C-based Bayesian source apportionment calculations of EC (median, interquartile range (25th–75th percentile), and 95 % credible intervals).
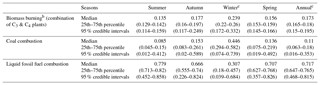
a Results from the four-source (C3 biomass, C4 biomass, coal, and liquid
fossil fuel) MCMC4 model.
b Contribution of biomass burning is calculated through a posteriori combination of
the PDF for C3 plants and that for C4 plants (Fig. S8). Median and quartile
ranges for C3 and
C4 plants' burning to EC are shown in Table S8.
c Sample taken from Chinese New Year's Eve (25 January 2009) was excluded.
4.3.2 Influence of C4 biomass on EC source apportionment
Bayesian Markov chain Monte Carlo techniques (MCMC) were used to account for the variability of the isotope signatures from the different sources (Andersson et al., 2015; Winiger et al., 2015; Fang et al., 2017). Results from a four-source (C3 biomass, C4 biomass, coal, and liquid fossil fuel) MCMC4 model and a three-source (C3 biomass, coal, and liquid fossil fuel) MCMC3 model were compared to underscore the influence of C4 biomass on source apportionment. The results of the Bayesian calculations are the posterior probability density functions (PDFs) for the relative contributions from the sources (Figs. S7, S8). For MCMC4, we calculated an a posteriori combination of the PDFs for C3 biomass and C4 biomass, and denoted the combined PDF as biomass burning, to better compare results with MCMC3.
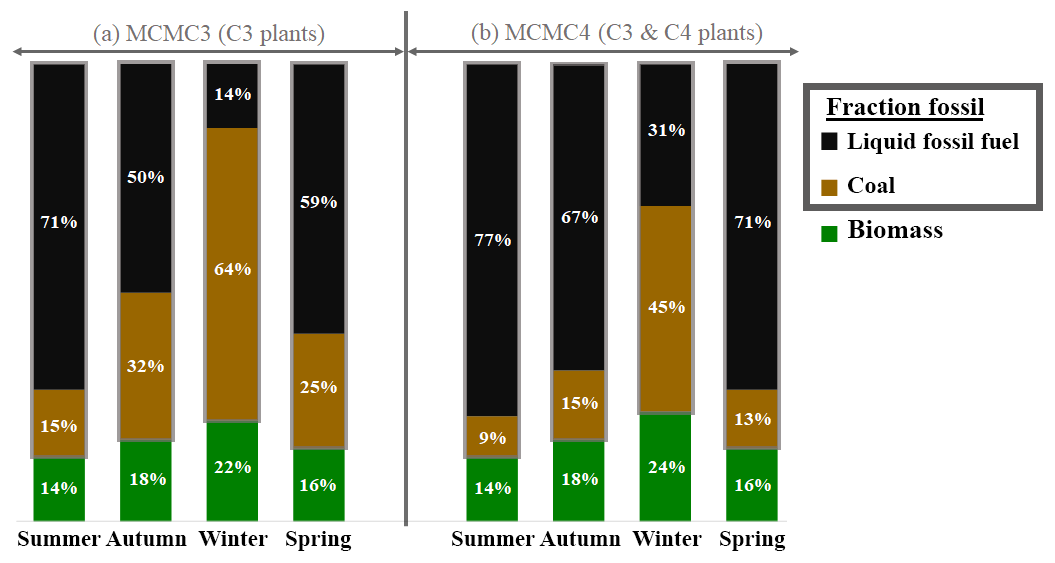
Figure 5Sources of EC in different seasons. Results from the F14C- and δ13C-based Bayesian source apportionment calculations of EC. The numbers in the bars represent the median contribution of liquid fossil fuel, coal, and biomass burning. (a) Results from the MCMC3 model, including C3 plants as biomass, coal, and liquid fossil fuel. (b) Impact of C4 plants burning on EC source apportionment is tested by including C4 biomass in the calculations (MCMC4). Including C4 plants in the calculations does not affect the contribution of biomass burning to EC. The relative fraction of C3 and C4 plants in biomass burning is shown in Fig. S10. In winter, the sample taken on Chinese New Year's Eve (25 January 2009) was excluded.
To estimate seasonal source contributions to EC, we combined all the data points from each season in the MCMC calculations. Yearly source apportionment was conducted by combining all the data points, to improve the precision of the estimated source contributions. The median was used to represent the best estimate of the contribution of any particular source to EC. Uncertainties of this best estimate are expressed as an interquartile range and the 95 % range of the corresponding PDF. For both MCMC4 and MCMC3, the MCMC-derived fraction of biomass burning EC (fbb; median with interquartile range calculated by Eq. 7) is similar to that obtained from radiocarbon data (fbb(EC); average with 1 standard deviation by Eq. 3) as both of them are well constrained by F14C (Tables 2, S5, S7, Fig. S9). Compared to MCMC4, MCMC3 overestimated the contributions from coal combustion and underestimated the contributions from liquid fossil fuel combustion (Fig. 5). In MCMC3, the δ13C signature for biomass burning (δ13Cbb) is taken from C3 plants only ( ‰), and is therefore more depleted compared to the δ13Cbb of combined C3 ( ‰) and C4 ( ‰) signatures in MCMC4. With the same fbb in both MCMC3 and MCMC4, MCMC3 calculations apportion a bigger fraction of EC to δ13C-enriched coal combustion in order to explain the enriched winter δ13CEC. As a result, the MCMC3-derived contribution of liquid fossil fuel combustion to EC was only 14 % in winter, 5 times lower than in summer. This implies the absolute EC concentrations from liquid fossil fuel combustion were much smaller in winter than in summer, considering that the total EC concentrations in winter were only 1.5 times higher than those in summer. This is inconsistent with our expectation that absolute EC concentrations from liquid fossil fuel combustion should be roughly constant throughout the year, or even higher in winter due to unfavorable meteorological conditions. If we do not include C4 biomass in the calculations, coal combustion contributions will be overestimated, and combustion of liquid fossil fuel be underestimated, especially in winter when δ13CEC values are most enriched combined with the highest contribution from biomass burning to EC.
MCMC4 calculations reveal that on a yearly average the highest contribution to EC is from liquid fossil sources (median, 72 %; interquartile range, 65 %–77 %; Table 2), followed by biomass burning (17 %, 16 %–18 %), and coal combustion (11 %, 6 %–18 %). However, source patterns changed substantially between different seasons. Coal combustion was the dominant contributor to EC concentrations in winter, with a median of 45 % (29 %–58 %). Contrary to winter, EC in other seasons was mainly derived from liquid fossil usage, accounting for 67 % (56 %–74 %), 71 % (63 %–77 %), and 77 % (71 %–82 %) of EC in autumn, spring, and summer, respectively. The larger contribution from coal combustion in winter was associated with the extensive coal use for residential heating and cooking in Xi'an, in addition to contributions from coal-fired industries and power plants. This is in line with the findings from δ13C results. We consider that EC from coal-fired industries and power plants is much lower than that from residential coal combustion because they have high combustion efficiency and widely used dust removal facilities. For example, a previous study reported that EC emission factors (amount of emitted EC per kg fuel) from residential coal combustion are up to 3 orders of magnitude higher than those from industries and power plants (Zhang et al., 2008). However, relative contributions from fossil combustion () were on average lower in winter than in other seasons (warm period), implying that contributions from biomass burning were also important for the EC increment in winter. By subtracting mean ECbb and ECfossil in the warm period from those in winter, the excess ECbb and ECfossil were 1.2 and 0.8 µg m−3, respectively. Biomass burning contributed on average 60 % of the EC increment in winter.
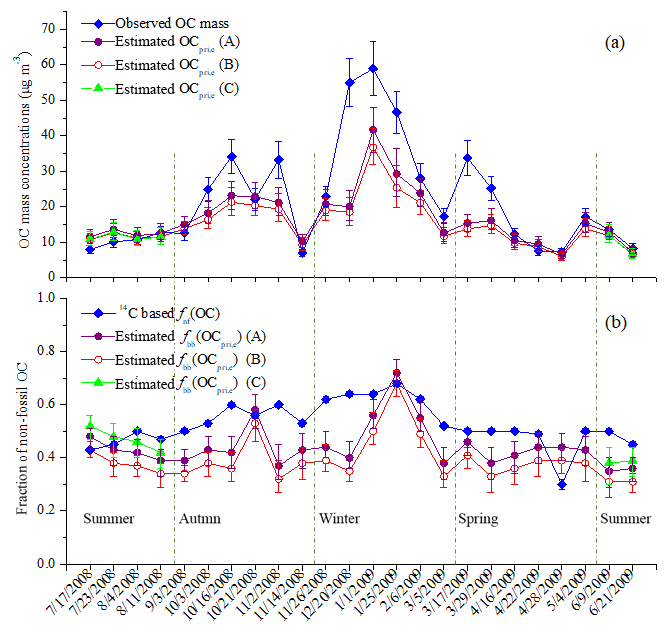
Figure 6Estimated primary OC based on MCMC4 results. (a) Measured OC concentrations (blue line and diamond symbols) with observational uncertainties (vertical bar) and estimated OC mass (OCpri,e, circle and triangular symbols) from apportioned EC and OC∕EC ratios for different sources (Eq. 10). (b) 14C-based fraction of non-fossil OC (fnf(OC)) and modeled non-fossil fraction in OCpri,e(fbb(OCpri,e)) derived from Eq. (11). The interquartile range (25th–75th percentile) of the median OCpri,e and fbb(OCpri,e) is shown by purple (A), red (B), and green (C) vertical bars. “A” and “B” denote different OC∕EC ratios applied to primary biomass burning emissions (rbb): A: rbb=5 (3–7, minimum–maximum); B: rbb=4 (3–5); “C” denotes 80 % rliq.fossil applied in summer with rbb=5 (3–7). fnf(OC) uncertainties are indicated but are too small to be visible.
4.4 Estimating mass concentrations and sources of primary OC
Comparing concentrations and sources of primary OC to total OC can give insights into the importance of secondary formation and other chemical processes, such as photochemical loss mechanisms. Based on the EC concentrations from biomass, coal, and liquid fossil fuel combustion derived from the MCMC4 model, the total primary OC mass concentrations due to these three major combustion sources can be estimated (OCpri,e; OC primary, estimated). The respective EC concentrations apportioned to each source are multiplied by the characteristic primary OC∕EC ratios for each source (Eq. 10). The non-fossil fraction (i.e., biomass burning) in OCpri,e(fbb(OCpri,e)) is approximated by Eq. (11):
where POCbb,e, POCcoal,e, and POC are estimated primary OC mass concentrations from biomass burning, coal combustion, and liquid fossil fuel combustion, respectively; rbb, rcoal, and rliq.fossil are OC∕EC ratios for primary emissions from biomass burning, coal combustion, and liquid fossil fuel combustion, respectively. The selection of rbb (5±2), rcoal (2.38±0.44), and rliq.fossil (0.85±0.16) is done through a literature search and is described in the Supplement S4; fbb, fcoal, and fliq.fossil are the relative contribution to EC from the combustion of biomass, coal, and liquid fossil fuel derived from the MCMC4 model. EC denotes EC mass concentrations (µg m−3).
A Monte Carlo simulation with 10 000 individual calculations of OCpri,e and fbb(OCpri,e) was conducted to propagate uncertainties. For each individual calculation input, EC concentrations are randomly chosen from a normal distribution symmetric around the measured values with uncertainties as standard deviation; the random values for rbb, rcoal, and rliq.fossil are taken from a triangular distribution, which has its maximum at the central value and 0 at the upper and lower limits. For fbb, fcoal, and fliq.fossil, the PDF derived from the MCMC4 model was used (Fig. S11). Then 10 000 different estimations of OCpri,e and fbb(OCpri,e) were calculated. The derived median represents the best estimate, and interquartile ranges (25th–75th percentile) were calculated to represent the combined uncertainties.
The observed OC concentrations and non-fossil fractions fnf(OC) as well as estimated OCpri,e and fbb(OCpri,e) are shown in Fig. 6. OCpri,e tracks the observed concentrations and seasonality of OC very well, with a correlation of r2=0.71 (p<0.05). OCpri,e values are only substantially lower than OC when observed OC concentrations >25 µg m−3 (Fig. 6a). Observed OC mass concentrations that exceed OCpri,e can be explained by the contribution from secondary OC from coal combustion (SOCcoal) and liquid fossil fuel usage (SOCliq.fossil) and by other non-fossil OC (OCo,nf). OCo,nf includes secondary OC from biomass burning and biogenic sources (SOCnf; SOC non-fossil), and primary OC from vegetative detritus, bioaerosols, resuspended soil organic matter, or cooking. Therefore,
In most cases, the contributions to PM2.5 from vegetative detritus, bioaerosols, and soil dust in the air are likely small because their sizes are usually much larger than 2.5 µm. For example, Guo et al. (2012) estimated that vegetative detritus only accounts for ∼1 % of OC in PM2.5 in Beijing, China, using chemical mass balance (CMB) modeling and a tracer-yield method. Thus, this fraction of OC can be ignored (i.e., OC). A previous 14C study in Xi'an during severe winter pollution days in 2013 also reveals that increased total carbon () was mainly driven by enhanced SOC from fossil and non-fossil sources (Zhang et al., 2015a), that is SOCcoal, SOCliq.fossil, and SOCnf, all of which are not modeled in OCpri,e.
OCpri,e was higher than the total observed OC in summer 2008, which may indicate an overestimate of primary OC∕EC ratios, or loss of OC due to photochemical processing. Xi'an is one of the four “stove cities” in China. In summer, daily average temperature was 25–31 ∘C, and occasionally exceeded 38 ∘C. At these temperatures, semi-volatile OC from emission sources becomes volatilized more quickly owing to higher temperatures, leading to lower primary OC∕EC ratios than other seasons. These low OC∕EC ratios in summer are commonly observed in urban China (e.g., median, 2.7; interquartile range, 1.9–4) from an overview of PM2.5 composition in China by Tao et al., 2017). This evaporation can be compounded by loss through photochemical reactions that lead to the fragmentation of organic compounds.
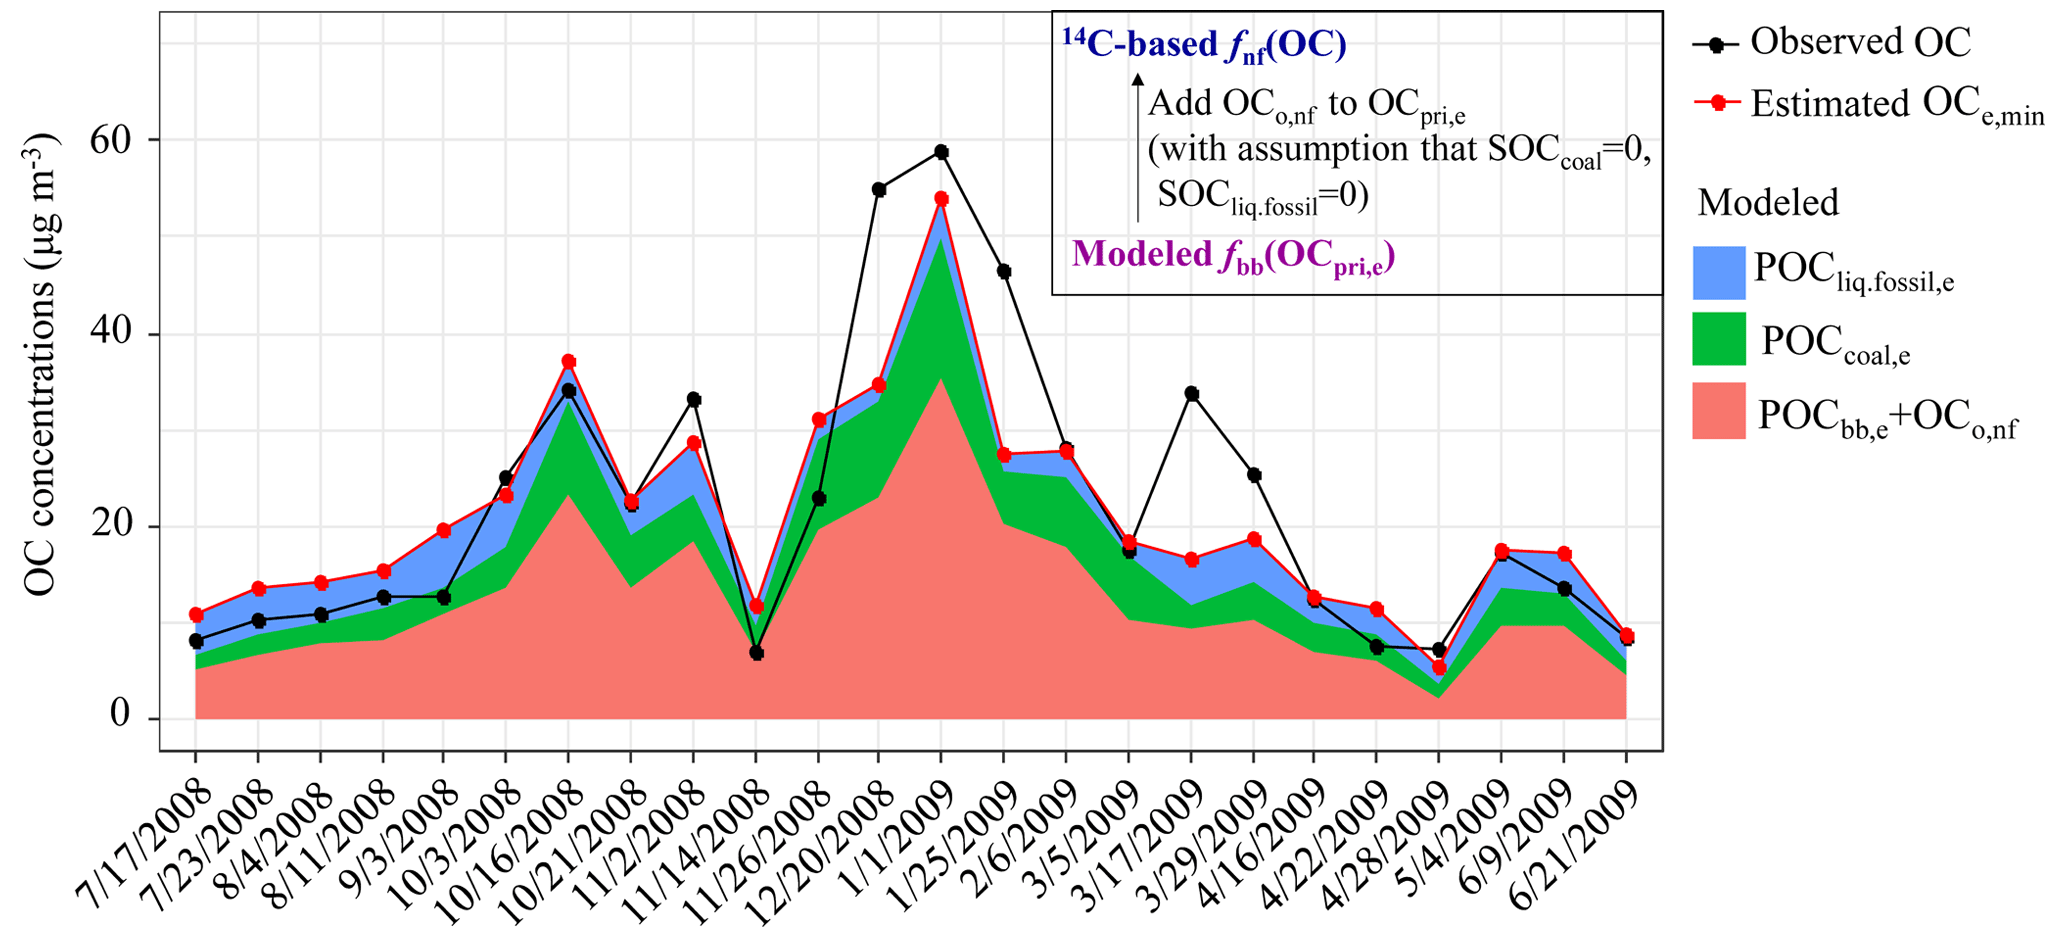
Figure 7Observed and estimated OC concentrations. Modeled OCe,min is the sum of OCpri,e and OCo,nf. OCo,nf accounts for the differences between fnf(OC) and fbb(OCpri,e), with an unrealistic assumption of no secondary fossil OC, leading to minimum addition to OCpri,e. The coral area shows the POCbb,e and OCo,nf, green area the POCcoal,e, and blue area the POC. Estimation is based on MCMC4 results for EC source apportionment and primary OC∕EC ratios corresponding to case (A) in Fig. 6.
On the other hand, the estimated fbb(OCpri,e) is consistently lower than observed 14C-based fnf(OC), and weak correlation was observed (r2=0.31). Differences between the non-fossil carbon fraction in primary aerosol (fbb(OCpri,e)) and in the total organic aerosol fnf(OC) can in principle be expected due to secondary organic aerosol formation. A higher fraction of non-fossil carbon in total OC than in estimated primary OC implies that non-fossil sources contribute more strongly to SOC formation than fossil sources. Some previous observations support this hypothesis. Zhang et al. (2015a) also reported that the relative contribution of OCo,nf is ∼2 times higher than that of SOCcoal and SOCliq.fossil in January 2013 at the same sampling site. In winter, OCo,nf is likely dominated by SOC from biomass burning emissions, while contributions from biogenic SOC are small. In spring and summer, additional contributions from biogenic SOC can further elevate fnf(OC) compared to fbb(OCpri,e).
However, considering both fnf(OC) and OC concentrations, this simple model of total OC as the sum of primary and secondary OC leads to an apparent contradiction for spring and summer observations. OCpri,e is already equal to or exceeds the total measured OC concentrations, whereas additional SOC is necessary to explain the observed higher fnf(OC). Spring and summer temperatures in Xi'an are generally high, which favors active photochemistry. The resulting loss of OC due to photochemistry probably also needs to be considered to explain the observations.
4.5 Differences between observed and estimated primary OC concentrations and sources
The estimated OCpri,e concentrations are comparable to the observed OC concentrations, except for samples with observed OC concentrations >25 µg m−3. However, fbb(OCpri,e) is considerably lower than the observed fnf(OC). It is worth investigating whether this might be due to the model assumptions, for example, the OC∕EC emission ratios used for the primary sources. OC∕EC ratios are known to be dependent on the measurement protocol applied to the samples (Chow et al., 2001, 2004). For example, Han et al. (2016) found that for fresh biomass burning emissions, OC∕EC ratios from EUSAAR_2 (Cavalli et al., 2010) are 2 times higher than those from IMPROVE_A (Chow et al., 2007). According to Eq. (11), underestimated rbb or overestimated rcoal and rliq.fossil would result in a fbb(OCpri,e) that is biased towards low values. Impacts of rbb on fbb(OCpri,e) are presented in Fig. 6b. With higher rbb=5 (3–7, minimum–maximum; our best estimate from the literature review presented in the Supplement S4) compared to rbb=4 (3–5), fbb(OCpri,e) only increases by 4 % to 7 %. Any further increase of rbb would result in a modeled OCpri,e that is substantially higher than total measured OC.
On the other hand, rliq.fossil of 0.85±0.16 was applied without considering its seasonal variations. However, it is found that rliq.fossil is lower in summer compared with other seasons, which is related to increased volatilization of semi-volatile organic compounds and faster catalyst and engine warm-up times in summer (Xie et al., 2017). X. H. H. Huang et al. (2014) found OC∕EC ratios from fresh vehicular emissions in summer to be ∼80 % of the yearly average, based on the lowest 5 % OC∕EC ratios measured in a roadside environment in Hongkong, China. The fbb(OCpri,e) would increase 3 % to 5 % in summer, if we apply 80 % of the yearly average rliq.fossil for the summer (Fig. 6b), which is also not a substantial increase. In summary, it is not feasible to model the observed fnf(OC) by primary emissions, even though the total OC concentrations are in the range of modeled primary OC for spring and summer. Moreover, in spring, δ13COC is lower than δ13CEC (Fig. 2). This points to a depleted OC source, which could be an indication of secondary formation of OC. In summary, the isotopic composition of OC makes a predominantly primary origin very unlikely.
A more realistic model for OC concentrations and fnf(OC) needs to account for OCo,nf, SOCcoal, and SOCliq.fossil:
Then the estimated total OC (OCe) will be
As a sensitivity study with minimum addition to OCpri,e (thus minimum OCe, OCe,min), we make the unrealistic assumption that there is no SOC from coal and liquid fossil fuel combustion (SOCcoal=0, SOC). Only the required OCo,nf is added until the modeled fnf(OC) is equal to the measured one. Figure 7 presents the modeled OCe,min and observed OC concentrations. Nearly half of OCe,min values are higher than observed OC, and especially in summer, the OC concentrations are consistently overestimated. For many of the data points in fall and spring there is a reasonable agreement between model and measurements. There are only a few haze episodes in winter, for which additional SOC formation would be required to explain observed OC concentrations. However, a previous study in winter 2013 at the same sampling site found the secondary fossil OC was 0.75–1.6 times that of primary fossil OC (Zhang et al., 2015a), which indicates that fossil SOC is likely also of importance. If we also include SOCcoal and SOCliq.fossil, this leads to a further overestimate of absolute OC concentrations, if we simply estimate total OC as the sum of primary and secondary OC. Therefore, the more reasonable explanation is OC loss. The primary OC∕EC ratios do not preserve the characteristics of sources any more in a warm period due to active photochemistry under high temperature and humidity. The conclusion will not change if we apply EC apportionment results from MCMC3 (Figs. S12, S13).
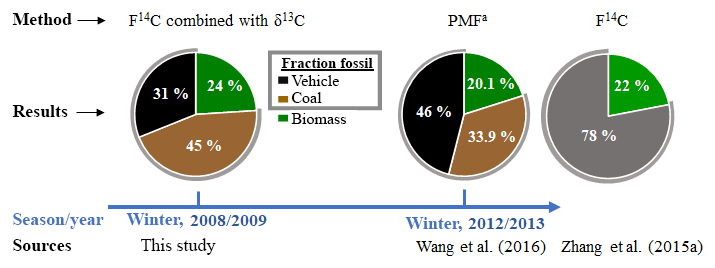
Figure 8Comparison of EC source apportionment in winter 2008/2009 with two other studies in winter 2012/2013 at the same sampling site. a Positive matrix factorization (PMF) receptor model simulation.
4.6 Changes in emission sources in Xi'an, China (2008/2009 vs. 2012/2013)
EC is a primary emission product, and thus changes in EC sources can reflect the changes in emission sources. The contribution from biomass burning to EC was 24 % (median; interquartile range 22 %–26 %) in winter 2008/2009 (Fig. 8, Table 2) with no considerable change in fbb(EC) between polluted days and clean days (Fig. 1a, except Chinese New Year's Eve). Taking into account the uncertainties, comparable contributions were also reported at the same sampling site for winter 2012/2013 based on 14C measurements (22±3 %; Zhang et al., 2015a), and positive matrix factorization (PMF) receptor model simulation (20.1±7.9 %; Wang et al., 2016) (Fig. 8). This suggests that from 2008 to 2013, biomass burning contributions to EC remained rather stable, although with a slight decrease from 24 % (22 %–26 %) to 20 % (SD=7.9 %). Biomass burning in Xi'an mainly includes open burning of crop residues and household usage of crop residues and wood. The slight decrease can be explained by more strict rules to minimize crop open burning, but implementation of regulations was still weak and slow. Moreover, there are no regulations yet that target household biomass usage (Zhang and Cao, 2015b).
The contribution of coal combustion to EC decreased from 45 % (29 %–58 %) in winter 2008/2009 to 33.9 % (SD=23.8 %) in winter 2012/2013, with an increased contribution from vehicle emission from 31 % (18 %–46 %) to 46 % (SD=25.1 %) (Fig. 8). For EC source apportionment, it is noted that the quartile range for 2008/2009 values overlaps range for 2012/2013 values (average±SD). Compared to the uncertainties of 14C measurements, the uncertainties of PMF results are always larger, making the overlapped ranges very likely. However, comparing the probability distribution functions for both cases gives a more complete picture. Figures S14 and S15 show the PDF of the relative source contributions to EC from coal combustion and vehicle emissions, respectively. For the PDF by Wang et al. (2016), we assume normal distribution as their source apportionment results are not known and given in the form of average±SD. As shown in Figs. S14 and S15, though with some overlaps, the PDF of the relative source contribution of coal combustion (vehicle emissions) does clearly shift to the lower side (higher side) from the year 2008/2009 to 2012/2013.
Vehicle emissions become increasingly important and coal combustion less so from 2008 to 2013. This change could not be detected from 14C measurements alone, since the total fossil contribution to EC stayed relatively constant. Further apportionment of fossil sources into coal combustion and vehicle emissions could be achieved by combining 14C measurements with δ13C (Andersson et al., 2015; Winiger et al., 2016) or organic source markers (Zhang et al., 2015b).
The decreased contribution from coal combustion to EC from 2008 to 2013 resulted from the stepwise replacement of coal by natural gas for residential heating and cooking since the second half of the 2000s. Natural gas usage in Xi'an increased by 94 % from 2009 to 2013 (Xi'an Municipal Bureau of Statistics and NBS Survey Office in Xi'an, 2010, 2014). Although coal combustion in Xi'an had been increasing from 6.6 million tons in 2008 to 10.3 million tons in 2013, the proportion of coal used as energy reduced from 71 % to 66 % (Xi'an Municipal Bureau of Statistics and NBS Survey Office in Xi'an, 2009, 2014). The reinforcement of environmental laws and regulations and the encouragement of using high-efficiency improved coal burners and high-quality coals are important factors as well. The decreased coal combustion emissions are also evidenced from the declined Fe-referenced enrichment factors (EFs, normalized to composition of earth crust) of As and Pb. As and Pb can indicate coal combustion, as Pb-containing gasoline has been forbidden since 2000 in Xi'an (Xu et al., 2012). Annual EFs of As and Pb dropped from 802 and 804 in 2008 to 465 and 490 in 2010, respectively (Xu et al., 2016).
Vehicular emissions to EC increased from 31 % to 46 % (an absolute relative increase by roughly 50 %) from 2008 to 2013 (Fig. 8). This is supported by increasing levels of NO2 in urban Xi'an, which is another indicator for the contribution of vehicular emissions to air pollution. The NO2 concentrations in Xi'an increased by 15.5 % from 2006 to 2010 (Xu et al., 2016). The increased vehicular contribution likely resulted from a strong increase in civil vehicles. The processing (registration) of civil vehicles increased > 2-fold from 0.9 million units in 2008 to 1.9 million units in 2013 (Xi'an Municipal Bureau of Statistics and NBS Survey Office in Xi'an, 2009, 2014). However, vehicular contributions to EC and NO2 concentrations have not increased to the same extent as the increase in vehicle numbers. This can be attributed to the upgrade of vehicle emission standards from National II to National III for light-duty gasoline and heavy-duty diesel vehicles in 2007 and for heavy-duty gasoline vehicles in 2010 in Xi'an (GB18352.3-2005, 2005; GB17691-2005, 2005), which somewhat offset the increase of vehicle numbers.
Sources of OC and EC in Xi'an, China, are constrained based on a full year of radiocarbon and the stable isotope 13C measurements for the year 2008–2009. Radiocarbon measurement reveals that EC is dominated by fossil sources, with contributions ranging from 71 % to 89 %, with an average of 83±5 %. Compared with EC, OC has a much higher contribution from non-fossil sources (54±8 %), with a higher contribution in winter (62±5 %). Fossil contributions to OC and EC in this study fall within the range of published values from other 14C-based source apportionments in Chinese cities. In this study, the non-fossil contribution to OC in winter ( %) was observed to be higher than in summer (48±3 %) in Xi'an. A different seasonal variation pattern for fnf(OC) was reported in Beijing, where the fossil contribution to OC was higher in winter than in summer (Yan et al., 2017; Zhang et al., 2017). This implies that different pollution patterns exist in individual Chinese cities.
In summer, a strong positive correlation was found between F14C(EC) and ratios, and a significant negative correlation between F14C(EC) and levoglucosan∕EC ratios. This suggests that the burning of crop residues, with significant lower ratios than wood, accounted for most of the variability in non-fossil EC in the summer. No significant correlations of F14C(EC) with or levoglucosan∕EC were found in other seasons (Fig. S5), suggesting a variable mixture of biomass subtypes.
To further refine EC sources, radiocarbon and stable carbon signatures are combined and used in a Bayesian Markov chain Monte Carlo (MCMC) approach, in which the burning of C4 plants is included as a subtype of biomass burning. The MCMC results indicate that coal combustion dominated EC in winter, and that liquid fossil fuel combustion dominated EC in other seasons. However, increased contributions from biomass burning were important for the EC increment in winter as well. Comparisons with the results of other studies at the same sampling site in winter suggest that the sources of fossil EC have changed from 2008/2009 to 2013/2014, with decreasing contributions from coal burning and increasing contributions from motor vehicles. This is consistent with recent changes in Xi'an: changes in energy consumption, and the expansion of the civil vehicular fleet, resulting from urbanization and economic improvement.
δ13COC exhibited similar values to δ13CEC, and showed strong correlations (r2=0.90) in summer and autumn, indicating similar source mixtures to EC and the influence of high temperature on the atmospheric processing of OC. In spring, δ13COC is more depleted than δ13CEC, indicating the possible importance of the secondary formation of OC (e.g., from volatile organic compound precursors) in addition to primary sources. Comparing the observations (OC mass, 14C-based fnf(OC)) with estimated total primary OC concentrations related to combustion sources (i.e., estimated by apportioned EC and corresponding OC to EC ratios) and the non-fossil fraction in the estimated primary OC makes it possible to provide some insights into the importance of secondary formation and other chemical processes, such as photochemical loss mechanisms. It is found that estimated primary OC mass follows the observed total OC concentrations and seasonality (r2=0.71), but source contributions to total OC differ from the estimated source contributions to primary OC (r2=0.31). The estimated primary OC is similar to the observed OC concentrations, except for samples with observed OC concentrations >25 µg m−3. However, the non-fossil fraction in estimated primary OC is significantly lower than the observed fnf(OC). These differences can be explained by the contribution of other non-fossil primary OC (excluding biomass burning), or secondary non-fossil OC, which are not included in the estimation. But we cannot reconcile the differences between observed and estimated non-fossil OC fraction without overestimating the absolute OC concentrations, especially in summer. Therefore, we hypothesize that OC loss due to active photochemistry cannot be neglected, especially not in summer.
All data needed to evaluate the conclusions in this study are present in the paper and the Supplement. Additional data related to this paper are available upon request to the corresponding authors.
The supplement related to this article is available online at: https://doi.org/10.5194/acp-18-16363-2018-supplement.
RJH, UD, HN, and JC conducted the study design. HN, MW, TZ, and WL carried out the experimental work. Data analysis was done by HN and UD. HN wrote the manuscript. HN, UD, HAJM, and RJH interpreted data and edited the manuscript. HN and UD prepared display items. All authors commented on and discussed the manuscript.
The authors declare that they have no conflict of interest.
This work was supported by a KNAW project (no. 530-5CDP30). The authors
acknowledge the financial support from the Gratama Foundation. Special
thanks are given to Henk Been and Marc Bleeker for their help with the AMS
measurements at CIO, and to Anita Aerts-Bijma and Dicky van Zonneveld for
their help with 14C data correction at CIO.
Edited by: Willy Maenhaut
Reviewed by: three anonymous referees
Anderson, R. S., Huang, L., Iannone, R., Thompson, A. E., and Rudolph, J.: Carbon kinetic isotope effects in the gas phase reactions of light alkanes and ethene with the OH radical at 296±4 K, J. Phys. Chem. A., 108, 11537–11544, 2004.
Andersson, A.: A systematic examination of a random sampling strategy for source apportionment calculations, Sci. Total Environ., 412, 232–238, 2011.
Andersson, A., Deng, J., Du, K., Zheng, M., Yan, C., Sköld, M., and Gustafsson, Ö.: Regionally-varying combustion sources of the January 2013 severe haze events over eastern China, Environ. Sci. Technol., 49, 2038–2043, 2015.
Bandowe, B. A. M., Meusel, H., Huang, R. J., Ho, K., Cao, J., Hoffmann, T., and Wilcke, W.: PM2.5-bound oxygenated PAHs, nitro-PAHs and parent-PAHs from the atmosphere of a Chinese megacity: seasonal variation, sources and cancer risk assessment, Sci. Total Environ., 473–474, 77–87, https://doi.org/10.1016/j.scitotenv.2013.11.108, 2014.
Bikkina, S., Andersson, A., Sarin, M., Sheesley, R., Kirillova, E., Rengarajan, R., Sudheer, A., Ram, K., and Gustafsson, Ö.: Dual carbon isotope characterization of total organic carbon in wintertime carbonaceous aerosols from northern India, J.Geophys. Res.-Atmos., 121, 4797–4809, 2016.
Bikkina, S., Andersson, A., Ram, K., Sarin, M., Sheesley, R. J., Kirillova, E. N., Rengarajan, R., Sudheer, A., and Gustafsson, Ö.: Carbon isotope-constrained seasonality of carbonaceous aerosol sources from an urban location (Kanpur) in the Indo-Gangetic Plain, J.Geophys. Res.-Atmos., 122, 4903–4923, 2017.
Bond, T. C., Doherty, S. J., Fahey, D. W., Forster, P. M., Berntsen, T., DeAngelo, B. J., Flanner, M. G., Ghan, S., Kärcher, B., Koch, D., Kinne, S., Kondo, Y., Quinn, P. K., Sarofim, M. C., Schultz, M. G., Schulz, M., Venkataraman, C., Zhang, H., Zhang, S., Bellouin, N., Guttikunda, S. K., Hopke, P. K., Jacobson, M. Z., Kaiser, J. W., Klimont, Z., Lohmann, U., Schwarz, J. P., Shindell, D., Storelvmo, T., Warren, S. G., and Zender, C. S.: Bounding the role of black carbon in the climate system: a scientific assessment, J.Geophys. Res.-Atmos., 118, 5380–5552, https://doi.org/10.1002/jgrd.50171, 2013.
Bosch, C., Andersson, A., Kirillova, E. N., Budhavant, K., Tiwari, S., Praveen, P., Russell, L. M., Beres, N. D., Ramanathan, V., and Gustafsson, Ö.: Source-diagnostic dual-isotope composition and optical properties of water-soluble organic carbon and elemental carbon in the South Asian outflow intercepted over the Indian Ocean, J.Geophys. Res.-Atmos., 119, 11743–11759, https://doi.org/10.1002/2014JD022127, 2014.
Cao, F., Zhang, S.-C., Kawamura, K., and Zhang, Y.-L.: Inorganic markers, carbonaceous components and stable carbon isotope from biomass burning aerosols in Northeast China, Sci. Total Environ., 572, 1244–1251, https://doi.org/10.1016/j.scitotenv.2015.09.099, 2016.
Cao, J. J., Lee, S. C., Ho, K. F., Zhang, X. Y., Zou, S. C., Fung, K., Chow, J. C., and Watson, J. G.: Characteristics of carbonaceous aerosol in Pearl River Delta Region, China during 2001 winter period, Atmos. Environ., 37, 1451–1460, 2003.
Cao, J. J., Wu, F., Chow, J. C., Lee, S. C., Li, Y., Chen, S. W., An, Z. S., Fung, K. K., Watson, J. G., Zhu, C. S., and Liu, S. X.: Characterization and source apportionment of atmospheric organic and elemental carbon during fall and winter of 2003 in Xi'an, China, Atmos. Chem. Phys., 5, 3127–3137, https://doi.org/10.5194/acp-5-3127-2005, 2005.
Cao, J. J., Lee, S. C., Chow, J. C., Watson, J. G., Ho, K. F., Zhang, R. J., Jin, Z. D., Shen, Z. X., Chen, G. C., Kang, Y. M., Zou, S. C., Zhang, L. Z., Qi, S. H., Dai, M. H., Cheng, Y., and Hu, K.: Spatial and seasonal distributions of carbonaceous aerosols over China, J.Geophys. Res.-Atmos., 112, D22S11, https://doi.org/10.1029/2006JD008205, 2007.
Cao, J. J., Zhu, C. S., Chow, J. C., Liu, W. G., Han, Y. M., and Watson, J. G.: Stable carbon and oxygen isotopic composition of carbonate in fugitive dust in the Chinese Loess Plateau, Atmos. Environ., 42, 9118–9122, 2008.
Cao, J. J., Zhu, C. S., Chow, J. C., Watson, J. G., Han, Y. M., Wang, G. H., Shen, Z. X., and An, Z. S.: Black carbon relationships with emissions and meteorology in Xi'an, China, Atmos. Res., 94, 194–202, 2009.
Cao, J. J., Chow, J. C., Tao, J., Lee, S. C., Watson, J. G., Ho, K. F., Wang, G. H., Zhu, C. S., and Han, Y. M.: Stable carbon isotopes in aerosols from Chinese cities: influence of fossil fuels, Atmos. Environ., 45, 1359–1363, 2011.
Cao, J. J., Xu, H. M., Xu, Q., Chen, B. H., and Kan, H. D.: Fine particulate matter constituents and cardiopulmonary mortality in a heavily polluted Chinese city, Environ. Health Persp., 120, 373–378, https://doi.org/10.1289/ehp.1103671, 2012.
Cao, J.-J., Zhu, C.-S., Tie, X.-X., Geng, F.-H., Xu, H.-M., Ho, S. S. H., Wang, G.-H., Han, Y.-M., and Ho, K.-F.: Characteristics and sources of carbonaceous aerosols from Shanghai, China, Atmos. Chem. Phys., 13, 803–817, https://doi.org/10.5194/acp-13-803-2013, 2013.
Cavalli, F., Viana, M., Yttri, K. E., Genberg, J., and Putaud, J.-P.: Toward a standardised thermal-optical protocol for measuring atmospheric organic and elemental carbon: the EUSAAR protocol, Atmos. Meas. Tech., 3, 79–89, https://doi.org/10.5194/amt-3-79-2010, 2010.
Chen, B., Andersson, A., Lee, M., Kirillova, E. N., Xiao, Q., Kruså, M., Shi, M., Hu, K., Lu, Z., Streets, D. G., Du, K., and Gustafsson, Ö.: Source forensics of black carbon aerosols from China, Environ. Sci. Technol., 47, 9102–9108, 2013.
Chen, Y., Cai, W., Huang, G., Li, J., and Zhang, G.: Stable carbon isotope of black carbon from typical emission sources in China, Environ. Sci., 33, 673–678, 2012 (in Chinese).
Cheng, Y., Engling, G., He, K.-B., Duan, F.-K., Ma, Y.-L., Du, Z.-Y., Liu, J.-M., Zheng, M., and Weber, R. J.: Biomass burning contribution to Beijing aerosol, Atmos. Chem. Phys., 13, 7765–7781, https://doi.org/10.5194/acp-13-7765-2013, 2013.
Chesselet, R., Fontugne, M., Buat-Ménard, P., Ezat, U., and Lambert, C. E.: The origin of particulate organic carbon in the marine atmosphere as indicated by its stable carbon isotopic composition, Geophys. Res. Lett., 8, 345–348, 1981.
Chow, J. C., Watson, J. G., Pritchett, L. C., Pierson, W. R., Frazier, C. A., and Purcell, R. G.: The DRI thermal/optical reflectance carbon analysis system: description, evaluation and applications in U.S. air quality studies, Atmos. Environ. A.-Gen., 27, 1185–1201, 1993.
Chow, J. C., Watson, J. G., Crow, D., Lowenthal, D. H., and Merrifield, T.: Comparison of IMPROVE and NIOSH carbon measurements, Aerosol Sci. Technol., 34, 23–34, 2001.
Chow, J. C., Watson, J. G., Chen, L.-W. A., Arnott, W. P., Moosmüller, H., and Fung, K. K.: Equivalence of elemental carbon by Thermal/Optical Reflectance and Transmittance with different temperature protocols, Environ. Sci. Technol., 38, 4414–4422, 2004.
Chow, J. C., Watson, J. G., Chen, L.-W. A., Chang, M. O., Robinson, N. F., Trimble, D., and Kohl, S.: The IMPROVE_A temperature protocol for thermal/optical carbon analysis: maintaining consistency with a long-term database, J. Air Waste Manage., 57, 1014–1023, 2007.
Chow, J. C., Watson, J. G., Chen, L.-W. A., Rice, J., and Frank, N. H.: Quantification of PM2.5 organic carbon sampling artifacts in US networks, Atmos. Chem. Phys., 10, 5223–5239, https://doi.org/10.5194/acp-10-5223-2010, 2010.
Chow, J. C., Watson, J. G., Robles, J., Wang, X. L., Chen, L.-W. A., Trimble, D. L., Kohl, S. D., Tropp, R. J., and Fung, K. K.: Quality assurance and quality control for thermal/optical analysis of aerosol samples for organic and elemental carbon, Anal. Bioanal. Chem., 401, 3141–3152, 2011.
Chung, S. H. and Seinfeld, J. H.: Global distribution and climate forcing of carbonaceous aerosols, J.Geophys. Res.-Atmos., 107, 4407, https://doi.org/10.1029/2001JD001397, 2002.
de Rooij, M., van der Plicht, J., and Meijer, H.: Porous iron pellets for AMS 14C analysis of small samples down to ultra-microscale size (10–25 µg C), Nucl. Instrum. Meth. B, 268, 947–951, 2010.
Dusek, U., Ten Brink, H., Meijer, H., Kos, G., Mrozek, D., Röckmann, T., Holzinger, R., and Weijers, E.: The contribution of fossil sources to the organic aerosol in the Netherlands, Atmos. Environ., 74, 169–176, 2013.
Dusek, U., Monaco, M., Prokopiou, M., Gongriep, F., Hitzenberger, R., Meijer, H. A. J., and Röckmann, T.: Evaluation of a two-step thermal method for separating organic and elemental carbon for radiocarbon analysis, Atmos. Meas. Tech., 7, 1943–1955, https://doi.org/10.5194/amt-7-1943-2014, 2014.
Dusek, U., Hitzenberger, R., Kasper-Giebl, A., Kistler, M., Meijer, H. A. J., Szidat, S., Wacker, L., Holzinger, R., and Röckmann, T.: Sources and formation mechanisms of carbonaceous aerosol at a regional background site in the Netherlands: insights from a year-long radiocarbon study, Atmos. Chem. Phys., 17, 3233–3251, https://doi.org/10.5194/acp-17-3233-2017, 2017.
Elser, M., Huang, R.-J., Wolf, R., Slowik, J. G., Wang, Q., Canonaco, F., Li, G., Bozzetti, C., Daellenbach, K. R., Huang, Y., Zhang, R., Li, Z., Cao, J., Baltensperger, U., El-Haddad, I., and Prévôt, A. S. H.: New insights into PM2.5 chemical composition and sources in two major cities in China during extreme haze events using aerosol mass spectrometry, Atmos. Chem. Phys., 16, 3207–3225, https://doi.org/10.5194/acp-16-3207-2016, 2016.
Fang, W., Andersson, A., Zheng, M., Lee, M., Holmstrand, H., Kim, S.-W., Du, K., and Gustafsson, Ö.: Divergent evolution of carbonaceous aerosols during dispersal of East Asian haze, Sci. Rep.-UK, 7, 10422, https://doi.org/10.1038/s41598-017-10766-4, 2017.
Fisseha, R., Saurer, M., Jäggi, M., Siegwolf, R. T. W., Dommen, J., Szidat, S., Samburova, V., and Baltensperger, U.: Determination of primary and secondary sources of organic acids and carbonaceous aerosols using stable carbon isotopes, Atmos. Environ., 43, 431–437, https://doi.org/10.1016/j.atmosenv.2008.08.041, 2009.
GB17691-2005: Limits and measurement methods for emissions from heavy-duty vehicles (III, IV), Ministry of Environmental Protection and General Administration of Quality Supervision, Inspection and Quarantine of the People's Republic of China, Beijing, China, 2005.
GB18352.3-2005: Limits and measurement methods for emissions from light-duty vehicles (III, IV), Ministry of Environmental Protection and General Administration of Quality Supervision, Inspection and Quarantine of the People's Republic of China, Beijing, China, 2005.
Genberg, J., Hyder, M., Stenström, K., Bergström, R., Simpson, D., Fors, E. O., Jönsson, J. Å., and Swietlicki, E.: Source apportionment of carbonaceous aerosol in southern Sweden, Atmos. Chem. Phys., 11, 11387–11400, https://doi.org/10.5194/acp-11-11387-2011, 2011.
Gilardoni, S., Vignati, E., Cavalli, F., Putaud, J. P., Larsen, B. R., Karl, M., Stenström, K., Genberg, J., Henne, S., and Dentener, F.: Better constraints on sources of carbonaceous aerosols using a combined 14C–macro tracer analysis in a European rural background site, Atmos. Chem. Phys., 11, 5685–5700, https://doi.org/10.5194/acp-11-5685-2011, 2011.
Guo, S., Hu, M., Guo, Q., Zhang, X., Zheng, M., Zheng, J., Chang, C. C., Schauer, J. J., and Zhang, R.: Primary sources and secondary formation of organic aerosols in Beijing, China, Environ. Sci. Technol., 46, 9846–9853, 2012.
Guo, Z., Jiang, W., Chen, S., Sun, D., Shi, L., Zeng, G., and Rui, M.: Stable isotopic compositions of elemental carbon in PM1.1 in north suburb of Nanjing region, China, Atmos. Res., 168, 105–111, 2016.
Hallquist, M., Wenger, J. C., Baltensperger, U., Rudich, Y., Simpson, D., Claeys, M., Dommen, J., Donahue, N. M., George, C., Goldstein, A. H., Hamilton, J. F., Herrmann, H., Hoffmann, T., Iinuma, Y., Jang, M., Jenkin, M. E., Jimenez, J. L., Kiendler-Scharr, A., Maenhaut, W., McFiggans, G., Mentel, Th. F., Monod, A., Prévôt, A. S. H., Seinfeld, J. H., Surratt, J. D., Szmigielski, R., and Wildt, J.: The formation, properties and impact of secondary organic aerosol: current and emerging issues, Atmos. Chem. Phys., 9, 5155–5236, https://doi.org/10.5194/acp-9-5155-2009, 2009.
Han, Y. M., Cao, J. J., Lee, S. C., Ho, K. F., and An, Z. S.: Different characteristics of char and soot in the atmosphere and their ratio as an indicator for source identification in Xi'an, China, Atmos. Chem. Phys., 10, 595–607, https://doi.org/10.5194/acp-10-595-2010, 2010.
Han, Y. M., Chen, L.W., Huang, R.J., Chow, J. C., Watson, J. G., Ni, H. Y., Liu, S. X., Fung, K. K., Shen, Z. X, Wei, C., Wang, Q. Y., Tian, J., Zhao, Z. Z., Prévôt, A. S. H., and Cao, J. J.: Carbonaceous aerosols in megacity Xi'an, China: implications of thermal/optical protocols comparison, Atmos. Environ., 132, 58–68, 2016.
Ho, K. F., Lee, S. C., Cao, J. J., Li, Y. S., Chow, J. C., Watson, J. G., and Fung, K.: Variability of organic and elemental carbon, water soluble organic carbon, and isotopes in Hong Kong, Atmos. Chem. Phys., 6, 4569–4576, https://doi.org/10.5194/acp-6-4569-2006, 2006.
Huang, L., Brook, J., Zhang, W., Li, S., Graham, L., Ernst, D., Chivulescu, A., and Lu, G.: Stable isotope measurements of carbon fractions (OC∕EC) in airborne particulate: a new dimension for source characterization and apportionment, Atmos. Environ., 40, 2690–2705, 2006.
Huang, R. J., Zhang, Y., Bozzeti, C., Ho, K. F., Cao, J. J., Han, Y., Daellenbach, K. R., Slowik, J.G., Platt, S. M., Canonaco, F., Zotter, P., Wolf, R., Pieber, S. M., Bruns, E. A., Crippa, M., Ciarelli, G., Piazzalunga, A., Schwikowski, M., Abbaszade, G., SchnelleKreis, J., Zimmermann, R., An, Z., Szidat, S., Baltensperger, U., El Haddad, I., and Prévôt, A. S. H.: High secondary aerosol contribution to particulate pollution during haze events in China, Nature, 514, 218–222, https://doi.org/10.1038/nature13774, 2014.
Huang, X. H. H., Bian, Q. J., Louie, P. K. K., and Yu, J. Z.: Contributions of vehicular carbonaceous aerosols to PM2.5 in a roadside environment in Hong Kong, Atmos. Chem. Phys., 14, 9279–9293, https://doi.org/10.5194/acp-14-9279-2014, 2014.
Iannone, R., Koppmann, R., and Rudolph, J.: Stable carbon kinetic isotope effects for the production of methacrolein and methyl vinyl ketone from the gas-phase reactions of isoprene with ozone and hydroxyl radicals, Atmos. Environ., 44, 4135–4141, 2010.
IPCC: Climate Change 2013: The Physical Science Basis, Cambridge University Press, Cambridge, United Kingdom and New York, NY, USA, 2013.
Irei, S., Huang, L., Collin, F., Zhang, W., Hastie, D., and Rudolph, J.: Flow reactor studies of the stable carbon isotope composition of secondary particulate organic matter generated by OH-radical-induced reactions of toluene, Atmos. Environ., 40, 5858–5867, 2006.
Irei, S., Rudolph, J., Huang, L., Auld, J., and Hastie, D.: Stable carbon isotope ratio of secondary particulate organic matter formed by photooxidation of toluene in indoor smog chamber, Atmos. Environ., 45, 856–862, 2011.
Jacobson, M. C., Hansson, H. C., Noone, K. J., and Charlson, R. J.: Organic atmospheric aerosols: review and state of the science, Rev. Geophys., 38, 267–294, 2000.
Kawashima, H. and Haneishi, Y.: Effects of combustion emissions from the Eurasian continent in winter on seasonal δ13C of elemental carbon in aerosols in Japan, Atmos. Environ., 46, 568–579, 2012.
Kirillova, E. N., Andersson, A., Sheesley, R. J., Kruså, M., Praveen, P., Budhavant, K., Safai, P., Rao, P., and Gustafsson, Ö.: 13C- and 14C-based study of sources and atmospheric processing of water-soluble organic carbon (WSOC) in South Asian aerosols, J.Geophys. Res.-Atmos., 118, 614–626, 2013.
Kirillova, E. N., Andersson, A., Han, J., Lee, M., and Gustafsson, Ö.: Sources and light absorption of water-soluble organic carbon aerosols in the outflow from northern China, Atmos. Chem. Phys., 14, 1413–1422, https://doi.org/10.5194/acp-14-1413-2014, 2014a.
Kirillova, E. N., Andersson, A., Tiwari, S., Srivastava, A. K., Bisht, D. S., and Gustafsson, Ö.: Water-soluble organic carbon aerosols during a full New Delhi winter: isotope-based source apportionment and optical properties, J. Geophys. Res.-Atmos., 119, 3476–3485, 2014b.
Laskin, A., Laskin, J., and Nizkorodov, S. A.: Chemistry of Atmospheric Brown Carbon, Chem. Rev., 115, 4335–4382, https://doi.org/10.1021/cr5006167, 2015.
Lelieveld, J., Evans, J., Fnais, M., Giannadaki, D., and Pozzer, A.: The contribution of outdoor air pollution sources to premature mortality on a global scale, Nature, 525, 367–371, 2015.
Levin, I., Naegler, T., Kromer, B., Diehl, M., Francey, R. J., GOMEZ-PELAEZ, A. J., Steele, L., Wagenbach, D., Weller, R., and Worthy, D. E.: Observations and modelling of the global distribution and long-term trend of atmospheric 14CO2, Tellus B, 62, 26–46, 2010.
Lewis, C. W., Klouda, G. A., and Ellenson, W. D.: Radiocarbon measurement of the biogenic contribution to summertime PM2.5 ambient aerosol in Nashville, TN, Atmos. Environ., 38, 6053–6061, 2004.
Liu, D., Li, J., Zhang, Y., Xu, Y., Liu, X., Ding, P., Shen, C., Chen, Y., Tian, C., and Zhang, G.: The use of levoglucosan and radiocarbon for source apportionment of PM2.5 carbonaceous aerosols at a background site in East China, Environ. Sci. Technol., 47, 10454–10461, 2013.
Liu, G., Li, J., Xu, H., Wu, D., Liu, Y., and Yang, H.: Isotopic compositions of elemental carbon in smoke and ash derived from crop straw combustion, Atmos. Environ., 92, 303–308, https://doi.org/10.1016/j.atmosenv.2014.04.042, 2014.
Liu, J., Li, J., Zhang, Y., Liu, D., Ding, P., Shen, C., Shen, K., He, Q., Ding, X., Wang, X., Chen, D., and Zhang, G.: Source apportionment using radiocarbon and organic tracers for PM2.5 carbonaceous aerosols in Guangzhou, South China: contrasting local-and regional-scale aaze events, Environ. Sci. Technol., 48, 12002–12011, 2014.
Liu, J., Li, J., Liu, D., Ding, P., Shen, C., Mo, Y., Wang, X., Luo, C., Cheng, Z., Szidat, S., Zhang, Y., Chen, Y., and Zhang, G.: Source apportionment and dynamic changes of carbonaceous aerosols during the haze bloom-decay process in China based on radiocarbon and organic molecular tracers, Atmos. Chem. Phys., 16, 2985–2996, https://doi.org/10.5194/acp-16-2985-2016, 2016a.
Liu, J., Li, J., Vonwiller, M., Liu, D., Cheng, H., Shen, K., Salazar, G., Agrios, K., Zhang, Y., He, Q., Ding, X., Zhong, G., Wang, X., Szidat, S., and Zhang, G.: The importance of non-fossil sources in carbonaceous aerosols in a megacity of central China during the 2013 winter haze episode: a source apportionment constrained by radiocarbon and organic tracers, Atmos. Environ., 144, 60–68, 2016b.
Masalaite, A., Holzinger, R., Remeikis, V., Roeckmann, T., and Dusek, U.: Characteristics, sources and evolution of fine aerosol (PM1) at urban, coastal and forest background sites in Lithuania, Atmos. Environ., 148, 62–76, 2017.
Minguillón, M. C., Perron, N., Querol, X., Szidat, S., Fahrni, S. M., Alastuey, A., Jimenez, J. L., Mohr, C., Ortega, A. M., Day, D. A., Lanz, V. A., Wacker, L., Reche, C., Cusack, M., Amato, F., Kiss, G., Hoffer, A., Decesari, S., Moretti, F., Hillamo, R., Teinilä, K., Seco, R., Peñuelas, J., Metzger, A., Schallhart, S., Müller, M., Hansel, A., Burkhart, J. F., Baltensperger, U., and Prévôt, A. S. H.: Fossil versus contemporary sources of fine elemental and organic carbonaceous particulate matter during the DAURE campaign in Northeast Spain, Atmos. Chem. Phys., 11, 12067–12084, https://doi.org/10.5194/acp-11-12067-2011, 2011.
Miyazaki, Y., Kawamura, K., Jung, J., Furutani, H., and Uematsu, M.: Latitudinal distributions of organic nitrogen and organic carbon in marine aerosols over the western North Pacific, Atmos. Chem. Phys., 11, 3037–3049, https://doi.org/10.5194/acp-11-3037-2011, 2011.
Mohn, J., Szidat, S., Fellner, J., Rechberger, H., Quartier, R., Buchmann, B., and Emmenegger, L.: Determination of biogenic and fossil CO2 emitted by waste incineration based on 14CO2 and mass balances, Bioresource Technol., 99, 6471–6479, 2008.
Mook, W. G. and van der Plicht, J.: Reporting 14C activities and concentrations, Radiocarbon, 41, 227–239, 1999.
NASA: MODIS thermal anomalies/fire, National Aeronautics & Space Administration, Greenbelt, MD, 2017.
Nel, A.: Air pollution-related illness: effects of particles, Science, 308, 804–806, 2005.
Niu, X., Cao, J., Shen, Z., Ho, S. S. H., Tie, X., Zhao, S., Xu, H., Zhang, T., and Huang, R.: PM2.5 from the Guanzhong Plain: chemical composition and implications for emission reductions, Atmos. Environ., 147, 458–469, 2016.
Palstra, S. W. and Meijer, H. A.: Biogenic carbon fraction of biogas and natural gas fuel mixtures determined with 14C, Radiocarbon, 56, 7–28, 2014.
Parnell, A. C., Inger, R., Bearhop, S., and Jackson, A. L.: Source partitioning using stable isotopes: coping with too much variation, PloS ONE, 5, e9672, https://doi.org/10.1371/journal.pone.009672, 2010.
Pavuluri, C. M. and Kawamura, K.: Enrichment of 13C in diacids and related compounds during photochemical processing of aqueous aerosols: new proxy for organic aerosols aging, Sci. Rep.-UK, 6, 36467, https://doi.org/10.1038/srep36467, 2016.
Pöschl, U.: Atmospheric aerosols: composition, transformation, climate and health effects, Angew. Chem. Int. Ed. Engl., 44, 7520–7540, 2005.
Reimer, P. J., Brown, T. A., and Reimer, R. W.: Discussion: reporting and calibration of post-bomb 14C data, Radiocarbon, 46, 1299–1304, 2004.
Stuiver, M. and Polach, H. A.: Discussion: Reporting of 14C data, Radiocarbon, 19, 355–363, 1977.
Sun, J., Shen, Z., Cao, J., Zhang, L., Wu, T., Zhang, Q., Yin, X., Lei, Y., Huang, Y., Huang, R., Liu, S., Han, Y., Xu, H., Zheng, C., and Liu, P.: Particulate matters emitted from maize straw burning for winter heating in rural areas in Guanzhong Plain, China: current emission and future reduction, Atmos. Res., 184, 66–76, 2017.
Sun, X., Hu, M., Guo, S., Liu, K., and Zhou, L.: 14C-Based source assessment of carbonaceous aerosols at a rural site, Atmos. Environ., 50, 36–40, 2012.
Szidat, S.: Sources of Asian haze, Science, 323, 470–471, 2009.
Szidat, S., Jenk, T. M., Synal, H. A., Kalberer, M., Wacker, L., Hajdas, I., Kasper-Giebl, A., and Baltensperger, U.: Contributions of fossil fuel, biomass-burning, and biogenic emissions to carbonaceous aerosols in Zurich as traced by 14C, J. Geophys. Res.-Atmos., 111, D07206, https://doi.org/10.1029/2005JD006590, 2006.
Tao, J., Zhang, L., Cao, J., and Zhang, R.: A review of current knowledge concerning PM2.5 chemical composition, aerosol optical properties and their relationships across China, Atmos. Chem. Phys., 17, 9485–9518, https://doi.org/10.5194/acp-17-9485-2017, 2017.
van der Plicht, J., Wijma, S., Aerts, A., Pertuisot, M., and Meijer, H.: Status report: the Groningen AMS facility, Nucl. Instrum. Meth. B, 172, 58–65, 2000.
Wang, Q., Huang, R. J., Zhao, Z., Cao, J., Ni, H., Tie, X., Zhao, S., Su, X., Han, Y., Shen, Z., Wang, Y., and Zhang, N.: Physicochemical characteristics of black carbon aerosol and its radiative impact in a polluted urban area of China, J. Geophys. Res.-Atmos., 121, 12505–12519, https://doi.org/10.1002/2016JD024748, 2016.
Watson, J. G.: Visibility: Science and regulation, J. Air Waste Manage., 52, 628–713, 2002.
Watson, J. G., Chow, J. C., Chen, L.-W. A., and Frank, N. H.: Methods to assess carbonaceous aerosol sampling artifacts for IMPROVE and other long-term networks, J. Air Waste Manage., 59, 898–911, 2009.
Winiger, P., Andersson, A., Yttri, K. E., Tunved, P., and Gustafsson, Ö.: Isotope-based source apportionment of EC aerosol particles during winter high-pollution events at the Zeppelin Observatory, Svalbard, Environ. Sci. Technol., 49, 11959–11966, https://doi.org/10.1021/acs.est.5b02644, 2015.
Winiger, P., Andersson, A., Eckhardt, S., Stohl, A., and Gustafsson, Ö.: The sources of atmospheric black carbon at a European gateway to the Arctic, Nat. Commun., 7, 12776, https://doi.org/10.1038/ncomms12776, 2016.
Xi'an Municipal Bureau of Statistics and NBS Survey Office in Xi'an: Xi'an Statistical Yearbook, China Statistics Press, Beijing, China, 2009 (in Chinese).
Xi'an Municipal Bureau of Statistics and NBS Survey Office in Xi'an: Xi'an Statistical Yearbook, China Statistics Press, Beijing, China, 2010 (in Chinese).
Xi'an Municipal Bureau of Statistics and NBS Survey Office in Xi'an: Xi'an Statistical Yearbook, China Statistics Press, Beijing, China, 2014 (in Chinese).
Xie, M., Hays, M., and Holder, A.: Light-absorbing organic carbon from prescribed and laboratory biomass burning and gasoline vehicle emissions, Sci. Rep.-UK, 7, 7318, https://doi.org/10.1038/s41598-017-06981-8, 2017.
Xu, H., Cao, J., Ho, K., Ding, H., Han, Y., Wang, G., Chow, J., Watson, J., Khol, S., Qiang, J., and Li, W.: Lead concentrations in fine particulate matter after the phasing out of leaded gasoline in Xi'an, China, Atmos. Environ., 46, 217–224, 2012.
Xu, H., Cao, J., Chow, J. C., Huang, R.-J., Shen, Z., Chen, L. A., Ho, K. F., and Watson, J. G.: Inter-annual variability of wintertime PM2.5 chemical composition in Xi'an, China: evidences of changing source emissions, Sci. Total Environ., 545, 546–555, 2016.
Yan, C., Zheng, M., Bosch, C., Andersson, A., Desyaterik, Y., Sullivan, A. P., Collett, J. L., Zhao, B., Wang, S., He, K., and Gustafsson, Ö.: Important fossil source contribution to brown carbon in Beijing during winter, Sci. Rep.-UK, 7, 43182, https://doi.org/10.1038/srep43182, 2017.
Yu, J. Z., Xu, J., and Yang, H.: Charring characteristics of atmospheric organic particulate matter in thermal analysis, Environ. Sci. Technol., 36, 754–761, 2002.
Zenker, K., Vonwiller, M., Szidat, S., Calzolai, G., Giannoni, M., Bernardoni, V., Jedynska, A. D., Henzing, B., Meijer, H. A., and Dusek, U.: Evaluation and Inter-comparison of oxygen-based OC-EC separation methods for radiocarbon analysis of ambient aerosol particle samples, Atmosphere, 8, 226, https://doi.org/10.3390/atmos8110226, 2017.
Zhang, T., Cao, J.-J., Chow, J. C., Shen, Z.-X., Ho, K.-F., Ho, S. S. H., Liu, S.-X., Han, Y.-M., Watson, J. G., Wang, G.-H., and Huang, R.-J.: Characterization and seasonal variations of levoglucosan in fine particulate matter in Xi'an, China, J. Air Waste Manage., 64, 1317–1327, https://doi.org/10.1080/10962247.2014.944959, 2014.
Zhang, Y. L. and Cao, F.: Fine particulate matter (PM2.5) in China at a city level, Sci. Rep.-UK, 5, 14884, https://doi.org/10.1038/srep14884, 2015a.
Zhang, Y. L. and Cao, F.: Is it time to tackle PM2.5 air pollutions in China from biomass-burning emissions?, Environ. Pollut., 202, 217–219, 2015b.
Zhang, Y. L., Li, J., Zhang, G., Zotter, P., Huang, R.-J., Tang, J.-H., Wacker, L., Prévôt, A. S. H., and Szidat, S.: Radiocarbon-based source apportionment of carbonaceous aerosols at a regional background site on Hainan Island, South China, Environ. Sci. Technol., 48, 2651–2659, https://doi.org/10.1021/es4050852, 2014a.
Zhang, Y. L., Liu, J. W., Salazar, G. A., Li, J., Zotter, P., Zhang, G., Shen, R. R., Schäfer, K., Schnelle-Kreis, J., and Prévôt, A. S.: Micro-scale (µg) radiocarbon analysis of water-soluble organic carbon in aerosol samples, Atmos. Environ., 97, 1–5, 2014b.
Zhang, Y.-L., Huang, R.-J., El Haddad, I., Ho, K.-F., Cao, J.-J., Han, Y., Zotter, P., Bozzetti, C., Daellenbach, K. R., Canonaco, F., Slowik, J. G., Salazar, G., Schwikowski, M., Schnelle-Kreis, J., Abbaszade, G., Zimmermann, R., Baltensperger, U., Prévôt, A. S. H., and Szidat, S.: Fossil vs. non-fossil sources of fine carbonaceous aerosols in four Chinese cities during the extreme winter haze episode of 2013, Atmos. Chem. Phys., 15, 1299–1312, https://doi.org/10.5194/acp-15-1299-2015, 2015a.
Zhang, Y. L., Schnelle-Kreis, J., Abbaszade, G., Zimmermann, R., Zotter, P., Shen, R. R., Schäefer, K., Shao, L., Prévôt, A., and Szidat, S.: Source apportionment of elemental carbon in Beijing, China: insights from radiocarbon and organic marker measurements, Environ. Sci. Technol., 49, 8408–8415, 2015b.
Zhang, Y. L., Ren, H., Sun, Y., Cao, F., Chang, Y., Liu, S., Lee, X., Agrios, K., Kawamura, K., Liu, D., Ren, L., Du, W., Wang, Z., Prévôt, A. S. H., Szidat, S., and Fu, P.: High contribution of nonfossil sources to submicrometer organic aerosols in Beijing, China, Environ. Sci. Technol., 51, 7842–7852, 2017.
Zhang, Y. X., Schauer, J. J., Zhang, Y. H., Zeng, L. M., Wei, Y. J., Liu, Y., and Shao, M.: Characteristics of particulate carbon emissions from real-world Chinese coal combustion, Environ. Sci. Technol., 42, 5068–5073, 2008.
Zhu, C. S., Cao, J. J., Tsai, C. J., Zhang, Z. S., and Tao, J.: Biomass burning tracers in rural and urban ultrafine particles in Xi'an, China, Atmos. Pollut. Res., 8, 614–618, https://doi.org/10.1016/j.apr.2016.12.011, 2017.
Zhuang, Z., Li, Y., Chen, B., and Guo, J.: Chinese kang as a domestic heating system in rural northern China – a review, Energ. Buildings, 41, 111–119, 2009.