the Creative Commons Attribution 4.0 License.
the Creative Commons Attribution 4.0 License.
Trends in air pollutants and health impacts in three Swedish cities over the past three decades
Bertil Forsberg
Hans Orru
Mårten Spanne
Hung Nguyen
Peter Molnár
Christer Johansson
Air pollution concentrations have been decreasing in many cities in the developed countries. We have estimated time trends and health effects associated with exposure to NOx, NO2, O3, and PM10 (particulate matter) in the Swedish cities Stockholm, Gothenburg, and Malmö from the 1990s to 2015. Trend analyses of concentrations have been performed by using the Mann–Kendall test and the Theil–Sen method. Measured concentrations are from central monitoring stations representing urban background levels, and they are assumed to indicate changes in long-term exposure to the population. However, corrections for population exposure have been performed for NOx, O3, and PM10 in Stockholm, and for NOx in Gothenburg. For NOx and PM10, the concentrations at the central monitoring stations are shown to overestimate exposure when compared to dispersion model calculations of spatially resolved, population-weighted exposure concentrations, while the reverse applies to O3. The trends are very different for the pollutants that are studied; NOx and NO2 have been decreasing in all cities, O3 exhibits an increasing trend in all cities, and for PM10, there is a slowly decreasing trend in Stockholm, a slowly increasing trend in Gothenburg, and no significant trend in Malmö. Trends associated with NOxand NO2 are mainly attributed to local emission reductions from traffic. Long-range transport and local emissions from road traffic (non-exhaust PM emissions) and residential wood combustion are the main sources of PM10. For O3, the trends are affected by long-range transport, and there is a net removal of O3 in the cities. The increasing trends are attributed to decreased net removal, as NOx emissions have been reduced.
Health effects in terms of changes in life expectancy are calculated based on the trends in exposure to NOx, NO2, O3, and PM10 and the relative risks associated with exposure to these pollutants. The decreased levels of NOx are estimated to increase the life expectancy by up to 11 months for Stockholm and 12 months for Gothenburg. This corresponds to up to one-fifth of the total increase in life expectancy (54–70 months) in the cities during the period of 1990–2015. Since the increased concentrations in O3 have a relatively small impact on the changes in life expectancy, the overall net effect is increased life expectancies in the cities that have been studied.
- Article
(5033 KB) - Full-text XML
- BibTeX
- EndNote
Air pollution exposure is clearly recognized as an important global risk factor for the development of a large number of diseases and disabilities (Cohen et al., 2017). In 2015, exposure to PM2.5 (particle matter with an aerodynamic diameter smaller than 2.5 micrometer) was ranked number five among all risk factors for premature deaths where smoking, diet, and high blood pressure are included. It is estimated to have caused 4.2 million premature deaths among the world's population. This can be compared to smoking, with a corresponding value of 6.4 million premature deaths for the year 2015 (State of Global Air, 2017).
In view of the apparent major health impact associated with exposure to air pollutants, it is of great importance to analyze the trends in air pollution concentrations, and how these affect the public health.
Worldwide, many cities, especially in high-income countries, show substantial decreasing trends in air pollution concentrations (e.g., WHO, 2016a; Geddes et al., 2016; Colette et al., 2011). Considering the changes in the total emissions in Europe and the US, there are different conditions. In Europe (EU-27), during the period of 2002–2011, the emissions of nitrogen oxides (NOx = sum of NO and NO2) have decreased by 27 %, and the emissions of primary PM10 (particle matter with an aerodynamic diameter smaller than 10 micrometer) have decreased by 14 % (Guerreiro et al., 2014). In the US, the NOx emissions in eight cities have decreased by between 25 % and 48 % during the period of 2005–2012 (Tong et al., 2015). Considering the trends in the US regarding all sector-specific emissions during the period of 1990–2010, NOx exhibits a decrease of 48 %, while PM10 exhibits a decrease of 50 % (Xing et al., 2013). So, the NOx and PM10 emissions have decreased almost equally in the US, while in Europe, the emissions regarding NOx exhibit a sharper decline compared to PM10 (Guerreiro et al., 2014). However, it should also be noted that there are large between-country variations in NOx emission trends, partly reflecting that some countries have had problems meeting the original National Emission Ceilings and the Air Quality directives (EEA, 2017).
For ozone (O3) in Europe, the concentrations tend to increase at urban sites, especially during the cold season, as observed by Sicard et al. (2016) for cities in France and by Colette et al. (2011) for most cities in Europe. This rise can be explained by increases in imported O3 by long-range transport and also by a decreased titration by nitrogen monoxide (NO) due to the reduction in local NOx emissions (Colette et al., 2011; Sicard et al., 2016). However, trends in O3 are also different for summer and winter, with mainly decreasing trends in the summer and increasing trends in the winter, and there are also some variations between cities in the EU (EEA, 2016). Furthermore, considering different statistical metrics, the trends for O3 at both urban and rural sites in the UK are different during the period of 1993–2011, depending on the metric that is used; mean and median trends are positive, while the maximum trend is negative (Munir et al., 2013). In northern Alberta in Canada, where measurement results from four urban locations were analyzed, the mean concentrations of O3 have increased at most stations during the period of 1998–2014 (Bari and Kindziersky, 2016).
This means that the general population exposure and presumably also associated health effects of the urban populations have been reduced for NOx and PM10 but increased for the mean O3 concentrations. So far there are, however, rather few studies that have assessed the net health gain or health loss associated with the trends. Henschel et al. (2012) have examined intervention studies focusing on improvements in air quality and associated health benefits for the assessed population. Some studies have focused on trends and effects associated with particulate matter (Tang et al., 2014; Keuken et al., 2011; Correria et al., 2013), and some studies have also included ozone (Fann and Risley, 2013; Gramsch et al., 2006). Correria et al. (2013) estimated that for the most urban communities in the USA, as much as 18 % of the increase in life expectancy from 2000 to 2007 was attributable to the reduction in PM2.5. When health improvements associated with PM2.5 trends are compared to those for O3, the health benefits associated with PM2.5 are much greater (Fann and Risley, 2013).
In a few studies, air quality dispersion models together with gridded population data and exposure-response functions have been used to assess health impacts of changing air pollutant emissions. For example, for Rotterdam (the Netherlands), the health benefits associated with decreasing trends for EC (elemental carbon) and PM10 have been calculated for the period of 1985–2008, and the average gain in life expectancy was 13 and 12 months per person for PM10 and EC, respectively (Keuken et al., 2011). Fann and Risley (2013) estimated changes in ozone and PM2.5 concentrations in the US during the period of 2000–2007, and they estimated the impact on the number of premature deaths by using health-impact functions based on short-term relative risk estimates for O3 and long-term relative risk estimates for PM2.5. Data from monitoring stations were spatially interpolated. Overall, they found net benefits in the number of premature deaths ranging from 22 000 to 60 000 for PM2.5 and from 880 to 4100 for ozone, but interestingly, they found opposing trends in premature mortality associated with PM2.5 and ozone at some locations and a considerable year to year variation in the number of premature deaths. Tang et al. (2014) evaluated the health benefits associated with coal-burning factory shutdowns and accompanied decreasing levels of PM10 in Taiyuan in China during the period of 2001–2010. They used PM10 measurements from monitoring stations, though without considering spatial variations in the exposures, and they used the Chinese national standard of 40 µg m−3 as a threshold level. The number of premature deaths associated with PM10 levels dropped from 4948 in 2001 to 2138 in 2010, though they did not include other pollutants in their analysis.
The studies that have been referenced above have used different methodologies of estimating the exposure by simply taking the concentration at the monitoring stations and making spatial interpolations between several monitoring stations or by using dispersion modeling to estimate the spatial distribution of the exposure concentrations. They have also used different relative risks for mortality and different ways to apply the baseline mortality and the health-effect exposure threshold.
The objective of this study is to quantify and compare the changes in life expectancy resulting from changes in different pollutants, namely NOx, NO2, O3, and PM10, based on measurements during 25 years in the three largest cities in Sweden. We show that the health impacts related to change in different pollutants are different, and we aim to discuss how different trends in different air pollutants affect the life expectancy assessment.
2.1 The choice of air pollutants for trend analysis
Our main trend analyses are based on simultaneous, continuous measurements of NOx, NO2, O3, and PM10 during the period of 1990 to 2015 in Stockholm, Gothenburg, and Malmö, which are the three largest cities in Sweden. Based on these trends, we calculate the health impacts associated with changes in the population exposure. The changes in life expectancy are calculated with the mean values and the 95 % confidence intervals (CIs) of the relative risks, while for the trends and the population-weighted exposure concentrations, only the median and the mean values, respectively, have been used without considering their confidence intervals. This means that the ranges of the confidence intervals are narrower than they would have been if the confidence intervals of the trend lines and the population-weighted exposure concentrations were also included in the calculations. NO2, O3, and PM10 have been regulated in the EU directives, and these regulations also set methods, quality assurance, and control (EU, 2008), making these pollutants relevant to analyze in our study.
2.2 Measuring sites and instrumentation
In all analyzed cities, the measuring site is located in the city center and represents the urban background (Fig. 1). Stockholm is the capital and the largest city in Sweden and has a temperate climate with four distinct seasons. Gothenburg is the second largest city, located on the west coast of Sweden. It is like Stockholm, located within the west wind belt, but the proximity to the Atlantic Ocean means a slightly milder climate compared to Stockholm. Malmö is located in the southernmost part of Sweden. General information about the three cities regarding population structure, life expectancy at birth, and baseline mortality is presented in Table A1.
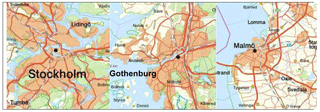
Figure 1Stockholm, Gothenburg, and Malmö: the three largest cities in Sweden, and their surroundings. The black dot in each city shows the location of the measuring station. Each map represents an area of 35×35 km.
The measuring station in Stockholm is located at Torkel Knutssonsgatan on a roof 20 m a.g.l., in Gothenburg it is located on a roof 30 m a.g.l. in the neighborhood Östra Nordstan, and in Malmö it is located on a roof 20 m a.g.l. at the city hall (Rådhuset) in the city center (Fig. 1). They are all regulatory monitoring urban background stations using reference methods. In all stations, PM10 has been measured by using a tapered element oscillating microbalance (TEOM 1400A, Thermo Fisher Scientific, USA). However, in Gothenburg, a continuous dichotomous ambient air monitor (1405-DF TEOM, Thermo Fisher Scientific) has also been used. Nitrogen oxides were measured in all stations by using chemiluminescence (AC 32M, Environnement SA., France). In Stockholm, ozone was measured by using UV absorption (O342M, Environnement SA., France). In Gothenburg, ozone has been measured by using nondispersive UV photometry (EC9811, Ecotech Pty Ltd., Australia) and chemiluminescence (CLD 700 AL, Ecophysics, Switzerland; and more recently T200, Teledyne, USA). In Malmö, ozone has been measured by using UV absorption (Thermo Environmental Instruments Model 49C, USA).
2.3 Statistical analysis of the trends
The changes in air pollution concentrations during the period of 1990–2015 have been calculated by using the Openair package (Carslaw and Ropkins, 2012). For the trend analyses, the Mann–Kendall test and the Theil–Sen method have been used. The Mann–Kendall test is a nonparametric trend test which is based on the ranking of observations (Hirsch et al. 1982). The Theil–Sen method is used to calculate the median slope of all possible slopes that may occur between the data points (Theil, 1992; Sen, 1968). In our calculations, the trends are based on monthly averages, and they are adjusted for seasonal variations, as these can have a significant effect on monthly data. The Theil–Sen method is regarded as more suitable than the linear-regression method, as it gives more accurate confidence intervals with non-normally distributed data, and it is not affected as much by outliers.
2.4 Health impact and life expectancy calculations
Trends in urban background concentrations reflect the change in population exposure over time (see further below), and they are used to calculate changes in health impacts, presented as changes in life expectancy. As basis for the calculations, we use the population size, age distribution, and mortality rate in Stockholm, Gothenburg, and Malmö according to the year 1997, where data in different age groups have been taken from Statistics Sweden (SCB, 2017), and from the Swedish National Board of Health and Welfare (Socialstyrelsen, 2017). Mortality data before 1997 are not available. However, our own test runs have shown that the calculations in life expectancy give very similar results regardless of the year (1997–2015) in which the population structure and mortality statistics are based on. To illustrate the health benefits associated with decreasing trends, the increase in life expectancy at birth has been calculated in AirQ+ according to a log-linear function (Eq. 1). Similarly, the decrease in life expectancy at birth associated with increasing trends has been calculated in AirQ+ according to the same log-linear function (Eq. 1) (WHO, 2016b). We have applied relative risks obtained from previous epidemiological studies, where the relationships between mortality and exposure to NOx, NO2, O3, and PM10 have been analyzed. The concept relative risk (RR) represents a log-linear exposure-response function, where the ratio of the incidence in an exposed group is compared to the incidence in a nonexposed or a less exposed group. The mortality rate associated with a change in exposure to pollutant x is calculated as
where the beta-coefficient (β) indicates the linear relationship between the health impact and the change (x−x0) in exposure.
-
For NOx, we apply the RR 1.06 (95 % CI 1.03–1.09) per 10 µg m−3 increase based on the results from Stockfelt et al. (2015), representing all-cause mortality associated with long-term exposure to NOx in a cohort with men in Gothenburg.
-
For NO2, we apply the RR 1.066 (95 % CI 1.029–1.104) per 10 µg m−3 increase. This RR is based on pooled estimates of mortality associated with long-term exposure to NO2 (Faustini et al., 2014).
-
For O3, we apply the RR 1.02 (95 % CI 1.01–1.04) per 10 ppb increase, corresponding to 1.01 (95 % CI 1.005–1.02) per 10 µg m−3 at 25 ∘C and 1 atm, based on a large prospective study examining the associations between long-term ozone exposure and all-cause and cause-specific mortality (Turner et al., 2016).
-
For PM10, we apply the RR 1.04 (95 % CI 1.00–1.09) per 10 µg m−3 increase, which is based on a meta-analysis of 22 European cohorts (Beelen et al., 2014). This value is also in line with the RR estimate of 1.043 (95 % CI 1.026–1.061) per 10 µg m−3 increase, from many years used in impact assessments (Künzli et al., 2000), based on cohort studies in the US.
All RRs described above are based on calculations for the population aged 30 years and over, and therefore, the changes in life expectancy, calculated in AirQ+, are also based on the age group 30 years old and over. The calculations have also been performed by assuming no threshold under which no effect occurs.
2.5 Relationship between urban background concentrations and population-weighted exposure concentrations
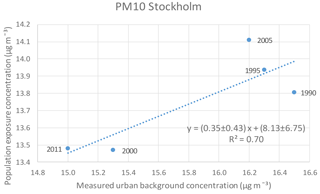
The trends measured at urban background monitoring stations may not be representative for the trends in exposure to the entire population in those areas, due to the position of the urban background measuring stations, the spatial variation in air pollution concentrations, and the variability in the population density within the cities. In order to assess the health effects of the population, associated with changes in air pollution exposure in each metropolitan area, we estimated the relations between the concentrations at the urban background monitoring stations and the population-weighted exposure concentrations. This is assessed by comparing model-calculated annual population-weighted exposure concentrations with annual-mean urban background concentrations. We have done this for NOx in Stockholm and Gothenburg and for O3 and PM10 in Stockholm, but due to lack of data, these relations have not been possible to calculate for other than the above-mentioned pollutants and cities.
Geographically resolved annual-mean concentrations of NOx in Stockholm were calculated by using a wind model and a Gaussian air quality dispersion model as a part of the Airviro system (Airviro, 2017). Details on the modeling and emission data are described in Johansson et al. (2017). The same modeling of NOx was done for Gothenburg by using a Gaussian model (Aermod, US EPA) as a part of the EnviMan AQ Planner (OPSIS, Furulund, Sweden) as described in Molnár et al. (2015).
Spatially resolved O3 concentrations in Stockholm are calculated from a combination of measurements and dispersion modeling of NOx concentrations. The modeled NOx concentrations are converted to O3 based on the measured NOx concentrations at an urban background site in Stockholm, and the difference between O3 at an urban background site and at a rural background site. The basic chemistry behind this is that the O3 concentration within a city is controlled by the transport from the surrounding areas into the city and by the removal of O3 due to the reaction with NO (nitrogen monoxide). If O3 at the urban background is higher compared to the rural background, then it is set to the same value as the urban background, and if it becomes less than zero, it is set to zero. More details of this method is described in Olsson et al. (2016).
Population-weighted exposure concentrations (Cpop) are obtained by multiplying the calculated concentration (Ci) in each grid-square cell with the number of people in the corresponding grid-square cell (Pi), summing all products, and dividing the sum by the total population (Eq. 2). This procedure has been used in several previous studies (e.g., Johansson et al., 2009; Orru et al., 2015).
The relationships between urban background levels and population-weighted exposure concentrations are presented in Figs. A1–A4 in the Appendix.
3.1 Overview of trends
Figures 2–4 show the trends in concentrations of NOx, NO2, O3, and PM10 measured at urban background sites in Stockholm, Gothenburg, and Malmö during the period of 1990–2015. During the given time periods, NOx and NO2 exhibit decreasing trends in all cities, whereas O3 exhibits increasing trends in all cities, and for PM10, the trends are less clear and consistent. For PM10 in Stockholm and Malmö, the data from the measuring stations only include the period of 1997–2015 and 1996–2015, respectively. In several cases, the trends are not perfectly linear throughout the periods (Figs. 2–4).
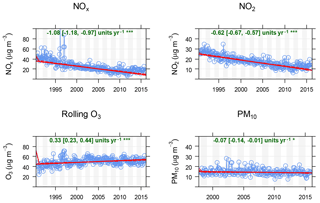
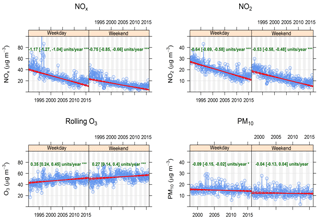
Figure 2Stockholm: trends in NOx, NO2, O3, and PM10 measured from 1990 to 2015. For PM10, data are only for the period of 1997–2015. The blue rings are the deseasonalized monthly averages, and the calculated trends using the Theil–Sen method are shown as the red thick lines. The unit for the trends is µg m−3 year−1, and the values in parentheses are 95 % confidence intervals. The asterisks (*) represent the significance level of the trend lines, where three asterisks means that p<0.001, and one asterisk means that 0.01<p<0.05.
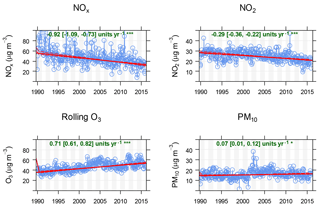
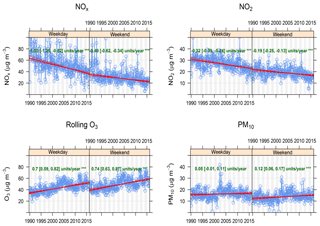
Figure 3Gothenburg: trends in NOx, NO2, O3, and PM10, measured from 1990 to 2015. The blue rings are the deseasonalized monthly averages, and the calculated trends using the Theil–Sen method are shown as the red thick lines. The unit for the trends is µg m−3 year−1, and the values in parentheses are 95 % confidence intervals. The asterisks (*) represent the significance level of the trend lines, where three asterisks means that p<0.001, and one asterisk means that 0.01<p<0.05.
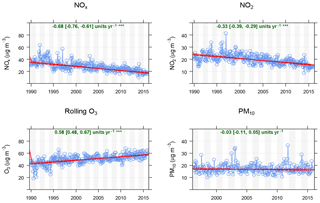
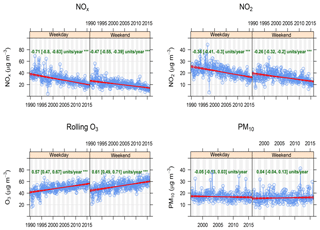
Figure 4Malmö: trends in NOx, NO2, O3, and PM10, measured from 1990 to 2015. For PM10, data are only for the period of 1996–2015. The blue rings are the deseasonalized monthly averages, and the calculated trends using the Theil–Sen method are shown as the red thick lines. The unit for the trends is µg m−3 year−1, and the values in parentheses are 95 % confidence intervals. The asterisks (*) represent the significance level of the trend lines, where three asterisks means that p<0.001, and one asterisk means that 0.01<p<0.05.
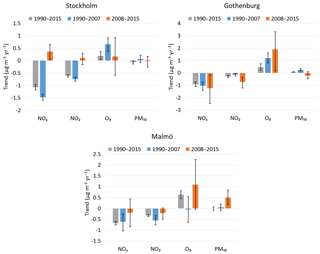
Figure 5The trends for the measured pollutants in µg m−3 year−1 (95 % CI) for the whole period and divided into two smaller periods.
For NOx, NO2, and PM10, the trends are based on the monthly average concentrations, and for O3, they are based on rolling 8 h daily maximum concentrations. This means that the maximum of all 8 h mean values during 24 h is calculated with the requirement that the data capture is at least 6 h. The monthly average is then calculated as the average of the daily maximum 8 h mean values. The reason for this division is that the relative risk of O3, used in our health-impact calculations, is based on 8 h daily maximum values. In Figs. 2–4, the median slopes are calculated according to the Theil–Sen method (Theil, 1992; Sen, 1968).
In Fig. 5, we show the trends for the first period of 1990–2007, and for the second period of 2008–2015 separately (except for PM10, which for Stockholm is from 1997 to 2007 and from 2008 to 2015, and for Malmö from 1996 to 2007 and from 2008 to 2015). In Stockholm, the NOx and NO2 concentrations have decreased significantly from 1990 to 2007, but for 2008–2015, there is even a tendency for increasing concentrations. The patterns are somewhat different in Gothenburg and Malmö.
There are also significantly different trends during weekdays and weekends in the three cities. In Figs. 6–8, the trends have been divided into weekdays and weekends, reflecting the importance of local emissions compared to nonlocal emissions, where local emissions from traffic are more prominent during weekdays compared to weekends. Figures 6–8 are otherwise designed in the same manner as Figs. 2–4. For NOx and NO2, the downward trends in all cities are more prominent during weekdays compared to weekends, indicating that local emission reductions, mainly from traffic, have had the greatest impact. For O3, the increasing trends in Gothenburg and Malmö are slightly higher during the weekends compared to the weekdays, while this does not apply to Stockholm. The trends related to PM10 are less clear, and they are also in many cases not statistically significant. Possible reasons for the appearances of the trends are further analyzed in the discussion section.
All the trends, except for PM10 in Malmö, are statistically significant within a 95 % CI. It can be noted that the rate of decreasing NOx is highest in Stockholm, then Gothenburg, and lowest in Malmö, whereas the opposite order is for the rate of increasing O3 concentrations. If the change in O3 was only associated with local NO titration, the opposite would be expected, so this indicates that other factors are also important for the O3 trends, like the O3 concentrations at the regional background sites outside the cities.
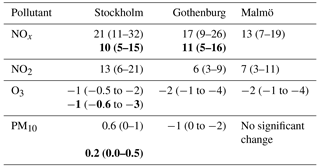
Table 1Change in life expectancy in months with 95 % CI in brackets, caused by a change in exposure during the measured periods. Decreasing trends are associated with an increase in life expectancy, and increasing trends are associated with a decrease in life expectancy (minus signs). The changes in life expectancy, adjusted for population-weighted exposure concentrations (see Sect. 2.5 and Figs. A1–A4), are presented in bold below the ordinary values. Note that the trend of PM10 in Stockholm is only for the period of 1997–2015.
3.2 Health impact assessment associated with the trends in air pollution concentrations
3.2.1 Change in life expectancy
In order to estimate the health impacts associated with changing concentrations of NOx, NO2, O3, and PM10 in Stockholm Gothenburg, and Malmö, the concentration changes during the given time periods for the pollutants, presented in Figs. 2–4, and the relative risks, presented in Sect. 2.4, have been used. Adjustments for population-weighted exposure concentrations have also been performed in the cases where data are available (Figs. A1–A4). The changes in life expectancy are calculated with the mean values and the 95 % confidence intervals of the relative risks, while for the trends and the population-weighted exposure concentrations, only the median and the mean values, respectively, have been used, though without considering their confidence intervals. NOx and NO2 exhibit decreasing trends in all cities, which means an increase in life expectancy (positive values). The opposite applies to O3, with increasing trends in all cities. For PM10, there is a decreasing trend in Stockholm with an increase in life expectancy, and an increasing trend in Gothenburg with a decrease in life expectancy. For PM10 in Malmö, however, no life expectancy change has been possible to calculate due to the lack of a significant trend (see Fig. 4). The detailed results are presented in Table 1.
The largest increase in life expectancy is expected due to the reduction in NOx and somewhat less due to the reduction in NO2 concentrations. The decrease in NOx levels corresponds to up to about 20 % of the total population life expectancy increase of between 54 and 70 months during the period of 1990–2015 (Table A1). Alternatively, the increase in ozone exposure might have caused the life expectancy to decrease within 1 to 2 months. For PM10, the effects are very mixed; in Stockholm there might have been a small increase in life expectancy, whereas in Gothenburg a small decrease has appeared, and for Malmö no life expectancy change has been possible to calculate.
4.1 Trends in concentrations
4.1.1 NOx and NO2
In all three cities, the NOx and NO2 trends for urban background concentrations are decreasing. The emissions of NOx and PM from different sectors during 1990–2015 have been quantified for Stockholm and Gothenburg as part of a Swedish research programme called SCAC (http://www.scac.se/, last access: 7 September 2018) (Segersson et al., 2017; Stockfelt et al., 2017). These studies show that the emissions of NOx in both Stockholm and Gothenburg are dominated by the contribution from road traffic. The emissions dropped by 60 % to 70 % from 1990 to 2011 in Gothenburg (inferred from Fig. 3a in Stockfelt et al., 2017). A similar trend in road traffic emissions is calculated for Stockholm based on reported emission data for 1993 and 2017 (SLB, 1995 and SLB, 2018a). This is mainly due to decreased vehicle emissions associated with the renewal of the vehicle fleet. The effect of changes in the number of vehicle kilometers is relatively small compared to the effect of lower emissions per kilometer. Other local sources have a minor impact on NOx, as shown for Stockholm in Johansson et al. (2008). The rural background concentrations of NOx outside the cities are low (2–8 µg m−3 or between 6 % and 14 % of the urban background concentrations) and not very important for the overall trend (Fig. 9 in IVL, 2016). The importance of road traffic is also consistent with the clear difference between the trends measured during weekdays and weekends (Figs. 6–8).
In the case of Stockholm, the downward trend diminishes almost entirely from 2008 onwards and exhibits rather an increasing trend (Fig. 5). Based on statistics on the share of new registrations of diesel vehicles in the three cities during the period of 2008–2015, the proportion of new registrations of diesel vehicles has been greatest in the Stockholm area, which possibly can explain these slightly increasing NOx and NO2 trends seen in Stockholm from 2008 onwards, but not in Gothenburg and Malmö (BilSweden, 2018).
Comparing NOx and NO2 in the three cities, the decreasing trends for NOx are much more pronounced compared to NO2. The proportion of NOx that is NO2 has been shown to be increasing at curbside sites in many cities, and this has partly been attributed to more directly emitted NO2 due to the increase in diesel vehicles equipped with oxidation catalysts (Carslaw, 2005) and particle filters (Grice et al., 2009). However, for urban background sites, the observed increased share of NO2 and associated slower decline in concentrations compared to NOx are mainly related to the change in O3 ∕ NOx equilibrium, caused by decreased NOx and increased O3 concentrations (Keuken et al., 2009) and not by the direct NO2 emissions.
4.1.2 Ozone
The 8 h daily maximum O3 levels exhibit increasing trends in all three cities during the period of 1990–2015. Since the concentrations of O3 are lower at central urban background sites in the cities compared to outside the cities, the net effect of the ozone cycle is that ozone is consumed, mainly due to the titration involving its reaction with NO. Reduced emissions of NO mean that less O3 is consumed due to a reduction of the NO titration, and thereby an increasing trend arises, consistent with many other cities in Europe (Sicard et al., 2016).
The increasing trend of O3 in Stockholm, based on 8 h daily maximum values, is weaker compared to Gothenburg and Malmö, even though the NOx trend in Stockholm exhibits a sharper decline compared to Gothenburg and Malmö. This may, however, be explained by considering the trends in the regional background concentrations of O3. The regional background concentrations of O3 are measured at Aspvreten 60 km SW of Stockholm, at Råö 45 km S of Gothenburg, and at Vavihill 50 km N of Malmö. The trend for O3 at Aspvreten is more sharply decreasing in comparison with the trends at Råö and Vavihill (SEPA, 2017a). This means that the site transport of O3 into Stockholm during 1990–2015 decreases more strongly in relation to Gothenburg and Malmö, which explains the weakest increasing O3 trend in Stockholm, despite the sharpest decreasing NOx trend. The differences between the regional background trends in O3 may explain the absence of pronounced anticorrelations between NOx and O3 in the cities.
4.1.3 PM10
The trends for PM10 are not as clear as those for NOx and O3. Only Stockholm exhibits a significant downward trend for the entire period. PM10 is a mixture of locally produced particles and the long-range transport of particles from emissions in other countries. The main local (primary) emissions of PM10 are non-exhaust particles from road traffic, ranging from 25 % to 55 %, and biomass burning ranging from 30 % to 35 % (Segersson et al. 2017; Stockfelt et al., 2017). Primary vehicle exhaust particles contribute less than 10 % of the total mass (Johansson et al., 2007). Road wear due to the use of studded winter tires is the main source of non-exhaust PM10. The decreasing trend of PM10 in Stockholm can be explained by the reduced use of studded tires and also by dust binding that has been introduced in the recent years (SLB, 2015).
Unlike Stockholm, Gothenburg exhibits increasing trends for PM10 during the measurement period (Figs. 3 and 7), however, not significantly during weekdays. According to Fig. 5, the trend for PM10 in Gothenburg from 2008 onwards is negative but not significant. During 2006, measures were established in order to reduce the levels of PM10. Dissemination of dust-binding agents, prohibiting the use of studded tires, and the introduction of congestion charges during 2013 may have contributed to this changing trend (Gothenburg City, 2015; Gothenburg Annual Report, 2015).
For Malmö, the trends are not significant, neither for weekdays, weekends, or for the entire period (Figs. 4 and 8).
The pronounced weekday–weekend pattern associated with NOx and NO2 is not shown for PM10. Despite the fact that PM10 is mainly related to traffic, other factors also affect this pattern. Since the emissions of road dust highly depend on the wetness of the roads, as shown by Johansson et al. (2007), the diurnal cycles do not follow the same pattern as vehicle exhaust from traffic.
The trend in concentrations measured at the regional background outside Stockholm (Aspvreten) is decreasing during the period, but it is fragmented with lack of data during parts of the period. For Gothenburg (Råö) and Malmö (Vavihill), there are only data for very limited parts of the period, and firm conclusions about their impact on the urban background concentrations cannot be made (SEPA, 2017b).
4.2 Comparisons between our trends and the trends in US and Europe as a whole
Regarding PM10, the trends in the Swedish cities do not exhibit the same decrease as the trends in the US or in Europe as a whole. An important reason for this is the large contribution of mechanically generated road-dust particles in the Swedish cities. In Stockholm, up to 90 % of the mass fraction of PM10 is generated from road abrasion, which is mostly caused by the use of studded tires during wintertime, and the concentration trend for PM10 is not significantly influenced by the reduction of exhaust emissions (Johansson et al., 2007). Similar conditions regarding the composition of PM10 prevail in Gothenburg (Grundström et al., 2015). In Europe as a whole, the PM10 concentrations exhibit a decreasing trend during the period of 1990–2010, and this is mainly caused by reduced emissions of both primary PM and precursors of secondary PM within the European countries (EEA, 2017).
According to Geddes et al. (2016), where the global population-weighted annual mean concentrations of NO2 from 1996 to 2012 were analyzed, the average downward trend in North America (Canada and US) is 4.7 % per year, which is the most heavily declining trend compared to all the other regions in the world. For western Europe, the average downward trend per year is, according to Geddes et al. (2016), 2.5 % per year. This downward trend is in the same magnitude as the NO2 trends in Stockholm, Gothenburg, and Malmö (Figs. 2, 3, and 4).
For O3, the comparison is a little bit more complicated since the trends may differ depending on the measure that is used. In the UK, during the period of 1993–2011, the mean and median concentration trends were positive, while the maximum concentration trend was negative (Munir et al., 2013). In Europe as a whole, the O3 concentrations are influenced by local emissions, intercontinental inflow, and the meteorological conditions. The O3 concentrations, and their changes in Europe during the period of 1990–2010, are very different depending on time and place, and no unambiguous explanation or interpretation is possible to make (EEA, 2017). Considering the O3 trends in Figs. 2–4, which are based on 8 h daily maximum values, it can be seen that all the trends are increasing. However, the O3 concentrations associated with monthly averages also show increasing trends for all three of the cities during 1990–2015, and as mentioned in Sect. 4.1, the increasing O3 concentrations in the Swedish cities are probably largely caused by a reduced titration effect, which in turn is caused by decreasing NO concentrations.
4.3 Impacts on life expectancy
In general, the impact of NOx and NO2 on life expectancy among the populations is much larger compared to the impact of O3 and PM10. The calculated gain in life expectancy, associated with decreasing NOx trends (Table 1), contributes up to as much as about 20 % of the total gain in life expectancy during the period of 1990–2015 (Table A1). However, since the O3 concentrations exhibit increasing trends during the same period, and thereby give rise to a loss in life expectancy, the summarized effects of NOx exposure and O3 exposure may be relevant to consider. For Stockholm, where population-weighted exposure concentrations are available for both NOx and O3, the mean value of the gain in life expectancy for NOx, which is 10 months, should be summed with the mean value of the loss of life expectancy for O3, which is 1 month, resulting in a net gain of 9 months. The very small corresponding gain in life expectancy of 0.2 months, associated with exposure to PM10, can also be taken into account. However, the relatively weak trends associated with PM10, with a significance level of 0.01<p<0.05 for Stockholm and Gothenburg and a corresponding level of p>0.05 for Malmö, cannot be compared with the trends for the others pollutants, which in all cases exhibit significance levels of p<0.001.
4.4 Uncertainties associated with the measurements and the relative risks
In general, the results are highly sensitive to the relative risks obtained from previous epidemiological studies. For NOx, we use the RR 1.06 (95 % CI 1.03–1.09) per 10 µg m−3 increase, based on a recent cohort study in Gothenburg (Stockfelt et al., 2015). Considering the similarities between Gothenburg, Stockholm, and Malmö regarding climate, vehicle fleet, and type of city, this RR may be representative for all three of these Swedish cities. The other option could have been to choose the RR 1.08 (95 % CI 1.06–1.11), which comes from on a previous long-term cohort study in Oslo (Nafstad et al., 2004), but we decided to implement the RR from the Swedish study, with exposure levels closer to the actual situation. For NO2, we use the pooled RR estimate of 1.066 (95 % CI 1.029–1.104) per 10 µg m−3 increase from a meta-analysis (Faustini et al., 2014). The other option could have been to choose the RR 1.05 (95 % CI 1.03–1.08) from Hoek et al. (2013), which is also based on a meta-analysis from several studies in different countries and continents, but we considered the study group in Faustini et al. (2014) as more relevant for the Swedish situation, since it is based only on European studies. An RR for NO2, based on European conditions, has also been calculated in the ESCAPE study (Beelen et al., 2014). In this study, the results for NO2 were based on a limited passive sampling campaign for each cohort and differ from the consistent results in the two meta-analyses (Faustini et al., 2014; Hoek et al., 2013), where the studies with active monitoring were also included. Because of this, we consider the RR in Faustini et al. (2014) as more relevant in comparison to the RR in Beelen et al. (2014).
Due to the influence of photochemistry, NOx is a better indicator of health risks associated with vehicle exhaust emissions than NO2. This might explain the differences in relative risks for NOx and NO2. For the same reason (photochemistry), the trends in NO2 are to some extent influenced by the trends in O3.
For O3 exposure, the relative risk of 1.01 (95 % CI 1.005–1.02) per 10 µg m−3 increase that has been used in our calculations is based on Turner et al. (2016), which is a large prospective long-term cohort study performed in the US. The other option could have been to choose the RR 1.014 (95 % CI 1.005–1.024) from Jerret et al. (2009), which is very close to the RR in Turner et al. (2016), but considering the time periods during which the studies have been conducted, Turner et al. (2016) is more in line with the trend analysis period in this study. The number of epidemiological studies focusing on long-term exposure to O3 are relatively few, and no meta-analyses are available. This means that the RR values associated with O3 exposure are based on a relatively less amount of data compared to the RR values for NO2 and PM10, which are obtained from meta-analyses.
For PM10, we use the RR value of 1.04 (95 % CI 1.00–1.09) per 10 µg m−3 increase from Beelen et al. (2014), where the meta-analysis in ESCAPE is based on measurement campaigns with Harvard impactors. An important issue to consider in these Swedish cities is that the mass of PM10 consists of a relatively small percentage of combustion-related particles. In the Swedish cities, non-exhaust traffic-generated particles are the largest contributors to the mass of PM10, which is clearly shown for Stockholm by Johansson et al. (2007) and for Gothenburg by Grundström et al. (2015). In Beelen et al. (2014), there is also an RR value of 1.04 (95 % CI 0.98–1.10) per 10 µg m−3 increase associated, with exposure to PMcoarse. This value is very similar to the corresponding value for PM10 mentioned above. Since PM10 in the Swedish cities to a large extent consists of mechanically generated particles in the coarse fraction, this gives additional support for the suitability of the RR that is applied in the calculations for the change in life expectancy.
This means that NOx and NO2, which both primarily indicate locally produced combustion-related traffic emissions, are clearly separated from PM10 in Sweden, which rather indicates non-exhaust emissions. From a health perspective, PM10 is a reflective indicator of the effects of exposure to the coarse fraction of urban aerosols. The health effects related to exposure to the coarse fraction of particles differ from exposure to the fine (combustion related) fraction. Previous studies indicate an association between exposure to the coarse fraction of PM10 and respiratory admissions such as asthma and chronic obstructive pulmonary disease, while cardiovascular diseases are more closely linked to exposure to the fine fraction (Brunekreef and Forsberg, 2005).
4.5 Correlations between the different pollutants
Calculating the health effects associated with exposure to these different pollutants may be problematic, considering that exposures can occur simultaneously. When conducting health-impact assessments, it is important to avoid double calculations when gain or loss in life expectancy are calculated as a result of decreasing or increasing trends. NOx and NO2 are highly correlated, and the health-impact assessments, calculated as a gain in life expectancy, cannot be summed up but can rather be considered as different indicators of air pollutants mainly originating from combustion processes. On the other hand, for these three Swedish cities, the correlation between NOx or NO2 and PM10 is very low since the mass proportion of exhaust particles in PM10 is very small (Johansson et al., 2007), and the health impacts associated with exposure to NOx and PM10, respectively, can therefore largely be assumed to be independent of each other. Moreover, when considering the simultaneous exposure to NO2 and PM2.5, the relative risks associated with these pollutants are not significantly affected when included in a two-pollutant model (Faustini et al., 2014).
The relative risks associated with O3 exposure are not significantly affected when they are included in two-pollutant models. The increased risks of circulatory and respiratory mortality associated with exposure to O3 remained stable after adjustment for PM2.5 and NO2 (Turner et al., 2016). Consequently, the health effects associated with exposure to O3 can be assumed to be separated from the health effects from the other three pollutants, and the change in life expectancy can therefore be added or subtracted from the change in life expectancy associated with NOx, NO2, and PM10.
4.6 The differences between urban background concentrations and population-weighted exposure concentrations
As shown in Sect. 2.5 and Figs. A1–A4, the average population-weighted exposure concentrations may differ substantially from the concentrations measured at the measuring stations. For NOx and PM10, the average exposure concentrations for the urban population are lower compared to the measured urban background concentrations. The reason for this is that the people who live in the outskirts of the urban area are exposed to lower concentrations compared to those living close to the measuring station in the central parts of the cities, where both exhaust emissions and the formation of mechanically generated particles are most apparent. For O3, the average exposure concentrations are higher compared to the measured urban background concentrations. This can be explained by the interaction between NOx and O3, where the O3 reaction with NO dominates over the formation of new O3, and this reaction is more apparent in the central part of a city where the NO concentration is relatively higher. This explains the higher average population exposure to O3 compared to the measured urban background concentrations at a central monitoring station.
The population distribution within the cities are not constant over time, and the meteorological conditions may also vary over time. Consequently, to calculate a corresponding change in population-weighted exposure based on an air pollution trend during 25 years is connected with uncertainties. Linear regression between the concentrations at the measuring stations and the corresponding population-weighted exposure concentrations for the available years (Figs. A1–A4) are the best estimates that can be performed. A disadvantage is the limited number of years of calculated relationships, but the R2 values in the range of 0.7–0.9 may be considered good.
Due to lack of data, the relations between urban background concentrations and population-weighted exposure concentrations have not been possible to obtain for NO2 in Stockholm, not for NO2, O3, and PM10 in Gothenburg, and not for any of the pollutants in Malmö. Without these relations, the population-weighted exposure concentrations have to be based on the data obtained directly from the measuring stations. However, based on the already established relations (Figs. A1–A4), it can be assumed that the life expectancy values associated with NOx and NO2 exposure without adjustment for population-weighted exposure are overestimated, while the opposite applies to O3 exposure.
4.7 Policy implications
From a policy point of view, it is important to know the health impacts of local air pollution emissions (i.e., the primary emissions in the city from wood burning and road traffic), versus long-range transport of nonlocal origin. The low rural compared to urban background concentrations outside the cities shows that the trends in local primary emissions of NOx and NO2 are most important for the decreasing trends and thereby also most important for the increase in life expectancy of the populations. This implies that policies addressing local emissions in the cities are important in order to improve the public health. NOx may be regarded as an indicator of vehicle exhaust emissions, which consist of many toxic compounds (Künzli et al., 2000). For PM10, long-range transport of mostly secondary PM is more important than local emissions. However, primary emissions may still be more important for the health effects associated with PM, as clearly demonstrated by Segersson et al. (2017). They calculated the sectoral contributions of PM10, PM2.5, and black carbon (BC) exposure and the related premature mortalities in three Swedish cities, including Gothenburg and Stockholm, by using dispersion models with high spatial resolution. They showed that although the main part of the PM10 and PM2.5 exposures were due to long-range transport, the major part of the premature deaths were related to local emissions, with road traffic (dominated by non-exhaust wear emissions) and residential wood combustion having the largest impacts. For black carbon, the emissions from local road traffic (exhaust emissions) and residential wood combustion were more important for both exposures and health risks, as compared to long-range transport. This means that local policies aiming at reducing emissions from road traffic, both non-exhaust and exhaust, and residential wood combustion will be most important for reducing health risks associated with urban air pollution in these cities.
The large impact on life expectancy, which both NOx and NO2 represent, makes these pollutants important to consider. NOx and NO2 are both indicators of combustion-related air pollutants, as indicated by the high correlation between NOx and particle number concentration at curbside sites (Johansson et al., 2007; Gidhagen et al., 2004), and therefore they may be good indicators of population exposure to exhaust emissions from road traffic. Additionally, the change in life expectancy can be regarded as the tip of the iceberg, since reductions in NOx concentrations are also expected to cause reductions in cardiovascular and respiratory morbidity (Johansson et al., 2009).
Our study also shows that although the reduced NOx emissions have caused increased ozone concentrations, which contribute to adverse health effects, the net effect will be a longer life expectancy in the population (Table 2). This may not be true if other health outcomes are analyzed. Our focus on increased mortality should be seen as a limitation and underestimation of the total impact. The regulated air pollutants have been associated not only with respiratory and cardiovascular morbidity and mortality, but more recently also with systemic effects and metabolic diseases, pregnancy and developmental outcomes, and CNS and psychiatric effects (Thurston et al., 2017). Many of these effects are poorly represented by the studies of mortality.
Health impact assessments from other studies clearly suggest that public health could largely benefit from better air quality (e.g., Künzli, 2002). However, estimates of the health benefits of reducing air pollution are dependent on the indicator that is used and on the shape of the concentration-response functions (Pope et al., 2015). In addition, Pope et al. (2015) also discuss recent evidence that the shape of the concentration-response function may be supralinear (dose–response relationship with a negative second derivative) across wide ranges of exposure, as has been shown in the case of exposure to PM2.5. This means that incremental pollution abatement efforts may yield greater benefit in relatively clean areas compared to highly polluted areas. This motivates actions to be taken even in areas with relatively low levels of air pollutants.
The air pollution trends regarding NOx, NO2, and O3 in Stockholm, Gothenburg, and Malmö exhibit significant (95 % CI) tendencies during the measured time periods. For PM10, the trends in Stockholm and Gothenburg are significant, but the trend in Malmö is nonsignificant. The slopes of the trends are very different, where the NOx and NO2 concentrations in all cities exhibit decreasing trends, while O3 in all cities exhibits increasing trends. For PM10, the trends are less clear, with a decreasing trend in Stockholm, an increasing trend in Gothenburg, and no significant trend in Malmö. When the trends are divided into weekdays and weekends, the trends for NOx and NO2 in all cities exhibit large differences, where the trends associated with weekdays exhibit sharper declines compared to the weekends. This phenomenon is consistent with the fact that local emission reductions mostly explain those declines, since the traffic intensity is more prominent during weekdays. An anticorrelation between NOx and O3 can be seen in all cities, which can be attributed to an increased or decreased titration effect, where NO oxidizes to NO2. When the trends in this article are compared to the trends in other studies, the trends associated with NOx and NO2 are in the same magnitude as those measured in the US and Europe as a whole, but the trends associated with PM10 are completely different, mostly caused by the large contribution of mechanically generated particles in the Swedish cities.
The change in life expectancy associated with the air pollution trends is most obvious for NOx and NO2, where up to about 20 % of the total increase in life expectancy during the period of 1990–2015 can be attributed to decreasing NOx trends. Since NOx and NO2 are indicators of combustion-related air pollutants in general, an overall conclusion is that exposure to these air pollutants are particularly important in terms of health effects and health benefits. Our study indicates that policies aiming at reducing local emissions from road traffic have been the most important for the increased life expectancy associated with urban air pollution in these three Swedish cities.
Data used in the trend analysis are available from the authors upon request. Data are also partly available to download from the website of the Swedish data host at http://shair.smhi.se/portal/concentrations-in-air (SMHI, 2018) and http://slb.nu/slbanalys/historiska-data-luft/ (SLB, 2018b).
Table A1General facts about the three cities regarding population structure, life expectancy at birth, and baseline mortality in terms of the number of deaths per 100 000 inhabitants. The number of deaths per 100 000 inhabitants is age standardized according to the average population for the year 2000.
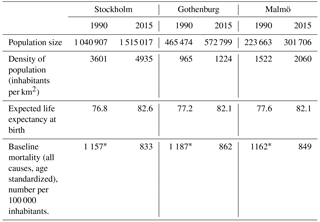
*Extrapolated from a linear regression based on data from 1997–2015.
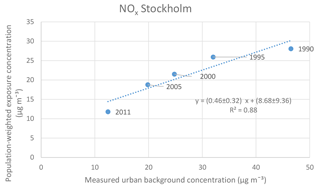
Figure A1Relationship between measured urban background concentrations and population-weighted exposure concentrations of NOx in Stockholm. Slope and intercept are specified with 95 % confidence intervals.
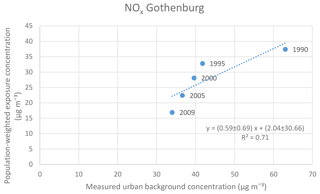
Figure A2Relationship between measured urban background concentrations and population-weighted exposure concentrations of NOx in Gothenburg. Slope and intercept are specified with 95 % confidence intervals.
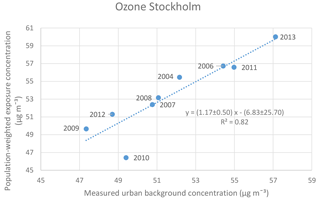
Figure A3Relationship between measured urban background concentrations and population-weighted exposure concentrations of O3 in Stockholm. Slope and intercept are specified with 95 % confidence intervals.
The manuscript was written by HO, CJ, BF, and HO, with contributions from the other authors. Health effect calculations were made by HO and HO. Figures were made by CJ and HO. Air pollution data were provided by MS, HN, PM, and CJ.
The authors declare that they have no conflict of interest.
Hans Orru's work was supported by the Estonian Ministry of Education and
Research grant IUT34-17.
Edited by: Nikolaos Mihalopoulos
Reviewed by: Ebba Malmqvist and two anonymous referees
Airviro: Air Quality Management system, available at: https://www.airviro.com/airviro/, last access: 22 November 2017.
Bari, M. A. and Kindzierski, W. B.: Evaluation of air quality indicators in Alberta, Canada – An international perspective, Environ. Int., 92–93, 119–129, https://doi.org/10.1016/j.envint.2016.03.021, 2016.
Beelen, R., Raaschou-Nielsen, O., Stafoggia, M., Andersen, Z. J., Weinmayr, G., Hoffmann, B., Wolf, K., Samoli, E., Fischer, P., Nieuwenhuijsen, M., Vineis, P., Xun, W. W., Katsouyanni, K., Dimakopoulou, K., Oudin, A., Forsberg, B., Modig, L., Havulinna, A. S., Lanki, T., Turunen, A., Oftedal, B., Nystad, W., Nafstad, P., De Faire, U., Pedersen, N. L., Östenson, C. G., Fratiglioni, L., Penell, J., Korek, M., Pershagen, G., Eriksen, K. T., Overvad, K., Ellermann, T., Eeftens, M., Peeters, P. H., Meliefste, K., Wang, M., Bueno-de-Mesquita, B., Sugiri, D., Krämer, U., Heinrich, J., de Hoogh, K., Key, T., Peters, A., Hampel, R., Concin, H., Nagel, G., Ineichen, A., Schaffner, E., Probst-Hensch, N., Künzli, N., Schindler, C., Schikowski, T., Adam, M., Phuleria, H., Vilier, A., Clavel-Chapelon, F., Declercq, C., Grioni, S., Krogh, V., Tsai, M. Y., Ricceri, F., Sacerdote, C., Galassi, C., Migliore, E., Ranzi, A., Cesaroni, G., Badaloni, C., Forastiere, F., Tamayo, I., Amiano, P., Dorronsoro, M., Katsoulis, M., Trichopoulou, A., Brunekreef, B., and Hoek, G.: Effects of long-term exposure to air pollution on natural-cause mortality: an analysis of 22 European cohorts within the multicentre ESCAPE project, Lancet, 383, 785–795, https://doi.org/10.1016/S0140-6736(13)62158-3, 2014.
BilSweden: statistics on new registrations, available at: http://www.bilsweden.se/statistik/arkiv-nyregistreringar_1, last acess: 29 August 2018.
Brunekreef, B. and Forsberg, B.: Epidemiological evidence of effects of coarse airborne particles on health, Eur. Respir. J., 26, 309–318, https://doi.org/10.1183/09031936.05.00001805, 2005.
Carslaw, D. C.: Evidence of an increasing NO2 ∕NOx emissions ratio from road traffic emissions, Atmos. Environ., 39, 4793–4802, https://doi.org/10.1016/j.atmosenv.2005.06.023, 2005.
Carslaw, D. C. and Ropkins, K.: Openair – an R package for air quality data analysis, Environ. Modell. Softw., 27–28, 52–61, 2012.
Cohen, A. J., Brauer, M., Burnett, R., Anderson, H. R., Frostad, J., Estep, K., Balakrishnan, K., Brunekreef, B., Dandona, L., Dandona, R., Feigin, V., Freedman, G., Hubbell, B., Jobling, A., Kan, H., Knibbs, L., Liu, Y., Martin, R., Morawska, L., Pope III, C. A., Shin, H., Stralf, K., Shaddick, G., Thomas, M., van Dingenen, R., van Donkelaar, A., Vos, T., Murray, C. J. L., and Forouzanfar, H.: Estimates and 25-year trends of the global burden of disease attributable to ambient air pollution: an analysis of data from the Global Burden of Diseases Study 2015, Lancet, 389, 1907–1918, https://doi.org/10.1016/S0140-6736(17)30505-6, 2017.
Colette, A., Granier, C., Hodnebrog, Ø., Jakobs, H., Maurizi, A., Nyiri, A., Bessagnet, B., D'Angiola, A., D'Isidoro, M., Gauss, M., Meleux, F., Memmesheimer, M., Mieville, A., Rouïl, L., Russo, F., Solberg, S., Stordal, F., and Tampieri, F.: Air quality trends in Europe over the past decade: a first multi-model assessment, Atmos. Chem. Phys., 11, 11657–11678, https://doi.org/10.5194/acp-11-11657-2011, 2011.
Correia, A. W., Pope III, C. A., Dockery, D. W., Wang, Y., Ezzati, M., and Dominici, F.: Effect of air pollution control on life expectancy in the United States: an analysis of 545 U.S. counties for the period from 2000 to 2007, Epidemiology, 24, 23–31, https://doi.org/10.1097/EDE.0b013e3182770237, 2013.
EEA: Air quality in Europe – 2016 report, No 28/2016, European Environment Agency, Copenhagen, Denmark, 2016.
EEA: Air quality in Europe – 2017 report, No 13/2017, European Environment Agency, Copenhagen, Denmark, 2017.
EU: EU Directive 2008/50/EC of the European Parliament and of the Council of 21 May 2008 on Ambient Air Quality and Cleaner Air for Europe, OJ L 152, 11 June 2008.
Fann, N. and Risley, H. The public health context for PM2.5 and ozone air quality trends, Air. Qual. Atmos. Health, 6, 1–11, https://doi.org/10.1007/s11869-010-0125-0, 2013.
Faustini, A., Rapp, R., and Forastiere, F.: Nitrogen dioxide and mortality: review and meta-analysis of long-term studies, Eur. Respir. J., 44, 744–753, https://doi.org/10.1183/09031936.00114713, 2014.
Geddes, J. A., Martin, R. V., Boys, B. L., and van Donkelaar, A.: Long-term trends worldwide in ambient NO2 concentrations inferred from satellite observations, Environ. Health Perspect., 124, 281–289, https://doi.org/10.1289/ehp.1409567, 2016.
Gidhagen, L., Johansson, C., Langner, J., and Olivares, G.: Simulation of NOx and ultrafine particles in a street canyon in Stockholm, Sweden, Atmos. Environ., 38, 2029–2044, https://doi.org/10.1016/j.atmosenv.2004.02.014, 2004.
Gothenburg Annual Report: Miljöförvaltningen, Göteborgs stad, available at: http://goteborg.se/wps/wcm/connect/48ca3c67-ced5-415f-b538-1ddf4f246e70/N800_R_2016_5.pdf?MOD=AJPERES (last access: 7 June 2016), 2015.
Gothenburg City: Environmental Programme, available at: http://goteborg.se/wps/portal/start/miljo/miljolaget-i-goteborg/luft/luftkvaliteten-i-goteborg/!ut/p/z1/hY7RCoIwGE afpRfYv81m83IGhhppYai7CY21BHXhpIFPnz1A9N0dzrn4 QEIFcmzenW7mzoxNv3It_VtOkjMPicDZIYhwXKR5dEqP2 f5CofwXyFXjHxMYEpBdOyB3HxBGHqE-CRjdcY9uGWZ QhlCn12Ip3feJGFuPa5CTeqhJTehp7AyVcw5pY3SvkFXwG qoltmLzAZX73Zg!/dz/d5/L2dBISEvZ0FBIS9nQSEh/ (last access: 14 June 2016), 2015.
Gramsch, E., Cereceda-Balic, F., Oyola, P., and von Baer, D.: Examination of pollution trends in Santiago de Chile with cluster analysis of PM10 and ozone data, Atmos. Environ., 40, 5464–5475, https://doi.org/10.1016/j.atmosenv.2006.03.062, 2006.
Grice, S., Stedman, J., Kent, A., Hobson, M., Norris, J., Abbott, J., and Cooke, S.: Recent trends and projections of primary NO2 emissions in Europe, Atmos. Environ., 43, 2154–2167, https://doi.org/10.1016/j.atmosenv.2009.01.019, 2009.
Grundström, M., Hak, C., Chen, D., Hallquist, M., and Pleijel, H.: Variation and co-variation of PM10, particle number concentration, NOx and NO2 in the urban air – Relationships with wind speed, vertical temperature gradient and weather type, Atmos. Environ., 120, 317–327, https://doi.org/10.1016/j.atmosenv.2015.08.057, 2015.
Guerreiro, C. B. B., Foltescu, V., and de Leeuw, F.: Air quality status and trends in Europe, Atmos. Environ., 98, 376–384, https://doi.org/10.1016/j.atmosenv.2014.09.017, 2014.
Henschel, S., Atkinson, R., Zeka, A., Le Tertre, A., Analitis, A., Katsouyanni, K., Chanel, O., Pascal, M., Forsberg, B., Medina, S., and Goodman, P. G.: Air pollution interventions and their impact on public health, Int. J. Public Health, 57, 757–768, https://doi.org/10.1007/s00038-012-0369-6, 2012.
Hirsch, R. M., Slack, J. R., and Smith, R. A.: Techniques of trend analysis for monthly water-quality data, Water Resour. Res., 18, 107–121, https://doi.org/10.1029/WR018i001p00107, 1982.
Hoek, G., Krishnan, R. M., Beelen, R., Peters, A., Ostro, B., Brunekreef, B., and Kaufman, J. D.: Long-term air pollution exposure and cardio- respiratory mortality: a review, Environ. Health, 28, 43, https://doi.org/10.1186/1476-069X-12-43, 2013.
IVL: Swedish National environmental monitoring, Report C 224, IVL Svenska Miljöinstitutet AB, Box 210 60, 100 31 Stockholm, Sweden, available at: https://www.naturvardsverket.se/upload/miljoarbete-i-samhallet/miljoarbete-i-sverige/miljoovervakning/Luft/ivl-rapport-c224-nationell-luftövervakning-sakrapport2015.pdf (last access: 4 September 2018), 2016 (in Swedish with English summary).
Jerrett, M., Burnett, R. T., Pope III, C. A., Ito, K., Thurston, G., Krewski, D., Shi, Y., Calle, E., and Thun, M.: Long-term ozone exposure and mortality, N. Engl. J. Med., 12, 1085–95, https://doi.org/10.1056/NEJMoa0803894, 2009.
Johansson, C., Norman, M., and Gidhagen, L.: Spatial & temporal variations of PM10 and particle number concentrations in urban air, Environ. Monit. Assess., 127, 477–487, https://doi.org/10.1007/s10661-006-9296-4, 2007.
Johansson, C., Andersson, C., Bergström, R., and Krecl, P.: Exposure to particles due to local and non-local sources in Stockholm – Estimates based on modelling and measurements 1997–2006, Report 175, Department of Applied Environmental Science, Stockholm university, 106 91 Stockholm, Sweden, available at: http://slb.nu/slb/rapporter/pdf8/itm2008_175.pdf (last access: 4 September 2018), 2008.
Johansson, C., Burman, L., and Forsberg, B.: The effects of congestions tax on air quality and health, Atmos. Environ., 43, 4843–4854, https://doi.org/10.1016/j.atmosenv.2008.09.015, 2009.
Johansson, C., Löverheim, B., Schantz, P., Wahlgren, L., Almström, P., Markstedt, A., Strömgren, M., Forsberg, B., and Nilsson Sommar, J.: Impacts on air pollution and health by changing commuting from car to bicycle, Sci. Total. Environ., 584–585, 55–63, https://doi.org/10.1016/j.scitotenv.2017.01.145, 2017.
Keuken, M., Roemer, M., and van den Elshout, S.: Trend analysis of urban NO2 concentrations and the importance of direct NO2 emissions versus ozone/NOx equilibrium, Atmos. Environ., 43, 4780–4783, https://doi.org/10.1016/j.atmosenv.2008.07.043, 2009.
Keuken, M., Zandveld, P., van den Elshout, S., Janssen, N. A. H., and Hoek, G.: Air quality and health impact of PM10 and EC in the city of Rotterdam, the Netherlands in 1985–2008, Atmos. Environ., 45, 5294–5301, https://doi.org/10.1016/j.atmosenv.2011.06.058, 2011.
Künzli, N., Kaiser, R., Medina, S., Studnicka, M., Chanel, O., Filliger, P., Herry, M., Horak Jr., F., Puybonnieux-Texier, V., Quénel, P., Schneider, J., Seethaler, R., Vergnaud, J. C., and Sommer, H.: Public-health impact of outdoor and traffic-related air pollution: a European assessment, Lancet, 356, 795–801, https://doi.org/10.1016/S0140-6736(00)02653-2, 2000.
Künzli, N.: The public health relevance of air pollution abatement, Eur. Respir. J., 20, 198–209, https://doi.org/10.1183/09031936.02.00401502, 2002.
Molnar, P., Stockfelt, L., Barregard, L., and Sallsten, G.: Residential NOx exposure in a 35 year cohort study, Changes of exposure, and comparison with back extrapolation for historical exposure assessment, Atmos. Environ., 115, 62–69, https://doi.org/10.1016/j.atmosenv.2015.05.055, 2015.
Munir, S., Chen, H., and Ropkins, K.: Quantifying temporal trends in ground level ozone concentration in the UK, Sci. Total Environ, 458–460, 217–227, https://doi.org/10.1016/j.scitotenv.2013.04.045, 2013.
Nafstad, P., Håheim, L. L., Wisløff, T., Gram, F., Oftedal, B., Holme, I., Hjermann, I., and Leren, P.: Urban air pollution and mortality in a cohort of Norwegian men, Environ. Health Perspect., 112, 610–615, https://doi.org/10.1289/ehp.6684, 2004.
Olsson, D., Johansson, C., Engström Nylén, A., and Forsberg, B., Air pollution at home and pregnancy outcomes, Presented at the 28th Annual Conference of the International Society For Environmental Epidemiology, Rome, Italy, manuscript in preparation April 2018, 31 August–4 September 2016.
Orru, H., Lövenheim, B., Johansson, C., and Forsberg, B.: Potential health impacts of changes in air pollution exposure associated with moving traffic into a road tunnel, J. Expo. Sci. Environ. Epidemiol., 25, 524–531, https://doi.org/10.1038/jes.2015.24, 2015.
Pope III, C. A., Cropper, M., Coggins, J., and Cohen, A.: Health benefits of air pollution abatement policy: Role of the shape of the concentration-response function, J. Air Waste. Manag. Assoc., 65, 516–522, https://doi.org/10.1080/10962247.2014.993004, 2015.
SCAC: Swedish Clean Air & Climate Research Program, available at: http://www.scac.se/, last access: 7 September 2018.
SCB: Statistics Sweden: available at: http://www.statistikdatabasen.scb.se/pxweb/sv/ssd/?rxid=_824e5e7c-a718-462e-9dd9-a83c29e37685, last access: 29 September 2017.
Segersson, D., Eneroth, K., Gidhagen, L., Johansson, C., Omstedt, G., Engström Nylen, A., and Forsberg B.: Health Impact of PM10, PM2.5 and black carbon exposure due to different source sectors in Stockholm, Gothenburg and Umea, Sweden, Int. J. Environ. Res. Public Health., 14, 742, https://doi.org/10.3390/ijerph14070742, 2017.
Sen, P. K.: Estimates of regression coefficient based on Kendall's tau.: J. Am. Stat. Assoc., 63, 1379–1389, https://doi.org/10.1080/01621459.1968.10480934, 1968.
SEPA: Swedish Environmental protection agency, available at: http://www.naturvardsverket.se/Sa-mar-miljon/Statistik-A-O/Ozon-marknara-halter-i-luft-urban-och-regional-bakgrund-arsmedelvarden/?visuallyDisabledSeries=7bbc8e1c95d277e1, last access: 16 November 2017a.
SEPA: Swedish Environmental protection agency, available at: http://www.naturvardsverket.se/Sa-mar-miljon/Statistik-A-O/Partiklar-PM10-halter-i-luft-regional-bakgrund-25/?visuallyDisabledSeries=_ca9f2dd590183278, last access: 9 December 2017b.
Sicard, P., Serra, R., and Rossello, P.: Spatiotemporal trends in ground-level ozone concentrations and metrics in France over the time period 1999–2012, Environ. Res., 149, 122–144, https://doi.org/10.1016/j.envres.2016.05.014, 2016.
SLB: Air Pollutants in the county of Stockholm, Stockholm air quality association, LVF 3:95, available at: http://slb.nu/slb/rapporter/pdf8/lvf1995_003.pdf (last access: 4 September 2018), 1995 (in Swedish).
SLB: Air Quality in Stockholm – annual report 2015, SLB Analys, Stockholms stad, available at: http://slb.nu/slb/rapporter/pdf8/slb2016_002.pdf (last acess: 7 September 2018), 2015 (summary in English).
SLB: Air Pollutants in the region of the Eastern Sweden air quality association, LVF 2018:22, available at: http://slb.nu/slb/rapporter/pdf8/lvf2018_022.pdf, last access: 4 September 2018, 2018a (in Swedish).
SLB: Historiska data, available at: http://slb.nu/slbanalys/historiska-data-luft/ (last access: 29 October 2018), 2018b.
SMHI: Air Pollution Data, available at: http://shair.smhi.se/portal/concentrations-in-air, last access: 29 October 2018.
Socialstyrelsen: The Swedish National Board of Health and Welfare, available at: http://www.socialstyrelsen.se/statistik/statistikdatabas/dodsorsaker, last acess: 7 September 2017
State of Global Air: Health Effects Institute, Special Report, Boston, MA: Health Effects Institute, available at: https://www.stateofglobalair.org/sites/.../SOGA2017_report.pdf, last access: 18 December 2017.
Stockfelt, L., Andersson, E. M., Molnár, P., Rosengren, A., Wilhelmsen, L., Sallsten, G., and Barregard, L.: Long term effects of residential NOx exposure on total and cause-specific mortality and incidence of myocardial infarction in a Swedish cohort, Environ. Res., 142, 197–206, https://doi.org/10.1016/j.envres.2015.06.045, 2015.
Stockfelt, L., Andersson, E. M., Molnár, P., Gidhagen, L., Segersson, D., Rosengren, A., Barregard, L., and Sallsten, G.: Long-term effects of total and source-specific particulate air pollution on incident cardiovascular disease in Gothenburg, Sweden, Environ. Res., 158, 61–71, https://doi.org/10.1016/j.envres.2017.05.036, 2017.
Tang, D., Wang, C., Nie, J., Chen, R., Niu, Q., Kan, H., Chen, B., Perera, F., and CDC, T.: Health benefits of improving air quality in Taiyuan, China, Environ. Internat., 73, 235–242, https://doi.org/10.1016/j.envint.2014.07.016, 2014.
Theil, H.: A rank invariant method of linear and polynomial regression analysis, Adv. St. Theo., 23, 345–381, https://doi.org/10.1007/978-94-011-2546-8_20, 1992.
Thurston, G. D., Kipen, H., Annesi-Maesano, I., Balmes, J., Brook, R. D., Cromar, K., De Matteis, S., Forastiere, F., Forsberg, B., Frampton, M. W., Grigg, J., Heederik, D., Kelly, F. J., Kuenzli, N., Laumbach, R., Peters, A., Rajagopalan, S. T., Rich, D., Ritz, B., Samet, J. M., Sandstrom, T., Sigsgaard, T., Sunyer, J., and Brunekreef, B.: A joint ERS/ATS policy statement: what constitutes an adverse health effect of air pollution? An analytical framework, Eur. Respir. J., 49, 1600419, https://doi.org/10.1183/13993003.00419-2016, 2017.
Tong, D. Q., Lamsal, L., Pan, L., Ding, C., Kim, H., Lee, P., Chai, T., Pickering, K. E., and Stajner, I.: Long-term NOx trends over large cities in the United States during the great recession: Comparison of satellite retrievals, ground observations, and emission inventories, Atmos. Environ., 107, 70–84, https://doi.org/10.1016/j.atmosenv.2015.01.035, 2015.
Turner, M. C, Jerrett, M., Pope III, C. A., Krewski, D., Gapstur, S. M., Diver, W. R., Beckerman, B. S., Marshall, J. D., Su J., Crouse, D. L., and Burnett, R. T.: Long-Term Ozone Exposure and Mortality in a Large Prospective Study, Am. J. Respir. Crit. Care. Med., 193, 1134–1142, https://doi.org/10.1164/rccm.201508-1633OC, 2016.
WHO: WHO's Urban Ambient Air Pollution database – Update 2016, available at: http://www.who.int/phe/health_topics/outdoorair/databases/cities/en/, last access: 11 August 2016a.
WHO: AirQ+: software tool for health risk assessment of air pollution, available at: http://www.euro.who.int/en/health-topics/environment-and-health/air-quality/activities/airq-software-tool-for-health-risk-assessment-of-air-pollution (last access: 22 November 2017), 2016b.
Xing, J., Pleim, J., Mathur, R., Pouliot, G., Hogrefe, C., Gan, C.-M., and Wei, C.: Historical gaseous and primary aerosol emissions in the United States from 1990 to 2010, Atmos. Chem. Phys., 13, 7531–7549, https://doi.org/10.5194/acp-13-7531-2013, 2013.


