the Creative Commons Attribution 4.0 License.
the Creative Commons Attribution 4.0 License.
 | 25 Oct 2018
Peroxy acetyl nitrate (PAN) measurements at northern midlatitude mountain sites in April: a constraint on continental source–receptor relationships
Arlene M. Fiore
Emily V. Fischer
George P. Milly
Shubha Pandey Deolal
Oliver Wild
Daniel A. Jaffe
Johannes Staehelin
Olivia E. Clifton
Dan Bergmann
William Collins
Frank Dentener
Ruth M. Doherty
Bryan N. Duncan
Bernd Fischer
Stefan Gilge
Peter G. Hess
Larry W. Horowitz
Alexandru Lupu
Ian A. MacKenzie
Rokjin Park
Ludwig Ries
Michael G. Sanderson
Martin G. Schultz
Drew T. Shindell
Martin Steinbacher
David S. Stevenson
Sophie Szopa
Christoph Zellweger
Guang Zeng
Abundance-based model evaluations with observations provide critical tests for the simulated mean state in models of intercontinental pollution transport, and under certain conditions may also offer constraints on model responses to emission changes. We compile multiyear measurements of peroxy acetyl nitrate (PAN) available from five mountaintop sites and apply them in a proof-of-concept approach that exploits an ensemble of global chemical transport models (HTAP1) to identify an observational “emergent constraint”. In April, when the signal from anthropogenic emissions on PAN is strongest, simulated PAN at northern midlatitude mountaintops correlates strongly with PAN source–receptor relationships (the response to 20 % reductions in precursor emissions within northern midlatitude continents; hereafter, SRRs). This finding implies that PAN measurements can provide constraints on PAN SRRs by limiting the SRR range to that spanned by the subset of models simulating PAN within the observed range. In some cases, regional anthropogenic volatile organic compound (AVOC) emissions, tracers of transport from different source regions, and SRRs for ozone also correlate with PAN SRRs. Given the large observed interannual variability in the limited available datasets, establishing strong constraints will require matching meteorology in the models to the PAN measurements. Application of this evaluation approach to the chemistry–climate models used to project changes in atmospheric composition will require routine, long-term mountaintop PAN measurements to discern both the climatological SRR signal and its interannual variability.
- Article
(5248 KB) - Full-text XML
-
Supplement
(954 KB) - BibTeX
- EndNote


Peroxy acetyl nitrate (PAN) is produced alongside ozone (O3) from photochemical reactions involving precursor emissions of nitrogen oxides (NOx) and non-methane volatile organic compounds (VOCs). Once ventilated from a source region to the free troposphere where it is more stable at colder temperatures, PAN can be efficiently transported throughout the hemisphere (Singh, 1987; Singh and Hanst, 1981). When a PAN-containing free-tropospheric air mass subsides, PAN thermally decomposes to release NOx and can thus facilitate O3 formation far downwind (Wild et al., 1996; Schultz et al., 1999; Jaeglé et al., 2003; Kotchenruther et al., 2001a; Hudman et al., 2004). Both PAN and O3 distributions over any northern midlatitude region reflect the combined influence of production from sources within the region and transport from outside that region. At northern midlatitudes, the intercontinental influence from anthropogenic emissions on surface O3 levels is largest during spring (e.g., HTAP 2010) and occurs via at least two pathways: (1) O3 can be produced within a polluted continental boundary layer, ventilated to the free troposphere and efficiently transported to other continents, and (2) O3 can be produced in transit from the export and subsequent chemical evolution of PAN and other precursors. Below, we examine the extent to which springtime PAN observations at northern midlatitude mountaintop sites can be used to constrain the spread in multi-model estimates of source–receptor relationships (SRRs), where the sources are continental-scale regions and the receptors are the mountaintop sites, for both PAN and O3.
Observations during several aircraft field campaigns in the eastern Pacific and at mountaintop sites in the western US and North Atlantic document efficient O3 production in the lower troposphere following subsidence of PAN-containing air masses (Fischer et al., 2010; Heald et al., 2003; Hudman et al., 2004; Kotchenruther et al., 2001a, b; Val Martin et al., 2008; Zhang et al., 2008). When PAN decomposes in low-NOx regions of the atmosphere, the NOx released can produce O3 up to 8 times more efficiently than in polluted (high-NOx) regions (Liang et al., 1998; Liu et al., 1987) and thus increase global O3 abundances (Moxim et al., 1996; Wang and Jacob, 1998), as O3 formation is NOx limited in most of the free troposphere (Chameides et al., 1992). The lifetime of PAN against thermal decomposition is about 1 h at 20 ∘C, and it approximately doubles for every 4 ∘C decrease in temperature, leading to a lifetime of at least a month in the mid-troposphere during spring. This strong temperature dependence implies that a warmer climate will decrease PAN export from polluted continental boundary layers, although a rise in temperature-sensitive biogenic precursor emissions may temper this response (e.g., Doherty et al., 2013). Future projections of atmospheric composition under global change scenarios will thus benefit from a thorough understanding of the role PAN plays in transporting oxidized reactive nitrogen and thereby altering ozone production throughout the troposphere.
To better distinguish among disparate estimates for intercontinental O3 transport in the published literature, the Task Force on Hemispheric Transport of Air Pollution (HTAP) organized an international global modeling study, referred to here as HTAP1. The HTAP1 study identified a range of a factor of 2 across individual model estimates of surface O3 response to changes in anthropogenic precursor emissions from continental-scale, northern midlatitude source regions (HTAP, 2007, 2010; Fiore et al., 2009; Wild et al., 2012). The HTAP1 models do not distinguish between intercontinental O3 transport occurring due to O3 produced from PAN chemistry and direct transport of O3 formed in a remote boundary layer, but other work indicates that both pathways contribute. Jaegle et al. (2003) find that 28 % of the O3 in the Pacific Northwest free troposphere between 0 and 6 km is associated with PAN-to-NOx conversion, consistent with Jiang et al. (2016), who found that PAN produced from East Asian emissions and exported to the free troposphere contributes 35 % and 25 % in spring and summer, respectively, to the free-tropospheric O3 abundance over western North America. Over East Asia, Lin et al. (2010) found that the export of PAN produced from European anthropogenic emission changes and subsequent downwind O3 formation contributed 20 % of the spatially averaged response of surface O3 levels, and up to 50 % of the O3 response at mountain sites.
In addition to the direct influence of PAN on intercontinental O3 transport, PAN may serve as a sensitive diagnostic of model uncertainties in O3 production chemistry and transport (Emmerson and Evans, 2009; Kuhn et al., 1998). Prior analysis of measurements and global model simulations suggests that PAN abundances at high-altitude sites may be more sensitive than O3 itself to changes in precursor emissions (Fiore et al., 2011; Fischer et al., 2011; Jaffe et al., 2007). We interpret this stronger sensitivity of PAN than O3 to changes in precursor emissions as reflecting buffering of O3 by changes to O3 losses that compensate for changes in production, whereas PAN loss pathways are far less sensitive to changes in precursor emissions. PAN loss pathways include thermal decomposition (which dominates below approximately 7 km), photolysis in the upper troposphere, and dry deposition within the boundary layer (Kirchner et al., 1999; Roberts, 2007; Turnipseed et al., 2006). All of the HTAP1 models include PAN formation, but the chemical mechanisms and kinetic rate coefficients differ, with likely implications for long-range transport (Emmerson and Evans, 2009; Knote et al., 2015). A prior multi-model study found that even with the same emissions, PAN differs widely across models, reflecting differences in simulated photochemistry (Emmons et al., 2015). While the absence of direct emissions and its low background make PAN a useful tracer of photochemistry, we note that O3 typically responds more strongly to changes in NOx emissions, while PAN responds more strongly to changes in VOC emissions in many regions (Fischer et al., 2014; see their Fig. 4).
A challenge in discriminating among model estimates of O3 produced from different source regions is the lack of direct observational constraints on SRRs. For example, Fiore et al. (2009) did not find any relationship across models between their biases against surface O3 observations and the strength of their response to emission changes. In the absence of an observable quantity to constrain these relationships, one approach is to identify an “emergent constraint” (Borodina et al., 2017), whereby an unobservable quantity correlates strongly across a multi-model ensemble with an observed variable. The inter-model range of the non-observable quantity is then narrowed by limiting it to the range encompassed by the models closest to the observed variable. This approach has gained traction for narrowing the spread across future climate projections (e.g., Hall and Qu, 2006; Cox et al., 2018). Given that PAN both directly facilitates intercontinental ozone transport and can serve as a proxy for ozone formation chemistry, and that prior work indicates a large signature of PAN originating from the European boundary layer during spring at Jungfraujoch (Pandey Deolal et al., 2013, 2014), we hypothesize that PAN measurements may offer much-needed constraints for discriminating across model estimates of intercontinental transport of PAN, and possibly O3. The number of models contributing to the HTAP1 study, which was designed to maximize comparability across individual model estimates of ozone responses to changes in precursor emissions within northern midlatitude continental-scale source regions, offers an opportunity to evaluate this hypothesis.
We describe the HTAP1 model simulations, mountaintop measurements, and our strategy to sample the models at these sites (Sect. 2) before illustrating our rationale for selecting the month of April for our analysis (Sect. 3). We then borrow from the emergent constraint approach in climate science to show that correlations between simulated total PAN and SRRs for PAN are sufficiently strong to permit PAN measurements at mountaintop sites (one in each of the three major northern midlatitude source regions) to narrow the wide inter-model spread in estimates of PAN origin (Sect. 4). We further examine inter-model relationships among the simulated PAN SRRs at these three mountaintop sites and regional precursor emissions, and with a proxy for model transport (Sect. 5). Finally, we assess the relationship between PAN and O3 SRRs (Sect. 6) and conclude with a summary and recommendations for future work based on our proof-of-concept analysis (Sect. 7).
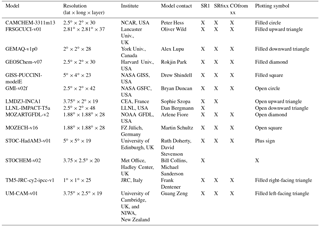
Table 1Models contributing to the HTAP1 simulations (SR1, SR6xx, and COfromXX) used in this study.
2.1 HTAP1 model simulations
We use monthly mean PAN mixing ratios for the year 2001 simulated by 14 global chemistry transport models (Table 1); the temporal resolution for three-dimensional chemical fields archived from the HTAP1 models is limited to monthly. We use four HTAP1 source–receptor (SR) simulations (Table 2): a base case (SR1) and three perturbation simulations in which anthropogenic O3 precursor emissions (NOx, VOCs, carbon monoxide, and aerosols) are reduced simultaneously by 20 % within East Asia (EA, SR6EA), Europe and northern Africa (EU, SR6EU), and North America (NA, SR6NA). We calculate PAN SRRs by differencing the perturbation and base simulations (SR1-SR6XX), for which XX refers to the region in which emissions of PAN precursors were decreased by 20 %.
Of the models in Table 1, 11 used 2001 meteorological fields. Two models are chemistry-transport models coupled directly to a general circulation model forced by observed sea surface temperatures (STOC-HadAM3 and STOCHEM) and one model incorporates chemistry directly into a general circulation model (UM-CAM). We include these models as our evaluation compiles PAN measurements across several years (Sect. 2.2). The individual model specifications and emissions are described in Tables 1 and 2 of Fiore et al. (2009). For HTAP1, each model used its own emissions inventories (see Table A1 of Fiore et al., 2009); Fiore et al. (2009) provide emission totals within each HTAP1 source region for all (their Table A2) and anthropogenic (their Table A3) emissions of NOx, non-methane volatile organic compounds (NMVOCs), and CO. The relative inter-model spread in regional anthropogenic emissions is smallest for NOx emissions in EU and NA (< 10 %) and largest for VOCs from EU (58 %) (Fiore et al., 2009).
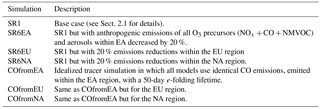
To separate the role of inter-model differences in transport from the combined impacts of inter-model differences in emissions and chemistry on simulated PAN at the mountaintop sites, we analyze an additional set of idealized tracer simulations available from 11 models (COfromXX in Table 1, for which XX is the source region). In these simulations, a set of tagged carbon-monoxide-like tracers are emitted, each from a single HTAP1 source region with a 50-day lifetime, and with identical emissions across models. Biomass burning emissions for the CO tracers are from GFED (van der Werf et al., 2006, 2010) and other emissions are from the RETRO project (Schultz et al., 2007, 2008). We refer to these tracers as “COfromEA”, “COfromNA”, and “COfromEU”, which denote the tracers emitted from EA, NA, and EU, respectively (Table 2; see also Doherty et al., 2013, and Shindell et al., 2008).
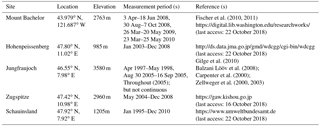
Table 3Mountaintop sites with multiple years of PAN observations used in this study.
2.2 Multiyear PAN measurements at mountaintop sites and model sampling
To evaluate the HTAP1 models, we compiled April mean climatologies of lower-tropospheric PAN measurements from northern midlatitude mountain observatories (Table 3). Given the large interannual variability in PAN abundances, we require at least 2 years of observations in April. PAN observations from Mount Bachelor (USA), Jungfraujoch (Switzerland), and Zugspitze (Schneefernerhaus), Hohenpeissenberg, and Schauinsland (all in Germany) meet these criteria. Taken together, these mountaintop measurements span 15 years, from 1995 to 2010 (Table 3), although only one site (Schauinsland) overlaps with the HTAP1 simulation year of 2001.
PAN was measured at all five mountain sites using gas chromatography with electron capture detection (ECD). A custom system using a Shimadzu Mini-2 ECD was employed at Mount Bachelor (Fischer et al., 2010). The commercially available Meteorologie Consult (GmbH) system was used at the European sites (Zellweger et al., 2000). Calibrations generate PAN from the photolysis of excess acetone and NO in air (Warneck and Zerbach, 1992; Volz-Thomas et al., 2002). Reported detection limits are ∼20 ppt for PAN measurements at Mount Bachelor and ∼50 ppt for the European sites, with total uncertainties of < 10 % (Fischer et al., 2010; Zellweger et al., 2003).
We include all available data at these sites without filtering for upslope winds or any other criteria. At Mount Bachelor, the cleanest of the five mountaintop sites (Supplement Fig. S1), Fischer et al. (2010) have shown that PAN mixing ratios are not primarily controlled by diurnal wind patterns, which lead to variations an order of magnitude smaller than the total observed range in measured PAN. When measurements fall below the detection limit, we include half of the detection limit. This assumption should not affect our conclusions as mountaintop sites generally sample free-tropospheric air at night (e.g., Weiss-Penzias et al., 2004), but PAN values below the detection limit typically occur due to deposition in a shallow nocturnal boundary layer.
For comparison with the observations, we sample each model on its native grid (Table 1) at the horizontal grid cell containing the latitude and longitude of each mountain site. Orography at these mountain sites is poorly resolved at the relatively coarse HTAP1 model horizontal resolutions. This mismatch requires us to apply some approximations for vertical sampling. We convert the station altitude to an approximate pressure level by assuming a mean tropospheric temperature of 260 K and a corresponding atmospheric scale height of 7.6 km. We then use monthly mean pressure fields from each model to linearly interpolate PAN based on the pressures of the two model grid cells that vertically bound the station pressure. While different sampling strategies may alter the exact value of simulated PAN and its comparison to observations, our primary interest is in the inter-model differences. Although the Zugspitze and Hohenpeissenberg sites fall within the same horizontal grid cell in the HTAP1 models, the station altitudes differ, so we consider the two sites separately.
Given that we seek constraints on intercontinental transport from the three major midlatitude source regions, we conduct a more in-depth analysis at the highest-altitude European site (Jungfraujoch), the most likely of the available sites to measure PAN transported among continents in the free troposphere, as well as at Mount Bachelor in North America. At Jungfraujoch, we also evaluate SRRs in the models with an estimate of PAN originating in the European boundary layer based on an analysis of 20-day back trajectories (Pandey Deolal et al., 2013). We conduct a proof-of-concept analysis at Mount Waliguan in Asia (36.28∘ N, 100.90∘ E, 3816 m) to assess the potential for future PAN measurements at this site to narrow the inter-model range in SRRs. Short-term measurements have previously been collected at this site (Xue et al., 2011). While aircraft and satellite observations have advanced the understanding of the chemistry and dynamics of individual PAN plumes using models that archived chemical fields at high temporal frequencies (e.g., Alvarado et al., 2010; Payne et al., 2014; Emmons et al., 2015), their limited temporal coverage is not well suited for comparison with the HTAP1 monthly mean PAN mixing ratios.
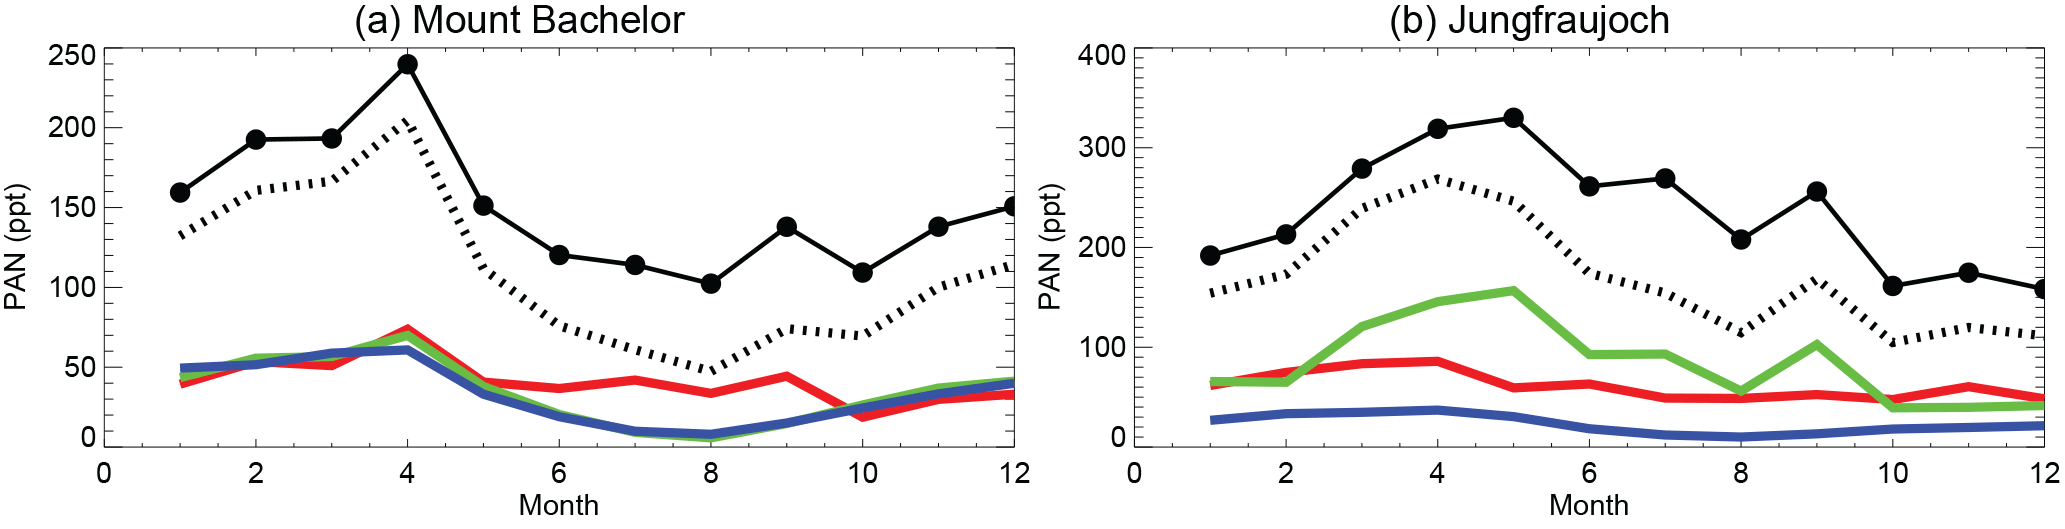
Figure 1Multi-model monthly mean total PAN mixing ratios (black circles and solid lines) at Mount Bachelor (a) and Jungfraujoch (b). We take the difference between the base simulation (SR1) and one in which emissions are decreased by 20 % and then multiply the difference by 5 to estimate a 100 % contribution associated with anthropogenic precursor emissions from Europe (green), North America (red), and East Asia (blue). The sum of the anthropogenic contribution from these three regions is shown (dashed black) for comparison with total simulated PAN.
Our goal is to assess the potential for mountaintop PAN measurements to discriminate among model estimates of PAN and O3 produced by regional anthropogenic emissions and transported to the mountaintop sites. We thus focus our analysis on April when measured PAN reaches its seasonal maximum (Penkett and Brice, 1986; Singh and Salas, 1989; Bottenheim et al., 1994; Schmitt and Volz-Thomas, 1997; Fig. S1) and when the HTAP1 models indicate that the production of PAN from the EA, EU, and NA source regions dominates total simulated PAN (Fig. 1). April thus offers the strongest possible signal of the influence of anthropogenic emissions from these three northern midlatitude source regions in the mountaintop measurements.

Figure 2Multi-model ensemble (n=14; Table 1) average PAN mixing ratios (ppt; a) and relative standard deviation (the absolute standard deviation across the models divided by the ensemble mean; b) at 650 hPa in April; relative standard deviations are masked out (white) for regions where multi-model mean PAN falls below 100 ppt. The models were sampled at 650 hPa by vertically interpolating among the bounding grid cells and then re-gridded horizontally to a common grid. White lines denote the HTAP1 source regions: North America (NA), Europe and North Africa (EU), and East Asia (EA) from left to right. White circles indicate the five mountain sites with multiyear PAN observations used in our analysis (note that Zugspitze and Hohenpeissenberg are too close to differentiate on the map; see Table 3). Mount Waliguan in Asia, where we lack multiyear measurements but conduct model analysis, is denoted by the white square.
Figure 2 shows the spatial distribution of the HTAP1 model ensemble mean PAN mixing ratios at 650 hPa (∼3 km), the level sampled by the highest-altitude sites on which we focus the majority of our analysis. PAN mixing ratios in April generally increase with latitude, as expected from the strong thermal dependence of the PAN lifetime, although some of the highest mixing ratios are simulated over the Asian source region. The multi-model spread in lower-tropospheric PAN, represented by the coefficient of variation (standard deviation over the 14 models divided by the model ensemble mean) is within ±45 % across much of the Northern Hemisphere (Fig. 2). The large inter-model spread over much of Europe in Fig. 2b implies that observational constraints in this region would be particularly valuable.
Observed and modeled PAN mixing ratios at the northern midlatitude mountain sites are compared in Fig. 3 (see Fig. S1 for a comparison extended throughout the year). We consider the measured range across years to bound the “plausible” portion of the wide range in simulated total PAN across the models. The multi-model mean falls in the range of the measurements at four of the sites but is higher than observed in any year at Mount Bachelor. The model rankings show some consistency across the different sites, suggesting systematic model differences that can be narrowed with a limited set of observational constraints, especially for models that rank similarly across the sites on all three continents (Fig. 3). For example, CAMCHEM and GEMAQ are consistently at the higher end of the range while GISS-PUCCINI and LLNL-IMPACT are at the low end. The two models falling closest to the observed 2001 value at Schauinsland (MOZECH and MOZARTGFDL) fall into the observed range at either Mount Bachelor or Jungfraujoch; we analyze these two sites further in the following sections.
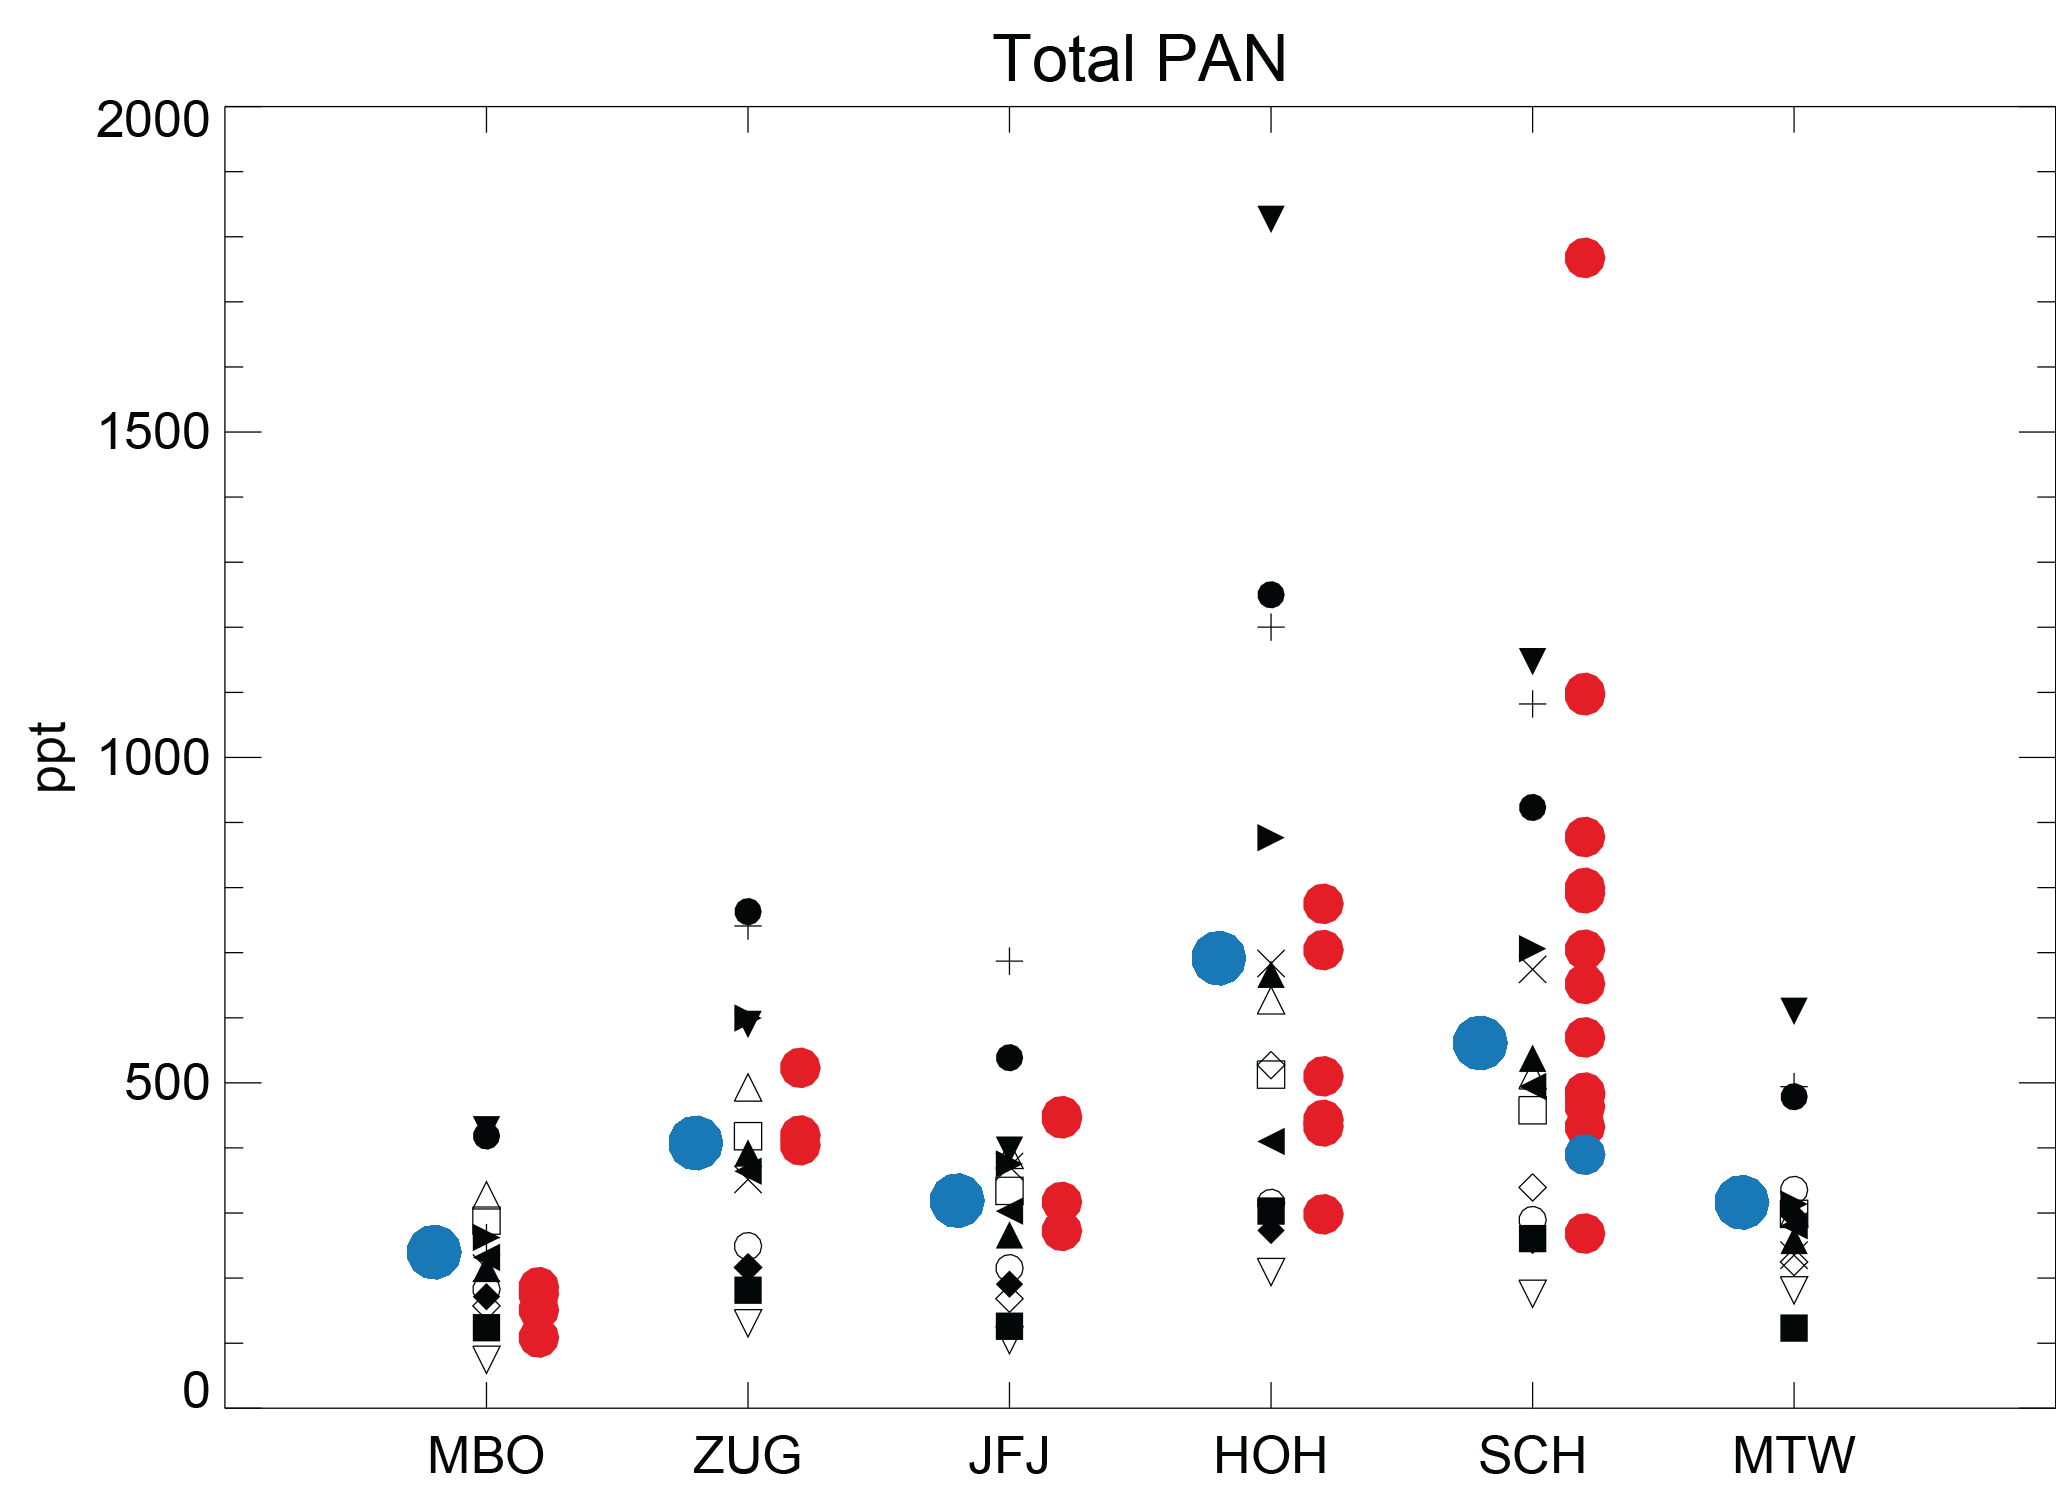
Figure 3April mean PAN abundances (ppt) simulated (black symbols, one per model as defined in Table 1; blue circles offset to the left show multi-model mean values) and measured (red circles offset to the right of the model values) at northern midlatitude mountaintop sites: Mount Bachelor (MBO), Zugspitze (ZUG), Jungfraujoch (JFJ), Hohenpeissenberg (HOH), Schauinsland (SCH), and Mount Waliguan (MTW). The observed year 2001 April mean, which corresponds to the meteorological year used by most of the models at Schauinsland, is shown in blue to the right of the models.
The longest observational dataset at Schauinsland varies by over a factor of 3 across years, consistent with large interannual variability found in prior analyses at mountaintop sites (Zellweger et al., 2003; Fischer et al., 2011; Pandey Deolal et al., 2013, 2014). All but one of the models (LLNL-IMPACT) fall within the wide range of observed interannual variability at Schauinsland, underscoring the tenuous nature of conclusions regarding model performance drawn from short observational records unless the modeled and observed meteorological years match. Future work to coordinate consistent time periods between measurements and models would provide tighter constraints than are possible with our proof-of-concept analysis described in the following sections.
The range of the PAN SRRs across the HTAP1 models at Jungfraujoch, Mount Bachelor, and Mount Waliguan is wide for all three source regions, spanning a factor of 5 or more in several cases (Fig. 4). The key to a successful emergent constraint analysis is for this range in inter-model PAN SRRs, our unobservable quantity, to correlate with the total PAN simulated at the mountaintop site, our observable variable. The strongest correlations emerge for PAN originating in the region where the mountain is located, but some intercontinental SRR pairs also show significant correlations (p≤0.05) with total simulated PAN (Fig. 4).
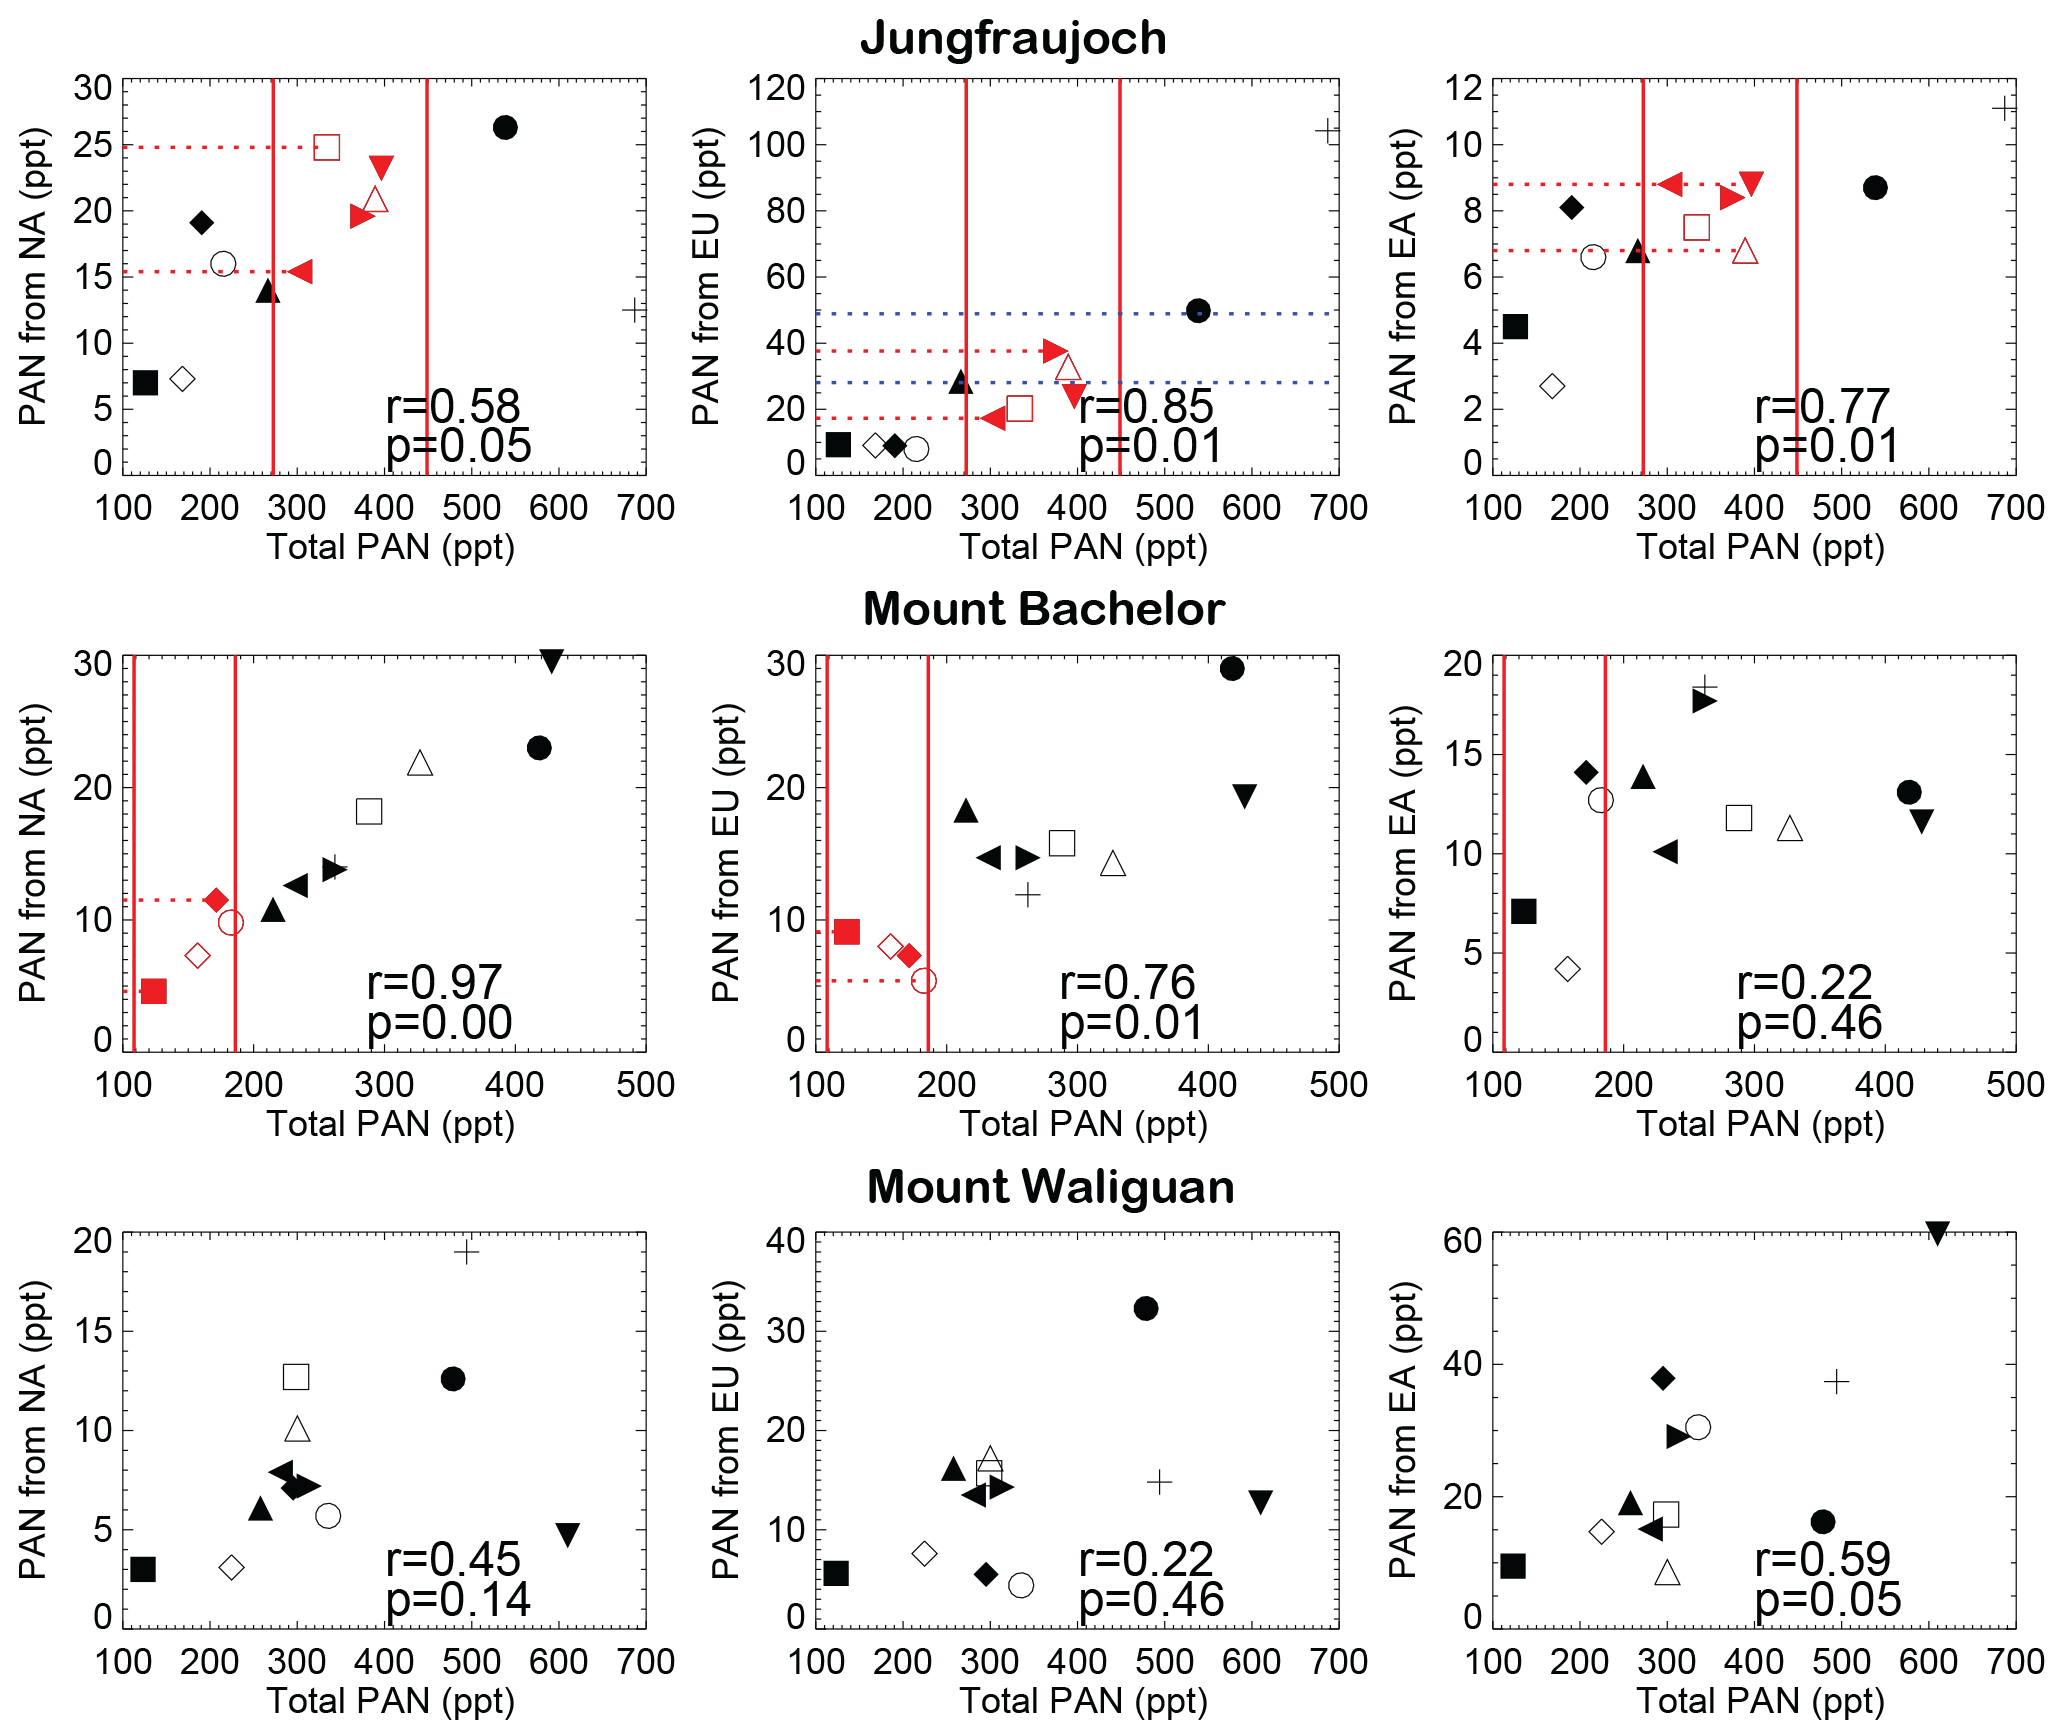
Figure 4Simulated total PAN versus source–receptor relationships (SRRs) at each of three northern midlatitude sites. For Jungfraujoch and Mount Bachelor, vertical red lines bound the observed range in total PAN. For source–receptor pairs with significant correlations (p≤0.05), models falling within the observed range (across years) are colored red, and horizontal red dashed lines extend to the ordinate, representing the emergent constraint (narrower range resulting from selecting only those models falling in the observed range of total PAN). At Jungfraujoch, the range (across years) in PAN attributed to the EU source region by back-trajectory analysis (Pandey Deolal et al., 2013) is indicated by horizontal dashed blue lines. Individual models are denoted by the symbols defined in Table 1.
We illustrate here how PAN measurements can be used to narrow the inter-model range in the SRR pairs. For the sites with significant correlations, the range across years (i.e., red vertical lines in Fig. 4) bound the April mean values observed at Jungfraujoch and Mount Bachelor. The models falling in this range are highlighted in red. We select these models to narrow the range in SRRs, indicated by the red horizontal dashed lines extending from the bounding models (red symbols) to the ordinate axis. Figure 4 shows that the constraint from total measured PAN narrows the inter-model range in SRRs for PAN by at least half, revealing some models as outliers. Other models simulate SRRs within the observationally constrained range (between the dashed red horizontal lines) despite falling outside the observed range for total PAN, possibly indicating a role for inter-model differences in non-anthropogenic sources of PAN or in the relative contributions from the individual midlatitude source regions, which we investigate further in the next section. Given the year-to-year variability in total PAN, stronger constraints could be placed in future work in which the model meteorology corresponds to the same year as the measurements.
At Jungfraujoch, we additionally consider PAN SRRs for the EU source region with those estimated previously using back-trajectory analysis (Pandey Deolal et al., 2013). While Pandey Deolal et al. (2013) also attribute trajectories to NA and EA, fewer than 15 % and 4 % of trajectories are attributed to those regions compared to 25 %–50 % from EU (range across years; see Fig. 1 of Pandey Deolal et al., 2013). Combining these low frequencies with the inevitable growth in uncertainty as trajectories lengthen, we have the most confidence in the Pandey Deolal et al. (2013) estimates for the EU region. The horizontal blue dashed lines indicate the bounds obtained from this trajectory-based approach to estimating PAN from EU. The models falling in these bounds overlap with those constrained by the total PAN measurements, lending some confidence that these two independent approaches (one using total PAN and the correlated inter-model spread in SRRs; the other using back trajectories to estimate SRRs) yield useful constraints on the influence of the EU source region on PAN measured at Jungfraujoch.
We note that for consistency with the model SRRs in Fig. 4, which are the responses to 20 % emission reductions in the source region, we divide the Pandey Deolal et al. (2013) EU SRRs by 5 to scale back from their estimated “full contribution” (100 %). This linear scaling of the PAN response between 20 % and 100 % may incur errors due to nonlinear chemistry. With an additional simulation in which the FRSGCUCI model sets European anthropogenic emissions of NOx, CO, and VOCs to zero (a 100 % perturbation), we estimate this error to be ∼10 %. For intercontinental regions, this error reduces to < 3 %. Earlier work shows that the smaller nonlinearity in PAN for intercontinental versus regional source–receptor pairs also holds for ozone (Fiore et al., 2009; Wu et al., 2009; Wild et al., 2012) and demonstrates approximate linearity between the simulated tropospheric ozone burden and ±50 % of present-day global NOx emissions (Stevenson et al., 2006).
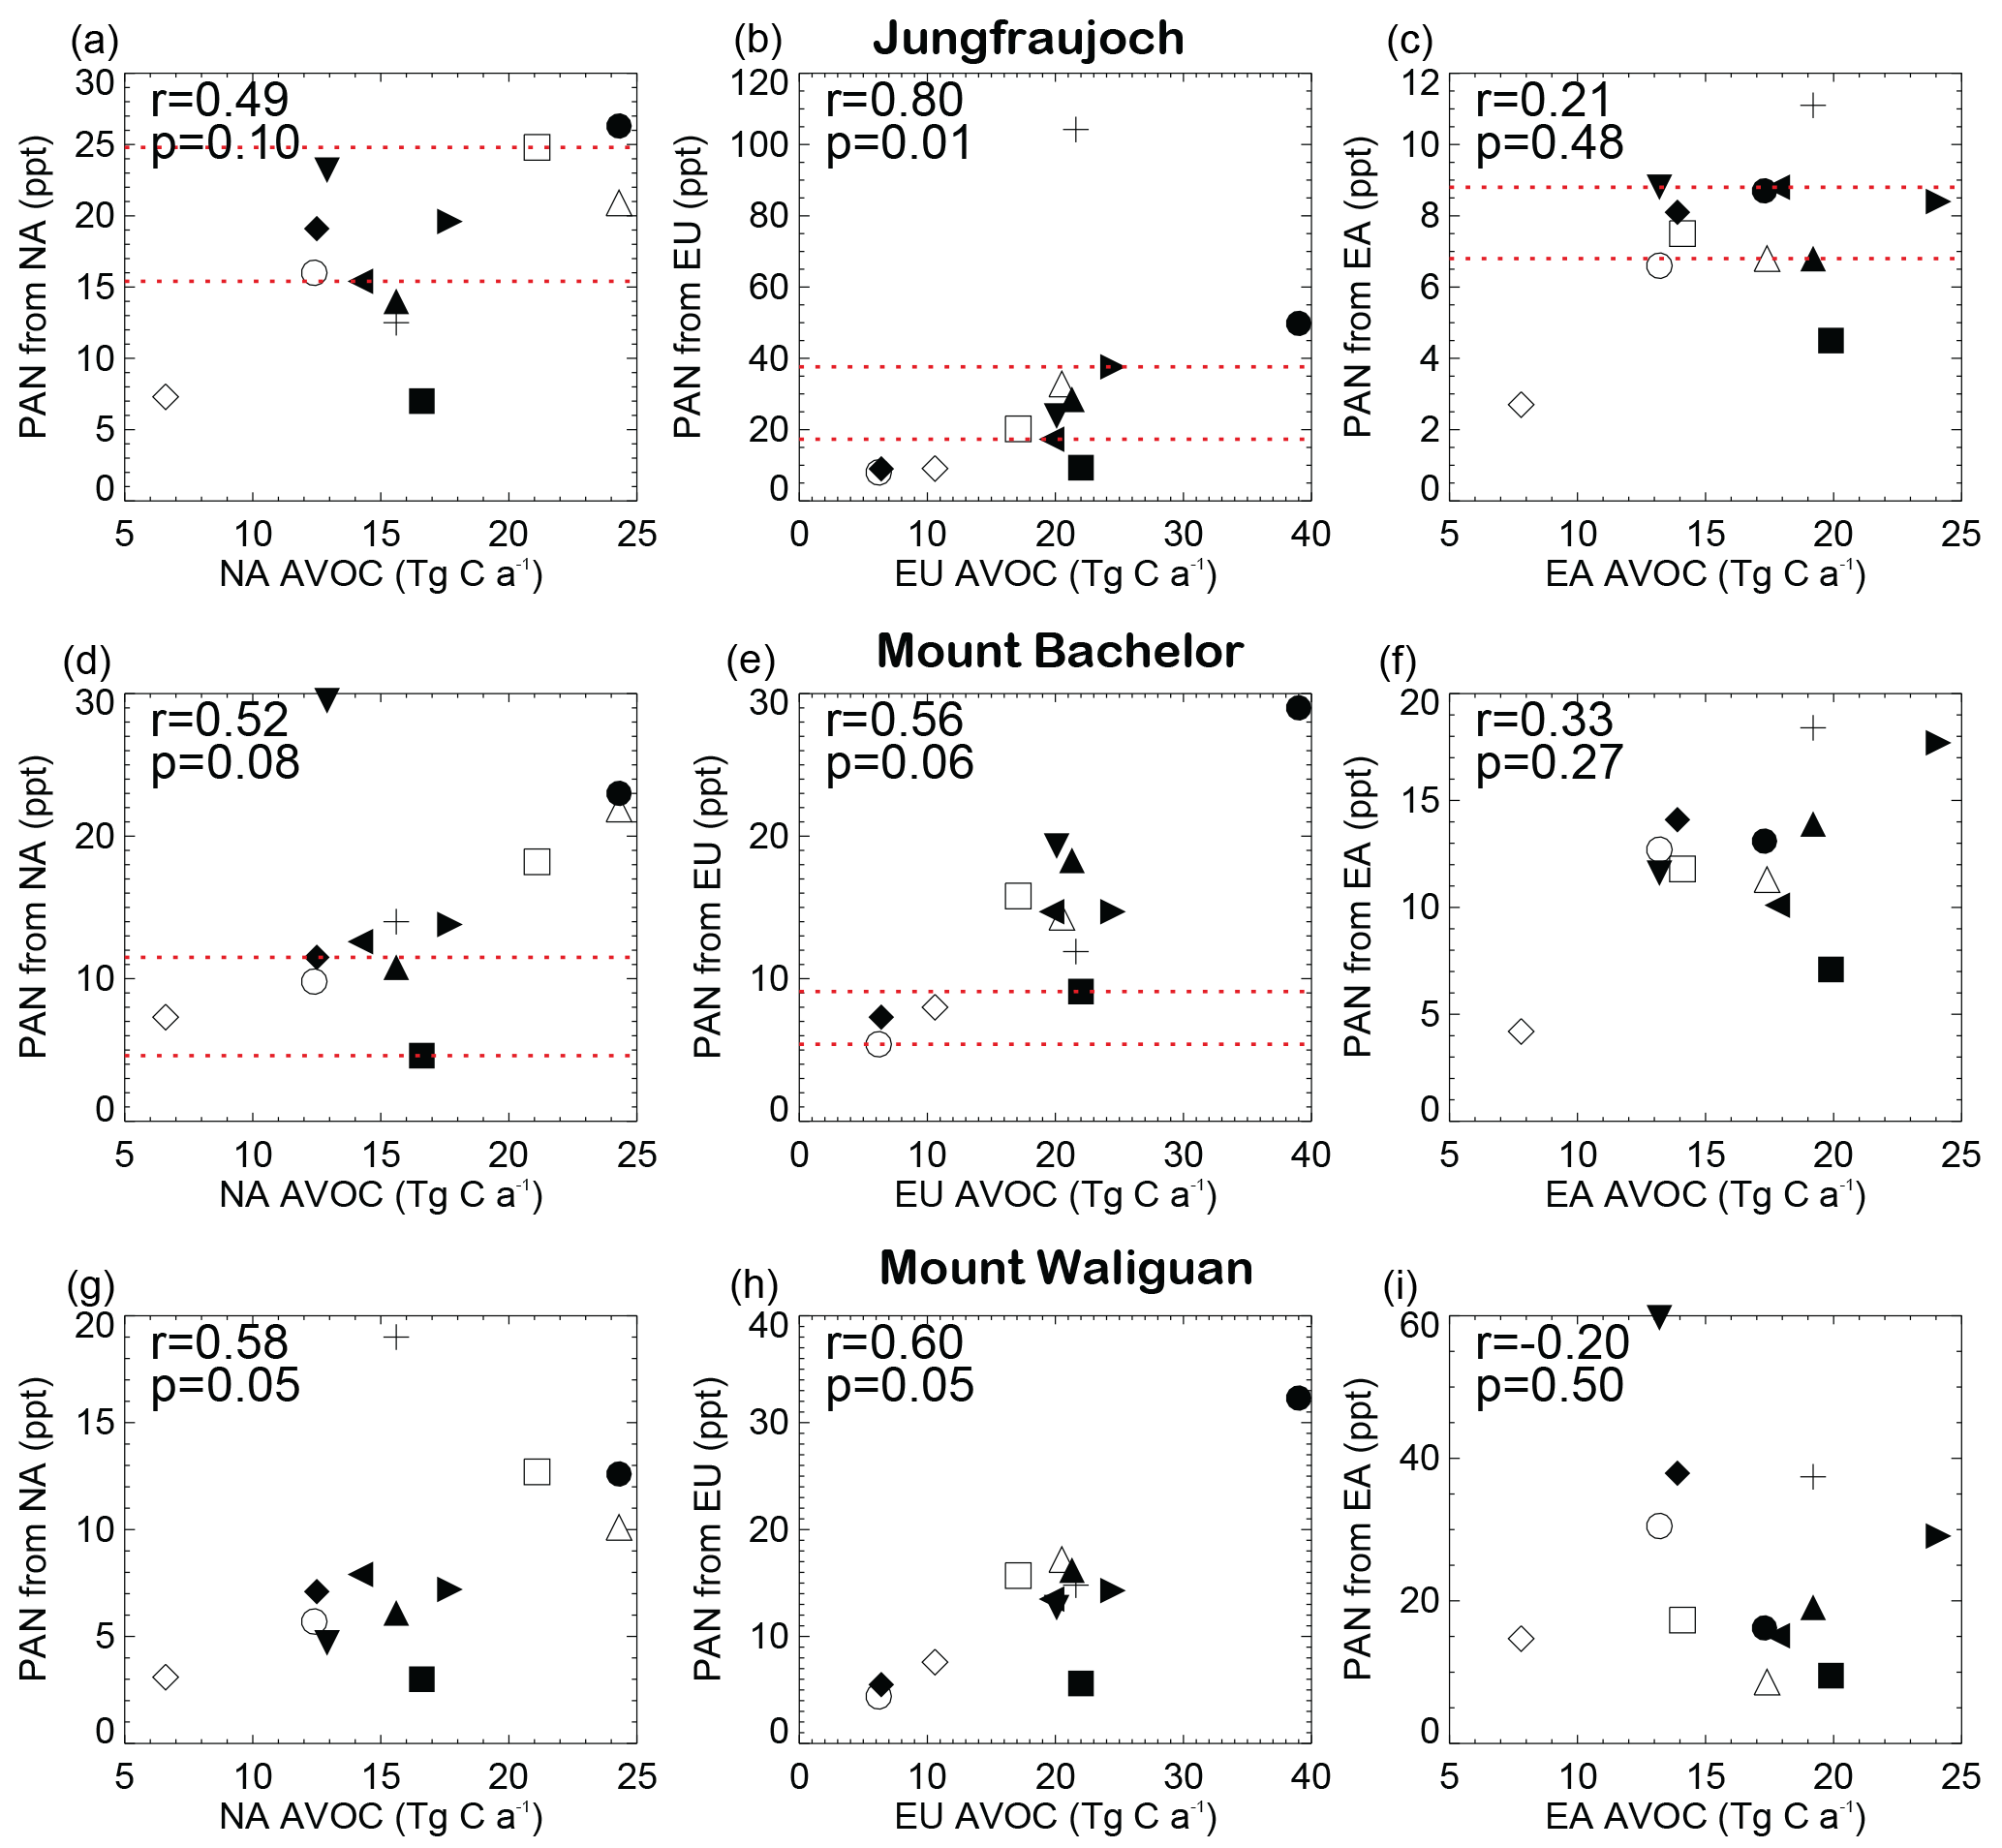
Figure 5SRRs diagnosed as the difference between the SR1 and SR6xx simulations in Table 1 for PAN (ppt) at Jungfraujoch (a, b, c), Mount Bachelor (d, e, f), and Mount Waliguan (g, h, i) in each HTAP1 model (see Table 1 for the symbol assigned to each model) versus the annual emission of anthropogenic VOCs (AVOCs; Tg C a−1) within the NA (a, d, g), EU (b, e, h), and EA (c, f, i) source regions. The Spearman's rank correlation coefficient (more robust to outliers than the traditional Pearson coefficient) and associated p value are shown in each panel. The horizontal red lines correspond to the values identified with the red symbols in Fig. 4.
We investigate the role of inter-model differences in regional emissions of PAN precursors versus transport in contributing to inter-model differences in the PAN response to continental-scale emission changes at the three mountaintop sites shown in Fig. 4. At each site, we examine the correlation across models between simulated PAN SRRs and regional anthropogenic emissions of VOCs (AVOCs; Fig. 5) or NOx (ANOx). The relationships for the EA SRRs are not significant, even at Mount Waliguan. We find, however, that the inter-model range in regional AVOC emissions explains as much as 64 % of the variation in PAN attributed to EU emissions, and at least 25 % of the variance in PAN attributed to the NA region (Fig. 5). In contrast to AVOCs, we find little relationship between the range in simulated PAN SRRs at the mountain sites and the model spread in regional ANOx emissions. Fischer et al. (2014) have previously shown that PAN abundances respond more strongly to changes in emissions of VOCs than of NOx. Our analysis supports that earlier finding and furthermore highlights a key role for model differences in regional AVOC emissions in contributing to the inter-model range in PAN SRRs.
Differences in model transport (e.g., Arnold et al., 2015; Orbe et al., 2017) may also contribute to the inter-model differences in PAN SRRs. Our analysis of the HTAP1 idealized CO tracers, however, reveals little correlation between inter-model differences in these idealized tracers (which have identical regional emissions and lifetimes applied in all of the models) and in the PAN SRRs sampled at these sites. Although we do not find any clear overall correlation, differences in the idealized CO tracers explain some of the scatter in Fig. 5. For example, at Jungfraujoch for EU AVOC emissions of 22 Tg C a−1, the lowest model (GISS-PUCCINI) has one of the smallest values for the COfromEU tracer, whereas the highest model (STOC-HadAM3) has the largest value of COfromEU.
In light of the dependence of inter-model differences in PAN attributed to EU and NA during April and the corresponding regional AVOC emissions, we illustrate how one could extend our emergent constraints in Fig. 4 (horizontal dashed red lines) to the regional AVOC emission estimates shown in Fig. 5. A major caveat underlying this analysis is the mismatch between meteorological years for the models and measurements as discussed above, and the underlying assumption that the relationships in Fig. 5 can exclusively be attributed to differences in the AVOC emissions (as opposed to chemistry or transport). The observationally constrained SRRs between PAN from NA and total PAN measured at Jungfraujoch and Mount Bachelor can be used to narrow the range of NA AVOC emissions to 12–18 Tg C a−1 (the low end is ruled out by the constraint imposed by PAN from NA at Jungfraujoch; the high end is ruled out by PAN from NA at Mount Bachelor). Similarly, the range for EU AVOC emissions would narrow to 16–25 Tg C a−1.
We consider next the importance that various models ascribe to a given source region relative to another source region. We first correlate the ratios of PAN from two different source regions with the total PAN simulated by the individual models in April. We find little relationship, with the exception of Mount Bachelor, where the observational constraint implies that more PAN originating from EA should be present at Mount Bachelor than PAN originating from NA (Fig. 6a). We interpret this as indicating that models with higher total PAN at Mount Bachelor are overestimating North American influence at this mountain site (which samples free-tropospheric air). This interpretation is supported by the idealized CO tracer simulations (with identical regional emissions and the same lifetime applied in all the models), which suggest that some of the variance in the ratio of PAN from NA to EA at Mount Bachelor is due to differences in transport from the two regions (Fig. 6b). We emphasize that these transport differences do not simply reflect the use of different meteorology in the models (Fig. 6b).

Figure 6Ratio of the PAN response to 20 % emission reductions within NA to that from EA plotted against (a) total PAN and (b) the ratio of idealized tracers of model transport emitted from NA to that from EA (COfromNA/COfromEA; see Table 2) at Mount Bachelor as simulated by the HTAP1 models. Each symbol in (a) represents a model as defined in Table 1; the range of observed total PAN at Mount Bachelor is indicated by the black vertical lines. The colored symbols in (b) represent the meteorological fields used in the simulation: blue triangles for GEOS winds, red circles for NCEP, black diamonds for ECMWF, cyan upside-down triangles for the Canadian Meteorological Centre, and green squares for general circulation models forced by observed sea surface temperatures and sea ice. Both panels show Spearman's rank correlation coefficients and p values, as well as a black dashed horizontal line at 1 to separate the models suggesting a higher NA influence (above) versus higher EA influence (below) on PAN SRRs.
By comparing NA:EA at Mount Bachelor, EU:NA at Jungfraujoch, and EA:EU at Mount Waliguan, we examine the relative importance of emissions within the source region, where the measurement site is located, versus the upwind intercontinental source region of PAN (Fig. S2). At Mount Bachelor, the HTAP1 multi-model mean SRRs from NA, EA, and EU are roughly equal in April (Fig. 1). The differences across the HTAP models in the relative importance of the NA:EA source regions of PAN (which range from about 0.5 to 2.5) correlate roughly equally with the ratio of the NA:EA CO transport tracers and with the ratio of the NA:EA AVOC emissions (Spearman's rank correlation coefficient (r) =0.6 for both cases); we find no relationship with the ratio of the NA:EA ANOx emissions (Figs. 6b and S2, upper left). At Jungfraujoch, the HTAP1 multi-model mean attributes much of the PAN to emissions from the EU and NA source regions during April (Fig. 1). The ratio of PAN attributed to EU to PAN attributed to NA at Jungfraujoch, however, varies from approximately 0.5 to 2 across the individual HTAP1 models (Fig. S2). In contrast to our findings at Mount Bachelor, this ratio at Jungfraujoch depends most strongly on the ratio of ANOx emissions in the EU to NA regions (r=0.6) and more weakly on the ratio of EU:NA AVOC emissions (r=0.5; Fig. S2). The correlation is even weaker between the ratio of PAN SRRs for these two regions with inter-model differences in transport as diagnosed with the CO tracers from EU to NA (r=0.4). At Mount Waliguan, the strongest relationship is found for the ratio of AVOC emissions (r=0.5; Fig. S2).
We repeat this correlation analysis of inter-model differences in ratios of ANOx emissions, AVOC emissions, or the idealized CO tracers of transport from a region, but for the ratio of PAN SRRs from two intercontinental regions. At Mount Bachelor, the EU and EA source regions contribute similar amounts to multi-model mean PAN during April (Fig. 1). Across the individual models, however, the ratio of the EU to EA source regions on PAN at Mount Bachelor varies from less than half to a factor of 2 (Fig. S3). We find that the ratio of PAN attributed to the EU versus EA source regions at Mount Bachelor correlates strongly across the models with the ratio of the AVOC emissions in the respective source regions (r=0.8; Fig. S3). In contrast, the ratio of EU:EA anthropogenic emission influence on PAN at Mount Bachelor shows little correlation with the respective regional NOx emissions used in the models, or with the differences in the simulated transport tracers (r=0.3 for both cases). As at Mount Bachelor, the model spread in the contribution to total simulated PAN from the EA versus NA source regions at both Jungfraujoch and Mount Waliguan depends most on the regional AVOC ratios (r=0.8 and 0.6, respectively; Fig. S3), with little correlation with inter-model differences in NA:EA ANOx emissions. Some correlation also emerges between the NA:EA SRRs for PAN and the NA:EA transport tracers (r=0.6 at both sites; Fig. S3). Finally, we do not find any obvious link between PAN SRRs and the choice of meteorological fields (the individual symbols in Figs. S2 and S3).
We address here the extent to which observational constraints on PAN SRRs might also serve to narrow the range of uncertainty in the inter-model spread in intercontinental SRRs for O3 (e.g., Fiore et al., 2009). We expect some commonality between the sensitivity of PAN and O3 to changes in precursor emissions because (1) both species are produced from chemical reactions involving NOx and VOCs and (2) PAN serves as a NOx reservoir, which upon decomposition releases NOx that can then produce O3 far downwind of the region where the PAN (and O3) precursors were originally emitted. Furthermore, earlier analysis of HTAP1 ozone continental-scale SRRs also identified a correlation with the model AVOC emissions, particularly over EU (Fiore et al., 2009).
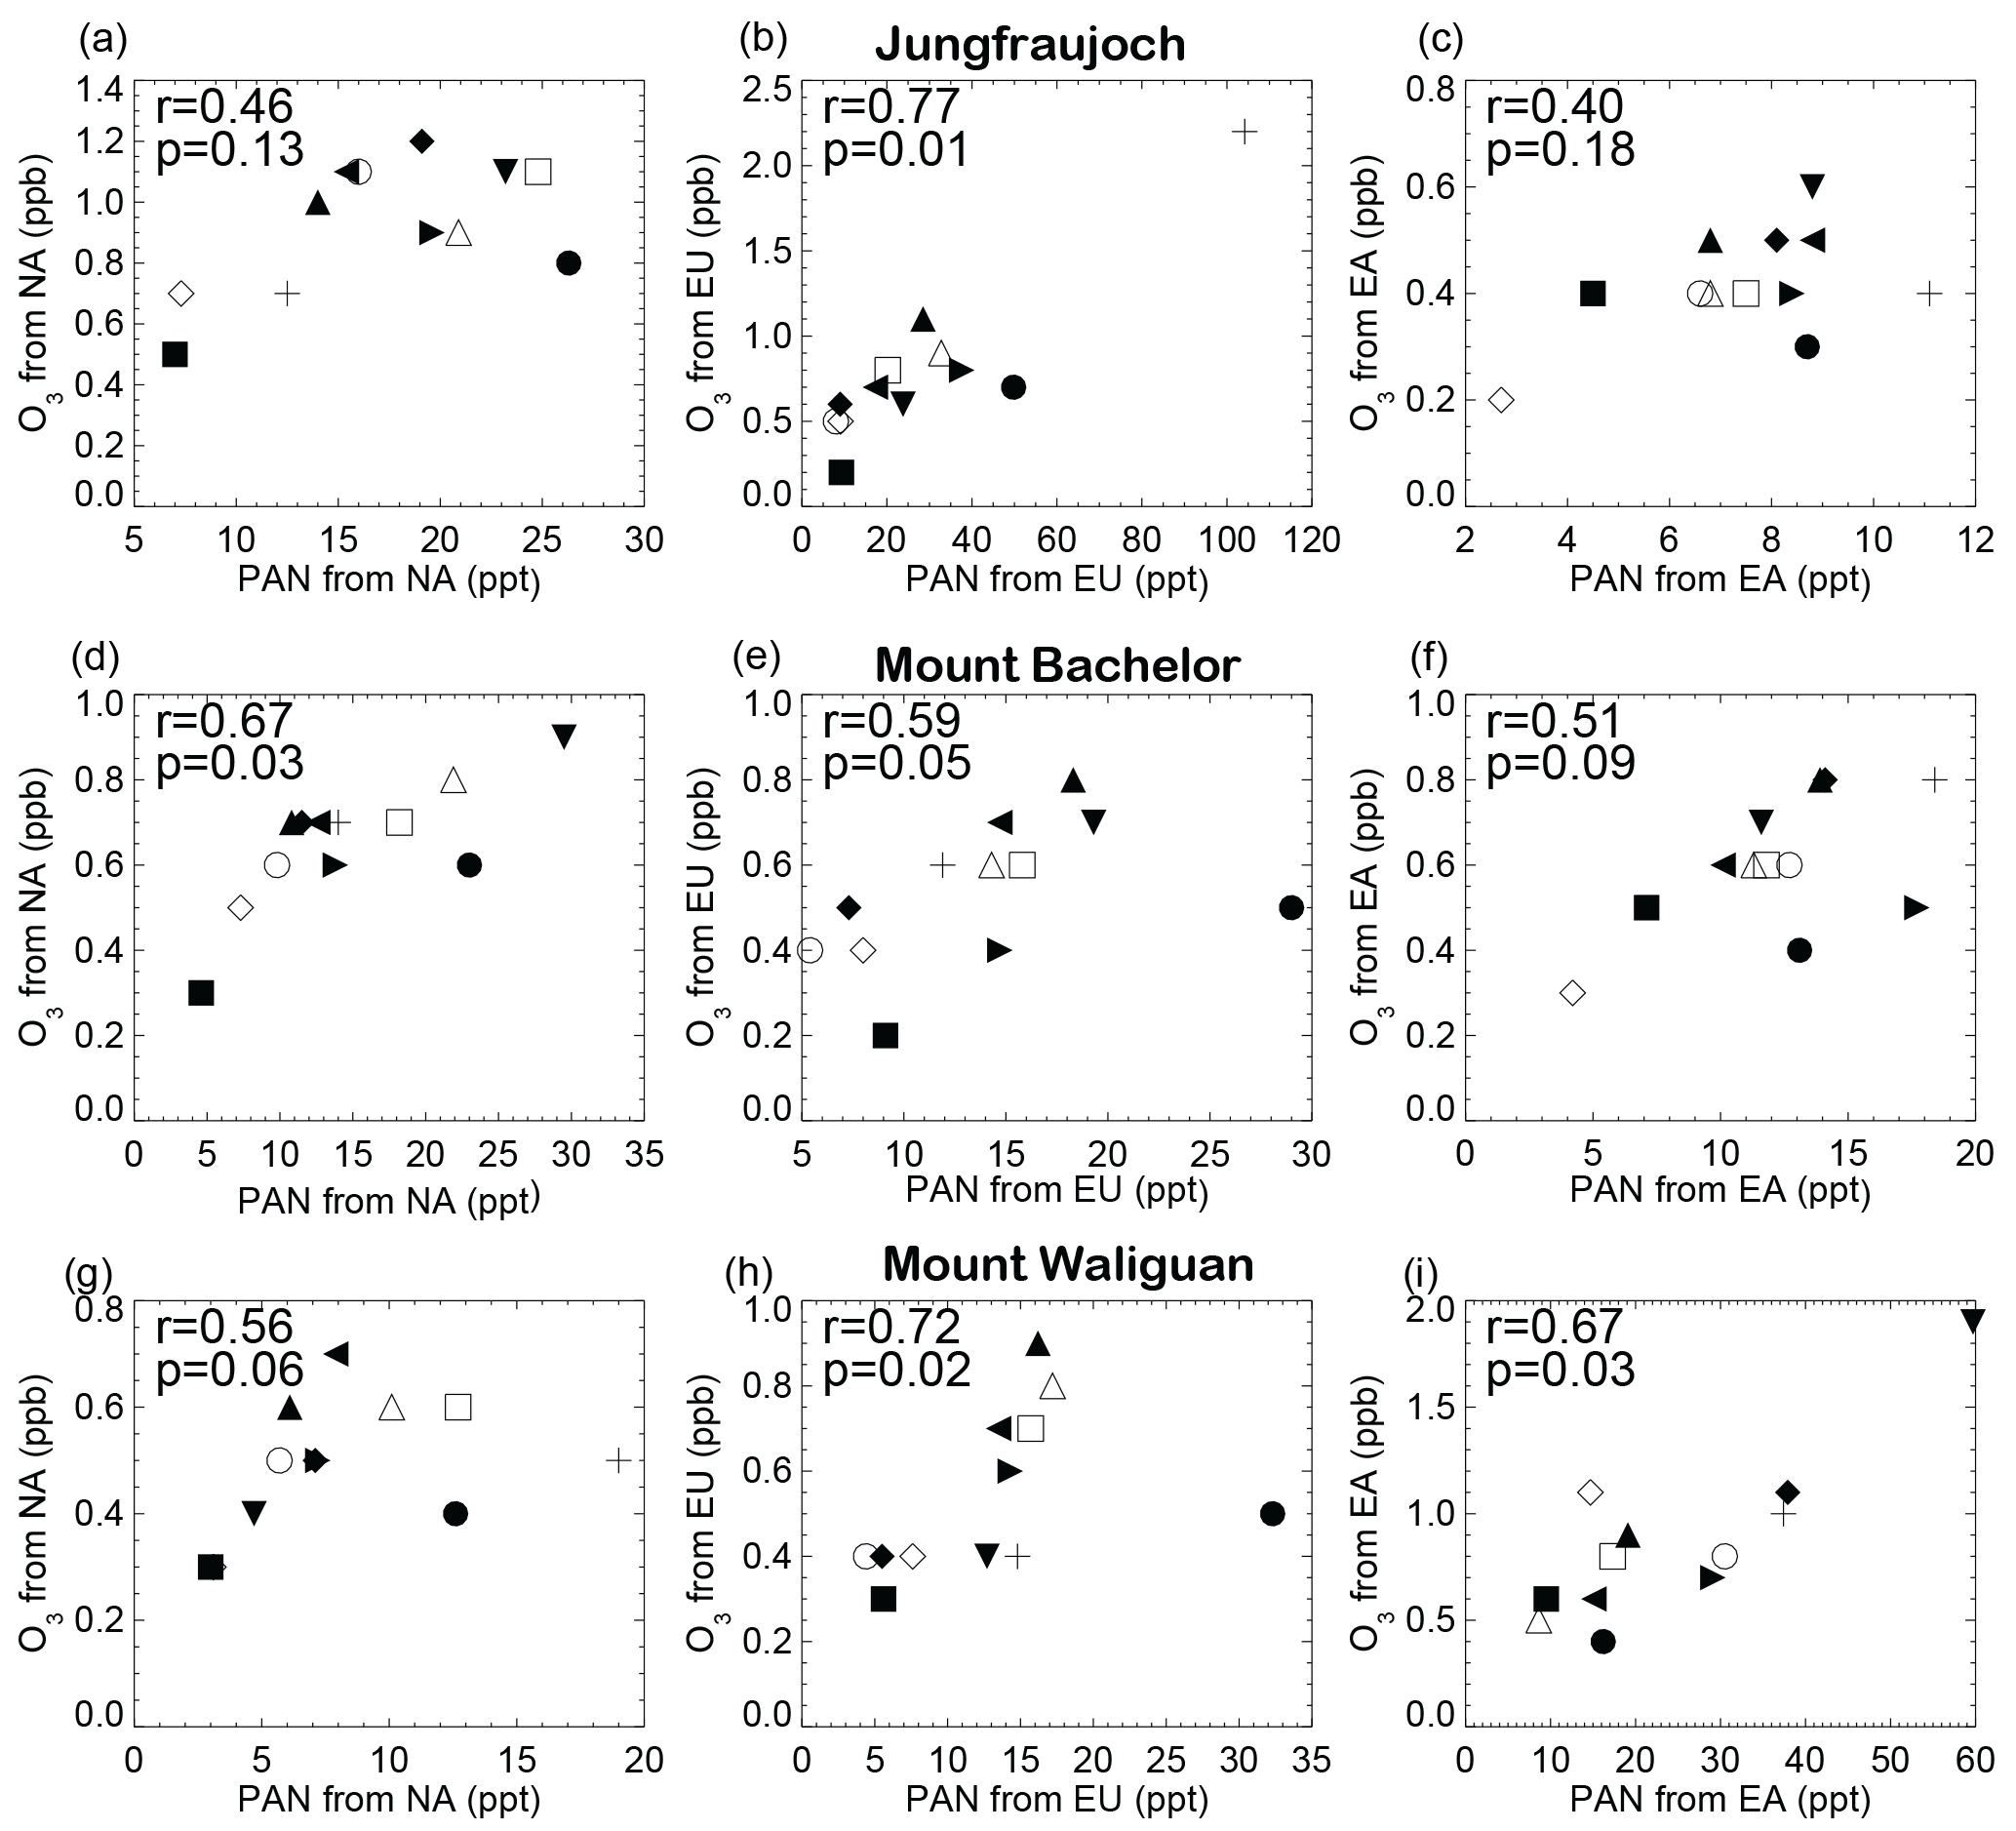
Figure 7SRRs for O3 versus PAN at Jungfraujoch (a, b, c), Mount Bachelor (d, e, f), and Mount Waliguan (g, h, i), obtained by subtracting the SR6XX from the SR1 simulations (Table 2) available from 12 models, for which XX denotes the NA (a, d, g), EU (b, e, h), or EA (c, f, i) source region. Each model thus contributes one point (symbols defined in Table 1) in each panel. Spearman's (rank) correlation coefficient and p values are also shown.
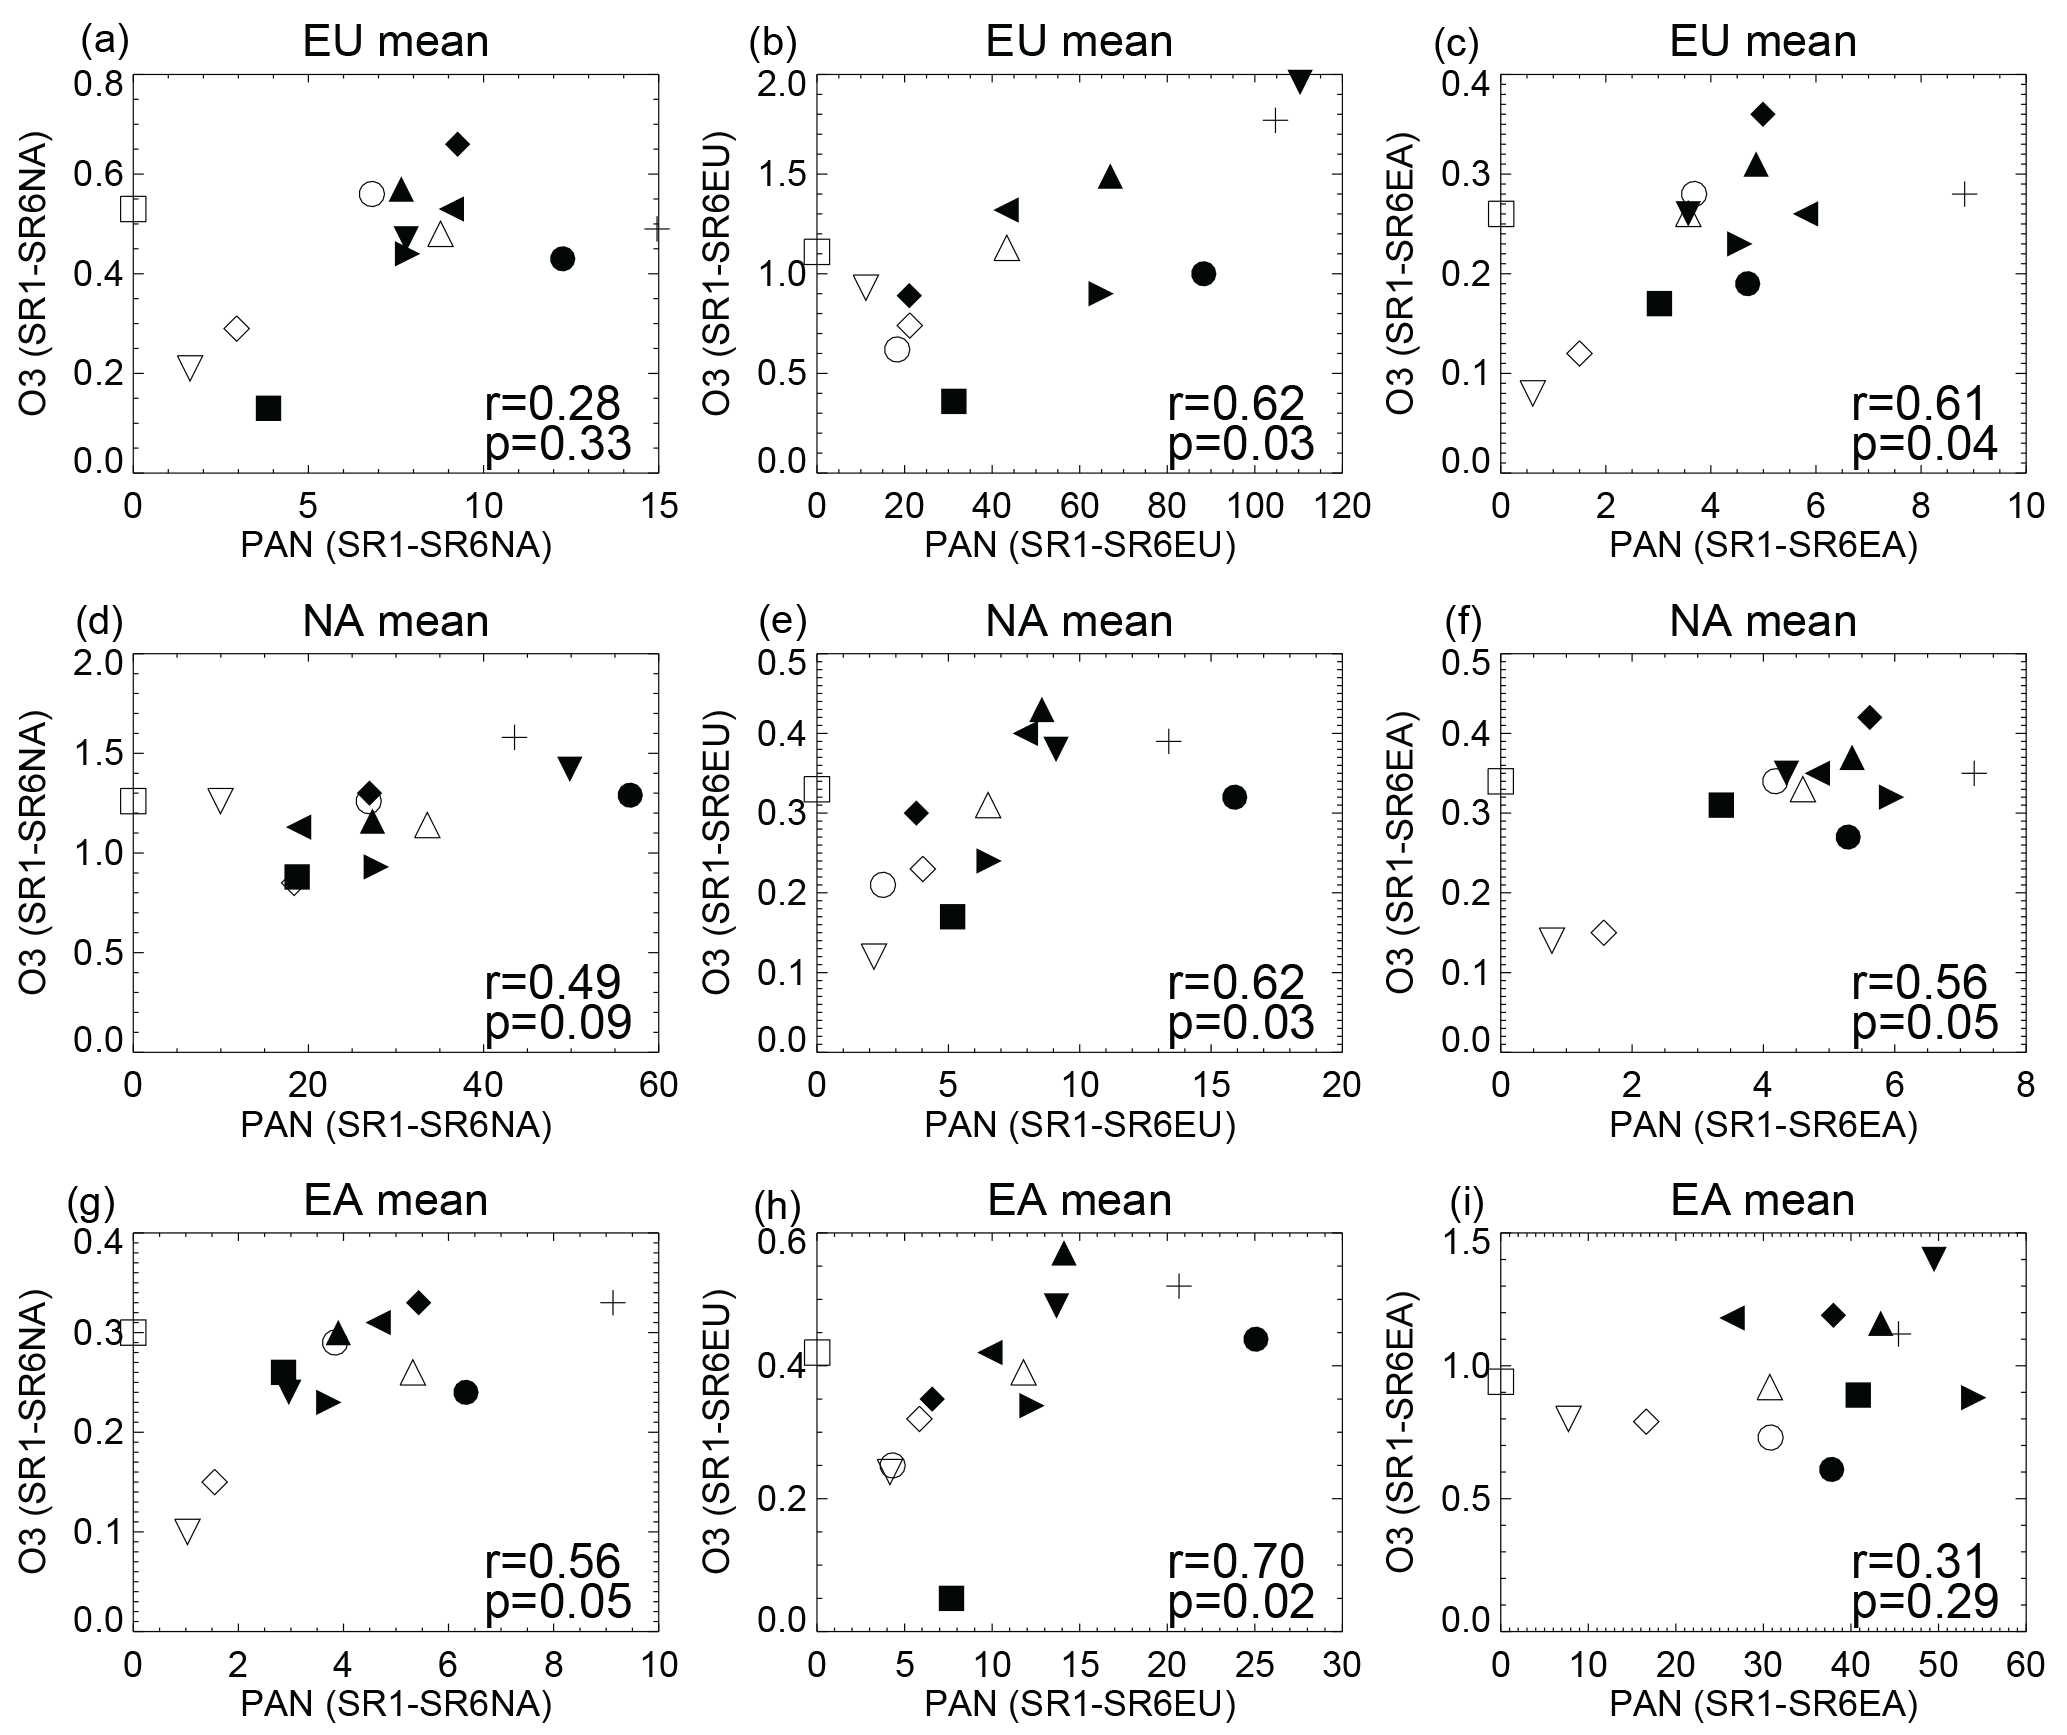
Figure 8SRRs for O3 versus PAN in surface air over each of the HTAP1 northern midlatitude continental regions: EU (a, b, c), NA (d, e, f), and EA (g, h, i), obtained by subtracting the SR6XX from the SR1 simulations, for which XX denotes the NA (a, d, g), EU (b, e, h), or EA (c, f, i) source region. Spearman's (rank) correlation coefficient and p values are also shown. Symbols denote individual models as defined in Table 1. STOC-HadAM3-v01 is excluded here as an outlier that artificially raised the correlation significance.
We assess the extent to which the inter-model range in source region influence on mountaintop PAN levels in April is relevant for interpreting O3 SRRs by correlating PAN and O3 SRRs at the three mountaintop sites (Fig. 7). Relationships vary across the individual source–receptor pairs, with the inter-model variability in PAN explaining 16 %–60 % of the inter-model differences in O3 at the mountain sites. The strongest relationships occur for the influence of regional sources at Mount Bachelor (from NA) and Jungfraujoch (from EU). At Mount Waliguan, the EU and EA source–receptor relationships for PAN and O3 are of similar strength (r=0.7). Intercontinental source–receptor pairs for O3 and PAN at Mount Bachelor and Mount Waliguan are also significant to within 90 %, with variability in the PAN attributed to intercontinental source regions explaining 25 %–35 % and 30 %–45 %, respectively, of the variability in the corresponding O3 SRRs.
We expand the correlation analysis of ozone and PAN SRRs from the free troposphere sampled at the mountaintop sites to large-scale SRRs in surface air over the HTAP1 continental regions. Of the significant relationships in Fig. 7 (p < 0.10), six out of seven also emerge as significant in Fig. 8. We infer that conclusions drawn from a limited number of mountaintop sites regarding PAN SRRs and their relationship to ozone SRRs are relevant, at least according to the models, on much broader scales.
We repeat the analysis in Fig. 5 but for O3 to consider the influence of the three source regions on the three mountaintop sites (nine total source–receptor pairs) but find little relationship between the model spread in the simulated O3 SRRs and in the magnitude of the regional AVOCs or ANOx emissions. Model differences in transport as diagnosed by the idealized regional CO tracers correlate more with O3 SRRs than for PAN for all source–receptor pairs, though the correlations remain weak except for COfromEU with O3 SRRs at Jungfraujoch. Overall, this analysis supports earlier findings that PAN is more sensitive to changes in emissions (and subsequent chemistry), particularly for VOC precursors, than O3.
The correlations between SRRs for PAN and O3 could reflect a role for PAN transport in contributing to O3 production over the receptor region, or may instead reflect coproduction of PAN and O3 from oxidation of regional precursor emissions followed by transport in the same air mass. In the latter case, PAN serves as a proxy for O3 transport, whereas in the former case PAN serves as the actual pathway by which O3 is transported. We do not have model diagnostics that allow us to distinguish between these two roles for PAN. The correlations between PAN and O3 SRRs, however, suggest that long-term PAN measurements contain signals relevant for constraining the relative importance of regional vs. intercontinental emissions on both PAN and O3. We examine the strength of these signals by correlating the O3 SRRs at each site with total PAN as simulated at each site. Relationships are far weaker than for the PAN SRRs and total PAN shown in Fig. 4, but correlations are significant between total PAN at Jungfraujoch for O3 from EU (r=0.67; p=0.03) and at Mount Bachelor for O3 from NA (r=0.61; p=0.04; Fig. S4).
Our proof-of-concept approach applies the HTAP1 multi-model ensemble to identify a strong inter-model correlation between PAN source–receptor relationships (SRRs; defined as the difference in simulations with 20 % emission reductions separately within each of the northern midlatitude continents) and simulated total PAN at mountaintop sites during April. Our findings imply promise for developing emergent constraints (e.g., Hall and Qu, 2006; Borodina et al., 2017; Cox et al., 2018) from more routine PAN measurements to narrow uncertainty in wide-ranging model estimates of PAN SRRs, quantities that are not directly observable yet relevant to air quality policy (e.g., HTAP, 2010). Inter-model correlations of the responses of PAN versus O3 to perturbations in regional anthropogenic emissions (Figs. 7 and 8) imply that constraints on PAN SRRs are relevant for lowering uncertainty in O3 SRR estimates. This connection between PAN and O3 likely reflects the dual role of PAN as both a pathway for O3 transport (by producing O3 upon its decomposition following transport), and as a proxy for O3 transport (as it is produced alongside O3 in the polluted continental boundary layer).
Establishing the strongest constraints possible on simulated SRRs for PAN and O3 will require (1) measurements and simulations with chemical transport models that coincide and (2) a sufficiently long measurement record to build a climatology suitable for evaluating chemistry–climate models that generate their own meteorology. Repeated sampling for the month of April may be sufficient to provide constraints on model responses to changes in anthropogenic emissions. PAN measurements over multiple seasons are necessary to evaluate model responses of PAN to climate change (e.g., by changing temperature and weather-sensitive precursor emissions) and the resulting influence on atmospheric O3 and oxidizing capacity (e.g., Doherty et al., 2013). For example, changes in meteorology and biomass burning (Fischer et al., 2011; Zhu et al., 2015) such as those driven by El Niño–Southern Oscillation (Koumoutsaris et al., 2008), as well as biogenic and lightning sources (Payne et al., 2017) vary from year to year and are expected to change as climate warms.
We identified only five multiyear datasets at mountain sites, four of which are located near each other in Europe, and only one of which continues at present (Schauinsland). Our analysis suggests that future measurements at Mount Waliguan would provide constraints on PAN SRRs, particularly for PAN originating in EA (Fig. 4). Additional work could systematically examine over 60 stations at altitudes above 2500 m in the Tropospheric Ozone Assessment Report (TOAR) database (Schultz et al., 2017).
We recommend archiving daily model fields for future applications of this multi-model emergent constraint approach to SRRs. Access to daily model fields permits (1) a more rigorous process-oriented evaluation of specific events (e.g., Fischer et al., 2010; Alvarado et al., 2010; Arnold et al., 2015) and (2) comparison with satellite-derived tropospheric PAN columns, which show promise for documenting PAN distributions, particularly in the upper troposphere, and their temporal variability and spatial patterns across the globe (e.g., Fadnavis et al., 2014; Jiang et al., 2016; Payne et al., 2014, 2017; Zhu et al., 2015, 2017). We also suggest archiving daily tracers tagged by emission region to isolate the role of model differences in transport during individual events. In addition, Lin et al. (2017) have demonstrated that applying a filtering technique based on daily idealized CO regional tracers can better isolate free-tropospheric air from surface air masses when comparing coarse-resolution models with high-altitude measurements.
By focusing on April, our analysis largely minimizes complexities introduced by inter-model differences in biogenic, fire, and lightning sources that further complicate disentangling summertime discrepancies in simulated PAN and O3 (e.g., Arnold et al., 2015; Emmons et al., 2015) and restricts inter-model differences to those associated with anthropogenic emissions and the subsequent chemistry and transport. Nevertheless, we find a wide range in inter-model SRR relationships that reflects uncertainties in emissions and different model representations of VOC chemistry, including PAN yields from VOCs (Fig. 5; Emmerson and Evans, 2009; Fischer et al., 2014; Arnold et al., 2015; Emmons et al., 2015; Knote et al., 2015). Future multi-model efforts could seek to separately parse the influence of differences in total anthropogenic VOC emissions, the mix of emitted VOC species and their reactivity, and the chemical production of PAN and O3. Documenting these aspects of model configuration would help to establish benchmarks for inter-model differences in simulated total PAN, O3, and their SRRs, against which future model simulations (and multi-model ensembles) can be assessed.
Upon publication, the data used to generate the figures can be found in a CSU digital repository that we established for this paper (https://hdl.handle.net/10217/185610).
The supplement related to this article is available online at: https://doi.org/10.5194/acp-18-15345-2018-supplement.
AMF and EVF conceived the analysis with guidance from SPD, OW, DAJ, and JS. EVF compiled monthly mean PAN measurements from EVF, DAJ, SPD, JS, BF, SG, LR, MGSa, MS, and CZ. AMF led the model evaluation, emergent constraint analysis, and writing. AMF, GPM, and OEC prepared the figures. SPD and JS contributed trajectory analysis at Jungfraujoch. OW contributed to linearity analysis. AMF, OW, DB, WC, FD, RMD, BND, PGH, LWH, AL, IAM, RP, MGSa, MGSc, DTS, DSS, SS, and GZ contributed HTAP Phase 1 model simulations. All authors helped to shape the paper content by editing prior versions of the paper.
The authors declare that they have no conflict of interest.
This article is part of the special issue “Global and regional assessment of intercontinental transport of air pollution: results from HTAP, AQMEII and MICS”. It is not associated with a conference.
We thank Mathew Evans (York University, UK) and Terry Keating (U.S. EPA) for
useful discussions and the two anonymous referees for their constructive
comments. Arlene M. Fiore and Bryan N. Duncan acknowledge NASA MAP (NNX14AM38G). David S. Stevenson acknowledges
NERC (grants NE/K001329/1 and NE/N003411/1) and the ARCHER UK National
Supercomputing Service (http://www.archer.ac.uk, last access: 17 October 2018).
Drew T. Shindell acknowledges the NASA High-End Computing Program
through the NASA Center for Climate Simulation at GSFC for computational resources.
Michael G. Sanderson was supported by the Met Office Hadley Centre Climate
Programme funded by BEIS and Defra. This is Lamont contribution number
8251.
Edited by: Kathy Law
Reviewed by: two anonymous referees
Alvarado, M. J., Logan, J. A., Mao, J., Apel, E., Riemer, D., Blake, D., Cohen, R. C., Min, K.-E., Perring, A. E., Browne, E. C., Wooldridge, P. J., Diskin, G. S., Sachse, G. W., Fuelberg, H., Sessions, W. R., Harrigan, D. L., Huey, G., Liao, J., Case-Hanks, A., Jimenez, J. L., Cubison, M. J., Vay, S. A., Weinheimer, A. J., Knapp, D. J., Montzka, D. D., Flocke, F. M., Pollack, I. B., Wennberg, P. O., Kurten, A., Crounse, J., Clair, J. M. St., Wisthaler, A., Mikoviny, T., Yantosca, R. M., Carouge, C. C., and Le Sager, P.: Nitrogen oxides and PAN in plumes from boreal fires during ARCTAS-B and their impact on ozone: an integrated analysis of aircraft and satellite observations, Atmos. Chem. Phys., 10, 9739–9760, https://doi.org/10.5194/acp-10-9739-2010, 2010.
Arnold, S. R., Emmons, L. K., Monks, S. A., Law, K. S., Ridley, D. A., Turquety, S., Tilmes, S., Thomas, J. L., Bouarar, I., Flemming, J., Huijnen, V., Mao, J., Duncan, B. N., Steenrod, S., Yoshida, Y., Langner, J., and Long, Y.: Biomass burning influence on high-latitude tropospheric ozone and reactive nitrogen in summer 2008: a multi-model analysis based on POLMIP simulations, Atmos. Chem. Phys., 15, 6047–6068, https://doi.org/10.5194/acp-15-6047-2015, 2015.
Balzani Lööv, J. M., Henne, S., Legreid, G., Staehelin, J., Reimann, S., Prévôt, A. S. H., Steinbacher, M., and Vollmer, M. K.: Estimation of background concentrations of trace gases at the Swiss Alpine site Jungfraujoch (3580 m asl), J. Geophys. Res., 113, D22305, https://doi.org/10.1029/2007JD009751, 2008.
Borodina, A., Fischer, E. M., and Knutti, R.: Emergent Constraints in Climate Projections: A Case Study of Changes in High-Latitude Temperature Variability, J. Climate, 30, 3655–3670, https://doi.org/10.1175/JCLI-D-16-0662.1, 2017.
Bottenheim, J. W., Sirois, A., Brice, K. A., and Gallant, A. J.: Five years of continuous observations of PAN and ozone at a rural location in eastern Canada, J. Geophys. Res.-Atmos., 99, 5333–5352, 10.1029/93JD02716, 1994.
Carpenter, L. J., Green, T. J., Mills, G. P., Bauguitte, S., Penkett, S. A., Zanis, P., Schuepbach, E., Schmidbauer, N., Monks, P. S., and Zellweger, C: Oxidized nitrogen and ozone production efficiencies in the springtime free troposphere over the Alps, J. Geophys. Res., 105, 14547–14559, 2000.
Chameides, W. L., Fehsenfeld, F. C., Rodgers, M. O., Cardelino, C., Martinez, J., Parrish, D., Lonnerman, W., Lawson, D. R., Rasmussen, R. A., Zimmerman, P., Greenberg, J., Middleton, P., and Wang, T.: Ozone precursor relationships in the ambient atmosphere, J. Geophys. Res., 97, 6037–6055, 1992.
Cox, P. M., Huntingford, C., and Williamson, M. S., Emergent constraint on equilibrium climate sensitivity from global temperature variability: Nature, 553, 319–323, https://doi.org/10.1038/nature25450, 2018.
Doherty, R. M., Wild, O., Shindell, D. T., Zeng, G., MacKenzie, I. A., Collins, W. J., Fiore, A. M., Stevenson, D. S., Dentener, F. J., Schultz, M. G., Hess, P., Derwent, R. G., and Keating, T. J.: Impacts of climate change on surface ozone and intercontinental ozone pollution: A multi-model study, J. Geophys. Res.-Atmos., 118, 3744–3763, https://doi.org/10.1002/jgrd.50266, 2013.
Emmerson, K. M. and Evans, M. J.: Comparison of tropospheric gas-phase chemistry schemes for use within global models, Atmos. Chem. Phys., 9, 1831–1845, https://doi.org/10.5194/acp-9-1831-2009, 2009.
Emmons, L. K., Arnold, S. R., Monks, S. A., Huijnen, V., Tilmes, S., Law, K. S., Thomas, J. L., Raut, J.-C., Bouarar, I., Turquety, S., Long, Y., Duncan, B., Steenrod, S., Strode, S., Flemming, J., Mao, J., Langner, J., Thompson, A. M., Tarasick, D., Apel, E. C., Blake, D. R., Cohen, R. C., Dibb, J., Diskin, G. S., Fried, A., Hall, S. R., Huey, L. G., Weinheimer, A. J., Wisthaler, A., Mikoviny, T., Nowak, J., Peischl, J., Roberts, J. M., Ryerson, T., Warneke, C., and Helmig, D.: The POLARCAT Model Intercomparison Project (POLMIP): overview and evaluation with observations, Atmos. Chem. Phys., 15, 6721–6744, https://doi.org/10.5194/acp-15-6721-2015, 2015.
Fadnavis, S., Schultz, M. G., Semeniuk, K., Mahajan, A. S., Pozzoli, L., Sonbawne, S., Ghude, S. D., Kiefer, M., and Eckert, E.: Trends in peroxyacetyl nitrate (PAN) in the upper troposphere and lower stratosphere over southern Asia during the summer monsoon season: regional impacts, Atmos. Chem. Phys., 14, 12725–12743, https://doi.org/10.5194/acp-14-12725-2014, 2014.
Fiore, A. M., Dentener, F. J., Wild, O., Cuvelier, C., Schultz, M. G., Hess, P., Textor, C., Schulz, M., Doherty, R. M., Horowitz, L. W., MacKenzie, I. A., Sanderson, M. G., Shindell, D. T., Stevenson, D. S., Szopa, S., Van Dingenen, R., Zeng, G., Atherton, C., Bergmann, D., Bey, I., Carmichael, G., Collins, W. J., Duncan, B. N., Faluvegi, G., Folberth, G., Gauss, M., Gong, S., Hauglustaine, D., Holloway, T., Isaksen, I. S. A., Jacob, D. J., Jonson, J. E., Kaminski, J. W., Keating, T. J., Lupu, A., Marmer, E., Montanaro, V., Park, R. J., Pitari, G., Pringle, K. J., Pyle, J. A., Schroeder, S., Vivanco, M. G., Wind, P., Wojcik, G., Wu, S., and Zuber, A.: Multimodel estimates of intercontinental source-receptor relationships for ozone pollution, J. Geophys. Res., 114, D04301, https://doi.org/10.1029/2008jd010816, 2009.
Fiore, A. M., Levy II, H., and Jaffe, D. A.: North American isoprene influence on intercontinental ozone pollution, Atmos. Chem. Phys., 11, 1697–1710, https://doi.org/10.5194/acp-11-1697-2011, 2011.
Fischer, E. V., Jaffe, D. A., Reidmiller, D. R., and Jaegle, L.: Meteorological controls on observed peroxyacetyl nitrate (PAN) at Mount Bachelor during the spring of 2008, J. Geophys. Res., 115, D03302, https://doi.org/10.1029/2009JD012776, 2010.
Fischer, E. V., Jaffe, D. A., and Weatherhead, E. C.: Free tropospheric peroxyacetyl nitrate (PAN) and ozone at Mount Bachelor: potential causes of variability and timescale for trend detection, Atmos. Chem. Phys., 11, 5641–5654, https://doi.org/10.5194/acp-11-5641-2011, 2011.
Fischer, E. V., Jacob, D. J., Yantosca, R. M., Sulprizio, M. P., Millet, D. B., Mao, J., Paulot, F., Singh, H. B., Roiger, A., Ries, L., Talbot, R. W., Dzepina, K., and Pandey Deolal, S.: Atmospheric peroxyacetyl nitrate (PAN): a global budget and source attribution, Atmos. Chem. Phys., 14, 2679–2698, https://doi.org/10.5194/acp-14-2679-2014, 2014.
Gilge, S., Plass-Duelmer, C., Fricke, W., Kaiser, A., Ries, L., Buchmann, B., and Steinbacher, M.: Ozone, carbon monoxide and nitrogen oxides time series at four alpine GAW mountain stations in central Europe, Atmos. Chem. Phys., 10, 12295–12316, https://doi.org/10.5194/acp-10-12295-2010, 2010.
Hall, A. and Qu, X., Using the current seasonal cycle to constrain snow albedo feedback in future climate change, Geophys. Res. Lett., 33, L03502, https://doi.org/10.1029/2005GL025127, 2006.
Heald, C. L., Jacob, D. J., Fiore, A. M., Emmons, L. K., Gille, J. C., Deeter, M. N., Warner, J., Edwards, D. P., Crawford, J. H., Hamlin, A. J., Sachse, G. W., Browell, E. V., Avery, M. A., Vay, S. A., Westberg, D. J., Blake, D. R., Singh, H. B., Sandholm, S. T., Talbot, R. W., and Fuelberg, H. E.: Asian outflow and trans-Pacific transport of carbon monoxide and ozone pollution: An integrated satellite, aircraft, and model perspective, J. Geophys. Res., 108, 4804, https://doi.org/10.1029/2003jd003507, 2003.
HTAP: Task Force on Hemispheric Transport of Air Pollution 2007 Interim Report, United Nations Economic Commission for Europe, New York and Geneva, 2007.
HTAP: Hemispheric transport of air pollution 2010 part a: ozone and particulate matter, Air Pollution Studies No. 17, UNITED NATIONS, New York, 2010.
Hudman, R. C., Jacob, D. J., Cooper, O. R., Evans, M. J., Heald, C. L., Park, R. J., Fehsenfeld, F., Flocke, F., Holloway, J., Hübler, G., Kita, K., Koike, M., Kondo, Y., Neuman, A., Nowak, J., Oltmans, S., Parrish, D., Roberts, J. M., and Ryerson, T.: Ozone production in transpacific Asian pollution plumes and implications for ozone air quality in California, J. Geophys. Res., 109, D23S10, https://doi.org/10.1029/2004jd004974, 2004.
Jaeglé, L., Jaffe, D. A., Price, H. U., Weiss-Penzias, P., Palmer, P. I., Evans, M. J., Jacob, D. J., and Bey, I.: Sources and budgets for CO and O3 in the northeastern Pacific during the spring of 2001: Results from the PHOBEA-II Experiment, J. Geophys. Res., 108, D20, 8802, https://doi.org/10.1029/2002JD003121, 2003.
Jaffe, D., Thornton, J., Wolfe, G., Reidmiller, D., Fischer, E. V., Jacob, D. J., Cohen, R., Singh, H., Weinheimer, A., and Flocke, F.: Can we Detect an Influence over North America From Increasing Asian NOx Emissions?, EOS Trans. AGU, 88(52), Fall Meet. Suppl., Abstract A51E-04, 2007.
Jiang, Z., Worden, J. R., Payne, V. H., Zhu, L., Fischer, E., Walker, T., and Jones, D. B. A.: Ozone export from East Asia: The role of PAN, J. Geophys. Res.-Atmos., 121, 6555–6563, https://doi.org/10.1002/2016JD024952, 2016.
Kirchner, F., Mayer-Figge, A., Zabel, F., and Becker, K. H.: Thermal stability of peroxynitrates, Int. J. Chem. Kinet., 31, 127–144, 1999.
Knote, C., Tuccella, P., Curci, G., Emmons, L., Orlando, J. J., Madronich, S., Baro, R., Jimenez-Guerrero, P., Luecken, D., Hogrefe, C., Forkel, R. , Werhahn, J., Hirtl, M., Perez, J., San Jose, R., Giordano, L., Brunner, D., Yahya, K., and Zhang, Y.: Influence of the choice of gas-phase mechanism on predictions of key gaseous pollutants during the AQMEII phase-2 intercomparison, Atmos. Environ., 115, 553–568, 2015.
Kotchenruther, R. A., Jaffe, D. A., and Jaeglé, L.: Ozone potochemistry and the role of PAN in the springtime northeastern Pacific Troposphere: Results from the PHOBEA Campaign, J. Geophys. Res., 106, 28731–28741, 2001a.
Kotchenruther, R. A., Jaffe, D. A., Beine, H. J., Anderson,T., Bottenheim, J. W., Harris, J. M., Blake, D., and Schmitt, R.: Observations of ozone and related species in the Northeast Pacific during the PHOBEA Campaigns: 2. Airborne observations, J. Geophys. Res., 106, 7463–7483, 2001b.
Koumoutsaris, S., Bey, I., Generoso, S., and Thouret, V.: Influence of El Niño-Southern Oscillation on the interannual variability of tropospheric ozone in the northern midlatitudes, J. Geophys. Res., 113, D19301, https://doi.org/10.1029/2007jd009753, 2008.
Kuhn, M., Builtjes, P. J. H., Poppe, D., Simpson, D., Stockwell, W. R., Andersson-Sköld, Y., Baart, A., Das, M., Fiedler, F., Hov, Ø., Kirchner, F., Makar, P. A., Milford, J. B., Roemer, M. G. M., Ruhnke, R., Strand, A., Vogel, B., and Vogel, H.: Intercomparison of the gas-phase chemistry in several chemistry and transport models, Atmos. Environ., 32, 693–709, 1998.
Liang, J., Horowitz, L. W., Jacob, D. J., Wang, Y., Fiore, A. M., Logan, J. A., Gardner, G. M., and Munger, J. W.: Seasonal variations of reactive nitrogen species and ozone over the United States and export fluxes to the global atmosphere, J. Geophys. Res., 103, 13435–413450, 1998.
Lin, M., Holloway, T., Carmichael, G. R., and Fiore, A. M.: Quantifying pollution inflow and outflow over East Asia in spring with regional and global models, Atmos. Chem. Phys., 10, 4221–4239, https://doi.org/10.5194/acp-10-4221-2010, 2010.
Lin, M., Horowitz, L. W., Payton, R., Fiore, A. M., and Tonnesen, G.: US surface ozone trends and extremes from 1980 to 2014: quantifying the roles of rising Asian emissions, domestic controls, wildfires, and climate, Atmos. Chem. Phys., 17, 2943–2970, https://doi.org/10.5194/acp-17-2943-2017, 2017.
Liu, S. C., Trainer, M., Fehsenfeld, F. C., Parrish, D. D., Williams, E. J., Fahey, D. W., Hubler, G., and Murphy, P. C.: Ozone production in the Rural Troposphere and the Implications for Regional and Global Ozone Distributions, J. Geophys. Res., 92, 4191–4207, 1987.
Moxim, W. J., Levy II, H., and Kasibhatla, P. S.: Simulated global tropospheric PAN: Its transport and impact on NOx, J. Geophys. Res., 101, 12621–12638, https://doi.org/10.1029/96jd00338, 1996.
Orbe, C., Waugh, D. W., Yang, H., Lamarque, J.-F., Tilmes, S., and Kinnison, D. E.: Tropospheric transport differences between models using the same large-scale meteorological fields, Geophys. Res. Lett., 44, 1068–1078, https://doi.org/10.1002/2016GL071339, 2007.
Pandey Deolal, S., Staehelin, J., Brunner, D., Cui, J., Steinbacher, M., Zellweger, C., Henne, S., and Vollmer, M. K.: Transport of PAN and NOy from different source regions to the Swiss high alpine site Jungfraujoch, Atmos. Environ., 64, 103–115, https://doi.org/10.1016/j.atmosenv.2012.08.021, 2013.
Pandey Deolal, S., Henne, S., Ries, L., Gilge, S., Weers, U., Steinbacher, M., Staehelin, J., and Peter, T.: Analysis of elevated springtime levels of Peroxyacetyl nitrate (PAN) at the high Alpine research sites Jungfraujoch and Zugspitze, Atmos. Chem. Phys., 14, 12553–12571, https://doi.org/10.5194/acp-14-12553-2014, 2014.
Payne, V. H., Alvarado, M. J., Cady-Pereira, K. E., Worden, J. R., Kulawik, S. S., and Fischer, E. V.: Satellite observations of peroxyacetyl nitrate from the Aura Tropospheric Emission Spectrometer, Atmos. Meas. Tech., 7, 3737–3749, https://doi.org/10.5194/amt-7-3737-2014, 2014.
Payne, V. H., Fischer, E. V., Worden, J. R., Jiang, Z., Zhu, L., Kurosu, T. P., and Kulawik, S. S.: Spatial variability in tropospheric peroxyacetyl nitrate in the tropics from infrared satellite observations in 2005 and 2006, Atmos. Chem. Phys., 17, 6341–6351, https://doi.org/10.5194/acp-17-6341-2017, 2017.
Penkett, S. A. and Brice, K. A.: The spring maximum in photo-oxidants in the Northern Hemisphere troposphere, Nature, 319, 655–657, 1986.
Roberts, J. M.: PAN and Related Compounds, in: Volatile Organic Compounds in the Atmosphere, edited by: Koppmann, R., Blackwell Publishing, 221–268, https://doi.org/10.1002/9780470988657.ch6, 2007.
Schmitt, R. and Volz-Thomas, A.: Climatology of Ozone, PAN, CO, and NMHC in the Free Troposphere Over the Southern North Atlantic, J. Atmos. Chem., 28, 245–262, https://doi.org/10.1023/A:1005801515531, 1997.
Schultz, M., Rast, S., van het Bolscher, M., Pulles, T., Brand, R., Pereira, J., Mota, B., Spessa, A., Dalsoren, S., van Noije, T., and Szopa, S.: Emission data sets and methodologies for estimating emissions, Hamburg, Max Planck Institute for Meteorology, 2007.
Schultz, M. G., Jacob, D. J., Wang, Y., Logan, J. A., Atlas, E. L., Blake, D. R., Blake, N. J., Bradshaw, J. D., Browell, E. G., Fenn, M. A., Flocke, F., Gregory, G. L., Heikes, B. G., Sachse, G. W., Sandholm, G. W., Shetter, R. E., Singh, H. B., and Talbot, R. W.: On the origin of tropospheric ozone and NOx over the tropical South Pacific, J. Geophys. Res., 104, 5829–5843, 1999.
Schultz, M. G., Heil, A., Hoelzemann, J. J., Spessa, A., Thonicke, K., Goldammer, J. G., Held, A. C., Pereira, J. M. C., and van het Bolscher, M.: Global wildland fire emissions from 1960 to 2000, Global Biogeochem. Cy., 22, GB2002, https://doi.org/10.1029/2007GB003031, 2008.
Schultz, M. G., Schröder, S., Lyapina, O., Cooper, O., Galbally, I., Petropavlovskikh, I., et al.: Tropospheric Ozone Assessment Report: Database and Metrics Data of Global Surface Ozone Observations, Elem. Sci. Anth., 5, 58, https://doi.org/10.1525/elementa.244, 2017.
Shindell, D. T., Chin, M., Dentener, F., Doherty, R. M., Faluvegi, G., Fiore, A. M., Hess, P., Koch, D. M., MacKenzie, I. A., Sanderson, M. G., Schultz, M. G., Schulz, M., Stevenson, D. S., Teich, H., Textor, C., Wild, O., Bergmann, D. J., Bey, I., Bian, H., Cuvelier, C., Duncan, B. N., Folberth, G., Horowitz, L. W., Jonson, J., Kaminski, J. W., Marmer, E., Park, R., Pringle, K. J., Schroeder, S., Szopa, S., Takemura, T., Zeng, G., Keating, T. J., and Zuber, A.: A multi-model assessment of pollution transport to the Arctic, Atmos. Chem. Phys., 8, 5353–5372, https://doi.org/10.5194/acp-8-5353-2008, 2008.
Singh, H. B.: Reactive nitrogen in the troposphere, Environ. Sci. Technol., 21, 320–327, 1987.
Singh, H. B. and Hanst, P. L.: Peroxyacetyl nitrate (PAN) in the unpolluted atmosphere: An important reservoir for nitrogen oxides, Geophys. Res. Lett., 8, 941–944, 1981.
Singh, H. B. and Salas, L. J.: Measurements of peroxyacetyl nitrate (pan) and peroxypropionyl nitrate (ppn) at selected urban, rural and remote sites, Atmos. Environ., 23, 231–238, https://doi.org/10.1016/0004-6981(89)90115-7, 1989.
Stevenson, D. S., Dentener, F. J., Schultz, M. G., Ellingsen, K., van Noije, T. P. C., Wild, O., Zeng, G., Amann, M., Atherton, C. S., Bell, N., Bergmann, D. J., Bey, I., Butler, T., Cofala, J., Collins, W. J., Derwent, R. G., Doherty, R. M., Drevet, J., Eskes, H. J., Fiore, A. M, Gauss, M., Hauglustaine, D. A., Horowitz, L. W., Isaksen, I. S. A, Krol, M. C., Lamarque, J.-F., Lawrence, M. G., Montanaro, V., Müller, J.-F., Pitari, G., Prather, M. J., Pyle, J. A., Rast, S., Rodriguez, J. M., Sanderson, M. G., Savage, N. H., Shindell, D. T., Strahan, S. E., Sudo, K., and Szopa, S.: Multimodel ensemble simulations of present-day and near-future tropospheric ozone, J. Geophys. Res., 111, D08301, https://doi.org/10.1029/2005JD006338, 2006.
Turnipseed, A. A., Huey, L. G., Nemitz, E., Stickel, R., Higgs, J., Tanner, D. J., Slusher, D. L., Sparks, J. P., Flocke, F., and Guenther, A.: Eddy covariance fluxes of peroxyacetyl nitrates (PANs) and NOy to a coniferous forest, J. Geophys. Res.-Atmos., 111, D09304, https://doi.org/10.1029/2005jd006631, 2006.
Val Martin, M., Honrath, R. E., Owen, R. C., and Lapina, K.: Large-scale impacts of anthropogenic pollution and boreal wildfires on the nitrogen oxide levels over the central North Atlantic region, J. Geophys. Res., 113, D17308, https://doi.org/10.1029/2007JD009689, 2008.
van der Werf, G. R., Randerson, J. T., Giglio, L., Collatz, G. J., Kasibhatla, P. S., and Arellano Jr., A. F.: Interannual variability in global biomass burning emissions from 1997 to 2004, Atmos. Chem. Phys., 6, 3423–3441, https://doi.org/10.5194/acp-6-3423-2006, 2006.
van der Werf, G. R., Randerson, J. T., Giglio, L., Collatz, G. J., Mu, M., Kasibhatla, P. S., Morton, D. C., DeFries, R. S., Jin, Y., and van Leeuwen, T. T.: Global fire emissions and the contribution of deforestation, savanna, forest, agricultural, and peat fires (1997–2009), Atmos. Chem. Phys., 10, 11707–11735, https://doi.org/10.5194/acp-10-11707-2010, 2010.
Volz-Thomas, A., Xueref, I., and Schmitt, R.: An automatic gas chromatograph and calibration system for ambient measurements of PAN and PPN, Environ. Sci. Pollut. R., 4, 72–76, 2002.
Wang, Y. and Jacob, D. J.: Anthropogenic forcing on tropospheric ozone and OH since preindustrial times, J. Geophys. Res., 103, 31123–131135, 1998.
Warneck, P. and Zerbach, T.: Synthesis of peroxyacetyl nitrate by acetone photolysis, Environ. Sci. Technol., 26, 74–79, 1992.
Weiss-Penzias, P., Jaffe, D. A., Jaeglé, L., and Liang, Q.: Influence of long-range-transported pollution on the annual and diurnal cycles of carbon monoxide and ozone at Cheeka Peak Observatory, J. Geophys. Res.-Atmos., 109, D23S14, https://doi.org/10.1029/2004JD004505, 2004.
Wild, O., Law, K., McKenna, D., Bandy, B., Penkett, S., and Pyle, J.: Photochemical trajectory modeling studies of the North Atlantic region during August 1993, J. Geophys. Res.-Atmos., 101, 29269–29288, 1996.
Wild, O., Fiore, A. M., Shindell, D. T., Doherty, R. M., Collins, W. J., Dentener, F. J., Schultz, M. G., Gong, S., MacKenzie, I. A., Zeng, G., Hess, P., Duncan, B. N., Bergmann, D. J., Szopa, S., Jonson, J. E., Keating, T. J., and Zuber, A.: Modelling future changes in surface ozone: a parameterized approach, Atmos. Chem. Phys., 12, 2037–2054, https://doi.org/10.5194/acp-12-2037-2012, 2012.
Wu, S., Duncan, B. N., Jacob, D. J., Fiore, A. M., and Wild, O.: Chemical nonlinearities in relating intercontinental ozone pollution to anthropogenic emissions, Geophys. Res. Lett., 36, L05806, https://doi.org/10.1029/2008gl036607, 2009.
Xue, L. K., Wang, T., Zhang, J. M., Zhang, X. C., Deliger, Poon, C. N., Ding, A. J., Zhou, X. H., Wu, W. S., Tang, J., Zhang, Q. Z., and Wang, W. X.: Source of surface ozone and reactive nitrogen speciation at Mount Waliguan in western China: New insights from the 2006 summer study, J. Geophys. Res., 116, D07306, https://doi.org/10.1029/2010JD014735, 2011.
Zellweger, C., Ammann, M., Buchmann, B., Hofer, P., Lugauer, M., Rüttimann, R., Streit, N., Weingartner, E., and Baltensperger, U.: Summertime NOy speciation at the Jungfraujoch, 3580 m asl, Switzerland, J. Geophys. Res., 105, 6655–6667, https://doi.org/10.1029/1999JD901126, 2000.
Zellweger, C., Forrer, J., Hofer, P., Nyeki, S., Schwarzenbach, B., Weingartner, E., Ammann, M., and Baltensperger, U.: Partitioning of reactive nitrogen (NOy) and dependence on meteorological conditions in the lower free troposphere, Atmos. Chem. Phys., 3, 779–796, https://doi.org/10.5194/acp-3-779-2003, 2003.
Zhang, L., Jacob, D. J., Boersma, K. F., Jaffe, D. A., Olson, J. R., Bowman, K. W., Worden, J. R., Thompson, A. M., Avery, M. A., Cohen, R. C., Dibb, J. E., Flock, F. M., Fuelberg, H. E., Huey, L. G., McMillan, W. W., Singh, H. B., and Weinheimer, A. J.: Transpacific transport of ozone pollution and the effect of recent Asian emission increases on air quality in North America: an integrated analysis using satellite, aircraft, ozonesonde, and surface observations, Atmos. Chem. Phys., 8, 6117–6136, https://doi.org/10.5194/acp-8-6117-2008, 2008.
Zhu, L., Fischer, E. V., Payne, V. H., Worden, J. R., and Jiang, Z.: TES observations of the interannual variability of PAN over Northern Eurasia and the relationship to springtime fires, Geophys. Res. Lett., 42, 7230–7237, https://doi.org/10.1002/2015GL065328, 2015.
Zhu, L., Payne, V. H., Walker, T. W., Worden, J. R., Jiang, Z., Kulawik, S. S., and Fischer, E. V.: PAN in the eastern Pacific free troposphere: A satellite view of the sources, seasonality, interannual variability, and timeline for trend detection, J. Geophys. Res.-Atmos., 122, 3614–3629, https://doi.org/10.1002/2016JD025868, 2017.
- Abstract
- Introduction
- Approach
- Modeled and measured lower tropospheric PAN at northern midlatitudes in April
- Exploring emergent constraints on model SRRs from measured total PAN
- Factors contributing to the inter-model range in PAN SRRs
- Linking PAN and O3 SRRs
- Conclusions and recommendations
- Data availability
- Author contributions
- Competing interests
- Special issue statement
- Acknowledgements
- References
- Supplement