the Creative Commons Attribution 4.0 License.
the Creative Commons Attribution 4.0 License.
 | 12 Oct 2018
Simulation of heterogeneous photooxidation of SO2 and NOx in the presence of Gobi Desert dust particles under ambient sunlight
Zechen Yu
To improve the simulation of the heterogeneous oxidation of SO2 and NOx in the presence of authentic mineral dust particles under ambient environmental conditions, the explicit kinetic mechanisms were constructed in the Atmospheric Mineral Aerosol Reaction (AMAR) model. The formation of sulfate and nitrate was divided into three phases: the gas phase, the non-dust aqueous phase, and the dust phase. In particular, AMAR established the mechanistic role of dust chemical characteristics (e.g., photoactivation, hygroscopicity, and buffering capacity) in heterogeneous chemistry. The photoactivation kinetic process of different dust particles was built into the model by measuring the photodegradation rate constant of an impregnated surrogate (malachite green dye) on a dust filter sample (e.g., Arizona test dust – ATD – and Gobi Desert dust – GDD) using an online reflective UV–visible spectrometer. The photoactivation parameters were integrated with the heterogeneous chemistry to predict the formation of reactive oxygen species on dust surfaces. A mathematical equation for the hygroscopicity of dust particles was also included in the AMAR model to process the multiphase partitioning of trace gases and in-particle chemistry. The buffering capacity of dust, which is related to the neutralization of dust alkaline carbonates with inorganic acids, was included in the model to dynamically predict the hygroscopicity of aged dust. The AMAR model simulated the formation of sulfate and nitrate using experimental data obtained in the presence of authentic mineral dust under ambient sunlight using a large outdoor smog chamber (University of Florida Atmospheric Photochemical Outdoor Reactor, UF-APHOR). Overall, the influence of GDD on the heterogeneous chemistry was much greater than that of ATD. Based on the model analysis, GDD enhanced the sulfate formation mainly via its high photoactivation capability. In the case of NO2 oxidation, dust-phase nitrate formation is mainly regulated by the buffering capacity of dust. The measured buffering capacity of GDD was 2 times greater than that of ATD, and consequently, the maximum nitrate concentration with GDD was nearly 2 times higher than that with ATD. The model also highlights that in urban areas with high NOx concentrations, hygroscopic nitrate salts quickly form via titration of the carbonates in the dust particles, but in the presence of SO2, the nitrate salts are gradually depleted by the formation of sulfate.
- Article
(2334 KB) - Full-text XML
-
Supplement
(978 KB) - BibTeX
- EndNote


Large quantities of mineral dust particles are frequently ejected into the atmosphere through wind action. Airborne mineral dust is a major contributor to atmospheric particulate matter, with an estimated annual emission of 1000–3000 Tg yr−1 (Textor et al., 2006; Tegen and Schepanski, 2009). Airborne dust is essential for radiation balance (Sokolik and Toon, 1996; Sokolik et al., 2001; Balkanski et al., 2007), cloud condensation nucleation (Krueger et al., 2003; Liu et al., 2008; Tang et al., 2016), oceanic metal-ion cycles (Jickells et al., 2005; Mahowald et al., 2005; Schulz et al., 2012), and visibility impairment (Kim et al., 2001; Camino et al., 2015).
The surface of mineral dust particles can act as an important sink for atmospheric trace gases, such as O3, NOx (e.g., NO and NO2), and SO2, and can enhance the production of oxygenated compounds (e.g., nitrate and sulfate) (Underwood et al., 2001; Michel et al., 2002; Usher et al., 2003b; Crowley et al., 2010; George et al., 2015; Tang et al., 2017). For example, 50 % to 70 % of the annual average total sulfate concentration is estimated to be formed by the heterogeneous oxidation of SO2 in the vicinity of dust sources (Dentener et al., 1996; Usher et al., 2003a). During a dust event (Beijing, China, on 28 March 2015), Wang et al. (2017) observed that the heterogeneous reactions on dust are the major production mechanisms for nitrate, 19 µg m−3, and sulfate, 7 µg m−3. Furthermore, airborne dust particles can carry the anthropogenic pollutants to downwind regions during long-range transport (Li and Shao, 2012; Valle-Diaz et al., 2016; Uno et al., 2017).
Several recent studies have shown significant increases in sulfate and nitrate concentrations due to the heterogeneous photooxidation of SO2 and NOx on mineral dust surfaces. For example, using a flow chamber, Dupart et al. (2014) observed that the NO2 uptake rate of Arizona test dust (ATD) particles was 4 times greater under UV-A irradiation than in the dark. A chamber study by Park and Jang (2016) also showed a significantly higher (10 times higher) SO2 reactive uptake coefficient on ATD under UV light (a mixture of UV-A and UV-B light) than that obtained in the dark. In another chamber study, Park et al. (2017) reported that the increase in the SO2 kinetic uptake coefficient of Gobi Desert dust (GDD) particles was higher than that observed for the ATD particles. Field observations by Ndour et al. (2009) and Dupart et al. (2012) showed that the uptake coefficients of trace gases (e.g., NO2 and SO2) on authentic dust particles increased under sunlight compared to those in the dark.
Despite numerous studies on the heterogeneous photooxidation of trace gases, the mechanism behind the in-particle chemistry remains largely unknown. One challenge is the modeling of the photocatalytic process of semiconductive metal oxides (e.g., TiO2 and Fe2O3) in dust particles. This photocatalytic process results in the formation of electron–hole pairs that can react with a water molecule or absorbed oxygen on the dust surface to form oxidant radicals (e.g., OH radicals and HO2 radicals) and oxidize trace gases on dust particles (Linsebigler et al., 1995; Hoffmann et al., 1995; Thompson and Yates, 2006; Cwiertny et al., 2008). Additionally, the hygroscopic property of mineral dust, which is dynamic due to the atmospheric process associated with the dust buffering capacity and inorganic composition, complicates the dust model. For example, Tang et al. (2015) reported decreased hygroscopic properties due to the formation of calcium sulfate via the reaction of calcium carbonate with sulfuric acid. Some inorganic salts in dust, such as magnesium sulfate and calcium nitrate, are hydrophilic and can be hydrated in low humidity environments (Liu et al., 2008; Beardsley et al., 2013; Abdelkader et al., 2017). The chemical properties of mineral dust can also be changed by carboxylic acids absorbed on dust particles, which further react with alkaline dust components (Mochizuki et al., 2016). Therefore, deriving a mathematical model to describe the hygroscopicity of dust particles is important for accurately processing both the multiphase partitioning of trace gases and the in-particle chemistry under ambient conditions.
In our recent modeling work (Yu et al., 2017), the heterogeneous oxidation of SO2 was simulated in the presence of ATD. However, ATD particles have chemical and physical properties that are different from those of ambient mineral dust particles. To simulate the heterogeneous chemistry of trace gases under ambient conditions, a model should include different authentic dusts with various surface areas, hygroscopic properties, photocatalytic capacities, and buffering abilities.
In this study, the Atmospheric Mineral Aerosol Reaction (AMAR) model highlights three aspects to accurately predict the heterogeneous photooxidation of SO2 and NOx: (1) the photocatalytic production of OH radicals, (2) the dynamic hygroscopicity of mineral dust, and (3) the buffering capacity determined by the dust compositions. For example, the kinetic mechanisms for the photoactivation processes of different dust particles (ATD and GDD) were established using the AMAR model based on laboratory data from the photodegradation of an impregnated dye (malachite green) on a dust filter sample. A mathematical model for dust particle hygroscopicity was also integrated into the model based on hygroscopicity data from Fourier transform infrared (FTIR) spectra of fresh and aged particles. The buffering capacity of dust particles was parameterized in the model by measuring the nitrate that formed via the photooxidation of NOx in the presence of dust particles (ATD or GDD) using an indoor chamber with different humidities (20 %, 55 %, and 80 %). The resulting AMAR model was then evaluated against chamber data obtained under ambient conditions using a large outdoor smog reactor at the University of Florida Atmospheric Photochemical Outdoor Reactor (UF-APHOR).
Table 1Outdoor chamber experimental conditions for NOx and SO2 oxidation in the presence of Gobi Desert dust (GDD) particles and Arizona test dust (ATD) particles.
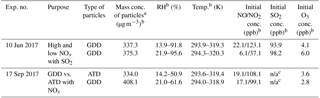
a The mass concentrations of GDD and ATD particles were calculated from the SMPS data combined with OPC data. The density of dust particles is 2.65 g cm−3 and the particle size distribution was calculated up to 3 µm. b The errors associated with NO, NO2, and O3 were ±12.5 %, ±6.9 %, and ±0.2 %, respectively. The error associated with dust mass was ±6 % based on SMPS and OPC data. The accuracies of the measurement of RH and temperature were ±5 % and ±0.5 K, respectively. c n/a: not applicable (no SO2 injection).
2.1 Sample preparation and characterization
The GDD particles were collected from the dust deposition region (Tsogt-Ovoo soum in the Ömnogövi Province, Mongolia) between March and May 2015. The collected sample was sieved to less than 20 µm. The ATD particles are a commercialized dust sample (size range: 0–3 µm) (Power Technology Inc. USA) from Arizona, USA. The particle size distributions of airborne dust particles were measured using both a scanning mobility particle sizer (SMPS; TSI 3080, USA) and an optical particle sizer (OPS; TSI 3330, USA). The measured SMPS and OPS data were merged using the Multi-Instrument Manager (MIM) 2.0 software (TSI, USA). An example of ATD and GDD particle distributions used in this study is shown in Fig. S1 in the Supplement. The concentrations of geometric surface area (cm2 cm−3) of airborne dust particles were calculated based on the particle size distribution. The Brunauer–Emmett–Teller (BET) surface areas, which were measured using the BET method and a NOVA 2200 instrument, of ATD and GDD were previously reported to be 47.4 and 39.6 m2 g−1, respectively (Park et al., 2017). The fractions of elements in the GDD and ATD samples were previously analyzed by Park et al. (2017) using energy dispersive spectroscopy.
2.2 Indoor and outdoor chamber experiments
The indoor and outdoor chamber operations have been previously reported (Yu et al., 2017; Park et al., 2017) (see Sect. S1 in the Supplement). To generate the model parameters for the heterogeneous oxidation of SO2, preexisting indoor chamber data were employed (Park and Jang, 2016). In this study, nitrate data were added to create the model parameters for NO2 oxidation. In the presence of different dust particles under various humidity levels (20 %, 55 % and 80 %), NO2 and SO2 were photo-oxidized using a 2 m3 indoor Teflon film chamber equipped with 16 UV lamps (wavelength range from 280 to 900 nm) (FS40T12/UVB, Solarc Systems Inc., Canada). The details on the experimental conditions for the NO2 oxidation are listed in Table S1 in the Supplement. The resulting AMAR model was tested against the outdoor chamber data produced using the UF-APHOR dual chambers ( m3) under ambient environmental conditions. The nitrate and sulfate ion concentrations were measured using a particle-into-liquid sampler (ADISO 2081, Applikon Inc., the Netherlands) coupled with ion chromatography (761 Compact IC, Metrohm Inc., USA) (PILS-IC). The details on the outdoor chamber data are listed in Table 1. The concentrations of NOx, SO2, and O3 were continuously measured using a chemiluminescence NO/NOx analyzer (Model T201, Teledyne, USA), a fluorescence Total Reduced Sulfur analyzer (Model 102E, Teledyne, USA), and a photometric ozone analyzer (Model 400E, Teledyne, USA), respectively.
2.3 Measurement of the dust particle photoactivation parameters
To parameterize the photoactivation capability of dust particles, a dust filter sample impregnated with a dye (malachite green) was photochemically irradiated using a specifically fabricated flow chamber equipped with a UV lamp (11SC-2.12; Pen-Ray., UK) coupled to a cutoff lens ( nm wavelength, 20CGA-280; Newport, USA) (Fig. S2). The dry dust particles were introduced into the indoor chamber by passing clean air through a nebulizer (Pari LC star, Starnberg, Germany). The dust particles were then collected on a Teflon-coated, glass-fiber filter (Emfab TX40 HI20 WW; Pallflex Corp., Putnam, CT, USA) to obtain 200 µg of dust particles per filter. This filter sample was then impregnated with 4 µg of malachite green dye dissolved in ethanol. Afshar et al. (2011) reported that malachite green dye decays in the presence of metal oxides under UV light. The dye-impregnated dust filter sample was placed in a UV flow chamber to activate the heterogeneous photodegradation of the dye on the dust particles. The humidity inside the flow chamber was controlled by manipulating the air flow (∼0.5 L min−1) and passing clean, dry air through a water bubbler. The degradation of the dye impregnated on the dust sample was then measured using a reflective UV–visible spectrophotometer (Jaz Spectrometer; Ocean Optics Inc., USA). Figure S3 shows an example of measured light absorbance of dye impregnated dust filter before and after irradiation using UV light. The degradation of dye was only significant in the presence of dust particles.
2.4 Hygroscopic properties of dust particles
The hygroscopic properties of the fresh and aged dust particles were determined using an FTIR spectrometer (Nicolet Magma 560, Madison, WI, USA) combined with a specifically fabricated optical flow chamber (Zhong and Jang, 2014; Jang et al., 2010; Beardsley et al., 2013; Park et al., 2017) that could control the humidity level in the range from 10 % to 80 %. The dust particles were impacted onto a silicon FTIR window (13×2 mm; Sigma–Aldrich, St. Louis, MO, USA) and weighed using an analytical balance (MX5; Mettler-Toledo Ltd., England). The FTIR peak at 1650 cm−1 was used to determine the water content of the particles. To calibrate the water content in the dust particles, (NH4)2SO4 particles were used, and the calibration was based on the particle mass and water content estimated using an inorganic thermodynamic model (E-AIM II) (Clegg et al., 1998; Wexler and Clegg, 2002; Clegg and Wexler, 2011).
3.1 Description of the AMAR model
The AMAR model was developed to predict the heterogeneous oxidation of SO2 and/or NOx in the presence of authentic mineral dust particles. As described in previous work (Yu et al., 2017), the formation of mass concentrations of sulfate ([], µg m−3) and nitrate ([], µg m−3) is processed in three phases: the gas phase, the inorganic salt-seeded aqueous phase, and the dust phase. The key components of the model consist of multiphase trace gases' partitioning and the kinetic mechanisms of the three phases. Under ambient conditions (RH higher than 20 %), studies showed that the water content in dust particles ranged 2–4 monolayers based on the BET surface area (Gustafsson et al., 2005; Yu et al., 2017). Therefore, we assume that the gas–dust partitioning of trace gases is governed by the absorption process. The partitioning coefficients of these gases can be calculated using Henry's law constant (KH), and the coefficients are influenced by the dust-phase water content. The oxidation of SO2 and NOx in the gas phase and inorganic salt-seeded aqueous phase was simulated using the mechanisms previously reported in the literature (Liang and Jacobson, 1999; Binkowski and Roselle, 2003; Byun and Schere, 2006; Sarwar et al., 2013, 2014; Yu et al., 2017). Dust-phase sulfuric acid partially or fully reacts with indigenous alkaline salt or the gaseous ammonia originating from the chamber wall (Li et al., 2015; Beardsley and Jang, 2016). The reactive uptake coefficient (γ) of SO2 or NO2 on dust in this study is dynamically changing due to the change of sunlight intensity and relative humidity. The calculation of γ is explained in Sect. S2 and an example of γ for GDD particles is shown in Fig. S4.
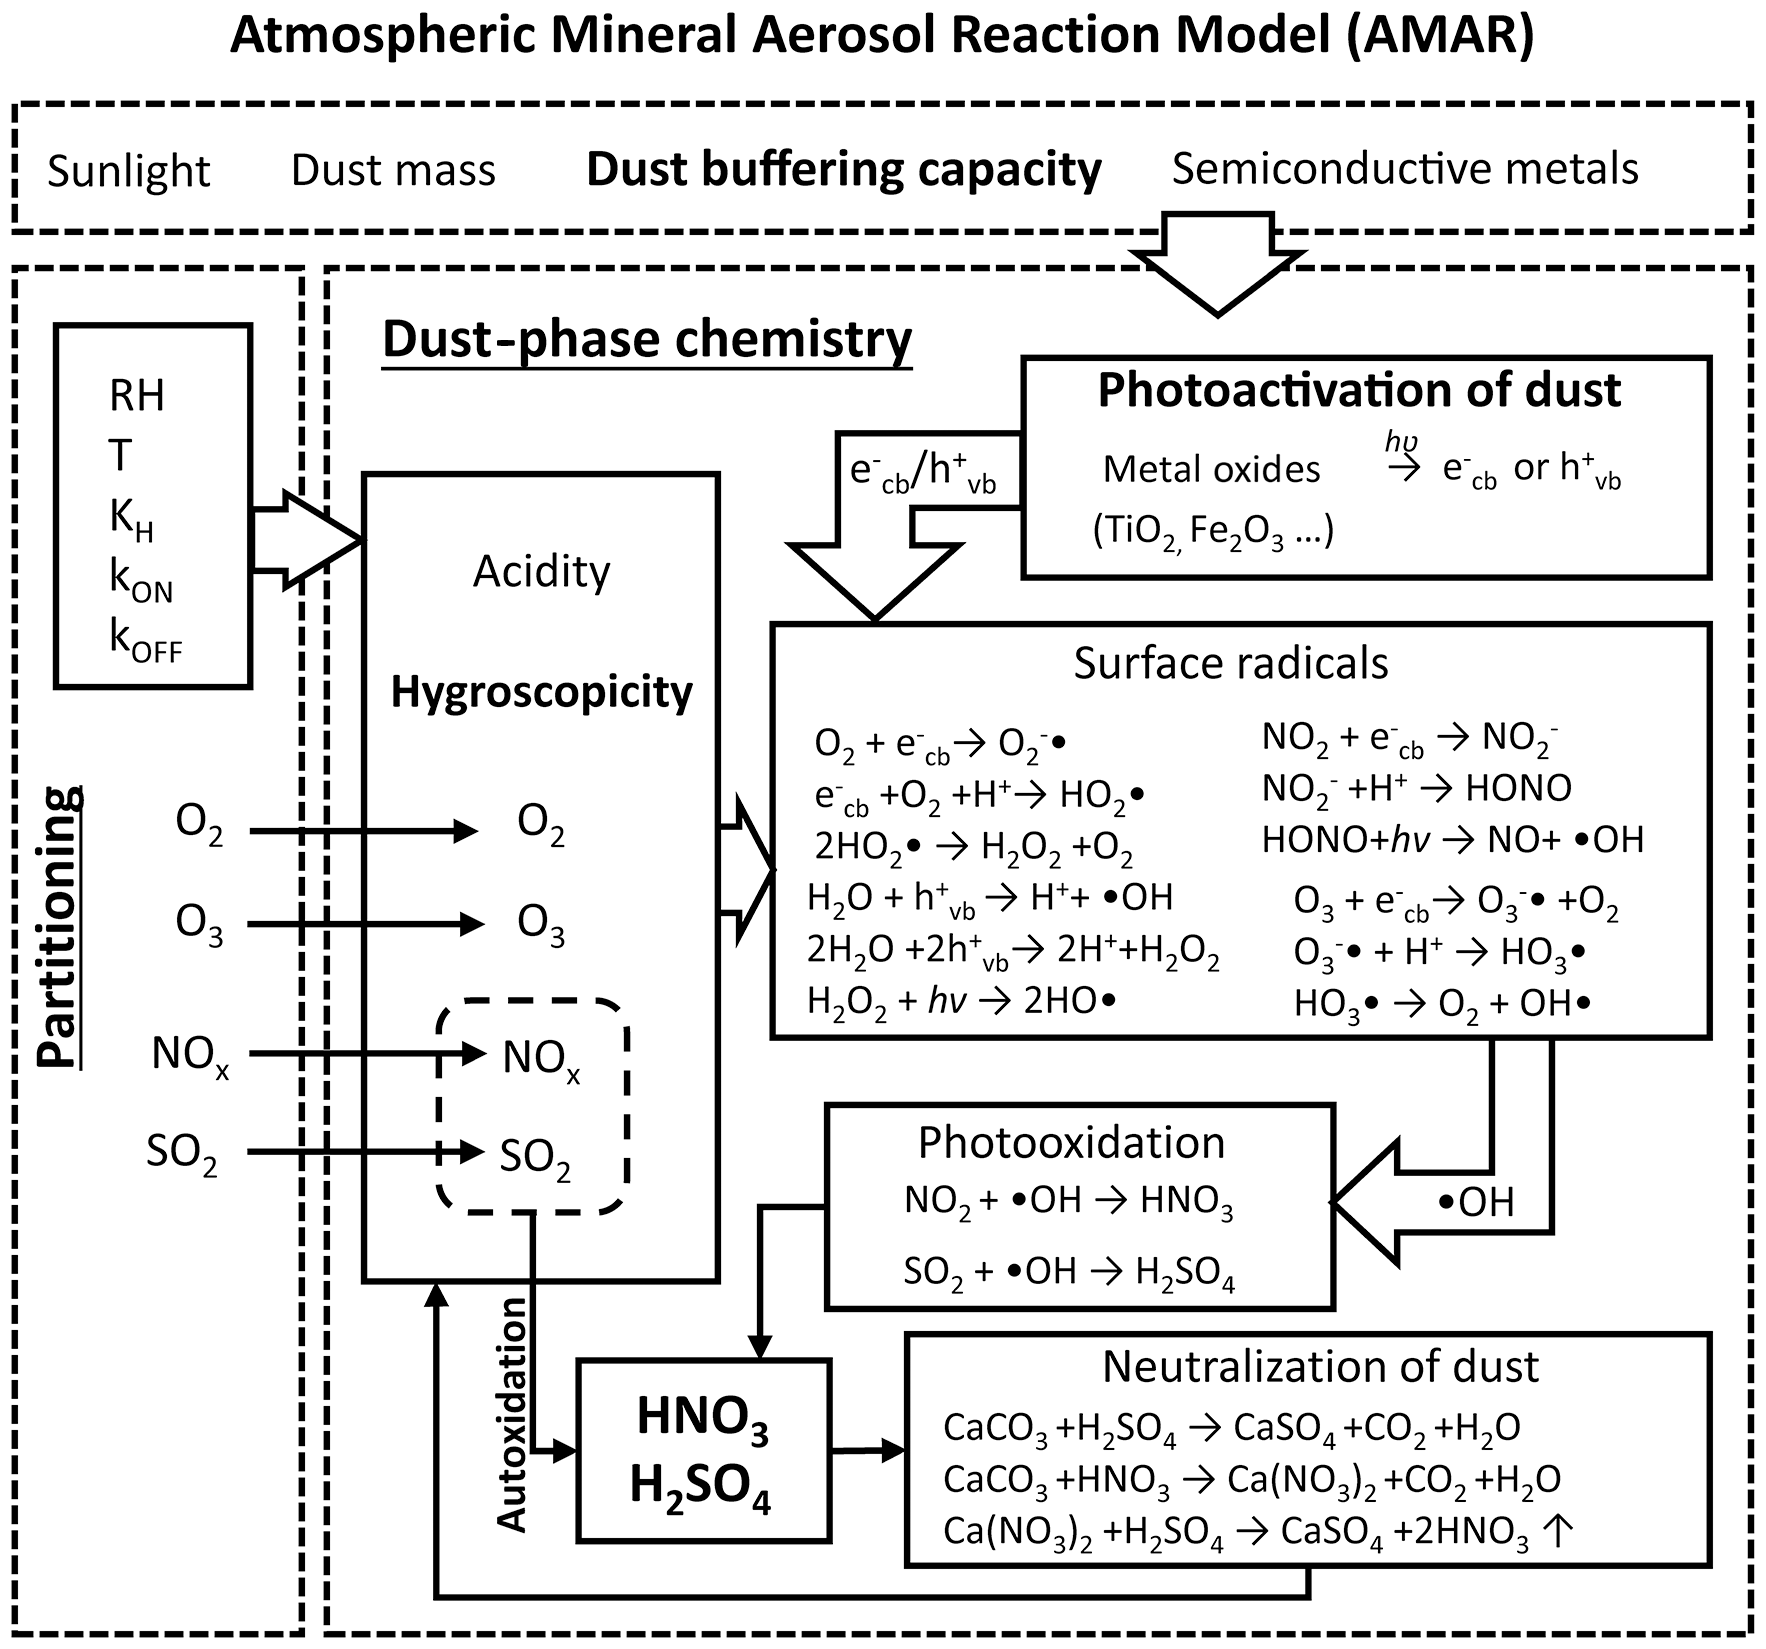
An overall schematic of the dust-phase chemistry mechanism in the AMAR model is shown in Fig. 1 (see also Table S2). To accurately process the heterogeneous oxidation of SO2 and NOx under ambient conditions, we emphasized the three key processes in dust-phase chemistry.
A mathematical model for dust particle hygroscopicity was derived to dynamically simulate the dust-phase water content as a function of dust aging, e.g., the neutralization of alkaline carbonates and inorganic components containing ammonia, sulfate, and nitrate. This hygroscopic model improved the multiphase gas–dust partitioning and in-particle chemistry (Sect. 3.2).
Kinetic mechanisms to simulate the photoactivation of dust particles and the formation of dust-phase OH radicals were included in the AMAR. Specifically, we standardized the technique to parameterize the photoactivation capability of various dust particles (Sects. 2.3 and 3.3).
The neutralization mechanisms for dust particles with inorganic acids were systematically approached using the buffering capacity parameter. This process is linked to the hygroscopicity of dust particles (Sect. 3.4).
3.2 Dust-phase water content
Under dry conditions (RH < 20 %), the water content on the dust surface is less than a monolayer (Ibrahim et al., 2018) and it may compete with trace gases for adsorption cites (a Langmuir-like adsorption). However, authentic dust particles which contain inorganic salts and metal oxides can absorb a significant number of water molecules under ambient RH (>20 %) via a thermodynamic equilibrium process and form a multilayer of water. Further, the modification of dust surfaces by forming alkali nitrates can greatly increase dust hygroscopicity and furthermore enhance the heterogeneous reactions (Vlasenko et al., 2006; Pradhan et al., 2010; Yang et al., 2017). For example, a higher water content enhances the multiphase partitioning of trace gases and the production of oxidized products (HONO, sulfate, and nitrate). In the AMAR model, an equation for the dust-phase water content (Fwater, µg µg−1), which is defined as the water mass normalized by the dry dust mass, is mathematically derived for RH between 20 % and 80 %. Fwater is estimated by an additive function with three parts:
where RH represents the relative humidity and ranges from 0.2 to 0.8. The first term, , in Eq. (1) is associated with the water content of fresh dust particles. The second term, , represents the hygroscopicity of the hydrophilic nitrate salts that are formed via titration of the dust constituents (e.g., alkaline carbonates and some metal oxides). The third term, , originates from the ammonium sulfate system and is estimated via the inorganic thermodynamic model E-AIM II (Clegg et al., 1998; Wexler and Clegg, 2002; Clegg and Wexler, 2011). Coefficients a (0.03±0.01), b (3.6±0.5), c (1.4±0.4), and d (4.0±0.4) are dimensionless, and they were determined using FTIR data (Fig. 2).
To determine the coefficients a and b, the hygroscopicity of fresh ATD particles or fresh GDD particles was measured using an FTIR spectrometer for RH levels from 10 % to 80 %. Similarly, the coefficients c and d were obtained from the FTIR spectra of aged dust particles, e.g., NO2 photooxidation in the presence of ATD particles or GDD particles. The nitrate concentrations (µg µg−1 in dust mass) were measured using PILS-IC and were 0.001 (approximately negligible) for fresh ATD and 0.011 for aged ATD. The nitrate concentrations were 0.007 for fresh authentic GDD and 0.02 for aged GDD. Figure 2 shows the Fwater values for ATD and GDD particles with and without aging. For both the fresh and aged dust particles, the Fwater value gradually increases in the dry region (RH < 40 %) but rapidly increases for RH values greater than 40 %. The Fwater value of fresh GDD is higher than that of ATD for the entire RH range due to the presence of more hydrophilic nitrate salts. Assuming that the Fwater value from the second term has a linear relationship with the nitrate content, the Fwater value associated with nitrate salts can be estimated. Figure 2b shows that when the nitrate-associated Fwater is excluded, the Fwater value of fresh GDD (e.g., the hygroscopicity solely originating from dust constituents other than nitrates) is similar to that of ATD. The difference in model parameters for hygroscopicity between ATD and GDD is insignificant. For dust aged via the photooxidation of NO2, the GDD particles are more hygroscopic than the ATD particles. Overall, clear phase transitions and obvious differences between the hydration and dehydration processes were not observed for either type of dust particle. This trend suggests that the hygroscopicity of dust particles is caused by a variety of chemical species.
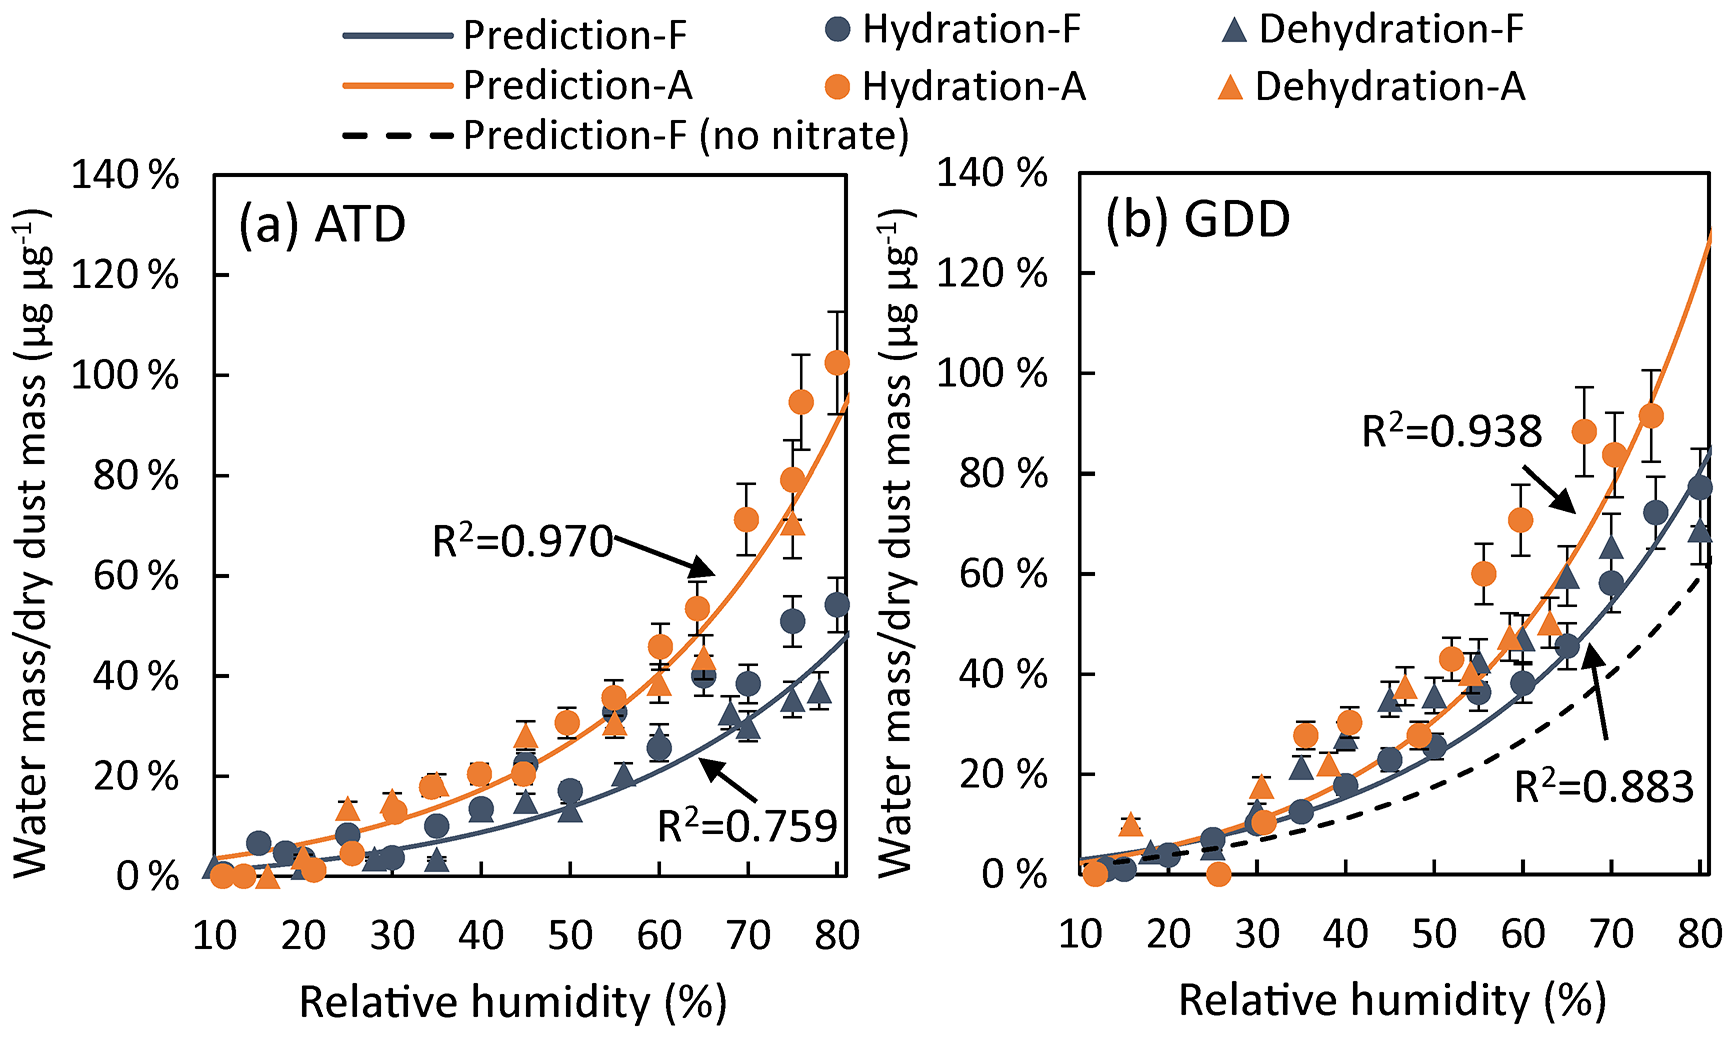
Figure 2The fraction of water mass relative to the dry dust mass for fresh and photochemically aged (a) ATD and (b) GDD particles as a function of the relative humidity from 10 % to 85 %. “F” and “A” represent the fresh and aged dust particles, respectively. The water content for fresh GDD with theoretically no indigenous nitrate is also predicted and shown. The aged dust samples were collected from dust particles that were photochemically aged in the presence of NOx. The estimated nitrate concentrations for fresh and aged ATD are 0.001 and 0.011 µg µg−1, respectively. The estimated nitrate concentrations for fresh and aged GDD are 0.007 and 0.02 µg µg−1, respectively. The error bars were estimated from the uncertainties in the FTIR absorbance measurements of the O–H band.
3.3 ATD and GDD photoactivation parameters
Mineral dust plays a key mechanistic role as a photocatalyst to accelerate the oxidation of trace gases in the dust phase. The photoactivation of semiconducting metal oxides (M*) in dust particles can yield an electron–hole pair () that further reacts with water or oxygen molecules to form oxidizing radicals, such as OH radicals (Linsebigler et al., 1995; Hoffmann et al., 1995; Thompson and Yates, 2006; Cwiertny et al., 2008; Yu et al., 2017).
where e_h is an pair and is the operational photoactivation rate constant of dust particles. The production rate of the pair is described as
where [M*]dust is the concentration (molecules cm−2) of M* on the dust surface (calculated based on geometric surface area). In our recent study (Yu et al., 2017), was linked to the wave-dependent, mass-absorbance cross section and quantum yield of a given dust particle (ATD) (Fig. S5). However, the type and quantity of conductive constituents in authentic dust particles vary. Hence, to extend the model to ambient conditions, the photoactivation of different dust particles and their kinetic mechanisms must be scaled.
In this study, we determined the relative photoactivation rate constant for different dust particles using colorimetry integrated with a fabricated photochemical flow reactor (also see Sect. 2.3). The impregnated dye (malachite green) on the dust surface was photodegraded by the oxidants created by the dust particles. The relative degradation rate constant of the dyed filter was measured using an online reflective UV–visible spectrometer to scale the photoactivation of the dust. The kinetic mechanisms for the reactions of the dye with radicals are expressed as follows:
where krecom is the rate constant of the recombination reaction of an electron with a hole. The concentration of the dye on the dust surface was assumed to be significantly higher than that of the surface OH radicals and much lower than that of the water content or oxygen molecules on dust. The concentration unit (molecules cm−2) of the chemical species in Reaction R1–R5 was multiplied by the surface area concentration of the dust particles (Adust, cm2 cm−3) to convert the value to the concentration unit in air (molecules cm−3). By combining Reactions R1–R5, the kinetic reaction rates for the pairs, OH radicals, and dye can be written as
The concentration of chemicals with the subscript “air” is the concentration in air (molecules cm−3). Under the assumption of a steady state for the net reaction rate of an pair and OH radicals, the dye consumption rate can be written as
where krecom is much larger than or in Eq. (6). A previous study by Khorasani et al. (2014) also reported a recombination rate (∼104 s−1) for an pair on silicon that is much faster than the rate observed for typical in-particle reactions. Therefore, the term ( in Eq. (6) is much larger than 1. [O2]dust is calculated through the partitioning process as follows:
where [O2]gas is the concentration of oxygen in the air and Kp is the partitioning coefficient for O2 on the dust-phase water layer. By applying Eq. (7) to Eq. (6), the analytical solution for Eq. (6) can be written as
As shown in Eq. (8), the dye decomposition on the particle surface is proportional to [M*], which changes based on the dust type, and the dust-phase water concentration, which can be estimated using Fwater and changes with the dust composition. Figure 3 shows the dye degradation rate in the presence of ATD or GDD particles, and the rate was measured using a UV flow chamber (Sect. 2.3). The [M*] value, which leverages the photoactivation ability of dust particles, is included in Fig. 3. The [M*] value of GDD is 2.5±0.7 times higher than that of ATD. This difference in dust's photoactivation ability can be explained by the dissimilarity in their elemental compositions. As seen in the previous study by Park et al. (2017), the elemental fraction of conductive metals such as iron and tritium appeared to be higher with the GDD of this study than reference ATD. The correlation between the metal compositions and photoactivation ability of dust particles needs to be explored in future. Additionally, the estimated photoactivation parameters of both GDD and ATD particles increase with increasing humidity, suggesting the importance of the role of water molecules in heterogeneous oxidation reactions.
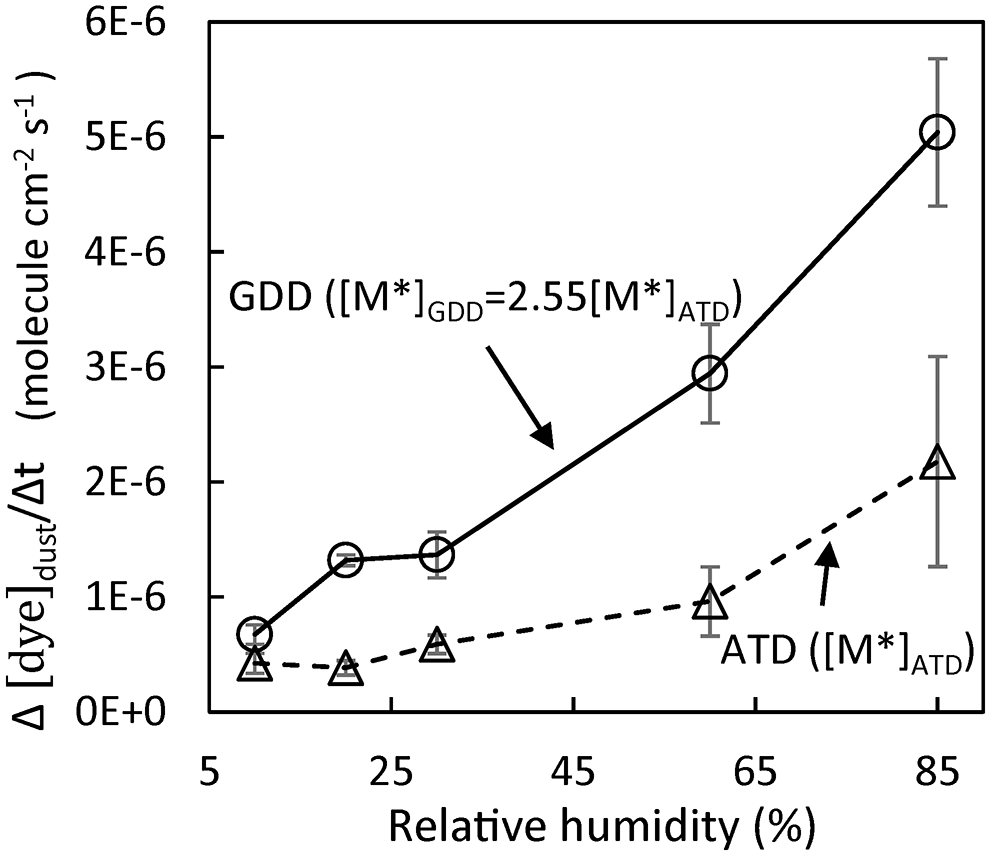
Figure 3The dye degradation rate in the presence of ATD or GDD particles measured using a UV flow chamber under RH levels ranging from 10 % to 85 %. As a control, the photodegradation of malachite green in the absence of dust was measured, but the degradation was negligible. The error bars represent the standard deviations.
3.4 Impact of the dust buffering capacity
The buffering capacity is determined by the neutralization of the dust-phase constituents (e.g., alkaline carbonates and some metal oxides) with inorganic acids. For example, alkaline carbonates in dust particles can react with nitric acid or sulfuric acid to form alkaline salts.
In contrast to nitrate, sulfate can accumulate at levels beyond the neutralization capacity of dust because sulfuric acid is not volatile in ambient humidity levels. Furthermore, sulfuric acid can deplete the nitrate salts that build up in the dust phase via the following reaction.
The buffering capacity determines the maximum nitrate concentration that can build up on dust particles. Nitrate ions are hydrophilic and significantly influence the hygroscopicity of dust particles (Fwater in Sect. 3.2). The buffering capacity was incorporated into the kinetic mechanisms in the AMAR model to dynamically modulate the Fwater value.
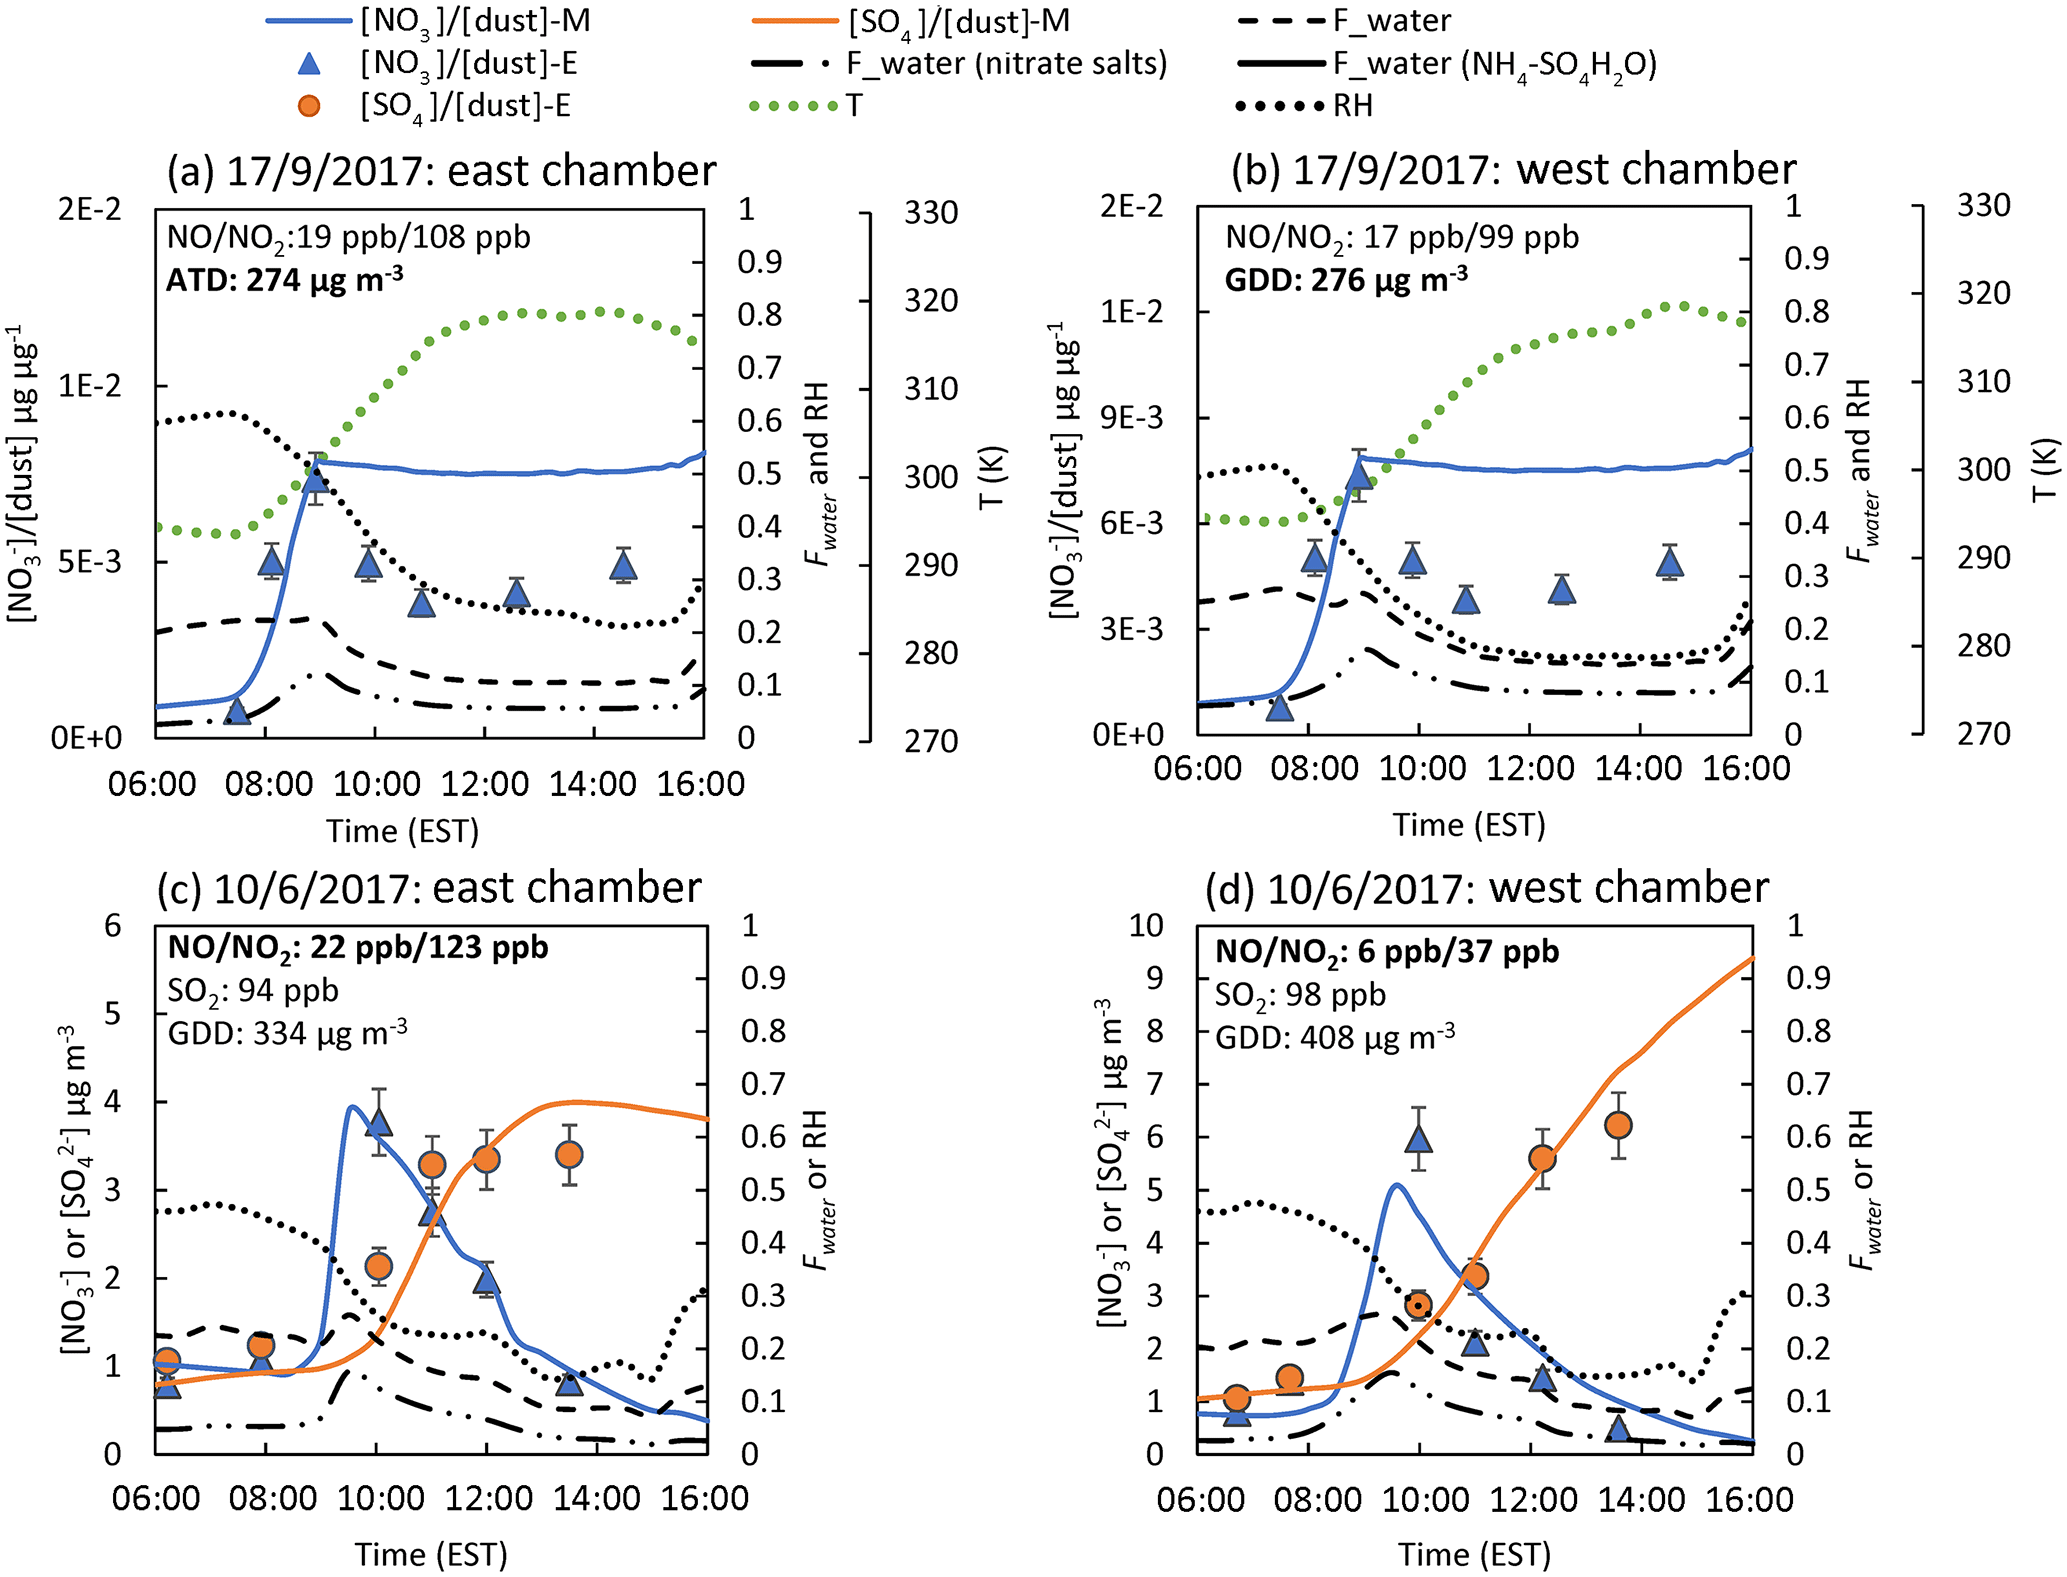
Figure 4Simulation of the outdoor chamber data using the AMAR model for (a) ATD (17 September 2017) and (b) GDD (17 September 2017) particles in the presence of NOx and SO2 oxidation on GDD particles in the presence of (c) high NOx (10 June 2017) and (d) low NOx (10 June 2017) concentrations. Fwater (nitrate salts) and Fwater () are the second and third terms in Eq. (1) and represent the additional absorbed water by alkaline nitrate salts and the ammonium sulfate system, respectively. The simulation result was not correct for particle loss.
The buffering capacities of two different mineral dusts (ATD and GDD) were semi-empirically determined by fitting the nitrate prediction to the experimental data shown in Fig. S6 (experimental conditions in Table S1) using the kinetic mechanisms (Reaction R7 and gas–particle nitric acid partitioning) in the AMAR model. The buffering capacity was determined using the maximum nitrate salt mass normalized by the dust mass (Sect. 2.1). The measured buffering capacities of ATD and GDD are 0.011 and 0.020 µg µg−1, respectively. The difference in buffering capacity between GDD and ATD originates from the content of alkaline carbonates and partially metal oxides. The element analysis measured by Park et al. (2017) showed that GDD contained the greater amount of alkaline metals (e.g., K, Ca, Na, and Mg) and transition metals (e.g., Fe and Ti) than ATD. However, the reaction generally occurs on the surface of dust rather than the whole body of dust due to its solidity and tortuosity. Thus, the actual buffering capacity of dust is much smaller than the total amount of alkaline carbonates and metal oxides in bulk dust.
3.5 Simulation of outdoor chamber data using the AMAR model
The resulting AMAR model was tested against the outdoor chamber data obtained from simulating the oxidation of NOx (Fig. 4a and b) or SO2/NOx (Fig. 4c and d) in the presence of mineral dust particles under ambient sunlight for 10 h. As shown in Fig. 4a and b, nitrate rapidly formed in the morning, and the model modeled the chamber data well. Additionally, the nitrate mass normalized by the dust mass was higher for GDD than ATD. In addition, nitrate depletion was observed (Fig. 4a and b), even in the absence of SO2. The nitrate depletion in the chamber data is possibly due to the nitrate salts reacting with the carboxylic acids present in the chamber air, but the current model cannot model this reaction. As shown in Fig. 4c and d, the model predicts the sulfate and nitrate concentrations produced from SO2 oxidation at two different NOx levels in the presence of GDD particles well. The oxidation of SO2 was suppressed when the NOx concentration was high because SO2 competes with NO2 to react with the OH radicals that form on dust surfaces. In the presence of SO2, the model reasonably predicts the nitrate profile and shows that the nitrate quickly builds up in the morning and is significantly depleted by the formed sulfate. The time profile of SO2, NOx, ozone, and dust particle concentrations are simulated in Fig. S7.
Figure 4 illustrates the predicted Fwater values with aging. The Fwater value is mainly influence by the humidity, which is high in the morning and gradually decreases as the temperature increases. However, the value is also modulated by the mineral dust particle aging process. For example, although the humidity level decreases between 08:00 and 10:00 LT, the Fwater value noticeably increases and coincides with the hygroscopic nitrate concentration time profile. The Fwater value is significantly lower in the presence of SO2 (Fig. 4d) than its absence (Fig. 4b) because the sulfate salts on dust particles and sulfates with ammonium ions (e.g., more titrated than ammonium hydrogen sulfate) are less hygroscopic than nitrate salts.

Figure 5Sensitivity of the model nitrate prediction to the (a) relative humidity at 20 %, 55 %, and 80 %; (b) temperature at 273, 293, and 313 K; (c) ATD vs. GDD particles; (d) concentration of GDD at 100, 200, and 400 µg m−3; and (e) sunlight profile on 23 November 2017 vs. 10 June 2017. The fraction of the HNO3 sources formed from the gas-phase reaction and dust-phase heterogeneous reaction to the total HNO3 is shown in (f). The simulation was conducted with 100 µg m−3 of initial GDD particles, 40 ppb of initial NOx (), 2 ppb of initial O3, and 10 ppb of isoprene under ambient environmental conditions on 23 November 2017. The simulation was performed without considering particle loss.
3.6 Model sensitivity
The sensitivity of the model predictions for nitrate (Fig. 5) and sulfate (Fig. 6) to the major input variables (e.g., relative humidity, temperature, sunlight intensity, dust mass concentration, and NOx concentration) was evaluated. The sensitivity test was mainly performed for GDD particles (100 µg m−3) under the environmental conditions at Gainesville, Florida, on 23 November 2017. The nitrate and sulfate mass concentrations in Figs. 5 and 6, respectively, are normalized with the dust mass.
As shown in Figs. 5a and 6a, the formation of both nitrate and sulfate is significantly sensitive to the RH level, but the reasons for this sensitivity are different. There was a sudden increase in the nitrate concentration between a low RH (20 % and 55 %) and a high RH (80 %), imitating the Fwater trend. In addition to the nitrate salt formation, which is influenced by the buffering capacity, the partitioning of hydrophilic nitric acid into the water layer increases at a higher RH. Unlike nitrate, the sulfate concentration gradually increases as the RH increases. The Fwater value of the sulfate salts (Fig. 6a) is relatively smaller than that of the nitrate salts (Fig. 5a). Additionally, nitrate formation is more sensitive to temperature than sulfate formation due to the nitric acid partitioning process. For the different dust types (ATD vs. GDD), the formation of nitrate (Fig. 5c) and sulfate (Fig. 6c) is higher with GDD. As discussed in Sect. 3.4, the maximum amount of nitrate salts in the dust phase is determined by the buffering capacity of the dust particles. The buffering capacity of GDD is 2 times higher than that of ATD (e.g., 0.011 µg µg−1 for ATD and 0.020 µg µg−1 for GDD), and thus, the nitrate concentration in the GDD system is nearly 2 times higher than that in the ATD system. Another reason for the high sulfate formation in the presence of GDD is the photoactivation ability of GDD. An in-depth explanation will be presented in Sect. 4. The sunlight intensity has more of an impact on sulfate formation than nitrate formation, as seen in Figs. 5e and 6d. Although nitrate formation is accelerated by strong sunlight, the nitrate production under the different sunlight intensities is governed by the buffering capacity of a given dust type (e.g., GDD).
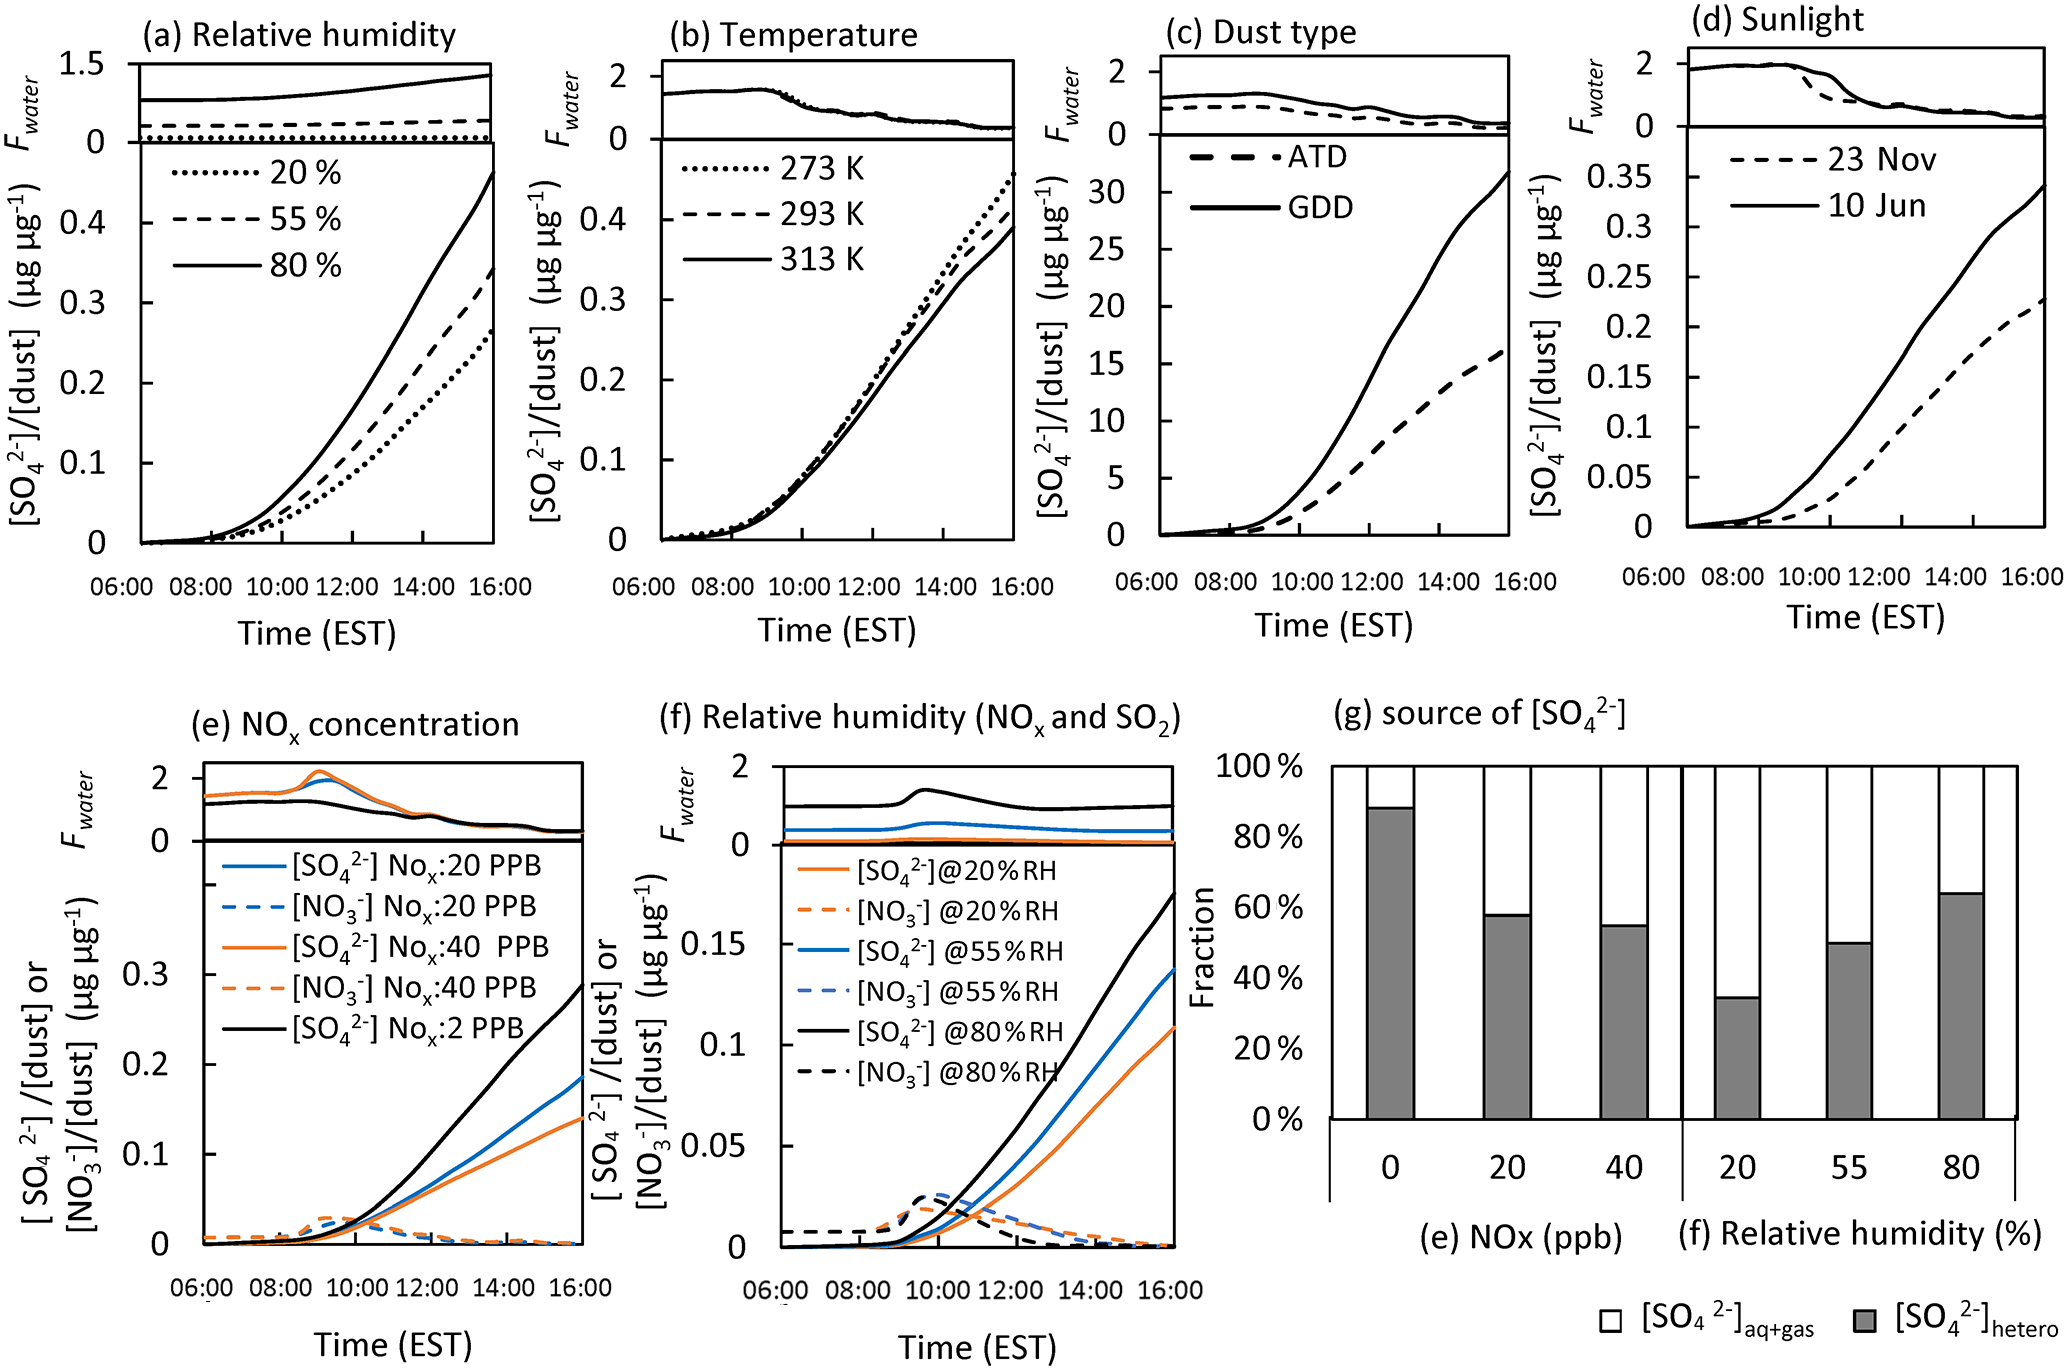
Figure 6Sensitivity of the model predicted sulfate concentration to the (a) relative humidity at 20 %, 55 %, and 80 %; (b) temperature at 273, 293, and 313 K; (c) dust type (ATD vs. GDD); (d) sunlight profile (23 November 2017 vs. 10 June 2017); (e) initial concentration of NOx (2, 20, and 40 ppb); and (f) relative humidity (20 %, 55 %, and 80 %) in the presence of 20 ppb of NOx. The fraction of sulfate from the gas phase and non-dust aqueous phase ([]aq+gas) and the heterogeneously formed sulfate in the dust phase ([]hetero) relative to the total sulfate is shown in (g). The dust-phase nitrate and water content were also predicted. For the sensitivity test, the simulation was conducted with 100 µg m−3 of initial GDD particles, 40 ppb of initial SO2, 2 ppb of initial O3, and 10 ppb of isoprene under ambient environmental conditions on 23 November 2017. The simulation was performed without considering particle loss.
Figure 6e shows the sulfate formation sensitivity to three levels of NOx (2, 20, and 40 ppb NOx) under ambient conditions (e.g., sunlight, temperature, and humidity). In the presence of NOx (40 ppb), the sulfate formation sensitivity to three different RH levels (20 %, 55 %, and 80 %) was tested, as shown in Fig. 6f. In general, sulfate is suppressed by increasing NOx concentrations (Fig. 6e). Similar to the effects of humidity on nitrate production at a low NOx level (Fig. 6a), the nitrate formation with a higher NOx concentration (40 ppb) is also enhanced by a higher RH level, as seen in Fig. 6f. Additionally, Fig. 6g shows how the total sulfate can be attributed to sulfate originating from the reactions in the different phases: (1) the sulfate from the gas phase and inorganic salt-seeded aqueous phase and (2) the sulfate from the dust phase. Dust-phase sulfate formation is suppressed by NOx due to competition between the absorbed SO2 and NO2 for surface OH radicals, while sulfate formation in the inorganic salt-seeded aqueous phase is promoted by NOx. When the % RH increases from 20 to 80, the heterogeneous reaction is significantly promoted due to the large Fwater value that enhances both the partitioning process and the production of OH radicals on dust surfaces.
To characterize the impact of dust characteristics on sulfate formation, the heterogeneous oxidation of SO2 in the presence of five different dust types, including ATD, GDD, and three artificially formulated dusts (Dust I–III), was compared. As shown in Fig. 7, the three characteristic parameters of the dust particles, including the photoactivation capability ([M*]dust in Eq. 2), buffering capacity (Sect. 3.4), and hygroscopicity (Fwater in Sect. 3.2), were scaled relative to the ATD particles. The relative values of the three parameters for GDD were obtained using laboratory data. The simulation with three artificially formulated samples, Dust I–III, was used to analyze why GDD particles have a larger influence on sulfate formation than ATD and which dust characteristic parameters are the most important for sulfate formation. Figure 7 illustrates that the photoactivation ability of dust ([M*]dust) is the most important among the three parameters. For example, the sulfate formation noticeably increased between ATD and Dust I. When the three characteristic dust parameters are determined by laboratory studies, in the future, the model will be able to simulate the impact of authentic dust particles on sulfate formation.
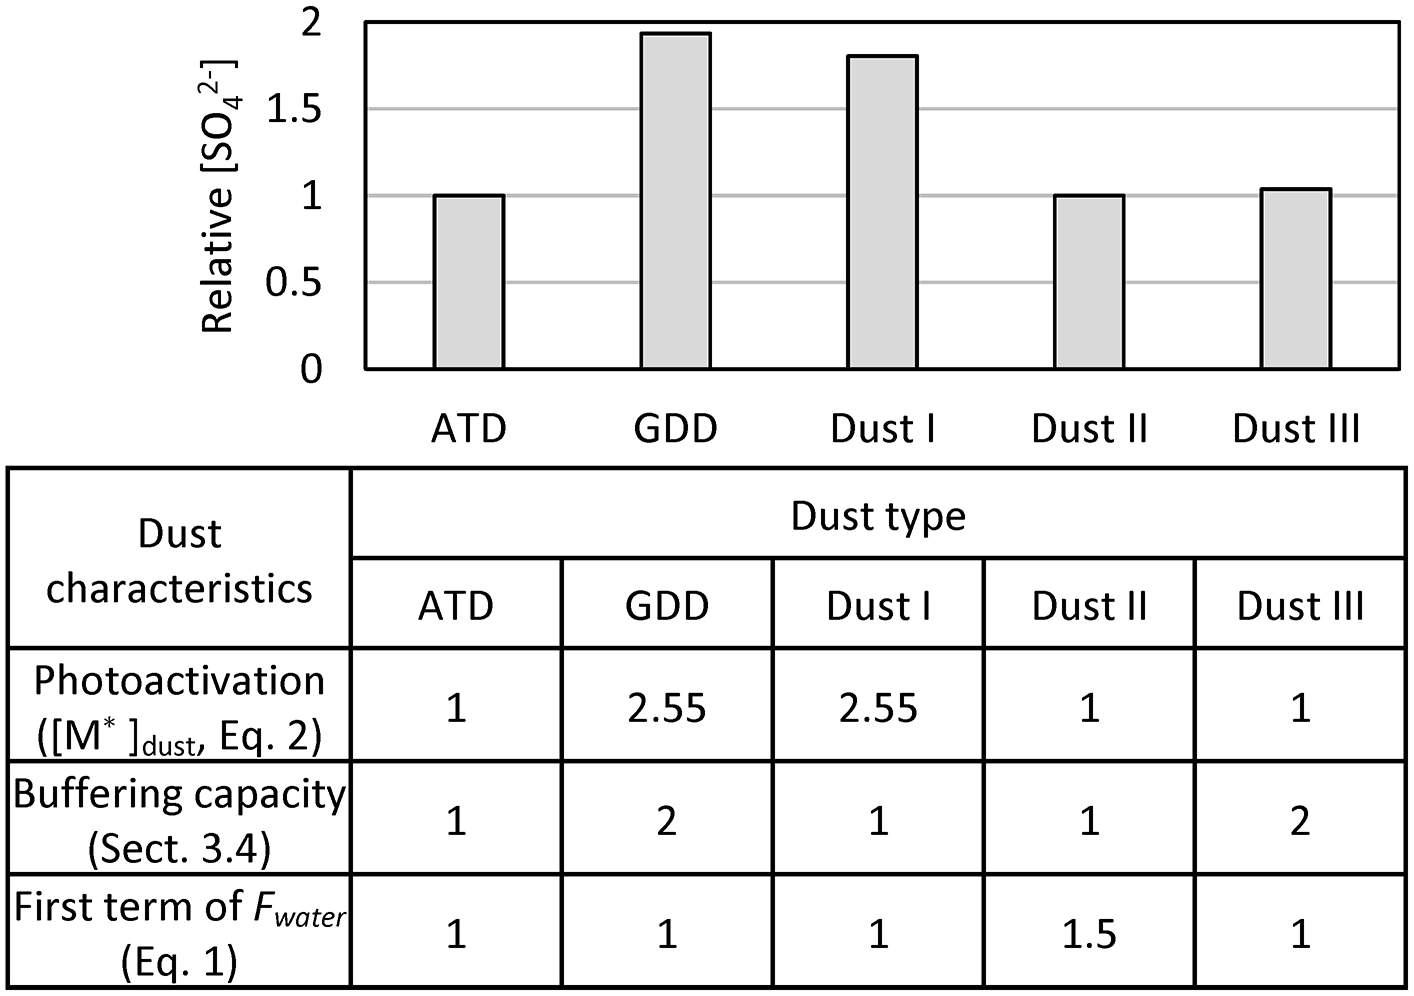
Figure 7The analysis of the influential parameters associated with dust characteristics to form sulfate. The relative concentration of sulfate is predicted using AMAR in the presence of different types of dust including ATD, GDD, and three types of artificial dust (Dust I, II, and III). The variation of dust type is determined via three major aspects: photoactivation capability of dust linked to [M*] in Eq. (2) (Sect. 3.3), the buffering capacity of dust (Sect. 3.4), and Fwater in Eq. (1) (Sect. 3.2). Dust types I–III are artificially formulated to analyze how the three dust properties can influence the sulfate formation. ATD is used as a reference dust. The three parameters of GDD, which were obtained from experimental data, are scaled to those of ATD. For analysis, the simulation is conducted with 100 µg m−3 of initial dust particles, 40 ppb of initial SO2, 2 ppb of initial O3, and 10 ppb of isoprene under ambient environmental condition on 23 November 2017. The simulation was performed without considering the particle loss to the chamber wall.
Figure S8 also shows the uncertainty in the sulfate and nitrate predictions in the presence of GDD using the AMAR model based on three major dust characteristic parameters (e.g., Fwater, buffering capacity, and photoactivation capability). Assuming that the sulfuric acid beyond the buffering capacity of GDD is treated by the ––H2O system, we estimated the Fwater value using an inorganic thermodynamic model with a large uncertainty (E-AIM II) (Clegg et al., 1998; Wexler and Clegg, 2002). In the model simulation, the ±10 % uncertainty in Fwater results in ±7.8 % variation in the sulfate concentration and −0.9 % to 1.2 % variation in the nitrate concentration. As shown in Fig. 3, the uncertainty in the photoactivation parameters of dust particles varies with the RH; e.g., the uncertainty is higher at higher RH levels. The probable uncertainty for the photoactivation of GDD particles at a high % RH (80 %) is ±50 % and results in −47.7 % to 55.7 % variation in the sulfate concentrations and −1.0 % to 1.9 % in the nitrate concentration. The uncertainty in the buffering capacity (±10 %) is associated with using ion chromatography to measure the ion concentrations and yields −0.7 % to 0.8 % variation in the sulfate concentration and −7.6 % to 9.4 % in the nitrate concentration.
Dust storms originating from the Gobi Desert often break during the spring season and influence the air quality over polluted urban or industrial areas in East Asia (Hsu et al., 2010; Li et al., 2012). In a typical, polluted urban environment, e.g., where NOx and SO2 levels are high (40 ppb of NOx, 5 ppb of SO2, and 200 µm−3 of GDD), the AMAR model shows that authentic dust particles are quickly saturated with nitrate and sulfate (concentrations higher than the buffering capacity of GDD), as shown in Fig. S9a. Under the high NOx conditions in most urban areas, the heterogeneously formed nitrate on the dust particles modulates the dust hygroscopicity, which is generally higher than that of unaged dust particles. Under high SO2 concentrations (e.g., 20 ppb of SO2; Fig. S9b), the dust-phase sulfate depletes nitrate, as discussed in Sect. 3.4. Therefore, SO2 and NOx rapidly convert into the nitrate or sulfate during dust break episodes. It is known that inorganic acids can corrode metal oxides, but they first react with alkaline carbonates on dust. Additionally, the excess amount of sulfuric acid beyond the dust buffering capacity can be titrated by ammonia, which is ubiquitous in ambient air. Thus, the acidity of dust particles may not be high enough to damage the photocatalytic ability of mineral dust particles under ambient conditions. Based on our simulation (Fig. S9), it takes 5–6 days under ambient conditions to produce a similar amount of sulfate to that observed in chamber studies (Fig. 4), and this is even longer than the reported average lifetime of airborne dust particles (∼4.3 days) (Scheuvens and Kandler, 2014; Zender et al., 2004). Therefore, most dust particles would possibly settle down before they are significantly corroded by sulfuric acid coating.
Under ambient conditions, the photooxidation of hydrocarbons in the presence of NOx is indispensable for the formation of ozone. In the model, the absorbed ozone on dust surfaces positively modulates the formation of sulfate and nitrate via either the autoxidation mechanism or the production of OH radicals (Yu et al., 2017). Although NO2 generally suppresses the formation of sulfate, its influence on the heterogeneous chemistry of SO2 is compounded with ozone in ambient air. For example, the heterogeneous chemistry of ozone becomes important in nighttime, particularly when humidity is high, and promotes SO2 oxidation. Additionally, some organic compounds can sink onto dust surfaces via a partitioning process and complicate the heterogeneous chemistry in the model. For example, the organic carboxylic acids on dust surfaces can react with alkaline carbonates to form alkaline carboxylates. Beardsley et al. (2013) reported that anions in inorganic aerosols, such as , can be depleted by the formation of carboxylic acids, and subsequently change aerosol hygroscopic properties. Semivolatile organic compounds compete with the absorbed SO2 and NO2 for the consumption of OH radicals. Therefore, the model requires further in-depth dust chemistry of organic compounds in the future to accurately predict sulfate and nitrate formation in ambient environments.
The data produced and any simulations as part of this publication are available upon request.
The supplement related to this article is available online at: https://doi.org/10.5194/acp-18-14609-2018-supplement.
Both authors equally contributed to chamber experiments, data analysis, model development, and manuscript preparation.
The authors declare that they have no conflict of interest.
This research was supported by an award from the National Institute of Metrological
Sciences (KMA2018-00512); an award from the Ministry of Science and
ICT, the Ministry of Environment, the Ministry of Health and Welfare
(2017M3D8A1090654); a scholarship from the Fulbright Scholar
Program (from the USA to Mongolia); and the University of Florida Open Access Publishing Fund.
Edited by: Athanasios Nenes
Reviewed by: Mingjin Tang and one anonymous referee
Abdelkader, M., Metzger, S., Steil, B., Klingmuller, K., Tost, H., Pozzer, A., Stenchikov, G., Barrie, L., and Lelieveld, J.: Sensitivity of transatlantic dust transport to chemical aging and related atmospheric processes, Atmos. Chem. Phys., 17, 3799–3821, https://doi.org/10.5194/acp-17-3799-2017, 2017.
Afshar, S., Jahromi, H. S., Jafari, N., Ahmadi, Z., and Hakamizadeh, M.: Degradation of malachite green oxalate by UV and visible lights irradiation using Pt/TiO2/SiO2 nanophotocatalyst, Sci. Iran, 18, 772–779, https://doi.org/10.1016/j.scient.2011.06.007, 2011.
Balkanski, Y., Schulz, M., Claquin, T., and Guibert, S.: Reevaluation of Mineral aerosol radiative forcings suggests a better agreement with satellite and AERONET data, Atmos. Chem. Phys., 7, 81–95, https://doi.org/10.5194/acp-7-81-2007, 2007.
Beardsley, R. L., and Jang, M.: Simulating the SOA formation of isoprene from partitioning and aerosol phase reactions in the presence of inorganics, Atmos. Chem. Phys., 16, 5993–6009, https://doi.org/10.5194/acp-16-5993-2016, 2016.
Beardsley, R. L., Jang, M., Ori, B., Im, Y., Delcomyn, C. A., and Witherspoon, N.: Role of sea salt aerosols in the formation of aromatic secondary organic aerosol: yields and hygroscopic properties, Environ. Chem., 10, 167–177, https://doi.org/10.1071/En13016, 2013.
Binkowski, F. S. and Roselle, S. J.: Models-3 Community Multiscale Air Quality (CMAQ) model aerosol component 1. Model description, J. Geophys. Res.-Atmos., 108, 4183, https://doi.org/10.1029/2001JD001409, 2003.
Byun, D. and Schere, K. L.: Review of the governing equations, computational algorithms, and other components of the models-3 Community Multiscale Air Quality (CMAQ) modeling system, Appl. Mech. Rev., 59, 51–77, https://doi.org/10.1115/1.2128636, 2006.
Camino, C., Cuevas, E., Basart, S., Alonso-Pérez, S., Baldasano, J., Terradellas, E., Marticorena, B., Rodríguez, S., and Berjón, A.: An empirical equation to estimate mineral dust concentrations from visibility observations in Northern Africa, Aeolian Res., 16, 55–68, 2015.
Clegg, S. L. and Wexler, A. S.: Densities and Apparent Molar Volumes of Atmospherically Important Electrolyte Solutions. 2. The Systems H+---H2O from 0 to 3 mol kg−1 as a Function of Temperature and H+----H2O from 0 to 6 mol kg−1 at 25 ∘C Using a Pitzer Ion Interaction Model, and NH4HSO4-H2O and (NH4)3H (SO4)2- H2O over the Entire Concentration Range, J. Phys. Chem. A, 115, 3461–3474, 2011.
Clegg, S. L., Brimblecombe, P., and Wexler, A. S.: Thermodynamic model of the system H+----H2O at tropospheric temperatures, J. Phys. Chem. A, 102, 2137–2154, https://doi.org/10.1021/jp973042r, 1998.
Crowley, J. N., Ammann, M., Cox, R. A., Hynes, R. G., Jenkin, M. E., Mellouki, A., Rossi, M. J., Troe, J., and Wallington, T. J.: Evaluated kinetic and photochemical data for atmospheric chemistry: Volume V – heterogeneous reactions on solid substrates, Atmos. Chem. Phys., 10, 9059–9223, https://doi.org/10.5194/acp-10-9059-2010, 2010.
Cwiertny, D. M., Young, M. A., and Grassian, V. H.: Chemistry and photochemistry of mineral dust aerosol, Annu. Rev. Phys. Chem., 59, 27–51, https://doi.org/10.1146/annurev.physchem.59.032607.093630, 2008.
Dentener, F. J., Carmichael, G. R., Zhang, Y., Lelieveld, J., and Crutzen, P. J.: Role of mineral aerosol as a reactive surface in the global troposphere, J. Geophys. Res.-Atmos., 101, 22869–22889, https://doi.org/10.1029/96jd01818, 1996.
Dupart, Y., King, S. M., Nekat, B., Nowak, A., Wiedensohler, A., Herrmann, H., David, G., Thomas, B., Miffre, A., Rairoux, P., D'Anna, B., and George, C.: Mineral dust photochemistry induces nucleation events in the presence of SO2, P. Natl. Acad. Sci. USA, 109, 20842–20847, https://doi.org/10.1073/pnas.1212297109, 2012.
Dupart, Y., Fine, L., D'Anna, B., and George, C.: Heterogeneous uptake of NO2 on Arizona Test Dust under UV-A irradiation: An aerosol flow tube study, Aeolian Res., 15, 45–51, https://doi.org/10.1016/j.aeolia.2013.10.001, 2014.
George, C., Ammann, M., D'Anna, B., Donaldson, D. J., and Nizkorodov, S. A.: Heterogeneous Photochemistry in the Atmosphere, Chem. Rev., 115, 4218–4258, https://doi.org/10.1021/cr500648z, 2015.
Gustafsson, R. J., Orlov, A., Badger, C. L., Griffiths, P. T., Cox, R. A., and Lambert, R. M.: A comprehensive evaluation of water uptake on atmospherically relevant mineral surfaces: DRIFT spectroscopy, thermogravimetric analysis and aerosol growth measurements, Atmos. Chem. Phys., 5, 3415–3421, https://doi.org/10.5194/acp-5-3415-2005, 2005.
Hoffmann, M. R., Martin, S. T., Choi, W. Y., and Bahnemann, D. W.: Environmental Applications of Semiconductor Photocatalysis, Chem. Rev., 95, 69–96, https://doi.org/10.1021/cr00033a004, 1995.
Hsu, S.-C., Wong, G. T., Gong, G.-C., Shiah, F.-K., Huang, Y.-T., Kao, S.-J., Tsai, F., Lung, S.-C. C., Lin, F.-J., and Lin, I.: Sources, solubility, and dry deposition of aerosol trace elements over the East China Sea, Mar. Chem., 120, 116–127, 2010.
Ibrahim, S., Romanias, M. N., Alleman, L. Y., Zeineddine, M. N., Angeli, G. K., Trikalitis, P. N., and Thevenet, F.: Water Interaction with Mineral Dust Aerosol: Particle Size and Hygroscopic Properties of Dust, Acs Earth Space Chem., 2, 376–386, https://doi.org/10.1021/acsearthspacechem.7b00152, 2018.
Jang, J., Jang, M., Mui, W., Delcomyn, C. A., Henley, M. V., and Hearn, J. D.: Formation of active chlorine oxidants in saline-oxone aerosol, Aerosol Sci. Tech., 44, 1018–1026, 2010.
Jickells, T., An, Z., Andersen, K. K., Baker, A., Bergametti, G., Brooks, N., Cao, J., Boyd, P., Duce, R., and Hunter, K.: Global iron connections between desert dust, ocean biogeochemistry, and climate, Science, 308, 67–71, 2005.
Khorasani, A. E., Schroder, D. K., and Alford, T. L.: Optically Excited MOS-Capacitor for Recombination Lifetime Measurement, IEEE Electr. Device L., 35, 986–988, https://doi.org/10.1109/Led.2014.2345058, 2014.
Kim, K. W., Kim, Y. J., and Oh, S. J.: Visibility impairment during Yellow Sand periods in the urban atmosphere of Kwangju, Korea, Atmos. Environ., 35, 5157–5167, 2001.
Krueger, B. J., Grassian, V. H., Laskin, A., and Cowin, J. P.: The transformation of solid atmospheric particles into liquid droplets through heterogeneous chemistry: Laboratory insights into the processing of calcium containing mineral dust aerosol in the troposphere, Geophys. Res. Lett., 30, 1148, https://doi.org/10.1029/2002gl016563, 2003.
Li, J., Wang, Z. F., Zhuang, G., Luo, G., Sun, Y., and Wang, Q.: Mixing of Asian mineral dust with anthropogenic pollutants over East Asia: a model case study of a super-duststorm in March 2010, Atmos. Chem. Phys., 12, 7591–7607, https://doi.org/10.5194/acp-12-7591-2012, 2012.
Li, J., Jang, M., and Beardsley, R. L.: Dialkylsulfate formation in sulfuric acid-seeded secondary organic aerosol produced using an outdoor chamber under natural sunlight, Environ. Chem., 13, 590–601, https://doi.org/10.1071/EN15129, 2015.
Li, W. J. and Shao, L. Y.: Chemical Modification of Dust Particles during Different Dust Storm Episodes, Aerosol Air Qual. Res., 12, 1095–1104, https://doi.org/10.4209/aaqr.2011.11.0188, 2012.
Liang, J. Y. and Jacobson, M. Z.: A study of sulfur dioxide oxidation pathways over a range of liquid water contents, pH values, and temperatures, J. Geophys. Res.-Atmos., 104, 13749–13769, https://doi.org/10.1029/1999jd900097, 1999.
Linsebigler, A. L., Lu, G. Q., and Yates, J. T.: Photocatalysis on TiO2 Surfaces – Principles, Mechanisms, and Selected Results, Chem. Rev., 95, 735–758, https://doi.org/10.1021/cr00035a013, 1995.
Liu, Y., Zhu, T., Zhao, D., and Zhang, Z.: Investigation of the hygroscopic properties of Ca(NO3)2 and internally mixed Ca(NO3)2/CaCO3 particles by micro-Raman spectrometry, Atmos. Chem. Phys., 8, 7205–7215, https://doi.org/10.5194/acp-8-7205-2008, 2008.
Mahowald, N. M., Baker, A. R., Bergametti, G., Brooks, N., Duce, R. A., Jickells, T. D., Kubilay, N., Prospero, J. M., and Tegen, I.: Atmospheric global dust cycle and iron inputs to the ocean, Global Biogeochem. Cy., 19, GB4025, https://doi.org/10.1029/2004GB002402, 2005.
Michel, A. E., Usher, C. R., and Grassian, V. H.: Heterogeneous and catalytic uptake of ozone on mineral oxides and dusts: A Knudsen cell investigation, Geophys. Res. Lett., 29, 10-11–10-14, https://doi.org/10.1029/2002GL014896, 2002.
Mochizuki, T., Kawamura, K., Aoki, K., and Sugimoto, N.: Long-range atmospheric transport of volatile monocarboxylic acids with Asian dust over a high mountain snow site, central Japan, Atmos. Chem. Phys., 16, 14621–14633, https://doi.org/10.5194/acp-16-14621-2016, 2016.
Ndour, M., Nicolas, M., D'Anna, B., Ka, O., and George, C.: Photoreactivity of NO2 on mineral dusts originating from different locations of the Sahara desert, Phys. Chem. Chem. Phys., 11, 1312–1319, https://doi.org/10.1039/b806441e, 2009.
Park, J. and Jang, M.: Heterogeneous photooxidation of sulfur dioxide in the presence of airborne mineral dust particles, RSC Adv., 6, 58617–58627, 2016.
Park, J., Jang, M., and Yu, Z.: Heterogeneous Photo-oxidation of SO2 in the Presence of Two Different Mineral Dust Particles: Gobi and Arizona Dust, Environ. Sci. Technol., 51, 9605–9613, https://doi.org/10.1021/acs.est.7b00588, 2017.
Pradhan, M., Kyriakou, G., Archibald, A. T., Papageorgiou, A. C., Kalberer, M., and Lambert, R. M.: Heterogeneous uptake of gaseous hydrogen peroxide by Gobi and Saharan dust aerosols: a potential missing sink for H2O2 in the troposphere, Atmos. Chem. Phys., 10, 7127–7136, https://doi.org/10.5194/acp-10-7127-2010, 2010.
Sarwar, G., Fahey, K., Kwok, R., Gilliam, R. C., Roselle, S. J., Mathur, R., Xue, J., Yu, J., and Carter, W. P.: Potential impacts of two SO2 oxidation pathways on regional sulfate concentrations: aqueous-phase oxidation by NO2 and gas-phase oxidation by Stabilized Criegee Intermediates, Atmos. Environ., 68, 186–197, 2013.
Sarwar, G., Simon, H., Fahey, K., Mathur, R., Goliff, W. S., and Stockwell, W. R.: Impact of sulfur dioxide oxidation by Stabilized Criegee Intermediate on sulfate, Atmos. Environ., 85, 204–214, 2014.
Scheuvens, D. and Kandler, K.: On Composition, Morphology, and Size Distribution of Airborne Mineral Dust, in: Mineral Dust: A Key Player in the Earth System, edited by: Knippertz, P. and Stuut, J.-B. W., Springer Netherlands, Dordrecht, 15–49, 2014.
Schulz, M., Prospero, J. M., Baker, A. R., Dentener, F., Ickes, L., Liss, P. S., Mahowald, N. M., Nickovic, S., Garcia-Pando, C. P., Rodriguez, S., Sarin, M., Tegen, I., and Duce, R. A.: Atmospheric Transport and Deposition of Mineral Dust to the Ocean: Implications for Research Needs, Environ. Sci. Technol., 46, 10390–10404, https://doi.org/10.1021/es300073u, 2012.
Sokolik, I. N. and Toon, O. B.: Direct radiative forcing by anthropogenic airborne mineral aerosols, Nature, 381, 681–683, 1996.
Sokolik, I. N., Winker, D., Bergametti, G., Gillette, D., Carmichael, G., Kaufman, Y., Gomes, L., Schuetz, L., and Penner, J.: Introduction to special section: Outstanding problems in quantifying the radiative impacts of mineral dust, J. Geophys. Res.-Atmos., 106, 18015–18027, https://doi.org/10.1029/2000JD900498, 2001.
Tang, M. J., Whitehead, J., Davidson, N. M., Pope, F. D., Alfarra, M. R., McFiggans, G., and Kalberer, M.: Cloud condensation nucleation activities of calcium carbonate and its atmospheric ageing products, Phys. Chem. Chem. Phys., 17, 32194–32203, https://doi.org/10.1039/c5cp03795f, 2015.
Tang, M. J., Cziczo, D. J., and Grassian, V. H.: Interactions of Water with Mineral Dust Aerosol: Water Adsorption, Hygroscopicity, Cloud Condensation, and Ice Nucleation, Chem. Rev., 116, 4205–4259, https://doi.org/10.1021/acs.chemrev.5b00529, 2016.
Tang, M. J., Huang, X., Lu, K. D., Ge, M. F., Li, Y. J., Cheng, P., Zhu, T., Ding, A. J., Zhang, Y. H., Gligorovski, S., Song, W., Ding, X., Bi, X. H., and Wang, X. M.: Heterogeneous reactions of mineral dust aerosol: implications for tropospheric oxidation capacity, Atmos. Chem. Phys., 17, 11727–11777, https://doi.org/10.5194/acp-17-11727-2017, 2017.
Tegen, I. and Schepanski, K.: The Global Distribution of Mineral Dust, in: Wmo/Geo Expert Meeting on an International Sand and Dust Storm Warning System, vol. 7 of IOP Conference Series Earth and Environmental Science, 7–9 November 2007, Barcelona, Spain, 2009.
Textor, C., Schulz, M., Guibert, S., Kinne, S., Balkanski, Y., Bauer, S., Berntsen, T., Berglen, T., Boucher, O., Chin, M., Dentener, F., Diehl, T., Easter, R., Feichter, H., Fillmore, D., Ghan, S., Ginoux, P., Gong, S., Grini, A., Hendricks, J., Horowitz, L., Huang, P., Isaksen, I., Iversen, I., Kloster, S., Koch, D., Kirkevåg, A., Kristjansson, J. E., Krol, M., Lauer, A., Lamarque, J. F., Liu, X., Montanaro, V., Myhre, G., Penner, J., Pitari, G., Reddy, S., Seland, Ø., Stier, P., Takemura, T., and Tie, X.: Analysis and quantification of the diversities of aerosol life cycles within AeroCom, Atmos. Chem. Phys., 6, 1777–1813, https://doi.org/10.5194/acp-6-1777-2006, 2006.
Thompson, T. L. and Yates, J. T.: Surface science studies of the photoactivation of TiO2 new photochemical processes, Chem. Rev., 106, 4428–4453, 2006.
Underwood, G. M., Song, C. H., Phadnis, M., Carmichael, G. R., and Grassian, V. H.: Heterogeneous reactions of NO2 and HNO3 on oxides and mineral dust: A combined laboratory and modeling study, J. Geophys. Res.-Atmos., 106, 18055–18066, https://doi.org/10.1029/2000jd900552, 2001.
Uno, I., Osada, K., Yumimoto, K., Wang, Z., Itahashi, S., Pan, X. L., Hara, Y., Yamamoto, S., and Nishizawa, T.: Importance of Long-Range Nitrate Transport Based on Long-Term Observation and Modeling of Dust and Pollutants over East Asia, Aerosol Air Qual. Res., 17, 3052–3064, https://doi.org/10.4209/aaqr.2016.11.0494, 2017.
Usher, C. R., Michel, A. E., and Grassian, V. H.: Reactions on mineral dust, Chem. Rev., 103, 4883–4939, https://doi.org/10.1021/cr020657y, 2003a.
Usher, C. R., Michel, A. E., Stec, D., and Grassian, V. H.: Laboratory studies of ozone uptake on processed mineral dust, Atmos. Environ., 37, 5337–5347, https://doi.org/10.1016/j.atmosenv.2003.09.014, 2003b.
Valle-Diaz, C. J., Torres-Delgado, E., Colon-Santos, S. M., Lee, T., Collett, J. L., McDowell, W. H., and Mayol-Bracero, O. L.: Impact of Long-Range Transported African Dust on Cloud Water Chemistry at a Tropical Montane Cloud Forest in Northeastern Puerto Rico, Aerosol Air Qual. Res., 16, 653–664, https://doi.org/10.4209/aaqr.2015.05.0320, 2016.
Vlasenko, A., Sjogren, S., Weingartner, E., Stemmler, K., Gäggeler, H. W., and Ammann, M.: Effect of humidity on nitric acid uptake to mineral dust aerosol particles, Atmos. Chem. Phys., 6, 2147–2160, https://doi.org/10.5194/acp-6-2147-2006, 2006.
Wang, Z., Pan, X. L., Uno, I., Li, J., Wang, Z. F., Chen, X. S., Fu, P. Q., Yang, T., Kobayashi, H., Shimizu, A., Sugimoto, N., and Yamamoto, S.: Significant impacts of heterogeneous reactions on the chemical composition and mixing state of dust particles: A case study during dust events over northern China, Atmos. Environ., 159, 83–91, https://doi.org/10.1016/j.atmosenv.2017.03.044, 2017.
Wexler, A. S. and Clegg, S. L.: Atmospheric aerosol models for systems including the ions H+, , Na+, , , Cl−, Br−, and H2O, J. Geophys. Res.-Atmos., 107, 4207, https://doi.org/10.1029/2001JD000451, 2002.
Yang, W. W., Zhang, J. H., Ma, Q. X., Zhao, Y., Liu, Y. C., and He, H.: Heterogeneous Reaction of SO2 on Manganese Oxides: the Effect of Crystal Structure and Relative Humidity, Sci. Rep.-UK, 7, 4550,https://doi.org/10.1038/s41598-017-04551-6, 2017.
Yu, Z., Jang, M., and Park, J.: Modeling atmospheric mineral aerosol chemistry to predict heterogeneous photooxidation of SO2, Atmos. Chem. Phys., 17, 10001–10017, https://doi.org/10.5194/acp-17-10001-2017, 2017.
Zender, C. S., Miller, R. L. R. L., and Tegen, I.: Quantifying mineral dust mass budgets:Terminology, constraints, and current estimates, Eos Trans. Am. Geophys. Union, 85, 509–512, https://doi.org/10.1029/2004EO480002, 2004.
Zhong, M. and Jang, M.: Dynamic light absorption of biomass-burning organic carbon photochemically aged under natural sunlight, Atmos. Chem. Phys., 14, 1517–1525, https://doi.org/10.5194/acp-14-1517-2014, 2014.