the Creative Commons Attribution 4.0 License.
the Creative Commons Attribution 4.0 License.
 | 11 Oct 2018
Assessment of Sun photometer Langley calibration at the high-elevation sites Mauna Loa and Izaña
Ramiro González
David Fuertes
Emilio Cuevas
Thomas F. Eck
Stelios Kazadzis
Natalia Kouremeti
Julian Gröbner
Philippe Goloub
Luc Blarel
Roberto Román
África Barreto
Alberto Berjón
Brent N. Holben
Victoria E. Cachorro
The aim of this paper is to analyze the suitability of the high-mountain stations Mauna Loa and Izaña for Langley plot calibration of Sun photometers. Thus the aerosol optical depth (AOD) characteristics and seasonality, as well as the cloudiness, have been investigated in order to provide a robust estimation of the calibration uncertainty as well as the number of days that are suitable for Langley calibrations. The data used for the investigations belong to the AERONET and GAW-PFR networks, which maintain reference Sun photometers at these stations with long measurement records: 22 years at Mauna Loa and 15 years at Izaña. In terms of clear-sky and stable aerosol conditions, Mauna Loa (3397 m a.s.l.) exhibits on average 377 Langley plots (243 morning and 134 afternoon) per year suitable for Langley plot calibration, whereas Izaña (2373 m a.s.l.) shows 343 Langley plots (187 morning and 155 afternoon) per year. The background AOD (500 nm) values, on days that are favorable for Langley calibrations, are in the range 0.01–0.02 throughout the year, with well-defined seasonality that exhibits a spring maximum at both stations plus a slight summer increase at Izaña. The statistical analysis of the long-term determination of extraterrestrial signals yields to a calibration uncertainty of ∼ 0.25–0.5 %, this uncertainty being smaller in the visible and near-infrared wavelengths and larger in the ultraviolet wavelengths. This is due to atmospheric variability produced by changes in several factors, mainly the AOD. The uncertainty cannot be reduced based only on quality criteria of individual Langley plots and averaging over several days is shown to reduce the uncertainty to the needed levels for reference Sun photometers.
- Article
(2195 KB) - Full-text XML
-
Supplement
(104 KB) - BibTeX
- EndNote


The Langley plot method (Shaw, 1983) is widely used for absolute calibration of Sun photometers. The main requirement for the method to be successful is the atmospheric transmittance stability during the period in which direct Sun observations are acquired at varying solar elevations. Apart from the original (classic) approach, several variations have been developed (Campanelli et al., 2004; Forgan, 1994; Herman et al., 1981). These are mostly intended to reduce the uncertainty and calibration error in case of changes in the atmospheric transmittance during the observation period.
Sun photometer networks like the AErosol RObotic NETwork (Holben et al., 1998), the Global Atmospheric Watch – Precision Filter Radiometer (Wehrli, 2005) and Skyradiometer Network (Nakajima et al., 1996) use the Langley plot method to calibrate the direct Sun channels, i.e., obtain extraterrestrial signals (V0), with the aim of calculating aerosol optical depth (AOD). Although some networks (e.g., SKYNET) perform Langley plots “on site” (Campanelli et al., 2007), networks like AERONET and GAW only use high-altitude stations to provide accurate absolute calibration with the Langley plot method for the so-called master instruments. The calibration is later transferred to field instruments by comparison in a calibration platform.
The AERONET network currently has three calibration centers: Goddard Space Flight Center (GSFC, in Greenbelt, Maryland), Laboratory of Atmospheric Optics (LOA, in Lille/Carpentras, France) and Group of Atmospheric Optics (GOA, in Valladolid, Spain). The GSFC master instruments are calibrated at the Mauna Loa Observatory, in Hawaii. The LOA and GOA masters are calibrated at Izaña Observatory. The GAW-PFR network is managed by the Physikalisch Meteorologisches Observatorium Davos, World Radiation Centre (PMOD/WRC) at Davos (Switzerland). It uses a triad of reference (PFR) instruments at Davos, which are considered by the World Meteorological Organization (WMO-GAW) to be the reference instrument triad for AOD measurements. It also operates permanent reference instruments at Izaña and at Mauna Loa that return periodically (every 6 months) to PMOD/WRC and are compared with the reference triad (Kazadzis et al., 2018b).
Mauna Loa is a reference site for radiometric observations and calibrations. It was very early considered an ideal place for calibration of Sun photometers using the Langley technique (Shaw, 1979); hence it hosts reference instruments of the main radiometric networks. Many studies have already reported the atmospheric aerosol characteristics at Mauna Loa (Andrews et al., 2011; Bodhaine et al., 1981, 1992; Dutton et al., 1994; Hyslop et al., 2013). Numerous studies about aerosol characteristics at Izaña have also been conducted (García et al., 2016; Prospero et al., 1995; Rodríguez et al., 2011). Izaña is also commonly used for accurate Langley plot calibrations (even in Moon photometry; Barreto et al., 2013, 2016), although the site performance has not yet been quantitatively evaluated in this sense.
After years of continuous Sun photometer observations at the Mauna Loa and Izaña observatories, long and high-quality measurement records are available, and the quantification of the calibration performance can be accomplished with the support of robust data sets. Therefore, the aim of this paper is to analyze the capability of the two high-mountain stations Mauna Loa and Izaña for Langley plot calibration, in terms of aerosol characteristics, seasonality and cloudiness, and provide statistically robust quantification of calibration uncertainty. The data used for the investigations belong to the AERONET and GAW-PFR networks, both having reference instruments at these stations with long measurement records. Several factors and physical processes affecting the performance of the Langley plots are analyzed.
2.1 The Mauna Loa and Izaña observatories
The atmospheric stability required for the Langley plot method is more easily achieved in remote, high-elevation locations, especially because the AOD is very low and stable. Several characteristics make the Izaña and Mauna Loa observatories unique for this purpose.
The Izaña Observatory (Tenerife, Spain, 28∘ N, 16∘ W) is located at the top of a mountain plateau, 2373 m a.s.l. (m above sea level), about 15 km away from the Teide peak. It is run by the Meteorological State Agency of Spain (AEMET; see http://izana.aemet.es, last access: 1 October 2018). Izaña is normally above a strong temperature inversion layer and therefore free of local anthropogenic influence. It is a World Meteorological Organization (WMO) Global Atmospheric Watch (GAW) program station as well as a WMO-CIMO Testbed for Aerosols and Water Vapour Remote Sensing Instruments (http://testbed.aemet.es, last access: 1 October 2018). It hosts reference instruments of several radiometric networks (e.g., Regional Brewer Calibration Centre, GAW-PFR, AERONET, PANDORA). Details of the Izaña facilities and activities are described in Cuevas et al. (2017b).
The Mauna Loa Observatory (Hawai'i, Hawaii, 19∘ N, 155∘ W) is located on the slope of the Mauna Loa volcano, 3397 m a.s.l. It was created in 1956 and run by the National Oceanic and Atmospheric Administration (NOAA; see https://www.esrl.noaa.gov/gmd/obop/mlo). It is the reference observatory for a wide set of atmospheric composition research programs (greenhouse gases, carbon cycle, aerosols, water vapor, ozone, trace gases, etc.) and has been continuously monitoring and collecting data related to the atmospheric change.
Both observatories are located in the free troposphere. The aerosol content above (see Sect. 3), as well as the water vapor column (PWV, precipitable water vapor) and the molecular (Rayleigh) optical depth, is very low, making it easier to ensure stable conditions during a Langley plot calibration. For instance the water vapor column at Izaña ranges from 0.2 cm in winter to 0.7 cm in summer (monthly averages, AERONET derived; see Table S1 in the Supplement), whereas at the nearby site “Santa_Cruz_Tenerife” located at sea level, the PWV ranges from 1.5 to 2.5 cm. The atmosphere is therefore very stable, especially in the mornings. In the afternoon, local convection can rise from the boundary layer up to the observatory level, especially at Mauna Loa. The strong inversion associated with the trade wind at Izaña very often prevents the boundary layer from reaching the observatory (Carrillo et al., 2015).
Another important feature to assure the success of the Langley calibration, is to reduce the time needed to acquire Sun observations at a wide optical air mass range as much as possible in order to avoid possible atmospheric changes. The latitude of Mauna Loa and Izaña, close to the tropics, makes the air mass change rapidly from 7 to 2, i.e., solar elevations from approximately 8 to 30∘, lasting about 01:35 to 02:15 h depending on the season (the duration is a few minutes shorter for Mauna Loa). Just for comparison, at 37∘ latitude, the time in winter to change from air mass 7 to 2 is more than 3 h. At higher latitudes, air mass 2 is not reached in winter.
Table 1Cloud fraction and number of clear-sky days over Mauna Loa and Izaña observatories, derived from GOME-2 cloud products (Loyola R. et al., 2010) over 2007–2014 . Clear sky is defined as a cloud fraction <0.1. The number of investigated days within each month for the 8-year period is also provided.
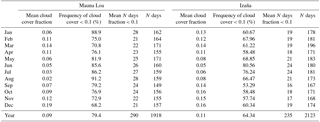
The cloudiness is another main aspect in performing Langley plots. Even thin high clouds perturb the Langley calibration dramatically. To evaluate the sky conditions with the same methodology at both locations, a cloud satellite product has been used. In particular, the cloud products (GDP-4.8 version) of the algorithms OCRA and ROCCIN (Loyola R. et al., 2010) from GOME-2 onboard MetOp-A have been used to evaluate cloud fraction and cloud top height, respectively. The cloud top height is a crucial parameter due to the high elevation of the observatories. The monthly mean cloud fraction and number of clear-sky days, defined as a cloud fraction <0.1, have been evaluated over the period 2007–2014. If the cloud top height was lower than the site elevation, the cloud fraction was considered 0. The results are shown in Table 1. On average, Mauna Loa exhibits 24 clear-sky days per month, whereas Izaña has 20. There is some seasonal variability, the period between May and August being the sunniest at both locations. However it is possible that very thin cirrus clouds (optical depth <0.1) are not detectable in these satellite products. This will be taken into account in the analysis of the Langley regressions (Sect. 4).
In addition to the necessary atmospheric conditions, the facility itself including permanent and trained staff, convenient access and easy logistics is also an important point to consider. The capacity of the measurement platforms themselves is a limitation given that many radiometric networks have reference instruments in these two observatories. This limitation, together with the relatively expensive shipping to such remote locations, is the main reason for AERONET (and many other networks) to calibrate master instruments with the Langley method at Izaña and Mauna Loa and then transfer the absolute calibration to field instruments in calibration platforms located in much more accessible facilities at GSFC, Carpentras, Davos, Valladolid, etc. For example, 15 to 20 calibrations of AERONET master instruments are accomplished every year at Izaña. Of course the calibration uncertainty of the field instruments is therefore less than that of masters, but logistically it is not reasonable to ship several hundred instruments every year to Mauna Loa or Izaña. The AOD calibration uncertainty needed for field instruments (0.01 to 0.02 absolute error as recommended by Kazadzis, 2016) can be achieved by means of side-by-side intercalibration (Eck et al., 1999; Holben et al., 1998). Possible instrument fluctuations due to shipping are controlled by always using a couple of masters that travel together and rigorous comparison of master instruments at the intercalibration sites. Ratio of direct Sun signals between the two masters must stay below 1 % variability.
2.2 Instrumentation and data sets
The AERONET standard instrument is the Cimel CE318, which has been extensively described (Holben et al., 1998). It is an automatic radiometer equipped with a two-axis robot, which collects both direct Sun and sky radiance observations at selected wavelengths in the range from 340 to 1640 nm. Three generations of Cimel instruments have been used in AERONET: the first (starting in the early 1990s) were analog instruments. After 2002 the digital version (Cimel 318N) was implemented, and after 2013 the so-called “triple” instruments (Cimel 318T, after Sun–sky–Moon measurement capability) started to operate. All three types of instruments can still be found in AERONET today.
The Precision Filter Radiometer of the GAW-PFR network is described in detail in Wehrli (2005). It uses four AOD channels at 368, 412, 500 and 862 nm and needs a separate solar tracker. It is designed for long-term stability; therefore the detectors are behind a shutter except for the brief sampling periods, and the instrument is stabilized in temperature and hermetically sealed, with an internal atmosphere of pressurized dry nitrogen.
Both instruments use interference filters to select the wavelengths, with a full width at half maximum of about 2–10 nm (filters are narrower in the ultraviolet wavelengths). The PFR uses one optical path and detector per channel, allowing simultaneous (and continuous) observation in the four channels. Conversely, the Cimel instrument has a single detector (or two in the case of instruments with a 1640 nm channel) and the filters are mounted in a rotating filter wheel. The Cimel configuration allows more wavelength channels (up to 10) but they can only be measured sequentially. In automatic operation, the Cimel instrument takes a triplet measurement (three separate measurements in a 1 min interval) every 15 min (or 3 min, in the high-frequency sampling mode), although during the Langley sequence – morning or afternoon for air masses larger than 2 – the Cimel instrument measures at fixed solar elevations with higher frequency.
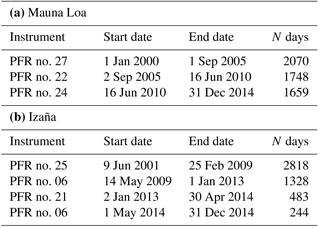
The AERONET observations at Mauna Loa started in 1994. The observation period used in this study spans 20 years (1997–2016). Within this period, 210 deployments of 22 different master photometers were carried out. This gives an idea of the frequent swap of Cimel instruments, once per month on average. The AERONET measurements at Izaña started in 2003 and had 37 deployments (71 days on average, 16 different instruments) until January 2011, when instrument no. 244 was set as the permanent reference. The GAW-PFR measurements started in 2000 and 2001 at Mauna Loa and Izaña, respectively. The list of PFR radiometers deployed at each location is given in Table 2. The high long-term stability of these radiometers will be shown in Sect. 4.
The database tool CÆLIS (Fuertes et al., 2018), developed at the Group of Atmospheric Optics, University of Valladolid (GOA-UVa) since 2008, has been used to facilitate the organization and extraction of data. It consists of a relational database, a web interface and a real-time data processing module. The specific software used in this work will be better described in Sect. 4.1. The “demonstrat” software tool (Holben et al., 1998) was used to browse the AERONET data and construct the AERONET data sets at the two stations, given the frequent swap out of master instruments (every 3–4 months). Conversely the GAW-PFR data sets are composed of a few instruments deployed for very long periods.
The two approaches have been therefore different, with AERONET prioritizing frequently recalibrating and maintaining the master instruments and shipping them to the intercalibration platforms, whereas GAW-PFR has prioritized stability in the long-term observations in order to facilitate the assessment of trends in the aerosol content, well in line with the GAW aims. However, in the last years (since 2011) AERONET has a permanent instrument at Izaña, not involved in the rotation of masters between this site and the intercalibration platforms.
Table 2Deployment periods of GAW-PFR instruments at Mauna Loa and Izaña.
The aerosol characteristics at Mauna Loa and Izaña observatories can be well established thanks to the long records of the AERONET and GAW-PFR networks. The very low AOD is a general feature at Mauna Loa throughout the year. At Izaña, very clean days alternate with some desert dust intrusions, especially in spring and summer (Cuevas et al., 2017a). The overall statistics for AOD at the 500 nm wavelength are provided in Fig. 1 and Table S1. These are computed by averaging all available daily mean values in the investigated period within a certain month of the year. As indicated above, 20 years of continuous AERONET data are used for Mauna Loa and 13 years for Izaña. Version 2 of AERONET data has been used in this analysis. A detailed description of the direct Sun algorithm, including gaseous absorption spectral corrections, is provided on the AERONET website (see https://aeronet.gsfc.nasa.gov/new_web/publications.html). As for GAW-PFR data, 15 years are available at Mauna Loa and 14 years at Izaña. A detailed description of the AOD derivation is given by Kazadzis et al. (2018b). Both are depicted in Fig. 1. Although the measurement periods are different, the long-term averages of AERONET and GAW-PFR differ less than 0.01 for all months, with a mean absolute difference of 0.0035 for the monthly means.
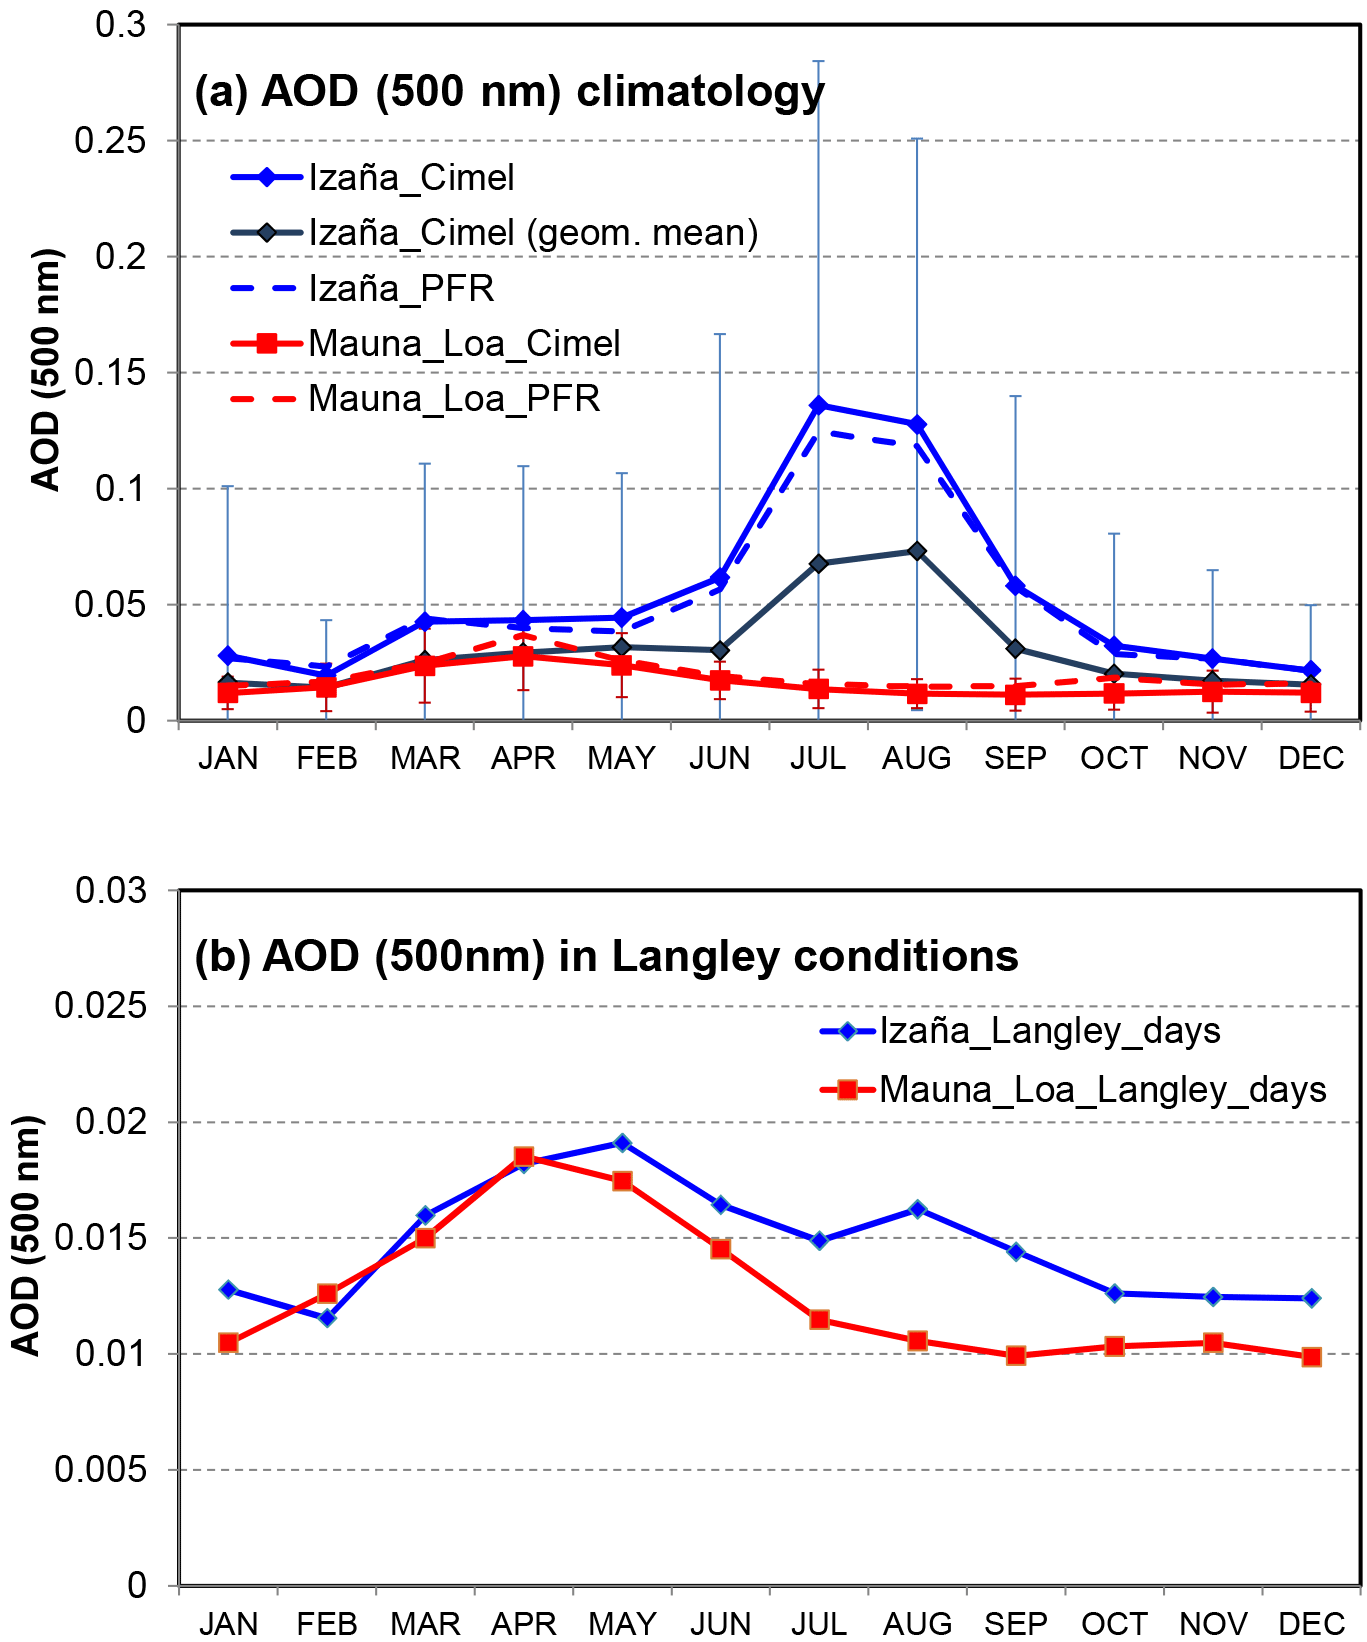
Figure 1(a) Monthly mean aerosol optical depth (500 nm) at Mauna Loa (1994–2016) and Izaña (2004–2016) for AERONET and GAW-PFR. Bars indicate ±1 monthly standard deviation. The black line indicates geometric mean values for AOD at Izaña (in contrast to the arithmetic mean for the other variables). (b) Monthly mean aerosol optical depth (500 nm) for the days fulfilling the criteria for Langley calibration as given in Sect. 4.1.
The cloud screening methodologies of AERONET and GAW differ, thus contributing to differences in monthly means. AERONET uses the algorithm by Smirnov et al. (2000), based on temporal variance as utilized by AERONET. GAW data are cloud-screened following the methodology by Wehrli (2008). Other authors have accomplished extensive comparison of Cimel and PFR observations (Kazadzis et al., 2014, 2016, 2018a; Kim et al., 2008) with excellent results.
Regarding Mauna Loa (Fig. 1), the AOD (500 nm) has a mean value of 0.016 (geometric mean 0.013), peaks in March with 0.028 and is at a minimum in August–September, with 0.011. The AOD (500 nm) daily mean only exceeded 0.05 on 0.6 % of the days. The monthly standard deviations indicate that the variability within each month is very low too. The largest variability is found from March through May, with monthly standard deviations of about 0.015. The Ångström exponent (AE, 440–870 nm), also given in Table S1, shows a mean value of 1.25, which is indicative of dominance by fine-mode particles. The AE is slightly lower in May (1.02), indicating a somewhat greater proportion of coarse-mode particles. The spring peak in aerosol concentration at Mauna Loa is a well-documented phenomenon and it is attributed to the advection of Asian dust (Bodhaine et al., 1981; Perry et al., 1999). The uncertainty in AE is very high at Mauna Loa Observatory since the uncertainty in AOD (about 0.002–0.003) is quite large in relation to the measured AOD of ∼0.01. Thus the AE values at Mauna Loa Observatory should be in general taken with caution.
The low AOD makes it difficult to investigate any other aerosol optical and microphysical properties, in particular those derived from the inversion of sky radiances for the AERONET instruments using the Dubovik inversion code (Dubovik and King, 2000; Dubovik et al., 2006). Such properties, like single-scattering albedo or the complex refractive index, are generally not quality assured if AOD (440 nm) is less than 0.4 (Holben et al., 2006). Given that the AOD stability is the main requirement for Langley calibrations, in-depth investigation of the aerosol properties is not in the scope of this work and will not be considered here.
The mean AOD (500 nm) at Izaña Observatory is 0.054 (geometric mean 0.029), with important seasonal variability. The geometric mean is often more suitable for AOD statistics because the lognormal probability distribution is a better reference than a normal distribution for most aerosol types (O'Neill et al., 2000). Monthly means range from 0.02 – for November through February – up to 0.14 in July and August (geometric means of 0.07 in both months; see Fig. 1). The transport of Saharan dust over Izaña in Summer enhances the aerosol content and the variability, as indicated by the large monthly standard deviations of up to 0.15 in July. The AE, which has a mean value of 0.99, exhibits a clear decrease in the summer months down to 0.54 in August, confirming the predominance of coarse dust particles. Despite this variability, the 25th percentile of AOD is <0.03 in July and August, indicating a relevant portion of pristine days during the summer months.
In order to assess the dust event frequency over Izaña, the presence of dust has been investigated within the 13-year AERONET database. Following similar methodology proposed by Toledano et al. (2007), dust events were identified by daily mean AOD (870 nm) >0.05 and AE <0.6, which approximately correspond to the 75th and 25th percentiles of these magnitudes in the Izaña data set. This simple approach results in the identification of 58 dust event days per year on average. The seasonal distribution is not even. On the contrary, dust events are very rare from October to February (1–2 days per month), while July and August, on average, exhibit 16 and 17 dust event days, respectively, which cause the higher AOD values observed in these months (Fig. 1). Similar results, even with a slightly different methodology, were achieved by Guirado-Fuentes (2015).
The dust occurrence over Izaña in summer may yield the incorrect conclusion that, during several months each year, the Langley calibrations are not possible at this station. But as it was previously indicated, dust events alternate with very clean (background) conditions. To demonstrate this important feature, all daily means of AOD (440 nm) over 2004–2014 have been plotted as a function of the day of the year (Fig. 2b). For comparison, Fig. 2a displays the same plot for Mauna Loa. As can be seen, most of the daily observations at Izaña (about 75 %) correspond to background values. Higher daily means, corresponding to dust events, are evident from June to September. Dust events are less frequent and with lower AOD outside those months. Note that dust transport in winter occurs at a much lower altitude than in summer; therefore the aerosol column above the observatory is minor in winter compared to summer dust events, in which dust can reach 5 km in height (Ansmann et al., 2011; Cuevas et al., 2015; Guirado-Fuentes, 2015). Izaña is therefore a privileged location for studying Saharan dust within the Saharan Air Layer.
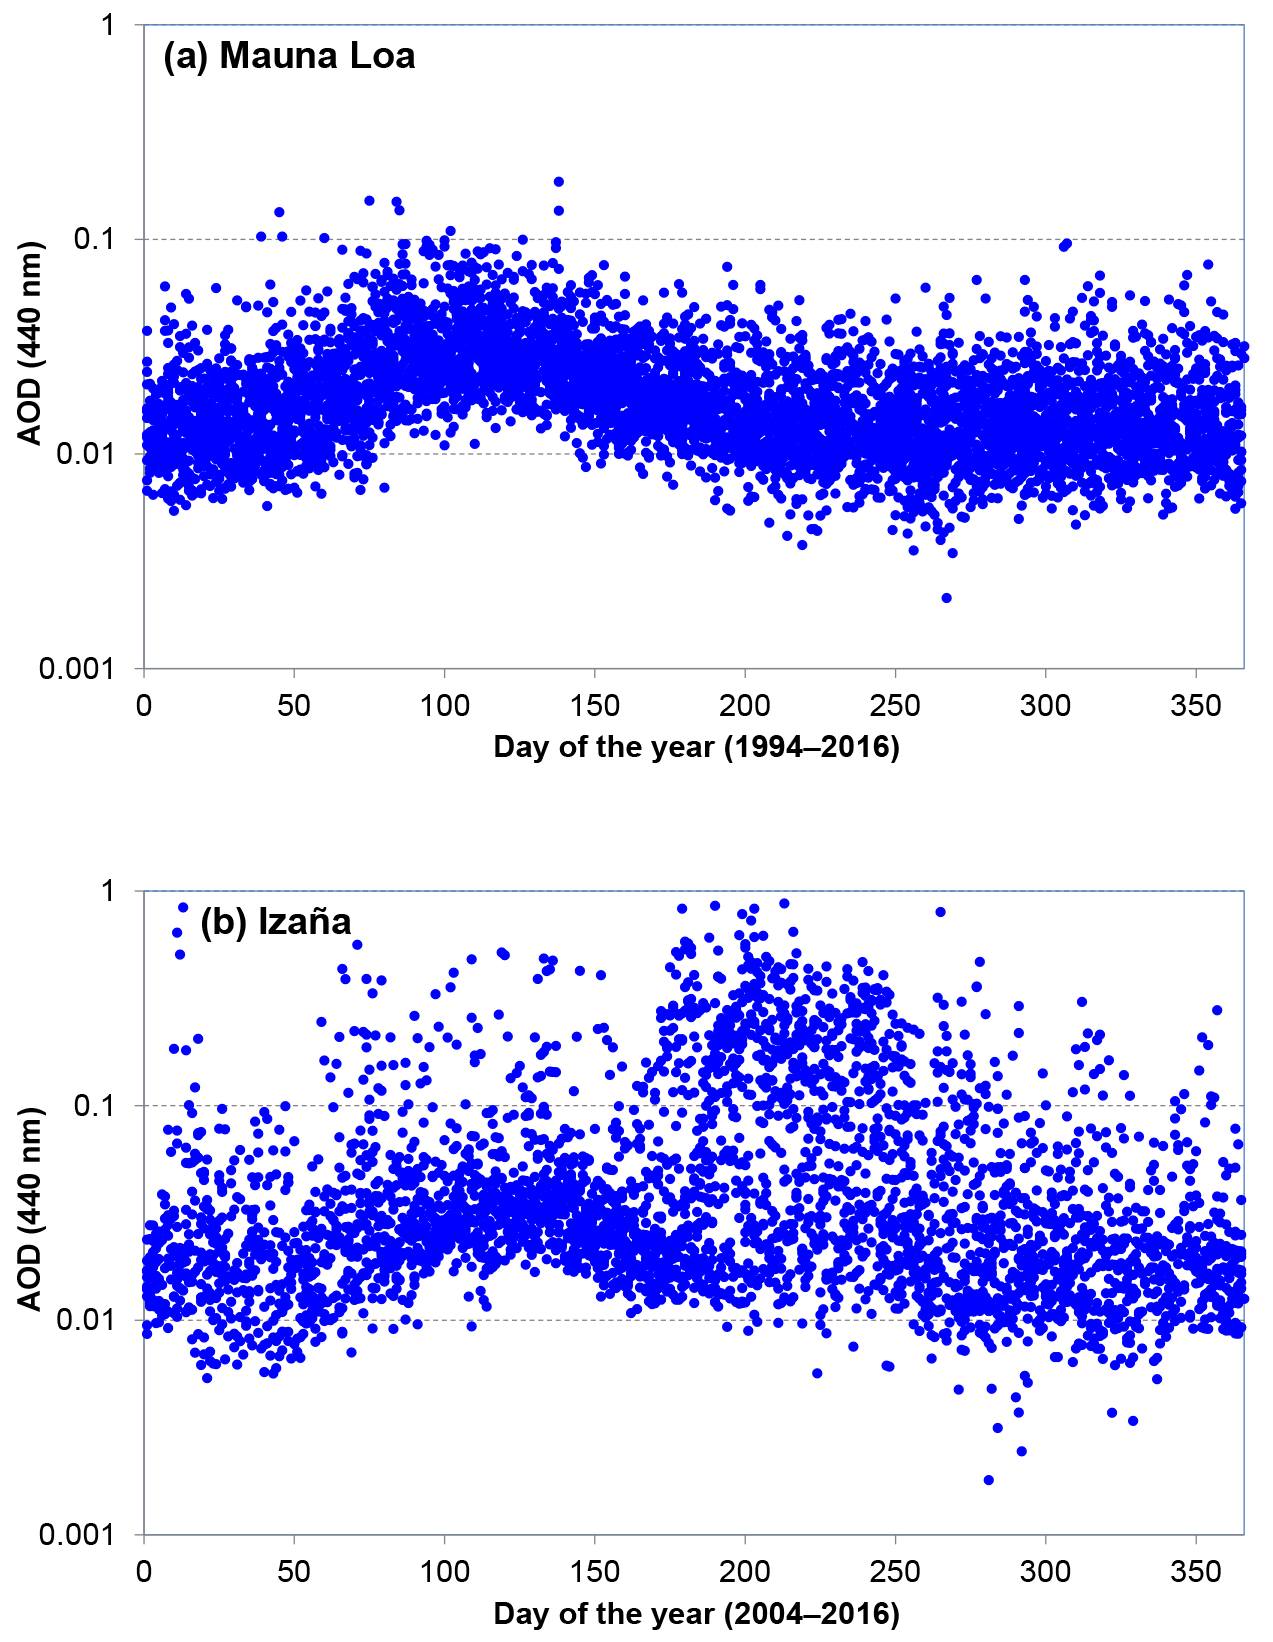
Figure 2Daily means of aerosol optical depth (440 nm) as a function of the day of the year at (a) Mauna Loa (1994–2016) and (b) Izaña (2004–2016) using AERONET data.
Another feature of the AOD seasonal cycle is the increase in the background AOD (lowest values) from March to May, with a maximum background occurring around the day 120 of the year, i.e., the beginning of May. This is not exactly in phase with the spring AOD peak at Mauna Loa (in April). The background AOD in May is about 0.016 (440 nm), whereas the rest of the year it is as low as AOD = 0.005. Interestingly, this enhanced background occurs both at Mauna Loa and Izaña (Fig. 2), although it is unclear whether these two seasonal maxima have the same origin.
4.1 Langley plot analysis
In order to investigate the station capability for Langley calibration, a software tool has been developed and integrated in CÆLIS. It performs two Langley plots for each available day (morning and afternoon) and stores the resulting extraterrestrial signal together with a set of regression statistics: correlation coefficient, standard deviation of the fit (σ), number of valid points, air mass range, fitting error for slope and intercept, etc. The routine performs the linear fit from air mass 7 to 21, and analyzes the standard deviation of the fit. If the residual for some point is larger than 2σ, the point is eliminated and a new iteration starts until all points are within 2σ or the number of remaining points is less than 10. If σ>0.2 or there are not enough points, the process stops.
This type of automatic and iterative analysis allows the identification of whether a certain day is suitable for Langley plot calibration according to preestablished quality thresholds. In our study, we have considered that for a certain period (morning or afternoon) within a particular day, the Langley calibration is possible if σ<0.006, the number of valid points is >33 % of the initial number of observations (Harrison and Michalsky, 1994) and AOD (500 nm) <0.025. These criteria can be chosen based on experience (Kiedron and Michalsky, 2016), but they are not critical in this study because we do not intend to perform the calibration of any particular instrument. For instance, for calibration purposes a higher threshold in σ should be used for the UV wavelengths. However our purpose here is to analyze the number of suitable Langley plots in a climatological sense. Other thresholds were tested and revealed no qualitative changes in the analysis. Other statistical indicators of the linear regression quality, such as the correlation coefficient, do not have enough sensitivity to be used for this purpose.
It is then straightforward to search the database for Langley periods fulfilling the indicated criteria. The results are given in Fig. 3, in which the average number of Langley plots for each month is indicated, as well as the standard deviation resulting from the year-to-year variability. Morning and afternoon Langley plots are given separately. It is common practice to use only mornings for Langley calibration, but in principle both periods are possible and therefore will both be considered in our study.
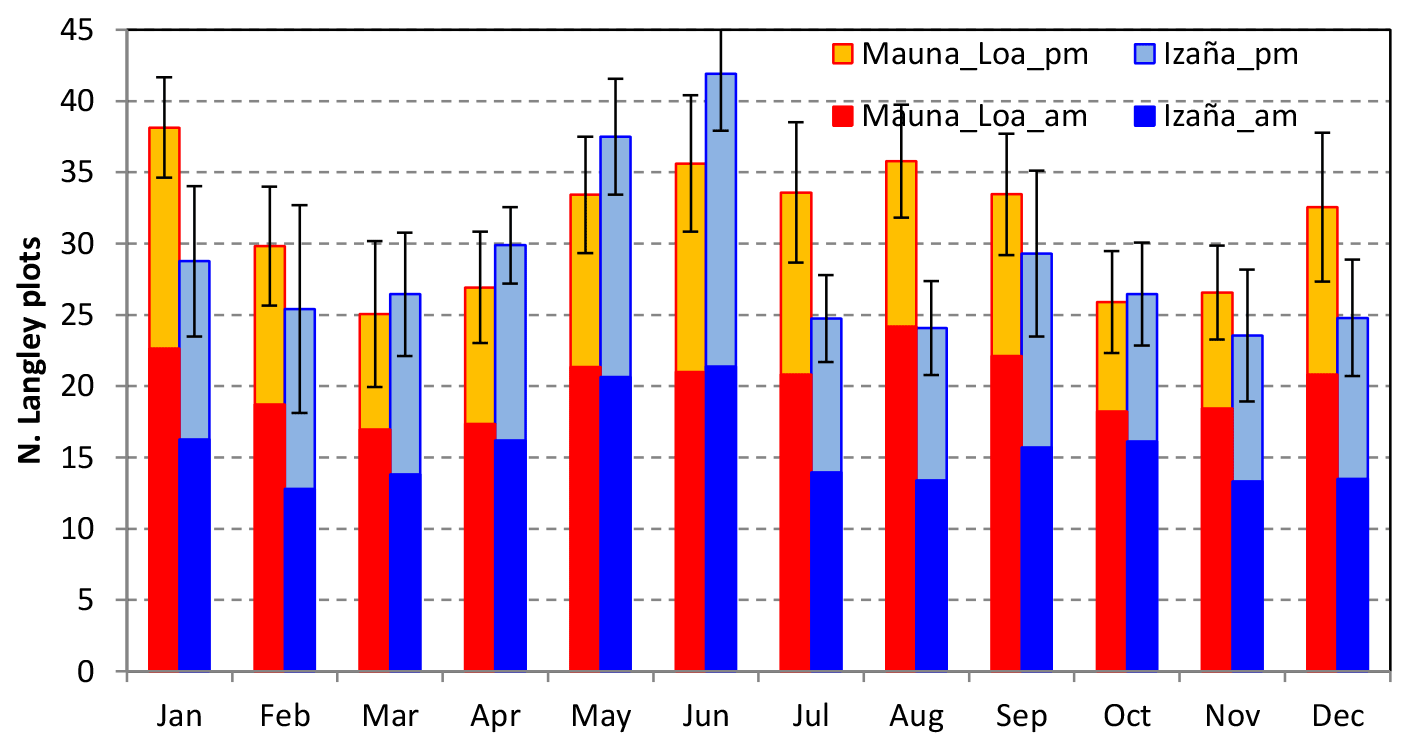
Figure 3Mean number of suitable Langley calibrations per month at Mauna Loa and Izaña based on GAW-PFR and AERONET data (see text). Bars indicate ±1 standard deviation for each month due to year-to-year variability. Morning (“am”) and afternoon (“pm”) Langley plot calibrations are given separately.
Overall, Mauna Loa meets the selected criteria in 377 Langley plots per year (243 morning and 134 afternoon calibrations). This means, on average, about 20 morning Langley plots and 11 afternoon Langley plots per month. Izaña meets the criteria in 343 Langley plots per year (187 morning and 155 afternoon calibrations), which means 15 morning and 13 afternoon Langley plots per month. There is a slight seasonality, with fewer suitable days in spring and fall at Mauna Loa and better conditions from May through September and December–January. At Izaña the dust events reduce the number of suitable days in July–August, and the best time of year is May–June.
The AOD (500 nm) for the selected Langley days is given in Fig. 1b, in which monthly averages are calculated for comparison with the overall climatology (Fig. 1a). This plot provides the seasonality of the background AOD values, which exhibits a spring maximum at both stations plus a slight summer increase at Izaña.
4.2 Calibration and statistical uncertainty
A major issue pointed out by many authors is that, despite the fact that the available Langley plots can be screened with very strict criteria, a certain variability, i.e., uncertainty in the extraterrestrial signals, remains (Kazadzis, 2016). The noise is caused by small changes in atmospheric transmission having a hyperbolic (solar air mass) dependence; thus they do not affect the linearity of the Langley plot but may change the result (Cachorro et al., 2004; Shaw, 1976). These changes in atmospheric transmission are mainly due to AOD variations, which affect the slope and/or y intersect of the Langley plots and cannot be identified with Langley plots alone (Marenco, 2007). For instance, a small variation of 0.005 in AOD could produce ∼0.5 % departure in the extraterrestrial signal. Other components like ozone, NO2 or water vapor would need unrealistically large changes during the Langley period to produce significant changes in the plot y intersect. Only changes in pressure >5 hPa during the Langley period would produce a significant change in the shorter wavelengths (<400 nm).
This uncertainty is well illustrated in Fig. 4, in which the GAW-PFR data at Mauna Loa have been selected. These data are very appropriate for this analysis due to the long deployment periods. We can see the daily extraterrestrial signals (500 nm) obtained with the Langley plot method after screening with the abovementioned criteria (Sect. 4.1). Making the criteria even stricter of course reduces the number of available points but does not reduce the variability much farther. That is the reason why many authors propose (and it is common practice) averaging a sufficient number of Langley plots to be able to achieve a satisfactory calibration (Kazadzis, 2016; Slusser et al., 2000).

Figure 4Daily extraterrestrial voltages (V0) at the 500 nm wavelength obtained with the Langley plot method for the GAW-PFR at Mauna Loa (morning calibrations only). The temporal linear fit to the V0's for each instrument deployment, as well as the 15-day moving average, is superimposed. Note that these are instrument signals; i.e., they depend on each particular instrument and are not directly comparable.
For long deployments, such as the PFR's in Fig. 4, the temporal fit to the extraterrestrial signals V0 resulting from the Langley plots is better than just averaging because it will take into account slow degradation of the optical elements (filters, detectors), which is quite clear, although small, in the plot. For instance, PFR no. 27 degraded by 0.4 % in 5.6 years (−0.07 % year−1). This is a successful example in long-term instrumental stability.
Once the slow temporal trend is taken into account, we can try to quantify the residuals in V0 determination as a quantification of the uncertainty of the Langley calibration at the site. The histogram of the V0 values from the PFR (500 nm wavelength), normalized to the long-term temporal trend, is provided in Fig. 5a (morning Langley plots only). The average of the V0 distribution is 1.0 and the standard deviation is σ=0.0033. In the plot we have superimposed a Gaussian distribution with the same mean and standard deviation (0.3 %). The V0 distribution does not pass a normality test mainly because the distribution has strong kurtosis (leptokurtic shape), with up to 81 % of the data contained in ±1σ, indicating that most of the values are very close to the average. Using expanded uncertainty (k=2), which for a normal distribution corresponds to a coverage interval of approximately 95 %, the Type A2 uncertainty of a single Langley plot at Mauna Loa is therefore ∼0.7 %.
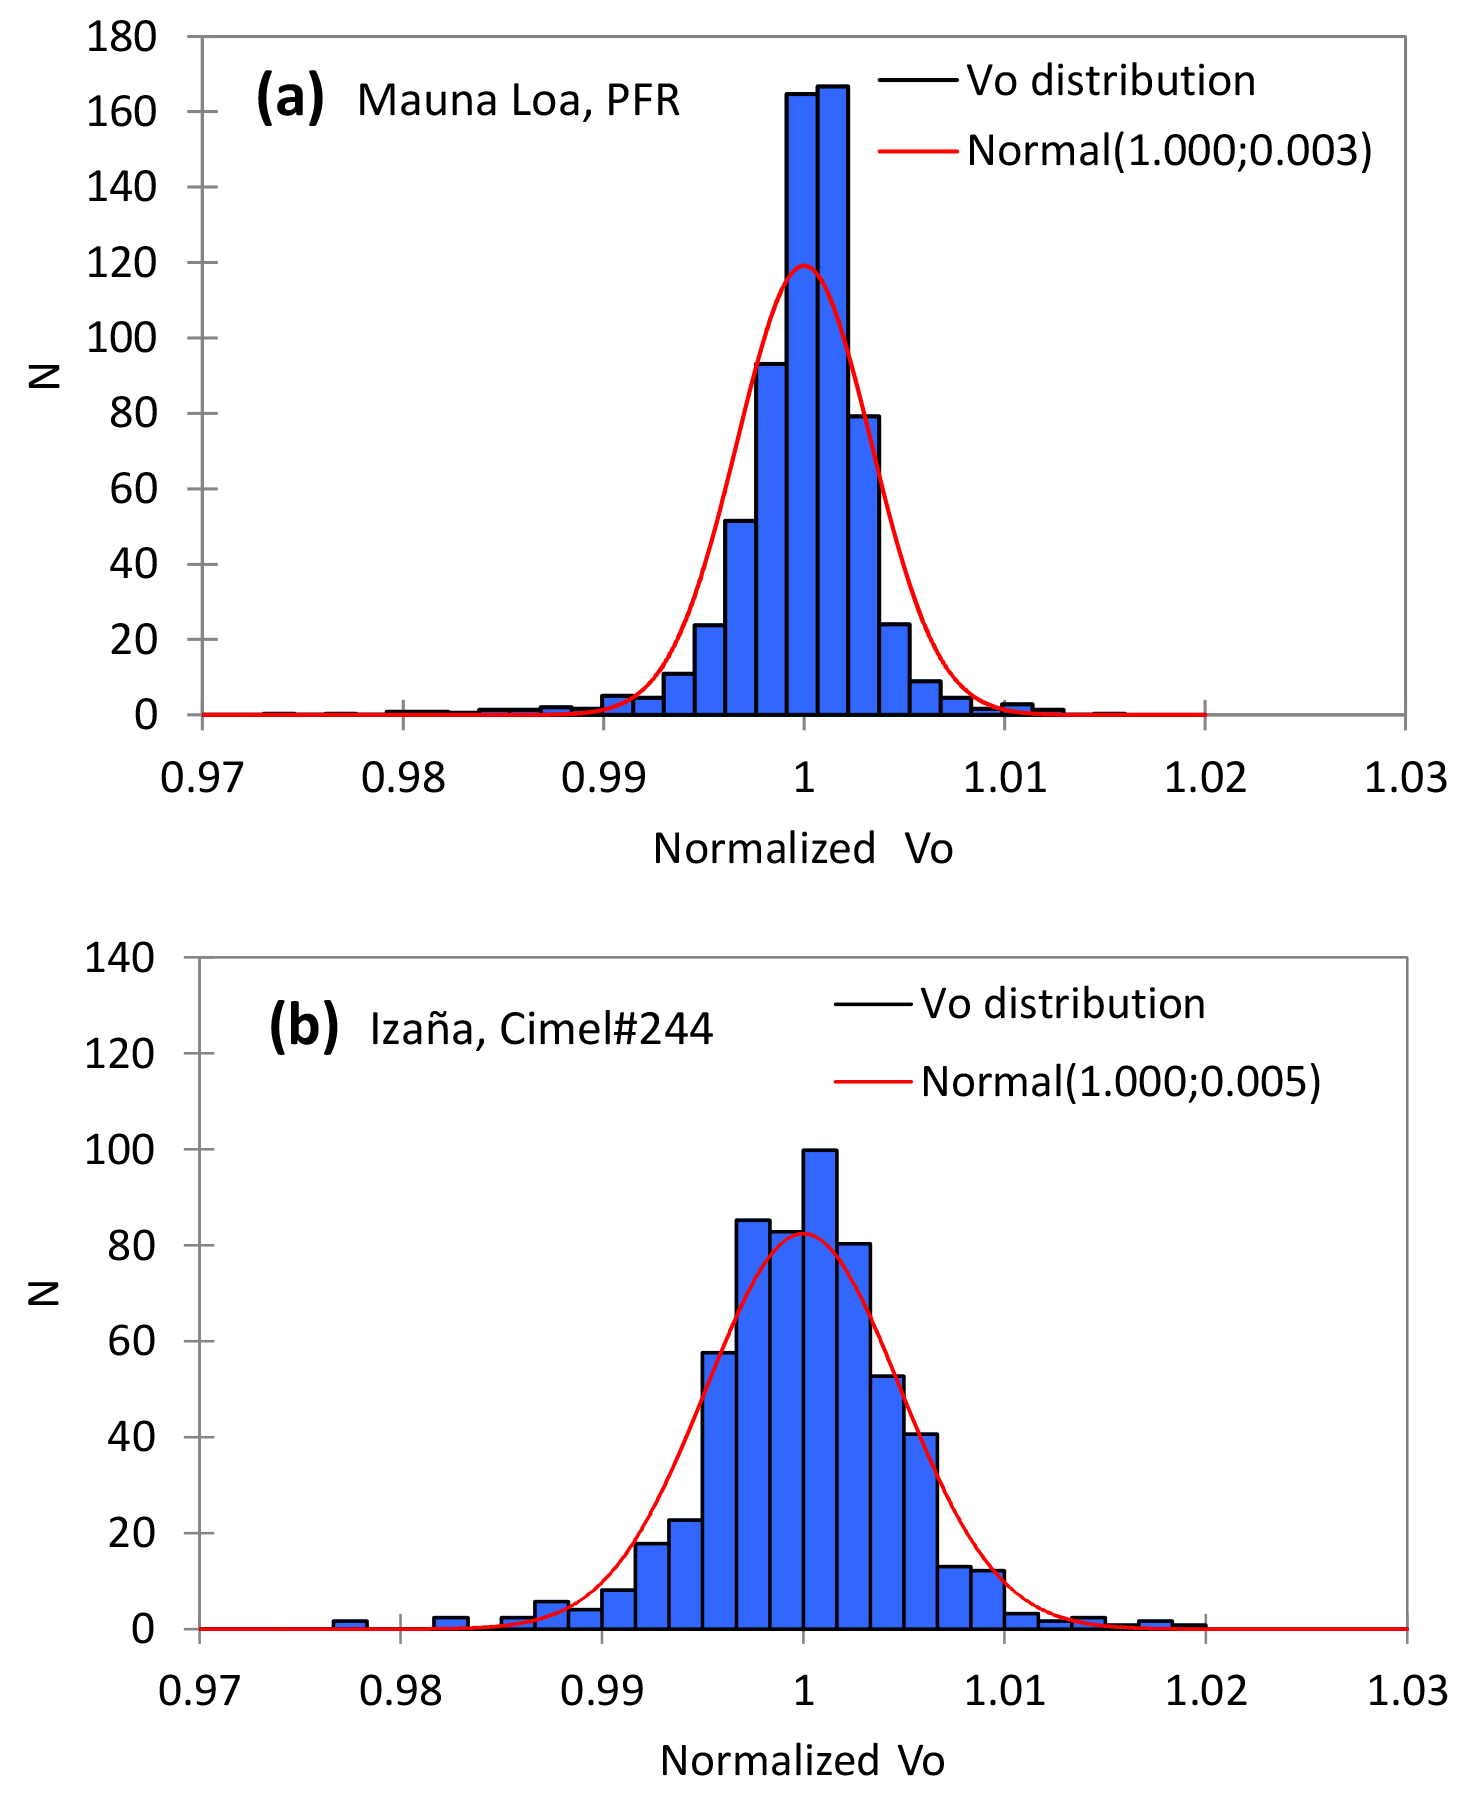
Figure 5Histogram of daily extraterrestrial voltages (V0) at the 500 nm wavelength normalized by the temporal trend: (a) at Mauna Loa using GAW-PFR data (2000–2014); (b) at Izaña using AERONET no. 244 (2012–2016). Red lines indicate a normal distribution (with the given parameters).
The same analysis for Izaña was carried out with the data of Cimel no. 244, which has been operated continuously since November 2011. The histogram of the residuals of the linear fit of V0 is depicted in Fig. 5b, with a relative standard deviation of 0.0046 (or 0.5 %). The distribution of the residuals at Izana follows a Gaussian distribution (at 95 % confidence level). Using the expanded uncertainty (k=2, 95 % confidence level), the uncertainty of a single Langley plot at Izaña is therefore ∼0.9 %. This particular instrument (in the 500 nm channel) degraded by 0.35 % in 5 years (−0.07 % year−1), thus also showing high stability.
Furthermore, we can evaluate the statistical uncertainty of the V0 determination as a function of the number of averaged Langley plots, with respect to the linear interpolation described before. For this purpose, we have computed moving averages between 2 and 20 days (number of Langley V0's) and compared them with the reference value obtained from the linear interpolation. The 15-day moving average is also plotted in Fig. 4. We basically calculate the residuals between the moving averages and the linear temporal trend and plot them as a function of the number of Langley plots that are averaged. The result can be interpreted as the reduction in uncertainty as we average an increasing number of Langley-retrieved V0's. Figure 6 shows the decrease in the expanded uncertainty as a function of the number of averaged Langley plots. The starting point is the uncertainty of one single Langley plot as described above. Note that the statistical uncertainty is generally expected to decrease with the square root of the number measurements, in this case number of Langley plots. This is indicated in the plot as the red dashed line. In our case, the uncertainty reduction is close to this theoretical value (slope of −0.4 in log–log scale). If we average more than 10 Langley plots, then the uncertainty is <0.25 %, in agreement with the calibration uncertainty at Mauna Loa reported for AERONET (Holben et al., 1998).

Figure 6Uncertainty of the Langley plot calibration vs. number of Langley plot V0's that are averaged, using GAW-PFR data (500 nm) at Mauna Loa (2000–2014). The black line indicates the fit to the experimental data in log–log scale (fit result provided). The red dashed line indicates the theoretical decrease in uncertainty with the square root of the number of measurements.
We have also tried to quantify the differences that can be found between morning and afternoon Langley plots in terms of uncertainty. The criteria applied to select afternoon Langley plots are exactly the same as above, but the number of suitable data is only 134 days per year at Mauna Loa (a factor of 1.8 fewer). The standard deviation of the V0's also increases for afternoon Langley plots (σ=0.0045). At Izaña the decrease in successful afternoon Langley plots is not that large, with 155 days per year (a factor of 1.2 fewer), and the standard deviation of the V0's increases up to 0.006.
The strong requirement of AOD (500 nm) <0.025 is needed to prevent AOD variability and achieve the low uncertainty required by AERONET and GAW-PFR. Recent work by Barreto et al. (2014) included moderate, but stable throughout the day, AOD up to 0.3 in the Langley plot calibrations, which were used to recover a long-term AOD data set at Izaña (spanning 1976–2012) from an astronomical spectrometer. The AOD uncertainty in that case is increased but it is worth mentioning that, depending on the instrument or the intended application, the set of criteria (for instance in AOD) used to select Langley calibrations can be changed.
Finally it must be noted that the uncertainty estimations have been performed for the 500 nm wavelength. The standard deviation of the V0's in a typical ∼20–30 Langley series is larger in the UV range, at ∼0.4–0.5 %, and smaller in the near-infrared wavelengths (870, 1020, 1640 nm) at ∼0.1–0.2 %. This wavelength dependence in uncertainty occurs due to lower AOD variability at the longer wavelengths. For the UV the higher variance might also be due to filter blocking issues and also possibly to temperature effects for AERONET Cimel instruments that have not been accounted for in the UV wavelengths (in addition to higher AOD in the UV range) .
4.3 Additional uncertainty sources
There are several other factors that can be considered in the analysis of Langley plot uncertainty. A number of authors analyzed the effect of finite bandwidth of the Sun photometer channels (Box, 1981; Thomason et al., 1982), structured vertical aerosol and uncertainty in air mass determination (Forgan, 1988; Russell et al., 1993; Thomason et al., 1983), diffuse light contributions to the radiometer signal (Reagan et al., 1986), and systematic diurnal variation in optical depth (Marenco, 2007; Schmid and Wehrli, 1995). These factors produce systematic errors, although the current instrument performance in terms of field of view, signal stability and time accuracy, together with the limitation of air mass range and the very low aerosol content in the selected Langley conditions for Mauna Loa and Izaña, make these errors <0.1 % (Reagan et al., 1986)3. Systematic semidiurnal cycles in other components like pressure (i.e., atmospheric tide; Le Blancq, 2011), ozone, water vapor or NO2 have a very small amplitude and do not affect the aerosol wavelength channels significantly.
We have investigated other possible sources contributing to the uncertainty of the Langley plot method. First, we have analyzed the variability in the solar extraterrestrial irradiance, which is assumed to be constant in our previous analysis. The measurements of the space-based photometer run by PMOD/WRC as part of the VIRGO experiment on the ESA/NASA SOHO mission (Fröhlich et al., 1995) were used for this purpose. The VIRGO data series comprises more than 20 years of total and spectral (in three bands) solar irradiance. It clearly shows the 11-year cycle in solar irradiance, which is of the order of 0.1 %. Given the frequency of recalibration (at least two to three times per year) of the GAW-PFR and AERONET reference instruments, this solar cycle should not be an issue for AOD calculations.
However, short-term variations in spectral solar irradiance can be as large as 0.5 % (at 402 nm) in a few weeks during high solar activity, as is the case with the episode in October–November 2003, depicted in Fig. 7 for the two Sun photometer wavelengths (500 and 862 nm). We analyzed the extraterrestrial signal provided by the PFR and the Cimel instrument from the ground during this event, using the Langley plot method. The resulting (normalized) V0's, also included in Fig. 7, are however rather noisy and do not correlate with the space-based data. Either the atmospheric variability or the instrument precision prevent the detection of these kinds of abrupt changes in solar irradiance even from high-altitude stations, at least with these particular instruments. Averaging several Langley calibrations is again shown necessary to overcome this possible uncertainty.
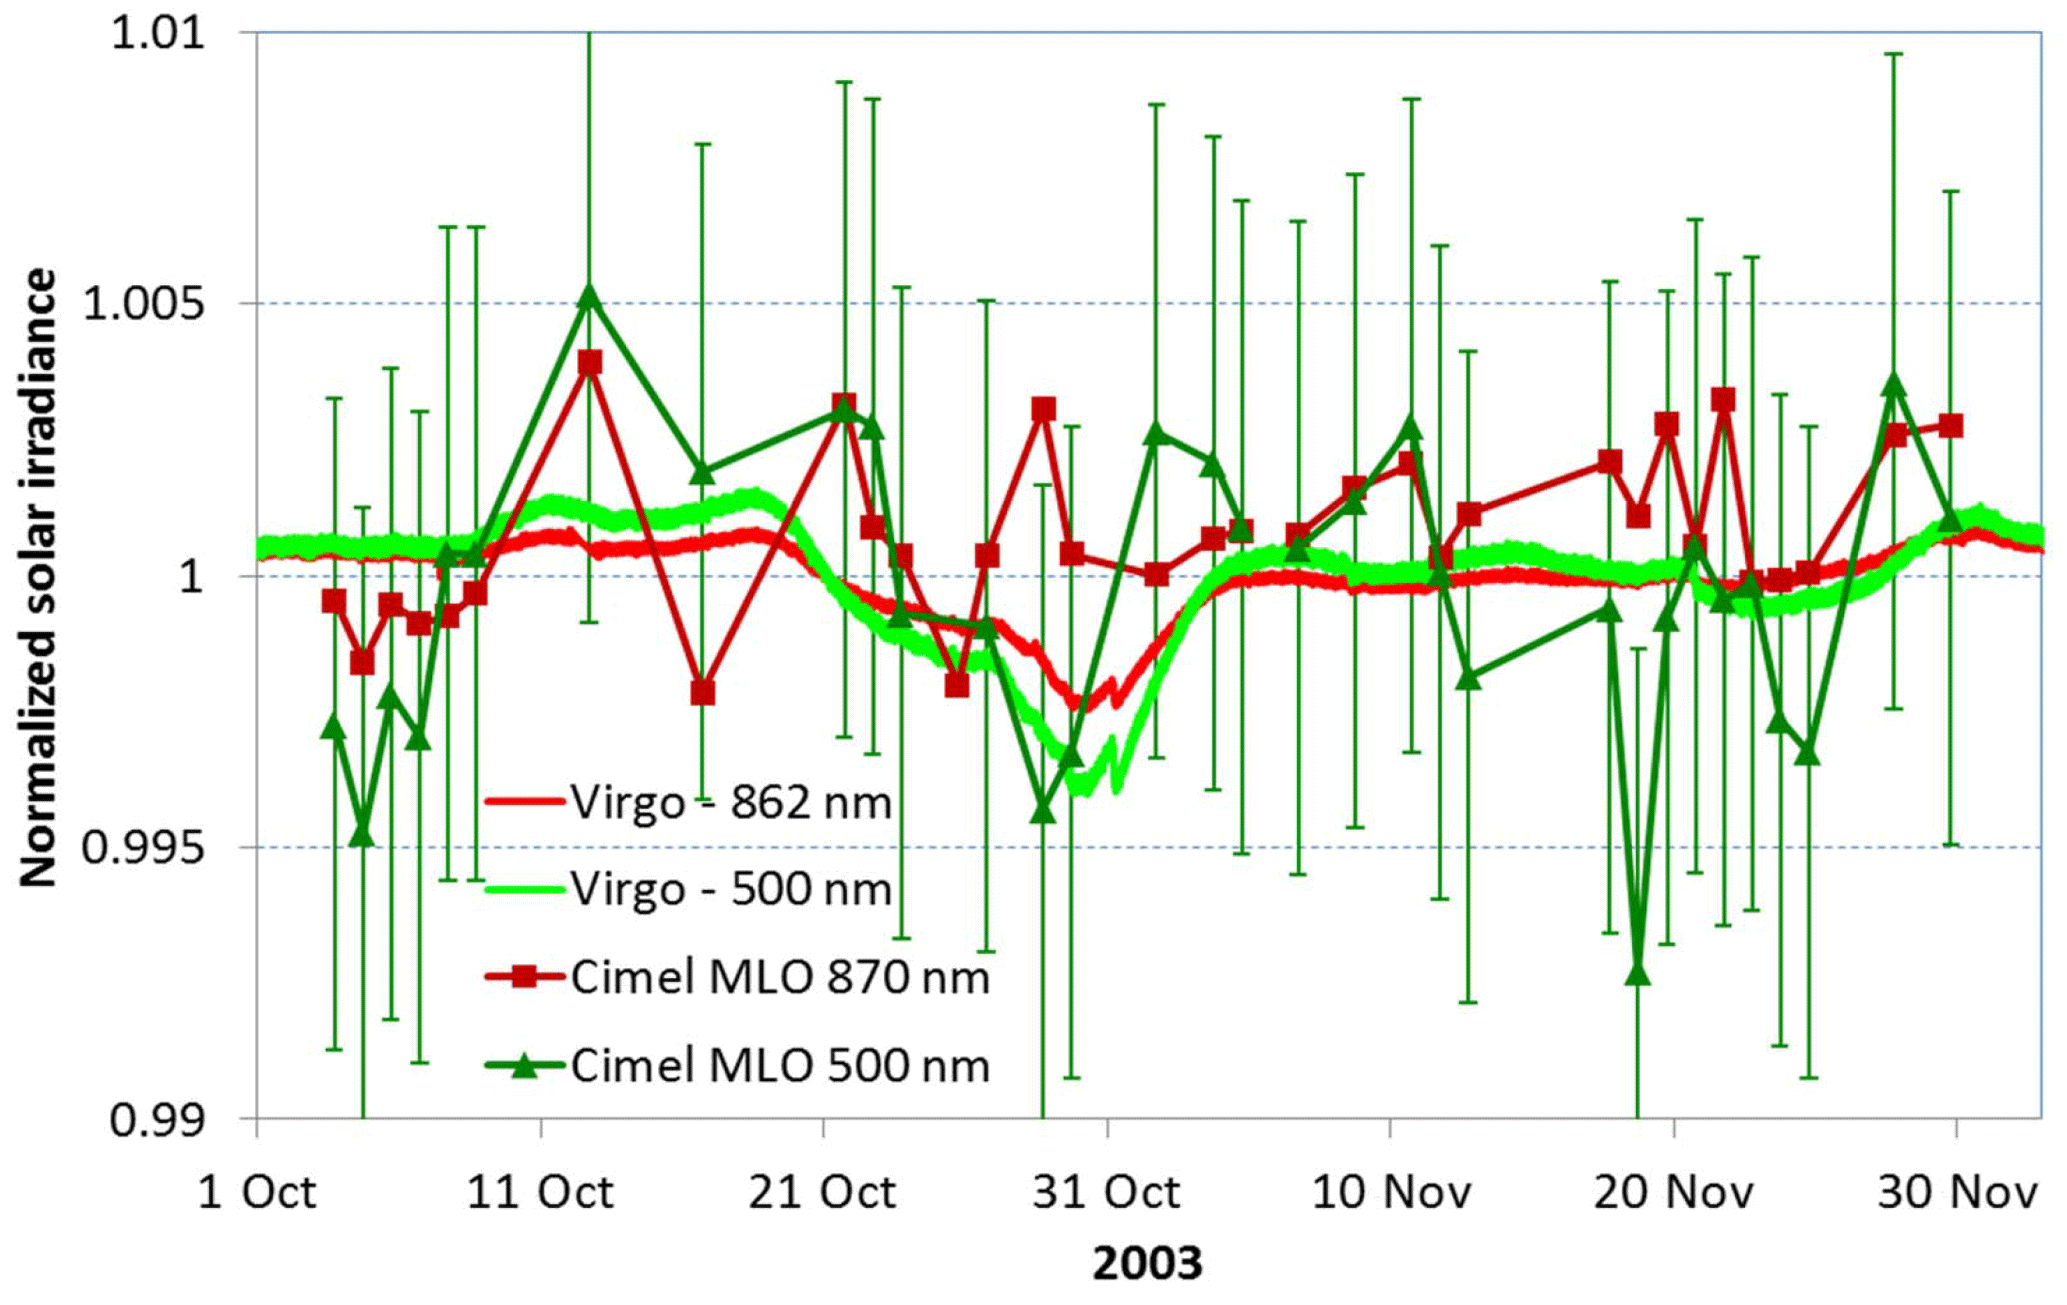
Figure 7Solar extraterrestrial normalized irradiance as measured by the VIRGO space-based photometer during 2003–2004 at the 500 nm (green) and 862 nm (red) wavelengths. Cimel extraterrestrial signal derived from Langley plots at 500 nm and 870 nm in Mauna Loa for the same period are also depicted. Error bars for the 500 nm channel indicate the 0.7 % typical uncertainty for this spectral channel.
Another source of uncertainty that has been analyzed is the presence of the subtropical jet above Izaña in spring, which introduces strong turbulence at around 12 km in height. This phenomenon is well known by the astronomers of the nearby Canary Astrophysics Institute since it produces blurring and twinkling of stars due to turbulent mixing in the Earth's atmosphere, which causes variations in the refractive index.
To investigate this, we have analyzed the V0 repeatability as in Fig. 5 but using monthly statistics in order to check for any seasonality in the quality of the calibrations. The result is shown in Fig. 8. The variability in the Langley plots, as evaluated from the standard deviation of the V0's (500 nm wavelength), is somewhat larger in March and October–November, compared to the rest of the year. According to Fig. 3 in Rodríguez-Franco and Cuevas (2013), March–April are the months with stronger winds in the upper troposphere above the Izaña station, but the V0 variability is not conclusive to confirm or discard the hypothesis. This assessment will need further investigations, but at least we can conclude that noisier Langley plots are to be expected at Izaña in March and fall. At Mauna Loa the standard deviation of the Langley plots is only higher in April, in coincidence with the higher mean AOD in this month.

Figure 8Standard deviation of V0's (500 nm wavelength) from Langley calibrations for every month at Izaña and Mauna Loa using AERONET data.
The main AOD characteristics of the high-elevation sites Mauna Loa and Izaña have been analyzed in detail in order to quantify the characteristics of these locations for Langley plot calibration of Sun photometers. For this purpose, we used long-term records of AERONET and GAW-PFR reference Sun photometers.
The aerosol monthly climatologies derived from both types of network instruments agree within 0.0035 optical depth at 500 nm (at both sites) and show very low aerosol concentrations. For background conditions used in Langley calibrations, AOD (500 nm) ranges from 0.01 to 0.02 for both stations. The seasonality is characterized by a spring maximum at Mauna Loa and the occurrence of Saharan dust events in summer at Izaña. Despite the different network operation (frequent swap of AERONET masters, long deployments for GAW-PFR) and data processing schemes (including cloud screening), they are both shown to be successful in accurate aerosol monitoring in such pristine locations.
The analysis of cloudiness was accomplished by means of the cloud products OCRA and ROCCIN from GOME-2. On average, Mauna Loa and Izaña exhibit 24 and 20 clear-sky days per month, respectively (very thin cirrus clouds are not included in these statistics). Therefore the clouds are not an obstacle for acquiring a sufficient number of Langley plots. If we look for days also fulfilling the requirement of high atmospheric stability needed for accurate Langley plot calibration, we find a climatological average of 243 morning and 134 afternoon periods per year at Mauna Loa (about 20 morning and 11 afternoon Langley plots per month). Izaña meets the criteria in 187 morning and 155 afternoon periods (about 15 morning and 13 afternoon Langley plots per month on average). These conditions were established for Langley plots having standard deviation of the residuals σ<0.006, number of valid points >33 % of the initial number of direct Sun observations and AOD (500 nm) <0.025. Dust events at Izaña (especially in summer) reduce the number of available calibration days during those months but do not prevent having a sufficient number of clean days for Langley calibration (13 morning Langley plots in August at the minimum).
Despite the strict criteria used to select individual Langley plots, a certain noise derived from small changes in atmospheric transmission (mainly changes in AOD) results in the time series of extraterrestrial signals having a certain variability. This dispersion has been used to statistically provide a quantification of the calibration uncertainty. The standard deviation of the Langley-derived extraterrestrial signals is ∼0.3 % at Mauna Loa and ∼0.5 % at Izaña for 500 nm, regardless of the data set (GAW-PFR or AERONET). Applying an expanded uncertainty (k=2) criterion, the typical calibration uncertainty for a single Langley plot is 0.7–0.9 % (at the 95 % confidence level). The necessary averaging of at least 10 Langley-derived extraterrestrial signals reduces the statistical uncertainty to 0.25 % at Mauna Loa and and 0.4 % at Izaña.
Due to convective activity, morning Langley plots more often fulfill the prescribed stability conditions than afternoons. The probability of having changes in atmospheric transmission is larger in the afternoons and therefore the noise in extraterrestrial signal determination is also larger compared to the mornings. This effect has been quantified in terms of reduction in the number of available accurate Langley plots: at Mauna Loa, a factor of 1.8 fewer afternoon Langley plots, and a smaller reduction (a factor of 1.2 fewer) is found at Izaña. It has also been found that fast variations in solar extraterrestrial irradiance, up to 0.5 % in a few weeks, are not easily detectable from the ground with this kind of instrument. Furthermore, more investigations are needed to explore whether the subtropical jet above Izaña is a possible explanation for the increase in the Langley plot residuals at this station during the spring months.
With this analysis we can conclude that the high-altitude stations Mauna Loa and Izaña meet the GAW-PFR and AERONET network requirements in terms of uncertainty, i.e., 0.2–0.5 % in calibration factors or 0.002–0.005 in AOD (for airmass =1). The long-term operation and maintenance of reference instruments at these unique locations is shown to be key in accurate aerosol monitoring worldwide. The stability of the reference instruments has also been proven to be very high, with signal losses due to degradation of optical components below 0.1 % per year over long periods.
Aerosol optical depth data of AERONET are available at https://aeronet.gsfc.nasa.gov (last access: 10 October 2018). Hourly GAW-PFR data can be found at the Global Atmospheric Watch, World Data Center for Aerosols (http://ebas.nilu.no, last access: 10 October 2018). GAW-PFR minute-based AODs and Langley analysis related data are available upon request.
The supplement related to this article is available online at: https://doi.org/10.5194/acp-18-14555-2018-supplement.
CT led the analysis and manuscript preparation. The GOA-UVa authors provided the CAELIS platform and analysis programs. NASA authors provided AERONET data and PMOD authors provided GAW-PFR and VIRGO data. All authors contributed to the scientific analysis, manuscript preparation and revision.
The authors declare that they have no conflict of interest.
The authors gratefully acknowledge the effort of NOAA and AEMET to maintain
the Mauna Loa and Izaña observatories. We thank the two site operators for
their efforts in day-to-day instrument maintenance over the years.
Manuel Antón and Diego Loyola provided the satellite data for the cloud
analysis. We thank Volker Freudenthaler for his advice on the error analysis.
This research has received funding from the European Union's Horizon 2020
Research and Innovation Programme under grant agreement no. 654109
(ACTRIS-2). The funding by MINECO (CTM2015-66742-R) and Junta de Castilla y
León (VA100P17) is also acknowledged.
Edited
by: Evangelos Gerasopoulos
Reviewed by: two anonymous
referees
Andrews, E., Ogren, J., Bonasoni, P., Marinoni, A., Cuevas, E., Rodríguez, S., Sun, J., Jaffe, D., Fischer, E., Baltensperger, U., Weingartner, E., Coen, M. C., Sharma, S., Macdonald, A., Leaitch, W., Lin, N.-H., Laj, P., Arsov, T., Kalapov, I., Jefferson, A., and Sheridan, P.: Climatology of aerosol radiative properties in the free troposphere, Atmos. Res., 102, 365–393, https://doi.org/10.1016/j.atmosres.2011.08.017, 2011. a
Ansmann, A., Petzold, A., Kandler, K., Tegen, I., Wendisch, M., Müller, D., Weinzierl, B., Müller, T., and Heintzenberg, J.: Saharan Mineral Dust Experiments SAMUM–1 and SAMUM–2: What have we learned?, Tellus B, 63, 403–429, 2011. a
Barreto, A., Cuevas, E., Damiri, B., Guirado, C., Berkoff, T., Berjón, A. J., Hernández, Y., Almansa, F., and Gil, M.: A new method for nocturnal aerosol measurements with a lunar photometer prototype, Atmos. Meas. Tech., 6, 585–598, https://doi.org/10.5194/amt-6-585-2013, 2013. a
Barreto, A., Cuevas, E., Pallé, P., Romero, P. M., Guirado, C., Wehrli, C. J., and Almansa, F.: Recovering long-term aerosol optical depth series (1976–2012) from an astronomical potassium-based resonance scattering spectrometer, Atmos. Meas. Tech., 7, 4103–4116, https://doi.org/10.5194/amt-7-4103-2014, 2014. a
Barreto, Á., Cuevas, E., Granados-Muñoz, M.-J., Alados-Arboledas, L., Romero, P. M., Gröbner, J., Kouremeti, N., Almansa, A. F., Stone, T., Toledano, C., Román, R., Sorokin, M., Holben, B., Canini, M., and Yela, M.: The new sun-sky-lunar Cimel CE318-T multiband photometer – a comprehensive performance evaluation, Atmos. Meas. Tech., 9, 631–654, https://doi.org/10.5194/amt-9-631-2016, 2016. a
Bodhaine, B. A., Mendonca, B. G., Harris, J. M., and Miller, J. M.: Seasonal variations in aerosols and atmospheric transmission at Mauna Loa Observatory, J. Geophys. Res.-Oceans, 86, 7395–7398, https://doi.org/10.1029/JC086iC08p07395, 1981. a, b
Bodhaine, B. A., Harris, J. M., Ogren, J. A., and Hofmann, D. J.: Aerosol optical properties at Mauna Loa Observatory: Long-range transport from Kuwait?, Geophys. Res. Lett., 19, 581–584, https://doi.org/10.1029/92GL00524, 1992. a
Box, M. A.: Finite bandwidth and scattered light effects on the radiometric determination of atmospheric turbidity and the solar constant, Appl. Opt., 20, 2215–2219, https://doi.org/10.1364/AO.20.002215, 1981. a
Cachorro, V. E., Romero, P. M., Toledano, C., Cuevas, E., and de Frutos, A. M.: The fictitious diurnal cycle of aerosol optical depth: A new approach for “in situ” calibration and correction of AOD data series, Geophys. Res. Lett., 31, L12106, https://doi.org/10.1029/2004GL019651, 2004. a
Campanelli, M., Nakajima, T., and Olivieri, B.: Determination of the solar calibration constant for a sun-sky radiometer: proposal of an in-situ procedure, Appl. Opt., 43, 651–659, https://doi.org/10.1364/AO.43.000651, 2004. a
Campanelli, M., Estellés, V., Tomasi, C., Nakajima, T., Malvestuto, V., and Martinez-Lozano, J. A.: Application of the SKYRAD improved Langley plot method for the in situ calibration of CIMEL sun-sky photometers, Appl. Optics, 46, 2688–2702, 2007. a
Carrillo, J., Guerra, J. C., Cuevas, E., and Barrancos, J.: Characterization of the Marine Boundary Layer and the Trade-Wind Inversion over the Sub-tropical North Atlantic, Bound.-Lay. Meteorol., 158, 311–330, https://doi.org/10.1007/s10546-015-0081-1, 2015. a
Cuevas, E., Camino, C., Benedetti, A., Basart, S., Terradellas, E., Baldasano, J. M., Morcrette, J. J., Marticorena, B., Goloub, P., Mortier, A., Berjón, A., Hernández, Y., Gil-Ojeda, M., and Schulz, M.: The MACC-II 2007–2008 reanalysis: atmospheric dust evaluation and characterization over northern Africa and the Middle East, Atmos. Chem. Phys., 15, 3991–4024, https://doi.org/10.5194/acp-15-3991-2015, 2015. a
Cuevas, E., Gómez-Peláez, A., Rodríguez, S., Terradellas, E., Basart, S., García, R., García, O., and Alonso-Pérez, S.: The pulsating nature of large-scale Saharan dust transport as a result of interplays between mid-latitude Rossby waves and the North African Dipole Intensity, Atmos. Environ., 167, 586–602, https://doi.org/10.1016/j.atmosenv.2017.08.059, 2017a. a
Cuevas, E., Milford, C., Bustos, J. J., del Campo-Hernández, R., García, O. E., García, R. D., Gómez-Peláez, A. J., Guirado-Fuentes, C., Marrero, C., Prats, N., Ramos, R., Redondas, A., Reyes, E., Rodríguez, S., Romero-Campos, P. M., Schneider, M., Belmonte, J., Yela, M., Almansa, F., Barreto, A., López-Solano, C., Basart, S., Terradellas, E., Afonso, S., Bayo, C., Berjón, A., Bethencourt, J., Carreño, V., Castro, N. J., Cruz, A. M., Damas, M., De Ory-Ajamil, F., García, M., Gómez-Trueba, V., González, Y., Hernández, C., Hernández, Y., Hernández-Cruz, B., Jover, M., León-Luís, S. F., López-Fernández, R., López-Solano, J., Rodríguez, E., Rodríguez-Franco, J. J., Rodríguez-Valido, M., Sálamo, C., Sanromá, E., Santana, D., Santo Tomás, F., Sepúlveda, E., Sierra, M., and Sosa, E.: Izaña Atmospheric Research Center Activity Report 2015–2016., Tech. rep., State Meteorological Agency of Spain (AEMET), Madrid, Spain and World Meteorological Organization, Geneva, Switzerland. (Eds.) Cuevas, E., Milford, C. and Tarasova, O. NIPO: 014-17-012-9, WMO/GAW Report No. 236, 2017b. a
Dubovik, O. and King, M.: A Flexible Inversion Algorithm for Retrieval of Aerosol Optical Properties from Sun and Sky Radiance Measurements., J. Geophys. Res., 105, 20673–20696, 2000. a
Dubovik, O., Sinyuk, A., Lapyonok, T., Holben, B. N., Mishchenko, M., Yang, P., Eck, T. F., Volten, H., Muñoz, O., Veihelmann, B., van der Zande, W. J., Léon, J.-F., Sorokin, M., and Slutsker, I.: Application of spheroid models to account for aerosol particle nonsphericity in remote sensing of desert dust, J. Geophys. Res., 111, D11208, https://doi.org/10.1029/2005JD006619, 2006. a
Dutton, E. G., Reddy, P., Ryan, S., and DeLuisi, J. J.: Features and effects of aerosol optical depth observed at Mauna Loa, Hawaii: 1982–1992, J. Geophys. Res.-Atmos., 99, 8295–8306, https://doi.org/10.1029/93JD03520, 1994. a
Eck, T. F., Holben, B. N., Reid, J. S., Dubovik, O., Smirnov, A., O'Neill, N. T., Slutsker, I., and Kinne, S.: The wavelength dependence of the optical depth of biomass burning, urban and desert dust aerosols., J. Geophys. Res., 104, 31333–31350, 1999. a
Forgan, B. W.: Bias in a solar constant determination by the Langley method due to structured atmospheric aerosol: comment, Appl. Opt., 27, 2546–2548, https://doi.org/10.1364/AO.27.002546, 1988. a
Forgan, B. W.: General method for calibrating Sun photometers, Appl. Opt., 33, 4841–4850, https://doi.org/10.1364/AO.33.004841, 1994. a
Fröhlich, C., Romero, J., Roth, H., Wehrli, C., Andersen, B. N., Appourchaux, T., Domingo, V., Telljohann, U., Berthomieu, B., Delache, P., Provost, J., Toutain, T., Crommelynck, D., Chevalier, A., Fichot, A., Däppen, W., Gough, D. O., Hoeksema, T., Jiménez-Gómez, M., Herreros, J., Roca-Cortés, T., Jones, A. R., Pap, J., and Willson, R. C.: VIRGO: Experiment for Helioseismology and Solar Irradiance Monitoring, Sol. Phys., 162, 101–128, 1995. a
Fuertes, D., Toledano, C., González, R., Berjón, A., Torres, B., Cachorro, V. E., and de Frutos, Á. M.: CÆLIS: software for assimilation, management and processing data of an atmospheric measurement network, Geosci. Instrum. Method. Data Syst., 7, 67–81, https://doi.org/10.5194/gi-7-67-2018, 2018. a
García, R. D., García, O. E., Cuevas, E., Cachorro, V. E., Barreto, A., Guirado-Fuentes, C., Kouremeti, N., Bustos, J. J., Romero-Campos, P. M., and de Frutos, A. M.: Aerosol optical depth retrievals at the Izaña Atmospheric Observatory from 1941 to 2013 by using artificial neural networks, Atmos. Meas. Tech., 9, 53–62, https://doi.org/10.5194/amt-9-53-2016, 2016. a
Guirado-Fuentes, C.: Caracterización de las propiedades de los aerosoles en columna en la región subtropical, PhD thesis, Universidad de Valladolid, 2015. a, b
Harrison, L. and Michalsky, J.: Objective algorithms for the retrieval of optical depths from ground-based measurements, APPLIED OPTICS, 33, 5126–5132, 1994. a
Herman, B. M., Box, M. A., Reagan, J. A., and Evans, C. M.: Alternate approach to the analysis of solar photometer data, Appl. Opt., 20, 2925–2928, 1981. a
Holben, B. N., Eck, T. F., Slutsker, I., Tanré, D., Buis, J. P., Setzer, A., Vermote, E., Reagan, J. A., Kaufman, Y. J., Nakajima, T., Lavenu, F., Jankowiak, I., and Smirnov, A.: AERONET – a federated instrument network and data archive for aerosol characterization, Remote Sens. Environ., 66, 1–16, 1998. a, b, c, d, e
Holben, B. N., Eck, T. F., Slutsker, I., Smirnov, A., Sinyuk, A., Schafer, J., Giles, D., and Dubovik, O.: Aeronet's Version 2.0 quality assurance criteria, Proc. SPIE, 6408, 64080Q8, https://doi.org/10.1117/12.706524, 2006. a
Hyslop, N., Trzepla, K., Wallis, C., Matzoll, A., and White, W.: Technical note: A 23-year record of twice-weekly aerosol composition measurements at Mauna Loa Observatory, Atmos. Environ., 80, 259–263, 2013. a
Kazadzis, S.: WMO/GAW Aerosol Measurement Procedures, Guidelines and Recommendations, 2nd Edition, Tech. rep., World Meteorological Organization, 2016. a, b, c
Kazadzis, S., Veselovskii, I., Amiridis, V., Gröbner, J., Suvorina, A., Nyeki, S., Gerasopoulos, E., Kouremeti, N., Taylor, M., Tsekeri, A., and Wehrli, C.: Aerosol microphysical retrievals from precision filter radiometer direct solar radiation measurements and comparison with AERONET, Atmos. Meas. Tech., 7, 2013-2025, https://doi.org/10.5194/amt-7-2013-2014, 2014. a
Kazadzis, S., Kouremeti, N., Gröbner, J., and Cuevas, E.: Comparisons of Aerosol Optical Depth measurements from different global Networks: the 4th filter radiometer comparison, in: CIMO TECO 2016, Instruments and Observing Methods Report No. 125, 2016. a
Kazadzis, S., Kouremeti, N., Diémoz, H., Gröbner, J., Forgan, B. W., Campanelli, M., Estellés, V., Lantz, K., Michalsky, J., Carlund, T., Cuevas, E., Toledano, C., Becker, R., Nyeki, S., Kosmopoulos, P. G., Tatsiankou, V., Vuilleumier, L., Denn, F. M., Ohkawara, N., Ijima, O., Goloub, P., Raptis, P. I., Milner, M., Behrens, K., Barreto, A., Martucci, G., Hall, E., Wendell, J., Fabbri, B. E., and Wehrli, C.: Results from the Fourth WMO Filter Radiometer Comparison for aerosol optical depth measurements, Atmos. Chem. Phys., 18, 3185–3201, https://doi.org/10.5194/acp-18-3185-2018, 2018a. a
Kazadzis, S., Kouremeti, N., Nyeki, S., Grö bner, J., and Wehrli, C.: The World Optical Depth Research and Calibration Center (WORCC) quality assurance and quality control of GAW-PFR AOD measurements, Geosci. Instrum. Method. Data Syst., 7, 39-53, https://doi.org/10.5194/gi-7-39-2018, 2018b. a, b
Kiedron, P. W. and Michalsky, J. J.: Non-parametric and least squares Langley plot methods, Atmos. Meas. Tech., 9, 215–225, https://doi.org/10.5194/amt-9-215-2016, 2016. a
Kim, S.-W., Yoon, S.-C., Dutton, E. G., Kim, J., Wehrli, C., and Holben, B. N.: Global Surface-Based Sun Photometer Network for Long-Term Observations of Column Aerosol Optical Properties: Intercomparison of Aerosol Optical Depth, Aerosol Sci. Tech., 42, 1–9, https://doi.org/10.1080/02786820701699743, 2008. a
Le Blancq, F.: Diurnal pressure variation: the atmospheric tide, Weather, 66, 306–307, https://doi.org/10.1002/wea.857, 2011. a
Loyola R., D. G., Thomas, W., Spurr, R., and Mayer, B.: Global patterns in daytime cloud properties derived from GOME backscatter UV-VIS measurements, Int. J. Remote Sens., 31, 4295–4318, 2010. a, b
Marenco, F.: On Langley plots in the presence of a systematic diurnal aerosol cycle centered at noon: A comment on recently proposed methodologies, J. Geophys. Res.-Atmos., 112, D06205, https://doi.org/10.1029/2006JD007248, 2007. a, b
Nakajima, T., Tonna, G., Rao, R., Boi, P., Kaufman, Y., and Holben, B.: Use of sky brightness measurements from ground for remote sensing of particulate polydispersions, Appl. Optics, 35, 2672–2686, 1996. a
O'Neill, N. T., Ignatov, A., Holben, B. N., and Eck, T. F.: The lognormal distribution as a reference for reporting aerosol optical depth statistics; Empirical tests using multi-year, multi-site AERONET sunphotometer data, J. Geophys. Res., 27, 3333–3336, 2000. a
Perry, K. D., Cahill, T. A., Schnell, R. C., and Harris, J. M.: Long-range transport of anthropogenic aerosols to the National Oceanic and Atmospheric Administration baseline station at Mauna Loa Observatory, Hawaii, J. Geophys. Res.-Atmos., 104, 18521–18533, https://doi.org/10.1029/1998JD100083, 1999. a
Prospero, J. M., Schmitt, R., Cuevas, E., Savoie, D. L., Graustein, W. C., Turekian, K. K., Volz-Thomas, A., Díaz, A., Oltmans, S. J., and Levy, H.: Temporal variability of summer-time ozone and aerosols in the free troposphere over the eastern North Atlantic, Geophys. Res. Lett., 22, 2925–2928, https://doi.org/10.1029/95GL02791, 1995. a
Reagan, J. A., Thomason, L. W., Herman, B. M., and Palmer, J. M.: Assessment of Atmospheric Limitations on the Determination of the Solar Spectral Constant from Ground-Based Spectroradiometer Measurements, IEEE T. Geosci. Remote, GE-24, 258–266, https://doi.org/10.1109/TGRS.1986.289645, 1986. a, b
Rodríguez, S., Alastuey, A., Alonso-Pérez, S., Querol, X., Cuevas, E., Abreu-Afonso, J., Viana, M., Pérez, N., Pandolfi, M., and de la Rosa, J.: Transport of desert dust mixed with North African industrial pollutants in the subtropical Saharan Air Layer, Atmos. Chem. Phys., 11, 6663–6685, https://doi.org/10.5194/acp-11-6663-2011, 2011. a
Rodríguez-Franco, J. J. and Cuevas, E.: Characteristics of the subtropical tropopause region based on long-term highly resolved sonde records over Tenerife, J. Geophys. Res., 118, 10754–10769, 2013. a
Russell, P. B., Livingston, J. M., Pueschel, R. F., Reagan, J. A., Browell, E. V., Toon, G. C., Newman, P. A., Schoeberl, M. R., Lait, L. R., Pfister, L., Gao, Q., and Herman, B. M.: Post-Pinatubo optical depth spectra vs. latitude and vortex structure: Airborne tracking sunphotometer measurements in AASE II, Geophys. Res. Lett., 20, 2571–2574, https://doi.org/10.1029/93GL03006, 1993. a, b
Schmid, B. and Wehrli, C.: Comparison of sunphotometer calibration by Langley technique and standard lamp, Appl. Opt., 34, 4500–4512, 1995. a
Shaw, G.: Error analysis of multi-wavelength sun photometry, Pure Appl. Geophys., 114, 1–14, 1976. a
Shaw, G. E.: Aerosols at Mauna Loa: Optical Properties, J. Atmos. Sci., 36, 862–869, 1979. a
Shaw, G. E.: Sun photometry, Bull. Am. Meteorol. Soc., 64, 4–10, 1983. a
Slusser, J., Gibson, J., Bigelow, D., Kolinski, D., Disterhoft, P., Lantz, K., and Beaubien, A.: Langley method of calibrating UV filter radiometers, J. Geophys. Res.-Atmos., 105, 4841–4849, https://doi.org/10.1029/1999JD900451, 2000. a
Smirnov, A., Holben, B. N., Eck, T. F., Dubovik, O., and Slutsker, I.: Cloud-Screening and Quality Control Algorithms for the AERONET Database, Remote Sens. Environ., 73, 337–349, 2000. a
Thomason, L. W., Herman, B. M., Schotland, R. M., and Reagan, J. A.: Extraterrestrial solar flux measurement limitations due to a Beer's law assumption and uncertainty in local time, Appl. Opt., 21, 1191–1195, https://doi.org/10.1364/AO.21.001191, 1982. a
Thomason, L. W., Herman, B. M., and Reagan, J. A.: The Effect of Atmospheric Attenuators with Structured Vertical Distributions on Air Mass Determinations and Langley Plot Analyses, J. Atmos. Sci., 40, 1851–1854, 1983. a
Toledano, C., Cachorro, V. E., de Frutos, A. M., Sorribas, M., Prats, N., and de la Morena, B. A.: Inventory of African desert dust events over the southwestern Iberian Peninsula in 2000–2005 with an AERONET Cimel Sun photometer, J. Geophys. Res., 112, D21201, https://doi.org/10.1029/2006JD008307, 2007. a
Wehrli, C.: GAW–PFR: A network of Aerosol Optical Depth observations with Precision Filter Radiometers. In: WMO/GAW Experts workshop on a global surface based network for long term observations of column aerosol optical properties, Tech. rep., GAW Report No. 162, WMO TD No. 1287, http://library.wmo.int/pmb_ged/wmo-td_1287.pdf, 2005. a, b
Wehrli, C. J.: Remote Sensing of Aerosol Optical Depth in a global surface network, PhD thesis, ETH ZURICH, 2008. a
This differs from the air mass range used in AERONET for Langley calibrations, i.e., 5 to 2, and 4 to 2 for the two UV channels (380 and 340 nm), thereby avoiding errors in optical air mass determination that increase significantly at larger air mass (Russell et al., 1993).
The Type A evaluation of standard uncertainty may be based on any valid statistical method for treating data (https://physics.nist.gov/cuu/Uncertainty/index.html, last access: 1 October 2018). Standard uncertainty refers to the uncertainty for a coverage interval of 68 % (±1 standard deviation, k=1), whereas expanded uncertainty, k=2, for a normal distribution corresponds to a coverage interval of approximately 95 %.
These are Type B uncertainty estimates, not based on the statistical analysis of series of observations.