the Creative Commons Attribution 4.0 License.
the Creative Commons Attribution 4.0 License.
 | 04 Oct 2018
Effects of mixing state on optical and radiative properties of black carbon in the European Arctic
Paolo Laj
Martin Gysel
Urs Baltensperger
Stergios Vratolis
Konstantinos Eleftheriadis
Yutaka Kondo
Philippe Dubuisson
Victor Winiarek
Stelios Kazadzis
Peter Tunved
Hans-Werner Jacobi
Atmospheric aging promotes internal mixing of black carbon (BC), leading to an enhancement of light absorption and radiative forcing. The relationship between BC mixing state and consequent absorption enhancement was never estimated for BC found in the Arctic region. In the present work, we aim to quantify the absorption enhancement and its impact on radiative forcing as a function of microphysical properties and mixing state of BC observed in situ at the Zeppelin Arctic station (78∘ N) in the spring of 2012 during the CLIMSLIP (Climate impacts of short-lived pollutants in the polar region) project.
Single-particle soot photometer (SP2) measurements showed a mean mass concentration of refractory black carbon (rBC) of 39 ng m−3, while the rBC mass size distribution was of lognormal shape, peaking at an rBC mass-equivalent diameter (DrBC) of around 240 nm. On average, the number fraction of particles containing a BC core with DrBC>80 nm was less than 5 % in the size range (overall optical particle diameter) from 150 to 500 nm. The BC cores were internally mixed with other particulate matter. The median coating thickness of BC cores with 220 nm < DrBC< 260 nm was 52 nm, resulting in a core–shell diameter ratio of 1.4, assuming a coated sphere morphology. Combining the aerosol absorption coefficient observed with an Aethalometer and the rBC mass concentration from the SP2, a mass absorption cross section (MAC) of 9.8 m2 g−1 was inferred at a wavelength of 550 nm. Consistent with direct observation, a similar MAC value (8.4 m2 g−1 at 550 nm) was obtained indirectly by using Mie theory and assuming a coated-sphere morphology with the BC mixing state constrained from the SP2 measurements. According to these calculations, the lensing effect is estimated to cause a 54 % enhancement of the MAC compared to that of bare BC particles with equal BC core size distribution. Finally, the ARTDECO radiative transfer model was used to estimate the sensitivity of the radiative balance to changes in light absorption by BC as a result of a varying degree of internal mixing at constant total BC mass. The clear-sky noontime aerosol radiative forcing over a surface with an assumed wavelength-dependent albedo of 0.76–0.89 decreased, when ignoring the absorption enhancement, by −0.12 W m−2 compared to the base case scenario, which was constrained with mean observed aerosol properties for the Zeppelin site in Arctic spring. The exact magnitude of this forcing difference scales with environmental conditions such as the aerosol optical depth, solar zenith angle and surface albedo. Nevertheless, our investigation suggests that the absorption enhancement due to internal mixing of BC, which is a systematic effect, should be considered for quantifying the aerosol radiative forcing in the Arctic region.
- Article
(939 KB) - Full-text XML
-
Supplement
(384 KB) - BibTeX
- EndNote


In the late winter, favorable transport pathways and scarce removal mechanisms lead to an enhancement of aerosol concentration in the Arctic, well known as the Arctic haze (Barrie, 1986; Shaw, 1995). The aerosol population of the Arctic haze is mainly composed of sulfate, organic matter, ammonium, nitrate, mineral dust and black carbon (BC) (Quinn et al., 2007). BC, emitted by incomplete combustion of fossil fuels, biofuels and biomass, is of particular interest as it is mainly of anthropogenic origin and dominates light absorption by atmospheric aerosols, causing a positive radiative forcing (Bond et al., 2013) on a global scale. In the Arctic, BC influences the energy budget by altering the radiative properties of clouds, absorbing the solar radiation in the atmosphere and darkening the snow surface (i.e., Flanner, 2013; Quinn et al., 2015; Mahmood et al., 2016; Sand et al., 2016). The combination of these three forcing mechanisms makes the Arctic more vulnerable to climate change and contributes to what is now called “Arctic amplification”. However the aforementioned effects depend on the absolute atmospheric BC mass concentration, which varies between 20 and 80 ng m−3 in late winter–early spring and less than 10 ng m−3 in summer (typical values from several Arctic sites; AMAP report, 2015). The degree of the BC radiative forcing further depends on its optical properties, which change during atmospheric ageing processes of BC. As a consequence of long-range transport, BC observed in the Arctic is typically heavily processed and a significant amount of internally mixed BC may be found (Yamanouchi et al., 2005). The presence of a coating on the BC cores is expected to enhance light absorption between 30 % and 50 % (Bond et al., 2006; Schwarz et al., 2008a) due to the so-called lensing effect. Adachi et al. (2010) showed that this effect enhances the global radiative forcing of BC by ∼70 % compared to scenarios neglecting this enhancement. Nevertheless, the magnitude of the light absorption enhancement remains controversial (Lack et al., 2009; Cappa et al., 2012) and affected by large uncertainty associated with the assumptions of mixing geometry (Adachi et al., 2010), morphology (Scarnato et al., 2013) and accuracy in coating thickness quantification.
Presently, the optical properties of BC in the Arctic atmosphere and its size distribution and mixing state are poorly characterized. During the CLIMSLIP (Climate impacts of short-lived pollutants in the Arctic) project, we addressed this gap with dedicated in situ measurements of BC properties including mixing state and mass absorption cross section during Arctic haze conditions at the Zeppelin station during springtime. This allowed quantification of the absorption enhancement via comparison with observationally constrained optical modeling. Finally, the resulting impact of BC mixing state on its radiative forcing was assessed using a 1-D radiative transfer model.
2.1 Sampling site and meteorology
The CLIMSLIP field experiment took place between 22 March and 11 April 2012. The instrumentation was deployed at the Zeppelin station (475 m a.s.l.; 78∘54′ N, 11∘53′ E), Svalbard, Norway. The site is representative of European Arctic background and, in spring during the Arctic haze period, is mainly influenced by long-range transport over the Arctic Ocean from Siberia, Eurasia and the European subcontinent (Tunved et al., 2013). Moreover, local anthropogenic emissions rarely reach the site (Beine et al., 1999; Ström et al., 2003). The CLIMSLIP campaign was characterized by anticyclonic conditions leading to the dominance of clear-sky conditions; only a few and weak snow precipitation events on the 23–24 and 29–30 March were observed. The wind direction was dominated by northerly winds with less frequent southerly inclusions. Back-trajectory analysis, performed with the NOAA HYSPLIT model, showed that the air masses reaching Svalbard during the CLIMSLIP campaign mainly originated from high latitudes (>70∘ N) with basically no influence from Europe and relatively low influence from northern Siberia (Fig. S1 in the Supplement).
2.2 Instrumental deployment for black carbon mass, size distribution and mixing state measurements
2.2.1 The single-particle soot photometer
The single-particle soot photometer (SP2, eight-channel, Droplet Measurement Technologies, Longmont, CO, USA) was used to determine concentration, size distribution and coating thickness of BC at the Zeppelin site. The operation principles are given by Stephens et al. (2003), Schwarz et al. (2006), and Moteki and Kondo (2010). Briefly, the SP2 is based on the laser-induced incandescence technique: the particles are directed through an intra-cavity Nd:YAG continuous-wave laser beam at a wavelength of 1064 nm, in which light-absorbing particles are heated. BC-containing particles reach incandescence, and the peak intensity of the emitted thermal radiation, which occurs when the boiling point temperature of BC is reached, is proportional to the BC mass contained in the particle. Hereafter we follow the recommendation of Petzold et al. (2013) and use the term refractory black carbon (rBC) whenever referring to BC quantified with laser-induced incandescence and use the term mrBC whenever referring to the rBC mass concentration. All other particulate matter that may be internally mixed with a BC core evaporates at temperatures below the boiling point of BC such that no interference occurs in the quantification of the rBC mass. The SP2 has a detection efficiency of unity between 0.48 and 207 fg of rBC mass, which reflects the lower and upper limits of quantification on a single-particle basis. The rBC number and mass size distribution are commonly expressed as a function of rBC mass-equivalent diameter (DrBC), calculated using a void-free material density of 1800 kg m−3. The above limits of quantification translate to 80 nm < DrBC< 604 nm. Lognormal fit to the measured rBC mass size distribution is used to correct for rBC mass in BC cores with sizes outside these detection limits (see Sect. 3.2.1).
Optical particle sizing is based on the collection of elastically scattered laser light at 1064 nm. For BC-free particles, which do not evaporate in the laser beam, the peak scattering intensity is translated to an optical diameter using a refractive index (RI) of 1.5 and assuming spherical particle shape. The optical diameter (Dopt) detection range of BC-free particles is from 150 to 500 nm. The optical sizing of BC-containing particles, which evaporate within the laser beam, is more complicated: we used a slightly modified version of the leading-edge-only (LEO) approach described by Gao et al. (2007) as implemented by Laborde et al. (2012a). This makes it possible to determine the optical size of particles at any position in the laser beam. The particle retains its original size in the leading edge of the Gaussian laser beam before evaporation onset. The optical size of the whole particle was inferred from the leading-edge scattering signal using Mie theory, assuming concentric-sphere morphology of the BC core and non-refractory coating, and was finally called DShell.
Thereby refractive indices of 1.5–0i and 2.26–1.26i, specific for the Nd : YAG laser operating wavelength (1064 nm), were used for the coating and BC core, respectively (Moteki et al., 2010). Using this RI for BC in the SP2 data analysis results in consistency between the rBC mass-equivalent diameter and the optical diameter of the bare BC core just before incandescence, thereby assuring minimal systematic bias in retrieved coating thickness values. The “coated sphere equivalent coating thickness”, hereafter simply referred to as coating thickness, is calculated as the difference of the optical radius of the whole BC-containing particle and the radius of the rBC core. The relative precision of SP2-derived coating thickness is ±17 % (unit-to-unit variability as determined by Laborde et al., 2012b). Accuracy of absolute values depends on consistency between SP2 calibrations and assumed refractive indices. This was checked by comparing the rBC mass-equivalent diameter with the optical diameter of the bare BC core just before incandescence as discussed above, which indicates that potential systematic biases are not greater than the above precision.
The SP2 calibration for the incandescence signal was performed in situ using size-selected fullerene particulate (Alfa Aesar; no. FS12S011). The scattering detector was calibrated in situ with spherical polystyrene latex size standards of 200, 220 and 269 nm in diameter (Thermo Scientific, formerly Duke Scientific). The scattering signal at incandescence signal onset, which is after evaporation of coatings but before onset of BC evaporation, was compared against the incandescence signal to verify that the measured coating thickness is unbiased for uncoated BC when applying the calibrations and BC RI as described above. A complete description of the calibration setup, calibration materials and operation principles can be found in Moteki and Kondo (2010), Gysel et al. (2011), Baumgardner et al. (2012), and Laborde et al. (2012a, b).
2.2.2 The continuous soot monitoring system
The continuous soot monitoring system (COSMOS, Kanomax, Osaka, Japan) is a single-wavelength photometer measuring the light attenuation through a filter collecting the aerosol sample (Miyazaki et al., 2008). A key difference to other aerosol absorption photometers is the heated inlet, which is operated at a temperature of 400 ∘C in order to remove volatile particles and non-refractory coatings from BC cores. As a consequence, the mass attenuation cross section (10 m2 g−1) of the denuded BC deposited on the filter is largely independent of the original BC mixing state, reducing the uncertainty of BC mass inferred from light attenuation without the need for site, air origin or seasonal-dependent correction factors (Kondo et al., 2009). However, the conversion factor between attenuation coefficient and BC mass remains weakly influenced by the deepness at which particles are deposited in the filter. A correction for this effect, which depends on the BC core size distribution, was developed by Nakayama et al. (2010) and applied in this work. This approach with a stabilized mass attenuation cross section makes COSMOS-derived BC mass much more accurate than traditional filter-based measurements of equivalent BC mass (Petzold et al., 2013).
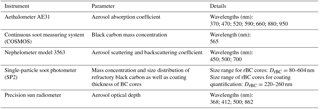
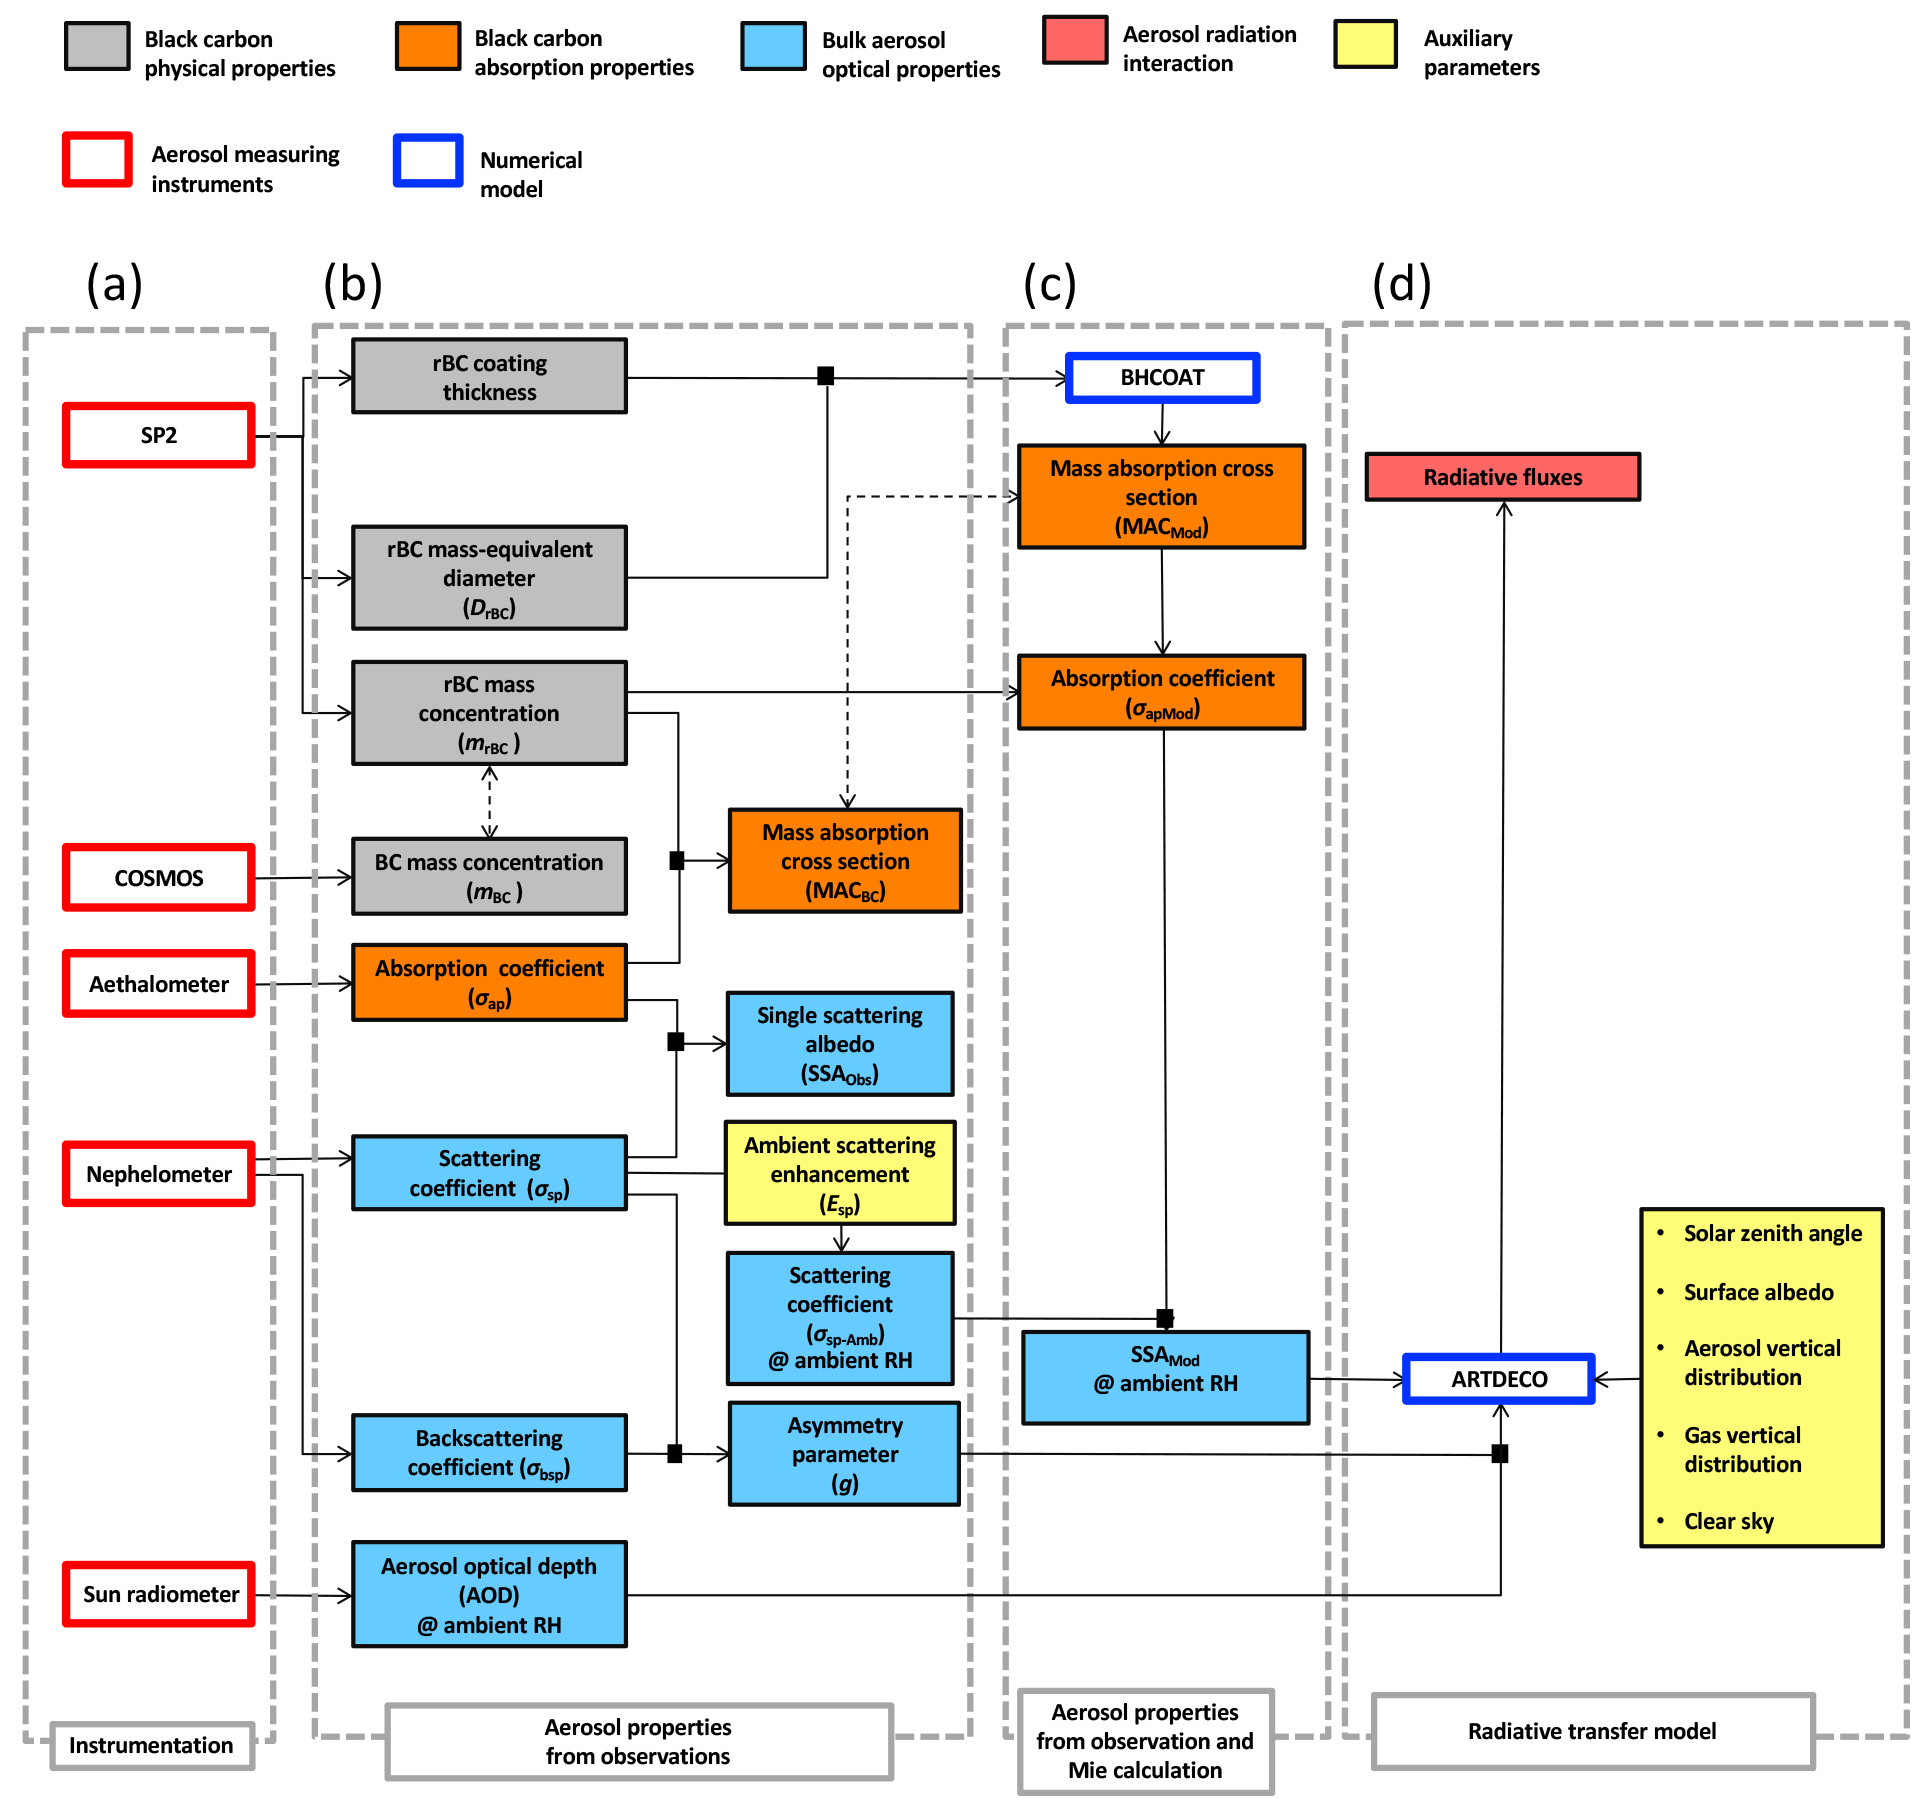
Figure 1Flow chart from observations to radiative forcing: (a) deployed instruments; (b) observed properties; (c) properties obtained from optical model constrained by observations; (d) radiative transfer model simulations. Measurements and quantities are generally for low RH (“dry”), unless “@ ambient RH” is explicitly stated.
2.3 Experimental and data analysis approaches for aerosol optical properties
Data from several instruments were used to characterize the optical properties of the total aerosol: a nephelometer (model 3563, TSI Inc., St. Paul, MN, USA), a seven-wavelength Aethalometer (model AE31, Magee Scientific Corporation, Berkeley, CA, USA) and a sun precision filter radiometer. The complete list of instruments used in this work with measured and derived parameters is presented in Table 1 and schematized in Fig. 1a, b. The nephelometer was used to monitor the aerosol total scattering (σsp) and hemispheric back scattering (σbsp) coefficients under dry conditions (RH < 20 %) at three different wavelengths (450, 500 and 700 nm). A full characterization of the nephelometer and the correction procedure for truncation error applied in this work is given by Anderson and Ogren (1998) and Müller et al. (2009). Combining σsp and σbsp, it was possible to derive the asymmetry parameter (g), which describes the angular distribution of diffused light and is an important input parameter for radiative transfer simulations. Here the asymmetry parameter is calculated applying the Henyey–Greenstein approximation, which parameterizes g as a function of the fraction of backscattered light (Wiscombe and Grams, 1976). It was shown that this approximation is appropriate for a submicron aerosol population and thus suitable for our purposes (Fiebig et al., 2005; Andrews et al., 2006).
The Aethalometer was used to monitor the aerosol light absorption coefficient (σap) at seven wavelengths between 370 and 950 nm. The AE31 collects the aerosol on a filter sampling air from a vertical duct at a 90∘ angle through a 1∕4 in. counterflow inlet with the instrument intake flow velocity imposing an 8 µm 50 % cutoff diameter. This photometer measures light attenuation (ATN) through a filter while the aerosol sample is deposited on the filter (Hansen et al., 1984). The raw attenuation coefficient (σATN) is defined as
where ΔATN is the change in attenuation over a time interval Δt, A is the area of the aerosol sample collection spot on the filter and Q is the sampling flow rate. The attenuation coefficient is approximately proportional to the absorption coefficient; however, the relationship becomes increasingly non-linear with increasing loading due to “shadowing effects” (Weingartner et al., 2003). The proportionality factor, C value (C), between loading-corrected attenuation coefficient and true aerosol absorption coefficient is greater than unity as the light absorption by the aerosol deposited in the filter is enhanced due to multiple scattering of the transmitted light within the filter matrix (Weingartner et al., 2003). The absorption coefficient (σap) is calculated from the raw attenuation coefficient using
where R accounts for the loading correction as a function of attenuation (Weingartner et al., 2003). Although applied here, the loading correction is not a significant source of uncertainty for absorption determination at long wavelengths and observations in the Arctic (Backman et al., 2017b). The C value, which depends on aerosol properties in a complex manner, can be determined if the true absorption coefficient is known. As no absorption reference instrument is available in this study, we use a fixed C value of 3.1 as determined by Backman et al. (2017a) for Aethalometers operated at multiple low-elevation sites in the Arctic region 1. The applied C value of 3.1 might not represent the actual C value at the Zeppelin site during our campaign, thus potentially causing systematic errors. Choosing a C value of 3.5 instead, as recommended by the Global Atmosphere Watch Program based on data from multiple European background sites (WMO, 2016; Zanatta et al., 2016), would result in a systematic reduction of resulting absorption coefficients and MAC values by 13 %. Furthermore, the variability in the C value at the European background sites was reported to be ±25 % around the recommended mean. Assuming that this range matches the potential variations in the actual C value at the Zeppelin site provides uncertainties of −29 % and +18 % associated with the Aethalometer derived absorption coefficients.
The single-scattering albedo (SSA), which is defined as
describes if the aerosol extinction coefficient (sum of scattering coefficient σsp and absorption coefficient σap) is dominated by light scattering or absorption. The SSA is one of the key parameters determining whether the aerosols have a warming or cooling effect.
The aerosol optical depth (AOD) at wavelengths of 368, 412, 500 and 862 nm was monitored by means of a sun precision filter radiometer. Each year, during wintertime, the instrument is calibrated at the World Optical Depth Research and Calibration Center of Davos. The AOD is used to assess the total aerosol load integrated over the vertical column. Additionally, information about the aerosol size distribution can be derived from the wavelength dependence of AOD. This dependency is parameterized using the Ångström exponent of the AOD (αAOD), where αAOD for a wavelength pair λ1 and λ2 is defined as
and the Ångström exponent difference (Δα), which is defined as
The mass absorption cross section (MAC) of a certain component of particulate matter is defined as the contribution of this component to the aerosol absorption coefficient divided by its mass concentration, which translates to
for BC aerosol, where mBC stands for mass concentration of BC. In our work we use mrBC from the SP2 for the BC mass concentration and the total aerosol absorption coefficient measured by the Aethalometer for a certain wavelength. Thus, we use the specific term MACrBC for the measured MAC of BC.
2.4 Optical and radiative modeling tools
2.4.1 Mie theory calculations
The influence of observed coatings of BC-containing particles on MAC was investigated from a theoretical point of view using Mie theory. Calculations were performed by means of the “BHCOAT” code (Bohren and Huffman, 1998), which is a numerical implementation of Mie theory. The BC-containing particles are assumed to have concentric-sphere morphology with a spherical BC core embedded in a shell of the internally mixed non-absorbing material. The coating thickness is defined as the thickness of the coating layer, i.e., the difference between the radii of the whole particle and the BC core (consistent with the definition in Sect. 2.2.1). The RI of the BC core was assumed to be 1.95–0.79i at a wavelength of 550 nm (Bond and Bergstrom, 2006). For the same wavelength, an RI of 1.55– was assumed for the coating material, which corresponds to a mixture of virtually non-light-absorbing organics and inorganics (Bond et al., 2006). The BC core size and coating thickness, both required to perform the Mie calculations, were inferred from the SP2 measurements (Sect. 2.2.1, Fig. 1c). The enhancement factor of light absorption of BC (EMAC) due to the lensing effect is defined as the ratio between the MAC calculated for BC with a certain core size and coating thickness over the MAC calculated with the same BC core in bare from, i.e., without coating.
2.4.2 ARTDECO radiative transfer model
Radiative transfer simulations were conducted in order to quantify the effects of different BC mixing state scenarios on atmospheric radiation fluxes following the schematic shown in Fig. 1d. The radiative forcing due to the aerosol–radiation interaction (RFARI) for a certain aerosol scenario was estimated as the difference between the net radiative fluxes (ΔFlux) at the top of the atmosphere (TOA) for simulations including aerosol and gases and simulations in which the aerosol was ignored :
Note, this definition of radiative forcing agrees with the definition by Stamnes et al. (2017) whereas it differs from the definition of the Intergovernmental Panel on Climate Change (Myhre et al., 2013). More details on this topic will be provided in Sect. 3.4.2. We used the Atmospheric Radiative Transfer Database for Earth Climate Observation model (ARTDECO), which is developed and maintained at the Laboratoire d'Optique Atmospheìrique (LOA), distributed by the data center AERIS/ICARE (http://www.icare.univ-lille1.fr/projects/artdeco, last access: 26 September 2018) and supported by CNRS / Lille University and CNES (TOSCA program). In the present study, the one-dimensional discrete model (1-D – DISORT2.1) was chosen as the radiative transfer equation solver (RTE solver). It is a scalar RTE solver based on the discrete ordinate method (Stamnes et al., 1988) and was used here to compute radiative fluxes between 400 and 840 nm (the spectral domain was reduced due to the limited spectral coverage of our optical measurements) for a fixed zenith angle of 77∘ (averaged solar zenith angle at 12:00 UTC for the Zeppelin station during the CLIMSLIP campaign). Some main assumptions were applied to describe environmental conditions. All simulations were run for clear-sky conditions. The surface was considered to be Lambertian with a wavelength-dependent surface albedo, varying from 0.887 at a wavelength of 400 nm to 0.763 at a wavelength of 800 nm. This choice is representative of a snow-covered ground. The radiative transfer code considers scattering and absorption by the gases carbon dioxide, water vapor and ozone. We used the vertical distribution considered to be representative for the Arctic region, which was developed for the MIPAS instrument on the ENVISAT space platform.
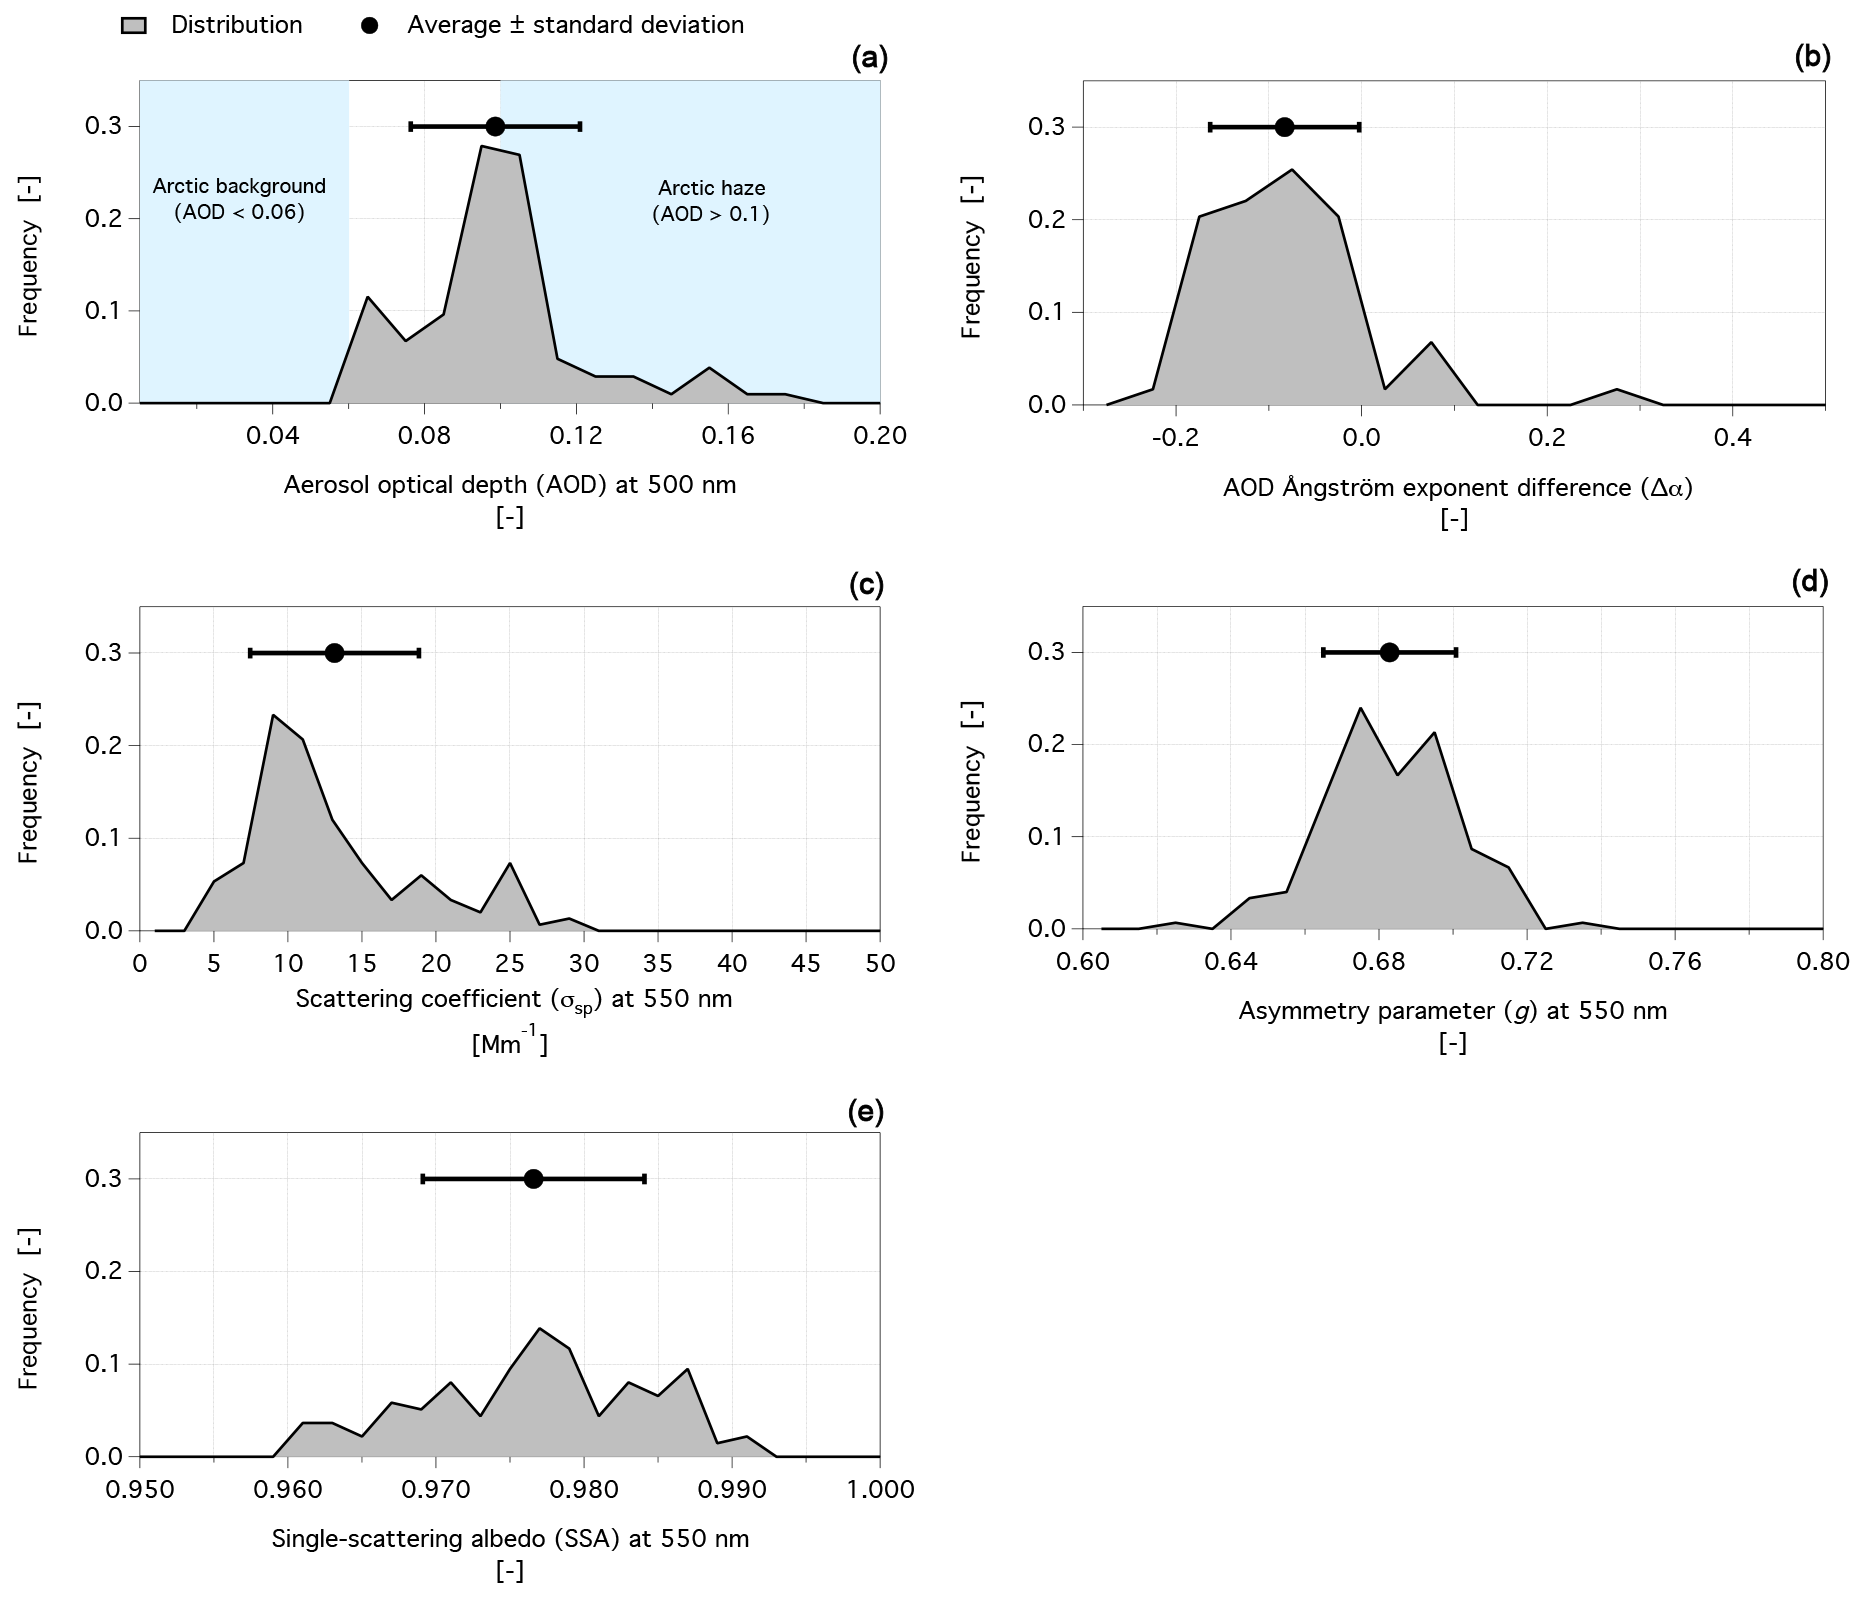
Figure 2Histograms of main aerosol properties calculated from 2 h averages. (a) Aerosol optical depth (AOD) at 500 nm, where AOD values >0.1 and <0.06 represent haze and background conditions, respectively (Yamanouchi et al., 2005); (b) difference of Ångström exponent (Δα) of AOD between 675–862 and 412–675 nm; (c) asymmetry parameter (g) of the dry aerosol at 550 nm; (e) single-scattering albedo (SSA) of the dry aerosol at 550 nm.
ARTDECO further requires various aerosol optical properties as input (see schematic in Fig. 1). The total aerosol burden is provided in the form of AOD at 550 nm wavelength, which was obtained by interpolating the sun radiometer AOD measurements at 368, 412, 500 and 862 nm. Then, ARTDECO internally adjusts the AOD provided at 550 nm to other wavelengths using the wavelength dependence of aerosol extinction. Extinction was calculated as the sum of the absorption- and humidity-corrected scattering coefficients and provided as model input at the wavelengths 370, 550 and 880 nm. The aerosol population was assumed to be confined between 0 and 1 km above ground and chosen to match the AOD. The SSA and asymmetry parameter are provided as input to ARTDECO for the wavelengths 370, 550 and 880 nm, as inferred from interpolated or extrapolated aerosol measurements and Mie calculations. More detail is provided in Sect. 3.4.1, specifically on the relative humidity (RH) dependence of aerosol optical properties and the approach to simulating the effects of different BC mixing state scenarios.
Figure 3(a) Mass size distribution of rBC cores; (b) frequency distribution of 2 h average rBC mass concentration values.
3.1 Aerosol optical properties
Here we present an optical characterization of the total aerosol at the Zeppelin station during the Arctic haze 2012 period. All measurements, excluding AOD, were made at RH <20 %, thus representing dry aerosol properties. The AOD was 0.097 on average with a standard deviation (SD) of 0.022 (Fig. 2a), indicating a low aerosol burden consistent with previous Arctic AOD observations (Yamanouchi et al., 2005; Hoffmann et al., 2009). Following the work of Yamanouchi et al. (2005), AOD (500 nm) values >0.1 and <0.06 are considered to represent Arctic haze and background conditions, respectively. Applying these thresholds for the CLIMSLIP 2012 experiments, the AOD measurements indicated that Arctic haze occurred 44 % of time and that the haze threshold was almost reached (0.09< AOD <0.1) during another 28 % of time, while background conditions did not occur at all. Although smoke events are known to occasionally enhance the total aerosol load up to AOD values between 0.3 and 0.7 (Treffeisen et al., 2007), we did not observe AOD values higher than 0.2. The dry aerosol scattering coefficient was 13.1±5.72 Mm−1 (mean ± SD) at 550 nm (Fig. 2c). This is close to previous measurements during Arctic haze at the Zeppelin station (9.8 Mm−1; Yamanouchi et al., 2005) but lower compared to previously observed biomass burning events (55 Mm−1; Moroni et al., 2017). Both observed AOD and scattering coefficients suggest that the measurement campaign was largely influenced by Arctic haze conditions with no influence of intense pollution events.
Qualitative information on the aerosol size distribution shape can be obtained from αAOD, Δα and g. The averaged αAOD, calculated between 412 and 675 nm, was observed to be 1.4±0.22 (mean ± SD). This suggests the presence of particles in the supermicron diameter range, as αAOD decreases from a value of 4 in the Rayleigh regime to a value of 0 in the geometric regime. Most observed Δα values were found to be negative (90 % of all data points; Fig. 2b), despite considerable uncertainty at low AOD (Gobbi et al., 2007). According to Kaufman (1993), negative ΔαΔα values indicate that the aerosol population is dominated by particles in the fine mode, while positive values would indicate that both fine and coarse modes give a distinct contribution to AOD. Thus, combined interpretation of αAOD and Δα values suggests that the fine-mode aerosol dominates over a minor coarse mode. A similar conclusion was deduced from the observed asymmetry parameter values: g at 550 nm was 0.68±0.018 (mean ± SD; Fig. 2d), exactly in the middle of g values for nuclei (0.637) and accumulation (0.745) modes as reported by Tomasi et al. (2015) during Arctic haze conditions.
The dry aerosol SSA, inferred from absorption coefficient and light-scattering measurements interpolated to a wavelength of 550 nm, was observed to be 0.977±0.007 (mean ± SD) with maximum and minimum values of 0.960 and 0.991, respectively (Fig. 2e), indicating that light scattering by aerosol vastly dominates over light absorption. Similar values were already observed at Zeppelin during Arctic haze episodes by Lund Myhre et al. (2007). In summary, aerosol optical properties, observed at the ground and with remote sensing during the measurement campaign in spring 2012, represent typical springtime Arctic haze without intense smoke or biomass burning episodes.
Table 2Statistical analysis of black carbon particle properties for the full campaign.
aCorrected for estimated rBC mass in BC cores outside the rBC core size range of the SP2; see Sect. 3.2.1. bCalculated across the actual size detection range of our SP2 (80 nm < DrBC <604 nm). cDerived for rBC cores having an rBC mass-equivalent diameter between 220 nm < DrBC <260 nm. dDerived for rBC-containing particles having an optical diameter between 200 nm < DShell <260 nm.
3.2 Black carbon mass concentration, size distribution and mixing state
3.2.1 BC concentration and size distribution
The SP2 quantitatively detects rBC mass in single particles with rBC mass-equivalent core diameters in the range of 80 nm < DrBC <604 nm. These size limits might lead to a substantial underestimation of the total rBC mass concentration (Schwarz et al., 2006; Kondo et al., 2011; Reddington et al., 2013; Dahlkötter et al., 2014). We minimized this potential bias by adding the estimated rBC mass concentration in the diameter ranges 10 nm < DrBC <80 nm and 604 nm < DrBC<1000 nm using lognormal fits for extrapolating the tails of the observed rBC mass size distribution. This correction was on average 12 % of the total uncorrected rBC mass (Fig. 3a). The corrected rBC mass concentration was 39±23 ng m−3 (mean ± SD) with the 25th and 75th percentiles at 24 and 51 ng m−3, respectively (Fig. 3b, Table 2). The rBC mass concentration exceeded 80 ng m−3 only during a single event of 6 h in duration. Recently, three studies also used the SP2 to investigate BC in the Arctic. Raatikainen et al. (2015) reported a mean rBC mass concentration of 26 ng m−3 at the Pallas Global Atmosphere Watch station (68∘ N, Finland) during winter 2011–2012. Taketani et al. (2016) investigated the spatial variability in rBC at sea level between the North Pacific and Arctic oceans during September 2014. At latitudes higher than 75∘ N the rBC mass concentration was highly variable (0–60 ng m−3 at 1 min time resolution), with an average of 1±1.2 ng m−3. In addition, Liu et al. (2015) presented rBC measurements performed in the low and middle troposphere in the European Arctic in spring 2013, when the rBC mass concentration varied between 20 and 100 ng m−3. While observations in the present study are similar to those by Raatikainen et al. (2015) and Liu et al. (2015), the much lower rBC mass concentrations reported by Taketani et al. (2016) can most likely be attributed to the fact that they sampled a different season and that an intense stagnation event occurred over Svalbard in 2012. The rBC mass size distribution peaked at DrBC=240 nm with 33 % of rBC mass in the BC core diameter range DrBC=200–300 nm (Fig. 3a; Table 2). This is similar to BC core sizes reported from previous observations in the Arctic region (D. Liu et al., 2015; Raatikainen et al., 2015; Taketani et al., 2016), while clearly smaller BC cores were reported for urban areas (Schwarz et al., 2008b; Laborde et al., 2013). This systematic size difference could potentially be caused by different BC properties at emission, while long-range transport can also alter the BC mass mode either to a larger size by coagulation (Shiraiwa et al., 2008; Tunved et al., 2013) or to a smaller size due to preferential wet removal of larger BC cores (Moteki et al., 2012). The reason for the size difference between BC in the Arctic and in urban regions remains elusive as the relative impact of aforementioned causes is not known yet.
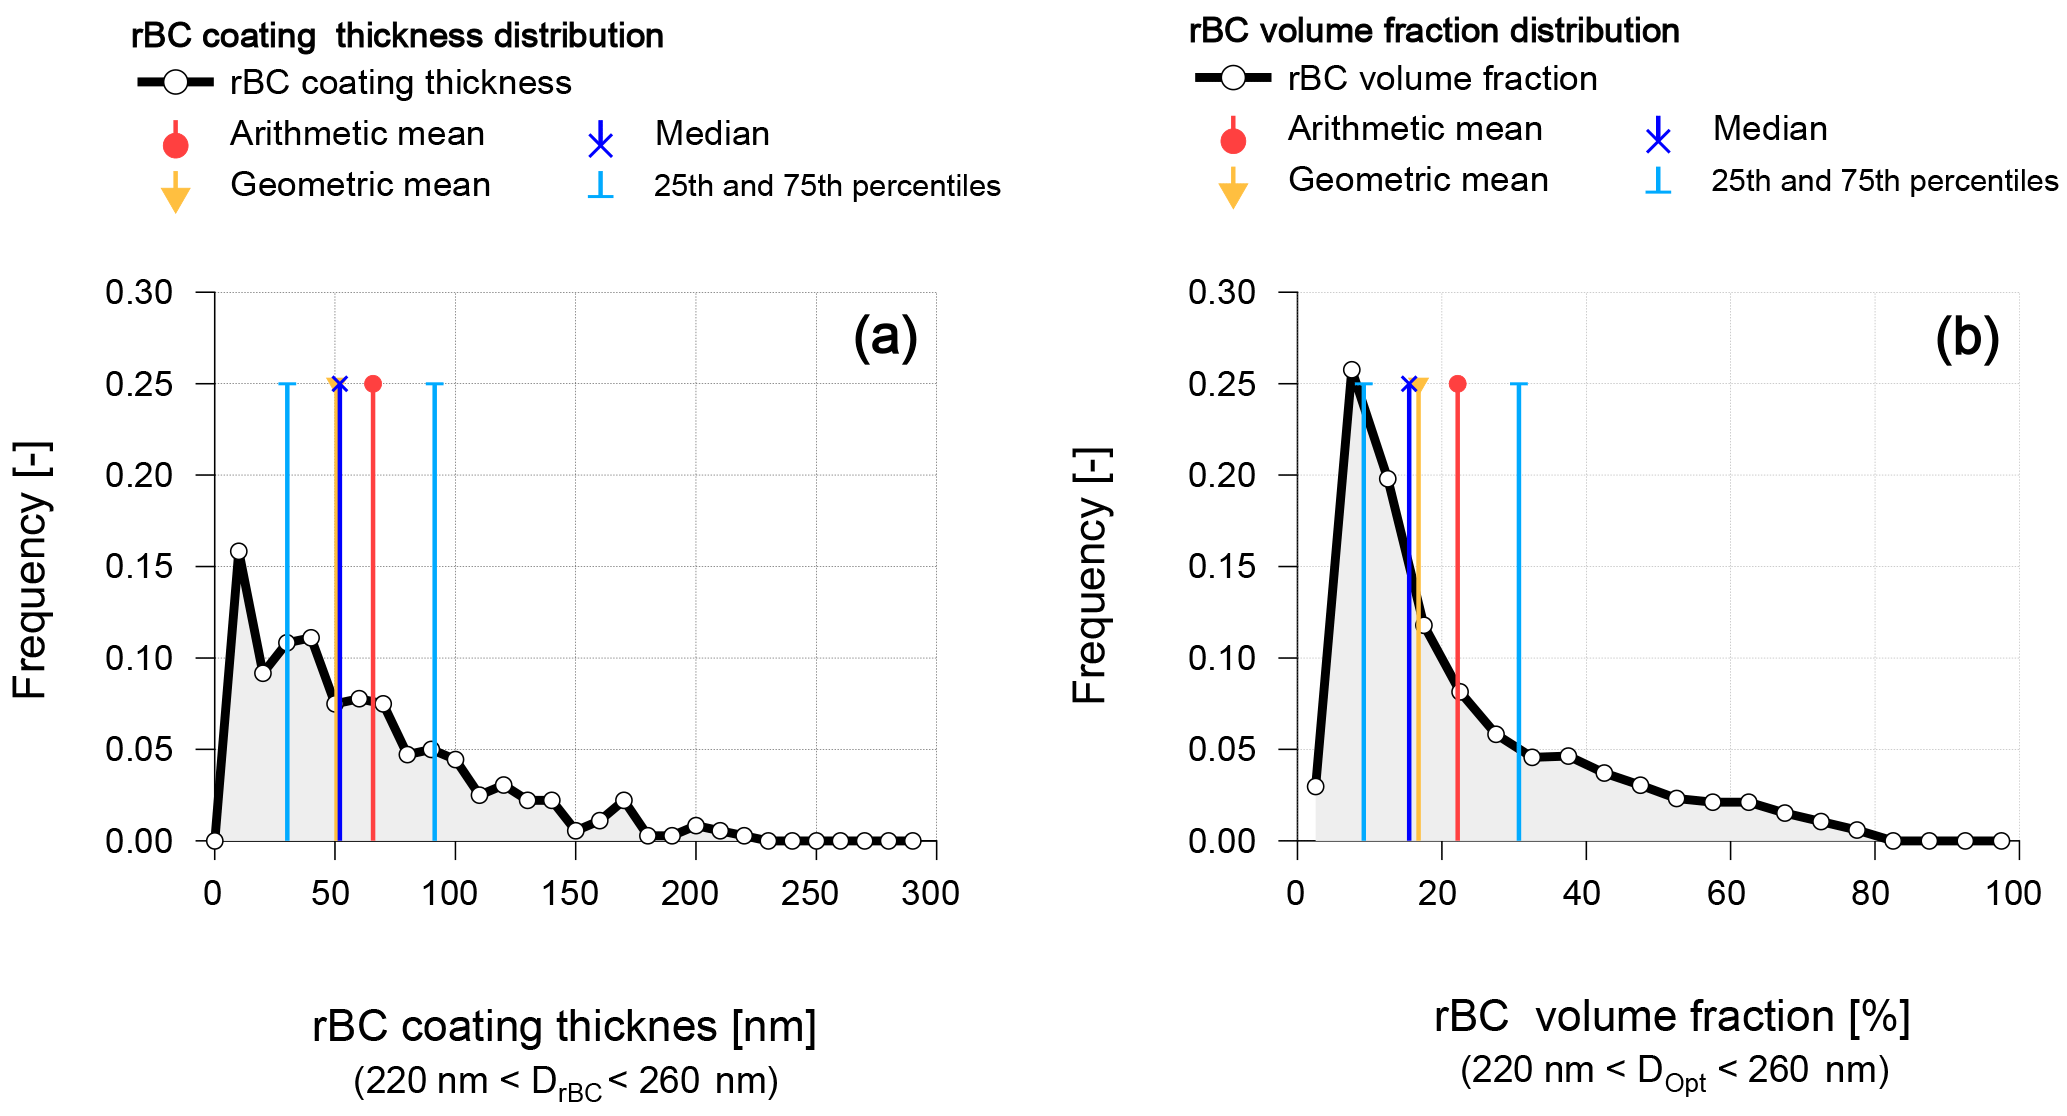
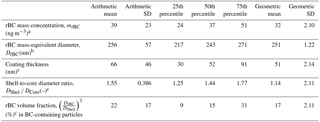
Figure 4Frequency distributions of single-particle properties inferred from the SP2 measurement during the whole campaign: (a) BC coating thickness of BC cores with 220 nm < DrBC <260 nm; (b) rBC volume fraction distribution of BC-containing particles having an optical diameter between 220 and 260 nm.
3.2.2 Comparison between SP2 and COSMOS
As summarized by Petzold et al. (2013), BC can be measured with different techniques. The heterogeneity of measurement approaches may lead to discrepancies between different types of operationally defined BC mass concentrations, especially in pristine areas where BC loadings are close to the limit of detection of many instruments. The AMAP report (2015) underlined the need for comparable BC-measuring techniques in the Arctic region in order to accurately monitor the consequences of anthropogenic activities on BC load and estimating the subsequent climatic impacts. In order to quantify the potential inconsistencies between BC mass concentrations measured by the SP2 and the COSMOS, an intercomparison study was carried out at the Zeppelin station from 30 March to 11 April when these two instruments were operated in parallel (more than 200 h of simultaneous measurements). The COSMOS raw data were analyzed using the mass absorption cross section reported in Kondo et al. (2009). The two instruments showed a good correlation (Pearson correlation coefficient of 0.89; Fig. 5) and the agreement of absolute BC mass values was good (slope of the regression line is 1.14). When only considering the BC mass concentration data at values higher than the limit of detection of the COSMOS instrument reported in the literature (50 ng m−3; Miyazaki et al., 2008), the two instruments showed even better agreement. This is well within expected uncertainties, given that the two instruments were independently calibrated by different groups and that Miyazaki et al. (2008) reported an accuracy of 12 % for COSMOS and Laborde et al. (2012b) a reproducibility of 10 % for the SP2. Although the COSMOS measurements might be influenced by BC particle size (Nakayama et al., 2010), the time-dependent ratio between the two quantities did not show any correlation with the mean diameter of BC cores. Considering that the BC at the Zeppelin station is expected to be internally mixed with other aerosol components due to long mean atmospheric residence time, the quantitative agreement between SP2 and COSMOS suggests that these methods applying different approaches for “thermal pre-treatment” and quantifying BC do not suffer from interference from non-BC matter that is present in a large fraction both internally mixed with BC and externally mixed in BC-free particles. Having a robust BC mass measurement is already halfway towards a reliable estimation of BC mass absorption cross section.
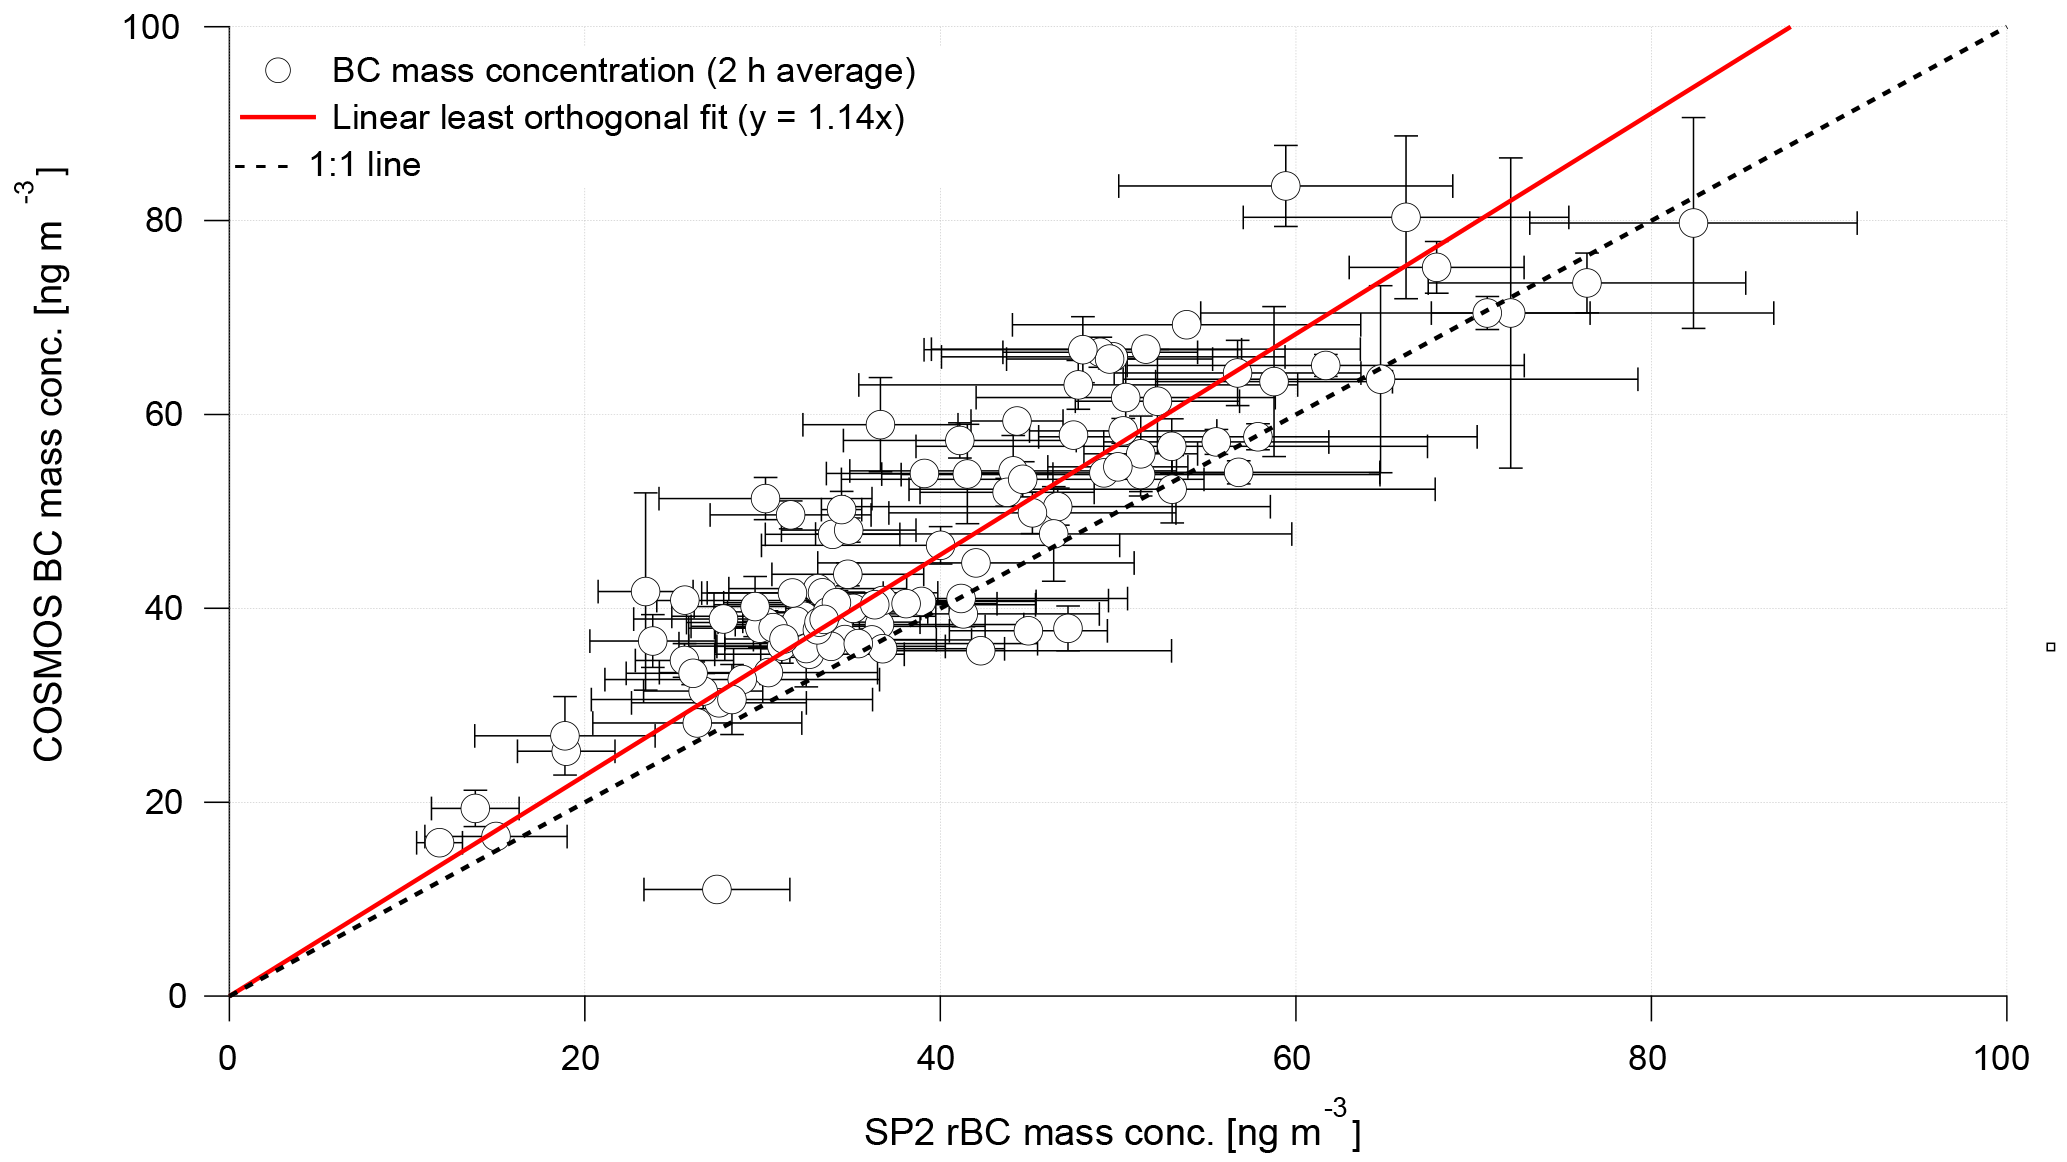
Figure 5Comparison of black carbon mass concentrations measured by COSMOS and SP2. Each individual data point represents the 2 h mean while error bars indicate the standard deviation.
3.2.3 BC mixing state
The mixing state of BC-containing aerosol was inferred from single-particle measurements performed with the SP2 using the approach described in Sect. 2.2.1. This was possible for all BC cores having a BC core diameter in the range of 220 nm < DrBC <260 nm, thus including 6 % of all detected BC particles and covering 13 % of the total rBC mass around the modal size of the BC mass size distribution. The mean coating thickness was found to be 66 nm, while the median, 25th and 75th percentiles were 52, 30 and 91 nm, respectively (Fig. 4a; Table 2). The number fraction of uncoated, bare BC particles was negligible and the maximum coating thickness was 230 nm. Alternatively, the BC mixing state can be expressed as the ratio of the total diameter of the BC-containing particle (DShell) over the diameter of the BC core (DrBC for SP2 measurements and DCore for optical calculations), and univocally called the shell-to-core diameter ratio (DShell / DCore). The above coating thickness values translate to an average shell-to-core diameter ratio of 1.55 (Table 2). This indicates that the BC cores at the mode of the core size distribution were internally mixed with other particulate matter, making up more than 3 times the rBC mass in these BC-containing particles. In agreement with this observation, Raatikainen et al. (2015) also reported dominance of internally mixed BC for the Pallas site in the Finnish Arctic, though with 20 % smaller shell-to-core diameter ratio reported for a slightly different core diameter range.
The SP2 makes it possible to distinguish two distinct types of particle morphology for individual internally mixed BC particles (Sedlacek et al., 2012; Dahlkötter et al., 2014; Moteki et al., 2014): (i) BC is only a minor volume fraction and fully embedded in the coating material somewhere near the particle center, and (ii) BC is attached to or at least near the surface of the coating material. We used the method introduced by Moteki et al. (2014) to show that at Svalbard, where the dominant fraction of BC-containing particles was found to have a small BC volume fraction, only around 2 % of the particles containing BC cores in the mass range of 6–10 fg exhibited the SP2 signal features corresponding to the attached geometry. While the exact value is subject to uncertainty, it is a robust result that the embedded type morphology clearly dominates over the attached type morphology for the BC particles. The fact that the dominant fraction of BC particles has substantial coatings with embedded type morphology supports using the simplified assumption of concentric core–shell geometry for inferring the mixing state based on SP2 data and for estimating the effect of the coatings on particle properties.
The above discussion of BC mixing state focused on a narrow BC core size range and thus on BC-containing particles only. Alternatively, particle mixing state can be discussed for all particles within a certain optical particle diameter range including both BC-free and BC-containing particles. In the following we discuss particles with an overall optical diameter in the range of 200–260 nm. In this size range, less than 5 % of the particles contained a detectable amount of BC, while more than 95 % were BC free. These numbers show that most of the non-BC particulate matter is externally mixed from BC, by both number and volume. It is important to emphasize that the reported number fraction of BC-containing particles is a lower limit of the true value as BC cores with DrBC <80 nm are not considered due to the detection limits of the SP2. However, the number of undetected BC cores is certainly less than 2–4 times the detected number. The lower BC core size detection limit further imposes a lower limit for the minimum detectable BC volume fraction in a particle, which is ∼4 % by volume for the particle size range selected here. The frequency distribution of BC volume fraction in BC-containing particles is shown in Fig. 4b: 50 % of the BC-containing particles had a BC volume fraction of 15 % or less while only 25 % had a BC volume fraction of 31 % or more, with maximum values around 75 % BC volume fraction (Table 2), consistent with the above findings that most BC cores have substantial coatings. This means that most BC-containing particles at a certain particle size have small cores while only very few have a large core compared to total particle size. This implies, combined with the small BC particle number fraction, that aerosol light scattering must clearly dominate over the light absorption, which is consistent with observed aerosol SSA (see Sect. 3.1).
3.3 Light absorption properties of black carbon
The aerosol light absorption coefficient was measured at seven wavelengths between 370 and 950 nm. However, from here on, we only discuss results at a wavelength of 550 nm, as this choice will allow direct comparison to results shown in previous literature.
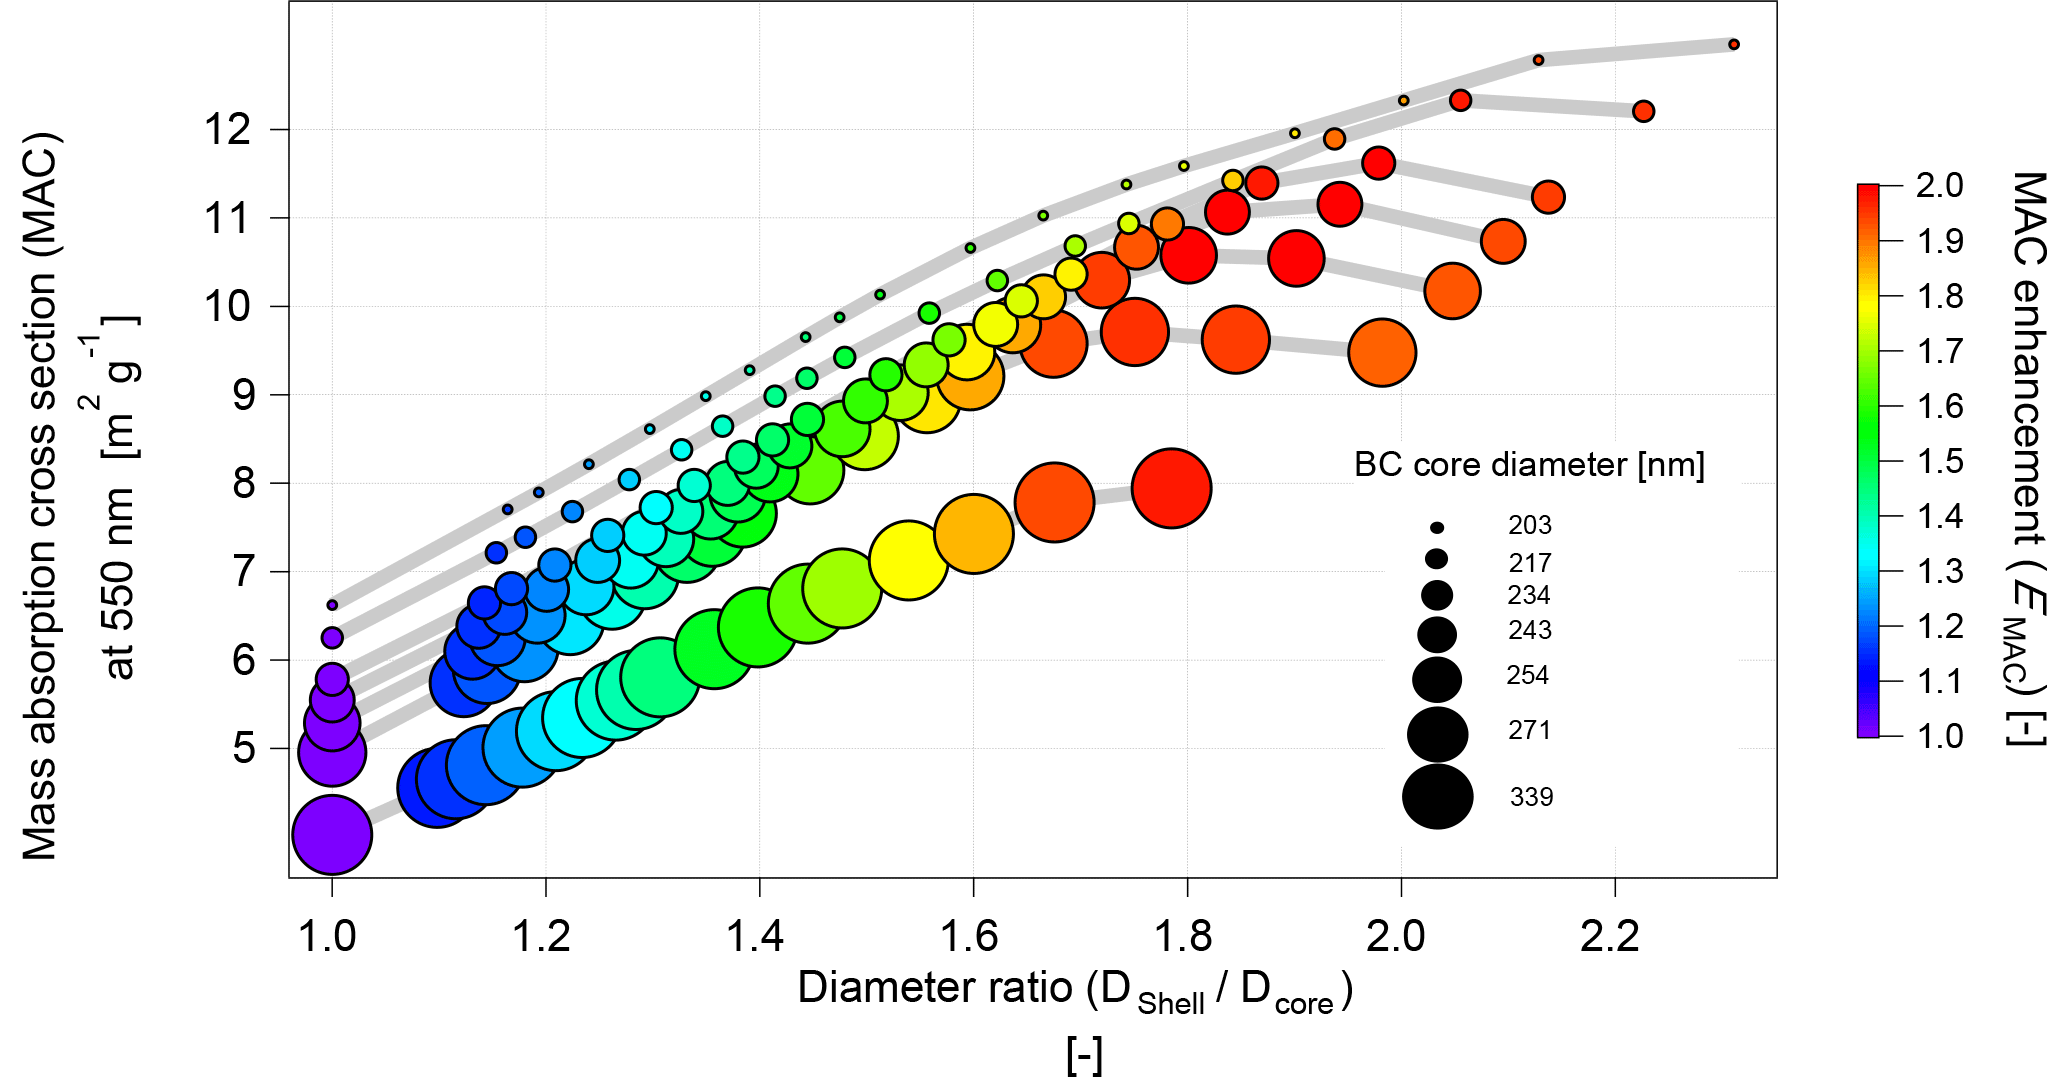
Figure 6Mass absorption cross section (MACMod) of BC-containing particles calculated according to Mie theory as a function of its mixing degree and BC core diameter assuming a core–shell mixing geometry. MAC enhancement (EMAC) is defined as the ratio of the MAC of a coated BC core divided by the MAC of the same BC core without coating.
3.3.1 Observed MAC of BC
The mass absorption cross section of BC was calculated from daily averaged values of the total absorption coefficient (σap) at the 550 nm wavelength measured with the Aethalometer divided by the rBC mass concentration (mrBC) quantified by the SP2 and hereafter named MACrBC. This approximation is based on the assumption that the light absorption is fully dominated by BC, while other compound classes such as organic or brown carbon give a negligible contribution. Depending on aerosol sources, organic carbon can potentially contribute to absorption at wavelengths shorter than ∼530 nm (Lack et al., 2012). If this is the case, then the absorption Ångström exponent (AAE) between 370 and 880 nm increases to values greater than those of BC, which is in the range of 0.8–1.1 (Zotter et al., 2017). In this study, the AAE between 370 and 880 nm was found to be 0.82±0.30 (mean ± SD), thus suggesting that the contribution of brown carbon to light absorption is negligible across this wavelength range (Fig. S2).
σap was interpolated to the 550 nm wavelength by adjusting the measurement from 590 nm using the AAE calculated from the measurements at 370 and 880 nm. The daily averaged MACrBC varied between 8.1 and 11.1 m2 g−1 (Fig. 7a) with a campaign average of 9.81±1.68 m2 g−1 (mean ± SD). The MACrBC observed in this study is in agreement with the MACrBC values recently observed in the Canadian Arctic in spring by Sharma et al. (2017), who reported a MAC of 8.0 m2 g−1 at 550 nm, and also comparable to MACrBC reported by Zanatta et al. (2016) at Scandinavian sites (6.5, 7.9 and 8.5 m2 g−1 at 637 nm, translating to around 7.5–9.9 m2 g−1 at 550 nm; all at latitudes between 56 and 58∘ N). All these MAC values are consistent within experimental uncertainty, and they are consistently larger than the MACrBC expected for bare BC, which provides experimental evidence that the coatings around the BC cores enhance the light absorbed by BC through the lensing effect. This will be addressed in Sect. 3.3.2.
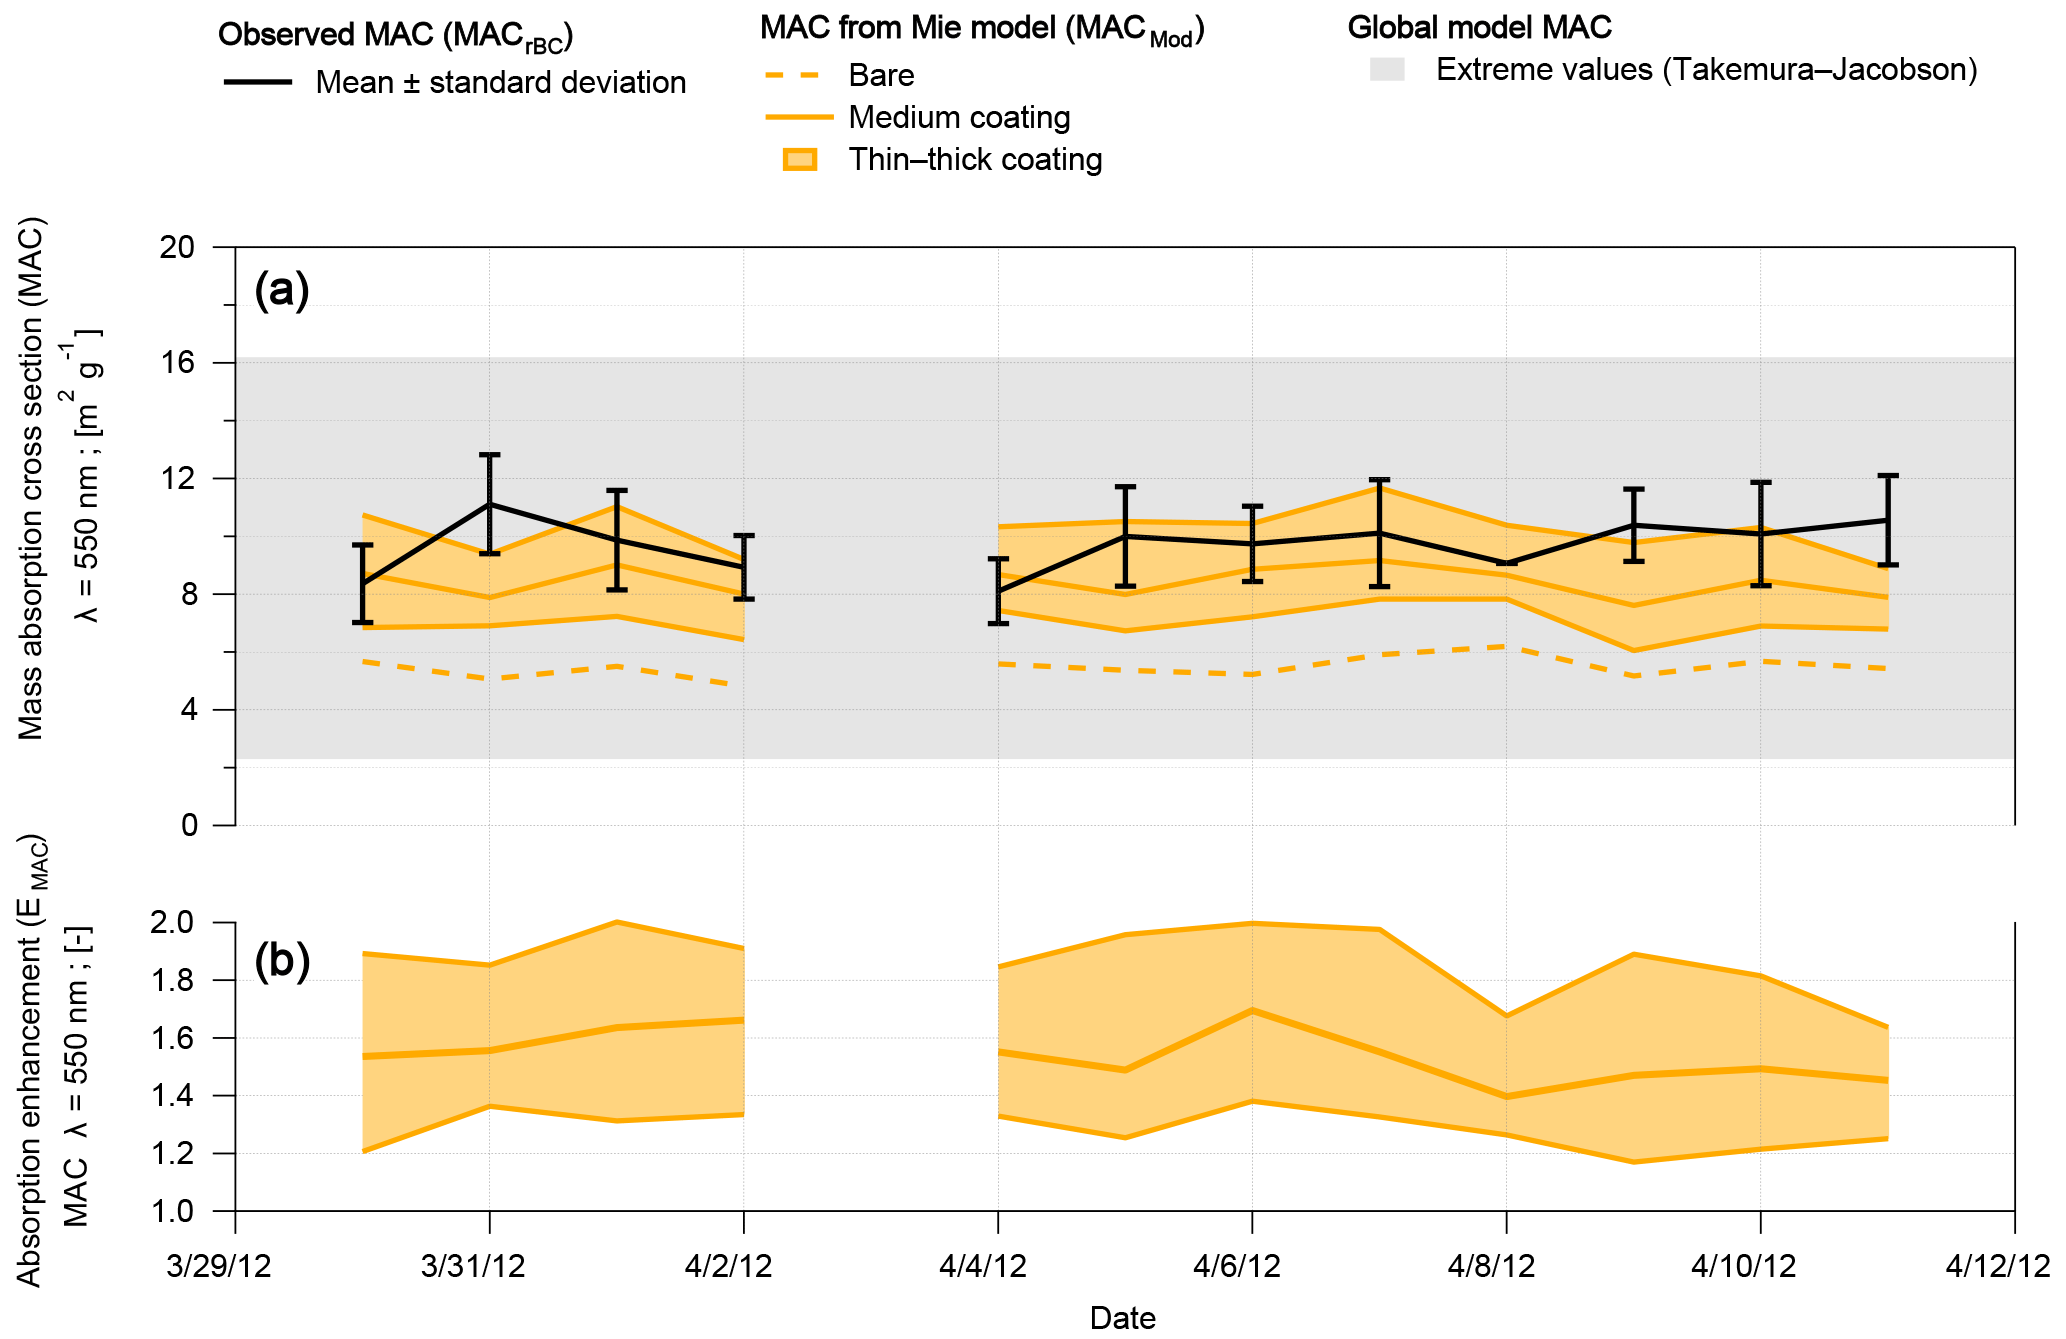
Figure 7(a) Daily mean values of black carbon mass absorption cross section from observation (MACrBC) and from observationally constrained Mie calculations (MACMod). Grey shadows represent the maximum and minimum MAC values used for radiative transfer simulations in global models (Jacobson, 2012; Takemura et al., 2000, 2002, 2005). (b) Daily mean values of absorption enhancement factor defined as the ratio of MACMod for coated BC to that of bare BC. All values are for a wavelength of 550 nm.
The observed MACrBC at 880 nm was 6.95±0.69 m2 g−1 (mean ± SD); we recommend applying this MACrBC when inferring the equivalent BC mass concentration for Arctic aerosol from absorption coefficient at 880 nm measured by the Aethalometer. This includes applying a C value of 3.1 in the first step (Eq. 2).
3.3.2 Theoretically expected MAC and absorption enhancement for internally mixed BC
The absorption cross section of BC-containing particles was calculated with the BHCOAT implementation of Mie theory assuming concentric-sphere geometry for coated BC cores (Sect. 2.4.1). The refractive indices at the 550 nm wavelength were assumed to be RICore= 1.95–0.79i for the BC core (Bond and Bergstrom, 2006) and RI for the coating (Bond et al., 2006). This combination of RIcore and RIcoating is meant to represent a compact BC core with a low void fraction being encapsulated in a mixture of organics and sulfate. The MAC, as defined in Eq. (6), was calculated for a range of BC-core diameters and coating thicknesses. The modeled MAC (MACMod) was then calculated by dividing the theoretical absorption cross section for a certain core size and coating thickness by the BC mass contained in that particle (using a BC bulk density of 1800 kg m−3 to convert from BC volume to BC mass; Moteki and Kondo, 2010).
Figure 6 shows the resulting relationship between the BC mass absorption cross section and the shell-to-core diameter ratio, the latter chosen as parameter to indicate the coating thickness in relative terms. The ensemble of simulations gives an overview on the potential absorption enhancement at Zeppelin. For bare BC (Dshell ∕ Dcore=1.0), MACMod at 550 nm decreases from 6.6 m2 g−1 for DCore=203 nm to 4.0 m2 g−1 for DCore=339 nm. This is a result of relatively large size parameters approaching the geometric optics regime in which MAC ∝ (see, e.g., Moosmüller et al., 2009). However, a less pronounced decrease in the MAC is expected for bare BC cores that are not compact spheres. The lensing effect is presented for increasing shell-to-core diameter ratio at fixed core size: MACMod increases approximately linearly up to shell-to-core ratios of around 1.8–2.2, where it levels off and saturates at a MAC enhancement factor (EMAC) of around 2. This is consistent with previously published Mie theory results for internally mixed BC with concentric-sphere geometry (Nessler et al., 2005; Bond et al., 2006; Cappa et al., 2012).
The coated sphere model is a simplification of the actual BC particle morphology, which might not provide an accurate representation of the actual mixing geometry of BC particles, with consequent effects for the estimation of the optical properties (Adachi et al., 2010). However, it might be considered a fair approximation for highly aged BC particles at Svalbard, which are embedded in coatings and have a low BC volume fraction as discussed in Sect. 3.2.3. Indeed, China et al. (2015) also found that aged BC is predominantly embedded in the coating material and that the Mie approach is suitable for estimating the absorption of aged BC in such a case. More recently, Liu et al. (2017) confirmed that Mie theory with assuming spherical core–shell geometry realistically describes the optical behavior of embedded BC cores when the coating mass is greater than around 3 times the mass of the BC core. In our work, the volume of the coating material was converted to mass using a density of 1100 kg m−3, similar to Liu et al. (2017). On average, a factor of 4.15 was found between the mass of coating and BC core, supporting the assumption of the core–shell as mixing geometry for our optical simulations.
Table 3Campaign average and standard deviation of optical properties of black carbon and total aerosol for different BC coating thickness scenarios and resulting radiative implications. The base case BC coating thickness scenario (“medium”) reflects the median of all measured values, while the “thin” and “thick” scenarios reflect the 25th and 75th percentiles, respectively. The scenarios “global model MAC low” and “global model MAC high” reflect extreme values applied in previous global model simulations. The black carbon mass absorption cross section (MACMod) is estimated with Mie theory; MAC enhancement (EMAC) is defined as the relative increase in BC MAC due to the lensing effect compared to bare BC. The single-scattering albedo (SSAMod) used in the radiative transfer simulations is inferred from measured aerosol optical properties. The change in radiative forcing from aerosol radiation interactions (ΔRFARI) is defined as the simulated RFARI minus that of the base case scenario.
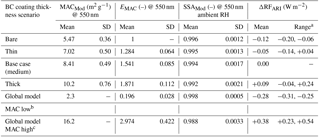
aThe range is obtained by propagating the standard deviation of SSAMod throughout the RF simulations. bTakemura et al. (2000, 2002, 2005). cJacobson (2012).
The most relevant MACMod in the context of our study is that of the median BC particle with DrBC=243 and 52 nm coating thickness, as it represents the best estimate of the theoretically expected MAC of BC based on Mie calculations constrained with observed BC particle properties, i.e., BC core size and mixing state measured by the SP2. Simply using the median particle is a good approximation for BC properties averaged over the whole BC particle population as BC mass is concentrated around the median core size and particle-to-particle variations in core size and coating thickness average out in the first order. This MACMod, hereafter always labeled “medium coating”, takes a value of 8.4 m2 g−1 at 550 nm and agrees with the directly measured MACrBC (9.8 m2 g−1; Sect. 3.3.1). A time-resolved comparison between the medium-coating MACMod and MACrBC is shown in Fig. 7a, which further includes MACMod for the median BC core size without coating (“bare BC”) as well as for coating thicknesses corresponding to the 25th percentile (“thin coating”) and 75th percentile (“thick coating”) of the observed coating thickness distribution (Fig. 4; Table 1). MACrBC agrees best with the base case Mie model prediction medium-coating MACMod, whereas the bare BC MACMod shows an average value of 5.57 m2 g−1 systematically smaller than the observation. The thin-coating and thick-coating Mie model results are slightly below and above the observation, though these differences are well within experimental uncertainty. The comparison between Mie model results and observation corroborates the finding that internal mixing of the BC at Svalbard results in absorption enhancement due to the lensing effect, while the absolute values of absorption enhancement cannot be taken as highly accurate due to the underlying experimental uncertainties and simplifications in the theoretical calculations.
The absorption enhancement factor (EMAC), shown in Fig. 7b and listed in Table 3, is estimated to be around 1.54. This indicates that the coatings of BC at Svalbard cause approximately half of the maximum possible absorption enhancement due to the lensing effect. EMAC values for the bare-, thin- and thick-coating scenarios are 1.0 (by definition), 1.28 and 1.87, respectively. Our results fall in a range similar to previous reports on absorption enhancements for BC in urban and remote environments as well as for laboratory experiments (Bond et al., 2006; Lan et al., 2013; Liu et al., 2015, 2017; Zanatta et al., 2016). In the following, the MACMod and EMAC values presented in Fig. 7 will be used to estimate the sensitivity of aerosol–radiation interactions in the Arctic to the mixing state of BC.
3.4 Simulated effects of BC mixing state on aerosol–radiation interaction
The fact that the measured and predicted MAC values of BC agree with each other, as shown in Sect. 3.3.2, is the starting point for a sensitivity analysis investigating the effects of light absorption enhancement, due to transparent particulate matter internally mixed with BC, on the optical properties and the radiative forcing of the total aerosol in the Arctic.
3.4.1 Aerosol properties required for the aerosol–radiation interaction simulations
Based on the finding discussed in Sect. 3.3.2, we used the measured rBC mass concentration and the modeled MAC for different mixing degrees to calculate the aerosol light absorption coefficient (σapMod) for the ARTDECO model input (Fig. 1c):
Hereby, the approximation is made to use the dry aerosol absorption coefficient, i.e., MACMod for water-free aerosol. This is considered a good approximation for the following reasons. Externally mixed BC does not experience hygroscopic growth at subsaturated RH (Laborde et al., 2013). Internally mixed BC will undergo hygroscopic growth; however, this is expected to have very little effect on the absorption cross section: Nessler et al. (2005) showed that the effect of increased coating thickness due to water uptake is largely compensated for by decreased index of refraction of the coating for particles having a size parameter larger than ∼0.74.
The dry scattering coefficient is taken from the nephelometer measurement (Fig. 1). Hygroscopic growth of the aerosol at ambient RH does cause a substantial increase in the scattering cross section compared to the dry aerosol properties (e.g., Xia et al., 2007). The RH effects on scattering coefficient and aerosol radiative efficiency were also shown by Rastak et al. (2014) for aerosol in the European Arctic. At the Zeppelin site Zieger et al. (2010) measured the aerosol scattering enhancement factor (Esp), which is defined as the ratio of the light-scattering coefficient at high RH to the light-scattering coefficient of the dry aerosol. They reported an averaged Esp value of 3.24 at 85 % RH. We use this Esp to approximate the scattering coefficient of the total aerosol at ambient conditions as the observed RH measured at Zeppelin during CLIMSLIP was 77 % on average.
From the ambient scattering coefficient and the dry aerosol absorption coefficient it was possible to estimate the aerosol SSA at ambient RH (SSAMod) as
As for σapMod, the SSAMod was calculated at three different wavelengths: 370, 550 and 880 nm. The resulting SSAMod, calculated from the MACMod corresponding to different BC mixing state scenarios, makes it possible to first assess the effects of BC mixing state on the optical properties of the total aerosol and from that the impact on the aerosol–radiation interaction (ARI).
Eventually, the absorption enhancement induced by a coating on BC cores discussed in Sect. 3.3.1 leads to a decrease in the SSA of the total aerosol (averaged SSAMod at 550 nm for bare BC = 0.996; for medium-coating BC = 0.994; for thick-coating BC = 0.992). The relatively small change in SSA is due to the low fraction of absorbing material in the aerosol population, as suggested by the high observed SSA.
The obtained SSAMod values for the four mixing degree scenarios listed in Table 3 are finally used as input in the ARTDECO model.
The AOD at 550 nm includes the contribution of hygroscopic growth and was used to parameterize the aerosol load. As shown in Sect. 3.3.1, the MACMod calculated assuming medium-coating rBC cores matched the MACrBC obtained from observations; it is therefore expected that the total aerosol load for the reference scenario would match the observed AOD (AODObs). For this reason, in the rest of the work, it will be considered our reference case. For the remaining scenarios, the AODObs was scaled maintaining the scattering contribution constant and varying the absorbing component of the aerosol, accounting for the absorption enhancement introduced by the different BC mixing degrees. The AODs specific to each mixing degree scenario (AODX) were then calculated as
The Legendre moments of the light-scattering phase function, which are required for the radiative transfer simulations, were derived within ARTDECO from the asymmetry parameter and kept unchanged for all simulations. The use of a constant g for all simulations implies that the acquisition of coatings by the BC cores did not alter the mean size distribution of the total aerosol. This hypothesis is supported by the low number fraction of BC particles and low volume fraction of non-BC material needed to build the coating shells. Nevertheless, the hygroscopic growth induced by high ambient RH might affect the particles' scattering phase function and enhance the aerosol asymmetry parameter (e.g., Andrews et al., 2006). A sensitivity test (see the Supplement) revealed that an enhanced g does not influence our results for the radiative impact. Hence, we conclude that the error introduced by a constant asymmetry parameter is negligible (as supported by the sensitivity analysis presented in Fig. S3e). The ARI calculation might also be affected by the vertical distribution of the aerosol layer. In our work we assumed that the aerosol is confined in one single layer starting from ground level and has a thickness of 1 km. The effects of aerosol vertical distribution and total aerosol load on the ARI calculation is discussed in more detail in the following section and in the Supplement.

Figure 8Dependence of radiative forcing difference (ΔRFARI) on black carbon MAC enhancement (EMAC) due to the lensing effect for different BC mixing state scenarios. ΔRFARI is the difference in aerosol radiative forcing at the top of the atmosphere between the scenario of interest and the base case scenario. Negative ΔRFARI values thus indicate a reduction of the radiative forcing compared to the base case scenario. “Medium coating” is the base case scenario reflecting the median of the measured coating thickness values, while the “thin” and “thick” scenarios reflect the 25th and 75th percentiles, respectively. The points “Jacobson” and “Takemura” reflect the extreme values applied in previous global model simulations (Jacobson, 2012; Takemura et al., 2000, 2002, 2005). Vertical error bars represent the variability introduced by the standard deviation of the single-scattering albedo during the campaign. Horizontal error bars represent the campaign standard deviation of EMAC.
3.4.2 Simulated ARI and BC radiative forcing
In this section we present the results concerning the impact of absorption enhancement of BC on the total aerosol radiative forcing. The radiative fluxes at the TOA were quantified with the ARTDECO package, which makes use of the one-dimensional discrete model 1-D – DISORT2.1 as a radiative transfer equation solver. In addition to aerosol properties, the equation solver needs other environmental variables such as the aerosol vertical distribution, surface albedo and solar zenith angle. We define the radiative forcing difference, ΔRFARI, as the difference between the RFARI for a certain mixing degree of BC and the RFARI for an aerosol population with medium-coating BC, i.e., our reference scenario:
ΔRFARI specifies the absolute change of the aerosol radiative forcing compared to our best-guess scenario in order to quantify the effect of the absorption enhancement induced by different mixing degrees of BC (bare BC, thin, medium and thick coatings) on the ΔRFARI. Our definition of radiative forcing refers to the gross effect on the radiative balance at present-day conditions, similar to Stamnes et al. (2017); but it differs from the definition by the IPCC (Myhre et al., 2013), which refers to the net effect on the radiative balance induced by anthropogenic emissions with using pre-industrial aerosol loadings as a reference. However, these definitions become essentially identical for the radiative forcing by BC under the assumption that present-day BC concentrations in the Arctic region are much greater than corresponding preindustrial values. If this assumption was not applied, then our results for ΔRFARI by BC would need the anthropogenic BC mass fraction at present day as an additional scaling factor to make them consistent with the IPCC definition. The relative radiative forcing showed a clear dependency on the BC MAC value adopted for the estimation of SSAMod, resulting in a negative ΔRFARI for bare BC compared to more thickly coated and more absorbing BC particles (Fig. 8). Specifically, the assumption of a bare BC population leads to ΔRF W m−2, which means more cooling or less warming depending on the sign of RFARIRef. The absorption enhancement due to acquisition of coatings by BC cores leads to ΔRFARI values of −0.05 and +0.10 W m−2 for a thinly and thickly coated BC population, respectively. These values are shown to be dependent, almost linearly, on the total column BC concentration (Fig. S3a). Through a linear fit, it was possible to calculate the energy transfer rate per unit of BC mass. Neglecting the absorption enhancement leads to a net RFARI underestimation of −1.98 W ⋅ (mg BC)−1. By contrast, using MAC values corresponding to thick coatings, i.e., higher than the reference scenario, leads to a net RFARI overestimation of 0.81 W ⋅ (mg BC)−1. These energy transfer rates correspond to noontime in Arctic spring for a surface albedo of 0.89 at 550 nm. The sensitivity of ΔRFARI to other environmental conditions was also tested and is discussed in more detail in the Supplement. Figure S3b shows that ΔRFARI hardly depends on the altitude of the aerosol layer. Hence a change in the aerosol altitude does not influence the radiative effect of the absorption enhancement. Moreover, a decrease in the solar zenith angle increases the absolute values ΔRFARI for all mixing degrees (Fig. S3c). On the one hand, ΔRFARI estimates, conducted for a zenith angle of 77∘ representing noontime in spring, are thus lower than expected for summer for an equal BC burden. On the other hand, the absorption enhancement impact will be less accentuated if surface albedo is less than the highly reflective surface assumed in our reference scenario (Fig. S3d). Assuming a low surface albedo of 0.1, typical of an open ocean, instead reduces ΔRFARI from −0.12 to −0.016 W m−2 for the bare BC scenario. Similarly, the ΔRFARI for thick-coating BC is reduced to +0.017 W m−2.
RFARI was additionally simulated using extreme MAC values found in the literature and implemented in global radiative models (16.2 to 2.3 m2 g−1 at a wavelength of 550 nm; see Table 3). The former is used in the Aerosol, Transport, Radiation, General Circulation, Mesoscale, and Ocean Model (GATOR-GCMOM; Jacobson, 2012). The latter is used in the Spectral Radiation-Transport Model for Aerosol Species (SPRINTARS) model (Takemura et al., 2000, 2002, 2005). These two scenarios result in a substantial ΔRFARI with values of +0.38 and −0.28 W m−2 for MAC values of 16.2 and 2.3 m2 g−1, respectively. This suggests that inappropriate assumptions on BC optical properties in global models may lead to a notable systematic bias in RFARI estimates.
To characterize aerosol and in particular BC physical and optical properties and to understand the radiative impact of the lensing effect caused by internal mixing of BC with transparent particulate matter, an intensive field experiment was conducted during the 2012 Arctic spring at the Zeppelin station in Svalbard, Norway. An optical survey of the aerosol showed thin aerosol optical depth, negative values of the Ångström exponent difference and high SSA, indicating that typical Arctic haze conditions prevailed with an aerosol population dominated by fine and non-absorbing particles, while no extreme smoke events occurred. A single-particle soot photometer (SP2) was used to infer the key properties of BC-containing particles. Low rBC mass concentrations of 39 ng m−3 on average and relatively large BC core diameters were observed (mode of the BC mass size distribution at DrBC=240 nm on average). The good agreement between COSMOS-derived and SP2-derived BC mass concentrations (difference of 14 % on average) showed that thermal treatment of the sample might avoid or drastically reduce the potential interference caused by the presence of non-refractory light-scattering aerosol in absorption filter photometers. The mixing state of BC was also determined from the SP2 measurements. Attached type BC represented only a minor fraction (∼2 %) of all BC-containing particles. Out of all particles with equal optical diameter (in the size range around Dopt=150–500 nm), less than 5 % by number contained BC cores with a size above the lower detection limit of the SP2. BC cores in the size range 220 nm < DrBC < 260 nm were covered by a layer of transparent particulate matter with a median coating thickness of 52 nm. Observationally constrained Mie calculations were used to show that this internal mixing state of BC is estimated to induce an absorption enhancement of around 54 % with respect to uncoated cores. This agrees within 12 % with the directly measured MAC value of 9.81 m2 g−1 at 550 nm.
The effect of absorption enhancement on the aerosol radiative forcing (RFARI) at the top of the atmosphere was also assessed. Using improper optical properties of BC may lead to a notable systematic bias in the resulting RFARI. Under the assumption of a highly reflective surface such as snow, clear-sky conditions and noontime, neglecting internal mixing and absorption enhancement of BC might alter the radiative forcing by −0.12 W m−2. This value was found to be dependent on the total load of BC particles, solar zenith angle and the considered surface albedo. Hence, the impact of the lensing effect on RFARI estimates would be amplified during intense pollution events and reduced after the melting season, when the surface albedo is reduced. With this work we provide evidence that the internal mixing state of BC in the Arctic increases its radiative impact via the lensing effect. While this adds important knowledge about BC properties in the poorly characterized European Arctic for the haze period in spring, additional field activity is desirable in order to capture seasonal-vertical variability and source dependency of the mixing state of BC in the Arctic region.
The data from the present work are open source and are available at http://ebas.nilu.no/ (NILU, 2018).
The supplement related to this article is available online at: https://doi.org/10.5194/acp-18-14037-2018-supplement.
MZ conceived the paper. MZ and MG interpreted the data and treated the SP2 data. KE and SV provided the Aethalometer data; YK provided the COSMOS data; SK provided the sun radiometer data; PT provided the nephelometer data. PL encouraged investigation of the radiative implications, and PD and VW supervised the use of the ARTDECO model. MZ analyzed all other data, prepared the figures, and drafted the paper. PL and UB supervised the entire work development. HWJ initiated and coordinated the study. All authors actively discussed the results and contributed to the final paper.
The authors declare that they have no conflict of interest.
This work was supported by the Agence Nationale de la Recherche under the
contract ANR 2011 Blanc SIMI 5-6 021 04 and a grant from Labex OSUG@2020
(Investissements d'avenir – ANR10 LABX56). The research project no. 1030
(CLIMSLIP-NyA) was performed at the AWIPEV station Ny-Ålesund and was
supported by the French Polar Institute (IPEV). Marco Zanatta and Martin
Gysel received financial support from the ERC under grant
ERC-CoG-615922-BLACARAT. We acknowledge the support by SFB/TR 172 “ArctiC
Amplification: Climate Relevant Atmospheric and SurfaCe Processes, and
Feedback Mechanisms (AC)3” in sub-project 172 funded by the DFG (Deutsche
Forschungsgemeinschaft). This project has received funding from the European
Union's Horizon 2020 research and innovation program under grant agreement
no. 689443 via the project iCUPE (Integrative and Comprehensive Understanding
on Polar Environments). We thank the AWIPEV personnel and the staff at the
Norwegian Sverdrup station for the logistic support.
The article processing charges for this open-access
publication were covered by the
Institute for Geosciences and Environmental Research (IGE) of Grenoble.
Edited by:
Manvendra K. Dubey
Reviewed by: two anonymous referees
Adachi, K., Chung, S. H., and Buseck, P. R.: Shapes of soot aerosol particles and implications for their effects on climate, J. Geophys. Res.-Atmos., 115, D15206, https://doi.org/10.1029/2009JD012868, 2010.
AMAP: AMAP Assessment 2015: Black carbon and ozone as Arctic climate forcers. Arctic Monitoring and Assessment Programme (AMAP), Oslo, Norway, vii +, 116 pp., available at: http://www.amap.no/documents/doc/amap-assessment-2015-black-carbon-and-ozone-as-arctic-climate-forcers/1299 (last access: 7 January 2016), 2015.
Anderson, T. L. and Ogren, J. A.: Determining Aerosol Radiative Properties Using the TSI 3563 Integrating Nephelometer, Aerosol Sci. Tech., 29, 57–69, https://doi.org/10.1080/02786829808965551, 1998.
Andrews, E., Sheridan, P. J., Fiebig, M., McComiskey, A., Ogren, J. A., Arnott, P., Covert, D., Elleman, R., Gasparini, R., Collins, D., Jonsson, H., Schmid, B., and Wang, J.: Comparison of methods for deriving aerosol asymmetry parameter, J. Geophys. Res.-Atmos., 111, D05S04, https://doi.org/10.1029/2004JD005734, 2006.
Backman, J., Schmeisser, L., Virkkula, A., Ogren, J. A., Asmi, E., Starkweather, S., Sharma, S., Eleftheriadis, K., Uttal, T., Jefferson, A., Bergin, M., Makshtas, A., Tunved, P., and Fiebig, M.: On Aethalometer measurement uncertainties and an instrument correction factor for the Arctic, Atmos. Meas. Tech., 10, 5039–5062, https://doi.org/10.5194/amt-10-5039-2017, 2017a.
Backman, J., Schmeisser, L., Virkkula, A., Ogren, J. A., Asmi, E., Starkweather, S., Sharma, S., Eleftheriadis, K., Uttal, T., Jefferson, A., Bergin, M., Makshtas, A., Tunved, P., and Fiebig, M.: On Aethalometer measurement uncertainties and an instrument correction factor for the Arctic, Atmos. Meas. Tech., 10, 5039–5062, https://doi.org/10.5194/amt-10-5039-2017, 2017b.
Barrie, L. A.: Arctic air pollution: An overview of current knowledge, Atmos. Environ., 1967, 643–663, https://doi.org/10.1016/0004-6981(86)90180-0, 1986.
Baumgardner, D., Popovicheva, O., Allan, J., Bernardoni, V., Cao, J., Cavalli, F., Cozic, J., Diapouli, E., Eleftheriadis, K., Genberg, P. J., Gonzalez, C., Gysel, M., John, A., Kirchstetter, T. W., Kuhlbusch, T. A. J., Laborde, M., Lack, D., Müller, T., Niessner, R., Petzold, A., Piazzalunga, A., Putaud, J. P., Schwarz, J., Sheridan, P., Subramanian, R., Swietlicki, E., Valli, G., Vecchi, R., and Viana, M.: Soot reference materials for instrument calibration and intercomparisons: a workshop summary with recommendations, Atmos. Meas. Tech., 5, 1869–1887, https://doi.org/10.5194/amt-5-1869-2012, 2012.
Beine, H. J., Dahlback, A., and Ørbæk, J. B.: Measurements of J(NO2) at Ny-Ålesund, Svalbard, J. Geophys. Res.-Atmos., 104, 16009–16019, https://doi.org/10.1029/1999JD900237, 1999.
Bohren, C. F. and Huffman, D. R.: Appendix B: Coated Sphere, in Absorption and Scattering of Light by Small Particles, 483–489, Wiley-VCH Verlag GmbH, Weinheim, Germany, available at: http://onlinelibrary.wiley.com/doi/10.1002/9783527618156.app3/summary (last access: 23 March 2015), 1998.
Bond, T. C. and Bergstrom, R. W.: Light Absorption by Carbonaceous Particles: An Investigative Review, Aerosol Sci. Tech., 40, 27–67, https://doi.org/10.1080/02786820500421521, 2006.
Bond, T. C., Habib, G., and Bergstrom, R. W.: Limitations in the enhancement of visible light absorption due to mixing state, J. Geophys. Res.-Atmos., 111, D20211, https://doi.org/10.1029/2006JD007315, 2006.
Bond, T. C., Doherty, S. J., Fahey, D. W., Forster, P. M., Berntsen, T., DeAngelo, B. J., Flanner, M. G., Ghan, S., Kärcher, B., Koch, D., Kinne, S., Kondo, Y., Quinn, P. K., Sarofim, M. C., Schultz, M. G., Schulz, M., Venkataraman, C., Zhang, H., Zhang, S., Bellouin, N., Guttikunda, S. K., Hopke, P. K., Jacobson, M. Z., Kaiser, J. W., Klimont, Z., Lohmann, U., Schwarz, J. P., Shindell, D., Storelvmo, T., Warren, S. G., and Zender, C. S.: Bounding the role of black carbon in the climate system: A scientific assessment, J. Geophys. Res.-Atmos., 118, 5380–5552, https://doi.org/10.1002/jgrd.50171, 2013.
Cappa, C. D., Onasch, T. B., Massoli, P., Worsnop, D. R., Bates, T. S., Cross, E. S., Davidovits, P., Hakala, J., Hayden, K. L., Jobson, B. T., Kolesar, K. R., Lack, D. A., Lerner, B. M., Li, S.-M., Mellon, D., Nuaaman, I., Olfert, J. S., Petäjä, T., Quinn, P. K., Song, C., Subramanian, R., Williams, E. J., and Zaveri, R. A.: Radiative Absorption Enhancements Due to the Mixing State of Atmospheric Black Carbon, Science, 337, 1078–1081, https://doi.org/10.1126/science.1223447, 2012.
China, S., Scarnato, B., Owen, R. C., Zhang, B., Ampadu, M. T., Kumar, S., Dzepina, K., Dziobak, M. P., Fialho, P., Perlinger, J. A., Hueber, J., Helmig, D., Mazzoleni, L. R., and Mazzoleni, C.: Morphology and mixing state of aged soot particles at a remote marine free troposphere site: Implications for optical properties, Geophys. Res. Lett., 42, 2014GL062404, https://doi.org/10.1002/2014GL062404, 2015.
Dahlkötter, F., Gysel, M., Sauer, D., Minikin, A., Baumann, R., Seifert, P., Ansmann, A., Fromm, M., Voigt, C., and Weinzierl, B.: The Pagami Creek smoke plume after long-range transport to the upper troposphere over Europe – aerosol properties and black carbon mixing state, Atmos. Chem. Phys., 14, 6111–6137, https://doi.org/10.5194/acp-14-6111-2014, 2014.
Fiebig, M., Stein, C., Schröder, F., Feldpausch, P., and Petzold, A.: Inversion of data containing information on the aerosol particle size distribution using multiple instruments, J. Aerosol Sci., 36, 1353–1372, https://doi.org/10.1016/j.jaerosci.2005.01.004, 2005.
Flanner, M. G.: Arctic climate sensitivity to local black carbon, J. Geophys. Res.-Atmos., 118, 1840–1851, https://doi.org/10.1002/jgrd.50176, 2013.
Gao, R. S., Schwarz, J. P., Kelly, K. K., Fahey, D. W., Watts, L. A., Thompson, T. L., Spackman, J. R., Slowik, J. G., Cross, E. S., Han, J.-H., Davidovits, P., Onasch, T. B., and Worsnop, D. R.: A Novel Method for Estimating Light-Scattering Properties of Soot Aerosols Using a Modified Single-Particle Soot Photometer, Aerosol Sci. Tech., 41, 125–135, https://doi.org/10.1080/02786820601118398, 2007.
Gobbi, G. P., Kaufman, Y. J., Koren, I., and Eck, T. F.: Classification of aerosol properties derived from AERONET direct sun data, Atmos. Chem. Phys., 7, 453–458, https://doi.org/10.5194/acp-7-453-2007, 2007.
Gysel, M., Laborde, M., Olfert, J. S., Subramanian, R., and Gröhn, A. J.: Effective density of Aquadag and fullerene soot black carbon reference materials used for SP2 calibration, Atmos. Meas. Tech., 4, 2851–2858, https://doi.org/10.5194/amt-4-2851-2011, 2011.
Hansen, A. D. A., Rosen, H., and Novakov, T.: The aethalometer – An instrument for the real-time measurement of optical absorption by aerosol particles, Sci. Total Environ., 36, 191–196, https://doi.org/10.1016/0048-9697(84)90265-1, 1984.
Hoffmann, A., Ritter, C., Stock, M., Shiobara, M., Lampert, A., Maturilli, M., Orgis, T., Neuber, R., and Herber, A.: Ground-based lidar measurements from Ny-Ålesund during ASTAR 2007, Atmos. Chem. Phys., 9, 9059–9081, https://doi.org/10.5194/acp-9-9059-2009, 2009.
Jacobson, M. Z.: Investigating cloud absorption effects: Global absorption properties of black carbon, tar balls, and soil dust in clouds and aerosols, J. Geophys. Res.-Atmos., 117, D06205, https://doi.org/10.1029/2011JD017218, 2012.
Kaufman, Y. J.: Aerosol optical thickness and atmospheric path radiance, J. Geophys. Res.-Atmos., 98, 2677–2692, https://doi.org/10.1029/92JD02427, 1993.
Kondo, Y., Sahu, L., Kuwata, M., Miyazaki, Y., Takegawa, N., Moteki, N., Imaru, J., Han, S., Nakayama, T., Oanh, N. T. K., Hu, M., Kim, Y. J., and Kita, K.: Stabilization of the Mass Absorption Cross Section of Black Carbon for Filter-Based Absorption Photometry by the use of a Heated Inlet, Aerosol Sci. Tech., 43, 741–756, https://doi.org/10.1080/02786820902889879, 2009.
Kondo, Y., Sahu, L., Moteki, N., Khan, F., Takegawa, N., Liu, X., Koike, M., and Miyakawa, T.: Consistency and Traceability of Black Carbon Measurements Made by Laser-Induced Incandescence, Thermal-Optical Transmittance, and Filter-Based Photo-Absorption Techniques, Aerosol Sci. Tech., 45, 295–312, https://doi.org/10.1080/02786826.2010.533215, 2011.
Laborde, M., Mertes, P., Zieger, P., Dommen, J., Baltensperger, U., and Gysel, M.: Sensitivity of the Single Particle Soot Photometer to different black carbon types, Atmos. Meas. Tech., 5, 1031–1043, https://doi.org/10.5194/amt-5-1031-2012, 2012a.
Laborde, M., Schnaiter, M., Linke, C., Saathoff, H., Naumann, K.-H., Möhler, O., Berlenz, S., Wagner, U., Taylor, J. W., Liu, D., Flynn, M., Allan, J. D., Coe, H., Heimerl, K., Dahlkötter, F., Weinzierl, B., Wollny, A. G., Zanatta, M., Cozic, J., Laj, P., Hitzenberger, R., Schwarz, J. P., and Gysel, M.: Single Particle Soot Photometer intercomparison at the AIDA chamber, Atmos. Meas. Tech., 5, 3077–3097, https://doi.org/10.5194/amt-5-3077-2012, 2012b.
Laborde, M., Crippa, M., Tritscher, T., Jurányi, Z., Decarlo, P. F., Temime-Roussel, B., Marchand, N., Eckhardt, S., Stohl, A., Baltensperger, U., Prévôt, A. S. H., Weingartner, E., and Gysel, M.: Black carbon physical properties and mixing state in the European megacity Paris, Atmos. Chem. Phys., 13, 5831–5856, https://doi.org/10.5194/acp-13-5831-2013, 2013.
Lack, D. A., Cappa, C. D., Cross, E. S., Massoli, P., Ahern, A. T., Davidovits, P., and Onasch, T. B.: Absorption Enhancement of Coated Absorbing Aerosols: Validation of the Photo-Acoustic Technique for Measuring the Enhancement, Aerosol Sci. Tech., 43, 1006–1012, https://doi.org/10.1080/02786820903117932, 2009.
Lack, D. A., Langridge, J. M., Bahreini, R., Cappa, C. D., Middlebrook, A. M., and Schwarz, J. P.: Brown carbon and internal mixing in biomass burning particles, P. Natl. Acad. Sci. USA, 109, 14802–14807, https://doi.org/10.1073/pnas.1206575109, 2012.
Lan, Z.-J., Huang, X.-F., Yu, K.-Y., Sun, T.-L., Zeng, L.-W., and Hu, M.: Light absorption of black carbon aerosol and its enhancement by mixing state in an urban atmosphere in South China, Atmos. Environ., 69, 118–123, https://doi.org/10.1016/j.atmosenv.2012.12.009, 2013.
Liu, D., Quennehen, B., Darbyshire, E., Allan, J. D., Williams, P. I., Taylor, J. W., Bauguitte, S. J.-B., Flynn, M. J., Lowe, D., Gallagher, M. W., Bower, K. N., Choularton, T. W., and Coe, H.: The importance of Asia as a source of black carbon to the European Arctic during springtime 2013, Atmos. Chem. Phys., 15, 11537–11555, https://doi.org/10.5194/acp-15-11537-2015, 2015.
Liu, D., Whitehead, J., Alfarra, M. R., Reyes-Villegas, E., Spracklen, D. V., Reddington, C. L., Kong, S., Williams, P. I., Ting, Y.-C., Haslett, S., Taylor, J. W., Flynn, M. J., Morgan, W. T., McFiggans, G., Coe, H., and Allan, J. D.: Black-carbon absorption enhancement in the atmosphere determined by particle mixing state, Nat. Geosci., 10, 184–188, https://doi.org/10.1038/ngeo2901, 2017.
Liu, S., Aiken, A. C., Gorkowski, K., Dubey, M. K., Cappa, C. D., Williams, L. R., Herndon, S. C., Massoli, P., Fortner, E. C., Chhabra, P. S., Brooks, W. A., Onasch, T. B., Jayne, J. T., Worsnop, D. R., China, S., Sharma, N., Mazzoleni, C., Xu, L., Ng, N. L., Liu, D., Allan, J. D., Lee, J. D., Fleming, Z. L., Mohr, C., Zotter, P., Szidat, S., and Prévôt, A. S. H.: Enhanced light absorption by mixed source black and brown carbon particles in UK winter, Nat. Commun., 6, 8435, https://doi.org/10.1038/ncomms9435, 2015.
Lund Myhre, C., Toledano, C., Myhre, G., Stebel, K., Yttri, K. E., Aaltonen, V., Johnsrud, M., Frioud, M., Cachorro, V., de Frutos, A., Lihavainen, H., Campbell, J. R., Chaikovsky, A. P., Shiobara, M., Welton, E. J., and Tørseth, K.: Regional aerosol optical properties and radiative impact of the extreme smoke event in the European Arctic in spring 2006, Atmos. Chem. Phys., 7, 5899–5915, https://doi.org/10.5194/acp-7-5899-2007, 2007.
Mahmood, R., von Salzen, K., Flanner, M., Sand, M., Langner, J., Wang, H., and Huang, L.: Seasonality of global and Arctic black carbon processes in the Arctic Monitoring and Assessment Programme models, J. Geophys. Res.-Atmos., 121, 7100–7116, 2016JD024849, https://doi.org/10.1002/2016JD024849, 2016.
Miyazaki, Y., Kondo, Y., Sahu, L. K., Imaru, J., Fukushima, N., and Kano, M.: Performance of a newly designed continuous soot monitoring system (COSMOS), J. Environ. Monit. JEM, 10, 1195–1201, 2008.
Moosmüller, H., Chakrabarty, R. K., and Arnott, W. P.: Aerosol light absorption and its measurement: A review, J. Quant. Spectrosc. Ra., 110, 844–878, https://doi.org/10.1016/j.jqsrt.2009.02.035, 2009.
Moroni, B., Cappelletti, D., Crocchianti, S., Becagli, S., Caiazzo, L., Traversi, R., Udisti, R., Mazzola, M., Markowicz, K., Ritter, C., and Zielinski, T.: Morphochemical characteristics and mixing state of long range transported wildfire particles at Ny-Ålesund (Svalbard Islands), Atmos. Environ., 156, 135–145, https://doi.org/10.1016/j.atmosenv.2017.02.037, 2017.
Moteki, N. and Kondo, Y.: Dependence of Laser-Induced Incandescence on Physical Properties of Black Carbon Aerosols: Measurements and Theoretical Interpretation, Aerosol Sci. Tech., 44, 663–675, https://doi.org/10.1080/02786826.2010.484450, 2010.
Moteki, N., Kondo, Y., and Nakamura, S.: Method to measure refractive indices of small nonspherical particles: Application to black carbon particles, J. Aerosol Sci., 41, 513–521, https://doi.org/10.1016/j.jaerosci.2010.02.013, 2010.
Moteki, N., Kondo, Y., Oshima, N., Takegawa, N., Koike, M., Kita, K., Matsui, H., and Kajino, M.: Size dependence of wet removal of black carbon aerosols during transport from the boundary layer to the free troposphere, Geophys. Res. Lett., 39, L13802, https://doi.org/10.1029/2012GL052034, 2012.
Moteki, N., Kondo, Y., and Adachi, K.: Identification by single-particle soot photometer of black carbon particles attached to other particles: Laboratory experiments and ground observations in Tokyo, J. Geophys. Res.-Atmos., 119, 2013JD020655, https://doi.org/10.1002/2013JD020655, 2014.
Müller, T., Nowak, A., Wiedensohler, A., Sheridan, P., Laborde, M., Covert, D. S., Marinoni, A., Imre, K., Henzing, B., Roger, J.-C., dos Santos, S. M., Wilhelm, R., Wang, Y.-Q., and de Leeuw, G.: Angular Illumination and Truncation of Three Different Integrating Nephelometers: Implications for Empirical, Size-Based Corrections, Aerosol Sci. Tech., 43, 581–586, https://doi.org/10.1080/02786820902798484, 2009.
Myhre, G., Shindell, D., Bréon, F.-M., Collins, W., Fuglestvedt, J., Huang, J., Koch, D., Lamarque, J.-F., Lee, D., Mendoza, B., Nakajima, T., Robock, A., Stephens, G., Takemura, T., and Zhang, H.: Anthropogenic and Natural Radiative Forcing, in: Climate Change 2013: The Physical Science Basis, Contribution of Working Group I to the Fifth Assessment Report of the Intergovernmental Panel on Climate Change, edited by: Stocker, T. F., Qin, D., Plattner, G.-K., Tignor, M., Allen, S. K., Boschung, J., Nauels, A., Xia, Y., Bex, V., and Midgley, P. M., 659–740, Cambridge University Press, Cambridge, UK and New York, NY, USA, 2013.
Nakayama, T., Kondo, Y., Moteki, N., Sahu, L. K., Kinase, T., Kita, K., and Matsumi, Y.: Size-dependent correction factors for absorption measurements using filter-based photometers: PSAP and COSMOS, J. Aerosol Sci., 41, 333–343, https://doi.org/10.1016/j.jaerosci.2010.01.004, 2010.
Nessler, R., Weingartner, E., and Baltensperger, U.: Effect of humidity on aerosol light absorption and its implications for extinction and the single scattering albedo illustrated for a site in the lower free troposphere, J. Aerosol Sci., 36, 958–972, https://doi.org/10.1016/j.jaerosci.2004.11.012, 2005.
Norwegian Institute for Air Research (NILU): EBAS, available at: http://ebas.nilu.no/, last access: 28 September 2018.
Petzold, A., Ogren, J. A., Fiebig, M., Laj, P., Li, S.-M., Baltensperger, U., Holzer-Popp, T., Kinne, S., Pappalardo, G., Sugimoto, N., Wehrli, C., Wiedensohler, A., and Zhang, X.-Y.: Recommendations for reporting ”black carbon” measurements, Atmos. Chem. Phys., 13, 8365–8379, https://doi.org/10.5194/acp-13-8365-2013, 2013.
Quinn, P. K., Shaw, G., Andrews, E., Dutton, E. G., Ruoho-Airola, T., and Gong, S. L.: Arctic haze: current trends and knowledge gaps, Tellus B, 59, 99–114, https://doi.org/10.1111/j.1600-0889.2006.00238.x, 2007.
Quinn, P. K., Stohl, A., Arnold, S., Baklanov, A., Berntsen, T. K., Christensen, J. H., Eckhardt, S., Flanner, M., Klimont, Z., Korsholm, U. S., and others: AMAP Assessment 2015: Black carbon and ozone as Arctic climate forcers, Arctic Monitoring and Assessment Programme (AMAP), Oslo, Norway, vii +, 116 pp., available at: http://www.forskningsdatabasen.dk/en/catalog/2290382387 (last access: 29 June 2016), 2015. AMAP Assessment 2015: Black carbon and ozone as Arctic climate forcers. Arctic Monitoring and Assessment Programme (AMAP), Oslo, Norway. vii + 116 pp
Raatikainen, T., Brus, D., Hyvärinen, A.-P., Svensson, J., Asmi, E., and Lihavainen, H.: Black carbon concentrations and mixing state in the Finnish Arctic, Atmos. Chem. Phys., 15, 10057–10070, https://doi.org/10.5194/acp-15-10057-2015, 2015.
Rastak, N., Silvergren, S., Zieger, P., Wideqvist, U., Ström, J., Svenningsson, B., Maturilli, M., Tesche, M., Ekman, A. M. L., Tunved, P., and Riipinen, I.: Seasonal variation of aerosol water uptake and its impact on the direct radiative effect at Ny-Ålesund, Svalbard, Atmos. Chem. Phys., 14, 7445–7460, https://doi.org/10.5194/acp-14-7445-2014, 2014.
Reddington, C. L., McMeeking, G., Mann, G. W., Coe, H., Frontoso, M. G., Liu, D., Flynn, M., Spracklen, D. V., and Carslaw, K. S.: The mass and number size distributions of black carbon aerosol over Europe, Atmos. Chem. Phys., 13, 4917–4939, https://doi.org/10.5194/acp-13-4917-2013, 2013.
Sand, M., Berntsen, T. K., von Salzen, K., Flanner, M. G., Langner, J., and Victor, D. G.: Response of Arctic temperature to changes in emissions of short-lived climate forcers, Nat. Clim. Change, 6, 286–289, https://doi.org/10.1038/nclimate2880, 2016.
Scarnato, B. V., Vahidinia, S., Richard, D. T., and Kirchstetter, T. W.: Effects of internal mixing and aggregate morphology on optical properties of black carbon using a discrete dipole approximation model, Atmos. Chem. Phys., 13, 5089–5101, https://doi.org/10.5194/acp-13-5089-2013, 2013.
Schwarz, J. P., Gao, R. S., Fahey, D. W., Thomson, D. S., Watts, L. A., Wilson, J. C., Reeves, J. M., Darbeheshti, M., Baumgardner, D. G., Kok, G. L., Chung, S. H., Schulz, M., Hendricks, J., Lauer, A., Kärcher, B., Slowik, J. G., Rosenlof, K. H., Thompson, T. L., Langford, A. O., Loewenstein, M., and Aikin, K. C.: Single-particle measurements of midlatitude black carbon and light-scattering aerosols from the boundary layer to the lower stratosphere, J. Geophys. Res.-Atmos., 111, D16207, https://doi.org/10.1029/2006JD007076, 2006.
Schwarz, J. P., Spackman, J. R., Fahey, D. W., Gao, R. S., Lohmann, U., Stier, P., Watts, L. A., Thomson, D. S., Lack, D. A., Pfister, L., Mahoney, M. J., Baumgardner, D., Wilson, J. C., and Reeves, J. M.: Coatings and their enhancement of black carbon light absorption in the tropical atmosphere, J. Geophys. Res.-Atmos., 113, D03203, https://doi.org/10.1029/2007JD009042, 2008a.
Schwarz, J. P., Gao, R. S., Spackman, J. R., Watts, L. A., Thomson, D. S., Fahey, D. W., Ryerson, T. B., Peischl, J., Holloway, J. S., Trainer, M., Frost, G. J., Baynard, T., Lack, D. A., de Gouw, J. A., Warneke, C., and Del Negro, L. A.: Measurement of the mixing state, mass, and optical size of individual black carbon particles in urban and biomass burning emissions, Geophys. Res. Lett., 35, L13810, https://doi.org/10.1029/2008GL033968, 2008b.
Sedlacek, A. J., Lewis, E. R., Kleinman, L., Xu, J., and Zhang, Q.: Determination of and evidence for non-core-shell structure of particles containing black carbon using the Single-Particle Soot Photometer (SP2), Geophys. Res. Lett., 39, L06802, https://doi.org/10.1029/2012GL050905, 2012.
Sharma, S., Leaitch, W. R., Huang, L., Veber, D., Kolonjari, F., Zhang, W., Hanna, S. J., Bertram, A. K., and Ogren, J. A.: An evaluation of three methods for measuring black carbon in Alert, Canada, Atmos. Chem. Phys., 17, 15225–15243, https://doi.org/10.5194/acp-17-15225-2017, 2017.
Shaw, G. E.: The Arctic Haze Phenomenon, B. Am. Meteorol. Soc., 76, 2403–2413, https://doi.org/10.1175/1520-0477(1995)076<2403:TAHP>2.0.CO;2, 1995.
Shiraiwa, M., Kondo, Y., Moteki, N., Takegawa, N., Sahu, L. K., Takami, A., Hatakeyama, S., Yonemura, S., and Blake, D. R.: Radiative impact of mixing state of black carbon aerosol in Asian outflow, J. Geophys. Res.-Atmos., 113, D24210, https://doi.org/10.1029/2008JD010546, 2008.
Stamnes, K., Tsay, S.-C., Wiscombe, W., and Jayaweera, K.: Numerically stable algorithm for discrete-ordinate-method radiative transfer in multiple scattering and emitting layered media, Appl. Opt., 27, 2502–2509, https://doi.org/10.1364/AO.27.002502, 1988.
Stamnes, K., Thomas, G. E., and Stamnes, J. J.: Radiative Transfer in the Atmosphere and Ocean by Knut Stamnes, Camb. Core, 8, 333–336, https://doi.org/10.1017/9781316148549, 2017.
Stephens, M., Turner, N., and Sandberg, J.: Particle identification by laser-induced incandescence in a solid-state laser cavity, Appl. Opt., 42, 3726–3736, https://doi.org/10.1364/AO.42.003726, 2003.
Ström, J., Umegård, J., Tørseth, K., Tunved, P., Hansson, H.-C., Holmén, K., Wismann, V., Herber, A., and König-Langlo, G.: One year of particle size distribution and aerosol chemical composition measurements at the Zeppelin Station, Svalbard, March 2000–March 2001, Phys. Chem. Earth Parts ABC, 28, 1181–1190, https://doi.org/10.1016/j.pce.2003.08.058, 2003.
Takemura, T., Okamoto, H., Maruyama, Y., Numaguti, A., Higurashi, A., and Nakajima, T.: Global three-dimensional simulation of aerosol optical thickness distribution of various origins, J. Geophys. Res.-Atmos., 105, 17853–17873, https://doi.org/10.1029/2000JD900265, 2000.
Takemura, T., Nakajima, T., Dubovik, O., Holben, B. N., and Kinne, S.: Single-Scattering Albedo and Radiative Forcing of Various Aerosol Species with a Global Three-Dimensional Model, J. Climate, 15, 333–352, https://doi.org/10.1175/1520-0442(2002)015<0333:SSAARF>2.0.CO;2, 2002.
Takemura, T., Nozawa, T., Emori, S., Nakajima, T. Y., and Nakajima, T.: Simulation of climate response to aerosol direct and indirect effects with aerosol transport-radiation model, J. Geophys. Res.-Atmos., 110, D02202, https://doi.org/10.1029/2004JD005029, 2005.
Taketani, F., Miyakawa, T., Takashima, H., Komazaki, Y., Kanaya, Y., Taketani, F., Miyakawa, T., Inoue, J., Kanaya, Y., Takashima, H., Pan, X., and Inoue, J.: Ship-borne observations of atmospheric black carbon aerosol particles over the Arctic Ocean, Bering Sea, and North Pacific Ocean during September 2014, J. Geophys. Res.-Atmos., 121, 1914–1921, 2015JD023648, https://doi.org/10.1002/2015JD023648, 2016.
Tomasi, C., Kokhanovsky, A. A., Lupi, A., Ritter, C., Smirnov, A., O'Neill, N. T., Stone, R. S., Holben, B. N., Nyeki, S., Wehrli, C., Stohl, A., Mazzola, M., Lanconelli, C., Vitale, V., Stebel, K., Aaltonen, V., de Leeuw, G., Rodriguez, E., Herber, A. B., Radionov, V. F., Zielinski, T., Petelski, T., Sakerin, S. M., Kabanov, D. M., Xue, Y., Mei, L., Istomina, L., Wagener, R., McArthur, B., Sobolewski, P. S., Kivi, R., Courcoux, Y., Larouche, P., Broccardo, S., and Piketh, S. J.: Aerosol remote sensing in polar regions, Earth-Sci. Rev., 140, 108–157, https://doi.org/10.1016/j.earscirev.2014.11.001, 2015.
Treffeisen, R., Tunved, P., Ström, J., Herber, A., Bareiss, J., Helbig, A., Stone, R. S., Hoyningen-Huene, W., Krejci, R., Stohl, A., and Neuber, R.: Arctic smoke – aerosol characteristics during a record smoke event in the European Arctic and its radiative impact, Atmos. Chem. Phys., 7, 3035–3053, https://doi.org/10.5194/acp-7-3035-2007, 2007.
Tunved, P., Ström, J., and Krejci, R.: Arctic aerosol life cycle: linking aerosol size distributions observed between 2000 and 2010 with air mass transport and precipitation at Zeppelin station, Ny-Ålesund, Svalbard, Atmos. Chem. Phys., 13, 3643–3660, https://doi.org/10.5194/acp-13-3643-2013, 2013.
Weingartner, E., Saathoff, H., Schnaiter, M., Streit, N., Bitnar, B., and Baltensperger, U.: Absorption of light by soot particles: determination of the absorption coefficient by means of aethalometers, J. Aerosol Sci., 34, 1445–1463, https://doi.org/10.1016/S0021-8502(03)00359-8, 2003.
Wiscombe, W. J. and Grams, G. W.: The Backscattered Fraction in two-stream Approximations, J. Atmos. Sci., 33, 2440–2451, https://doi.org/10.1175/1520-0469(1976)033<2440:TBFITS>2.0.CO;2, 1976.
WMO: Aerosol Measurements Procedures Guidelines and Recomendations, 2nd edn., World Meteorological Organization, Geneva, 2016.
Xia, X., Li, Z., Holben, B., Wang, P., Eck, T., Chen, H., Cribb, M., and Zhao, Y.: Aerosol optical properties and radiative effects in the Yangtze Delta region of China, J. Geophys. Res.-Atmos., 112, D22S12, https://doi.org/10.1029/2007JD008859, 2007.
Yamanouchi, T., Treffeisen, R., Herber, A., Shiobara, M., Yamagata, S., Hara, K., Sato, K., Yabuki, M., Tomikawa, Y., Rinke, A., Neuber, R., Schumachter, R., Kriews, M., Ström, J., Schrems, O., and Gernandt, H.: Arctic Study of Tropospheric Aerosol and Radiation (ASTAR) 2000: Arctic haze case study, Tellus B, 57, 141–152, https://doi.org/10.1111/j.1600-0889.2005.00140.x, 2005.
Zanatta, M., Gysel, M., Bukowiecki, N., Müller, T., Weingartner, E., Areskoug, H., Fiebig, M., Yttri, K. E., Mihalopoulos, N., Kouvarakis, G., Beddows, D., Harrison, R. M., Cavalli, F., Putaud, J. P., Spindler, G., Wiedensohler, A., Alastuey, A., Pandolfi, M., Sellegri, K., Swietlicki, E., Jaffrezo, J. L., Baltensperger, U., and Laj, P.: A European aerosol phenomenology-5: Climatology of black carbon optical properties at 9 regional background sites across Europe, Atmos. Environ., 145, 346–364, https://doi.org/10.1016/j.atmosenv.2016.09.035, 2016.
Zieger, P., Fierz-Schmidhauser, R., Gysel, M., Ström, J., Henne, S., Yttri, K. E., Baltensperger, U., and Weingartner, E.: Effects of relative humidity on aerosol light scattering in the Arctic, Atmos. Chem. Phys., 10, 3875–3890, https://doi.org/10.5194/acp-10-3875-2010, 2010.
Zotter, P., Herich, H., Gysel, M., El-Haddad, I., Zhang, Y., Močnik, G., Hüglin, C., Baltensperger, U., Szidat, S., and Prévôt, A. S. H.: Evaluation of the absorption Ångström exponents for traffic and wood burning in the Aethalometer-based source apportionment using radiocarbon measurements of ambient aerosol, Atmos. Chem. Phys., 17, 4229–4249, https://doi.org/10.5194/acp-17-4229-2017, 2017.
Note that an updated C value of 3.25 specific to the site and instrument used in this study is provided in the final published paper by Backman et al. (2017b). However, the difference between these two values is well within uncertainty.