the Creative Commons Attribution 4.0 License.
the Creative Commons Attribution 4.0 License.
 | 21 Sep 2018
Observations of organic and inorganic chlorinated compounds and their contribution to chlorine radical concentrations in an urban environment in northern Europe during the wintertime
Michael Priestley
Michael le Breton
Thomas J. Bannan
Stephen D. Worrall
Asan Bacak
Andrew R. D. Smedley
Ernesto Reyes-Villegas
Archit Mehra
James Allan
Ann R. Webb
Dudley E. Shallcross
Carl J. Percival
A number of inorganic (nitryl chloride, ClNO2; chlorine, Cl2; and hypochlorous acid, HOCl) and chlorinated, oxygenated volatile organic compounds (ClOVOCs) have been measured in Manchester, UK during October and November 2014 using time-of-flight chemical ionisation mass spectrometry (ToF-CIMS) with the I− reagent ion. ClOVOCs appear to be mostly photochemical in origin, although direct emission from vehicles is also suggested. Peak concentrations of ClNO2, Cl2 and HOCl reach 506, 16 and 9 ppt respectively. The concentrations of ClNO2 are comparable to measurements made in London, but measurements of ClOVOCs, Cl2 and HOCl by this method are the first reported in the UK. Maximum HOCl and Cl2 concentrations are found during the day and ClNO2 concentrations remain elevated into the afternoon if photolysis rates are low. Cl2 exhibits a strong dependency on shortwave radiation, further adding to the growing body of evidence that it is a product of secondary chemistry. However, night-time emission is also observed. The contribution of ClNO2, Cl2 and ClOVOCs to the chlorine radical budget suggests that Cl2 can be a greater source of Cl than ClNO2, contributing 74 % of the Cl radicals produced on a high radiant-flux day. In contrast, on a low radiant-flux day, this drops to 14 %, as both Cl2 production and loss pathways are inhibited by reduced photolysis rates. This results in ClNO2 making up the dominant fraction (83 %) on low radiant-flux days, as its concentrations are still high. As most ClOVOCs appear to be formed photochemically, they exhibit a similar dependence on photolysis, contributing 3 % of the Cl radical budget observed here.
- Article
(919 KB) - Full-text XML
- BibTeX
- EndNote


Oxidation controls the fate of many atmospheric trace gases. For example, increasing the oxidation state of a given species may increase its deposition velocity (Nguyen et al., 2015) or solubility (Carlton et al., 2006) and reduce its volatility (Carlton et al., 2006), all of which act to reduce the atmospheric lifetime of that species and can lead to the formation of secondary material such as secondary organic aerosol (SOA) or ozone (O3). As the identity of the chemical species change with oxidation, intrinsic and diverse properties of the chemical species are altered, influencing their toxicity (Borduas et al., 2015) and their impact on the environment, e.g. cloud-particle nucleating efficiency (Ma et al., 2013) or global warming potential (Boucher et al., 2009).
The hydroxyl radical (OH) is considered the most important daytime atmospheric oxidant due to its ubiquity and high reactivity, with an average tropospheric concentration of 106 molecules cm−3 (Heal et al., 1995). However, rate coefficients for the reaction of the chlorine radical (Cl) can be 2 orders of magnitude larger than those for OH (Spicer et al., 1998), indicating that lower Cl concentrations of 1×10⁴ atoms cm−3 that are estimated to exist in urban areas (e.g. Bannan et al., 2015) can be just as significant in their contribution to oxidation.
Cl-initiated oxidation of volatile organic compounds (VOCs) forms chlorinated analogues of the OH-initiated oxidation products, via addition Eq. (1) or hydrogen abstraction Eq. (2), forming HCl that may react with OH to regenerate Cl. Subsequent peroxy radicals formed through Cl oxidation can take part in the HOx cycle and contribute to the enhanced formation of O3 and SOA (Wang and Ruiz, 2017). This is represented by the following;
where X is OH or Cl.
Nitryl chloride (ClNO2) is a major reservoir of Cl that is produced by aqueous reactions between particulate chloride (Cl−) and nitrogen pentoxide (N2O5), as seen in Eq. (4) and Eq. (6). Gaseous ClNO2 is produced throughout the night and is typically photolysed at dawn before OH concentrations reach their peak, as in Eq. (6). This early morning release of Cl induces oxidation earlier in the day and has been shown to increase maximum 8 h mean O3 concentrations by up to 7 ppb under moderately elevated NOx levels (Sarwar et al., 2014). Typical ClNO2 concentrations measured in urban regions range from 10 s of ppt to 1000 s of ppt. Mielke et al. (2013) measured a maximum of 3.6 ppb (0.04 Hz) during the summertime in Los Angeles, with maximum sunrise concentrations of 800 ppt. Bannan et al. (2015) measured a maximum concentration of 724 ppt (1 Hz) at an urban background site in London during summer. They state that in some instances, ClNO2 concentrations increase after sunrise and attribute this to the influx of air masses with higher ClNO2 concentrations by either advection or from the collapse of the residual mixing layer. In urban environments where NOx emission and subsequent N2O5 production is likely, Cl− may be the limiting reagent in the formation of ClNO2 if excess NO does not reduce NO3 as seen in Eq. (3) before N2O5 is produced (e.g. Bannan et al., 2015). Whilst the distance from a marine source of Cl− may explain low, inland concentrations Faxon et al., 2015), the long-range transport of marine air can elevate inland ClNO2 concentrations (Phillips et al., 2012) and the long-range transport of polluted plumes to a marine location can also elevate ClNO2 concentrations (e.g. Bannan et al., 2017). These processes may be represented by the following equations;
The anthropogenic emission of molecular chlorine is identified as another inland source of Cl− in the US (e.g. Thornton et al., 2010; Riedel et al., 2012) and in China (e.g. Wang et al., 2017; Liu et al., 2017), where some of the highest concentrations 3.0–4.7 ppb have been recorded. As well as industrial processes, the suspension of road salt used to melt ice on roads during the winter has been suggested as a large source of anthropogenic Cl− Mielke et al., 2016). This wintertime-only source, combined with reduced nitrate radical photolysis, is expected to yield greater ClNO2 concentrations at this time of the year (Mielke et al., 2016).
The photolysis of molecular chlorine (Cl2) is another potential source of Cl. Numerous heterogeneous formation mechanisms leading to Cl2 from particles containing Cl− are known. These include the reaction of Cl− and OH (Vogt et al., 1996), which may originate from the photolysis of O3(aq) (Oum, 1998) or from the reactive uptake of ClNO2 (Leu et al., 1995), ClONO2 (Deiber et al., 2004) or HOCl (Eigen and Kustin, 1962) to acidic Cl− containing particles. Thornton et al. (2010) also suggest that inorganic Cl reservoirs such as HOCl and ClONO2 may also enhance the Cl concentration, potentially accounting for the shortfall in the global burden (8–22 Tg yr−1 source from ClNO2 and 25–35 Tg yr−1 as calculated from methane isotopes). This may be direct through photolysis or indirect through heterogenous reactions with Cl− on acidic aerosol.
Globally, Cl2 concentrations are highly variable. In the marine atmosphere, concentrations of up to 35 ppt have been recorded (Lawler et al., 2011), whereas at urban costal sites in the US, concentrations on the order of 100s ppt have been measured (Keene et al., 1993; Spicer et al., 1998). Sampling urban outflow, Riedel et al. (2012) measure a maximum of 200 ppt Cl2 from plumes and mean concentrations of 10 ppt on a ship in the LA basin. Maximum mixing ratios of up to 65 ppt have also been observed in the continental US (Mielke et al., 2011).
More interestingly, these studies (Keene et al., 1993; Lawler et al., 2011; Mielke et al., 2011; Spicer et al., 1998) report maximum Cl2 concentrations at night and minima during the day. However, there is a growing body of evidence suggesting that daytime Cl2 may also be observed. Although the primary emission may be one source of daytime Cl2 (Mielke et al., 2011), others demonstrate that the diurnal characteristics of the Cl2 time series have a broader signal suggestive of continuous processes rather than intermittent signals typically associated with sampling emission sources under turbulent conditions.
In a clean marine environment Liao et al. (2014) observe maximum Cl2 concentrations of 400 ppt attributed to emissions from a local snow pack source. A maximum was measured during the morning and evening with a local minimum during midday caused by photolysis. They also describe negligible night-time concentrations, with significant loss attributed to deposition. Faxon et al. (2015) measured Cl2 with a time-of-flight chemical ionisation mass spectrometry (ToF-CIMS) recording a maximum during the afternoon of 4.8 ppt (0.0016 Hz) and suggesting a local precursor primary source of Cl2 that is potentially soil emission, with further heterogeneous chemistry producing Cl2. At a rural site in northern China, Liu et al. (2017) measured mean concentrations of Cl2 of 100 ppt and a maximum of 450 ppt, peaking during the day; they also report 480 ppt observed in an urban environment in the US during summer. They attribute power-generation facilities burning coal as the source.
Another potential source of Cl to the atmosphere is the photolysis of chlorinated organic compounds (ClVOCs, chlorocarbons, organochlorides) that are emitted from both natural (biomass burning, oceanic and biogenic emission) (e.g. Yokouchi et al., 2000) and anthropogenic sources (e.g. Butler, 2000). Whilst many ClVOCs are only considered chemically important in the stratosphere, those that are photochemically labile in the troposphere, e.g. methyl hypochlorite (CH3OCl), whose absorption cross section is non-negligible at wavelengths as long as 460 nm (Crowley et al., 1994), can act as a source of Cl and take part in oxidative chemistry.
Photolysis of ClVOCs have been postulated to contribute atoms cm−3 globally to the Cl budget of the boundary layer (Hossaini et al., 2016), although on much smaller spatial and temporal scales, the variance in this estimate is likely to be large. Very few data exist on the concentrations, sources and spatial extent of oxygenated ClVOCs (ClOVOCs) and their contribution to the Cl budget.
The ToF-CIMS is a highly selective and sensitive instrument with high mass accuracy and a resolution (m/dm ∼4000) that is capable of detecting a suite of chlorinated compounds, including HOCl and organic chlorine (Le Breton et al., 2018) as well as other oxygenated chlorine species and chloroamines (Wong et al., 2017). Here we use the ToF-CIMS with the I− reagent ion to characterise the sources of chlorine and estimate their contribution to Cl concentrations in the wintertime in Manchester, UK.
Full experimental details and a description of meteorological and air quality measurements can be found in Priestley et al. (2018). A time-of-flight chemical ionisation mass spectrometer (ToF-CIMS) (Lee et al., 2014b) using iodide reagent ions was used to sample ambient air between 29 October and 11 November 2014 at the University of Manchester's southern campus, approximately 1.5 km south of Manchester city centre, UK (53.467∘ N, 2.232∘ W) and 55 km east of the Irish Sea. The sample loss to the 1 m long Perfluoroalkoxy alkane (PFA) inlet was minimised by using a fast inlet pump inducing a flow rate of 15 standard litres per minute (slm) which was subsampled by the ToF-CIMS. Backgrounds were taken every 6 h for 20 min by overflowing dry N2 and were applied consecutively. The overflowing of dry N2 will have a small effect on the sensitivity of the instrument to those compounds whose detection is water dependent. Here we find that due to the low instrumental backgrounds, the absolute error remains small and is an acceptable limitation in order to measure a vast suite of different compounds for which no best practice backgrounding method has been established. Whilst backgrounds were taken infrequently, they are of a comparable frequency to those used in previous studies where similar species are measured (Lawler et al., 2011; Osthoff et al., 2008; Phillips et al., 2012). The stability of the background responses, i.e. for Cl2 0.16±0.07 (1σ) ppt, and the stability of the instrument diagnostics with respect to the measured species suggest that they effectively capture the true instrumental background.
Formic acid was calibrated throughout the campaign and post campaign. Very little deviation in the formic acid calibrations was observed. The mean average sensitivity was 30.66±1.90 (1σ) Hz ppt−1. A number of chlorinated species were calibrated post campaign using a variety of different methods, and relative calibration factors were applied based on measured instrument sensitivity to formic acid as has been performed previously (e.g. Le Breton et al., 2014a, 2017; Bannan et al., 2015). A summary of calibration procedures and species calibrated are described below. All data from between 16:30 LT on 5 November and 00:00 LT on 7 November have been removed to prevent the interference of a large-scale anthropogenic biomass burning event (Guy Fawkes Night) on these analyses.
2.1 Calibrations
We calibrate a number of species by overflowing the inlet with various known concentrations of gas mixtures (Le Breton et al., 2012), including molecular chlorine (Cl2, 99.5 % purity, Aldrich), formic acid (98/100 %, Fisher) and acetic acid (glacial, Fisher) by making known mixtures (in N2) and flowing 0–20 standard cubic centimetres per minute (sccm) into a 3 slm N2 dilution flow that is subsampled. The Cl2 calibration factor is 4.6 Hz ppt−1.
As all chlorinated VOCs we observe are oxygenated we assume the same sensitivity found for 3-chloropropionic acid (10.32 Hz ppt−1) for the rest of the organic chlorine species detected. Chloropropionic acid (Aldrich) was calibrated following the methodology of Lee et al. (2014). A known quantity of chloropropionic acid was dissolved in methanol (Aldrich) and a known volume was doped onto a filter. The filter was slowly heated to 200 ∘C to ensure the total desorption of the calibrant whilst 3 slm N2 flowed over it. This was repeated several times. A blank filter was first used to determine the background.
ClNO2 was calibrated by the method described by Kercher et al. (2009) with N2O5 synthesised following the methodology described by Le Breton et al. (2014)a, giving a calibration factor of 4.6 Hz ppt−1. Excess O3 is generated by flowing 200 sccm O2 (BOC) through an ozone generator (BMT, 802N) and into a 5 L glass volume containing NO2 (σ, > 99.5 %). The outflow from this reaction vessel is cooled in a cold trap held at −78 ∘C (195 K) by a dry ice and glycerol mixture where N2O5 is condensed and frozen. The trap is allowed to reach room temperature and the flow is reversed, where it is then condensed in a second trap held at 195 K. This process is repeated several times to purify the mixture. The system is first purged by flowing O3 for 10 min before use. To ascertain the N2O5 concentration on the line, the flow is diverted through heated line to decompose the N2O5 and into to a Thermo Scientific 42i NOx analyser, where it is detected as NO2. It is known that the Thermo Scientific 42i NOx analyser suffers from interferences from NOy species, indicating that this method could cause an underestimation of the ClNO2 concentrations reported here. Based on previous studies (e.g. Le Breton et al., 2014; Bannan et al., 2017) where comparisons with a broad-beam cavity-enhancement absorption spectrometer (BBCEAS) have been made, good agreement has been found between co-located N2O5 measurements. We feel that this calibration method works well, likely in part due to the high purity of the N2O5 synthesised and because the possible interference of NOy on the NOx analyser during this calibration is considered negligible. The N2O5 is passed over a salt slurry where excess chloride may react to produce ClNO2. The drop in the N2O5 signal is equated to the rise in ClNO2, as the stoichiometry of the reaction is 1:1. The conversion efficiency of N2O5 to ClNO2 over wet NaCl is known to vary by 60 %–100 % (Hoffman et al., 2003; Roberts et al., 2008). Here we follow the methodology of Osthoff et al. (2008) and Kercher et al. (2009) that ensures that conversion is 100 % efficient, so we assume a 100 % yield in this study.
We developed a secondary novel method to quantify ClNO2 by cross-calibration with a turbulent flow tube chemical ionisation mass spectrometer (TF-CIMS) (Leather et al., 2012). Chlorine atoms were produced by combining a 2.0 slm flow of He with a 0–20 sccm flow of 1 % Cl2, which was then passed through a microwave discharge produced by a surfatron (Sairem) cavity operating at 100 W. The Cl atoms were titrated via a constant flow of 20 sccm NO2 (99.5 % purity NO2 cylinder, Aldrich) from a diluted (in N2) gas mix to which the TF-CIMS has been calibrated. This flow is carried in 52 slm N2 that is purified by flowing through two heated molecular sieve traps. This flow is subsampled by the ToF-CIMS where the I. adduct is measured. The TF-CIMS is able to quantify the concentration of ClNO2 generated in the flow tube as the equivalent drop in signal. This indirect measurement of ClNO2 is similar in its methodology to ClNO2 calibration by quantifying the loss of N2O5 reacted with Cl− (e.g. Kercher et al., 2009). We do not detect an increase in I.Cl2 signal from this calibration and so rule out the formation of Cl2 from inorganic species in our inlet due to unknown chemistry occurring in the IMR. The TF-CIMS method gives a calibration factor 58 % greater than that of the N2O5 synthesis method. The Cl atom titration method assumes a 100 % conversion to ClNO2 and does not take into account any Cl atom loss, which will lead to a reduced ClNO2 concentration and thus a greater calibration factor. Also, the method assumes a 100 % sampling efficiency between the TF-CIMS and ToF-CIMS; again this could possibly lead to an increased calibration factor. Whilst the new method of calibration is promising, we assume that the proven method developed by Kercher et al. (2009) is the correct calibration factor and assign an error of 50 % to that calibration factor. We feel that the difference between the two methods is taken into account by our measurement uncertainty.
We calibrate HOCl using the methodology described by Foster et al. (1999) giving a calibration factor of 9.22 Hz ppt−1. 100 sccm N2 is flowed through a fritted bubbler filled with NaOCl solution (min 8 % chlorine, Fisher) that meets a dry 1.5 slm N2 flow, with the remaining flow made up of humidified ambient air, generating the HOCl and Cl2 signal measured on the ToF-CIMS. The flow from the bubbler is diverted through a condensed HCl (σ) scrubber (condensed HCl on the wall of 20 cm PFA tubing) where HOCl is titrated to form Cl2. The increase in Cl2 concentration when the flow is sent through the scrubber is equal to the loss of HOCl signal and as the calibration factor for Cl2 is known, the relative calibration factor for HOCl to Cl2 is found.
Additionally, several atmospherically relevant ClVOCs were sampled in the laboratory to assess their detectability by the ToF-CIMS with I−. The instrument was able to detect dichloromethane (DCM, VWR), chloroform (CHCl3, 99.8 %, Aldrich) and methyl chloride (CH3Cl, synthesised), although the instrument response was poor. The response to 3-chloropropionic acid was orders of magnitude greater than for the ClVOCs suggesting that the role of the chlorine atom is negligible compared with the carboxylic acid group in determining the I− sensitivity in this case.
2.2 Cl radical budget calculations
Within this system, we designate ClNO2, HOCl and organic chlorine as sources of Cl. As HCl was not detected, it is not possible to quantify the contribution of Cl from the reaction of HCl + OH. Loss processes of Cl are Cl + O3 and Cl + CH4 (7). Photolysis rates for the Cl sources are taken from the US National Center for Atmospheric Research (NCAR) Tropospheric Ultraviolet and Visible TUV radiation model (Mandronich, 1987) assuming a 100 % quantum yield at our latitude and longitude with a column overhead O3 measured by the Brewer spectrophotometer #172 (Smedley et al., 2012) and assuming zero optical depth. To account for the effective optical depth of the atmosphere, including clouds and other optical components, we scale our idealised photolysis rate coefficient (J) by the observed transmittance values in the UV-A waveband (325 to 400 nm). These transmittance values are calculated from UV spectral scans of global irradiance, measured at half-hourly intervals by the Brewer spectrophotometer and provided as an output of the SHICrivm analysis routine (Slaper et al., 1995). The Cl rate coefficient for the reaction with O3 is cm3 molecule−1 s−1 (Atkinson et al., 2006b) and CH4 is cm3 molecule−1 s−1 (Atkinson et al., 2006a). The individual kCl+VOC are taken from the NIST chemical kinetics database. This is represented by the following equation;
As methane was not measured, an average concentration was taken from the European Centre for Medium-Range Weather Forecasts (ECMWF) Copernicus atmosphere monitoring service (CAMS). VOC concentrations were approximated by applying representative VOC : benzene ratios for the UK urban environment (Derwent et al., 2000) and applying those to a typical urban UK benzene : CO ratio (Derwent et al., 1995), where CO was measured at the Whitworth observatory. The VOC : benzene ratios are scaled to the year of this study to best approximate ambient levels (Derwent et al., 2014). The calculated benzene : CO ratio is in good agreement with a Non-Automatic Hydrocarbon Network monitoring site (Manchester Piccadilly) approximately 1.5 km from the measurement location, indicating that the approximation made here is reasonably accurate. The ratios assume that traffic emissions are the dominant source of the VOCs, as is assumed here.
The photosensitivity of the ClOVOCs to wavelengths longer than 280 nm dictates their ability to contribute to the Cl budget in the troposphere. As many of the identified species here do not have known photolysis rates, we approximate the photolysis of methyl hypochlorite for all ClOVOCs, as it is the only available photolysis rate for an oxygenated organic compound containing a chlorine atom provided by the TUV model and no other more suitable photolysis rate could be found elsewhere, e.g. the JPL kinetics database. The same quantum yield and actinic flux assumptions are made.
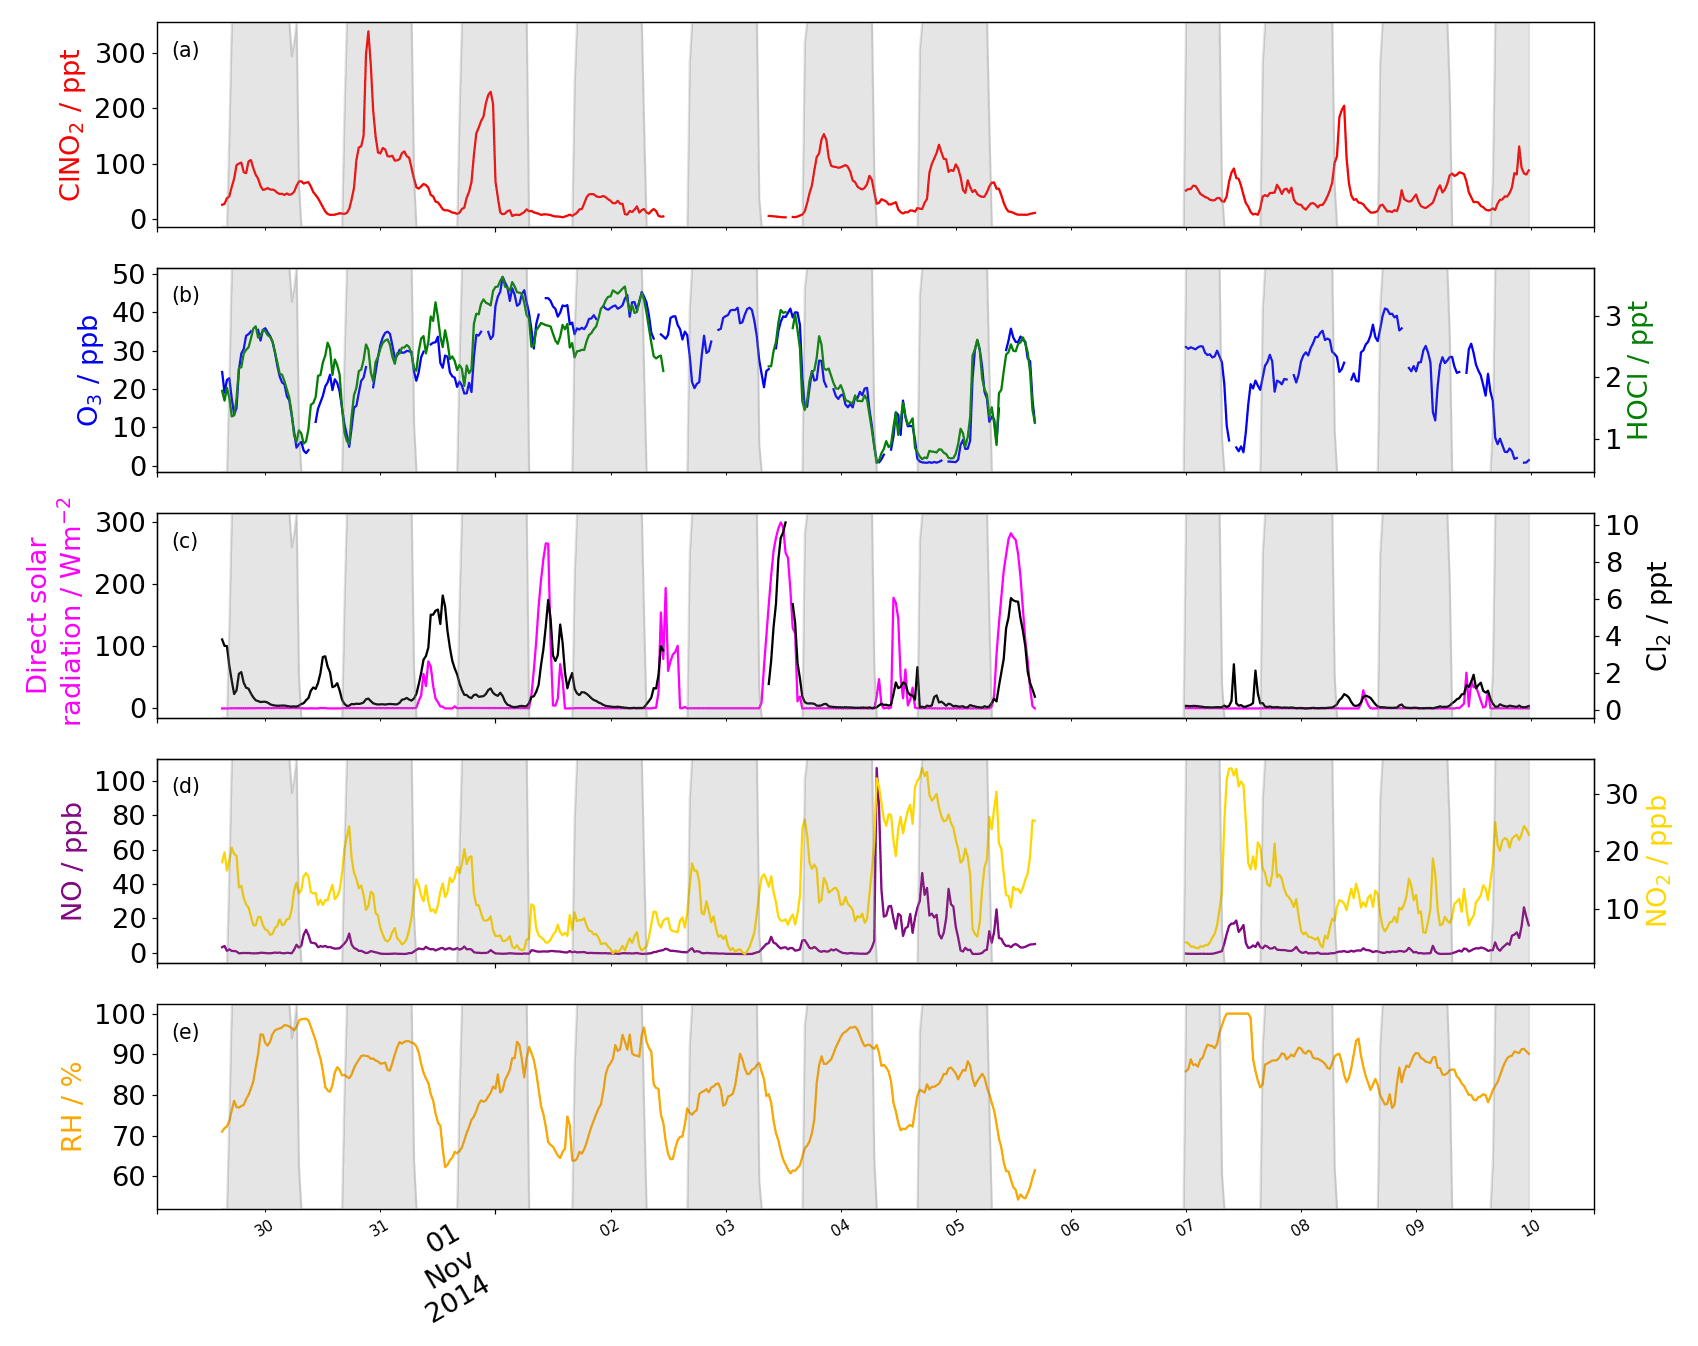
Figure 1Time series of (a) ClNO2 (ppt), (b) HOCl (ppt) and O3 (ppb), and (c) Cl2 (ppt) and direct solar radiation (Wm−2). (d) NO (ppb) and NO2 (ppb). (e) Relative humidity (%). Data is removed during bonfire night (5–6) and HOCl data is discounted thereafter due to a persistent interference that was not present earlier.
Concentrations of all chlorinated species are higher at the beginning of the measurement campaign, when air masses originating from continental Europe were sampled (Reyes-Villegas et al., 2018). Toward the end of the measurement campaign, ClNO2 and ClOVOCs concentrations were low, which is consistent with the pollution during this period having a high fraction of primary components (Reyes-Villegas et al., 2018), see Fig. 1.
3.1 Inorganic chlorine
We detect a range of inorganic chlorine species and fragments including I.Cl−, I.ClO−, I.HOCl−, I., I. and I., however we do not detect I., I.Cl2O−, I., I.ClNO− or I.HCl−. Laboratory studies have shown that the ToF-CIMS is sensitive to detection of I.HCl−, however under this configuration, the I.HCl− adduct was not observed. The statistics of the concentrations reported below do not take into account the limits of detection (LOD), so for some of the measurements, values may be reported below the LOD.
3.1.1 ClNO2
ClNO2 (m∕z 208) was detected every night of the campaign with an LOD (3× standard deviation of the background) of 3.8 ppt. The 1 Hz mean night-time concentration of ClNO2 was 58 ppt (not accounting for the LOD), and a maximum of 506 ppt (not accounting for the LOD) was measured as a large spike on the evening of 30 October. These concentrations are comparable to other urban UK measured values, although the maximum concentration reported here is 30 % lower than that measured in London (Bannan et al., 2015) but is consistent with high concentrations expected during the winter, as discussed in the introduction.
The diurnal profile of ClNO2 increases through the evening to a local morning maximum, with rapid loss after sunrise. Although we observe a rapid build-up after sunset (ca. 16:30 LT) and loss after sunrise (ca. 07:30 LT), the maximum concentration measured within a given 24 h period typically peaks at around 22:00 LT and halves by 03:00 LT, where it is maintained. The reasons for the early onset in peak concentration and loss throughout the night is unclear, although on 1 November, a sharp decrease in ClNO2 is a consequence of a change in wind direction, indicating that the source of ClNO2 is directional. A minimum concentration of < LOD is reached by 15:00 LT, indicating that concentrations can persist for much of the day. On 7 November ClNO2 concentrations grow throughout the morning, even after photolysis begins, until 11:00 LT. Correlated high wind speeds suggest that the long-range transport and downward mixing is a likely cause for this daytime increase.
Typically, elevated concentrations of ClNO2 are measured when the wind direction is easterly and wind speeds are low (2–4 ms−1), also during periods of southerly winds between 3–9 ms−1. The potential sources of Cl− precursor from these directions are industrial sites, including waste water treatment facilities (8.5 km east and 7.0 km south) that may use salt water as part of the chemical disinfection process (Ghernaout and Ghernaout, 2010). Another source of the ClNO2 precursor is found from the southwest at wind speeds of 9 ms−1, indicating a more distant source that is also likely to be industrial or marine. The correlation between ClNO2 and Cl2 is poor at most times, apart from the night of the 30 where a strong linear relationship is observed. This is consistent with polluted continental air masses advecting a variety of trace gases. Throughout the measurement campaign the relationship between ClNO2 and Cl2 is poor, so it is unlikely they share the same source.
3.1.2 HOCl
HOCl concentrations average 2.18 ppt (not accounting for the LOD) and reach a daytime maximum of 9.28 ppt with an LOD of 3.8 ppt. Concentrations peak in the early afternoon, similarly to Cl2, but remain elevated for longer, dropping after sunset. The diurnal profile is similar to that for O3, with a maximum during the day and minima during morning and evening rush hours when NOx is emitted locally. The strong correlation with O3 (R2=0.67) is expected, as the route to the formation of HOCl is the oxidation of Cl with O3 to form ClO and then the oxidation by HO2 to form HOCl. Non-negligible night-time concentrations of a maximum 8.1 ppt are only measured when concentrations of other inorganic Cl containing species are high. The HOCl signal is artificially elevated after the night of the 5 due to a persistent interference from a large-scale biomass burning event (Guy Fawkes Night, Priestley et al., 2018), which cannot be de-convolved from the dataset due to the small difference in their mass-to-charge ratios and insufficient instrument resolution. For this reason HOCl data after this date are discounted from the analysis.
3.1.3 ClO
We detect the I.ClO− adduct at m∕z 178, which strongly correlates with I. and I.Cl− signals, all of which show night-time maxima. This is inconsistent with the ClO photochemical production pathway of Cl + O3, suggesting that its maximum concentration should be measured during the day, as was observed for HOCl. It is not possible to confirm if the I.ClO− is a fragment of a larger ClO containing molecule, however, as the fragmentation of multiple larger molecules are detected as a single adduct, e.g. the I.Cl− cluster is a known fragment from ClNO2 and HOCl, it is reasonable to suspect that I.ClO− may be a fragment as well.
3.1.4 Cl2
We observe concentrations of Cl2 during the day ranging from 0–16.6 ppt with a mean value of 2.3 ppt (not accounting for the LOD) and night-time concentrations of 0–4.7 ppt with mean concentrations of 0.4 ppt (not accounting for the LOD), see Fig. 1. The LOD is 0.5 ppt and a calibration factor of 4.5 Hz ppt−1 was found. These concentrations are of the same order of magnitude as measured at an urban site in the US but up to 2 orders of magnitude smaller than at US urban costal sites (Keene et al., 1993; Spicer et al., 1998) and a megacity impacted rural site in northern China (Liu et al., 2017). Although the maximum measured value here is an order of magnitude greater than that measured in Houston (Faxon et al., 2015), the photolysis rate of Cl2 here is 2 orders of magnitude smaller compared with Houston at that time.

Figure 2Time series for 1 November 2014, with (a) Cl2, (b) solar radiation (global, direct and indirect), (c) photochemical marker C2H4O5, and (d) O3 and NOx, where highlighted boxes demonstrate that is increasing. The increase in concentration of Cl2, C2H4O5 and O3 production when VOC limited are strongly coupled with direct solar radiation. Greyed areas are night time.
The diurnal profile of Cl2 exhibits a maximum at midday and a minimum at night (early morning) consistent with other studies (Faxon et al., 2015; Liao et al., 2014; Liu et al., 2017). The days with the greatest concentration are those where direct shortwave radiation is at its highest. On 5 November, the incidence of direct shortwave radiation is unhindered throughout the day and a similarly uniform profile for Cl2 is also observed. On 1 November, Cl2 concentrations increase unhindered as direct radiation increases but when cloud cover reduces radiation transmission efficiency, a corresponding drop in Cl2 is also observed (Fig. 2). Also, when global radiation is low throughout the day, e.g. 7 November, we observe very low concentrations of Cl2.
There is the potential that the Cl2 signal detected is an instrumental artefact generated either by chemistry in the IMR or from displacement reactions or degassing on the inlet walls. We believe none of these to be the case. First, the correlation between the signal used for labile chlorine in the IMR 35Cl (m∕z 35) is high with ClNO2 (R2=0.98) yet is non-existent with Cl2 (R2=0.01) indicating Cl2 concentration is independent of 35Cl concentrations. Second, there is no correlation between HNO3 and Cl2 (R2=0.07) which suggests that acid displacement reactions are not occurring on the inlet walls. Third, there is no correlation between temperature and Cl2 (R2=0.08), indicating that localised ambient inlet heating is also not a contributing factor to increased Cl2 concentrations. Fourth, we observe a similar direct radiation dependency for other photochemical species as we observe for Cl2. For example, the temporal behaviour of C2H4O5 exhibits a similar diurnal profile and radiation dependency (Fig. 2). Also, the production of O3 increases and decreases with direct solar radiation at the same times we observe the enhancements in concentrations of Cl2 and C2H4O5 (Fig. 2). The changes in O3 production are observed when NO concentrations are near zero, indicating that O3 production is VOC limited. Finally, other large organic molecules e.g. C10H14O4 do not exhibit this strong coupling with direct solar radiation. This evidence suggests that a local photolytic daytime mechanism is responsible for the increase in daytime concentrations as has previously been suggested (e.g. Finley and Saltzman, 2006).
Although peak concentrations of Cl2 are observed in the daytime, high levels of Cl2 are also observed during the night. At the beginning of the measurement period, which has previously been characterised using an aerosol mass spectrometer (AMS) as a period of high secondary activity (Reyes-Villegas et al., 2018), there are persistent, non-zero concentrations of Cl2 (≤4 ppt) after sunset. On 4 November, after the period of high secondary activity, intermittent elevations in night-time Cl2 concentrations when the wind is northerly suggest that a local emission source, with concentrations reaching a maximum of 4.6 ppt. Two more distinct night-time sources, ranging from the south west through to the east of the measurement site, indicate a likely origin in industrial areas, some of which contain chemical production and water treatment facilities.
3.2 Organic chlorine
We detected seven C2−C6 ClOVOCs of the forms CnH2n+1O1Cl, CnH2n+1O2Cl, CnH2n+1O3Cl, CnH2n−1O2Cl, CnH2n−1O3Cl and CnH2n−3O2Cl (Fig. 3), of which only C2H3O2Cl has been previously reported (Le Breton et al., 2018). We find no evidence for the detection of small chlorohydrocarbons, e.g. poly-chloromethanes, such as methyl chloride, dimethyl chloride and chloroform, or poly-chloroethanes such as those described by Huang et al. (2014) in the ambient data, but qualitative testing and laboratory calibrations show that the iodide reagent ion can detect CH3Cl (not calibrated), CH2Cl2 (LOD = 143 ppb) and CHCl3 (LOD = 11 ppb). We find no discernible evidence for the detection of 4-chlorocrotonaldehyde, the Cl oxidation product of 1,3-butadiene and unique marker of chlorine chemistry (Wang and Finlayson-Pitts, 2001) due to interferences from other CHO compounds. We do not believe that these species are products of inlet reactions as there is a poor correlation () with labile chlorine 35Cl.
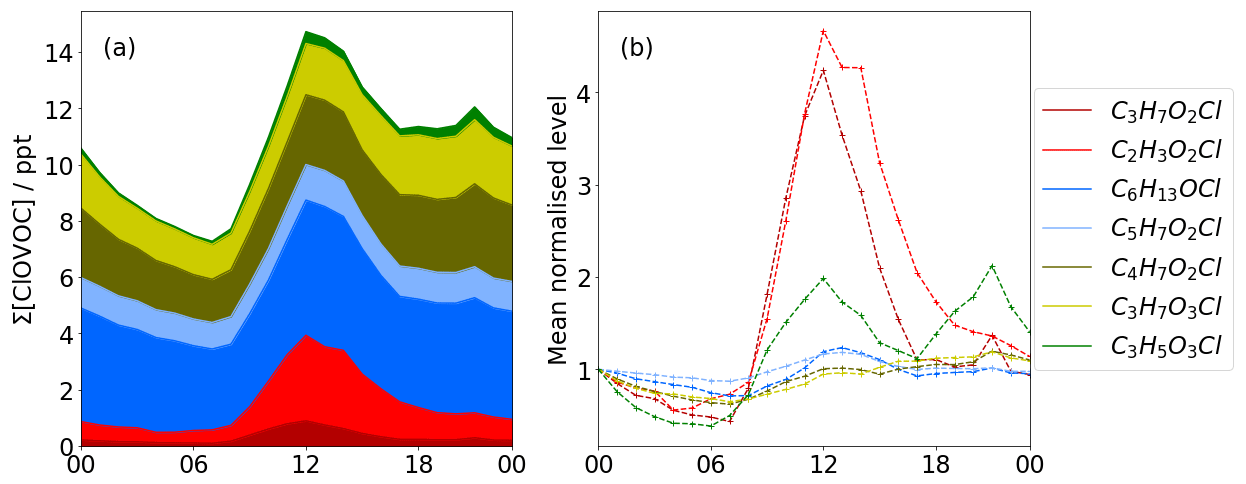
Figure 3Diurnal profiles of Cl VOCs. (a) Stacked plot showing total Cl VOC concentration. (b) The first data point of each diurnal trace is mean normalised to 1.0. Reds show photochemical dominated signals with maxima at midday, whereas yellow and blue traces show a more typical diurnal concentration profile associated with changes in boundary layer height, indicating that these species have longer lifetimes.
The maximum hourly averaged total ClOVOCs concentration is 28 ppt at 12:00 LT and at a minimum of 5 ppt at 07:00 LT, when NOx concentrations are highest at ∼30 ppb. Concentrations of C2H3O2Cl (tentatively identified as chloroacetic acid) and C6H13OCl (tentatively identified as chloro-hexanol) are the highest of any ClOVOCs, accounting for between 20 % and 30 % of total ClOVOCs concentrations measured. All concentrations rise towards midday, with C3H7O2Cl and C2H3O2Cl rising the most by a factor of 4 and returning to nominal levels by the early evening (red in Fig. 3). C3H7O2Cl and C2H3O2Cl correlate well with Cl2 (R2 0.77 and 0.75, respectively), which is consistent with a photochemical formation mechanism identifying these species as secondary products, potentially chloro-propanediol and chloro-acetic acid.
Whilst the diurnal profiles of C6H13OCl and C5H7O2Cl (blue in Fig. 3) are similar to those of C3H7O2Cl and C2H3O2Cl, they do not enhance as much as those photochemical species or return to nominal levels after the solar maximum. Instead, they increase again during the night, with C3H5O3Cl reaching a maximum concentration of 8 ppt at 20:00 LT. This trend suggests that concentration changes could be a function of boundary layer height.
C3H7O2Cl and C4H7O2Cl (yellow in Fig. 3) are the only ClOVOCs that show a positive correlation with NOx (R2=0.42, R2=0.41) and negative correlation with O3 (, ). Their correlation is stronger with NO2 (R2=0.55, R2=0.48), a product of traffic emission. This suggests that at least some of the time, they accumulate at low wind speeds, indicating their origins as local, primary emissions or as thermal degradation products that have a traffic source, e.g. polychlorinated dibenzodioxins/dibenzofurans (PCDD/F) and their oxidation products (Fuentes et al., 2007; Heeb et al., 2013). The diurnal profile shows maxima during midday consistent with other photochemical species, which is expected of secondary formation. It is possible that these compounds are isobaric or isomeric with the other compounds that interfere with the perceived signals recorded here.
The diurnal profile of C3H5O3Cl (green in Fig. 3) exhibits a similar shape to the bimodal distribution observed for NOx. Cross-correlation indicates that a time lag of −3 h provides the best correlation with NO2 of R2=0.80. This suggests that local oxidation chemistry, which takes place over long periods in the day and is sensitive to traffic emission, is the source of this ClOVOC.
4.1 Effect of global radiation transmission efficiency on Cl radical production
Three days are selected based on their different solar short wave transmission efficiencies to quantify the variation in Cl2 formation and photolysis and thus the influence of Cl2 on producing Cl. The average transmission of global radiation on 5 November was high with 84±14 % (1σ), whereas on 7 November it was very low with 21±14 %, sometimes dropping below 10 % in the middle of the day. The middle case is represented by 1 November, where the transmission efficiency in the morning was high with 88±11 %, but in the afternoon it was highly variable and dropped to 55±20 % (see Fig. 4). These 3 days provide good case studies for the investigation of the effect of global radiation on molecular chlorine concentrations and therefore the production of Cl.
The reduced transmission efficiency inhibits Cl2 formation, thereby reducing the contribution of Cl2 to Cl production. The lower transmission efficiency also reduces the photolysis of Cl2 and so reduces the production of Cl even further. Figure 5 shows the divergence between the ideal without transmission efficiency correction (a), the value scaled by transmission efficiency (b) and subsequent Cl formation. Cl production rates are similar until 11:00 LT, when the scaled production then becomes an average 47 % lower. This is most prominent at 13:00 LT, when the difference between ideal and scaled production is 8.4×10⁴ Cl radicals cm−3 s−1.
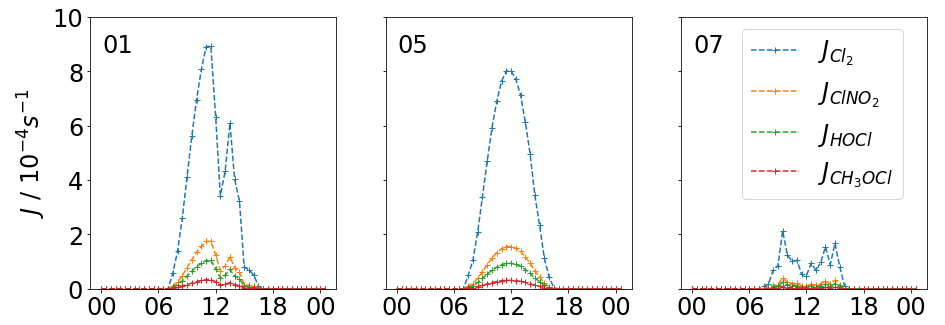
Figure 4Transmission scaled J values for Cl2, ClNO2 and HOCl for 1, 5 and 7 November, where 1 November had high photolysis rates in the morning that were reduced during the afternoon, 5 November is the closest to a full day's ideal photolysis and 7 November shows very weak photolysis.
4.2 Contribution of inorganic chlorine to Cl radical production
The contribution of HOCl and ClOVOCs to Cl formation is negligible due to low photolysis rates and low concentrations, whereas the contributions from Cl2 and ClNO2 are much greater (Fig. 6). During the morning of 5 November, ClNO2 is the dominant source of Cl, contributing 95 % of the total Cl concentration, a maximum of 3.0×10³ Cl radicals cm−3, to the steady-state concentration, which is approximately a factor of 3 lower than the estimated maximum concentration of 9.5×10³ Cl radicals cm3 produced by ClNO2 photolysis in London during the summer (Bannan et al., 2015) and a factor of 22 lower than the maximum concentration of 85.0×10³ Cl radicals cm−3 calculated from measurements of ClNO2 in Houston (Faxon et al., 2015). In both instances, this is due to a combination of lower and lower ClNO2 concentrations.
As the day progresses, concentrations of Cl2 increase and it becomes the dominant and more sustained source of Cl by contributing 95 % of Cl (12.5×10³ Cl radicals cm−3) by the early afternoon, which is approximately 4× that of the ClNO2 measured in the early morning and 1.3× higher than the maximum estimated concentration calculated from the ClNO2 photolysis in London (Bannan et al., 2015). The maximum Cl concentration produced from Cl2 and ClNO2 photolysis on 5 November reached 14.2×10³ Cl radicals cm3 at 11:30 LT which is approximately 16 % of the 85.0×10³ Cl,radicals cm3 maximum calculated value from the photolysis of these two species in Houston in summer (Faxon et al., 2015). This is dominated by the contribution of Cl2, indicating that Cl2 can be a much more significant source of Cl than ClNO2. On this high-flux day, when hourly mean Cl2 concentrations range between 0–7 ppt, the source term is calculated between 4–21 ppt Cl2 h−1, which is slightly lower, although consistent with previous studies (Faxon et al., 2015; Finley and Saltzman, 2006; Spicer et al., 1998).
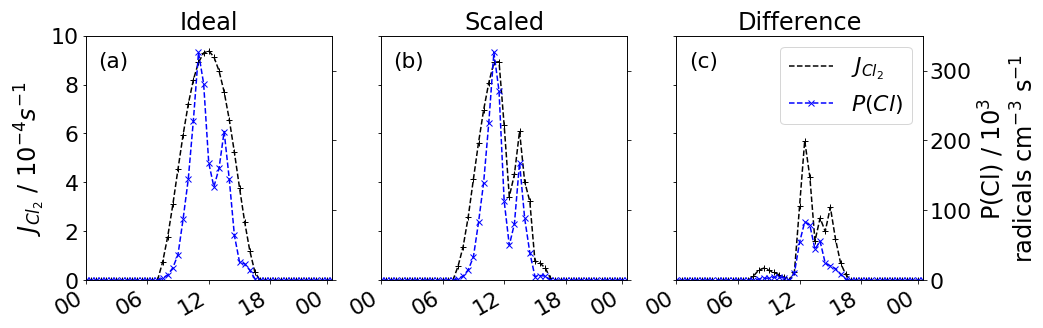
Figure 5Diurnal profile for 1 November of (a) idealised and P(Cl), (b) scaled and P(Cl), and (c) the difference between (a) and (b). Transmission efficiency scaled photolysis reduce P(Cl) from Cl2 photolysis.
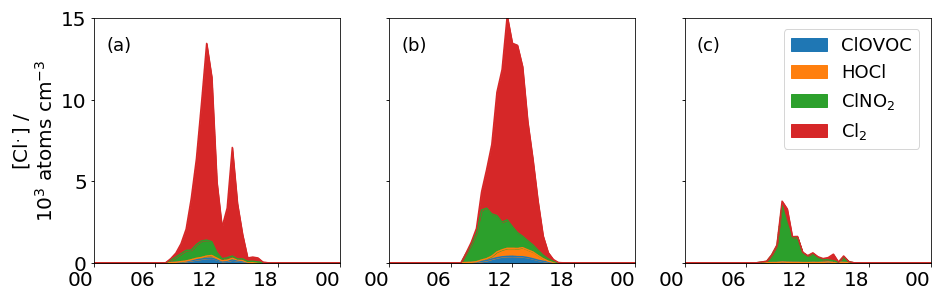
Figure 6Steady state concentration of Cl from ClNO2, Cl2, HOCl and total ClOVOC photolysis for (a) 1 November, (b) 5 November, and (c) 7 November. The importance of ClNO2 during the morning is most evident on the 5, with a diminishing contribution throughout the day. On the high-flux days, Cl2 is the most important source of Cl, but on the low-flux day, ClNO2 is most important.
A day with low photolysis rates and high daytime ClNO2 concentrations has been highlighted as 7 November. On this day, ClNO2 is the dominant Cl source (95 %) reaching a maximum of 3.4×10³ Cl radicals cm−3 at 09:30 LT, which is ∼87 % of that calculated for London (Bannan et al., 2015). A mean Cl2 concentration of 0.3 ppt (less than the LOD of 0.5 ppt) on this day is very low, as production of Cl2 at its maximum, calculated as 0.6 ppt h−1, is also low. This combined with a low maximum of h−1 means that maximum Cl production from Cl2 photolysis on this day is very low, generating 0.9×10³ Cl radicals cm−3 at 10:00 LT or a quarter of the maximum contributed by ClNO2 on this day (see Fig. 6). This is represented by the following equation;
The dependency of Cl formation on Cl2 production and loss highlights the sensitivity of this reaction channel to the photolysis that is demonstrated on these 2 days. The production of Cl from ClNO2 is less sensitive, relatively speaking, to the solar flux, as the production of ClNO2 does not rely on photochemistry but chemical composition cf. Eqs. (6) and (8). This further highlights the role of photolytic mechanisms in the re-activation of particulate chloride to gaseous chlorine radicals.
4.3 Organic vs. inorganic contribution to Cl radical production
Summing the concentrations of the ClOVOCs and assuming a uniform photolysis rate as detailed in the above section, we derive the contribution of total measured ClOVOC to the Cl budget and compare it to the contribution from inorganic Cl measured here (Fig. 6). On the high-flux day, the Cl concentration reaches 4.0×10² Cl radicals cm−3 at midday, which is 30 % of the contribution by ClNO2, 3.6 % of the contribution from Cl2 and 2 % of the HOCl contribution for the same day. On the low-flux day, the ClOVOC contribution is 11.0×10² Cl radicals cm−3, which is ∼2.8 % of the ClNO2 contribution on that day and ∼57 % of the Cl2 contribution. Like Cl2, the production of most ClOVOC requires a photolytic step to generate concentrations that can then go on to decompose, providing the Cl. Here it is suggested that the organic contribution to Cl production is negligible at 15 % on the low radiant-flux day and 3 % on the high-flux day.
A large suite of inorganic and organic, oxygenated, chlorinated compounds has been identified in ambient, urban air during the wintertime in the UK. Of the seven organic chlorinated compounds (ClOVOCs) identified here, only C2H3O2ClO (tentatively assigned as chloroacetic acid) has previously been reported. Although the ToF-CIMS with I− is sensitive towards chlorinated and polychlorinated aliphatic compounds, e.g. methyl chloride (CH3Cl) dimethyl chloride (CH2Cl2) and chloroform (CHCl3), their concentrations were below the detection limit. The sources of ClOVOCs are mostly photochemical with maxima of up to 28 ppt observed at midday, although C3H7O3Cl and C4H7O2Cl concentrations correlate with NOx accumulating at low wind speeds, indicating they are produced locally, potentially as the thermal breakdown products of higher-mass chlorinated species such as polychlorinated dibenzodioxins/dibenzofurans (PCDD/F) from car exhausts or the oxidation products thereof. C3H5O3Cl shows a good diurnal cross-correlation with NO2 with a time lag of 3 h, suggesting that its production is sensitive to NOx concentrations on that time scale.
Alongside ClOVOCs, daytime concentrations of Cl2 and ClNO2 are measured, reaching maxima of 17 and 506 ppt, respectively. ClNO2 is a source of Cl in every daytime period measured. Cl2 shows strong evidence of a daytime production pathway limited by photolysis as well as emission sources evident during the evening and night time.
On a day of high radiant flux (84±14 % of idealised values), Cl2 is the dominant source of Cl, generating a maximum steady state concentration of 12.5×10³ Cl radicals cm−3 or 74 % of the total Cl produced by the photolysis of Cl2, ClNO2, HOCl and ClOVOC, with the latter three contributing 19 %, 4 % and 3 %, respectively. This contrasts with a share of 14 % for Cl2, 83 % for ClNO2 and 3 % for ClOVOCs on a low radiant-flux day (21±14 % of idealised values). On the low radiance day, not only is the photolysis of all Cl species inhibited, reducing Cl concentrations, but also the formation of Cl2 and some ClOVOCs by photochemical mechanisms is inhibited, thus the variability in contribution between days is highly sensitive to the incidence of sunlight. This further highlights the importance of photochemistry in the re-activation of particulate chloride to gaseous chlorine radicals. Similarly to Cl2, ClOVOCs can be an important source of Cl, although the behaviour of their contribution is similar to Cl2, relying on high rates of photolysis rather than high concentrations as is the case for ClNO2.
The contribution of the ClOVOCs to the Cl budget would be better determined if more specific photolysis rates for each compound were available and so would further improve the accuracy of the contribution they make to the Cl budget. In addition, future work should aim to identify the processes leading to the formation of these compounds to better constrain the Cl budget in the urban atmosphere. Further ambient measurements of a broader suite of chlorinated species as shown here in different chemical environments would help to better constrain the contribution that chlorine-initiated chemistry has on a global scale.
The data are to be uploaded to http://catalogue.ceda.ac.uk/ (last access: 20 September 2018).
MP, MlB, TJB and AB operated the CIMS during for the measurement period. Data analysis was performed by MP, MIB and TJB. ERV and JA aided with data analysis. The manuscript was written by MP. MP, SDW and AM performed laboratory calibrations. ARDS and AW provided transmittance data and contributed to that section of the manuscript. DES and CJP provided assistance with the steady-state calculation. DES, CJP and HC supported with project management and manuscript refinement.
The authors declare that they have no conflict of interest.
This work was conducted during a PhD study supported by the Natural Environment Research Council (NERC) EAO Doctoral Training Partnership and is
fully funded by NERC, whose support is gratefully acknowledged (Grant ref
no. NE/L002469/1).
Edited by: Steven Brown
Reviewed by: two anonymous referees
Atkinson, R., Baulch, D., Cox, R., and Crowley, J.: Summary of Evaluated Kinetic and Photochemical Data for Atmospheric Chemistry, Web Version, February 2006, IUPAC Subcomm. Gas Kinet. Data Eval. Atmos. Chem., 1–60, 2006a.
Atkinson, R., Baulch, D. L., Cox, R. A., Crowley, J. N., Hampson, R. F., Hynes, R. G., Jenkin, M. E., Rossi, M. J., Troe, J., and IUPAC Subcommittee: Evaluated kinetic and photochemical data for atmospheric chemistry: Volume II – gas phase reactions of organic species, Atmos. Chem. Phys., 6, 3625–4055, https://doi.org/10.5194/acp-6-3625-2006, 2006b.
Bannan, T. J., Murray Booth, A., Bacak, A., Muller, J. B. A., Leather, K. E., Le Breton, M., Jones, B., Young, D., Coe, H., Allan, J., Visser, S., Slowik, J. G., Furger, M., Prévôt, A. S. H., Lee, J., Dunmore, R. E., Hopkins, J. R., Hamilton, J. F., Lewis, A. C., Whalley, L. K., Sharp, T., Stone, D., Heard, D. E., Fleming, Z. L., Leigh, R., Shallcross, D. E., and Percival, C. J.: The first UK measurements of nitryl chloride using a chemical ionization mass spectrometer in central London in the summer of 2012, and an investigation of the role of Cl atom oxidation, J. Geophys. Res., 120, 5638–5657, https://doi.org/10.1002/2014JD022629, 2015.
Bannan, T. J., Bacak, A., Le Breton, M., Flynn, M., Ouyang, B., McLeod, M., Jones, R., Malkin, T. L., Whalley, L. K., Heard, D. E., Bandy, B., Khan, M. A. H., Shallcross, D. E., and Percival, C. J.: Ground and Airborne U.K. Measurements of Nitryl Chloride: An Investigation of the Role of Cl Atom Oxidation at Weybourne Atmospheric Observatory, J. Geophys. Res.-Atmos., 122, 11154–11165, https://doi.org/10.1002/2017JD026624, 2017.
Borduas, N., Da Silva, G., Murphy, J. G., and Abbatt, J. P. D.: Experimental and theoretical understanding of the gas phase oxidation of atmospheric amides with OH radicals: Kinetics, products, and mechanisms, J. Phys. Chem. A, 119, 4298–4308, https://doi.org/10.1021/jp503759f, 2015.
Boucher, O., Friedlingstein, P., Collins, B., and Shine, K. P.: The indirect global warming potential and global temperature change potential due to methane oxidation, Environ. Res. Lett., 4, 044007, https://doi.org/10.1088/1748-9326/4/4/044007, 2009.
Butler, J.: Better budgets for methyl halides?, Nature, 403, 260–261, https://doi.org/10.1038/35002232, 2000.
Carlton, A. G., Turpin, B. J., Lim, H. J., Altieri, K. E., and Seitzinger, S.: Link between isoprene and secondary organic aerosol (SOA): Pyruvic acid oxidation yields low volatility organic acids in clouds, Geophys. Res. Lett., 33, 2–5, https://doi.org/10.1029/2005GL025374, 2006.
Crowley, N., Helleis, F., Miiller, R., Moortgat, G. K., Crutzen, P. J., and Orlando, J. J.: CH3OCI: UV/visible absorption cross sections, J values and atmospheric significance, J. Geophys. Res., 99, 20683–20688, 1994.
Deiber, G., George, Ch., Le Calvé, S., Schweitzer, F., and Mirabel, Ph.: Uptake study of ClONO2 and BrONO2 by Halide containing droplets, Atmos. Chem. Phys., 4, 1291–1299, https://doi.org/10.5194/acp-4-1291-2004, 2004.
Derwent, R. G., Middleton, D. R., Field, R. A., Goldstone, M. E., Lester, J. N., and Perry, R.: Analysis and interpretation of air quality data from an urban roadside location in Central London over the period from July 1991 to July 1992, Atmos. Environ., 29, 923–946, https://doi.org/10.1016/1352-2310(94)00219-B, 1995.
Derwent, R. G., Davies, T. J., Delaney, M., Dollard, G. J., Field, R. A., Dumitrean, P., Nason, P. D., Jones, B. M. R., and Pepler, S. A.: Analysis and interpretation of the continuous hourly monitoring data for 26 C 2 -C 8 hydrocarbons at 12 United Kingdom sites during, 1996. Atmos. Environ., 34, 297–312, 2000.
Derwent, R. G., Dernie, J. I. R., Dollard, G. J., Dumitrean, P., Mitchell, R. F., Murrells, T. P., Telling, S. P., and Field, R. A.: Twenty years of continuous high time resolution volatile organic compound monitoring in the United Kingdom from 1993 to 2012, Atmos. Environ., 99, 239–247, https://doi.org/10.1016/j.atmosenv.2014.10.001, 2014.
Eigen, M. and Kustin, K.: The Kinetics of Halogen Hydrolysis, J. Am. Chem. Soc., 84, 1355–1361, https://doi.org/10.1021/ja00867a005, 1962.
Faxon, C., Bean, J., and Ruiz, L.: Inland Concentrations of Cl2 and ClNO2 in Southeast Texas Suggest Chlorine Chemistry Significantly Contributes to Atmospheric Reactivity, Atmosphere, 6, 1487–1506, https://doi.org/10.3390/atmos6101487, 2015.
Finley, B. D. and Saltzman, E. S.: Measurement of Cl2 in coastal urban air, Geophys. Res. Lett., 33, 6–9, https://doi.org/10.1029/2006GL025799, 2006.
Foster, K. L., Caldwell, T. E., Benter, T., Langer, S., Hemminger, J. C., Finlayson-pitts, B. J., and November, A.: Techniques for quantifying gaseous HOCl using atmospheric pressure ionization mass spectrometry, Phys. Chem. Chem. Phys., 1, 5615–5621, doi:Doi 10.1039/A907362k, 1999.
Fuentes, M. J., Font, R., Gómez-Rico, M. F., and Martín-Gullón, I.: Pyrolysis and combustion of waste lubricant oil from diesel cars: Decomposition and pollutants, J. Anal. Appl. Pyrol., 79, 215–226, https://doi.org/10.1016/j.jaap.2006.12.004, 2007.
Ghernaout, D. and Ghernaout, B.: From chemical disinfection to electrodisinfection: The obligatory itinerary?, Desalin. Water Treat., 16, 156–175, https://doi.org/10.5004/dwt.2010.1085, 2010.
Heal, M., Heard, D., Pilling, M., and Whitaker, B.: On the Development and Validation of FAGE for Local Measurement of Tropospheric OH and HO2, J. Atmos. Sci., 52, 3428–3441, https://doi.org/10.1175/1520-0469(1995)052<3428:OTDAVO>2.0.CO;2, 1995.
Heeb, N. V., Zennegg, M., Haag, R., Wichser, A., Schmid, P., Seiler, C., Ulrich, A., Honegger, P., Zeyer, K., Emmenegger, L., Bonsack, P., Zimmerli, Y., Czerwinski, J., Kasper, M., and Mayer, A.: PCDD/F formation in an iron/potassium-catalyzed diesel particle filter, Environ. Sci. Technol., 47, 6510–6517, https://doi.org/10.1021/es400760h, 2013.
Hoffman, R. C., Gebel, M. E., Fox, B. S., and Finlayson-Pitts, B. J.: Knudsen cell studies of the reactions of N2O5 and ClONO2 with NaCl: development and application of a model for estimating available surface areas and corrected uptake coefficients, Phys. Chem. Chem. Phys., 5, 1780–1789, https://doi.org/10.1039/b301126g, 2003.
Hossaini, R., Chipperfield, M. P., Saiz-Lopez, A., Fernandez, R., Monks, S., Feng, W., Brauer, P., and von Glasow, R.: A global model of tropospheric chlorine chemistry: Organic versus inorganic sources and impact on methane oxidation, J. Geophys. Res.-Atmos., 121, 14271–14297, https://doi.org/10.1002/2016JD025756, 2016.
Huang, B., Lei, C., Wei, C., and Zeng, G.: Chlorinated volatile organic compounds (Cl-VOCs) in environment – sources, potential human health impacts, and current remediation technologies, Environ. Int., 71, 118–138, https://doi.org/10.1016/j.envint.2014.06.013, 2014.
Keene, W. C., Maben, J. R., Pszenny, A. A. P., and Galloway, J. N.: Measurement Technique for Inorganic Chlorine Gases in the Marine Boundary Layer, Environ. Sci. Technol., 27, 866–874, https://doi.org/10.1021/es00042a008, 1993.
Kercher, J. P., Riedel, T. P., and Thornton, J. A.: Chlorine activation by N2O5: simultaneous, in situ detection of ClNO2 and N2O5 by chemical ionization mass spectrometry, Atmos. Meas. Tech., 2, 193–204, https://doi.org/10.5194/amt-2-193-2009, 2009.
Lawler, M. J., Sander, R., Carpenter, L. J., Lee, J. D., von Glasow, R., Sommariva, R., and Saltzman, E. S.: HOCl and Cl2 observations in marine air, Atmos. Chem. Phys., 11, 7617–7628, https://doi.org/10.5194/acp-11-7617-2011, 2011.
Leather, K. E., Bacak, A., Wamsley, R., Archibald, A. T., Husk, A., Shallcross, E., and Percival, C. J.: Temperature and pressure dependence of the rate coefficient for the reaction between ClO and CH3O2 in the gas-phase, Phys. Chem. Chem. Phys., 14, 3425–3434, https://doi.org/10.1039/c2cp22834c, 2012.
Le Breton, M., McGillen, M. R., Muller, J. B. A., Bacak, A., Shallcross, D. E., Xiao, P., Huey, L. G., Tanner, D., Coe, H., and Percival, C. J.: Airborne observations of formic acid using a chemical ionization mass spectrometer, Atmos. Meas. Tech., 5, 3029–3039, https://doi.org/10.5194/amt-5-3029-2012, 2012.
Le Breton, M., Bacak, A., Muller, J. B. A., Xiao, P., Shallcross, B. M. A., Batt, R., Cooke, M. C., Shallcross, D. E., Bauguitte, S. J.-B. and Percival, C. J.: Simultaneous airborne nitric acid and formic acid measurements using a chemical ionization mass spectrometer around the UK: Analysis of primary and secondary production pathways, Atmos. Environ., 83, 166–175, https://doi.org/10.1016/j.atmosenv.2013.10.008, 2014a.
Le Breton, M., Bacak, A., Muller, J. B. A., Bannan, T. J., Kennedy, O., Ouyang, B., Xiao, P., Bauguitte, S. J.-B., Shallcross, D. E., Jones, R. L., Daniels, M. J. S., Ball, S. M., and Percival, C. J.: The first airborne comparison of N2O5 measurements over the UK using a CIMS and BBCEAS during the RONOCO campaign, Anal. Methods, 6, 9731–9743, https://doi.org/10.1039/C4AY02273D, 2014b.
Le Breton, M., Bannan, T. J., Shallcross, D. E., Khan, M. A., Evans, M. J., Lee, J., Lidster, R., Andrews, S., Carpenter, L. J., Schmidt, J., Jacob, D., Harris, N. R. P., Bauguitte, S., Gallagher, M., Bacak, A., Leather, K. E., and Percival, C. J.: Enhanced ozone loss by active inorganic bromine chemistry in the tropical troposphere, Atmos. Environ., 155, 21–28, https://doi.org/10.1016/j.atmosenv.2017.02.003, 2017.
Le Breton, M., Hallquist, Å. M., Pathak, R. K., Simpson, D., Wang, Y., Johansson, J., Zheng, J., Yang, Y., Shang, D., Wang, H., Liu, Q., Chan, C., Wang, T., Bannan, T. J., Priestley, M., Percival, C. J., Shallcross, D. E., Lu, K., Guo, S., Hu, M., and Hallquist, M.: Chlorine oxidation of VOCs at a semi-rural site in Beijing: significant chlorine liberation from ClNO2 and subsequent gas- and particle-phase Cl-VOC production, Atmos. Chem. Phys., 18, 13013–13030, https://doi.org/10.5194/acp-18-13013-2018, 2018.
Lee, B. H., Lopez-Hilfiker, F. D., Mohr, C., Kurtén, T., Worsnop, D. R., and Thornton, J. A.: An iodide-adduct high-resolution time-of-flight chemical-ionization mass spectrometer: Application to atmospheric inorganic and organic compounds, Environ. Sci. Technol., 48, 6309–6317, https://doi.org/10.1021/es500362a, 2014.
Leu, M.-T., Timonen, R. S., Keyser, L. F., and Yung, Y. L.: Heterogeneous Reactions of HNO3(g) + NaCl(s) .fwdarw. HCl(g) + NaNO3(s) and N2O5(g) + NaCl(s) .fwdarw. ClNO2(g) + NaNO3(s), J. Phys. Chem., 99, 13203–13212, https://doi.org/10.1021/j100035a026, 1995.
Liao, J., Huey, L. G., Liu, Z., Tanner, D. J., Cantrell, C. A., Orlando, J. J., Flocke, F. M., Shepson, P. B., Weinheimer, A. J., Hall, S. R., Ullmann, K., Beine, H. J., Wang, Y., Ingall, E. D., Stephens, C. R., Hornbrook, R. S., Apel, E. C., Riemer, D., Fried, A., Mauldin, R. L., Smith, J. N., Staebler, R. M., Neuman, J. A., and Nowak, J. B.: High levels of molecular chlorine in the Arctic atmosphere, Nat. Geosci., 7, 91–94, https://doi.org/10.1038/ngeo2046, 2014.
Liu, X., Qu, H., Huey, L. G., Wang, Y., Sjostedt, S., Zeng, L., Lu, K., Wu, Y., Hu, M., Shao, M., Zhu, T., and Zhang, Y.: High Levels of Daytime Molecular Chlorine and Nitryl Chloride at a Rural Site on the North China Plain, Environ. Sci. Technol., 51, 9588–9595, https://doi.org/10.1021/acs.est.7b03039, 2017.
Ma, Y., Brooks, S. D., Vidaurre, G., Khalizov, A. F., Wang, L., and Zhang, R.: Rapid modification of cloud-nucleating ability of aerosols by biogenic emissions, Geophys. Res. Lett., 40, 6293–6297, https://doi.org/10.1002/2013GL057895, 2013.
Mandronich, S.: Photodissociation in the Atmosphere Actinic Flux and the Effects of Ground Reflections and Clouds, J. Geophys. Res., 92, 9740–9752, 1987.
Mielke, L. H., Furgeson, A., and Osthoff, H. D.: Observation of ClNO2 in a mid-continental urban environment, Environ. Sci. Technol., 45, 8889–8896, https://doi.org/10.1021/es201955u, 2011.
Mielke, L. H., Stutz, J., Tsai, C., Hurlock, S. C., Roberts, J. M., Veres, P. R., Froyd, K. D., Hayes, P. L., Cubison, M. J., Jimenez, J. L., Washenfelder, R. A., Young, C. J., Gilman, J. B., De Gouw, J. A., Flynn, J. H., Grossberg, N., Lefer, B. L., Liu, J., Weber, R. J., and Osthoff, H. D.: Heterogeneous formation of nitryl chloride and its role as a nocturnal NOx reservoir species during CalNex-LA 2010, J. Geophys. Res.-Atmos., 118, 10638–10652, https://doi.org/10.1002/jgrd.50783, 2013.
Mielke, L. H., Furgeson, A., Odame-Ankrah, C. A., and Osthoff, H. D.: Ubiquity of ClNO2 in the urban boundary layer of Calgary, Alberta, Canada, Can. J. Chem., 94, 414–423, https://doi.org/10.1139/cjc-2015-0426, 2016.
Nguyen, T. B., Crounse, J. D., Teng, A. P., St. Clair, J. M., Paulot, F., Wolfe, G. M., and Wennberg, P. O.: Rapid deposition of oxidized biogenic compounds to a temperate forest, P. Natl. Acad. Sci. USA, 112, E392–E401, https://doi.org/10.1073/pnas.1418702112, 2015.
Osthoff, H. D., Roberts, J. M., Ravishankara, A. R., Williams, E. J., Lerner, B. M., Sommariva, R., Bates, T. S., Coffman, D., Quinn, P. K., Dibb, J. E., Stark, H., Burkholder, J. B., Talukdar, R. K., Meagher, J., Fehsenfeld, F. C., and Brown, S. S.: High levels of nitryl chloride in the polluted subtropical marine boundary layer, Nat. Geosci., 1, 324–328, https://doi.org/10.1038/ngeo177, 2008.
Oum, K. W.: Formation of Molecular Chlorine from the Photolysis of Ozone and Aqueous Sea-Salt Particles, Science, 279, 74–76, https://doi.org/10.1126/science.279.5347.74, 1998.
Phillips, G. J., Tang, M. J., Thieser, J., Brickwedde, B., Schuster, G., Bohn, B., Lelieveld, J., and Crowley, J. N.: Significant concentrations of nitryl chloride observed in rural continental Europe associated with the influence of sea salt chloride and anthropogenic emissions, Geophys. Res. Lett., 39, 1–5, https://doi.org/10.1029/2012GL051912, 2012.
Reyes-Villegas, E., Priestley, M., Ting, Y.-C., Haslett, S., Bannan, T., Le Breton, M., Williams, P. I., Bacak, A., Flynn, M. J., Coe, H., Percival, C., and Allan, J. D.: Simultaneous aerosol mass spectrometry and chemical ionisation mass spectrometry measurements during a biomass burning event in the UK: insights into nitrate chemistry, Atmos. Chem. Phys., 18, 4093–4111, https://doi.org/10.5194/acp-18-4093-2018, 2018.
Riedel, T. P., Bertram, T. H., Crisp, T. A., Williams, E. J., Lerner, B. M., Vlasenko, A., Li, S. M., Gilman, J., De Gouw, J., Bon, D. M., Wagner, N. L., Brown, S. S., and Thornton, J. A.: Nitryl chloride and molecular chlorine in the coastal marine boundary layer, Environ. Sci. Technol., 46, 10463–10470, https://doi.org/10.1021/es204632r, 2012.
Roberts, J. M., Osthoff, H. D., Brown, S. S., and Ravishankara, A. R.: N2O5 oxidizes chloride to Cl2 in acidic atmospheric aerosol, Science, 321, 1059, https://doi.org/10.1126/science.1158777, 2008.
Sarwar, G., Simon, H., Xing, J., and Mathur, R.: Importance of tropospheric ClNO2 chemistry across the Northern Hemisphere, Geophys. Res. Lett., 41, 4050–4058, https://doi.org/10.1002/2014GL059962, 2014.
Slaper, H., Blumthaler, M., Huber, M., and Kuik, E.: Comparing ground-level spectrally resolved solar UV measurements using various instruments: A technique resolving effects of wavelength shift and slit width, Geophys. Res. Lett., 22, 2721–2724, 1995.
Smedley, A. R. D., Rimmer, J. S., Moore, D., Toumi, R., and Webb, A. R.: Total ozone and surface UV trends in the United Kingdom: 1979-2008, Int. J. Climatol., 32, 338–346, https://doi.org/10.1002/joc.2275, 2012.
Spicer, C. W., Chapman, E. G., Finlayson-Pitts, B. J., Plastridge, R. A., Hubbe, J. M., Fast, J. D., and Berkowitz, C. M.: Unexpectedly high concentrations of molecular chlorine in coastal air, Nature, 394, 353–356, https://doi.org/10.1038/28584, 1998.
Thornton, J. A., Kercher, J. P., Riedel, T. P., Wagner, N. L., Cozic, J., Holloway, J. S., Dubé, W. P., Wolfe, G. M., Quinn, P. K., Middlebrook, A. M., Alexander, B., and Brown, S. S.: A large atomic chlorine source inferred from mid-continental reactive nitrogen chemistry, Nature, 464, 271–274, https://doi.org/10.1038/nature08905, 2010.
Vogt, R., Crutzen, P. J., and Sander, R.: A mechanism for halogen release from sea-salt aerosol in the remote marine boundary layer, Nature, 383, 327–330, https://doi.org/10.1038/383327a0, 1996.
Wang, D. S. and Ruiz, L. H.: Secondary organic aerosol from chlorine-initiated oxidation of isoprene, Atmos. Chem. Phys., 17, 13491–13508, https://doi.org/10.5194/acp-17-13491-2017, 2017.
Wang, W. H. and Finlayson-Pitts, B. J.: Unique markers of chlorine atom chemistry in coastal urban areas: The reaction with 1,3-butadiene in air at room temperature, J. Geophys. Res., 106, 4939–4958, https://doi.org/10.1029/2000jd900683, 2001.
Wang, X., Wang, H., Xue, L., Wang, T., Wang, L., Gu, R., Wang, W., Tham, Y. J., Wang, Z., Yang, L., Chen, J., and Wang, W.: Observations of N2O5 and ClNO2 at a polluted urban surface site in North China: High N2O5 uptake coefficients and low ClNO2 product yields, Atmos. Environ., 156, 125–134, https://doi.org/10.1016/j.atmosenv.2017.02.035, 2017.
Wong, J. P. S., Carslaw, N., Zhao, R., Zhou, S., and Abbatt, J. P. D.: Observations and impacts of bleach washing on indoor chlorine chemistry, Indoor Air, 27, 1082–1090, https://doi.org/10.1111/ina.12402, 2017.
Yokouchi, Y., Noijiri, Y., Barrie, L. A., Toom-Sauntry, D., Machida, T., Inuzuka, Y., Akimoto, H., Li, H. J., Fujinuma, Y., and Aoki, S.: A strong source of methyl chloride to the atmosphere from tropical coastal land, Nature, 403, 295–298, https://doi.org/10.1038/35002049, 2000.