the Creative Commons Attribution 4.0 License.
the Creative Commons Attribution 4.0 License.
 | 14 Sep 2018
Ground-based observation of clusters and nucleation-mode particles in the Amazon
Daniela Wimmer
Stephany Buenrostro Mazon
Hanna Elina Manninen
Juha Kangasluoma
Alessandro Franchin
Tuomo Nieminen
John Backman
Jian Wang
Chongai Kuang
Radovan Krejci
Joel Brito
Fernando Goncalves Morais
Scot Turnbull Martin
Paulo Artaxo
Markku Kulmala
Veli-Matti Kerminen
Tuukka Petäjä
We investigated atmospheric new particle formation (NPF) in the Amazon rainforest using direct measurement methods. To our knowledge this is the first direct observation of NPF events in the Amazon region. However, previous observations elsewhere in Brazil showed the occurrence of nucleation-mode particles. Our measurements covered two field sites and both the wet and dry season. We measured the variability of air ion concentrations (0.8–12 nm) with an ion spectrometer between September 2011 and January 2014 at a rainforest site (T0t). Between February and October 2014, the same measurements were performed at a grassland pasture site (T3) as part of the GoAmazon 2014/5 experiment, with two intensive operating periods (IOP1 and IOP2 during the wet and the dry season, respectively). The GoAmazon 2014/5 experiment was designed to study the influence of anthropogenic emissions on the changing climate in the Amazon region. The experiment included basic aerosol and trace gas measurements at the ground, remote sensing instrumentation, and two aircraft-based measurements.
The results presented in this work are from measurements performed at ground level at both sites. The site inside the rainforest (T0t) is located 60 km NNW of Manaus and influenced by pollution about once per week. The pasture (T3) site is located 70 km downwind from Manaus and influenced by the Manaus pollution plume typically once per day or every second day, especially in the afternoon. No NPF events were observed inside the rainforest (site T0t) at ground level during the measurement period. However, rain-induced ion and particle bursts (hereafter, “rain events”) occurred frequently (643 of 1031 days) at both sites during the wet and dry season, being most frequent during the wet season. During the rain events, the ion concentrations in three size ranges (0.8–2, 2–4, and 4–12 nm) increased up to about 104–105 cm−3. This effect was most pronounced in the intermediate and large size ranges, for which the background ion concentrations were about 10–15 cm−3 compared with 700 cm−3 for the cluster ion background.
We observed eight NPF events at the pasture site during the wet season. We calculated the growth rates and formation rates of neutral particles and ions for the size ranges 2–3 and 3–7 nm using the ion spectrometer data. The observed median growth rates were 0.8 and 1.6 nm h−1 for 2–3 nm sized ions and particles, respectively, with larger growth rates (13.3 and 7.9 nm h−1) in the 3–7 nm size range. The measured nucleation rates were of the order of 0.2 cm−3 s−1 for particles and 4– cm−3 s−1 for ions. There was no clear difference in the sulfuric acid concentrations between the NPF event days and nonevent days ( cm−3). The two major differences between the NPF days and nonevent days were a factor of 1.8 lower condensation sink on NPF event days ( s−1) compared to nonevents ( s−1) and different air mass origins.
To our knowledge, this is the first time that results from ground-based sub-3 nm aerosol particle measurements have been obtained from the Amazon rainforest.
- Article
(7946 KB) - Full-text XML
- BibTeX
- EndNote


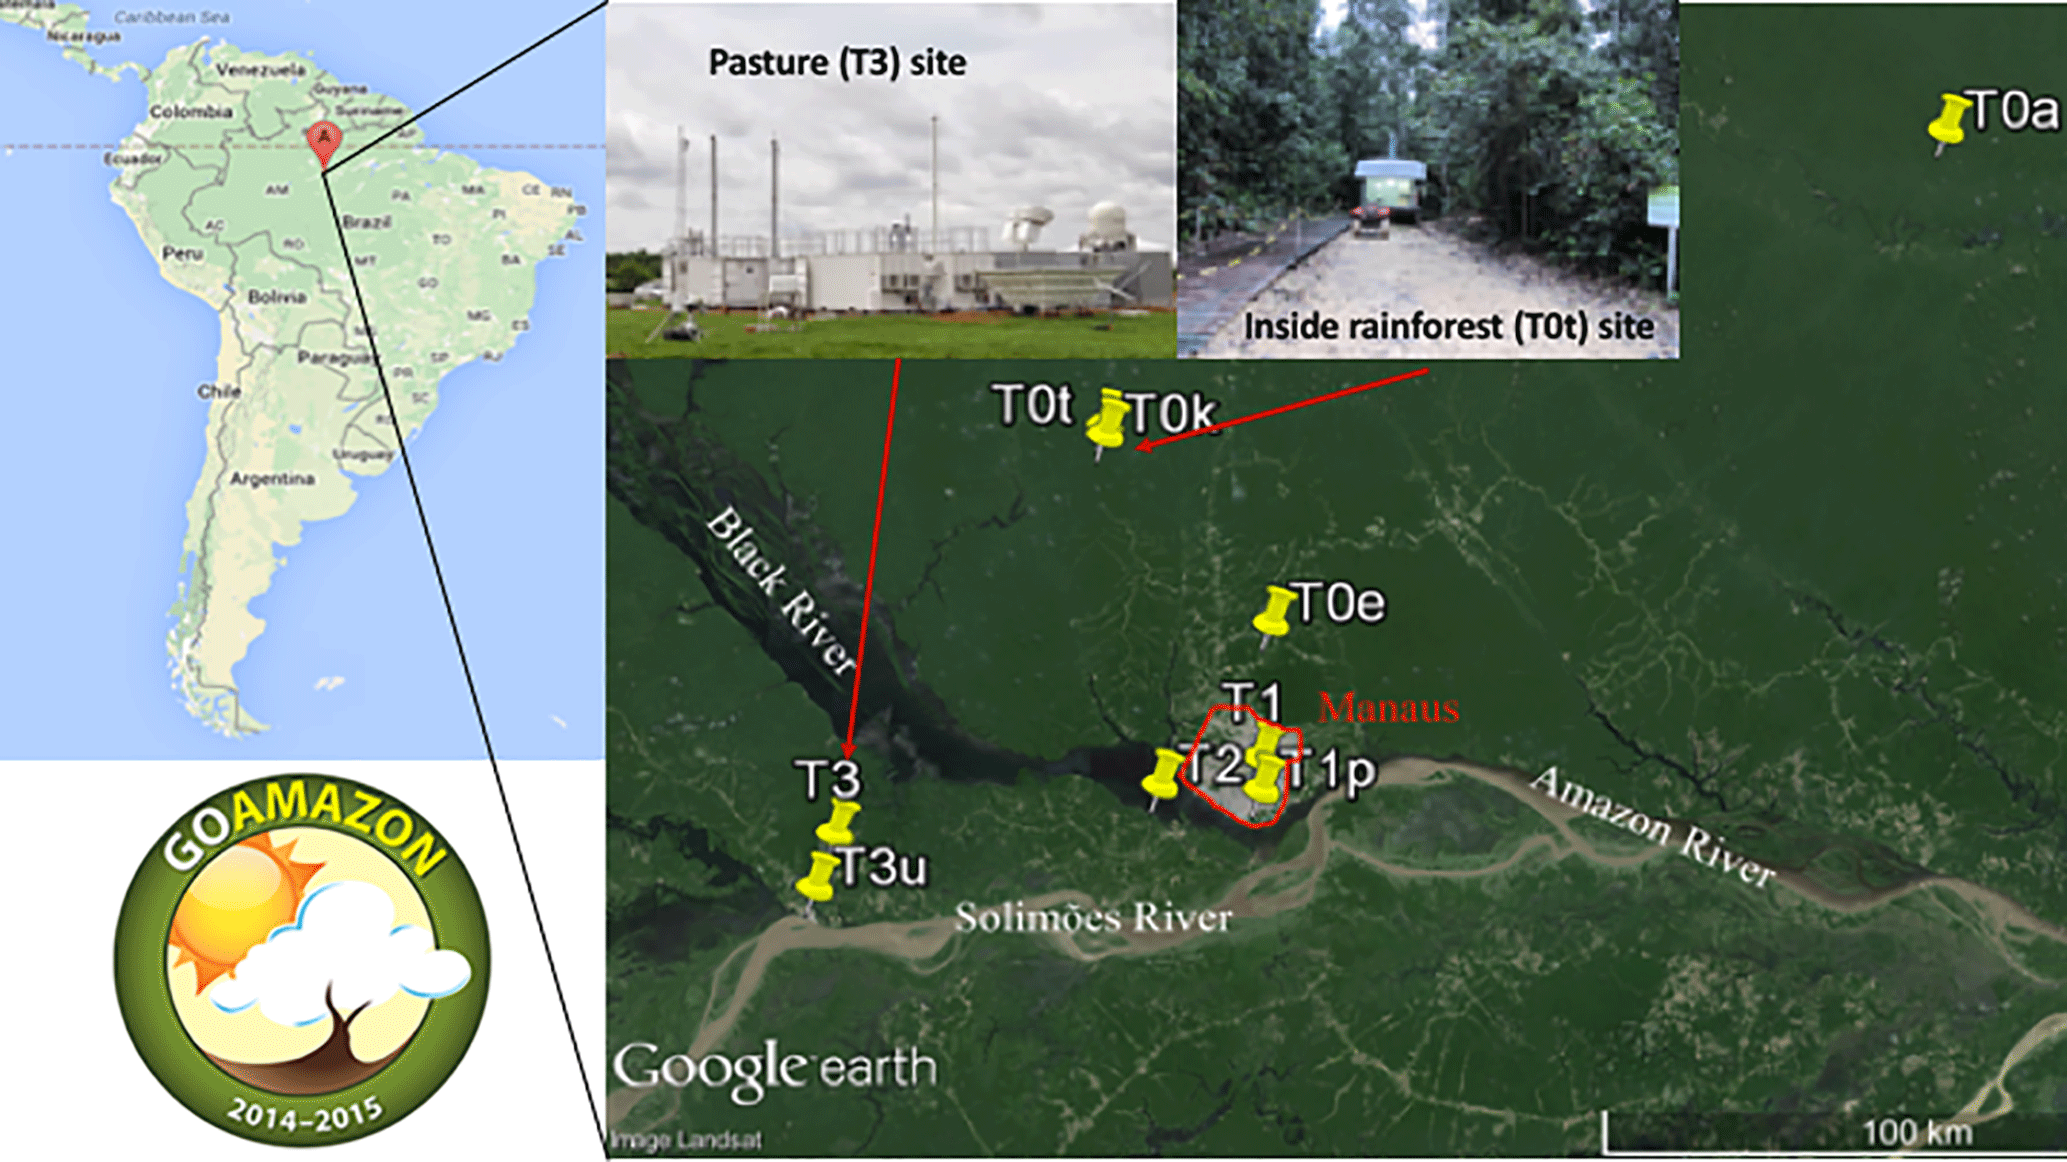
Figure 1The location on the map and photos of the inside rainforest (T0t) and open pasture (T3) sampling sites in Amazonas are shown here. The left column shows a map of South America and the right-hand side shows a satellite view and photos of the T0t and T3 environment.
Globally, atmospheric new particle formation (NPF) and growth has been estimated to account for a major, if not dominant, fraction of cloud condensation nuclei (Merikanto et al., 2009; Wang and Penner, 2009; Yu and Luo, 2009; Dunne et al., 2016; Kulmala et al., 2016). The formation of atmospheric nanoparticles is a multi-stage process, in which stable clusters form from gas-phase precursors, followed by the activation of these clusters and their further growth (Kulmala et al., 2014). Although atmospheric NPF is occurring frequently in many environments (e.g., Kulmala et al., 2004; Manninen et al., 2010), the Amazon basin is one of the locations where the initial steps in the formation of nanoparticles have not been previously observed from ground-based measurements (Martin et al., 2010a).
In the Amazon basin, emissions and oxidation of volatile organic compounds (e.g., Lelieveld et al., 2008), aerosol activation to cloud droplets, and eventually rain formation are tightly connected with synoptic processes, such as deep convection (e.g., Lelieveld et al., 2008; Wang et al., 2016). Aerosol concentrations in the Amazonian atmosphere are rapidly changing as a result of deforestation and the associated biomass burning and economic development in the Amazon region (Martin et al., 2016; Artaxo et al., 2013). The Manaus metropolis (population 2 million) is the capital of the state of Amazonia, Brazil, surrounded by the largest rainforest on Earth (Martin et al., 2017), as shown in Fig. 1.
The measurements discussed in this paper took place at two different locations in the Amazon rainforest: a pasture site 70 km downwind from Manaus (T3; Martin et al., 2016) and a site within the rainforest mostly unaffected by Manaus pollution (T0t; Martin et al., 2010b). The sites are described in more detail in Sect. 2.1. Depending on the wind direction, these sites can represent (i) one of the most anthropogenically undisturbed continental locations on Earth or (ii) a location affected by both polluted and clean air masses (Martin et al., 2016). The complexity of the mixture of trace gases and aerosol population make the Amazon rainforest an interesting place to study. During most of the wet season, the Amazon basin is one of the cleanest continental regions on Earth (Andreae, 2007; Martin et al., 2010a; Artaxo et al., 2013; Andreae et al., 2015). During the dry season, the Amazon basin is highly influenced by anthropogenic emissions, mostly from biomass burning. Additionally, our study region experiences frequent high-intensity precipitation episodes.
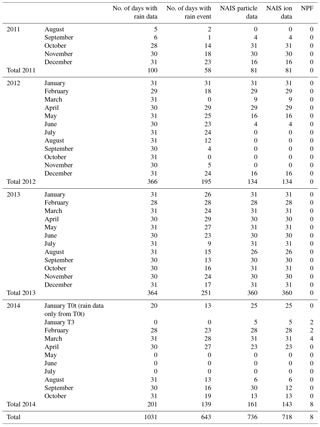
Table 1Overall data availability for the measurements presented in the paper.
The primary goal of this paper was to investigate the characteristics of the wet and the dry season at different sampling locations and the occurrence of NPF and growth in the Amazon region, as well as to quantify the role of ions and aerosol particles in this process.
The measurements inside the rainforest at site T0t were performed over 3 years from September 2011 to January 2014. The second measurement site (T3) was part of the Green Ocean Amazon (GoAmazon2014/5) experiment (Martin et al., 2016). The GoAmazon2014/5 experiment operated from 1 January 2014 to 31 December 2015. The experiment included two intensive operation periods (IOP1 and IOP2). IOP1 extended from 1 February 2014 to 31 March 2014 and IOP2 from 15 August 2014 to 15 October 2014 (Martin et al., 2016). The ion spectrometer measurements were conducted from 28 January to 13 October 2014. Figure 1 shows the locations of both measurement sites. Table 1 shows an overview of the available dataset presented in this study.
2.1 Measurement sites
2.1.1 Measurement site inside the rainforest
The T0t ecological reserve (Martin et al., 2010b) is a terrestrial ecosystem science measurement site located 70 km NNW of the Manaus metropolis in the central region of Brazil (2.609∘ S, 60.2092∘ W). Two major rivers, the Solimões and the Rio Negro, converge in Manaus to become the Amazon River. The city of Manaus is the capital of the state of Amazonia, Brazil, with more than 2 million inhabitants. It is the seventh biggest city in Brazil and is surrounded by forest for 1500 km in all directions (Martin et al., 2016).
T0t is surrounded by a dense rainforest. The rainforest canopy is homogeneous with an average height of 30 m. T0t is influenced by anthropogenic pollution about once per week (Martin et al., 2010b, Supplement; Thalmann et al., 2017; de Sá et al., 2017). Otherwise, the location of the T0t site allows for the characterization of an almost completely undisturbed environment (Martin et al., 2016).
2.1.2 Open pasture measurement site
The open pasture site, T3, is influenced by the Manaus pollution plume typically once per day or every second day, especially in the afternoon (Martin et al., 2010b, Supplement; Thalmann et al., 2017; de Sá et al., 2017). A mobile facility from the Atmospheric Radiation Measurement (ARM) Program (Mather and Voyles, 2013) of the United States Department of Energy was deployed at the T3 site close to Manacapuru, about 70 km downwind of the city of Manaus (3.2133∘ S, 60.5987∘ W), and included an ARM Mobile Aerosol Observing System (MAOS). The site also hosted numerous instrument systems from other GoAmazon2014/5 participants (Martin et al., 2016).
2.2 Instrumentation
2.2.1 Neutral cluster and air ion spectrometer (NAIS)
A neutral cluster and air ion spectrometer (NAIS; Manninen et al., 2016) was used to determine the early stages of atmospheric nucleation and subsequent growth. The NAIS measures mobility distributions in the range 3.2–0.0013 cm2 V−1 s−1, which corresponds to a mobility equivalent diameter range of 0.8–42 nm. The ion and neutral particle size distributions are measured in three different stages: ion, particle, and offset. The NAIS consists of two parallel cylindrical DMAs (differential mobility analyzers), one for classifying negative ions and the other for positive ions. In the ion mode, the corona chargers and the electrostatic filters are switched off to allow only naturally charged ions to enter the DMA. During the particle mode, the particles are charged by a corona charger in order to be detected by the DMA. The inlet flow into the NAIS is 60 liters per minute (L min−1), whereas the sample and the sheath flows of the DMAs are 30 and 60 L min−1, respectively. The NAIS time resolution was set to 5 min, which includes a full measurement cycle of negative ions, positive ions, and total particles. The NAIS instrument and calibration are described in more detail in Asmi et al. (2009), Wagner et al. (2016), and Manninen et al. (2016). The NAIS measurement accuracy was estimated to be 10 %–30 %, which was mainly due to flow rate uncertainties (Manninen et al., 2016; Wagner et al., 2016). The electrometers measure a current that can be transformed into particle and/or ion concentrations. If the measured currents are low, the noise can be quite high and can result in negative concentration values. The environmental conditions in the Amazon are very challenging for NAIS measurements, especially the high relative humidity (RH). To reduce the NAIS sampling RH, an electric heater was installed at the inlet to heat the sampling air to 60 ∘C in order to evaporate some water before entering the instrument.
The NAIS was placed inside a hut at the T0t site, sampling at 2 m above the ground level. In January 2014, the NAIS was moved to the T3 site where it was placed outside under a roof. The sampling setup was the same at both sites. In total 736 days of neutral particle data and 718 days of ion data were taken at both sites together (see Table 1).
2.2.2 Particle size magnifier (PSM)
A particle size magnifier (PSM; Airmodus A09; Vanhanen et al., 2011) was used to determine aerosol particle concentrations at sizes below 3 nm. The PSM is a mixing-type condensation particle counter (CPC), in which the aerosol is turbulently mixed with air saturated with diethylene glycol (DEG). DEG only grows the particles to about 90 nm, so the PSM system consists of a second stage, in which the particles are grown to optically detectable sizes. The 50 % activation diameter of the instrument can be varied across a size range of 1–4 nm in mobility diameter (Vanhanen et al., 2011) by changing the mixing ratio between the saturator and the sample flow. During GoAmazon2014/5, the PSM was used in a scanning mode in which the saturator flow is continuously changing, altering the cutoff diameters between 1 and 4 nm. One scan takes 4 min and the system was set up to do one upscan, followed by a downscan. Due to the challenging measurement conditions, the size-resolved data were not used in this analysis.
Prior to deployment during the GoAmazon2014/5 campaign, the PSM system was equipped with an inlet system specifically designed to decrease the relative humidity of the sample without disturbing the sample itself and to maintain high flow rates to minimize diffusion losses. The inlet system comprises a core sampling probe combined with a sintered tube. The core sampling probe consists of two cylindrical tubes with different outer diameters (10 and 6 mm). The larger diameter of the outer tube allows for a total laminar flow rate of up to 10 L min−1 to minimize diffusional losses. The inner tube is directly attached to the PSM with an airflow of 2.5 L min−1. The excess airflow is discarded into an exhaust line (Kangasluoma et al., 2014). Downstream of the core sampling line there is a sintered tube into which dry, pressurized air is introduced. The water molecules in the sample flow are pushed towards the outer walls of the sintered material by diffusion, drying the airflow. Laboratory studies have shown that RH can drastically affect the PSM counting efficiency (higher sensitivity at smaller sizes at higher RH; Kangasluoma et al., 2014; Iida et al., 2009).
Since the aerosol in Brazil was expected to be composed of mostly organic species, the PSM with the inlet was calibrated using limonene and its oxidation products (Kangasluoma et al., 2014) as a test aerosol. The resulting lowest PSM cutoff diameter was 1.5 nm (±0.3 nm), and the uncertainty was estimated as a combination of the calibration uncertainty and the influence of the ambient RH on the PSM cutoff diameter. In total, 38 days of data obtained during the dry season were used.
2.2.3 Supporting instrumentation at both sites
At T0t, the submicron aerosol size number distributions and total particle number concentrations were monitored with a DMPS system (Aalto et al., 2001) and a CPC. The CPC time resolution was 1 min, with a 50 % cutoff size of about 6 nm. The DMPS measured size number distributions over the mobility diameter range of 6–800 nm (Backman et al., 2012), and a complete size distribution was obtained every 10 min. During the 10 min measurement cycle, size-segregated aerosols were measured for 8 min, followed by 2 min of total particle number concentration measurements using a bypass valve. The transmission at 4 nm of the inlet used in the AMAZE-08 (Martin et al., 2010b) experiment was 50 %. The diffusion losses increase exponentially with a decreasing particle size. For the measurements reported here, a similar setup with a 60 m sampling line was used. The DMPS data should be used in a qualitative rather than quantitative manner as the losses due to diffusion in the sampling line are not precisely known and therefore not considered. In addition to the ion spectrometer measurements, the measurement hut hosted an automated weather system (Vaisala; WXT-520) for acquiring meteorological parameters.
The auxiliary data from the T3 site presented in this paper include measurements from an ultrafine CPC (TSI Inc; 3010), with a 50 % activation diameter of 10 nm and an SMPS with a lower cutoff of 20 nm. The meteorological data were also retrieved from an automated weather station (Vaisala; WXT-520). Those datasets are available at the ARM data browser.
2.3 Measurement periods: wet and dry season
The differences in the tropical seasons present contrasting environmental conditions (Martin et al., 2016; Artaxo et al., 2013). In our paper, we follow Artaxo et al. (2013) and define the wet season in the Amazon from January to June and the dry season from July to December.
The most dominant anthropogenic influence in the Amazon region is dictated by biomass burning emissions, which are strongest during the dry season. The most intense biomass burning and atmospheric perturbations take place at the southern and eastern edges of the forest (Brito et al., 2014), however, their transport impacts the whole basin. During the wet season, Manaus emissions are the main anthropogenic influence on the aerosol population in the Amazon region (Andreae, 2007; Martin et al., 2010a). During the dry season, the wet deposition decreases, whereas the condensation sink increases. That leads to an overall increase in aerosol concentration in the accumulation mode of about 1 order of magnitude even in remote areas (Artaxo et al., 2013).
The planetary boundary layer development displays a strong diel behavior, with a stable nocturnal layer and strong vertical mixing during the daytime. The vertical transport is enhanced in strong convective situations when particles are lofted and entrained into the free troposphere. The stable nocturnal layer, on the other hand, traps the emissions near the surface; the impact can be more pronounced during the dry season as biomass burning usually starts at midday and continues into evening hours (Martin et al., 2010a). The boundary layer development is also different for the two different measurement sites, as the boundary layer develops more rapidly over the pasture area, with more efficient vertical mixing compared to the site enclosed by the rainforest.
2.4 Data analysis
All the available data from the NAIS were cleaned for potential instrumental noise. The cleaning process was done visually using the particle and ion size distributions as surface plots. The non-reliable data were removed based on the guidelines introduced by Manninen et al. (2010). The NAIS data turned out to be unreliable during the measurements presented here, mostly in the size range above 15 nm. Therefore, we decided to show data for the sizes up to 12 nm only in our analysis. We divided the measured ion and neutral particle concentrations into three sub-size ranges: cluster size range (0.8–2 nm), intermediate size range (2–4 nm), and large size range (4–12 nm). Defining the lower and upper limits of the intermediate ion size range varies in the scientific literature (see Hirsikko et al., 2011, and references therein). The definition of 2–4 nm as the intermediate size range allows for differentiating between new particle formation events and nonevents when using ion measurements (Leino et al., 2016).
We observed an increase in the concentrations of the cluster ions in the NAIS starting from 7 October 2013 to 21 January 2014. By investigating the raw data files, this drift was observed to be due to too-low currents in the sheath air filters. The sheath air filters are electrical filters using corona needles to neutralize all the remaining ions, which leads to an overestimation of ion concentrations. A correction factor of 1.8 was applied to account for this problem in the four smallest size channels of the NAIS (0.8–1.25 nm) for the data taken at the T0t site after the drift was observed. This increased level in the positive polarity of the natural ions continued when the NAIS was redeployed at the T3 site. The cause was the same (too-low current in the sheath air filters). We consider the positive polarity of the natural charged ions in the NAIS at the T3 site unreliable; therefore, the data regarding the absolute concentrations using the positive channel for the T3 site are not shown in this study. Additionally, the ion data from 9–26 September 2014 at the T3 site were considered unreliable and also excluded from our analysis.
Rain-induced ion events were selected as the times when an ion burst coincided with the onset of precipitation. The median and the maximum (99th percentile) ion concentrations were calculated during periods when the rain intensity was >0 mm h−1. In the case of more than one rain event per day, two separate rain events were classified as such if the start of the second one occurred more than 1 h after the end of the first one. Any fluctuations in the rain intensity for a time period shorter than 1 h were considered to be part of a single rain event. We classified 962 rain events at the T0t site and 221 rain events at the T3 site.
The new particle formation event analysis from the ion spectrometer data, including the event classification and formation and growth rate calculations, followed the already well-defined guidelines (Kulmala et al., 2012). In the data analysis, the first step was to classify all available days into NPF event and nonevent days according to methods introduced earlier by Hirsikko et al. (2007) and Manninen et al. (2010). The days that do not fulfill the criteria of an event or nonevent day are categorized as undefined days. However, no days were classified as undefined in this study.
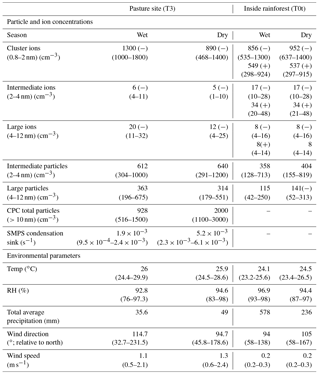
Table 2A comparison of the two measurement sites and the wet and the dry season. The values from the pasture site are on the left-hand side, and the values from inside the rainforest site are on the right-hand side. The months for the wet season are January to June and July to December for both measurement sites. The aerosol and ion parameters from the NAIS measurements listed are the ion concentrations in three size bins (0.8–2, 2–4, and 4–12 nm), the neutral particle concentrations in two different size bins from the NAIS (2–4 and 4–12 nm), and the total particle concentrations (>10 nm) from the MAO CPC measurements; the calculated condensation sink values from the SMPS are also shown. The numbers present median values and the 25th–75th percentiles are in brackets. The environmental parameters shown are temperature, relative humidity, precipitation rate, wind direction, and wind speed.
The classification was performed manually through a visual inspection of daily contour plots of particle size number distributions. The second step in the analysis was to define the characteristics related to each NPF event, such as the particle growth rate (GR) and formation rate (J). The GRs were calculated for two different size bins (2–3 and 3–7 nm in particle diameter) using both ion and neutral particle data from the NAIS. The particle growth rate was determined by finding the times at which the maximum concentrations of ions and/or particles in each of these size ranges occurred. A fit between the points was then applied to resolve the growth rates. The particle formation rate was determined for the lower end of each size bin (2 and 3 nm) by taking the particle growth rate, condensation sink, and coagulation sink into account.
All the times mentioned below are local Manaus time (LT), which is Coordinated Universal Time (UTC) − 4 h.
3.1 Number concentrations of ions and particles at the two sites
An overview of the observed number concentrations of ions and particles together with the meteorological conditions at the two measurement sites is presented in Table 2.
When comparing the two measurement sites, the most apparent differences include (i) the almost factor of 3 lower intermediate negative ion concentrations at the T3 site compared to the T0t site (6 and 5 cm−3 during the wet and dry season, respectively, at T3; 17 cm−3 during both the wet and dry season at T0t). This difference is likely to be caused by the enhanced formation of negative ions by precipitation. (ii) By contrast, the large-sized ion concentrations were about a factor of 2 higher at the T3 site compared to the T0t site (20 and 12 cm−3 during the wet and dry season, respectively, at T3; 8 cm−3 during both the wet and dry season at T0t). (iii) Also, the intermediate and large-sized neutral particles were by about a factor of 3 higher at the T3 compared to the T0t site. These enhanced concentrations were probably due to a combination of stronger mixing of the boundary layer and the occurrence of NPF events at the T3 site.
The environmental variables were relatively similar at the two measurement sites, with higher average temperatures and lower average RH at the T3 site compared to the T0t site. The wind directions at both sites varied from the wet to the dry season. At T3, the air masses arrived, on average, from 115∘ N during the wet season and from 95∘ N during the dry season. At T0t, the average wind direction changed from 94∘ during the wet season to 105 ∘ N throughout the dry season (see Table 2).
3.1.1 Inside rainforest site (T0t)
At the T0t site, the negative cluster ion concentrations were very comparable during the wet (856 cm−3) and the dry season (952 cm−3). The positive cluster ion concentrations were about a factor of 1.7 lower throughout both seasons compared to the negative ions (549 cm−3 wet, 537 cm−3 dry). These values are comparable to those observed in several other locations (eg. urban Paris, Dos Santos et al., 2015; coastal Mace Head, Vana et al., 2008 and Finokalia, Kalvitis et al., 2012; Puy de Dôme, Rose et al., 2015).
The ion concentrations in the intermediate size range (2–4 nm) were a factor of 2 higher in the positive polarity compared to the negative polarity both in the wet and in the dry season (17 cm−3 (−) and 34 cm−3 (+) during the wet season; 17 cm−3 (−) and 34 cm−3 (+) during the dry season). We observed the same concentrations in the large size range, on the other hand, in both polarities and both seasons (8 cm−3). The neutral particle concentrations were higher in the intermediate (2–4 nm) size range compared to the large (4–12 nm) size range, being very similar in the wet and dry season.
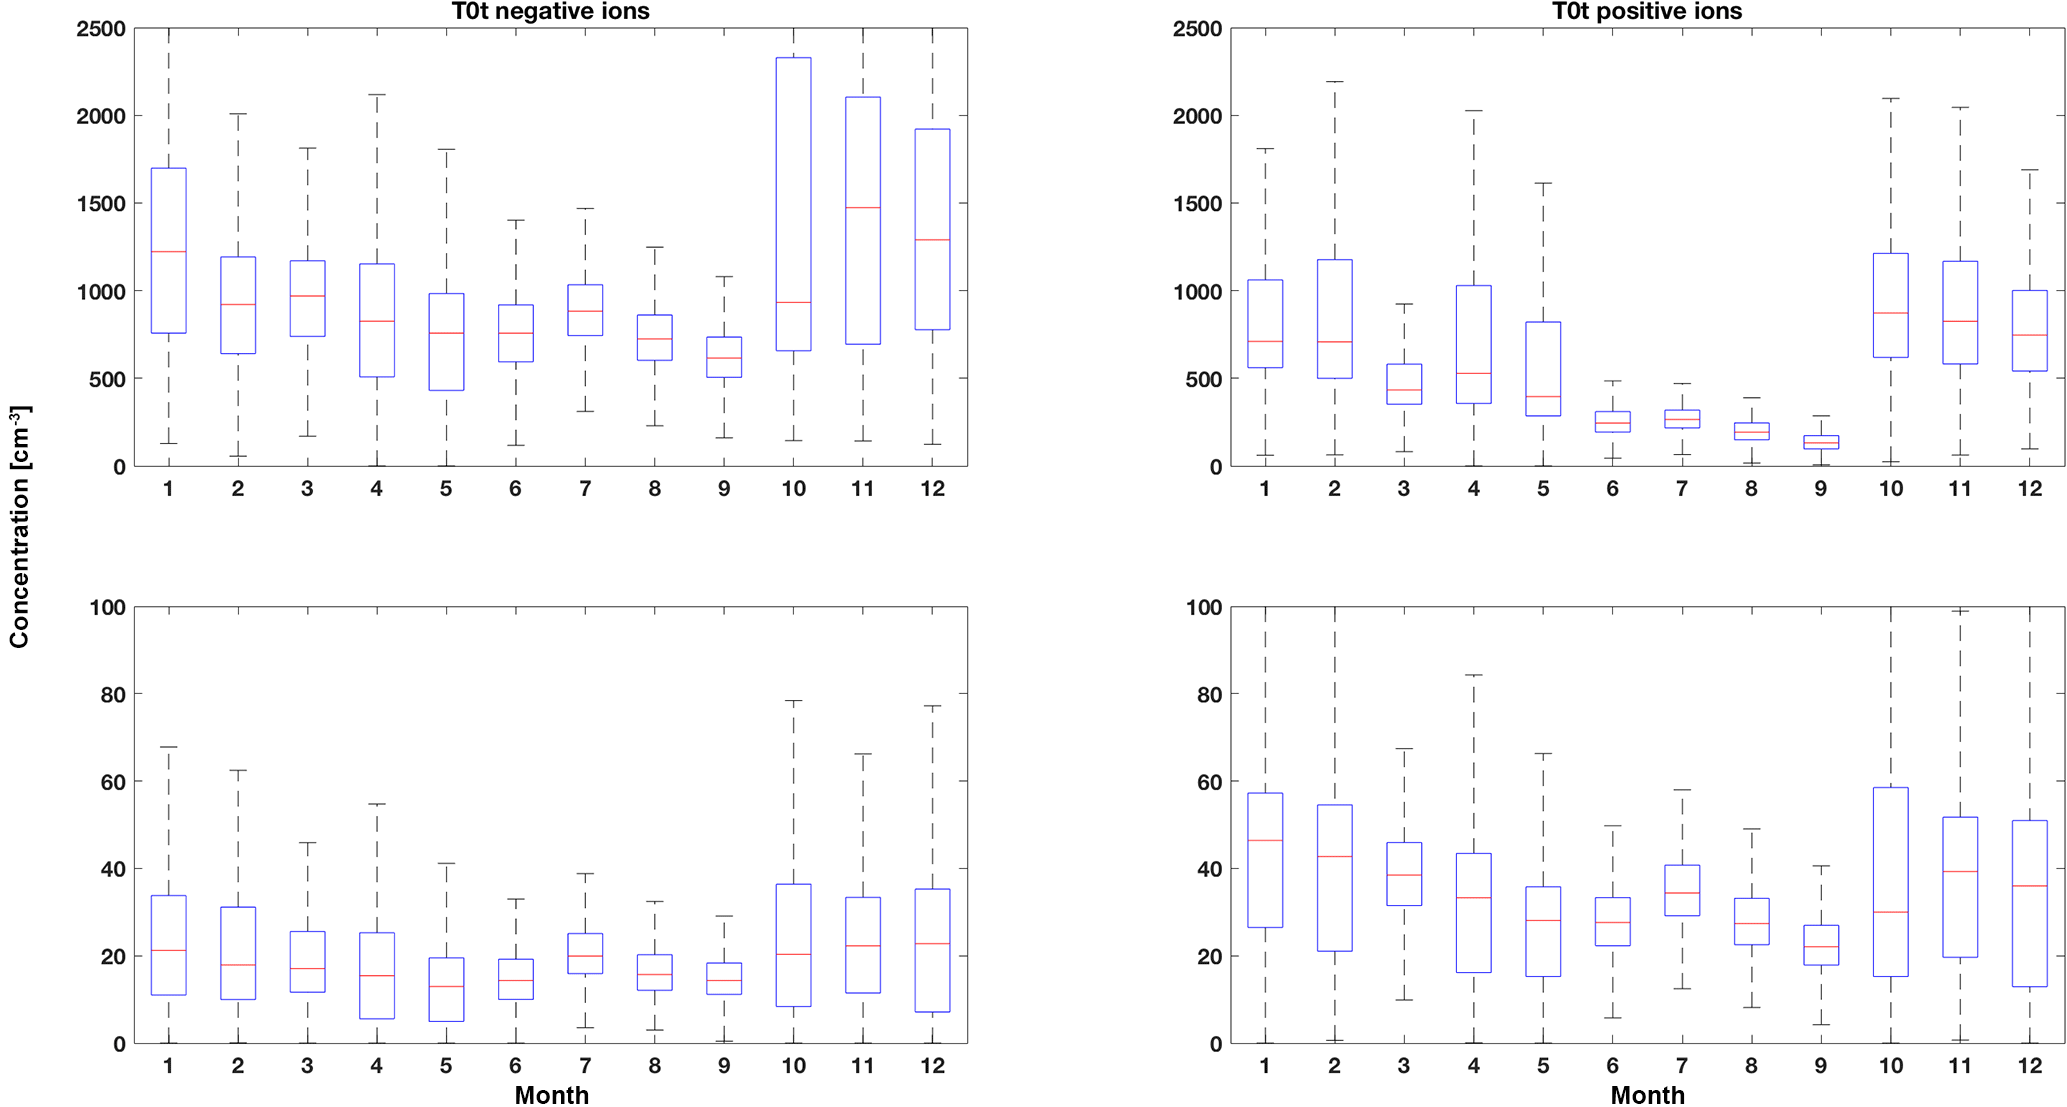
Figure 2The median annual variations for positive and negative cluster (0.8–2 nm) and intermediate (2–4 nm) ions from the site inside the rainforest are shown. The boxes show the 25th–75th percentile and the whiskers are 1.5× IQR (interquartile range); data points beyond the whiskers are considered outliers.
The characteristics of the wet and the dry season in the Amazon (Rissler et al., 2006; Martin et al., 2010a) can be observed in the concentrations of the negative ions as shown in Fig. 2. The negative ion concentrations were decreasing from April to September and increasing between September and February. Most likely, the local biomass burning during the dry season increased the ion concentrations. During the wet season, the ion concentrations decreased, most likely due to wet deposition and reduced source strengths.

Figure 3The median diel patterns of the intermediate (2–4 nm) and the large (4–12 nm) particles from the NAIS measurements at the T0t measurement site are shown. On the left-hand side are the values for the wet and on the right-hand side the values for the dry season. The boxes represent 25th–75th percentiles and the whiskers are 1.5× IQR (interquartile range); data points beyond the whiskers are considered outliers.
We observed a similar diel pattern for both the wet and the dry season for the neutral particles as shown in Fig. 3. The concentrations in both size ranges increase at around 06:00–09:00 during the wet season. This effect was less pronounced in the dry season. A clear decrease in neutral particle concentrations during evening times (after 17:00) can be observed.
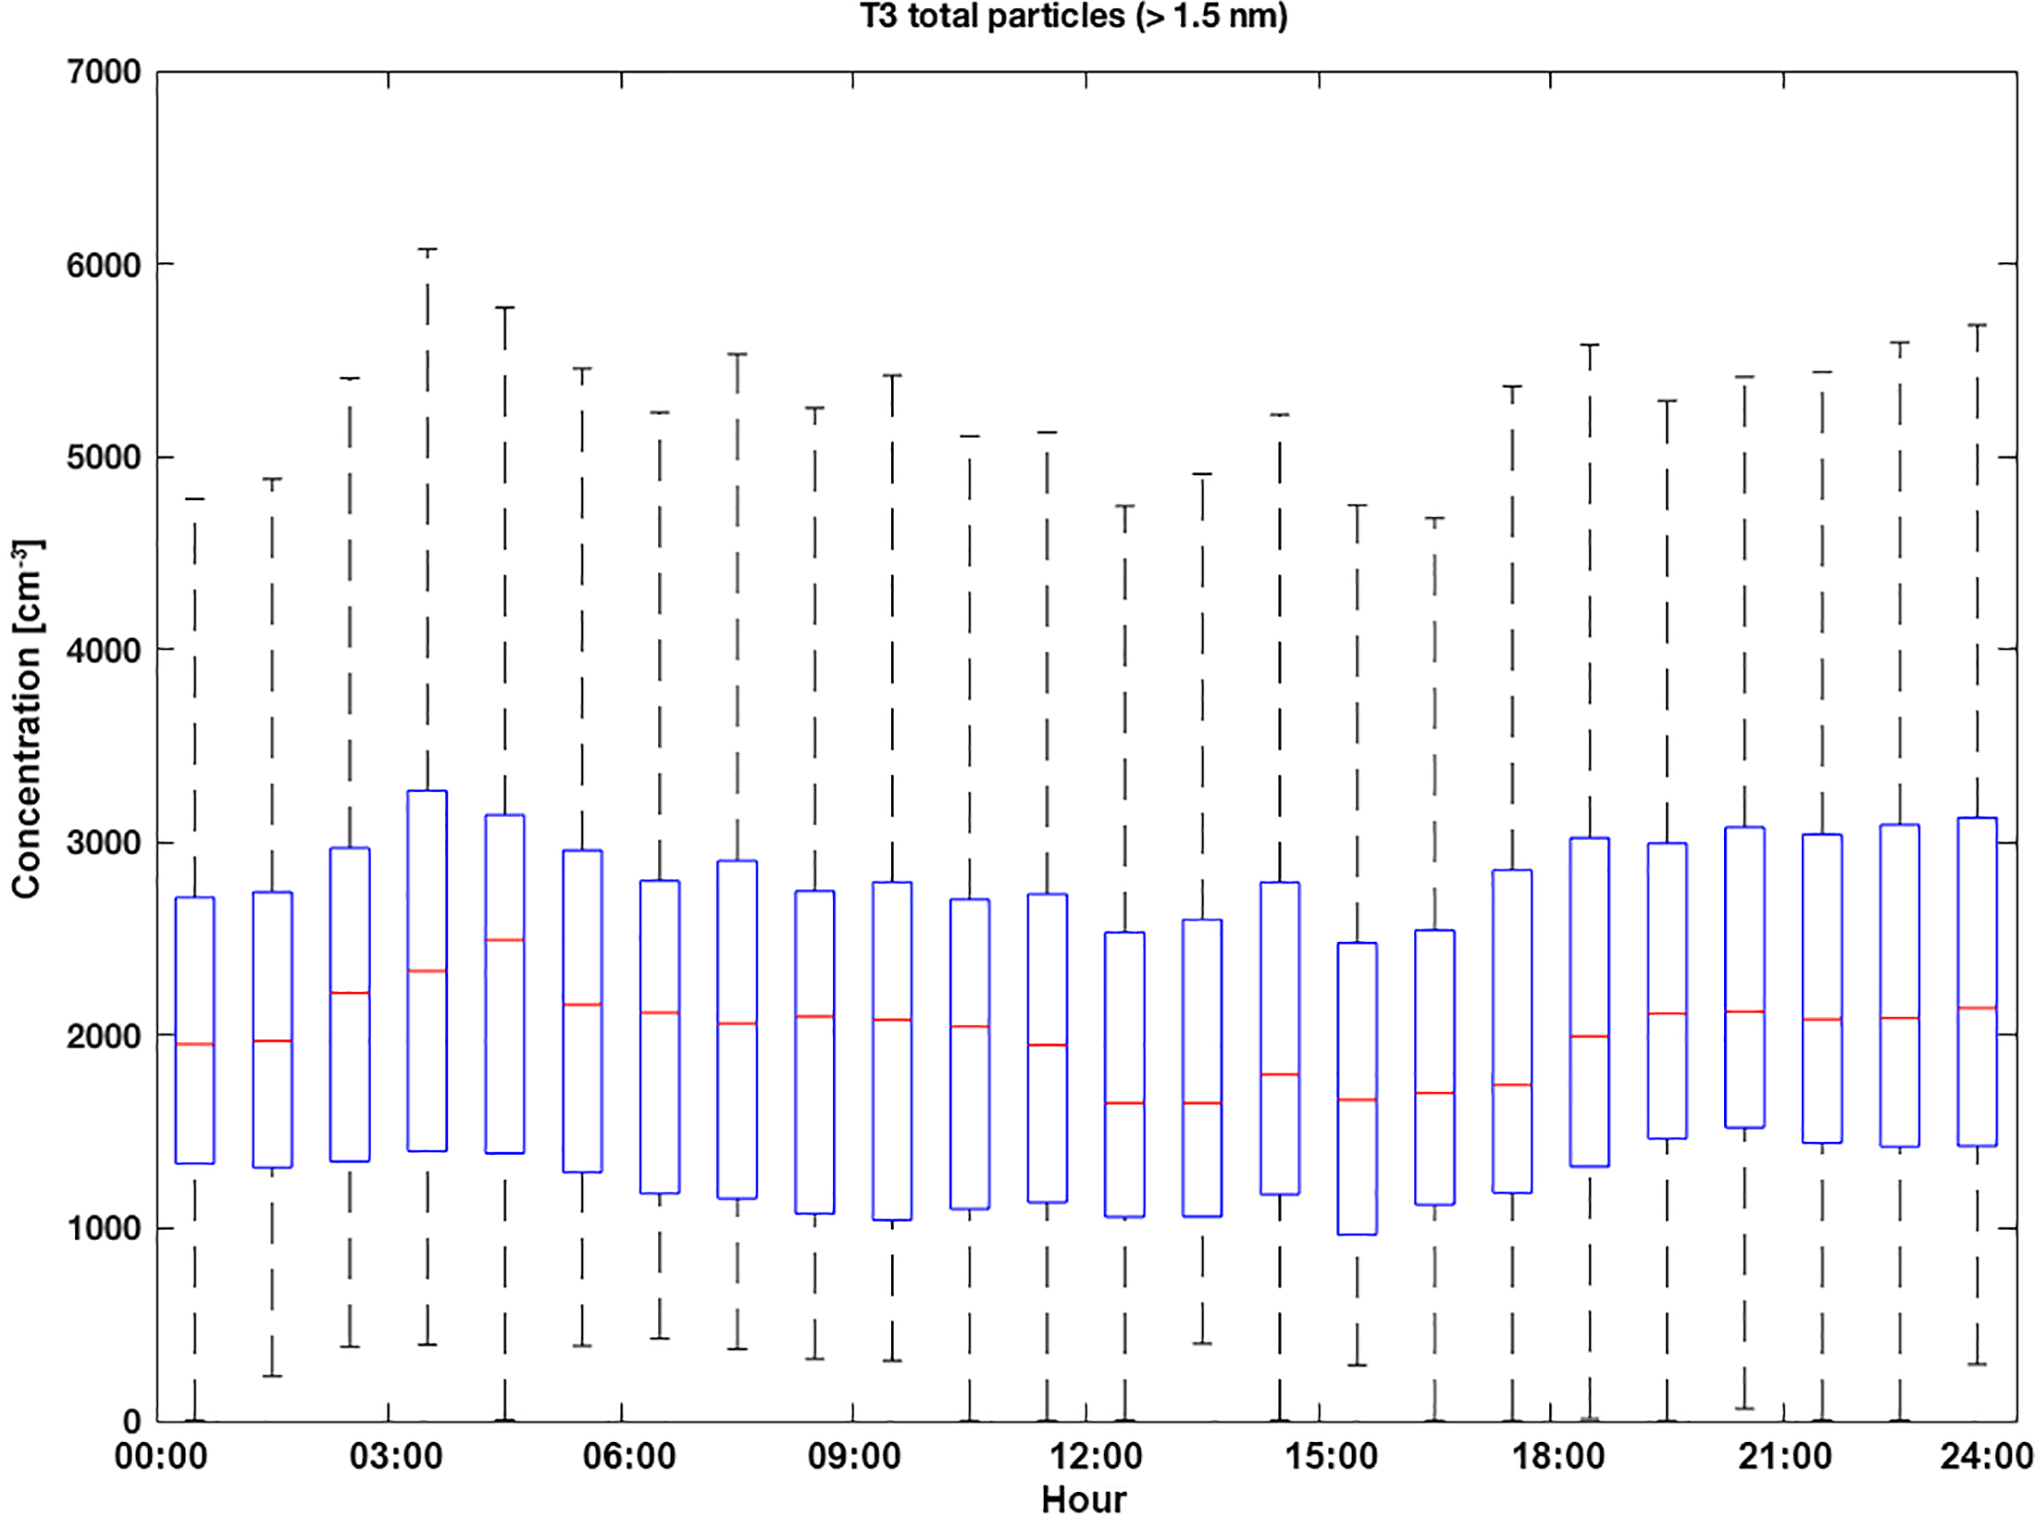
Figure 4The diel cycle of particles bigger than 1.5 nm measured by the PSM during the dry season at the pasture site is shown. In total, 38 days of data were used. The data show hourly median concentrations, the boxes represent the 25th and 75th percentiles, and the whiskers are 1.5× IQR (interquartile range); data points beyond the whiskers are considered outliers.
3.1.2 Pasture site (T3)
As shown in Table 2, cluster ion concentrations at the T3 site were typically higher during the wet season (1300 cm−3) than the dry season (890 cm−3). Similarly high ion concentrations were reported in an Australian rainforest in Tumbarumba (Suni et al., 2008) and in a wetland site in Abisko (Svennigsson et al., 2008). Those experiments showed concentrations of ∼2400 (1700) cm−3 for negative (positive) ions. The median negative ion concentrations in the intermediate and large size ranges (2–4 and 4–12 nm) were very similar during the wet season (6, 20 cm−3) and the dry season (5, 12 cm−3). The neutral particle concentrations were also very similar in both seasons at the T3 site. The median total concentrations measured by the ultrafine MAOS CPC (>10 nm) were observed to be more than a factor of 2 higher in the dry season than in the wet season (928 cm−3 versus 2000 cm−3). This difference is most likely due to the enhanced biomass burning during the dry season. The average temperatures and the average relative humidity were very similar in both seasons.

Figure 5An example measurement for a rain event at the T0t site inside the rainforest is shown. Panel (a) shows the surface figure of the NAIS negative ion channel. Panel (b) shows (i) the concentrations of positive (red line) and (ii) negative (blue line) cluster ions (0.8–2 nm) and (iv) positive (dashed black line) and (v) negative (dot-dashed line) intermediate (2–4 nm) ions on the left-hand axis. The precipitation rate in mm h−1 is shown in green on the right-hand axis.
The PSM measurements were performed during the dry season only. In total, 38 days of PSM data were included in this study and the results are shown in Fig. 4. The PSM was used in scanning mode but, due to the challenging environmental conditions, only data measured at the highest supersaturation (total particle concentration at >1.5 nm) are shown. The PSM data showed a similar diel pattern as the cluster ion concentrations measured by the NAIS (see Fig. 9), with higher median concentrations observed during the early morning (03:00–06:00), a dip in concentrations during the early afternoon (12:00–15:00), and then elevated median concentrations again in the evening (18:00–24:00). This could be explained by the Carnegie curve (Harrison and Carslaw, 2003), which manifests as a diel variation in the ionospheric potential.
3.2 Rain-induced ion formation events
While no NPF events were observed within the rainforest at site T0t, rain-induced ion burst events (hereafter, rain events) were common and observed during 264 out of the 384 measurement days. Since multiple rain episodes could occur in a single day, each rain event was investigated separately, giving a total of 962 rain events at T0t site and 221 at the T3 site.
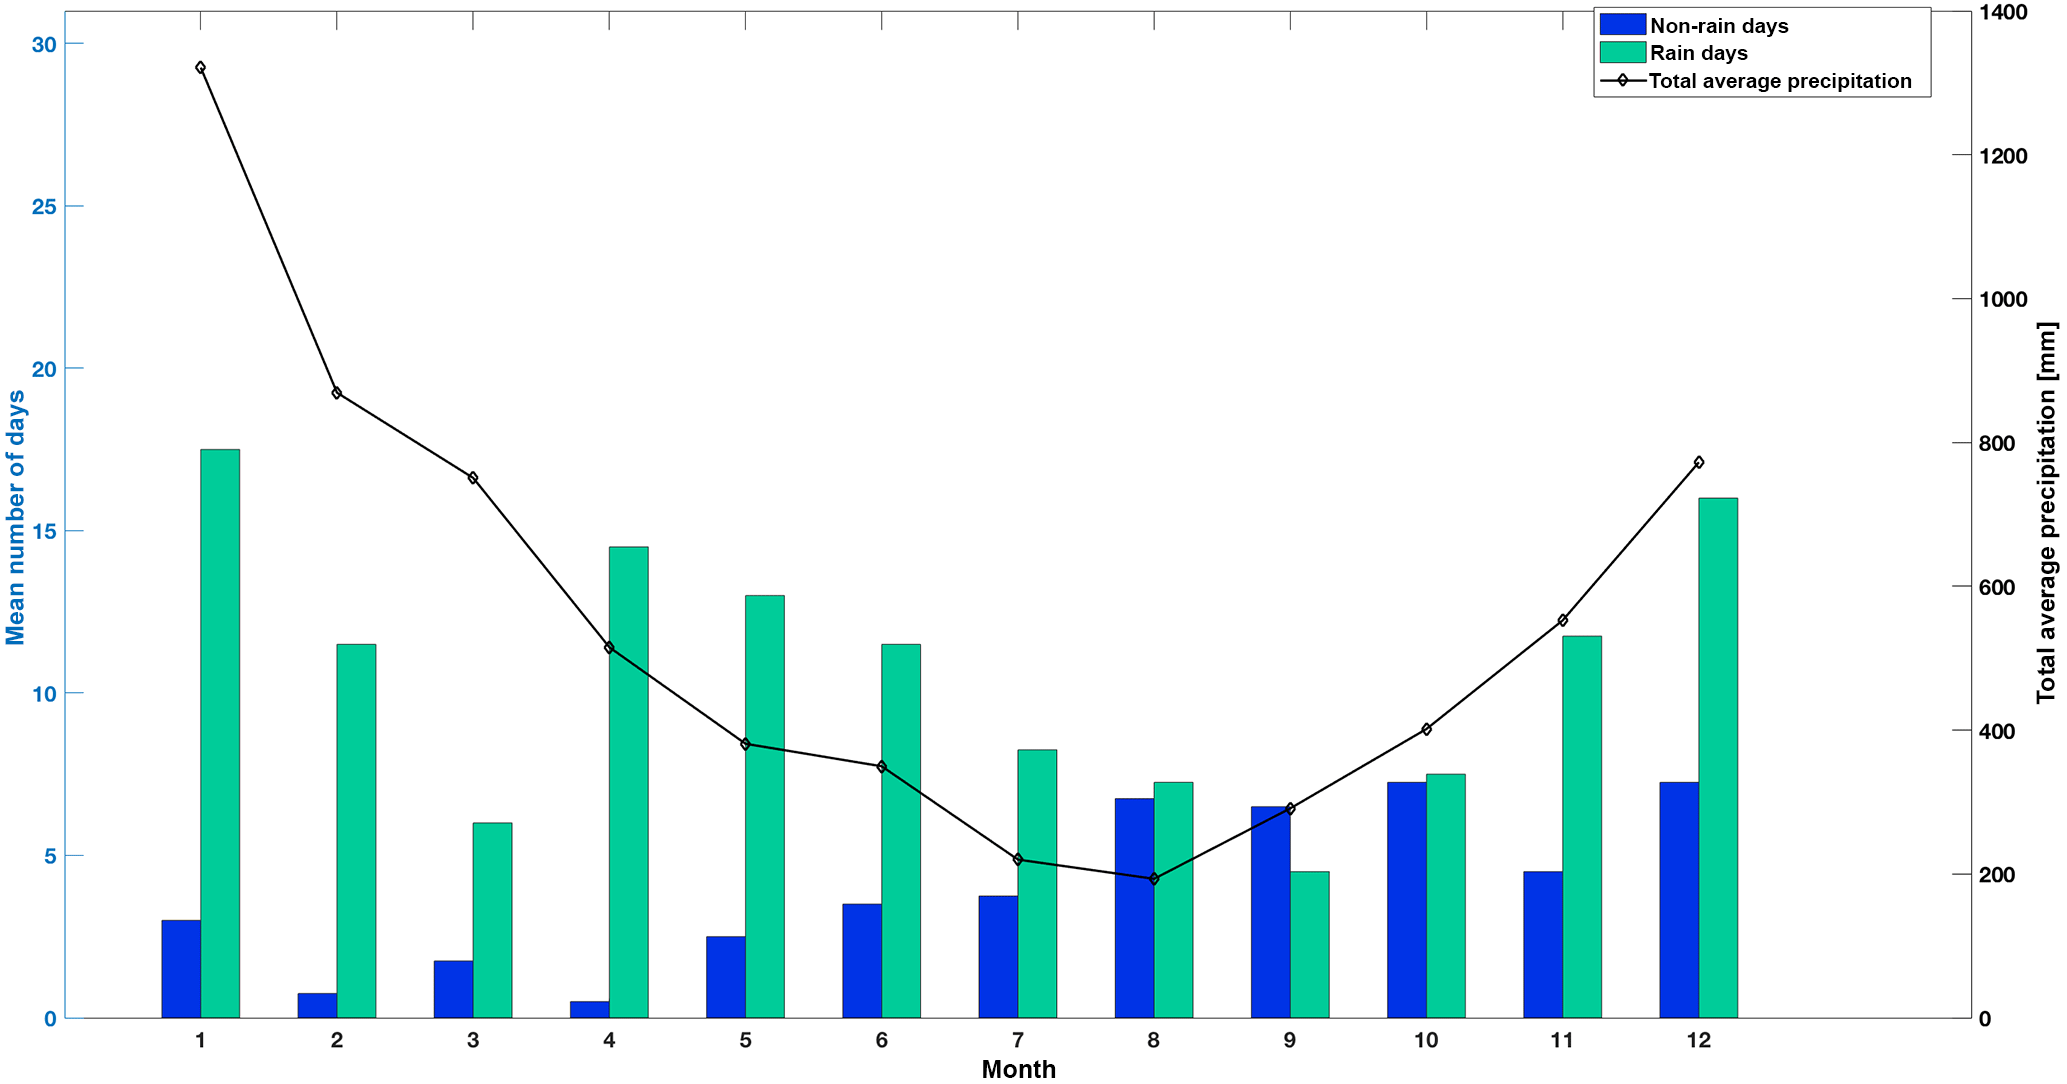
Figure 6The statistics of the precipitation days at the T0t site are shown. The blue bars show the mean number of days per month with no precipitation and the green bars the mean number of days per month with precipitation rates above zero. The black line shows the average total precipitation per month in millimeters on the right-hand axis.
Figure 5 shows an example of multiple rain events that took place during 24 January 2013 (wet season). The negative ion concentrations in the cluster size range of 0.8–2 nm increased during the precipitation from about 1000 to 1500 cm−3. The positive cluster ion concentrations, on the other hand, decreased during the precipitation episode from 1000 to about 500 cm−3. The intermediate (2–4 nm) ion concentrations showed an increase in both polarities, although the buildup was more pronounced for the negative intermediate-sized ions. In the intermediate size range, the concentrations of negative ions reached up to 3000 cm−3, while during the same precipitation event, the positive intermediate ion concentrations only rose to 200 cm−3. A similar feature for 2–8 nm sized negative ions during rain events has also been reported for an Australian rainforest (Suni et al., 2008). In that study, the positive ion concentrations increased only in the 3–7 nm size range and decreased in the 1–3 nm size range during the precipitation episodes. These rain-induced ion bursts are thought to be a result of a balloelectric effect, in which splashing water produces intermediate ions such that the negative ions are smaller in size than the positive ions (Hõrrak et al., 2006; Hirsikko et al., 2007; Tammet et al., 2009).

Figure 7The maximum (99th percentile) negative ion concentrations as a function of rain intensity at the site inside the rainforest (T0t) between September 2011 and January 2014 (red circles) are shown. For comparison, the ion concentrations from the open pasture site are added (blue circles). The lines indicate the median ion concentrations in the absence of precipitation for T0t (red) and T3 (blue).
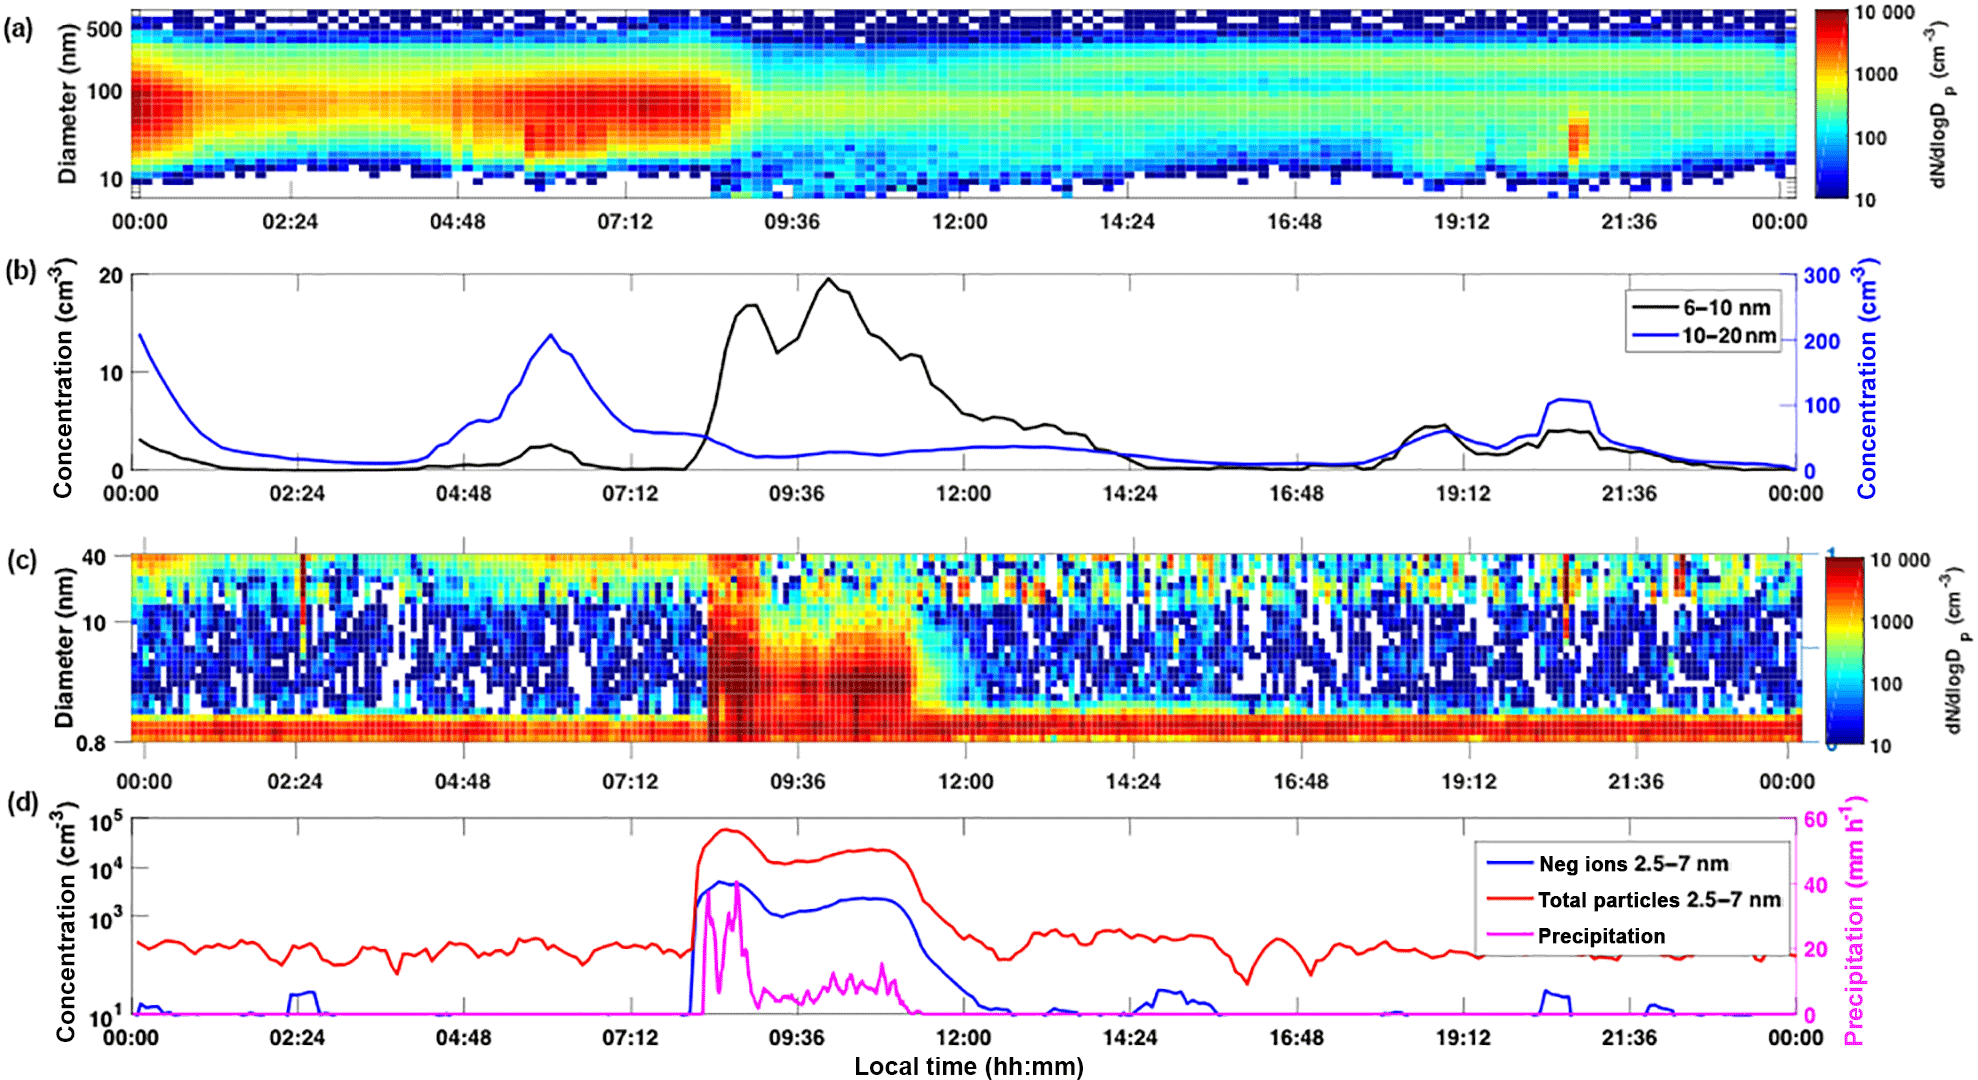
Figure 8An example for a rain-induced event is shown. Panel (a) shows the surface figure for total particles (DMPS). Panel (b) shows the particle concentrations measured by the DMPS for the size range 6–10 nm (black line, left-hand axis) and the size range 10–20 nm (blue line, right-hand axis). Panel (c) shows the surface figure for the negative ions measured by the NAIS. Panel (d) shows the negative ion concentrations for 2.5–7 nm in blue and the neutral particle concentration in the same size range from the NAIS in red. For the neutral particles, the scale is on the left-hand axis. The pink trace shows the precipitation rate in mm h−1 on the right-hand axis.
The duration of the 962 rain events in our study varied from a couple of minutes to 22 h, with over half of the rain events lasting 2 h or less. The statistics of the rain event frequency from the T0t measurement site are shown in Fig. 6. The bars show the mean number of days with and without rain and the black line shows the median total average precipitation per month. Figure 6 shows that rain events occurred in both seasons. However, the number of days without rain increased during the dry season (July to December).
Figure 7 shows the correlation between the maximum negative ion concentration and the median rain intensity during each rain event. While no clear connection between these two quantities was found, two specific features are apparent: at the site within the canopy (T0t), the highest cluster and intermediate ion concentrations occurred almost entirely in correlation with rather strong rain intensities, whereas at the pasture site (T3) almost no increase in negative ion concentrations in any size range during precipitation periods could be observed.
The rain events were also evident in the total particle concentration measured by the NAIS, as depicted in Fig. 8. In this example, the rain intensity peaks twice, about 40 mm h−1 at ∼09:00 followed by a second peak of 10 mm h−1 at ∼11:00. The ion and particle concentrations measured by the NAIS increased and decreased almost simultaneously with the increase and decrease in the precipitation rate. Additionally, the DMPS data showed an appearance of nucleation-mode particles between 6 and 10 nm, also following the onset of the rain. Please note that the DMPS was sampling at a height of 60 m, which is well above the rainforest canopy. The concentration of 6–10 nm particles increased by a factor of 4 during the rain event compared to a background concentration of 5 cm−3 in the absence of precipitation. The 10–20 nm particle concentrations first showed a drop, followed by an increase up to ∼35 cm−3. The maximum concentrations of the 10–20 nm particles appeared about 4 h after the short-term increase in the 6–10 nm particles.
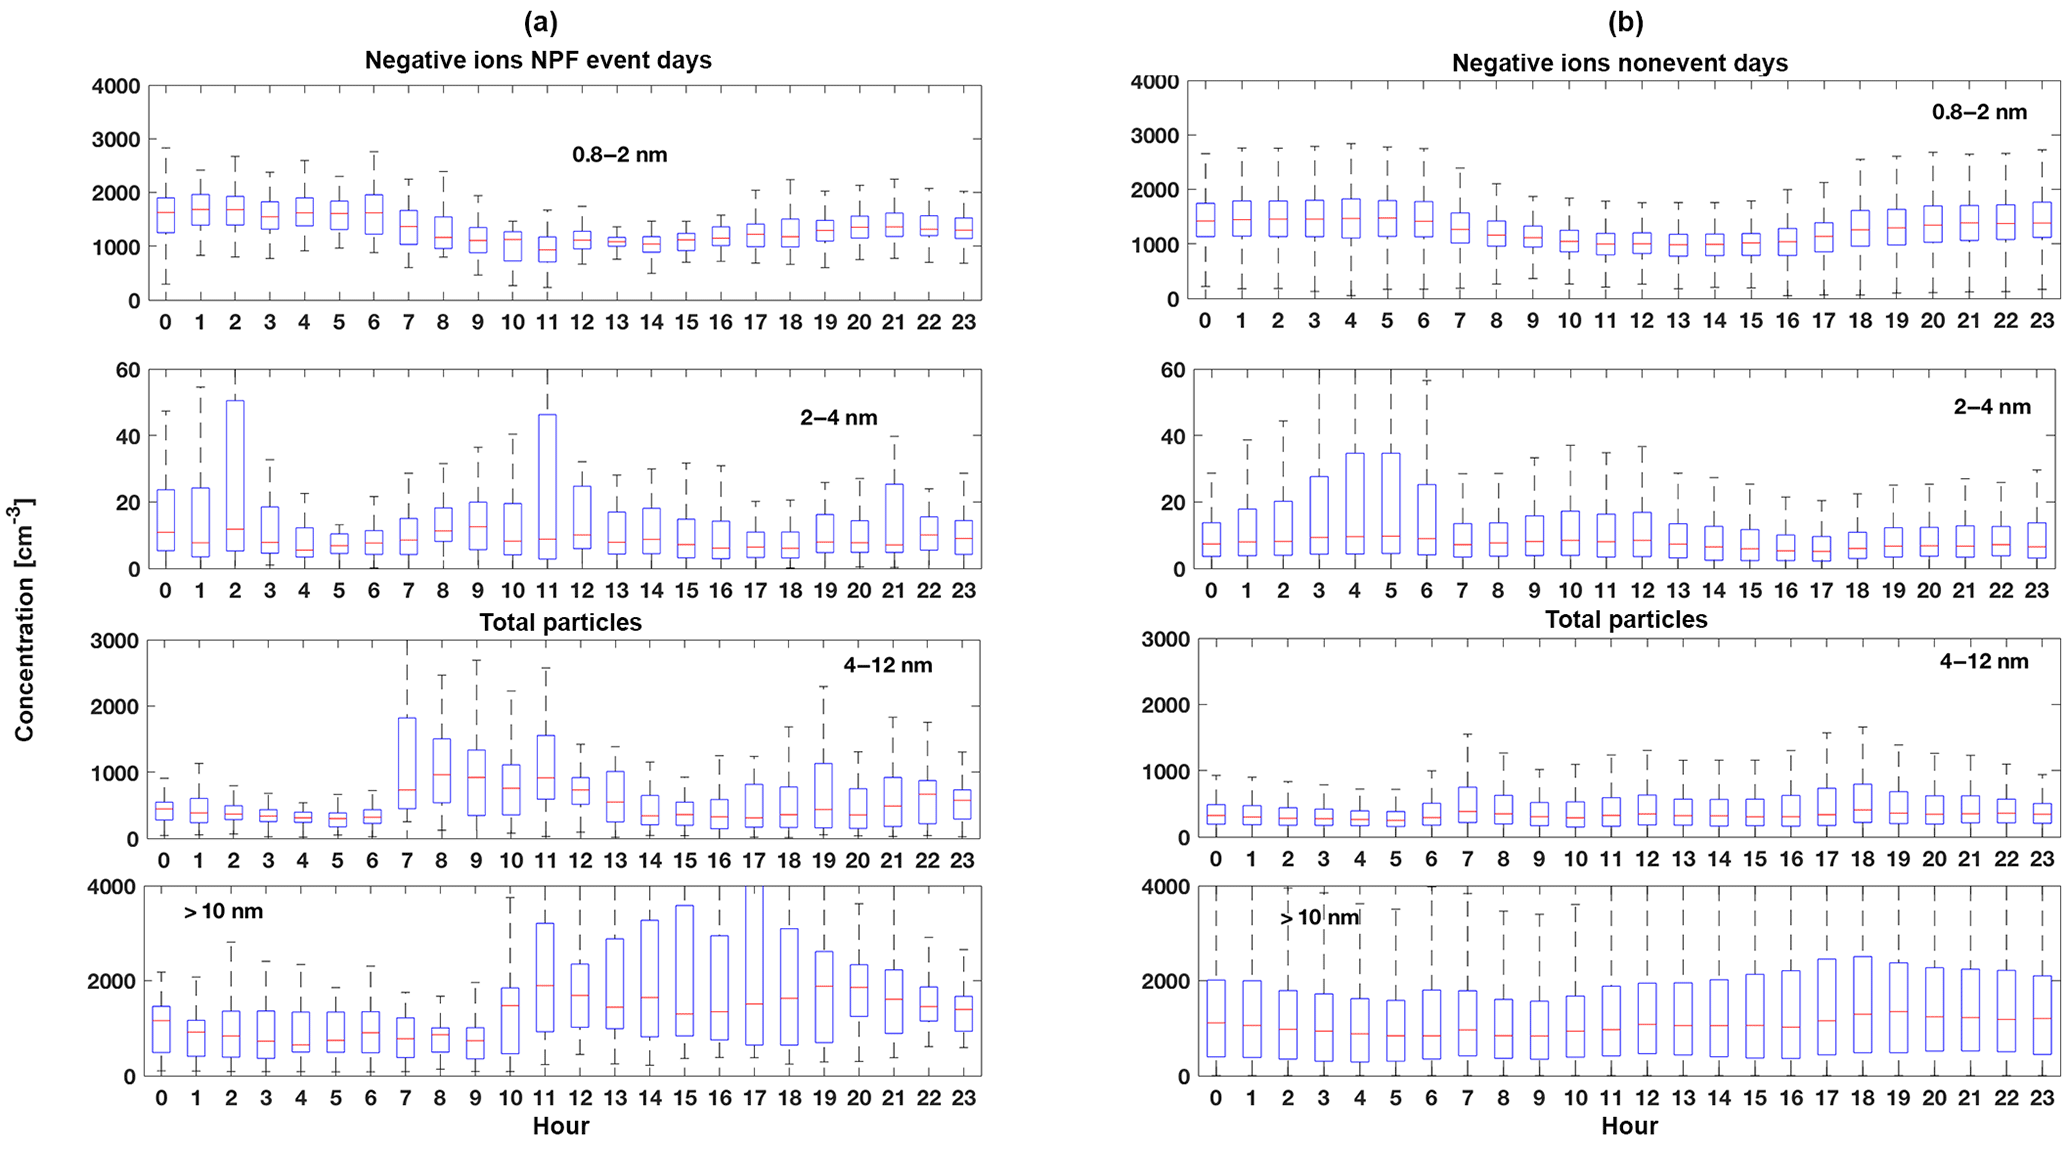
Figure 9The median diel cycles of cluster ions (0.8–2 nm), intermediate ions (2–4 nm), large (4–12 nm) neutral particles, and total particles (>10 nm) for new particle formation event days (a) and nonevent days (b) are shown. The boxes show the 25th–75th percentiles and the whiskers are 1.5× IQR (interquartile range); data points beyond the whiskers are considered outliers.
The appearance of 6–10 nm particles and their peak concentration could present a similar scenario as observed in Wang et al. (2016). They reported a production of small aerosol particles as a result of new particle formation in cloud outflow regions, with further transport into the boundary layer due to strong convection during precipitation events in the Amazon. Wang et al. (2016) noted that the <20 nm particle concentrations decreased very rapidly. We suggest the process that we observe is a local one because the production of ions was observed to only last for the duration of the precipitation.
3.3 New particle formation events at T3
We observed no NPF events during the dry season. During the wet season, on 9 % of the days, we did observe NPF events. A similar event frequency has been observed in the Finnish boreal forest environment during the autumn as an example (Kontkanen et al., 2017). An earlier study by Backman et al. (2012) showed that in the metropolitan area of São Paulo (population 20 million), Brazil, NPF events occurred on 11 % of the days. Zhou et al. (2002) observed an ultrafine particle mode in central Amazonia on 18 % of the measurement days.
We selected all eight NPF event days to characterize the behavior of ions and aerosol particles during the bursts of particle formation. A comparison of the diel cycle for particles and ions between NPF and nonevent days is shown in Fig. 9. The cluster ions showed a clear diel cycle with higher concentrations in the morning and evening for both NPF and nonevent days. An increase in the concentrations of intermediate and large ions (2–4 and 4–12 nm) occurred during NPF event days, which was due to the growth of the ions from the cluster ion size range (0.8–2 nm) to larger sizes. The intermediate neutral particle concentrations increased at around 09:00, suggesting an onset of NPF after sunrise when the boundary layer begins to grow and turbulent mixing starts. On nonevent days these particles showed the highest concentrations after sunrise (06:00) and sunset (18:00). The total particle concentration measured by the MAOS CPC showed a clear concentration increase on NPF event days starting from 10:00, which clearly indicates that the particles had grown from smaller sizes into the 10 nm detection limit of the MAOS CPC. No clear diel pattern in the MAOS CPC measurements was visible on nonevent days.
The type of NPF events that we observed are likely of a regional nature, requiring relatively homogeneous air masses for at least a few hours (Vana et al., 2004; Manninen et al., 2010). The most likely explanations for why no new particle formation events were observed at the T0t site are (i) either the lack of SO2 sources for forming sulfuric acid or (ii) that the sampling at the less polluted T0t site was performed within the rainforest, where mixing with the atmospheric boundary layer above is hindered. The gaps, or fluctuations, in the usually distinct NPF shape in time–size–concentration plots could be caused by some degree of heterogeneity in the measured air masses. All NPF events occurred during the daytime starting at around 08:00–09:00, 2–3 h after sunrise. All NPF events took place during the wet season, which might be due to the lower condensation sink at this time of the year, as shown in Table 1. The median sulfuric acid concentrations, as measured by a quadrupole HOx CIMS (Martin et al., 2016, Supplement), were about 9×105 cm−3 for both NPF event and nonevent days. Similar sulfuric acid concentrations were reported for the Finnish boreal forest measurements in autumn, when about 12 % of the days were classified as NPF event days (Kontkanen et al., 2017).
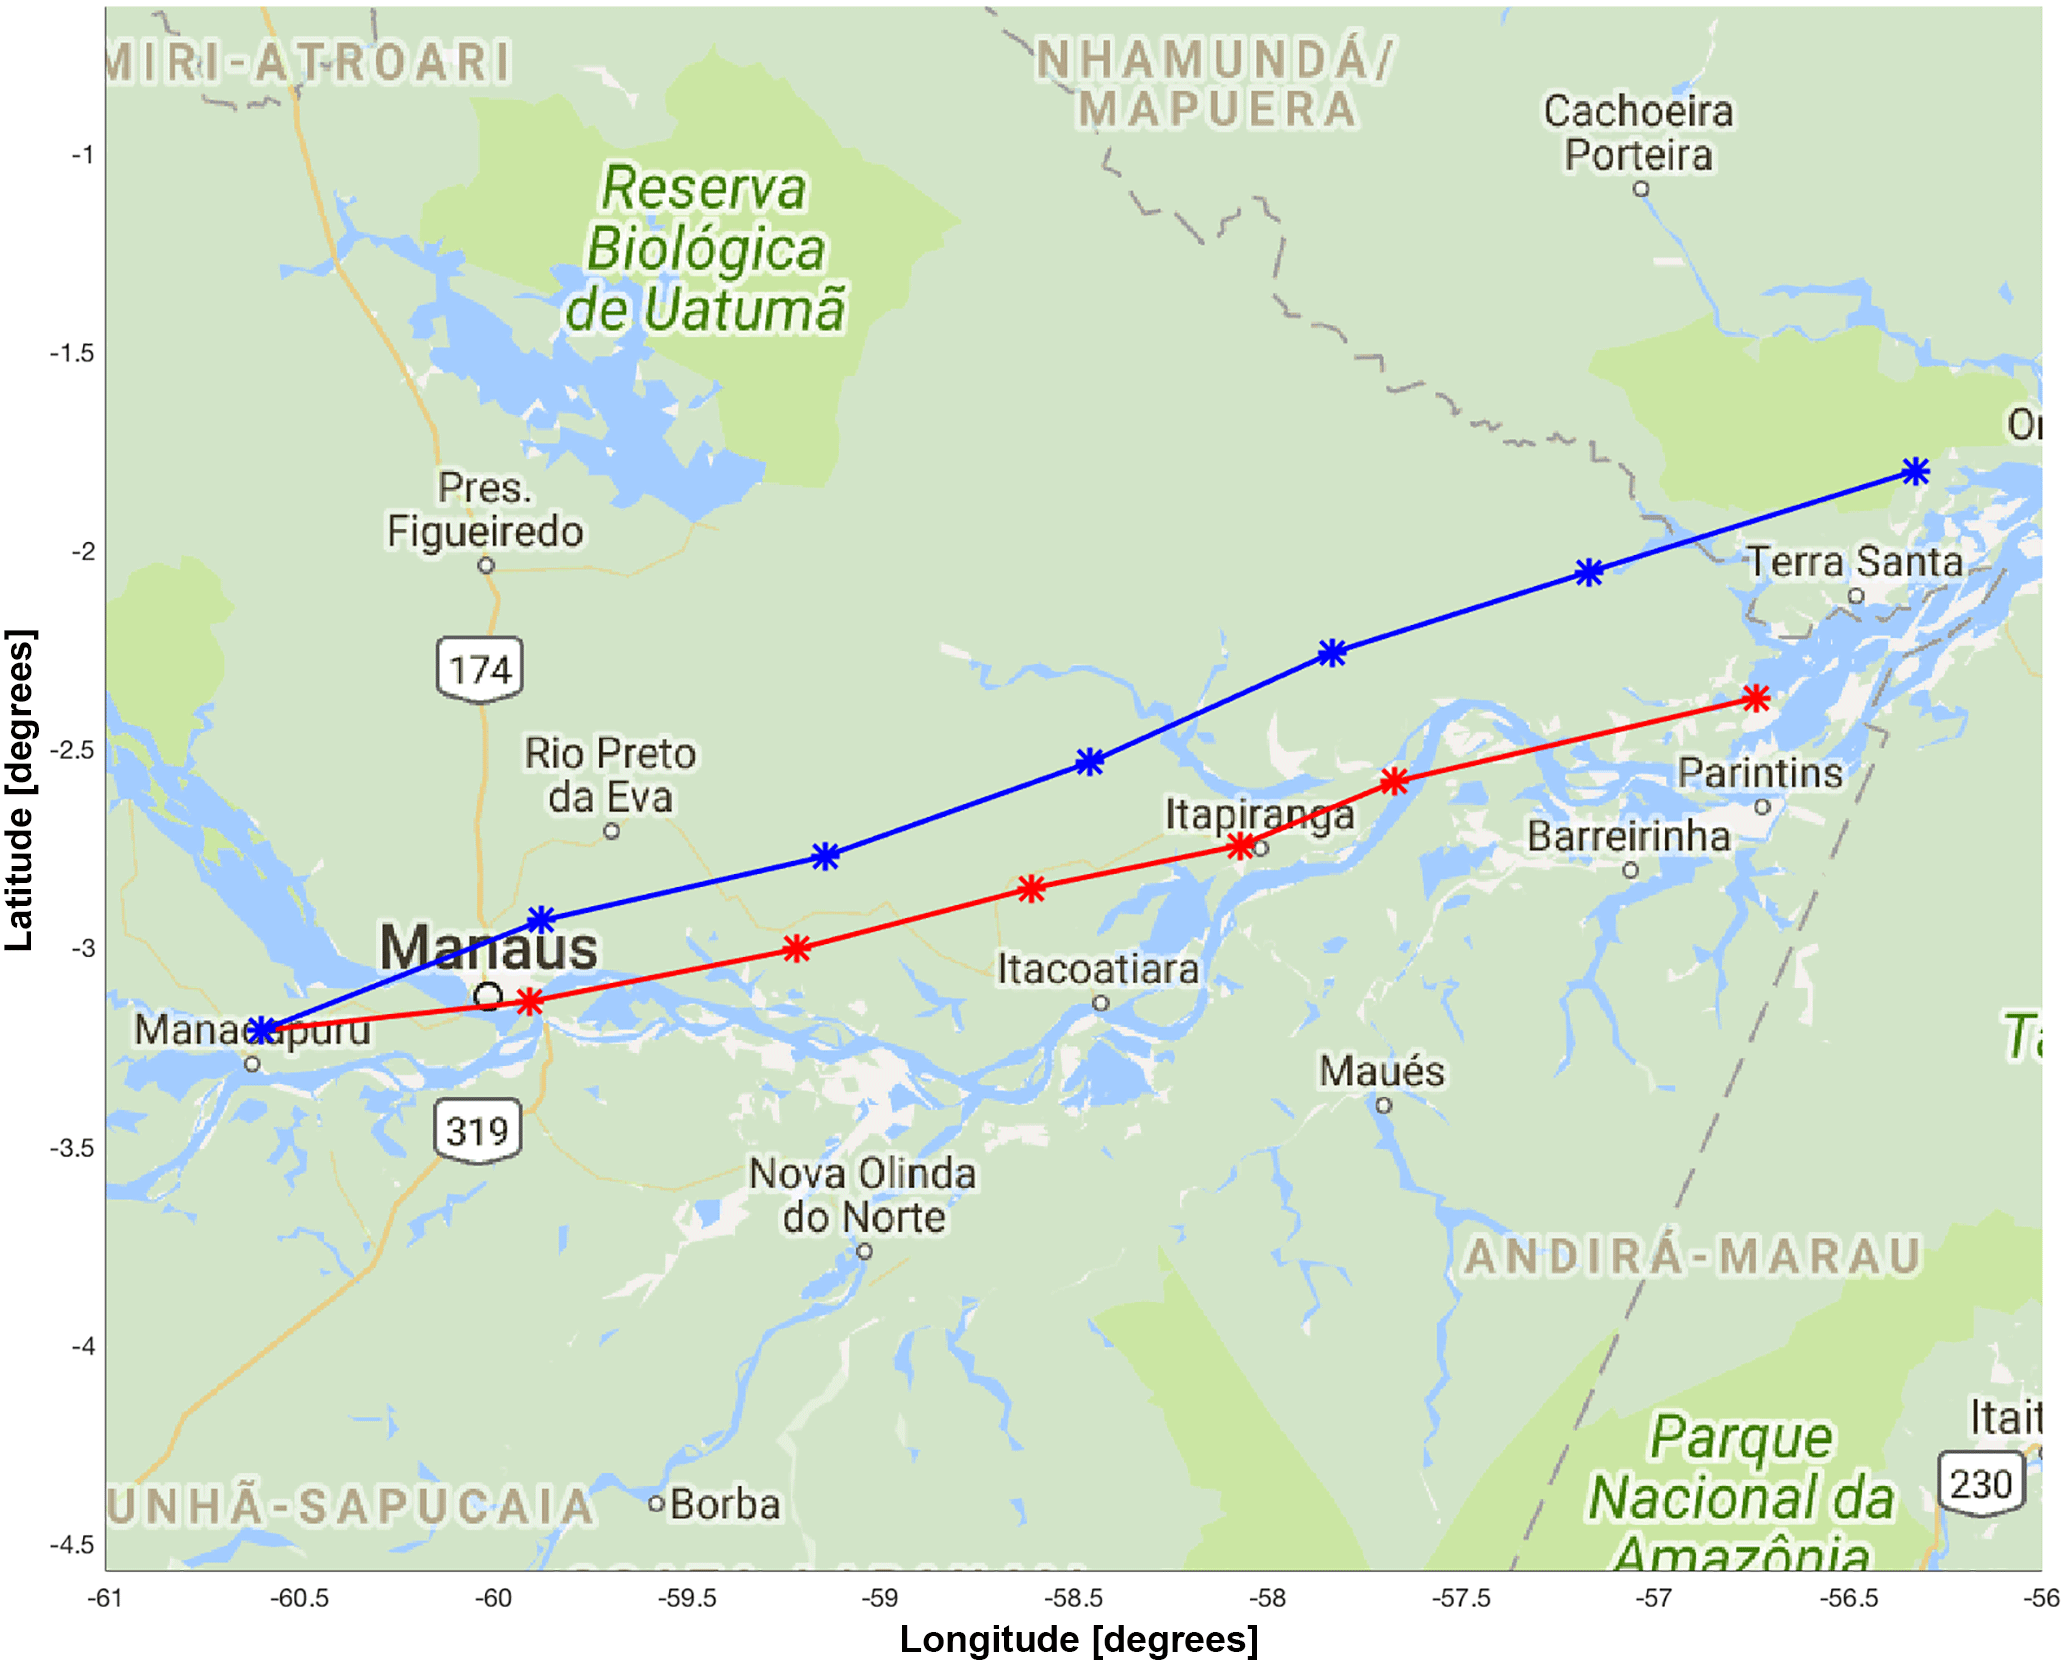
Figure 10The median back trajectories for NPF (blue) and nonevent (red) days are shown. The trajectories were calculated as ensembles, 24 h backwards, arriving at 09:00 LT at 500 m a.s.l. at the open pasture measurement site.

Figure 11One example of an NPF event day, as observed at the open pasture (T3) site. Panel (a) shows the surface figure from the SMPS, and panels (b) and (a) show the surface figures from the NAIS (b) for neutral particles and (c) for negative ions. The color code indicates the measured concentrations. Panel (d) shows concentrations for the 20–30 nm size range from the SMPS on the left-hand axis (blue dashed line). The solid red line shows the 4–12 nm negative ion concentration on the right-hand axis and the solid black line the 4–12 nm neutral particle concentration on the left-hand axis.
Back trajectories using HYSPLIT (http://ready.arl.noaa.gov/hypub-bin/trajtype.pl?runtype=archive, last access: 14 July 2017; Rolph et al., 2017) were calculated using Global Data Assimilation System model data produced by the National Centers for Environmental Prediction (NCEP) and showed a clear difference in the air mass origins arriving at the measurement site during the NPF event and nonevent days. The back trajectories were calculated as ensembles for 24 h to arrive at 13:00 UTC (09:00 LT) at 50 m a.s.l. The back trajectories were calculated on NPF event days and for each day prior to and following an NPF event day. If an NPF event occurred on two consecutive days, the day after both events was used for the nonevent day back-trajectory calculations. On nonevent days, the 50th percentile of air masses originated from 2. 9∘ S, 58.6∘ W and 545 m a.s.l., a location upstream of the Amazon River. On NPF event days, the back-trajectory calculations show an origin at 2.5∘ S, 58.5∘ W and 602.5 m a.s.l.; this is further north, which is an area with dense rainforest. The results of the back-trajectory calculations are shown in Fig. 10.
Table 3The parameters from the pasture site for NPF days and nonevent days are shown. The values shown are the median total particle concentration measured by a CPC, the median neutral particle concentrations measured by the NAIS in two size ranges (2–4 and 4–12 nm), and the median negative ion concentrations from the NAIS in three size ranges (0.8–2, 2–4, and 4–12 nm). The values are calculated for the time window 08:00–12:00, which is when the NPF events take place. The numbers in brackets represent the 25th and 75th percentiles. The second part of the table includes median numbers of environmental parameters for the whole day: temperature, RH, precipitation, and wind direction for NPF and nonevent days.
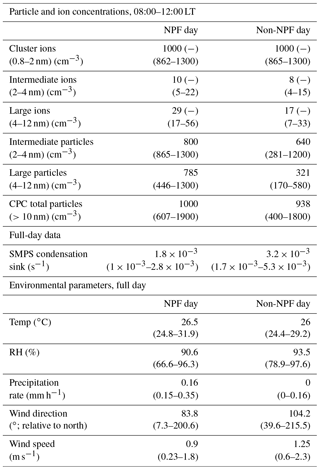
Figure 11 shows an example of an NPF event observed at the pasture site (T3), displaying MAOS SMPS data, NAIS total particle concentrations, and NAIS negative ion concentrations. The intermediate ion concentrations increased during this NPF event starting at 08:00, with a continuous growth reaching the smallest size channel of the MAOS SMPS at 10:00 (blue dashed line in Fig. 11d). The same can be observed in the large particle and ion (4–12 nm) channel from the NAIS (red and black lines, respectively).
Table 4The growth rates (GR, nm h−1) and nucleation rates (J; cm−3 s−1) determined from the NAIS ion and particle data for each nucleation event are presented. Both the GR values and the nucleation rates present median values for positive and negative ions. Also, the median values for the calculated condensation sink values (CS; s−1) for each event are shown. The condensation sink parameter is calculated from the SMPS size distributions. The last line of the table shows the median values for GR and J for all the nucleation event days, except the ion GR at 2–3 nm of 19.8 nm h−1 on 6 February 2014, which is considered to be an outlier and not included in the median.
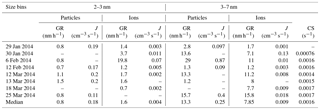
Table 3 shows a comparison of the median particle and ion concentrations (25th–75th percentiles in brackets), as well as the condensation sink, for the time window 08:00–12:00 comparing the NPF event and nonevent days. The condensation sink was clearly lower on NPF event days (0.0018 s−1) than on nonevent days (0.003 s−1), and the median concentration of intermediate (2–4 nm) ions and neutral particles was 1.3 times higher on NPF event days. The ion concentrations in the large size range were about a factor of 1.7 higher and neutral particle concentrations in the same size range were 2.4 times higher during the time of NPF compared to nonevent days.
We also compared environmental variables, including the temperature, relative humidity, and wind direction. No precipitation during any of the classified NPF events was observed, but on two classified NPF event days, precipitation periods were observed before or after the NPF events (starting at 06:00 and 17:00, respectively). The median temperature and RH were about the same for NPF event and nonevent days, whereas the median wind direction changed (83∘ N on event days and 105.5∘ N during nonevent days), consistent with the results from the back-trajectory analysis.
Table 4 shows the calculated growth rates, particle formation rates, and condensation sinks for each classified NPF event day. Note that here, the condensation sink was calculated for the time of the event, whereas the numbers in Tables 2 and 3 are for the whole day. The quantiles of both particle formation rate and growth rate were determined for two different size ranges (2–3 and 3–7 nm) and calculated separately for the ion and particle data. The results show considerably lower ion formation rates compared with neutral particle formation rates, consistent with observations made at most other continental sites (Manninen et al., 2010; Hirsikko et al., 2011). The growth rates of particles and ions were comparable to each other and typically smaller for the 2–3 nm size range than the 3–7 nm size range. An increase in the particle and ion growth rate with an increasing particle size has previously been reported at a few other sites (see Häkkinen et al., 2013, and references therein). We observed two regimes when looking at the neutral 3–7 nm growth rate. On 3 days, the growth rate was about 2 nm h−1, with sulfuric acid concentrations of about 2×106 cm−3. According to theoretical calculations about 107 cm−3 of sulfuric acid molecules can account for 1 nm h−1 (Nieminen et al., 2010). It is most likely that other compounds are contributing to the growth. Other NPF event days showed growth rates of about 14 nm h−1 for the same 3–7 nm size range, and the sulfuric acid concentration was even lower (about 6×105 cm−3). These growth rates are most likely driven by organic compounds (Tröstl et al., 2016). Tröstl et al. (2016) calculated that about 106–107 cm−3 of highly oxidized organic compounds are required to explain a growth rate of about 10 nm h−1.
We performed direct measurements of atmospheric new particle formation (NPF) events in the Amazon region with state-of-the-art aerosol instrumentation. The measurement campaigns were performed at two observation sites (T0t and T3) in the vicinity of Manaus in Brazil. One site was located within the rainforest (T0t), providing long-term (September 2011 to January 2014) measurement data to complement data from a pasture site (T3, January to October 2014).
No NPF events were observed at the T0t site during the long-term measurement period. However, we observed rain-induced ion and particle burst events (rain events) inside the rainforest during 264 of the 384 days. Concentrations of 2–4 and 4–12 nm ions and total particles were enhanced by up to 3 orders of magnitude during such rain events (∼104–105 cm−3) at the T0t site. The rain events occurred throughout the year, but the number of days with precipitation was the highest from December to June, corresponding to the wet season. Multiple rain events could occur during the same day, totaling 1491 rain events in 643 rainy days for both sites together. The duration of the rain events ranged from a couple of minutes to 22 h, but over 50 % of the events lasted <2 h. During the rain events, 0.8–2 and 2–4 nm negative ions increased more than the same-sized positive ions. The production of small (0.8–2 nm) and intermediate negative ions (–4 nm) during rain events reached a maximum of 105 cm−3 at the T0t site.
At the pasture site, we observed a clear diel pattern in the cluster ion concentration during both the wet and the dry season, with higher concentrations observed during the morning and evening. The PSM observations showed a similar diel cycle for particles >1.5 nm, with higher concentrations in the early morning, a dip in the afternoon, and an increase again in the evening after sunset. The diel cycle was less pronounced inside the rainforest, indicating that the rainforest canopy hinders vertical mixing.
We observed eight NPF events showing particle growth at the pasture site during January to March 2014. The formation rates were considerably higher for neutral particles than ions during these NPF events. The growth rates of newly formed ions and particles were comparable to each other and showed a clear increase with increasing size in the sub-20 nm size range. We found two different regimes for growth rates in the 3–7 nm size range: three out of eight NPF days showed a growth rate of about 2 nm h−1, and on four out of eight NPF days, a growth rate of about 14 nm h−1 was observed. The sulfuric acid concentrations were similar for both NPF event and nonevent days (approx. 9×105 cm−3). Most likely the observed growth for all NPF events is driven by highly oxidized organic compounds (Tröstl et al., 2016).
The back-trajectory calculations using HYSPLIT did not show any clear difference between the days with high and low growth rates. Nevertheless, there was a clear difference in air mass origin between the days with NPF events when back trajectories originated from the rainforest and nonevent days when back trajectories originated from the Amazon River. As observed in SMPS measurements, particles grew to sizes around 60 nm during all the NPF events, above which they are able to act as cloud condensation nuclei (McFiggans et al., 2006; Andreae and Rosenfeld, 2008; Kerminen et al., 2012). There were clear differences in the median cluster and intermediate ion concentrations between the NPF event and nonevent days for the local time window of 08:00–12:00. For NPF event days, the median intermediate ion and particle concentration was higher by a factor of 1.3 compared to nonevent days. The condensation sink was also lower on the NPF event days (0.0016 s−1) than on nonevent days (0.003 s−1). There were no NPF events observed during the dry season, when it is likely that the condensation sink is too high for new particle formation.
The data sets for the T3 site used in this publication are available at the ARM Climate Research Facility database for the GoAmazon2014/5 experiment (https://www.arm.gov/research/campaigns/amf2014goamazon, last access: 11 June 2018). The data from the T0t site can be made available upon request from the corresponding author.
DW analyzed the data, conducted the measurements, and wrote the paper. SBM analyzed the data and wrote the paper. HEM and VMK provided scientific guidance and wrote the paper. JK, AF, JBa, JBr, and FGM conducted the measurements. STM and PA designed the experiment. TN, JW, CK, RK, MK, and TP provided scientific guidance. All authors contributed to the analysis and interpretation of results.
The authors declare that they have no conflict of interest.
This article is part of the special issue “Observations and Modeling of the Green Ocean Amazon (GoAmazon2014/5) (ACP/AMT/GI/GMD inter-journal SI)”. It is not associated with a conference.
We acknowledge the Academy of Finland Centre of Excellence program (grant
no. 272041). We acknowledge the Atmospheric Radiation Measurement (ARM)
Climate Research Facility, a user facility of the United States Department
of Energy, Office of Science, sponsored by the Office of Biological and
Environmental Research, and support from the Atmospheric System Research
(ASR) program of that office. Daniela Wimmer wishes to acknowledge the Austrian
Science Fund (FWF; grant no. J-3951). Paulo Artaxo acknowledges FAPESP project
2013/05014-0 and CNPq for funding. We appreciate field support from Alcides Ribeiro, Bruno Takeshi,
and Fabio Jorge. We acknowledge logistical support
from the LBA Central Office at the INPA – Instituto Nacional de Pesquisas
da Amazonia.
Edited by: James Allan
Reviewed by: two anonymous referees
Aalto, P., Hämeri, K., Becker, E., Weber, R., Salm, J., Mäkelä, J. M., Hoell, C., O'Dowd, C. D., Karlsson, H., Hansson, H. C., Väkevä, M., Koponen, I. K., Buzorius, G., and Kulmala, M.: Physical characterization of aerosol particles during nucleation events, Tellus B, 53, 344–358, https://doi.org/10.1034/j.1600-0889.2001.530403.x, 2001.
Andreae, M. O.: Aerosols before pollution, Science, 315, 50–51, 2007.
Andreae, M. O. and Rosenfeld, D.: Aerosol-cloud-precipitation interactions. Part 1. The nature and sources of cloud-active aerosols, Earth-Sci. Rev., 89, 13–41, https://doi.org/10.1016/j.earscirev.2008.03.001, 2008.
Andreae, M. O., Acevedo, O. C., Araùjo, A., Artaxo, P., Barbosa, C. G. G., Barbosa, H. M. J., Brito, J., Carbone, S., Chi, X., Cintra, B. B. L., da Silva, N. F., Dias, N. L., Dias-Júnior, C. Q., Ditas, F., Ditz, R., Godoi, A. F. L., Godoi, R. H. M., Heimann, M., Hoffmann, T., Kesselmeier, J., Könemann, T., Krüger, M. L., Lavric, J. V., Manzi, A. O., Lopes, A. P., Martins, D. L., Mikhailov, E. F., Moran-Zuloaga, D., Nelson, B. W., Nölscher, A. C., Santos Nogueira, D., Piedade, M. T. F., Pöhlker, C., Pöschl, U., Quesada, C. A., Rizzo, L. V., Ro, C.-U., Ruckteschler, N., Sá, L. D. A., de Oliveira Sá, M., Sales, C. B., dos Santos, R. M. N., Saturno, J., Schöngart, J., Sörgel, M., de Souza, C. M., de Souza, R. A. F., Su, H., Targhetta, N., Tóta, J., Trebs, I., Trumbore, S., van Eijck, A., Walter, D., Wang, Z., Weber, B., Williams, J., Winderlich, J., Wittmann, F., Wolff, S., and Yáñez-Serrano, A. M.: The Amazon Tall Tower Observatory (ATTO): overview of pilot measurements on ecosystem ecology, meteorology, trace gases, and aerosols, Atmos. Chem. Phys., 15, 10723–10776, https://doi.org/10.5194/acp-15-10723-2015, 2015.
Artaxo, P., Rizzo, L. V., Brito, J. F., Barbosa, H. M. J., Arana, A., Sena, E. T., Cirino, G. G., Bastos, W., Martin, S. T., and Andreae, M. O.: Atmospheric aerosols in Amazonia and land use change: from natural biogenic to biomass burning conditions, Faraday Discuss., 165, 203–235, 2013.
Asmi, E., Sipilä, M., Manninen, H. E., Vanhanen, J., Lehtipalo, K., Gagné, S., Neitola, K., Mirme, A., Mirme, S., Tamm, E., Uin, J., Komsaare, K., Attoui, M., and Kulmala, M.: Results of the first air ion spectrometer calibration and intercomparison workshop, Atmos. Chem. Phys., 9, 141–154, https://doi.org/10.5194/acp-9-141-2009, 2009.
Backman, J., Rizzo, L. V., Hakala, J., Nieminen, T., Manninen, H. E., Morais, F., Aalto, P. P., Siivola, E., Carbone, S., Hillamo, R., Artaxo, P., Virkkula, A., Petäjä, T., and Kulmala, M.: On the diurnal cycle of urban aerosols, black carbon and the occurrence of new particle formation events in springtime São Paulo, Brazil, Atmos. Chem. Phys., 12, 11733–11751, https://doi.org/10.5194/acp-12-11733-2012, 2012.
Brito, J., Rizzo, L. V., Morgan, W. T., Coe, H., Johnson, B., Haywood, J., Longo, K., Freitas, S., Andreae, M. O., and Artaxo, P.: Ground-based aerosol characterization during the South American Biomass Burning Analysis (SAMBBA) field experiment, Atmos. Chem. Phys., 14, 12069–12083, https://doi.org/10.5194/acp-14-12069-2014, 2014.
de Sá, S. S., Palm, B. B., Campuzano-Jost, P., Day, D. A., Newburn, M. K., Hu, W., Isaacman-VanWertz, G., Yee, L. D., Thalman, R., Brito, J., Carbone, S., Artaxo, P., Goldstein, A. H., Manzi, A. O., Souza, R. A. F., Mei, F., Shilling, J. E., Springston, S. R., Wang, J., Surratt, J. D., Alexander, M. L., Jimenez, J. L., and Martin, S. T.: Influence of urban pollution on the production of organic particulate matter from isoprene epoxydiols in central Amazonia, Atmos. Chem. Phys., 17, 6611–6629, https://doi.org/10.5194/acp-17-6611-2017, 2017.
Dos Santos, V. N., Herrmann, E., Manninen, H. E., Hussein, T., Hakala, J., Nieminen, T., Aalto, P. P., Merkel, M., Wiedensohler, A., Kulmala, M., Petäjä, T., and Hämeri, K.: Variability of air ion concentrations in urban Paris, Atmos. Chem. Phys., 15, 13717–13737, https://doi.org/10.5194/acp-15-13717-2015, 2015.
Dunne, E., Gordon, H., Kürten, A., Almeida, J., Duplissy, J., Williamson, C., Ortega, I. K., Pringle, J.K., Adamov, A., Baltensperger, U., Barmet, P., Benduhn, F., Bianchi, F., Breitenlechner, M., Clarke, A., Curtius, J., Dommen, J., Donahue, N. M., Ehrhart, S., Flagan, R. C.,Franchin, A., Guida, R., Hakala, J., Hansel, A., Heinritzi, M., Jokinen, T., Kangasluoma, J., Kirkby, J., Kulmala, M., Kupc, A., Lawler, M. J., Lehtipalo, K., Makhmutov, V., Mann, G., Mathot, S., Merikanto, J., Miettinen, P., Nenes, A., Onnela, A., Rap, A., Reddington, C. L. S., Riccobono, F., Richards, N. D. A.,Rissanen, M. P., Rondo, L., Sarnela, N., Schobesberger, S., Sengupta, K., Simon, M., Sipilä, M., Smith, J. N., Stozkhov, Y., Tomé, A., Tröstl, J., Wagner, P. E., Wimmer, D., Winkler, P. M., Worsnop, D. R., and Carslaw K. S.: Global atmospheric particle formation from CERN CLOUD measurements, Science, 354, 1119–1124, https://doi.org/10.1126/science.aaf2649, 2016.
Häkkinen, S. A. K., Manninen, H. E., Yli-Juuti, T., Merikanto, J., Kajos, M. K., Nieminen, T., D'Andrea, S. D., Asmi, A., Pierce, J. R., Kulmala, M., and Riipinen, I.: Semi-empirical parameterization of size-dependent atmospheric nanoparticle growth in continental environments, Atmos. Chem. Phys., 13, 7665–7682, https://doi.org/10.5194/acp-13-7665-2013, 2013.
Harrison, R. G. and Carslaw, K. S.: Ion-Aerosol-cloud processes in the lower atmosphere, Rev. Geophys., 41, 1012, https://doi.org/10.1029/2002RG000114, 2003.
Hirsikko, A., Bergman, T., Laakso, L., Dal Maso, M., Riipinen, I., Hõrrak, U., and Kulmala, M.: Identification and classification of the formation of intermediate ions measured in boreal forest, Atmos. Chem. Phys., 7, 201–210, https://doi.org/10.5194/acp-7-201-2007, 2007.
Hirsikko, A., Nieminen, T., Gagné, S., Lehtipalo, K., Manninen, H. E., Ehn, M., Hõrrak, U., Kerminen, V.-M., Laakso, L., McMurry, P. H., Mirme, A., Mirme, S., Petäjä, T., Tammet, H., Vakkari, V., Vana, M., and Kulmala, M.: Atmospheric ions and nucleation: a review of observations, Atmos. Chem. Phys., 11, 767–798, https://doi.org/10.5194/acp-11-767-2011, 2011.
Hõrrak, U., Tammet, H., Aalto, P. P., Vana, M., Hirsikko, A., Laakso, L., and Kulmala, M.: Formation of charged particles associated with rainfall: atmospheric measurements and lab experiments, Rep. Ser. Aerosol Sci., 80, 180–185, 2006.
Iida, K., Stolzenburg, M. R., and McMurry, P. H.: Effect of Working Fluid on Sub-2 nmParticle Detectionwith a Laminar Flow Ultrafine Condensation Particle Counter, Aerosol Sci. Technol., 43, 81–96, 2009.
Kalivitis, N., Stavroulas, I., Bougiatioti, A., Kouvarakis, G., Gagné, S., Manninen, H. E., Kulmala, M., and Mihalopoulos, N.: Night-time enhanced atmospheric ion concentrations in the marine boundary layer, Atmos. Chem. Phys., 12, 3627–3638, https://doi.org/10.5194/acp-12-3627-2012, 2012.
Kangasluoma, J., Kuang, C., Wimmer, D., Rissanen, M. P., Lehtipalo, K., Ehn, M., Worsnop, D. R., Wang, J., Kulmala, M., and Petäjä, T.: Sub-3 nm particle size and composition dependent response of a nano-CPC battery, Atmos. Meas. Tech., 7, 689–700, https://doi.org/10.5194/amt-7-689-2014, 2014.
Kerminen, V.-M., Paramonov, M., Anttila, T., Riipinen, I., Fountoukis, C., Korhonen, H., Asmi, E., Laakso, L., Lihavainen, H., Swietlicki, E., Svenningsson, B., Asmi, A., Pandis, S. N., Kulmala, M., and Petäjä, T.: Cloud condensation nuclei production associated with atmospheric nucleation: a synthesis based on existing literature and new results, Atmos. Chem. Phys., 12, 12037–12059, https://doi.org/10.5194/acp-12-12037-2012, 2012.
Kontkanen, J., Lehtipalo, K., Ahonen, L., Kangasluoma, J., Manninen, H. E., Hakala, J., Rose, C., Sellegri, K., Xiao, S., Wang, L., Qi, X., Nie, W., Ding, A., Yu, H., Lee, S., Kerminen, V.-M., Petäjä, T., and Kulmala, M.: Measurements of sub-3 nm particles using a particle size magnifier in different environments: from clean mountain top to polluted megacities, Atmos. Chem. Phys., 17, 2163–2187, https://doi.org/10.5194/acp-17-2163-2017, 2017.
Kulmala, M., Vehkämäki, H., Petäjä, T., Dal Maso, M., Lauri, A., Kerminen, V. M., Birmili, W., and McMurry, P. H.: Formation and growth rates of ultrafine atmospheric particles: a review of observations, J. Aerosol Sci., 35, 143–176, 2004.
Kulmala, M., Petäjä, T., Nieminen, T., Sipilä, M., Manninen, H. E., Lehtipalo, K., Dal Maso, M., Aalto, P. P., Junninen, H., Paasonen, P., Riipinen, I., Lehtinen, K. E. J.: Laaksonen, A., and Kerminen, V.-M.: Measurement of the nucleation of atmospheric aerosol particles, Nat. Protoc., 7, 1651–1667, 2012.
Kulmala, M., Petäjä, T. Ehn, M., Thornton, J., Sipilä, M., Worsnop, D. R., and Kerminen, V.-M.: Chemistry of Atmospheric Nucleation: On the Recent Advances on Precursor Characterization and Atmospheric Cluster Composition in Connection with Atmospheric New Particle Formation, Annu. Rev. Phys. Chem., 65, 21–37, 2014.
Kulmala, M., Luoma, K., Virkkula, A, Petäjä, T., Paasonen, P., Kerminen, V.-M. Nie, W., Qi, X., Shen, Y., Chi, X., and Ding, A.: On the mode-segregated aerosol particle number concentration load: contributions of primary and secondary particles in Hyytiala and Nanjing, Boreal Environ. Res., 21, 319–331, 2016.
Leino, K., Nieminen, T., Manninen, H. E., Petäjä, T., Kerminen, V.-M., and Kulmala, M.: Intermediate ions as a strong indicator of new particle formation bursts in a boreal forest, Boreal Environ. Res., 21, 274–286, 2016.
Lelieveld, J., Butler, T. M., Crowley, J. N., Dillon, T. J., Fischer, H., Ganzeveld, L., Harder, H., Lawrence, M. G., Martinez, M., Taraborrelli, D., and Williams, J.: Atmospheric oxidation capacity sustained by a tropical forest, Nature, 452, 737–740, 2008.
Manninen, H. E., Nieminen, T., Asmi, E., Gagné, S., Häkkinen, S., Lehtipalo, K., Aalto, P., Vana, M., Mirme, A., Mirme, S., Hõrrak, U., Plass-Dülmer, C., Stange, G., Kiss, G., Hoffer, A., Töro, N., Moerman, M., Henzing, B., de Leeuw, G., Brinkenberg, M., Kouvarakis, G. N., Bougiatioti, A., Mihalopoulos, N., O'Dowd, C., Ceburnis, D., Arneth, A., Svenningsson, B., Swietlicki, E., Tarozzi, L., Decesari, S., Facchini, M. C., Birmili, W., Sonntag, A., Wiedensohler, A., Boulon, J., Sellegri, K., Laj, P., Gysel, M., Bukowiecki, N., Weingartner, E., Wehrle, G., Laaksonen, A., Hamed, A., Joutsensaari, J., Petäjä, T., Kerminen, V.-M., and Kulmala, M.: EUCAARI ion spectrometer measurements at 12 European sites – analysis of new particle formation events, Atmos. Chem. Phys., 10, 7907–7927, https://doi.org/10.5194/acp-10-7907-2010, 2010.
Manninen, H. E., Mirme, S., Mirme, A., Petäjä, T., and Kulmala, M.: How to reliably detect molecular clusters and nucleation mode particles with Neutral cluster and Air Ion Spectrometer (NAIS), Atmos. Meas. Tech., 9, 3577–3605, https://doi.org/10.5194/amt-9-3577-2016, 2016.
Martin, S. T., Andreae, M. O., Artaxo, P., Baumgardner, D., Chen, Q., Goldstein, A. H., Guenther, A., Heald, C. L., Mayol-Bracero, O. L., McMurry, P. H., Pauliquevis, T., Poeschl, U., Prather, K. A., Roberts, G. C., Saleska, S. R., Silva Dias, M. A., Spracklen, D. V., Swietlicki, E., and Trebs, I.: Sources and properties of Amazonian aerosol particles, Rev. Geophys., 48, RG2002, https://doi.org/10.1029/2008RG000280, 2010a.
Martin, S. T., Andreae, M. O., Althausen, D., Artaxo, P., Baars, H., Borrmann, S., Chen, Q., Farmer, D. K., Guenther, A., Gunthe, S. S., Jimenez, J. L., Karl, T., Longo, K., Manzi, A., Müller, T., Pauliquevis, T., Petters, M. D., Prenni, A. J., Pöschl, U., Rizzo, L. V., Schneider, J., Smith, J. N., Swietlicki, E., Tota, J., Wang, J., Wiedensohler, A., and Zorn, S. R.: An overview of the Amazonian Aerosol Characterization Experiment 2008 (AMAZE-08), Atmos. Chem. Phys., 10, 11415–11438, https://doi.org/10.5194/acp-10-11415-2010, 2010b.
Martin, S. T., Artaxo, P., Machado, L. A. T., Manzi, A. O., Souza, R. A. F., Schumacher, C., Wang, J., Andreae, M. O., Barbosa, H. M. J., Fan, J., Fisch, G., Goldstein, A. H., Guenther, A., Jimenez, J. L., Pöschl, U., Silva Dias, M. A., Smith, J. N., and Wendisch, M.: Introduction: Observations and Modeling of the Green Ocean Amazon (GoAmazon2014/5), Atmos. Chem. Phys., 16, 4785–4797, https://doi.org/10.5194/acp-16-4785-2016, 2016.
Martin, S. T., Artaxo P., Machado, L., Manzi, A. O., Souza, R. A. F., Schumacher, C., Wang, J., Biscaro, T., Brito, J., Calheiros, A., Jardine, K., Medeiros, A., Portela, B., de Sá, S. S., Adachi, K., Aiken, A. C., Albrecht, R., Alexander, L., Andreae, M. O., Barbosa, H. M. J., Buseck, P., Chand, D., Comstock, J. M., Day, D. A., Dubey, M., Fan, J., Fast, J., Fisch, G., Fortner, E., Giangrande, S., Gilles, M., Goldstein, A. H., Guenther, A., Hubbe, J., Jensen, M., Jimenez, J. L., Keutsch, F. N., Kim, S., Kuang, C., Laskin, A., McKinney, K., Mei, F., Miller, M., Nascimento, R., Pauliquevis, T., Pekour, M., Peres, J., Petäjä, T, Pöhlker, C., Pöschl, U., Rizzo, L., Schmid, B., Shilling, J. E., Silva Dias, M. A., Smith, J. N., Tomlinson, J. M., Tóta, J., and Wendisch, M.: The Green Ocean Amazon Experiment (GoAmazon2014/5) observes pollution affecting gases, aerosols, clouds and rainfall over the rain forest, B. Am. Meteorol. Soc., 98, 981–997, https://doi.org/10.1175/BAMS-D-15-00221.1, 2017.
Mather, J. H. and Voyles, J. W.: The ARM Climate Research Facility: A review of structure and capabilities, B. Am. Meteorol. Soc., 94, 377–392, 2013.
McFiggans, G., Artaxo, P., Baltensperger, U., Coe, H., Facchini, M. C., Feingold, G., Fuzzi, S., Gysel, M., Laaksonen, A., Lohmann, U., Mentel, T. F., Murphy, D. M., O'Dowd, C. D., Snider, J. R., and Weingartner, E.: The effect of physical and chemical aerosol properties on warm cloud droplet activation, Atmos. Chem. Phys., 6, 2593–2649, https://doi.org/10.5194/acp-6-2593-2006, 2006.
Merikanto, J., Spracklen, D. V., Mann, G. W., Pickering, S. J., and Carslaw, K. S.: Impact of nucleation on global CCN, Atmos. Chem. Phys., 9, 8601–8616, https://doi.org/10.5194/acp-9-8601-2009, 2009.
Nieminen, T., Lehtinen, K. E. J., and Kulmala, M.: Sub-10 nm particle growth by vapor condensation – effects of vapor molecule size and particle thermal speed, Atmos. Chem. Phys., 10, 9773–9779, https://doi.org/10.5194/acp-10-9773-2010, 2010.
Rissler, J., Vestin, A., Swietlicki, E., Fisch, G., Zhou, J., Artaxo, P., and Andreae, M. O.: Size distribution and hygroscopic properties of aerosol particles from dry-season biomass burning in Amazonia, Atmos. Chem. Phys., 6, 471–491, https://doi.org/10.5194/acp-6-471-2006, 2006.
Rolph, G., Stein, A., and Stunder, B.: Real-time Environmental Applications and Display sYstem: READY, Environ. Modell. Softw., 95, 210–228, https://doi.org/10.1016/j.envsoft.2017.06.025, 2017.
Rose, C., Sellegri, K., Velarde, F., Moreno, I., Ramonet, M., Weinhold, K., Krejci, R. Ginot, P., Andrade, M., Wiedensohler, A., and Laj, P.: Frequent nucleation events at the high altitude station of Chacaltaya (5240 m a.s.l.), Bolivia, Atmos. Environ., 102, 18–29, https://doi.org/10.1016/j.atmosenv.2014.11.015, 2015.
Suni, T., Kulmala, M., Hirsikko, A., Bergman, T., Laakso, L., Aalto, P. P., Leuning, R., Cleugh, H., Zegelin, S., Hughes, D., van Gorsel, E., Kitchen, M., Vana, M., Hõrrak, U., Mirme, S., Mirme, A., Sevanto, S., Twining, J., and Tadros, C.: Formation and characteristics of ions and charged aerosol particles in a native Australian Eucalypt forest, Atmos. Chem. Phys., 8, 129–139, https://doi.org/10.5194/acp-8-129-2008, 2008.
Svenningsson, B., Arneth, A., Hayward, S., Holst, T., Massling, A., Swietlicki, E., Hirsikko, A., Junninen, H., Riipinen, I., Vana, M., Dal Maso, M., Hussein, T., and Kulmala, M.: Aerosol particle formation events and analysis of high growth rates observed above a subarctic wetland-forest mosaic, Tellus B, 60B, 353–364, 2008.
Tammet, H., Hõrrak, U., and Kulmala, M.: Negatively charged nanoparticles produced by splashing of water, Atmos. Chem. Phys., 9, 357–367, https://doi.org/10.5194/acp-9-357-2009, 2009.
Thalman, R., de Sá, S. S., Palm, B. B., Barbosa, H. M. J., Pöhlker, M. L., Alexander, M. L., Brito, J., Carbone, S., Castillo, P., Day, D. A., Kuang, C., Manzi, A., Ng, N. L., Sedlacek III, A. J., Souza, R., Springston, S., Watson, T., Pöhlker, C., Pöschl, U., Andreae, M. O., Artaxo, P., Jimenez, J. L., Martin, S. T., and Wang, J.: CCN activity and organic hygroscopicity of aerosols downwind of an urban region in central Amazonia: seasonal and diel variations and impact of anthropogenic emissions, Atmos. Chem. Phys., 17, 11779–11801, https://doi.org/10.5194/acp-17-11779-2017, 2017.
Tröstl, J., Chuang, W. K., Gordon, H., Heinritzi, M., Yan, C., Molteni, U., Ahlm, L., Frege, C., Bianchi, F., Wagner, R., Simon, M., Lehtipalo, K., Williamson, C., Craven, J. S., Duplissy, J., Adamov, A., Almeida, J., Bernhammer, A.-K., Breitenlechner, M., Brilke, S., Dias, A., Ehrhart, S., Flagan, R. C., Franchin, A., Fuchs, C., Guida, R., Gysel, M., Hansel, A., Hoyle, C. R., Jokinen, T., Junninen, H., Kangasluoma, J., Keskinen, H., Kim, J., Krapf, M., Kürten, A., Laaksonen, A., Lawler, M.,Leiminger, M., Mathot, S., Möhler, O., Nieminen, T., Onnela, A., Petäjä, T., Piel, F. – M., Miettinen, P., Rissanen, M. P., Rondo, L., Sarnela, N., Schobesberger, S., Sengupta, K., Sipilä, M., Smith, J. N., Steiner, G., Tomè, A., Virtanen, A., Wagner, A.C., Weingartner, E., Wimmer, D., Winkler, P. M., Ye, P., Carslaw, K. S., Curtius, J., Dommen, J., Kirkby, J., Kulmala, M., Riipinen, I., Worsnop, D. R., Donahue, N. M., and Baltensperger, U.: The role of low-volatility organic compounds in initial particle growth in the atmosphere, Nature, 533, 527–531, https://doi.org/10.1038/nature18271, 2016.
Vana, M., Kulmala, M., Dal Maso, M., and Hõrrak, U.: Comparative study of nucleation mode aerosol particles and intermediate air ions formation events at three sites, J. Geophys. Res., 109, D17201, https://doi.org/10.1029/2003JD004413, 2004.
Vana, M., Ehn, M., Petäjä, T., Vuollekoski, H., Aalto, P., de Leeuw, G., Ceburnis, D., O'Dowd, C. D., and Kulmala, M.: Characteristic features of air ions at Mace Head on the west coast of Ireland, Atmos. Res., 90, 278–286, https://doi.org/10.1016/j.atmosres.2008.04.007, 2008.
Vanhanen, J., Mikkilä, J., Lehtipalo, K., Sipilä, M., Manninen, H. E., Siivola, E., Petäjä, T., and Kulmala, M.: Particle size magnifier for nano-CN detection, Aerosol Sci. Tech., 45, 533–542, 2011.
Wagner, R., Manninen, H. E., Franchin, A., Lehtipalo, K., Mirme, S., Steiner, G., Petäjä, T., and Kulmala, M.: On the accuracy of ion measurements using a Neutral cluster and Air Ion Spectrometer, Boreal Environ. Res., 21, 230–241, 2016.
Wang, J., Krejci, R., Giangrande, S., Kuang, C., Barbosa, H. M. J., Brito, J., Carbone, S., Chi, X., Comstock, J., Ditas, F., Lavric, J., Manninen, H. E., Mei, F., Moran-Zuloaga, D., Pöhlker, C., Pöhlker, M. L., Saturno, J., Schmid, B., Souza, R. A. F., Springston, S. R., Tomlinson, J. M., Toto, T., Walter, D., Wimmer, D., Smith, J. N., Kulmala, M., Machado, L.A. T., Artaxo, P., Andreae, M. O., Petäjä, T., and Martin, S. T.: Amazon boundary layer aerosol concentration sustained by vertical transport during rainfall, Nature, 539, 416–419, https://doi.org/10.1038/nature19819, 2016.
Wang, M. and Penner, J. E.: Aerosol indirect forcing in a global model with particle nucleation, Atmos. Chem. Phys., 9, 239–260, https://doi.org/10.5194/acp-9-239-2009, 2009.
Yu, F. and Luo, G.: Simulation of particle size distribution with a global aerosol model: contribution of nucleation to aerosol and CCN number concentrations, Atmos. Chem. Phys., 9, 7691–7710, https://doi.org/10.5194/acp-9-7691-2009, 2009.
Zhou, J., Swietlicki, E., Hansson, H. C., and Artaxo, P.: Submicrometer aerosol particle size distribution and hygroscopic growth measured in the Amazon rain forest during the wet season, J. Geophys. Res.-Atmos., 107, 8055, https://doi.org/10.1029/2000JD000203, 2002.