the Creative Commons Attribution 4.0 License.
the Creative Commons Attribution 4.0 License.
 | 24 Aug 2018
Effectiveness of ammonia reduction on control of fine particle nitrate
Hongyu Guo
Rene Otjes
Patrick Schlag
Astrid Kiendler-Scharr
Athanasios Nenes
In some regions, reducing aerosol ammonium nitrate (NH4NO3) concentrations may substantially improve air quality. This can be accomplished by reductions in precursor emissions, such as nitrogen oxides (NOx) to lower nitric acid (HNO3) that partitions to the aerosol, or reductions in ammonia (NH3) to lower particle pH and keep HNO3 in the gas phase. Using the ISORROPIA-II thermodynamic aerosol model and detailed observational data sets, we explore the sensitivity of aerosol NH4NO3 to gas-phase NH3 and NOx controls for a number of contrasting locations, including Europe, the United States, and China. NOx control is always effective, whereas the aerosol response to NH3 control is highly nonlinear and only becomes effective at a thermodynamic sweet spot. The analysis provides a conceptual framework and fundamental evaluation on the relative value of NOx versus NH3 control and demonstrates the relevance of pH as an air quality parameter. We find that, regardless of the locations examined, it is only when ambient particle pH drops below an approximate critical value of 3 (slightly higher in warm and slightly lower in cold seasons) that NH3 reduction leads to an effective response in PM2.5 mass. The required amount of NH3 reduction to reach the critical pH and efficiently decrease NH4NO3 at different sites is assessed. Owing to the linkage between NH3 emissions and agricultural productivity, the substantial NH3 reduction required in some locations may not be feasible. Finally, controlling NH3 emissions to increase aerosol acidity and evaporate NH4NO3 will have other effects, beyond reduction of PM2.5 NH4NO3, such as increasing aerosol toxicity and potentially altering the deposition patterns of nitrogen and trace nutrients.
- Article
(4229 KB) - Full-text XML
-
Supplement
(4639 KB) - BibTeX
- EndNote


Global trends of increasing gas-phase ammonia (NH3) concentrations (Erisman et al., 2008) have multiple environmental implications. As part of the global nitrogen cycle (Fowler et al., 2013), excessive NH3 deposition promotes alga blooms, degrades water quality, and may be toxic for ecosystems (Krupa, 2003; Camargo and Alonso, 2006). NH3 is one of the most important atmospheric alkaline species, as it influences the pH of clouds, fogs, precipitation (Wells et al., 1998), and fine particles (PM2.5) (Guo et al., 2017c). Agricultural practices, including use of synthetic nitrogen-based fertilizer and domesticated animal manure, are the major anthropogenic NH3 sources (Galloway et al., 2003; Aneja et al., 2009; Zhang et al., 2018). Minor contributions include biomass burning (e.g., forest fires), fossil fuel combustion, and vehicle catalytic converters (Perrino et al., 2002; Behera et al., 2013). Higher temperatures resulting from global warming can also potentially enhance NH3 emissions (Skjøth and Geels, 2013). Given that fertilizer usage supports food production for about half the global population (Erisman et al., 2008), NH3 emissions are linked to world population and so expected to increase into the 21st century (Gerland et al., 2014). Compared to the limited regulation of NH3 emissions, other anthropogenic air pollutants that are linked to acidic atmospheric species, such as sulfur dioxide (SO2) and nitrogen oxide (NOx), are regulated through air quality standards, which accounts for their observed decreasing gas and aerosol concentrations in the United States (Hand et al., 2012; Russell et al., 2012; Hidy et al., 2014), western Europe, and China (Warner et al., 2017). Decreasing trends of SO2 and NOx emissions are expected to continue on global scales throughout the century (IPCC, 2013). The contrast between increasing NH3 and decreasing SO2 and NOx leads to changes in aerosol composition and mass concentration. NH3 reacts rapidly with the oxidized products of SO2 and NOx, sulfuric (H2SO4) and nitric (HNO3) acids, to form ammonium sulfate ((NH4)2SO4, or other forms such as NH4HSO4, (NH4)3H(SO4)2), and ammonium nitrate (NH4NO3) aerosols, which globally constitute an important fraction of ambient PM2.5 mass (Kanakidou et al., 2005; Sardar et al., 2005; Zhang et al., 2007). These reaction pathways link NH3 to PM2.5 mass and its subsequent impacts on human health (Pope et al., 2004; Lim et al., 2012; Lelieveld et al., 2015; Cohen et al., 2017) and the climate system (Haywood and Boucher, 2000; Bellouin et al., 2011; IPCC, 2013).
A number of studies using regional- or global-scale models have investigated NH3 controls as a way to reduce PM2.5 mass to meet air quality standards (Erisman and Schaap, 2004; Pinder et al., 2007, 2008; Paulot and Jacob, 2014; Bauer et al., 2016; Pozzer et al., 2017). The fundamental premise is that reducing NH3 will increase aerosol acidity (i.e., lower aerosol pH) and prevent the formation of NH4NO3, reducing overall PM2.5 mass. As a secondary effect, lower pH can also reduce the sulfate production rate, such as the in-cloud SO2 oxidation by O3 (Wang et al., 2011; Cheng et al., 2016; Paulot et al., 2017). Use of large-scale models to assess effectiveness of NH3 controls requires (i) good predictions of a range of pertinent emissions and sinks (NH3; NOx; SO2; and nonvolatile cations, NVCs) and (ii) accurate representation of their applicable atmospheric chemical processes. Thermodynamic modules in different levels of complexity are then applied to determine sensitivities to the precursors (e.g., NH3, HNO3). In some cases (Pozzer et al., 2017), the aerosol pH is explicitly determined with an embedded thermodynamic model, such as ISORROPIA-II (Fountoukis and Nenes, 2007). Due to the complexities from all these factors, chemical-transport-model-predicted responses to changing emissions may not align with observations. For example, the sensitivity of PM2.5 pH in the Community Multiscale Air Quality Modeling System (CMAQ) simulations to the mass of crustal material apportioned to the PM2.5 size range can have important effects on anticipated responses to these changing emission trends. Vasilakos et al. (2018) have shown that including too much crustal material in PM2.5 results in a predicted increasing trend in both aerosol pH and concentrations of NH4NO3, which is counter to observations (Weber et al., 2016).
Overall, calculating aerosol pH is a more accurate approach that provides a fundamental understanding of the factors controlling HNO3– partitioning and therefore enables a direct evaluation of different studies. Furthermore, it is also useful to determine aerosol pH since it has broad application to many other important aerosol processes. For instance, pH is a mediator of many heterogeneous chemical processes, including various acid-catalyzed reactions (Jang et al., 2002; Eddingsaas et al., 2010; Surratt et al., 2010); gas–particle partitioning of species other than HNO3 and NH3, such as organic acids and halogens (Fridlind and Jacobson, 2000; Young et al., 2013; Guo et al., 2017a; Nah et al., 2018); and solubility of metals and other nutrient species (Meskhidze et al., 2003; Nenes et al., 2011; Longo et al., 2016; Stockdale et al., 2016; Fang et al., 2017).
In this study, we apply a more direct approach, where measured gas and particle concentrations and the thermodynamic model ISORROPIA-II are used directly in a sensitivity analysis to evaluate the effectiveness of NH3 emission controls on fine particle mass relative to NOx control. Contrasts are made between sites that have a wide range in NH3 concentrations and aerosol composition, with a focus on a 1-year data set collected in Cabauw, the Netherlands (Schlag et al., 2016). This site had year-round high NH3 concentrations (average 7.3±6.0 µg m−3, ∼10 ppbv), with nitrate comprising a significant fraction of the fine particle mass (30 % of PM1), and there was a strong seasonal temperature variation. The goal is to establish a transparent and fundamental understanding on when NH3 emission controls could be an effective way to alter aerosol pH to reduce ammonium nitrate aerosol concentrations, without the use of a full chemical transport model.
2.1 Sampling sites
Cabauw. One year (July 2012 to June 2013) of online aerosol and gas measurements of inorganic species were performed at the Cabauw Experimental Site for Atmospheric Research (CESAR; 51.970∘ N, 4.926∘ E), near the village of Cabauw, the Netherlands. Cabauw is a rural site situated approximately 45 km from the Atlantic Ocean and surrounded by agricultural land. Northwestern Europe has fairly high NH3 concentrations with yearly averages ranging from 1 to 14 µg m−3 (median as 4.2 µg m−3) for the Netherlands in 2013, reported by the Measuring Ammonia in Nature (MAN) network (Lolkema et al., 2015). Satellite-derived 14-year average for western Europe is 3 ppbv (∼2.3 µg m−3) (Warner et al., 2017). Cabauw was somewhat higher due to intensive agriculture in the region with observed yearly NH3 average of 7.3±6.0 µg m−3 (∼10 ppbv). Site details, instrumentation, and measurement intercomparisons can be found in Schlag et al. (2016). The data used in this analysis are from a monitor for aerosols and gases (MARGA, Applikon Analytical BV) that was operated by the Energy Research Centre of the Netherlands (ECN). The instrument performs online measurements of soluble inorganic gases collected in a continuously wetted-wall denuder, followed by a steam–condensation system for collection of particles. Both the aqueous samples of gases and particles are measured via ion chromatography (Schaap et al., 2011; Rumsey et al., 2014), including NH3, HNO3, and HCl, and particle-phase , , Cl−, , Na+, K+, Ca2+, and Mg2+ alternatively between PM1 and PM2.5, with each size sampled hourly (i.e., a 2 h interval for one size and a 1 h interval for gas). Measurement uncertainties were below 10 % (Schaap et al., 2011). The detection limits were 0.05, 0.10, 0.08, and 0.01 µg m−3 for aerosol ions , , , and Cl−, respectively, and 0.10 and 0.05 µg m−3 for the gases HNO3 and NH3 (Rumsey et al., 2014). Relative humidity (RH) and temperature (T) data were collected at the 2 m level from the CESAR tower and used to represent ground level meteorological conditions (for an overview see Fig. S7 in Schlag et al., 2016).
Other sites. In addition to the Cabauw site, we analyze the effectiveness of NH3 reduction for a number of contrasting sites where we have already reported on aerosol pH in detail. This includes data from the Southern Oxidant and Aerosol Study (SOAS) (Guo et al., 2015); Wintertime Investigation of Transport, Emissions, and Reactivity (WINTER) (Guo et al., 2016); and California Research at the Nexus of Air Quality and Climate Change (CalNex) study (Guo et al., 2017a). Briefly, the SOAS data were collected at the Southeastern Aerosol Research and Characterization (SEARCH) Centreville ground site, representative of the southeastern US background conditions, from June to July 2013. The WINTER data were sampled from the National Center for Atmospheric Research (NCAR) C-130 aircraft operating from Feb to March 2015 mainly in the northeastern US. The CalNex data were collected from May to June 2010 in Pasadena, California, an urban site that is part of the greater Los Angeles region. As a further contrast for regions of very high NH3 concentrations, we include an analysis from published data in Beijing during winter haze events in 2015 (Wang et al., 2016), for which pH has also been investigated (Guo et al., 2017c). Table S1 in the Supplement summarizes the conditions at the various sites.
2.2 Thermodynamic modeling
The ISORROPIA-II thermodynamic model (Fountoukis and Nenes, 2007) was used to determine the composition and phase state of an , , , Cl−, Na+, Ca2+, K+, Mg2+, and water inorganic aerosol and its partitioning with corresponding gases. Thermodynamic equilibrium is assumed between fine particles and gases for all semivolatile inorganic species, including particle water and water vapor. Timescales for submicron particles to reach equilibrium are about 30 min (Dassios and Pandis, 1999; Cruz et al., 2000; Fountoukis et al., 2009). The model is run in “forward mode” to calculate gas–particle equilibrium concentrations based on the input of total concentration of inorganic species (e.g., NH3 + , HNO3 + , , and Na+). has no gas pair as it is virtually nonvolatile in the observed temperature ranges of this study (An et al., 2007). The forward mode gives more accurate and robust results than the reverse mode since it is much less sensitive to measurement uncertainties (Hennigan et al., 2015). Inorganic ions are also assumed to be only in the aqueous phase (i.e., no solid precipitates). This entails a number of assumptions. First, the ambient RH and the history of the particles' exposure to RH result in a deliquesced particle. In many cases, diurnal swings in RH (i.e., the maximum RH in early morning) are generally sufficient to reach the deliquescent point. Furthermore, efflorescence RHs are generally low and rarely reached by the ambient RH (10 to 30 %) (Bertram et al., 2011). Thus, a deliquesced particle is often a good assumption when average ambient RH is above 50 %. For Cabauw, the 1-year mean RH was 81±15 % (±SD), with RH reaching up to 90 % during diurnal cycles (see Fig. S1a in the Supplement), making the presence of a liquid phase a reasonable assumption. For the other sites studied, average RHs were all above 55 % (Table S1). A second assumption is that most ions are in an aqueous liquid inorganic phase and only minor fractions reside dissolved in a separate liquid organic phase, if it exists. This is supported by very good agreement between observed ammonia gas–particle partitioning with thermodynamic model predictions that do not consider an organic phase. (See Figs. S3 and S4 for this study; similar results are found in other studies, e.g., Guo et al., 2015, 2017a; and Nah et al., 2018.) Pye et al. (2018) found only minor differences in the predicted ammonia partition when an organic phase was considered. It is also assumed that the particles were internally mixed and that pH did not vary with size. Mixing state of the nonvolatile cations can affect particle composition and pH (Zhu et al., 2016), but the effect on predicted fine particle pH is small if a minor fraction of nonvolatile sulfate is internally mixed with the nonvolatile cations (Guo et al., 2017b); however, it can add uncertainty to predicted nitric acid partitioning (discussed below in Sect. 2.3). Since there are no data on the mixing state and the mass concentrations (or mole fractions) of nonvolatile cations are generally small (discussed below in Sect. 3.2 and also see Table S1), internal mixing is assumed in the following analysis.
With increasing pH (e.g., above 2 for oxalate), organic acids can be found at increasing quantities in the particle phase (Nah et al., 2018). However, organic acids are not considered in the ISORROPIA-II pH calculations. In Cabauw, it has been reported that excess (i.e., not paired with , , and Cl−) was correlated with (di-)carboxylic organic acids. Excess on average constituted only 5 % of the reported by an aerosol mass spectrometer (AMS), so it is likely to have a small effect on predicted pH (Schlag et al., 2017). This is confirmed by the good agreement between measured and ISORROPIA-II-predicted NH3– partitioning without considering organic acids or other organic species (see Sect. 3.2). Although a recent modeling study has suggested that ambient NH3 concentration can be decreased by as much as 31 % in winter and 67 % in summer in the US, due to the reactive uptake of NH3 by secondary carbonyl compounds (Zhu et al., 2018), this process does not appear to have an impact on NH3– partitioning and predicted pH for the locations in this study. For the winter haze conditions in Beijing, which had the highest pH among the sampling sites, including organic acids (i.e., oxalate) in the model calculation of pH is reported to only reduce pH by at most 0.07 (Song et al., 2018).
2.3 NOx vs. NH3 control to limit PM2.5 ammonium nitrate?
Following the various assessments of NH3 control on PM2.5 mass (Erisman and Schaap, 2004; Pinder et al., 2007, 2008; Paulot and Jacob, 2014; Bauer et al., 2016; Pozzer et al., 2017), we assume the PM2.5 inorganic nitrate is mainly in the form of semivolatile ammonium nitrate and negligible in nonvolatile forms, such as Ca(NO3)2, NaNO3, and similar species, which are generally not found to a large extent in particles smaller than 1 µm. However, it is noted that in locations where concentrations of minerals or sea-salt particle components are high, and the aerosol has aged, formation of semivolatile NH4NO3 will be perturbed as the HNO3 will evolve over time to the more stable largely coarse-mode salts (e.g., CaCl2 and NaCl) at the expense of fine-mode NH4NO3 (see Guo et al., 2017a, for example).
Aerosol organic nitrate species can also contribute to aerosol mass (Farmer et al., 2010; Perring et al., 2013; Xu et al., 2015), and may respond to NOx control, but are not considered here. For the 1-year Cabauw data set analyzed here, 9 % of the aerosol nitrate was inferred to be organic nitrate, calculated from the difference in Aerosol Chemical Speciation Monitor (ACSM) nitrate and MARGA-measured nitrate (Schlag et al., 2016). Higher fractions (34 % to 44 %) have been reported for European submicron aerosols (Kiendler-Scharr et al., 2016). NOx emission controls could lead to a change in the relative importance of inorganic and organic nitrate (Edwards et al., 2017).
Focusing just on ammonium nitrate, there are two fundamental ways to control PM2.5 nitrate: (i) limit the precursors of nitrate aerosol, that is HNO3, or (ii) move the nitrate out of the aerosol by reducing the aerosol pH (increasing the particle acidity). The equilibrium aerosol nitrate concentration is given by
where is the concentration in air of semivolatile aerosol nitrate and ε() is the fraction of in the particle phase relative to gas plus particle nitrate (HNO3 + ), which is defined as total nitrate, . Equation (1) is the definition of ε(). Because ε() depends on pH, the premise of NH3 control is to reduce ε() through decreasing particle pH, whereas NOx emission controls will mainly reduce , although this can also slightly affect pH through aerosol water uptake (discussed below; see Fig. 4 for example).
NOx control. Emitted NOx can undergo a variety of reactions that produce a range of compounds (NOz), including HNO3, peroxynitric acid (HO2NO2), the nitrate radical (NO3), nitrous acid (HONO), dinitrogen pentoxide (N2O5), and both gas-phase (e.g., peroxyacetyl nitrate – PAN) and particle-phase nitrate and organic nitrate species. Once gas-phase HNO3 or particle-phase is formed, equilibrium between the phases will re-establish gas and particle concentrations. HNO3 is largely formed by NO2 reaction with the hydroxyl radical (OH) and at night through the nitrate-radical–N2O5 pathway. Modeling studies show that HNO3 can be the most significant of NOz species (Atkinson, 2000) and is correlated to NOx emissions (Shah et al., 2018). Here we assume, to a first approximation, that NOx mainly produces HNO3 (either directly through reaction with OH or indirectly through production of N2O5) that partitions to the particle to form semivolatile aerosol nitrate and rapidly reaches equilibrium. concentrations are then directly related to NOx control. Use of more detailed modeling approaches can better assess the relationship between NOx emissions and . For example, we are not considering competing chemical pathways that lead to organic nitrates versus inorganic nitrate that is in equilibrium with gas-phase HNO3.
NH3 control. The effectiveness of ammonia control in reducing NH4NO3 burdens depends on ε() and how it varies with pH, actual pH of the ambient aerosol, and the sensitivity of ambient aerosol pH to changes in NH3 concentration. From thermodynamic equilibrium, ε() can be derived from the solubility, Reaction (R1), and dissociation, Reaction (R2), of HNO3:
Assuming the solution is ideal, ε() as a function of pH can be predicted solely based on known properties of HNO3; the HNO3 Henry's constant, , and the acid dissociation constant, Kn1 ( and Kn1 are T dependent); ambient T; and particle liquid water content. The latter is often estimated by only considering water associated with inorganic species (Wi; µg m−3), determined from measured inorganic aerosol components and relative humidity. Liquid water associated with organic species can also be included but normally has a minor influence on pH of much lower hygroscopicity and the logarithmic nature of pH (Guo et al., 2015). A more accurate result may be achieved by using measured particle water concentrations.
By combining the equilibrium of Reactions (R1) and (R2),
where is a unit conversion factor (from converting atm and µg to SI units), R (J mol−1 K−1) is the gas constant and (mol2 kg−2 atm−1) is the combined molality-based equilibrium constant of HNO3 dissolution and deprotonation, and γ represents the activity coefficients (equal to 1 if assuming an ideal solution). Derivation of Eq. (2) and references for the temperature-dependent equilibrium constants, and similar equations for NH3 and HCl partitioning, can be found in the Supplement of Guo et al. (2017a).
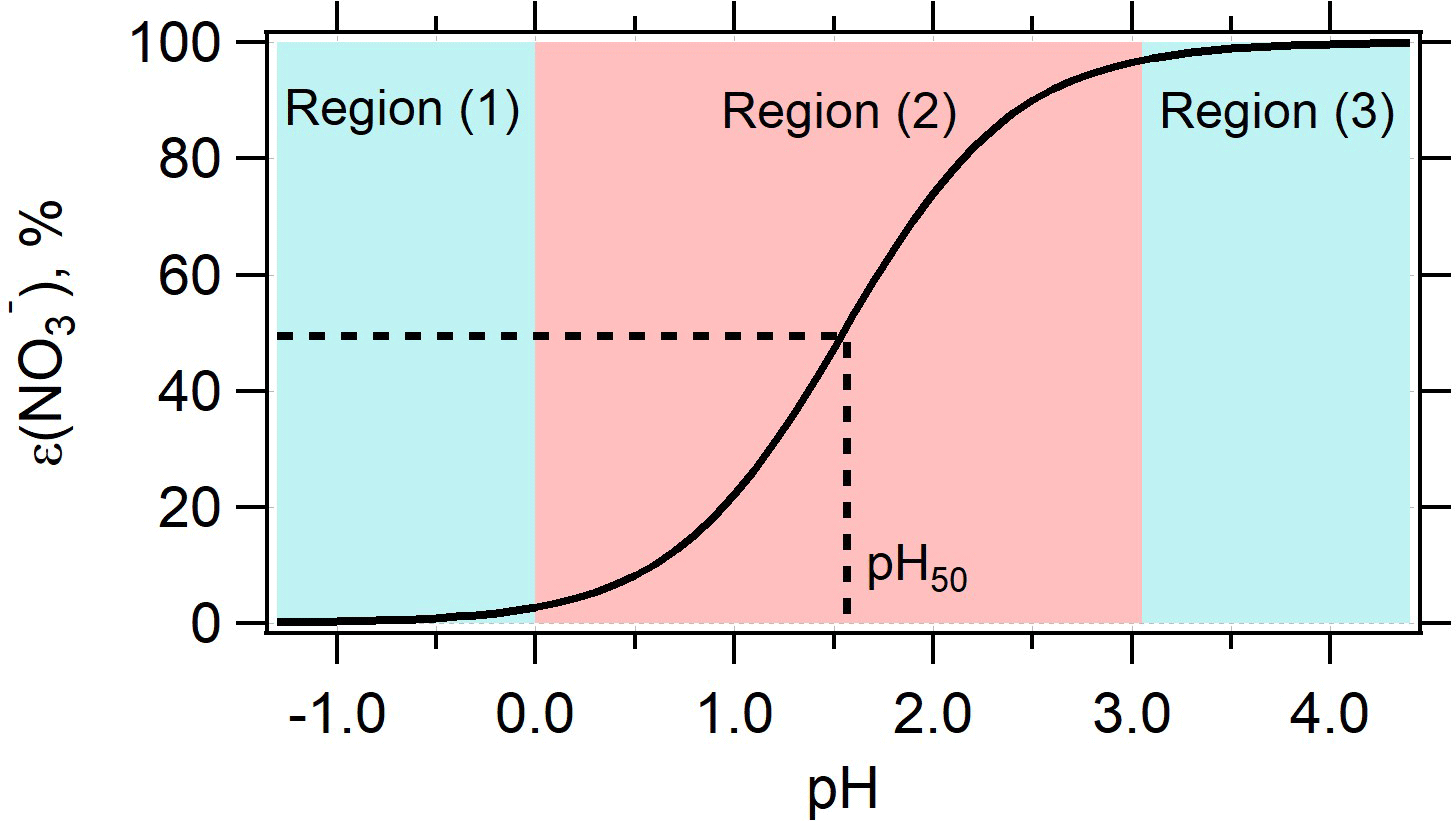
Figure 1Predicted particle-phase fraction of total nitrate, ε(), versus pH for 1-year average condition in Cabauw based on Eq. (2). The blue-color zone denotes where HNO3– (nitric acid–nitrate) partitioning is not affected by changes in pH, while the red-color zone shows the region where adjusting pH will change HNO3– partitioning and hence concentration. is most sensitive to pH at ε() = 50 %, which corresponds to a pH defined as pH50.
3.1 The nitrate partitioning S curve
The S curve given by Eq. (2) provides a conceptual basis for the effect of ammonia control, through changes in aerosol pH, on particle nitrate. Figure 1 shows the characteristic S-shaped curve of ε() plotted as a function of pH using Eq. (2), for the yearly average conditions in Cabauw and with activity coefficients extracted from ISORROPIA-II (). Including nonideality shifts the ε() S curve to lower pH by approximately 0.6 units (shown as Fig. S2).
Figure 1 shows that there are three pertinent pH regions: (1) low pH, where ε() asymptotically approaches 0 and practically all is in the gas phase; (2) ε() varies between approximately 0 and 1 and is highly sensitive to pH variations; and (3) higher pH, where ε() approaches 1 and practically all is in the particle phase. This demonstrates that for the 1-year average conditions in Cabauw, there is a certain range in ambient pH where NH3 control to alter ambient pH will result in a change in (i.e., region 2 where pH is between 0 and 3). The greatest change in to a lowering of pH occurs when ε() is near 50 % (referred to as pH50).
It follows that NH3 control will only lead to reduction in if ambient particle pH is within region 2 of Fig. 1. If pH is in region 1 there is no need for NH3 control since pH is sufficiently low that little exists, and if pH is in region 3 the sensitivity of pH to reducing NH3 will determine the effectiveness of NH3 controls. For example, NH3 first needs to be reduced to move particle pH to the transition point between region 2 and 3, where ε() starts to drop. (Note that NH3 control also affects particle mass by changing concentrations; this is discussed more below in Sect. 3.4.)
The S curve of Fig. 1 applies for a given situation (see Eq. 2), which changes as the particle composition or ambient conditions (RH, T) change. For example, if NH3 concentrations change, the inorganic particle composition changes, which affects particle water and activity coefficients in Eq. (2), resulting in a shift in the ε() curve. Thus, these curves provide only a sense of the general state of how responds to changes in NH3. A full thermodynamic model needs to be run to actually determine the new ε() when conditions change. This analysis is provided in the later part of the paper. The S curve, however, provides valuable insight on sensitivity of ε() to pH for a given situation (i.e., what region of Fig. 1).
3.2 pH predicted in Cabauw
High concentrations of aerosol inorganic species were observed during the 1 year of observations at the CESAR tower. The mass fractions of , , , and Cl− were on average 30 %, 15 %, 14 %, and 1 %, respectively, of the 9.5 µg m−3 particle mass (PM1) (Schlag et al., 2016). The gas–particle partitioning of three semivolatile pairs, NH3–, HNO3–, and HCl–Cl−, measured with MARGA are compared with the thermodynamic model predictions (see Sect. 3 in the Supplement for plots). PM2.5 and PM1 MARGA data sets produce similar results (Fig. S3 versus Fig. S4); here we mainly discuss predictions based on PM2.5. Measured and ISORROPIA-predicted partitioning of ammonia was in agreement (NH3: slope = 1.02, R2= 0.997; : slope = 0.97, R2 = 0.96) (Fig. S3). (slope = 1.01, R2= 0.987) and Cl− (slope = 0.98, R2= 0.91) were also in agreement. However, for unknown reasons, gas-phase components of these two species showed significant discrepancies (R2 of 0.13 to 0.17). We note that these discrepancies may be associated with the very low gas-phase concentrations of these species, in contrast to NH3. HNO3– and HCl–Cl− were dominated by particle phases, ε(NO ∕ % and ε(Cl−) = Cl− ∕ (Cl− + HCl) %. The opposite was found for NH3–: the gas phase dominated with ε() = ∕ NHx % (total ammonium is referred to as NHx = NH3 + ), which is consistent with particle artifacts in the gas collection system possibly affecting HNO3 and HCl, but having less effect on NH3. Furthermore, a generally better prediction of NH3– compared to HNO3– and HCl–Cl− partitioning has been observed in our previous studies (Guo et al., 2017a) and is consistent with the lack of a coarse-mode sink for NH3, in contrast to HNO3 and HCl, which can react with sodium and other nonvolatile cations and bias the equilibrium states between fine particles and gases. In summary, all the semivolatile inorganic species in the particle phase (, , and Cl−) are predicted with high accuracy, as well as NH3– partitioning; therefore, particle water and pH predictions by ISORROPIA-II are expected to be reasonable.
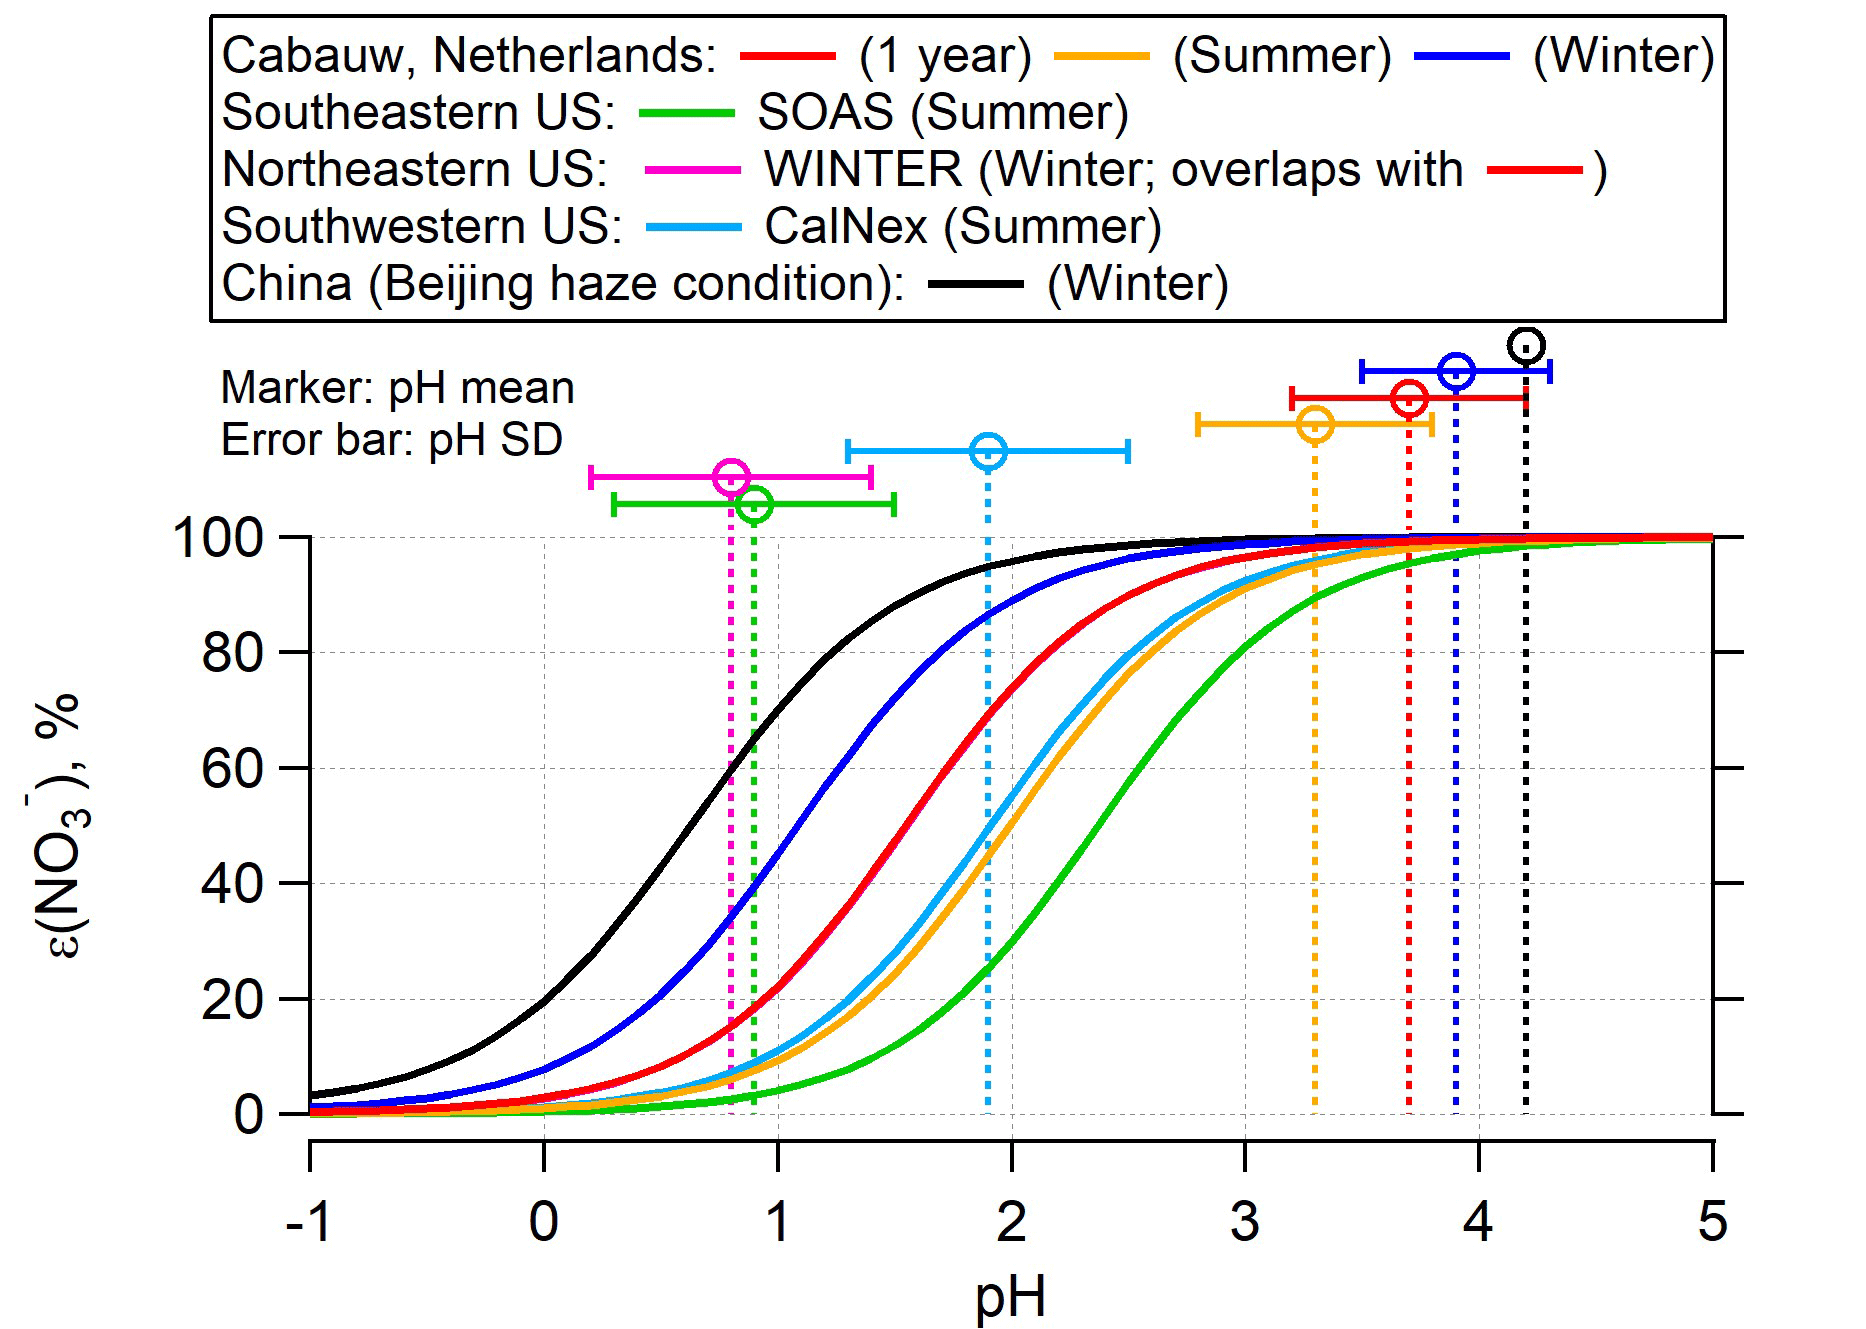
Figure 2ε() versus pH for various field studies based on the average temperature, liquid water, and activity coefficients for each study, according to Eq. (2). The WINTER study curve overlaps completely with the Cabauw 1-year average curve in red color. The input can be found in Table S1. Vertical lines are the study average ambient fine particle pH calculated with ISORROPIA-II and error bars show the variability in pH as 1 standard deviation. S curves and ambient pH for each site or season can be matched by color. For a more direct comparison between seasons at a specific region, Fig. S5 shows separate curves and ambient pH plots.
As noted above, the presence of water-soluble nonvolatile cations (which here include Na+, K+, Ca2+, and Mg2+) can affect the bulk pH analysis. In Cabauw, NVC effects can be assessed by comparing hourly PM1 and PM2.5 data, since these mechanically generated species are largely found in particles larger than 1 µm in diameter. Average NVC mole fractions (i.e., NVCs divided by the total inorganic species, not including liquid water) were consistently small: 5.7 % for PM1 and 5.9 % for PM2.5. However, Na+ was slightly higher in PM2.5 at 0.14±0.25 µg m−3, compared to 0.05±0.09 µg m−3 for PM1. The small and nearly identical fractions of NVCs result in the same predicted pH for PM1 and PM2.5; in both cases pH = 3.7±0.6. Therefore, we focus on the PM2.5 in the following discussion due to the similar partitioning predictions and pH for PM1 and PM2.5 (Fig. S3 and S4). A diurnal pattern of ambient particle pH is observed in Cabauw, similar to other studies (Guo et al., 2015). For example, for the nighttime period from 01:00 to 07:00, the average pH is 3.9, whereas for the daytime period of 13:00 to 18:00, the pH is ∼3.5. The difference is mainly driven by the diurnal variation in liquid water content (see Fig. S1).
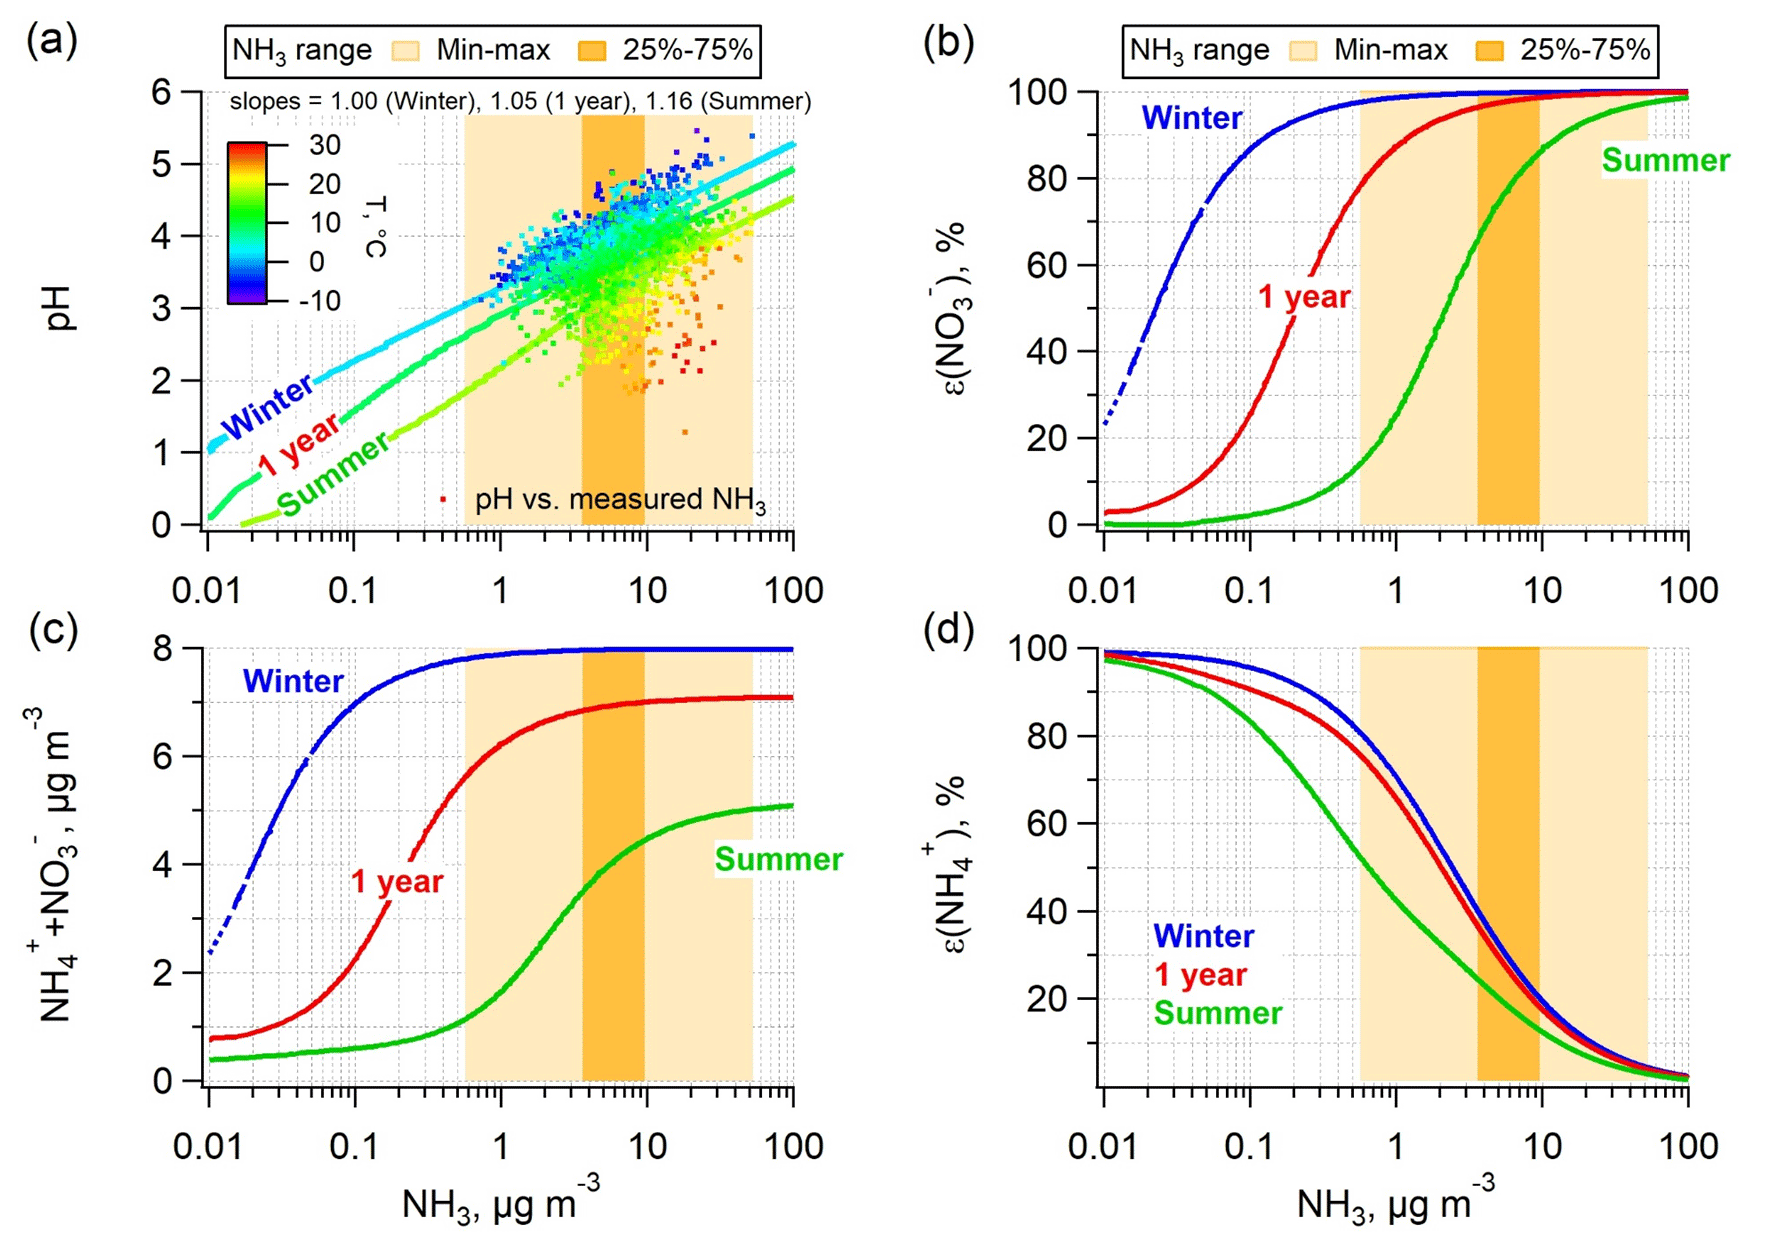
Figure 3Prediction of (a) particle pH; (b) particle-phase fractions of total nitrate, ε(); (c) ammonium and nitrate mass concentration; and (d) particle-phase fractions of total ammonium, ε(), for a wide range of ammonia. The simulations are based on the 1-year (July 2012–June 2013), summer (June–August 2012), and winter (December 2012–February 2013) average conditions at the Cabauw site with NHx ( + NH3) left as a free variable. The measured NH3 ranges for the 1-year span are also shown as the lighter (min–max) and darker (25 %–75 % percentiles) orange-color zones. Plot (a) also includes the predicted pH versus measured NH3 data for the entire study and colored by ambient temperature.
3.3 Contrasts in pH and ε () between studies
Figure 2 includes a comparison of ε() versus pH for the different locations and seasons (Fig. S5 shows separate plots for each region). The ε() curves are plotted based on the campaign average conditions (i.e., T, Wi, and ; all listed in Table S1). Two sub-data sets in Cabauw, summer (June–August 2012) and winter (December 2012–February 2013), are shown together with the 1-year whole data set. As seen for Cabauw, lower temperatures (dark blue vs. red vs. orange lines in Fig. 2) shift HNO3– partitioning to favor the particle phase due to (i) the effect of T on nitric acid Henry's law and dissociation constants and (ii) the explicit effect of T in Eq. (2). For example, at given activity coefficients and liquid water levels, a decrease from 20 (∼ summer) to 0 ∘C (∼ winter) shifts ε() to lower pH by roughly one unit. The differences between the ε() curves are also caused by variations in liquid water and to a lesser degree by variation in activity coefficients. In general, the summer curves (the right three curves) are at higher pH and the winter curves are at lower pH.
In addition to the S curves, Fig. 2 shows the average ambient particle pH predicted by ISORROPIA-II for each of the studies. Note that pH could also be inferred from the S curve and measured ε() but is more uncertain and requires activity coefficients for nonideality effects. A comparison between Eq. (2)-predicted ε() versus pH and observed ε() versus ISORROPIA-predicted pH is shown in Fig. S6 and confirms the consistency between the ISORROPIA-predicted pH and S curve given by Eq. (2). (A plot of ε() vs. pH is also shown in Fig. S6.) Fine ambient particle pH varies among the sites. The pH of 3.7±0.6 in Cabauw is higher than several other regions, such as the SE US (pH = 0.9±0.6), the NE US (0.8±1.0), and the SW US (1.9±0.5), but slightly lower than the China haze ambient particle pH of 4.2. The higher ambient particle pH is generally associated with higher concentrations of NH3 and . Particle pH is affected by coupling between many variables, hence the need for a thermodynamic model. ISORROPIA-II predicts the overall resulting equilibrium values and associated pH. Particle nitrate has a secondary effect on pH by increasing particle liquid water and diluting H+ aqueous concentrations, resulting in slightly higher pH. This effect is less pronounced when levels exceed , meaning that liquid water is mainly controlled by nonvolatile . Thus, NH3, , and particle pH are coupled. Regions of higher NH3 will have higher pH, which can lead to higher (when in region 2 of Fig. 1). The highest observed NH3 (12.8 µg m−3) and (26 µg m−3) concentrations were found for the Beijing haze condition. The Cabauw 1-year average NH3 was lower at 7.3 µg m−3, and was on average 4.7 µg m−3. The lowest NH3 and levels were observed in the US studies: for example, 1.37 µg m−3 NH3 and 3.58 µg m−3 in the SW US, and only 0.39 µg m−3 NH3 and 0.08 µg m−3 in the SE US, both in summer.
The intersection of the ε() S curves with ambient particle pH in Fig. 2 (i.e., intersection of vertical line and corresponding site S curve) provides contrast in the average ε() at each site and hence how much NH3 control will be needed to shift ε() to 50 % and a corresponding pH of pH50. The lowest ε() was found in the SE US at 22 % in summer and a higher ε() in the NE US in winter at 39 %. The Cabauw site also had higher ε() in winter (91 %) than summer (84 %). Additionally, the SW US site observed on average 54 % ε() in summer and the China haze had ∼100 % ε() in winter. These data show that, in the SE US in summer, ε() is generally so low that shifting pH by changing NH3 emissions will not greatly influence NH4NO3 concentrations since most of it is already in the gas phase. Higher NH3 can increase NH4NO3, but large changes in NH3 are needed in these regions to change pH (Weber et al., 2016). For the SW US summer, partitioning is sensitive to changes in pH with a 54 % ε(). In the Beijing winter, substantial decrease in pH is needed to evaporate NH4NO3, even more so than Cabauw in winter. For Cabauw, a substantial reduction in ambient pH would be needed to evaporate since the current pH is on the flat zone of the S curve (region 3), where ε() is near 100 %. In summer, however, a much smaller reduction in ambient particle pH would result in a decrease in .
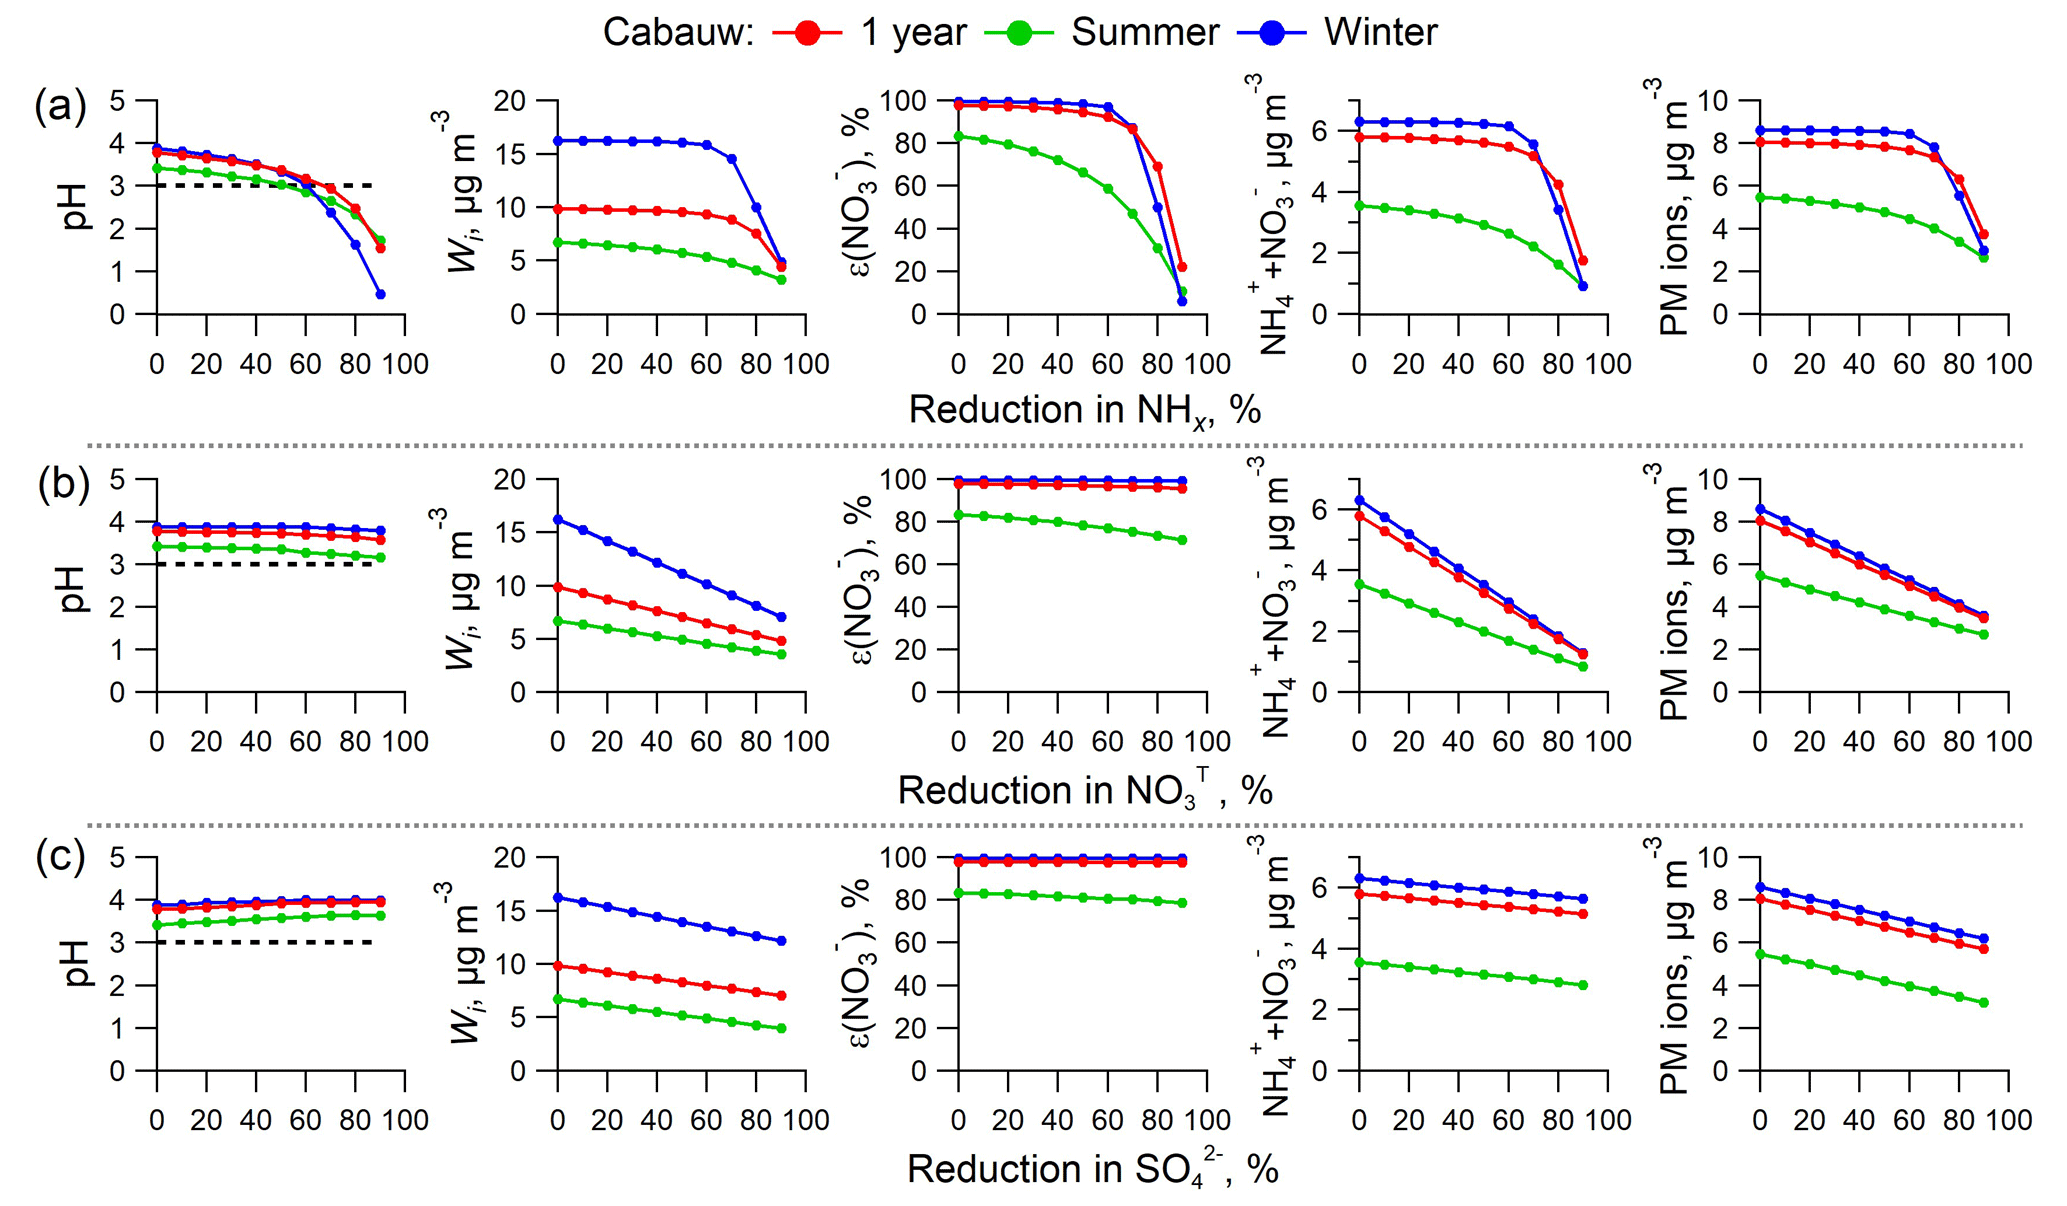
Figure 4ISORROPIA-predicted PM2.5 pH (first column), liquid water content (Wi, second column), ε() (third column), ammonium and nitrate (fourth column), and aerosol inorganic mass concentrations (fifth column) as a function of changes in NHx ( + NH3, first row), NO3T ( + HNO3, second row), and (third row). Simulations are based on average conditions of 1-year, summer, and winter observational data in Cabauw, the Netherlands, and changing only NHx, , and from the average conditions. The black dashed lines in the pH figures identify the critical pH value of 3.
3.4 Simulation of particle mass reduction with a thermodynamic model
3.4.1 Sensitivities of pH and nitrate partitioning to NH3 concentration
In the above analysis, ε() versus pH curves relative to ambient particle pH are used to provide insight on how ε() is expected to change with small changes in pH. The S curves are based on the average ambient conditions for each time period, and variables, such as particle water and activity coefficients, are held constant. But changes in NH3 concentration will vary aerosol composition, liquid water content, and the activity coefficients, which in turn modulates the S curve, Eq. (2). To address this, in the following analysis, we run ISORROPIA-II for various input NHx concentrations, while T, RH, , and are held constant, and plot various parameters of interest. This takes into account the various aerosol composition and gas-phase species concentrations through the consideration of the partitioning of all semivolatile species, including water, and how this affects thermodynamic properties, such as activity coefficients.
First, we consider the extent of NH3 control needed to reduce NH4NO3, which depends on the response of pH to changes in ambient NH3 concentration, which in turn is related to NH3 emissions (i.e., changes in NHx). In a previous study, we show that for average conditions at the various sites discussed above, a general rule is that an order of magnitude reduction in NH3 lowers pH by about one unit (Guo et al., 2017c) (ΔpH ∕ Δ(log10NH3) are listed in Table S1). At the Cabauw site, the responses in pH to changes in NH3 are similar to these other locations; the linear fitted curves for the semi-log plot in Fig. 3a give slopes of 1.00 in winter, 1.16 in summer and 1.05 for the 1-year average (all R2 > 0.99). Figure 3a also shows predicted pH versus measured NH3 based on hourly average data. How pH changes with temperature for a constant NH3 can also be seen in Fig. 3a; higher temperature leads to lower particle pH due to volatilization of semivolatile , , and particle water. The physical explanation for this is that, with higher temperature, is converted to NH3 and releases one H+ to the particle phase, whereas is converted to HNO3 and results in loss of one H+ from the particle phase. The former process dominates over the latter due to the differences in the temperature dependency of equilibrium constants (see Fig. S7) and the greater loss of from NH4NO3 and (NH4)2SO4 compared to less loss of only from NH4NO3, leading to a net increase in particle H+ and lower pH. The loss of water associated with and further reduces pH, as the H+ becomes more concentrated. The water effect is also seen in the diurnal pH trends (see Fig. S1b).
This analysis also permits assessing how ε(), the sum of and ( + ), and ε() responds to changes in NH3. Figure 3b shows that it takes a factor of 1000 change in NH3 concentration (∼3 pH units) to reduce ε() from ∼100 % to ∼0 % (i.e., from complete particle phase to complete gas phase). Also, a change temperature of ∼8 ∘C shifts ε() equivalent to roughly an order of magnitude change in NH3 concentration. (For reference, ΔT between winter and 1-year averages is 6.6 ∘C and ΔT between 1-year average and summer averages is 8.8 ∘C). Figure 3b and c again show that larger reductions in NH3 are needed in winter compared to summer to reduce . In Cabauw, only during the highest temperature periods is a NH3 control policy immediately effective.
The response of ε() to changes in NH3 is shown in Fig. 3d. The S curves are reversed compared to ε() due to opposite base and acid partitioning responses to changes in pH. Thus, lowering NH3 reduces ε(), reducing for constant , but raises ε() as the particles become more acidic, resulting in relatively more in the particle phase and less NH3 in the gas phase. This is important since although we discuss NH3 emissions, changes in particle pH also affect NH3 concentrations through changes in gas–particle partitioning (i.e., ε()), but it is NHx that is really changing through emission controls.
Finally, Fig. 3d shows that temperature has little effect on the ε() versus NH3 curves. This is because for constant Wi and activity coefficients, the ε() versus pH S curves move in the opposite direction with change in temperature than the ε() versus pH S curves; ε() shifts to a lower pH region and ε() shifts to a higher pH region with increasing temperature. This tends to bring the NH3– partitioning versus NH3 curves together and separate the HNO3– partitioning versus NH3 curves for different seasons, considering an increase in pH at lower temperature and constant NH3 shown in Fig. 3a or vice versa.
3.4.2 Effects of NH3, NOx, and SO2 emission control in Cabauw
Here we assess the relative merits of NH3, NOx, and SO2 control on various aspects of PM2.5 in Cabauw, again using the full thermodynamic model. Changes in pH, particle water (Wi), ε(), mass of plus , and overall PM2.5 ion mass are assessed when changes are made to NHx (NH3 + ), (HNO3 + ), and , representing control of NH3, NOx, and SO2 emissions, respectively. Each are reduced in steps starting from 0 % to a 90 % reduction, while holding the other model inputs constant. The results are shown in Fig. 4. The base values are the 1-year, summer, and winter average conditions and correspond to 0 % reduction in all plots.
The first row in Fig. 4 shows that all parameters respond nonlinearly to NHx reduction, remaining relatively constant until ∼70 % NHx reduction, at which point they start to rapidly decrease. This is a result of the ε() versus pH S curve of Fig. 1, where little effect is realized until pH reaches a critical value of about 3 (the horizontal dashed line in Fig. 4 pH plots). Once pH drops below this, the balance between HNO3 and is sharply shifted towards the gas phase due to the combined effects of reduced particle pH and also reduced particle water (Wi). An approximate 70 % reduction in NHx is required in Cabauw, in winter or based on the yearly average data, to achieve effective reductions in ( + ) and particle ion mass. In summer, some minor reductions in the mass concentrations occur for small NHx reductions, since pH is slightly lower in summer (3.3) compared to winter (3.9). Despite the seasonal variations in gas and particle composition, RH, and T, all three pH curves (1 year, summer, winter) appear to be similar and show a critical pH of approximately 3; NHx reduction is more effective for pH below 3 but far less effective for pH above 3, consistent with the simplified analysis above (see Fig. 1).
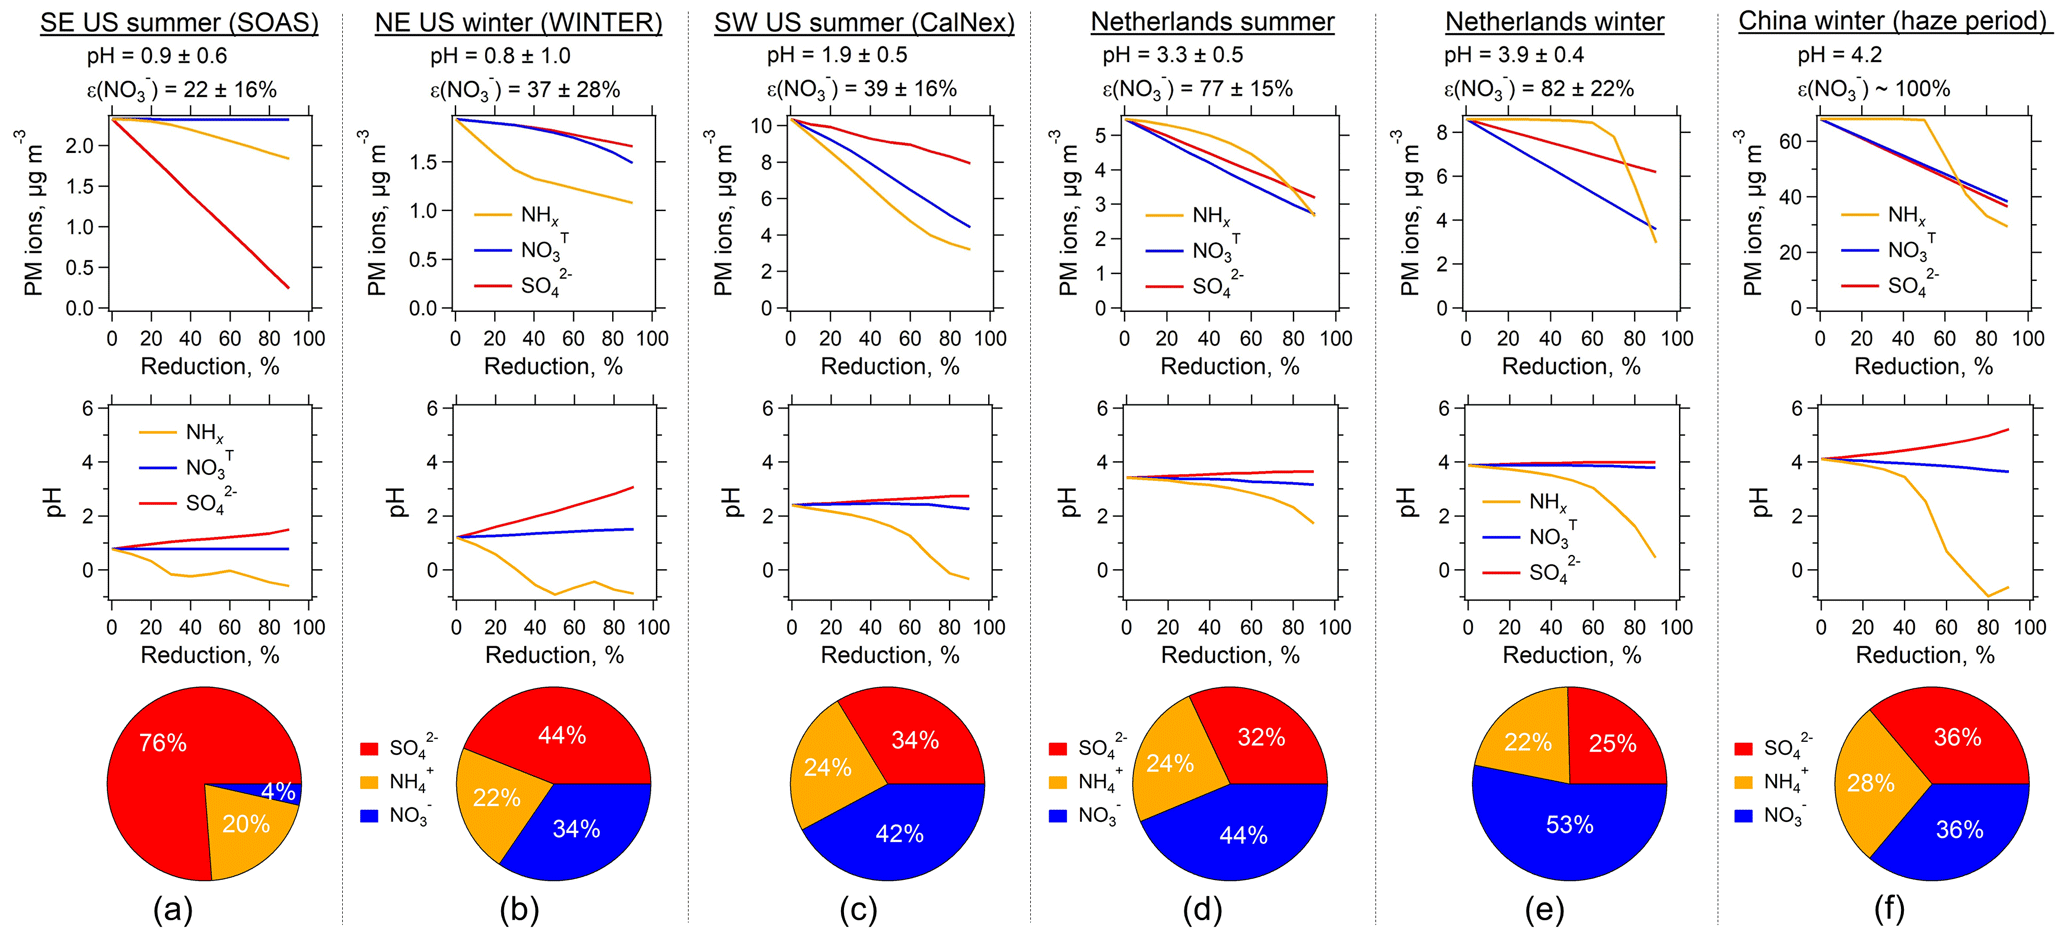
Figure 5Response of predicted PM2.5 inorganic mass concentration (first row) and pH (second row) to reduced levels of NHx (NH3 + ), (HNO3 + ), and for several studies including (a) the southeastern US summer at a rural ground site in Centreville, AL (SOAS study); (b) the northeastern US during winter (WINTER aircraft study); (c) the southwestern US summer at an urban site in Pasadena, CA (CalNex study); (d, e) the Netherlands summer and winter conditions at a rural site in Cabauw from this study; and (f) polluted winter conditions (haze) in Beijing, China. For each case, the average fine ambient particle pH and ε(), prior to the reductions, are shown above the figures, with the columns ordered with increasing ambient particle pH from left to right. PM2.5 mass fractions of –– based on study averages are shown as pie graphs along the bottom.
Effects of reducing (the second row, Fig. 4b, i.e., NOx control) and (the third row, i.e., SO2 control) show different responses. For NOx control, holding NHx and constant, a linear reduction in causes a linear decrease in Wi, ( + ), and PM2.5 ion concentrations simply because ε() remains close to 1 so that ∼ . Then a reduction is just transmitted directly to Wi ( is constant so particle hygroscopicity is controlled by ), ( + ), and PM2.5 ions. ε() is relatively constant (more so in winter) because it is ∼100 % and so not sensitive to the changes in Wi. Lower Wi does shift the HNO3– S curve towards a higher pH, but since pH is affected little, and never drops below the critical value of 3, HNO3– partitioning is barely affected by reducing (i.e., remains in region 3 in Fig. 1)
In the case of reduction, particle pH only increases slightly with substantial reduction due to buffering by NH3– partitioning (i.e., volatility) (Weber et al., 2016; Guo et al., 2017c). ( + ) decreases slightly due to the loss of associated due to both the drop in and volatilization caused by reduced particle water. Since is nonvolatile and no gas–particle partitioning is involved, the reduction results in a linear reduction in particle ionic mass, while model input of NHx and is constant.
Sensitivity tests were also performed to investigate the robustness of these results. Considering the observed decreasing trends of SO2 emissions in many regions (Hand et al., 2012; Hidy et al., 2014; Warner et al., 2017), we tested a cleaner future with less sulfate (20 % of the current level; see Fig. S8). Also, since significant changes in global climate and surface land cover can result in a dustier future with more NVCs, we investigated the effect of a 400 % increase in NVCs above the Cabauw levels (see Fig. S9). These two assumed scenarios produce a similar conclusion as the base simulation discussed above, including our finding of a critical pH of 3 and nonlinear response to a NHx reduction. However, we note that, in the reduced case (i.e., the cleaner future scenario), control had nearly no effect on particle ion mass because the concentrations were already very low.
In summary, the optimal strategy to reduce ammonium nitrate or particle total inorganic ion mass for the current conditions in Cabauw is to control (NOx emission) since it results in a linear response. Even control is superior over NHx control to reduce particle ion mass, unless over 70 % reduction in NHx could be achieved. If NHx is reduced, the effects will be greatest in warmer periods. These are also the times when NH3 emissions and concentrations are largest regionally or globally (Yamamoto et al., 1988; Warner et al., 2016, 2017; Zhang et al., 2018) (see Table S1 for Cabauw NH3 levels), and so there may be other benefits to controlling NH3 emissions at these times, for example, minimizing eutrophication in surface aqueous systems.
The above findings in Cabauw are in contrast to results of a global model, which also utilized ISORROPIA-II (Pozzer et al., 2017). They find the impacts of NH3 emissions on PM2.5 mass are strongest in winter for Europe (along with North America and Asia). Some of the differences are likely attributed to our higher predicted pH in Cabauw of ∼3.7 compared to the average pH of Europe predicted in the global model to be near 2 (Pozzer et al., 2017). Thus, we predict conditions above the critical pH of 3, and Pozzer et al. (2017) predicts pH below this value. Difference in pH may be due to meteorological conditions or the concentration of aerosol and gas inorganic species, but it does demonstrate the sensitivity of responses to what the local ambient pH is and that care should be taken to evaluate predicted particle pH against inferences from ambient measurements. Another thermodynamic model may give a different pH compared to ISORROPIA-II, which may result in a slightly different critical pH (i.e., ∼3 in this study). Next, we explore the outcomes of NHx reductions in other locations and show that NH3 emission control is more effective in winter than summer.
3.4.3 Effects of NH3, NOx, and SO2 emission control for other locations
NHx, , and reduction tests were also run for the other sampling sites following the same approach as described above for Cabauw. The model input (period averages) can be found in Table S1 and the results summarized in Fig. 5. The Cabauw simulations are included in Fig. 5 for direct comparison with the other studies, despite being also plotted in Fig. 4. The average fine particle pH and ε() in each study are listed at the top of each plot in Fig. 5 and the plots for the different studies are arranged with increasing ambient pH from left to right. This order is followed in the following discussion.
Fine particles in the eastern US (SOAS and WINTER studies, Fig. 5a and b) are the most acidic among the sites, with an average pH of approximately 1 due to the lowest NH3 (and to some minor extent due to small , through its effect on liquid water). In the NE US in winter, NHx control is most efficient in decreasing PM2.5 ion mass since the particle pH and ε() (37 %) indicate a sweet spot, where the change in NHx emission affects immediately. PM2.5 ion mass reductions from control and control are similar, since aerosol and are comparable in mass. In the SE US in summer, control is not effective because only contributed 4 % to the –– aerosols (Fig. 5a). A small fraction of nitrate aerosol is typically observed in the southeast in summer (Hidy et al., 2014) due to the high temperature and low particle pH. Because of the small fraction and already low pH in summer, NHx control only leads to minor reductions in particle ionic mass. In contrast, control produces the highest reduction of particle ionic mass since it is the dominant inorganic species (76 %) in this region. Therefore, it is more effective to control NHx in winter in the NE US and in summer in the SE US, a finding consistent with previous studies (Duyzer, 1994; Tsimpidi et al., 2007).
For the southwestern US summer (CalNex study, Fig. 5c), since was the most abundant among –– aerosol components, reducing NHx is the most effective way to reduce PM2.5 ion mass as the ambient particle pH is within the range where ε() is sensitive to pH. control follows closely in effectiveness, whereas reducing is the least effective. In the WINTER (NE US winter) and CalNex (SW US summer) studies, PM2.5 ion mass decreases at a lower rate towards higher levels in NHx reduction (see Fig. 5b and c) due to the nonlinear response in ε() to NH3 concentration (as shown in Figs. 3b or 2). For instance, when ε() drops from 50 % to 0 %, the sensitivities to NH3 keep decreasing asymptotically towards zero. The pH stays nearly flat for the control and control and decreases with the NHx control.
Cabauw winter and Beijing winter haze conditions (see Fig. 5e and f) are similar in terms of benefits in reducing particle ionic mass from NHx, , or controls. This is because of similarities in pH and ε() between these sites. For the haze condition in Beijing, NHx control does not produce as much PM2.5 ion mass reduction as and controls, unless more than a 60 % reduction in NHx is reached. However, after that PM mass reduction is fast. At 90 % NHx reduction, a decrease of more than half of the particle ionic mass is predicted. and controls produce equivalent results due to the same mass fractions of and (both equal to 36 %) and linear response in particle ionic mass. Comparing the pH profiles, the largest reduction in pH is predicted for Beijing haze if reducing NHx. At 50 % NHx reduction, pH changes from 4.1 to 2.5 in Beijing, whereas pH only changes from 3.9 to 3.3 in Cabauw. This can be explained by differences in ε(), which are at 60 % in Beijing versus 27 % in Cabauw.
3.5 Other implications of lowering pH by NH3 emission control
The benefit of reducing NH3 emission to reduce ambient PM2.5 mass concentrations depends on the conditions at a specific site. While particle pH is lowered during the process, other pH-related atmospheric processes are affected. One potentially unintended effect is nitrogen deposition. Nitrogen dry deposition rates depend on particle versus gas-phase fractions since there are large differences between gas and particle deposition velocities. For example, the dry deposition velocity of NH3 is about 1–2 cm s−1 over forest, agricultural, or mixed-use land and 10 times that of (Duyzer, 1994; Schrader and Brummer, 2014). Also, the dry deposition velocity of HNO3 is similar to that of NH3 (Huebert and Robert, 1985). Lowering particle pH through NH3 reductions will decrease overall reduced nitrogen deposition, but may result in more localized oxidized nitrogen dry deposition, if the lower pH results in evaporation and higher HNO3 concentrations. Deposition due to wet removal processes is not considered here.
An additional consequence of lowering particle pH is that it can increase aerosol toxicity. Many studies have identified links between strong particle acidity and adverse health endpoints (Koutrakis et al., 1988; Thurston et al., 1994; Raizenne et al., 1996; Gwynn et al., 2000; Lelieveld et al., 2015). We recently showed one way this can happen is due to increased conversion of PM2.5 insoluble transition metals to soluble forms by strong acidity (Fang et al., 2017), which increases the particles' ability to induce oxidative stress (Ghio et al., 2012). Lowering pH may reduce PM2.5 mass but increase the overall potential for adverse health effects due to significantly greater toxicity of soluble metals relative to ammonium nitrate. Finally, lowering pH can also impact the deposition pattern and bioavailability of trace-limiting nutrients such as Fe, P, and other metals (Meskhidze et al., 2003; Nenes et al., 2011) with important implications for primary productivity (Meskhidze et al., 2005) and even the oxygen state of the subsurface ocean (Ito et al., 2016).
In this study, we assess the effectiveness of NH3 control as a way to lower inorganic PM2.5 mass based on observational data sets from the US, the Netherlands, and China during different seasons. These sites encompass a diverse range in (i) NH3 and inorganic aerosol concentrations and (ii) thermodynamic conditions. In all cases, the relative humidities are sufficiently high (average RH > 55 %) that a completely deliquesced inorganic phase is a reasonable assumption, which is implicit to the thermodynamic calculations (metastable mode). Focusing on Cabauw, the Netherlands, a site in a region highly impacted by agricultural emissions, we show that the effectiveness of NH3 control changes with season. In winter, a much larger reduction in NH3 is required to reduce than in summer, making NOx control more effective in winter. This is explained by a shift in the HNO3– partitioning (ε()) curve to lower pH in winter and pH50 (where ε() = 50 %) further from the actual ambient particle pH. A similar situation is seen in Beijing in winter, where NH3 emission control would also be less effective. In most other sites investigated, NH3 control is effective in reducing PM2.5 mass in regions with reasonably high ammonium nitrate concentrations.
The analysis presented here provides a conceptual and direct evaluation of how the inorganic gas–particle system can be expected to respond to changes in NH3 emissions and how it contrasts to NOx control. The approach relies on the single HNO3– partitioning equation and the use of a thermodynamic model to predict pH. Other approaches are also often used to address this question. Chemical transport models with imbedded thermodynamic sub-modules (such as ISORROPIA) can provide a more detailed analysis that includes other possible impacts of the emission controls, such as ammonia and nitrate deposition and associated environmental impacts. However, the various uncertainties associated with the many simulated processes involved in these models (e.g., emissions and processing) can affect the predicted results and obscure the fundamental partitioning processes. With the more transparent and accessible approach presented here, this is less of an issue. Both approaches have benefits, but, regardless of which analysis is utilized, it is always useful to explicitly report estimated particle pH as it allows assessment of the predictions and provides contrasts between studies at specific sites.
The Cabauw MARGA data can be accessed by request to Rene Otjes (ECN). The meteorological data can be accessed at the CESAR database (http://www.cesar-database.nl/; last access: 4 February 2017). Alternatively, the model input data files can be obtained by request (rweber@eas.gatech.edu). The campaign average parameters for plotting Figs. 1–5 can be found in Table S1 in the Supplement.
The supplement related to this article is available online at: https://doi.org/10.5194/acp-18-12241-2018-supplement.
RO, PS, and ASK collected the data. HG analyzed the data. HG, AN, and RJW were involved in data interpretation and wrote the paper.
The authors declare that they have no conflict of interest.
This work was supported by the National Science Foundation (NSF) under grant
AGS-1360730 and by the US Environmental Protection Agency STAR grant R835882.
This publication's contents are solely the responsibility of the grantee and
do not necessarily represent the official views of the US EPA. Further, the
US EPA does not endorse the purchase of any commercial products or services
mentioned in the publication. Athanasios Nenes acknowledges support from the
European Research Council Project PyroTRACH (Pyrogenic TRansformations
Affecting Climate and Health) grant agreement 726165. We acknowledge Fred
Bosveld (KNMI) and the CESAR database for sharing the meteorological data.
Edited by: Qiang Zhang
Reviewed by: two anonymous referees
An, W. J., Pathak, R. K., Lee, B.-H., and Pandis, S. N.: Aerosol volatility measurement using an improved thermodenuder: Application to secondary organic aerosol, J. Aerosol Sci., 38, 305–314, https://doi.org/10.1016/j.jaerosci.2006.12.002, 2007.
Aneja, V. P., Schlesinger, W. H., and Erisman, J. W.: Effects of Agriculture upon the Air Quality and Climate: Research, Policy, and Regulations, Environ. Sci. Technol., 43, 4234–4240, https://doi.org/10.1021/es8024403, 2009.
Atkinson, R.: Atmospheric chemistry of VOCs and NOx, Atmos. Environ., 34, 2063–2101, https://doi.org/10.1016/s1352-2310(99)00460-4, 2000.
Bauer, S. E., Tsigaridis, K., and Miller, R.: Significant atmospheric aerosol pollution caused by world food cultivation, Geophys. Res. Lett., 43, 5394–5400, https://doi.org/10.1002/2016gl068354, 2016.
Behera, S. N., Sharma, M., Aneja, V. P., and Balasubramanian, R.: Ammonia in the atmosphere: a review on emission sources, atmospheric chemistry and deposition on terrestrial bodies, Environ. Sci. Pollut. Res. Int., 20, 8092–8131, https://doi.org/10.1007/s11356-013-2051-9, 2013.
Bellouin, N., Rae, J., Jones, A., Johnson, C., Haywood, J., and Boucher, O.: Aerosol forcing in the Climate Model Intercomparison Project (CMIP5) simulations by HadGEM2-ES and the role of ammonium nitrate, J. Geophys. Res., 116, D20206, https://doi.org/10.1029/2011jd016074, 2011.
Bertram, A. K., Martin, S. T., Hanna, S. J., Smith, M. L., Bodsworth, A., Chen, Q., Kuwata, M., Liu, A., You, Y., and Zorn, S. R.: Predicting the relative humidities of liquid-liquid phase separation, efflorescence, and deliquescence of mixed particles of ammonium sulfate, organic material, and water using the organic-to-sulfate mass ratio of the particle and the oxygen-to-carbon elemental ratio of the organic component, Atmos. Chem. Phys., 11, 10995–11006, https://doi.org/10.5194/acp-11-10995-2011, 2011.
Camargo, J. A. and Alonso, A.: Ecological and toxicological effects of inorganic nitrogen pollution in aquatic ecosystems: A global assessment, Environ. Int., 32, 831–849, https://doi.org/10.1016/j.envint.2006.05.002, 2006.
Cheng, Y., Zheng, G., Wei, C., Mu, Q., Zheng, B., Wang, Z., Gao, M., Zhang, Q., He, K., Carmichael, G., Poschl, U., and Su, H.: Reactive nitrogen chemistry in aerosol water as a source of sulfate during haze events in China, Sci. Adv., 2, e1601530, https://doi.org/10.1126/sciadv.1601530, 2016.
Cohen, A. J., Brauer, M., Burnett, R., Anderson, H. R., Frostad, J., Estep, K., Balakrishnan, K., Brunekreef, B., Dandona, L., Dandona, R., Feigin, V., Freedman, G., Hubbell, B., Jobling, A., Kan, H., Knibbs, L., Liu, Y., Martin, R., Morawska, L., Pope, C. A., Shin, H., Straif, K., Shaddick, G., Thomas, M., van Dingenen, R., van Donkelaar, A., Vos, T., Murray, C. J. L., and Forouzanfar, M. H.: Estimates and 25-year trends of the global burden of disease attributable to ambient air pollution: an analysis of data from the Global Burden of Diseases Study 2015, Lancet, 389, 1907–1918, https://doi.org/10.1016/s0140-6736(17)30505-6, 2017.
Cruz, C. N., Dassios, K. G., and Pandis, S. N.: The effect of dioctyl phthalate films on the ammonium nitrate aerosol evaporation rate, Atmos. Environ., 34, 3897–3905, https://doi.org/10.1016/S1352-2310(00)00173-4, 2000.
Dassios, K. G. and Pandis, S. N.: The mass accommodation coefficient of ammonium nitrate aerosol, Atmos. Environ., 33, 2993–3003, https://doi.org/10.1016/S1352-2310(99)00079-5, 1999.
Duyzer, J.: Dry deposition of ammonia and ammonium aerosols over heathland, J. Geophys. Res., 99, 18757–18763, https://doi.org/10.1029/94jd01210, 1994.
Eddingsaas, N. C., VanderVelde, D. G., and Wennberg, P. O.: Kinetics and Products of the Acid-Catalyzed Ring-Opening of Atmospherically Relevant Butyl Epoxy Alcohols, J. Phys. Chem. A, 114, 8106–8113, https://doi.org/10.1021/Jp103907c, 2010.
Edwards, P. M., Aikin, K. C., Dube, W. P., Fry, J. L., Gilman, J. B., de Gouw, J. A., Graus, M. G., Hanisco, T. F., Holloway, J., Hübler, G., Kaiser, J., Keutsch, F. N., Lerner, B. M., Neuman, J. A., Parrish, D. D., Peischl, J., Pollack, I. B., Ravishankara, A. R., Roberts, J. M., Ryerson, T. B., Trainer, M., Veres, P. R., Wolfe, G. M., Warneke, C., and Brown, S. S.: Transition from high- to low-NOx control of night-time oxidation in the southeastern US, Nat. Geosci., 10, 490–495, https://doi.org/10.1038/ngeo2976, 2017.
Erisman, J. W. and Schaap, M.: The need for ammonia abatement with respect to secondary PM reductions in Europe, Environ. Pollut., 129, 159–163, https://doi.org/10.1016/j.envpol.2003.08.042, 2004.
Erisman, J. W., Sutton, M. A., Galloway, J., Klimont, Z., and Winiwarter, W.: How a century of ammonia synthesis changed the world, Nat. Geosci., 1, 636–639, 2008.
Fang, T., Guo, H., Zeng, L., Verma, V., Nenes, A., and Weber, R. J.: Highly Acidic Ambient Particles, Soluble Metals, and Oxidative Potential: A Link between Sulfate and Aerosol Toxicity, Environ. Sci. Technol., 51, 2611–2620, https://doi.org/10.1021/acs.est.6b06151, 2017.
Farmer, D. K., Matsunaga, A., Docherty, K. S., Surratt, J. D., Seinfeld, J. H., Ziemann, P. J., and Jimenez, J. L.: Response of an aerosol mass spectrometer to organonitrates and organosulfates and implications for atmospheric chemistry, P. Natl. Acad. Sci. USA, 107, 6670–6675, https://doi.org/10.1073/pnas.0912340107, 2010.
Fountoukis, C. and Nenes, A.: ISORROPIA II: a computationally efficient thermodynamic equilibrium model for K+-Ca2+-Mg2+--Na+---Cl−-H2O aerosols, Atmos. Chem. Phys., 7, 4639–4659, https://doi.org/10.5194/acp-7-4639-2007, 2007.
Fountoukis, C., Nenes, A., Sullivan, A., Weber, R., Van Reken, T., Fischer, M., Matías, E., Moya, M., Farmer, D., and Cohen, R. C.: Thermodynamic characterization of Mexico City aerosol during MILAGRO 2006, Atmos. Chem. Phys., 9, 2141–2156, https://doi.org/10.5194/acp-9-2141-2009, 2009.
Fowler, D., Coyle, M., Skiba, U., Sutton, M. A., Cape, J. N., Reis, S., Sheppard, L. J., Jenkins, A., Grizzetti, B., Galloway, J. N., Vitousek, P., Leach, A., Bouwman, A. F., Butterbach-Bahl, K., Dentener, F., Stevenson, D., Amann, M., and Voss, M.: The global nitrogen cycle in the twenty-first century, Philos. T. R. Soc. B, 368, 20130164, https://doi.org/10.1098/rstb.2013.0164, 2013.
Fridlind, A. M. and Jacobson, M. Z.: A study of gas-aerosol equilibrium and aerosol pH in the remote marine boundary layer during the First Aerosol Characterization Experiment (ACE 1), J. Geophys. Res., 105, 17325–17340, https://doi.org/10.1029/2000jd900209, 2000.
Galloway, J. N., Aber, J. D., Erisman, J. W., Seitzinger, S. P., Howarth, R. W., Cowling, E. B., and Cosby, B. J.: The Nitrogen Cascade, BioScience, 53, 341–35, https://doi.org/10.1641/0006-3568(2003)053[0341:Tnc]2.0.Co;2, 2003.
Gerland, P., Raftery, A. E., Sevcikova, H., Li, N., Gu, D., Spoorenberg, T., Alkema, L., Fosdick, B. K., Chunn, J., Lalic, N., Bay, G., Buettner, T., Heilig, G. K., and Wilmoth, J.: World population stabilization unlikely this century, Science, 346, 234–237, https://doi.org/10.1126/science.1257469, 2014.
Ghio, A. J., Carraway, M. S., and Madden, M. C.: Composition of air pollution particles and oxidative stress in cells, tissues, and living systems, J. Toxicol. Env. Heal. B, 15, 1–21, https://doi.org/10.1080/10937404.2012.632359, 2012.
Guo, H., Xu, L., Bougiatioti, A., Cerully, K. M., Capps, S. L., Hite Jr., J. R., Carlton, A. G., Lee, S.-H., Bergin, M. H., Ng, N. L., Nenes, A., and Weber, R. J.: Fine-particle water and pH in the southeastern United States, Atmos. Chem. Phys., 15, 5211–5228, https://doi.org/10.5194/acp-15-5211-2015, 2015.
Guo, H., Sullivan, A. P., Campuzano-Jost, P., Schroder, J. C., Lopez-Hilfiker, F. D., Dibb, J. E., Jimenez, J. L., Thornton, J. A., Brown, S. S., Nenes, A., and Weber, R. J.: Fine particle pH and the partitioning of nitric acid during winter in the northeastern United States, J. Geophys. Res., 121, 10355–10376, https://doi.org/10.1002/2016jd025311, 2016.
Guo, H., Liu, J., Froyd, K. D., Roberts, J. M., Veres, P. R., Hayes, P. L., Jimenez, J. L., Nenes, A., and Weber, R. J.: Fine particle pH and gas-particle phase partitioning of inorganic species in Pasadena, California, during the 2010 CalNex campaign, Atmos. Chem. Phys., 17, 5703–5719, https://doi.org/10.5194/acp-17-5703-2017, 2017a.
Guo, H., Nenes, A., and Weber, R. J.: The underappreciated role of nonvolatile cations on aerosol ammonium-sulfate molar ratios, Atmos. Chem. Phys. Discuss., https://doi.org/10.5194/acp-2017-737, in review, 2017b.
Guo, H., Weber, R. J., and Nenes, A.: High levels of ammonia do not raise fine particle pH sufficiently to yield nitrogen oxide-dominated sulfate production, Sci. Rep., 7, 12109, https://doi.org/10.1038/s41598-017-11704-0, 2017c.
Gwynn, R. C., Burnett, R. T., and Thurston, G. D.: A time-series analysis of acidic particulate matter and daily mortality and morbidity in the Buffalo, New York, region, Environ. Health Persp., 108, 125–133, https://doi.org/10.2307/3454510, 2000.
Hand, J. L., Schichtel, B. A., Malm, W. C., and Pitchford, M. L.: Particulate sulfate ion concentration and SO2 emission trends in the United States from the early 1990s through 2010, Atmos. Chem. Phys., 12, 10353–10365, https://doi.org/10.5194/acp-12-10353-2012, 2012.
Haywood, J., and Boucher, O.: Estimates of the direct and indirect radiative forcing due to tropospheric aerosols: A review, Rev. Geophys., 38, 513–543, https://doi.org/10.1029/1999rg000078, 2000.
Hennigan, C. J., Izumi, J., Sullivan, A. P., Weber, R. J., and Nenes, A.: A critical evaluation of proxy methods used to estimate the acidity of atmospheric particles, Atmos. Chem. Phys., 15, 2775–2790, https://doi.org/10.5194/acp-15-2775-2015, 2015.
Hidy, G. M., Blanchard, C. L., Baumann, K., Edgerton, E., Tanenbaum, S., Shaw, S., Knipping, E., Tombach, I., Jansen, J., and Walters, J.: Chemical climatology of the southeastern United States, 1999–2013, Atmos. Chem. Phys., 14, 11893–11914, https://doi.org/10.5194/acp-14-11893-2014, 2014.
Huebert, B. J. and Robert, C. H.: The Dry Deposition of Nitric-Acid to Grass, J. Geophys. Res., 90, 2085–2090, https://doi.org/10.1029/JD090iD01p02085, 1985.
IPCC: Climate Change 2013: The Physical Science Basis. Contribution of Working Group I to the Fifth Assessment Report of the Intergovernmental Panel on Climate Change, Cambridge, United Kingdom and New York, NY, USA, 1535, 2013.
Ito, T., Nenes, A., Johnson, M. S., Meskhidze, N., and Deutsch, C.: Acceleration of oxygen decline in the tropical Pacific over the past decades by aerosol pollutants, Nat. Geosci., 9, 443–447, https://doi.org/10.1038/ngeo2717, 2016.
Jang, M., Czoschke, N. M., Lee, S., and Kamens, R. M.: Heterogeneous atmospheric aerosol production by acid-catalyzed particle-phase reactions, Science, 298, 814–817, https://doi.org/10.1126/science.1075798, 2002.
Kanakidou, M., Seinfeld, J. H., Pandis, S. N., Barnes, I., Dentener, F. J., Facchini, M. C., Van Dingenen, R., Ervens, B., Nenes, A., Nielsen, C. J., Swietlicki, E., Putaud, J. P., Balkanski, Y., Fuzzi, S., Horth, J., Moortgat, G. K., Winterhalter, R., Myhre, C. E. L., Tsigaridis, K., Vignati, E., Stephanou, E. G., and Wilson, J.: Organic aerosol and global climate modelling: a review, Atmos. Chem. Phys., 5, 1053–1123, https://doi.org/10.5194/acp-5-1053-2005, 2005.
Kiendler-Scharr, A., Mensah, A. A., Friese, E., et al.: Ubiquity of organic nitrates from nighttime chemistry in the European submicron aerosol, Geophys. Res. Lett., 43, 7735–7744, https://doi.org/10.1002/2016gl069239, 2016.
Koutrakis, P., Wolfson, J. M., and Spengler, J. D.: An improved method for measuring aerosol strong acidity: Results from a nine-month study in St Louis, Missouri and Kingston, Tennessee, Atmos. Environ., 22, 157–162, https://doi.org/10.1016/0004-6981(88)90308-3, 1988.
Krupa, S. V.: Effects of atmospheric ammonia (NH3) on terrestrial vegetation: a review, Environ. Pollut., 124, 179–221, https://doi.org/10.1016/s0269-7491(02)00434-7, 2003.
Lelieveld, J., Evans, J. S., Fnais, M., Giannadaki, D., and Pozzer, A.: The contribution of outdoor air pollution sources to premature mortality on a global scale, Nature, 525, 367–371, https://doi.org/10.1038/nature15371, 2015.
Lim, S. S., Vos, T., Flaxman, A. D., et al.: A comparative risk assessment of burden of disease and injury attributable to 67 risk factors and risk factor clusters in 21 regions, 1990–2010: a systematic analysis for the Global Burden of Disease Study 2010, Lancet, 380, 2224–2260, https://doi.org/10.1016/S0140-6736(12)61766-8, 2012.
Lolkema, D. E., Noordijk, H., Stolk, A. P., Hoogerbrugge, R., van Zanten, M. C., and van Pul, W. A. J.: The Measuring Ammonia in Nature (MAN) network in the Netherlands, Biogeosciences, 12, 5133–5142, https://doi.org/10.5194/bg-12-5133-2015, 2015.
Longo, A. F., Feng, Y., Lai, B., Landing, W. M., Shelley, R. U., Nenes, A., Mihalopoulos, N., Violaki, K., and Ingall, E. D.: Influence of Atmospheric Processes on the Solubility and Composition of Iron in Saharan Dust, Environ. Sci. Technol., 50, 6912–6920, https://doi.org/10.1021/acs.est.6b02605, 2016.
Meskhidze, N., Chameides, W. L., Nenes, A., and Chen, G.: Iron mobilization in mineral dust: Can anthropogenic SO2 emissions affect ocean productivity?, Geophys. Res. Lett., 30, 2085, https://doi.org/10.1029/2003gl018035, 2003.
Meskhidze, N., Chameides, W. L., and Nenes, A.: Dust and pollution: A recipe for enhanced ocean fertilization?, J. Geophys. Res., 110, D03301, https://doi.org/10.1029/2004jd005082, 2005.
Nah, T., Guo, H., Sullivan, A. P., Chen, Y., Tanner, D. J., Nenes, A., Russell, A., Ng, N. L., Huey, L. G., and Weber, R. J.: Characterization of Aerosol Composition, Aerosol Acidity and Organic Acid Partitioning at an Agriculture-Intensive Rural Southeastern U.S. Site, Atmos. Chem. Phys. Discuss., https://doi.org/10.5194/acp-2018-373, in review, 2018.
Nenes, A., Krom, M. D., Mihalopoulos, N., Van Cappellen, P., Shi, Z., Bougiatioti, A., Zarmpas, P., and Herut, B.: Atmospheric acidification of mineral aerosols: a source of bioavailable phosphorus for the oceans, Atmos. Chem. Phys., 11, 6265–6272, https://doi.org/10.5194/acp-11-6265-2011, 2011.
Paulot, F. and Jacob, D. J.: Hidden cost of U.S. agricultural exports: particulate matter from ammonia emissions, Environ. Sci. Technol., 48, 903–908, https://doi.org/10.1021/es4034793, 2014.
Paulot, F., Fan, S., and Horowitz, L. W.: Contrasting seasonal responses of sulfate aerosols to declining SO2 emissions in the Eastern U.S.: Implications for the efficacy of SO2 emission controls, Geophys. Res. Lett., 44, 455–464, https://doi.org/10.1002/2016gl070695, 2017.
Perring, A. E., Pusede, S. E., and Cohen, R. C.: An observational perspective on the atmospheric impacts of alkyl and multifunctional nitrates on ozone and secondary organic aerosol, Chem. Rev., 113, 5848–5870, https://doi.org/10.1021/cr300520x, 2013.
Perrino, C., Catrambone, M., Di Menno Di Bucchianico, A., and Allegrini, I.: Gaseous ammonia in the urban area of Rome, Italy and its relationship with traffic emissions, Atmos. Environ., 36, 5385–5394, https://doi.org/10.1016/s1352-2310(02)00469-7, 2002.
Pinder, R. W., Adams, P. J., and Pandis, S. N.: Ammonia Emission Controls as a Cost-Effective Strategy for Reducing Atmospheric Particulate Matter in the Eastern United States, Environ. Sci. Technol., 41, 380–386, https://doi.org/10.1021/es060379a, 2007.
Pinder, R. W., Gilliland, A. B., and Dennis, R. L.: Environmental impact of atmospheric NH3 emissions under present and future conditions in the eastern United States, Geophys. Res. Lett., 35, L12808, https://doi.org/10.1029/2008gl033732, 2008.
Pope, C. A., III, Burnett, R. T., Thurston, G. D., Thun, M. J., Calle, E. E., Krewski, D., and Godleski, J. J.: Cardiovascular mortality and long-term exposure to particulate air pollution: epidemiological evidence of general pathophysiological pathways of disease, Circulation, 109, 71–77, https://doi.org/10.1161/01.CIR.0000108927.80044.7F, 2004.
Pozzer, A., Tsimpidi, A. P., Karydis, V. A., de Meij, A., and Lelieveld, J.: Impact of agricultural emission reductions on fine-particulate matter and public health, Atmos. Chem. Phys., 17, 12813–12826, https://doi.org/10.5194/acp-17-12813-2017, 2017.
Pye, H. O. T., Zuend, A., Fry, J. L., Isaacman-VanWertz, G., Capps, S. L., Appel, K. W., Foroutan, H., Xu, L., Ng, N. L., and Goldstein, A. H.: Coupling of organic and inorganic aerosol systems and the effect on gas-particle partitioning in the southeastern US, Atmos. Chem. Phys., 18, 357–370, https://doi.org/10.5194/acp-18-357-2018, 2018.
Raizenne, M., Neas, L. M., Damokosh, A. I., Dockery, D. W., Spengler, J. D., Koutrakis, P., Ware, J. H., and Speizer, F. E.: Health effects of acid aerosols on North American children: pulmonary function, Environ. Health Persp., 104, 506–514, https://doi.org/10.2307/3432991, 1996.
Rumsey, I. C., Cowen, K. A., Walker, J. T., Kelly, T. J., Hanft, E. A., Mishoe, K., Rogers, C., Proost, R., Beachley, G. M., Lear, G., Frelink, T., and Otjes, R. P.: An assessment of the performance of the Monitor for AeRosols and GAses in ambient air (MARGA): a semi-continuous method for soluble compounds, Atmos. Chem. Phys., 14, 5639–5658, https://doi.org/10.5194/acp-14-5639-2014, 2014.
Russell, A. R., Valin, L. C., and Cohen, R. C.: Trends in OMI NO2 observations over the United States: effects of emission control technology and the economic recession, Atmos. Chem. Phys., 12, 12197–12209, https://doi.org/10.5194/acp-12-12197-2012, 2012.
Sardar, S. B., Fine, P. M., and Sioutas, C.: Seasonal and spatial variability of the size-resolved chemical composition of particulate matter (PM10) in the Los Angeles Basin, J. Geophys. Res., 110, D07S08, https://doi.org/10.1029/2004jd004627, 2005.
Schaap, M., Otjes, R. P., and Weijers, E. P.: Illustrating the benefit of using hourly monitoring data on secondary inorganic aerosol and its precursors for model evaluation, Atmos. Chem. Phys., 11, 11041–11053, https://doi.org/10.5194/acp-11-11041-2011, 2011.
Schlag, P., Kiendler-Scharr, A., Blom, M. J., Canonaco, F., Henzing, J. S., Moerman, M., Prévôt, A. S. H., and Holzinger, R.: Aerosol source apportionment from 1-year measurements at the CESAR tower in Cabauw, the Netherlands, Atmos. Chem. Phys., 16, 8831–8847, https://doi.org/10.5194/acp-16-8831-2016, 2016.
Schlag, P., Rubach, F., Mentel, T. F., Reimer, D., Canonaco, F., Henzing, J. S., Moerman, M., Otjes, R., Prevot, A. S. H., Rohrer, F., Rosati, B., Tillmann, R., Weingartner, E., and Kiendler-Scharr, A.: Ambient and laboratory observations of organic ammonium salts in PM1, Faraday Discuss., 200, 331–351, https://doi.org/10.1039/c7fd00027h, 2017.
Schrader, F. and Brummer, C.: Land Use Specific Ammonia Deposition Velocities: a Review of Recent Studies (2004-2013), Water Air Soil Pollut., 225, 2114, https://doi.org/10.1007/s11270-014-2114-7, 2014.
Shah, V., Jaeglé, L., Thornton, J. A., Lopez-Hilfiker, F. D., Lee, B. H., Schroder, J. C., Campuzano-Jost, P., Jimenez, J. L., Guo, H., Sullivan, A. P., Weber, R. J., Green, J. R., Fiddler, M. N., Bililign, S., Campos, T. L., Stell, M., Weinheimer, A. J., Montzka, D. D., and Brown, S. S.: Chemical feedbacks weaken the wintertime response of particulate sulfate and nitrate to emissions reductions over the eastern United States, P. Natl. Acad. Sci. USA, https://doi.org/10.1073/pnas.1803295115, 2018.
Skjøth, C. A. and Geels, C.: The effect of climate and climate change on ammonia emissions in Europe, Atmos. Chem. Phys., 13, 117–128, https://doi.org/10.5194/acp-13-117-2013, 2013.
Song, S., Gao, M., Xu, W., Shao, J., Shi, G., Wang, S., Wang, Y., Sun, Y., and McElroy, M. B.: Fine-particle pH for Beijing winter haze as inferred from different thermodynamic equilibrium models, Atmos. Chem. Phys., 18, 7423–7438, https://doi.org/10.5194/acp-18-7423-2018, 2018.
Stockdale, A., Krom, M. D., Mortimer, R. J., Benning, L. G., Carslaw, K. S., Herbert, R. J., Shi, Z., Myriokefalitakis, S., Kanakidou, M., and Nenes, A.: Understanding the nature of atmospheric acid processing of mineral dusts in supplying bioavailable phosphorus to the oceans, P. Natl. Acad. Sci. USA, 113, 14639–14644, https://doi.org/10.1073/pnas.1608136113, 2016.
Surratt, J. D., Chan, A. W., Eddingsaas, N. C., Chan, M., Loza, C. L., Kwan, A. J., Hersey, S. P., Flagan, R. C., Wennberg, P. O., and Seinfeld, J. H.: Reactive intermediates revealed in secondary organic aerosol formation from isoprene, P. Natl. Acad. Sci. USA, 107, 6640–6645, https://doi.org/10.1073/pnas.0911114107, 2010.
Thurston, G. D., Ito, K., Hayes, C. G., Bates, D. V., and Lippmann, M.: Respiratory hospital admissions and summertime haze air pollution in Toronto, Ontario: consideration of the role of acid aerosols, Environ. Res., 65, 271–290, https://doi.org/10.1006/enrs.1994.1037, 1994.
Tsimpidi, A. P., Karydis, V. A., and Pandis, S. N.: Response of Inorganic Fine Particulate Matter to Emission Changes of Sulfur Dioxide and Ammonia: The Eastern United States as a Case Study, J. Air Waste Ma., 57, 1489–1498, https://doi.org/10.3155/1047-3289.57.12.1489, 2007.
Vasilakos, P., Russell, A., Weber, R., and Nenes, A.: Understanding nitrate formation in a world with less sulfate, Atmos. Chem. Phys. Discuss., https://doi.org/10.5194/acp-2018-406, in review, 2018.
Wang, G., Zhang, R., Gomez, M. E., et al.: Persistent sulfate formation from London Fog to Chinese haze, P. Natl. Acad. Sci. USA, 113, 13630–13635, https://doi.org/10.1073/pnas.1616540113, 2016.
Wang, S., Xing, J., Jang, C., Zhu, Y., Fu, J. S., and Hao, J.: Impact assessment of ammonia emissions on inorganic aerosols in East China using response surface modeling technique, Environ. Sci. Technol., 45, 9293–9300, https://doi.org/10.1021/es2022347, 2011.
Warner, J. X., Wei, Z., Strow, L. L., Dickerson, R. R., and Nowak, J. B.: The global tropospheric ammonia distribution as seen in the 13-year AIRS measurement record, Atmos. Chem. Phys., 16, 5467–5479, https://doi.org/10.5194/acp-16-5467-2016, 2016.
Warner, J. X., Dickerson, R. R., Wei, Z., Strow, L. L., Wang, Y., and Liang, Q.: Increased atmospheric ammonia over the world's major agricultural areas detected from space, Geophys. Res. Lett., 44, 2875–2884, https://doi.org/10.1002/2016gl072305, 2017.
Weber, R. J., Guo, H., Russell, A. G., and Nenes, A.: High aerosol acidity despite declining atmospheric sulfate concentrations over the past 15 years, Nat. Geosci., 9, 282–285, https://doi.org/10.1038/ngeo2665, 2016.
Wells, M., Choularton, T. W., and Bower, K. N.: A modelling study of the interaction of ammonia with cloud, Atmos. Environ., 32, 359–363, https://doi.org/10.1016/s1352-2310(97)00199-4, 1998.
Xu, L., Suresh, S., Guo, H., Weber, R. J., and Ng, N. L.: Aerosol characterization over the southeastern United States using high-resolution aerosol mass spectrometry: spatial and seasonal variation of aerosol composition and sources with a focus on organic nitrates, Atmos. Chem. Phys., 15, 7307–7336, https://doi.org/10.5194/acp-15-7307-2015, 2015.
Yamamoto, N., Kabeya, N., Onodera, M., Takahahi, S., Komori, Y., Nakazuka, E., and Shirai, T.: Seasonal variation of atmospheric ammonia and particulate ammonium concentrations in the urban atmosphere of yokohama over a 5-year period, Atmos. Environ., 22, 2621–2623, https://doi.org/10.1016/0004-6981(88)90498-2, 1988.
Young, A. H., Keene, W. C., Pszenny, A. A. P., Sander, R., Thornton, J. A., Riedel, T. P., and Maben, J. R.: Phase partitioning of soluble trace gases with size-resolved aerosols in near-surface continental air over northern Colorado, USA, during winter, J. Geophys. Res., 118, 9414–9427, https://doi.org/10.1002/jgrd.50655, 2013.
Zhang, L., Chen, Y., Zhao, Y., Henze, D. K., Zhu, L., Song, Y., Paulot, F., Liu, X., Pan, Y., Lin, Y., and Huang, B.: Agricultural ammonia emissions in China: reconciling bottom-up and top-down estimates, Atmos. Chem. Phys., 18, 339–355, https://doi.org/10.5194/acp-18-339-2018, 2018.
Zhang, Q., Jimenez, J. L., Canagaratna, M. R., et al.: Ubiquity and dominance of oxygenated species in organic aerosols in anthropogenically-influenced Northern Hemisphere midlatitudes, Geophys. Res. Lett., 34, L13801, https://doi.org/10.1029/2007gl029979, 2007.
Zhu, S., Sartelet, K., Zhang, Y., and Nenes, A.: Three-dimensional modeling of the mixing state of particles over Greater Paris, J. Geophys. Res., 121, 5930–5947, https://doi.org/10.1002/2015jd024241, 2016.
Zhu, S., Horne, J. R., Montoya-Aguilera, J., Hinks, M. L., Nizkorodov, S. A., and Dabdub, D.: Modeling reactive ammonia uptake by secondary organic aerosol in CMAQ: application to the continental US, Atmos. Chem. Phys., 18, 3641–3657, https://doi.org/10.5194/acp-18-3641-2018, 2018.