the Creative Commons Attribution 4.0 License.
the Creative Commons Attribution 4.0 License.
 | 22 Aug 2018
Measurement and modeling of the multiwavelength optical properties of uncoated flame-generated soot
Sara D. Forestieri
Taylor M. Helgestad
Andrew T. Lambe
Lindsay Renbaum-Wolff
Daniel A. Lack
Paola Massoli
Eben S. Cross
Manvendra K. Dubey
Claudio Mazzoleni
Jason S. Olfert
Arthur J. Sedlacek III
Andrew Freedman
Paul Davidovits
Timothy B. Onasch
Optical properties of flame-generated black carbon (BC) containing soot particles were quantified at multiple wavelengths for particles produced using two different flames: a methane diffusion flame and an ethylene premixed flame. Measurements were made for (i) nascent soot particles, (ii) thermally denuded nascent particles, and (iii) particles that were coated and then thermally denuded, leading to the collapse of the initially lacy, fractal-like morphology. The measured mass absorption coefficients (MACs) depended on soot maturity and generation but were similar between flames for similar conditions. For mature soot, here corresponding to particles with volume-equivalent diameters nm, the MAC and absorption Ångström exponent (AAE) values were independent of particle collapse while the single-scatter albedo increased. The MAC values for these larger particles were also size-independent. The mean MAC value at 532 nm for larger particles was 9.1±1.1 m2 g−1, about 17 % higher than that recommended by Bond and Bergstrom (2006), and the AAE was close to unity. Effective, theory-specific complex refractive index (RI) values are derived from the observations with two widely used methods: Lorenz–Mie theory and the Rayleigh–Debye–Gans (RDG) approximation. Mie theory systematically underpredicts the observed absorption cross sections at all wavelengths for larger particles (with x>0.9) independent of the complex RI used, while RDG provides good agreement. (The dimensionless size parameter , where dp is particle diameter and λ is wavelength.) Importantly, this implies that the use of Mie theory within air quality and climate models, as is common, likely leads to underpredictions in the absorption by BC, with the extent of underprediction depending on the assumed BC size distribution and complex RI used. We suggest that it is more appropriate to assume a constant, size-independent (but wavelength-specific) MAC to represent absorption by uncoated BC particles within models.
- Article
(5127 KB) - Full-text XML
-
Supplement
(3730 KB) - BibTeX
- EndNote


Soot particles, which contain light-absorbing black carbon (BC), are a byproduct of the incomplete combustion of fossil fuels and biomass. These particles affect climate directly by absorbing and scattering solar radiation (Bond et al., 2013) and indirectly by acting as cloud condensation nuclei, especially following chemical processing (Lohmann and Feichter, 2005). Soot particles absorb shortwave radiation and have an overall warming effect on climate. The exact magnitude of the climate impacts of BC remains uncertain. One estimate puts top-of-the-atmosphere direct forcing by BC as high as 0.9 W m−2, which is comparable in magnitude to that of CO2 (Ramanathan and Carmichael, 2008). Other more recent assessments yield 0.71 W m−2 with 90 % uncertainty bounds of 0.08 to 1.27 W m−2 (Bond et al., 2013) or 0.61 [+0.16 to +1.40] W m−2 (Wang et al., 2016), while the IPCC suggests a value of 0.40 [+0.05 to +0.80] W m−2 (Boucher et al., 2013).
One challenge in modeling the optical properties of soot, and of the BC component in particular, derives from BC having a complex, fractal-like structure, being an agglomerate of small “spherules” (Medalia and Heckman, 1969). One theory that is commonly used in climate models to calculate BC optical properties is Lorenz–Mie theory (hereafter, Mie theory), which makes the physically unrealistic assumption that soot particles are spherical (Bohren and Huffman, 1983). This theory is widely used in climate models (Bond et al., 2013), in part because it does not require any details about the number of spherules or the arrangement of the spherules within the agglomerate but also because it is compatible with calculations for other spherical aerosol types. A variation on Mie theory, the Rayleigh–Debye–Gans (RDG) approximation, is also often used to model the optical properties of BC (Sorensen, 2001), albeit not by climate models. In RDG, the agglomerate absorption cross section (σabs) is the product of σabs for individual spherules and the number of spherules in the agglomerate. As such, RDG neglects spherule-to-spherule interactions, and the mass absorption coefficient (MAC) of an individual spherule is equal to that of the overall particle. (The MAC is the absorption cross section normalized by the particle mass.) There are more complex methods for calculating soot particle optical properties, including the T-matrix method (Mackowski and Mishchenko, 1996) and the discrete dipole approximation (DDA) (Purcell and Pennypacker, 1973), which account for interactions between spherules. Given that these more advanced methods require detailed information on the shape of the soot particles and are computationally intensive, they are not practical for climate models. The derived effective refractive indices used as inputs for these models are theory-specific, and it is necessary to have experimentally constrained effective refractive indices for both RDG and Mie theory if they are to be employed in climate models. For example, Bond et al. (2006) suggested that BC can be described using an MAC = 7.5 m2 g−1 at 550 nm and a complex refractive index (RI) . However, as they show, the maximum MAC calculated from Mie theory using this refractive index is only 7.2 m2 g−1 over a very narrow range of particle sizes and is much smaller in general, with a value of 4.9 m2 g−1 in the small particle limit, where RDG applies (assuming ρ=1.8 g cm−3). In other words, there can be an inconsistency between the often used MAC and complex RI. This illustrates the need for theory-specific effective refractive index values and a more thorough exploration of the robustness of commonly used optical models.
Our work investigates the ability of two optical models, Mie theory and the RDG approximation, to reproduce observed soot optical properties for particles composed primarily of BC. The observations include light absorption and extinction coefficients of soot particles produced from methane diffusion and ethylene premixed flames, measured over four different studies at multiple wavelengths. The impact of shape on soot particle optical properties is also examined. The soot particles sampled during these studies serve as a proxy for different types of soot particles in the ambient atmosphere. Recommended theory-specific complex RI values for BC-dominated soot particles are provided. However, we ultimately suggest that atmospheric models should consider adopting observationally constrained, wavelength-specific constant MAC values for BC rather than calculating the optical properties from optical theories.
The measurements reported here were made during a series of laboratory intensive studies that took place at Boston College (BC2, BC3, and BC4) in 2008, 2012, and 2015 and Aerodyne Research (BC3+) in 2014. Below, we provide details of soot particle generation and the measurements made. An experimental schematic is provided in Fig. S1 (in the Supplement).
2.1 Soot particle generation
Soot particles were produced using two different flame sources and fuel types. During the BC3, BC3+, and BC4 studies, most experiments were conducted using particles produced from an inverted co-flow diffusion flame operating on methane with a sheath flow mixture of O2 and N2 (Stipe et al., 2005) with a net fuel equivalence ratio ; because the diffusion flame entrains sheath oxygen into the methane-rich center flow, a range of φ values are accessed, including regions where the local φ may be greater than 1. These are referred to as the “methane diffusion flame” experiments and have been combined into a single dataset since the sampling and generation were similar in all.
During BC2 and for a small number of experiments during BC3+, particles were produced using a McKenna flat-flame burner from the combustion of premixed C2H4 (ethylene), O2 and N2 with . These are referred to as the “ethylene premixed flame” experiments. Particles were sampled at a nominal height of 5 cm above the burner during BC3+ but at a nominal height of 20 cm above the burner during BC2 (Cross et al., 2010). As such, the results from the two ethylene premixed flame have been kept separate because particles were sampled from the flame differently in the two studies.
The soot particles produced from these two flames exhibited different properties. For example, the organic (OC) mass fraction of the nascent (i.e., freshly emitted and unprocessed) ethylene premixed flame soot particles in BC2 was ∼0.26 (Cross et al., 2010), whereas the OC fraction of nascent methane diffusion flame particles was <0.01. Consequently, upon heating to >200 ∘C, the per-particle mass of the ethylene premixed flame soot particles decreased while the methane diffusion flame soot particles were unaffected.
The sampling and/or burner conditions were modified during these studies to generate monodisperse soot particles with a volume-equivalent diameter (dp,VED) less than 160 nm. The dp,VED is the diameter calculated from the per-particle mass assuming that particles have spherical morphology and the material density of the particles is 1.8 g cm−3 (Bond and Bergstrom, 2006; Wu et al., 1997; Mullins and Williams, 1987):
where mp is the per-particle mass. For the ethylene premixed flame, sampling closer to the burner surface selected for smaller soot particles; sampling on the centerline over the burner surface vs. off-center may also affect the selected soot particle sizes. For the methane diffusion flame, increasing the fuel dilution (N2) fraction generated smaller soot particles (Stipe et al., 2005). These variations in sampling and/or burner conditions likely led to some changes in the particle optical and chemical properties (López-Yglesias et al., 2014). Thus, some of the size-dependent changes observed in particles smaller than dp,VED ∼160 nm, discussed below, are likely a result of real changes in the particle properties. The extreme case is in the comparison between the soot particles sampled at 5.1 cm (BC3+) and 20.3 cm (BC2) above the ethylene premixed flame burner surface.
2.2 Particle processing
The soot particles were subjected to various kinds of physical and chemical processing and were selected according to their mobility diameter after processing but prior to sampling for optical and chemical property measurements. Particles size-selected with no processing are termed nascent soot particles. For some experiments, nascent particles were passed through a thermal denuder in which they were heated to 270 ∘C for ∼5 s. Such particles are termed nascent–denuded soot particles. (A summary of terminology is provided in Table S1.) For other experiments, nascent particles were first coated and then thermo-denuded. Coating materials included either dioctyl sebacate (DOS, CxHyOx; BC2, BC3, and BC3+), sulfuric acid (H2SO4; all studies), or secondary organic aerosol from α-pinene photooxidation (SOA; BC4). These particles are referred to as coated–denuded. Literature results indicate that the thermo-denuding of particles coated with or composed of these materials leads to essentially complete evaporation of the non-refractory material (Cappa and Wilson, 2011; Huffman et al., 2008), confirmed by measurements from BC2 (Cross et al., 2010).
For DOS coatings, the nascent particles were first size-selected, the monodisperse nascent particles were coated, and the coated particles were subsequently denuded. This is referred to as a forward-coating experiment. For either H2SO4 or SOA coatings, polydisperse nascent soot particles were first coated, then size-selected, and finally denuded. This is referred to as a reverse-coating experiment. This difference in methodology decreased the extent of homogenous nucleation of pure H2SO4 and SOA particles by providing additional soot surface area to act as a condensation sink, and any nucleated particles were further excluded during the size selection. However, the reverse method led to broader size and mass distributions in the denuded soot cores. The typical geometric standard deviation of the per-particle mass distributions for forward-coating experiments was 1.3, while for reverse-coating experiments it ranged from around 1.3 to 2.
For BC2, BC3, and BC3+, soot particles were coated in a heated section of tubing containing either DOS or H2SO4, which cooled and condensed onto soot particles after exiting the heated section of tubing. For BC4 experiments, soot particles were coated with α-pinene SOA and H2SO4 that were generated in a potential aerosol mass (PAM) oxidation flow reactor (Lambe et al., 2011). In the PAM reactor, O3 was photolyzed by UV lamps at λ= 254 nm to produce O(1D) radicals, which then reacted with water (RH = 25 %–30 %) to produce OH radicals. Low-volatility products were formed via the reaction between OH and α-pinene, which condensed onto the soot particles. Similarly, H2SO4 was formed through the reaction of SO2 and OH radicals.
Particles were size-selected according to their mobility diameter (dm) using a differential mobility analyzer (DMA; TSI model 3080) with a sheath-to-sample flow ratio of 5 : 1, yielding a resolution of % of the set point in terms of mobility. During BC4, particles were mass-selected with a centrifugal particle mass analyzer (CPMA; Cambustion Ltd.), in addition to being size-selected using a DMA. Particles sampled into the DMA or CPMA first passed through a neutralizer, which imparts an equilibrium charge distribution to the particles. The DMA selects particles according to their electrical mobility, which is dependent upon the number of charges per particle. Particles with more than one charge are larger than those with a single charge, and the presence of these larger particles can confound the interpretation of optical property measurements. Altering the burner and sampling conditions for both flame types minimized the number of these multiply charged particles during the experiments, and in some cases their concentrations were effectively zero. However, for some experiments, their concentrations were non-zero. The method used to account for the multiply charged particles is discussed below.
2.3 Instrumentation
A wide range of instruments was employed to characterize the soot particle size, mass, composition and optical properties. Not all instruments were deployed for all studies, summarized in Table S2.
2.3.1 Size and mass
Particle mobility size distributions were measured using a scanning mobility particle sizer (SMPS; TSI model 3936). Particles sampled into the SMPS were passed through a neutralizer, which imparts a new equilibrium charge distribution to the particles. This (re)neutralization step shifts the charge distribution of the monodisperse particles imparted by the size-selection DMA to a new equilibrium state. For particles with mobility diameters 200–300 nm (typical of these studies), the number concentration ratio between particles with +1 charge to those with a greater number of charges selected by the DMA is ∼2–2.5 at equilibrium. Thus, after (re)neutralization, the majority of the particles that were in a +2 state coming out of the DMA are sized in the SMPS in their +1 state. This allows for the quantitative determination of the fraction of particles that had charge states of +1, +2, +3, etc., when selected by the DMA. The information is used to correct the optical measurements for contributions from larger, multiply charged particles for BC2, BC3, and BC3+.
Particle mass distributions were measured using a CPMA. Particle number concentrations were measured using a condensation particle counter (CPC; TSI Inc.) and using a mixing CPC (MCPC, BMI model l710). The two particle-counting instruments were placed at different points in the flow path to estimate and account for losses in the transfer lines between instruments. All CPC number concentrations agreed within ±5 %.
2.3.2 Composition
Particle composition was characterized online using a soot particle aerosol mass spectrometer (SP-AMS; Aerodyne Research, Inc.) (Onasch et al., 2012) and a compact time-of-flight aerosol mass spectrometer (c-ToF-AMS; Aerodyne Research, Inc.) (Canagaratna et al., 2007). The SP-AMS measured concentrations of refractory BC and the associated refractory and non-refractory coatings in BC-containing particles. The c-ToF-AMS measures concentrations of only non-refractory materials, which include particulate organic matter (POM) and some inorganic salts (, , ). Both instruments allow for the determination of mass-weighted particle size distributions as characterized by the vacuum aerodynamic diameter (dp,va). Particles were also collected on quartz-fiber filters for offline thermal-optical analysis (Chow et al., 2004), from which the relative abundances of OC and elemental carbon (EC) are determined.
During BC4, refractory black carbon mass was quantified with a single particle soot photometer (SP2; Droplet Measurement Technologies). The SP2 heats up the soot particles with an Nd:YAG laser and quantifies the incandescence emission as the particle evaporates. The incandescence signal from the instrument was calibrated using DMA size-selected fullerene soot (Alfa Aesar Lot L18U002) (Laborde et al., 2012). The mass distributions from the SP2 were used to determine contributions from multiply charged particles during BC4.
2.3.3 Optical properties
Particle optical properties were characterized using multiple instruments. Three different photoacoustic spectrometers (PASs) were used during the various studies to measure particulate light absorption coefficients (babs). During BC2, a custom-built PAS from the National Oceanic and Atmospheric Administration (NOAA) operating at λ= 532 nm was deployed (Lack et al., 2006). Also, during BC2, a commercial three-wavelength particle absorption soot spectrometer (PASS-3; DMT, Inc.) operating at λ=405, 532, and 781 nm was deployed by Los Alamos National Laboratory (LANL) (Flowers et al., 2010). The results from the different PAS instruments for BC2 are compared in Cross et al. (2010). During BC3, BC3+, and BC4, a custom-built PAS from the University of California, Davis (UCD), operating at λ=405 and 532 nm, was deployed (Lack et al., 2011; Cappa et al., 2012). Light absorption was also measured during BC3, BC3+, and BC4 at λ=630 nm using a commercial cavity-attenuated phase-shift single-scatter albedo spectrometer (CAPS PMSSA; Aerodyne Research, Inc.). The CAPS PMSSA measures particulate light absorption as the difference between the measured light extinction (bext) and scattering (bsca) coefficients, whereas the PAS instruments measure light absorption directly. The CAPS extinction measurement has been previously described (Massoli et al., 2010). The CAPS PMSSA measures bsca using an integrating nephelometer, corrected for the finite viewing angle of the detector, i.e., truncation correction (Onasch et al., 2015b). The truncation correction at 630 nm was determined to be <1 % at 630 nm for particles smaller than 300 nm, increasing to <5 % for particles smaller than 800 nm. Light extinction coefficients were measured at λ=532 nm during BC2 using the NOAA cavity ring-down (CRD) spectrometer and at λ=405 and 532 nm during BC3, BC3+, and BC4 using the UCD CRD spectrometer (Langridge et al., 2011). Light extinction coefficients were also determined during BC2 at λ=405, 532, and 781 nm using the PASS-3 instrument, which, like the CAPS PMSSA, incorporates an integrating nephelometer to measure bsca; bext is determined as the sum of babs and bsca.
Absorption and extinction cross sections were determined for the size-selected particles as
where Np is the measured particle number concentration. Additional parameters of interest that can be calculated from the measurements are the wavelength-dependent mass absorption and extinction coefficients, MAC and MEC, respectively, defined as
where mp is the per-particle mass. The combination of the absorption and extinction cross sections allows for the calculation of single-scatter albedo (SSA), defined as
The SSA characterizes the fraction of extinction that is due to scattering. The wavelength-dependence of absorption is characterized by the semiempirical parameter, the absorption Ångström exponent, defined as
where λ is wavelength and the subscript 1 and 2 indicate two different wavelengths.
3.1 Mass mobility exponent
One measure of particle shape is the mass mobility exponent (Df,m) (Park et al., 2003):
where C is the proportionality constant. (The mass mobility exponent, Df,m, differs from the fractal dimension, Df, as discussed by Sorensen (2011).) Values of Df,m for atmospheric particles typically range from 2.0 to 3.0, with lower values being characteristic of more “lacy” soot and higher values of more compacted soot. Df,m values were obtained for nascent and coated–denuded soot particles by fitting a power law function to a graph of mp vs. dm.
3.2 Refractive index retrieval
Effective complex refractive index values (RI; ) for the soot particles were determined using two methods: (1) spherical particle Mie theory and (2) RDG approximation. For the refractive index, m is the real component and ki is the imaginary component. In Mie theory, particle cross sections are calculated assuming spherical particles with a homogenously uniform complex refractive index. The calculated cross section is the product of the calculated absorption or extinction efficiency (Qabs or Qext) and the geometric particle cross section (, where dp is the particle diameter). Here, the particle diameter used in the calculations is the measured dp,VED, as determined from the CPMA per-particle mass measurements and assuming a material density for BC of 1.8 g cm−3. In the RDG approximation (Sorensen, 2001), the absorption cross sections are calculated as
where Nspherule is the number of spherules comprising a particle and σabs,spherule is the absorption cross section calculated for a single spherule using Mie theory. Here, we have assumed that , where mp is the measured per-particle mass and mspherule is the mass of an individual spherule with dp=20 nm (ethylene premixed flame) (Cross et al., 2010) or dp=37 nm (methane diffusion flame) (Ghazi et al., 2013), again assuming a material density of 1.8 g cm−3.
Optimal (best-fit), theory-specific values of m and k were established by comparing the size-dependent observations of σabs to calculations from either Mie theory or the RDG approximation by varying these parameters over the ranges and and determining the minimum value of the reduced chi-square statistic:
where is the measured absorption cross section, is the calculated absorption cross section, N is the number of points, and εabs is the estimated uncertainty, which accounts for both instrumental uncertainties plus the uncertainty associated with contributions from multiply charged particles. Individual fits were performed for each wavelength for each flame type. The methane diffusion flame soot data collected during different studies were treated as one dataset, whereas the ethylene premixed flame soot data collected during the different studies were kept separate due to the sampling differences described above.
3.3 Accounting for multiply charged particles
All absorption and extinction coefficient measurements were corrected for contributions from doubly charged (Q2) particles. This correction leads to a decrease in the measured absorption and extinction coefficients. Here, an approach is taken where the fraction of absorption or extinction from Q2s (fabs,Q2 or fext,Q2, respectively) is estimated from the measurements of the number fraction of singly and doubly charged particles (fQ1 and fQ2, respectively) determined from either the SMPS (BC2, BC3, and BC3+) or the SP2 (BC4), the per-particle mass of singly and doubly charged particles (mp,Q1 and mp,Q2, respectively), with an assumption of spherical particles (i.e., that and an assumption that the MAC and MEC are size-independent. The resulting expression for fabs,Q2 is then
It is important to note that the final expression is independent of the absolute value of the MAC. A similar procedure was used to correct MEC values. Although the MAC (and MEC) may not be fundamentally size-independent, as assumed, the correction is relatively insensitive to differences in the MAC between sizes. For the size range of interest, there is a relatively constant relationship between the diameters of the singly and doubly charged particles, with dp,VED,Q2∼1.6 dp,VED,Q1 corresponding to mp,Q2∼4mp,Q1. Thus,
and the absorption by Q1 particles only is
As an example, if fQ1=0.95, then fabs,Q2=0.17 and the sensitivity of fabs,Q2 to uncertainties in fQ1 is , as determined by sensitivity calculations. We estimate that the uncertainty in fQ1 is 0.01, which contributes ∼3 % to the uncertainty in babs,Q1. (If the MAC were not constant but were instead 20 % larger for Q2s compared to Q1s, then the correction would increase to 0.20 from 0.17.) For most runs, the Q2 contribution was small, being 5 % or less.
Results from the methane diffusion flame and from the two different ethylene premixed flame experiments are presented and discussed separately. For each flame type or configuration, the coated–denuded data for all coating types are considered together.
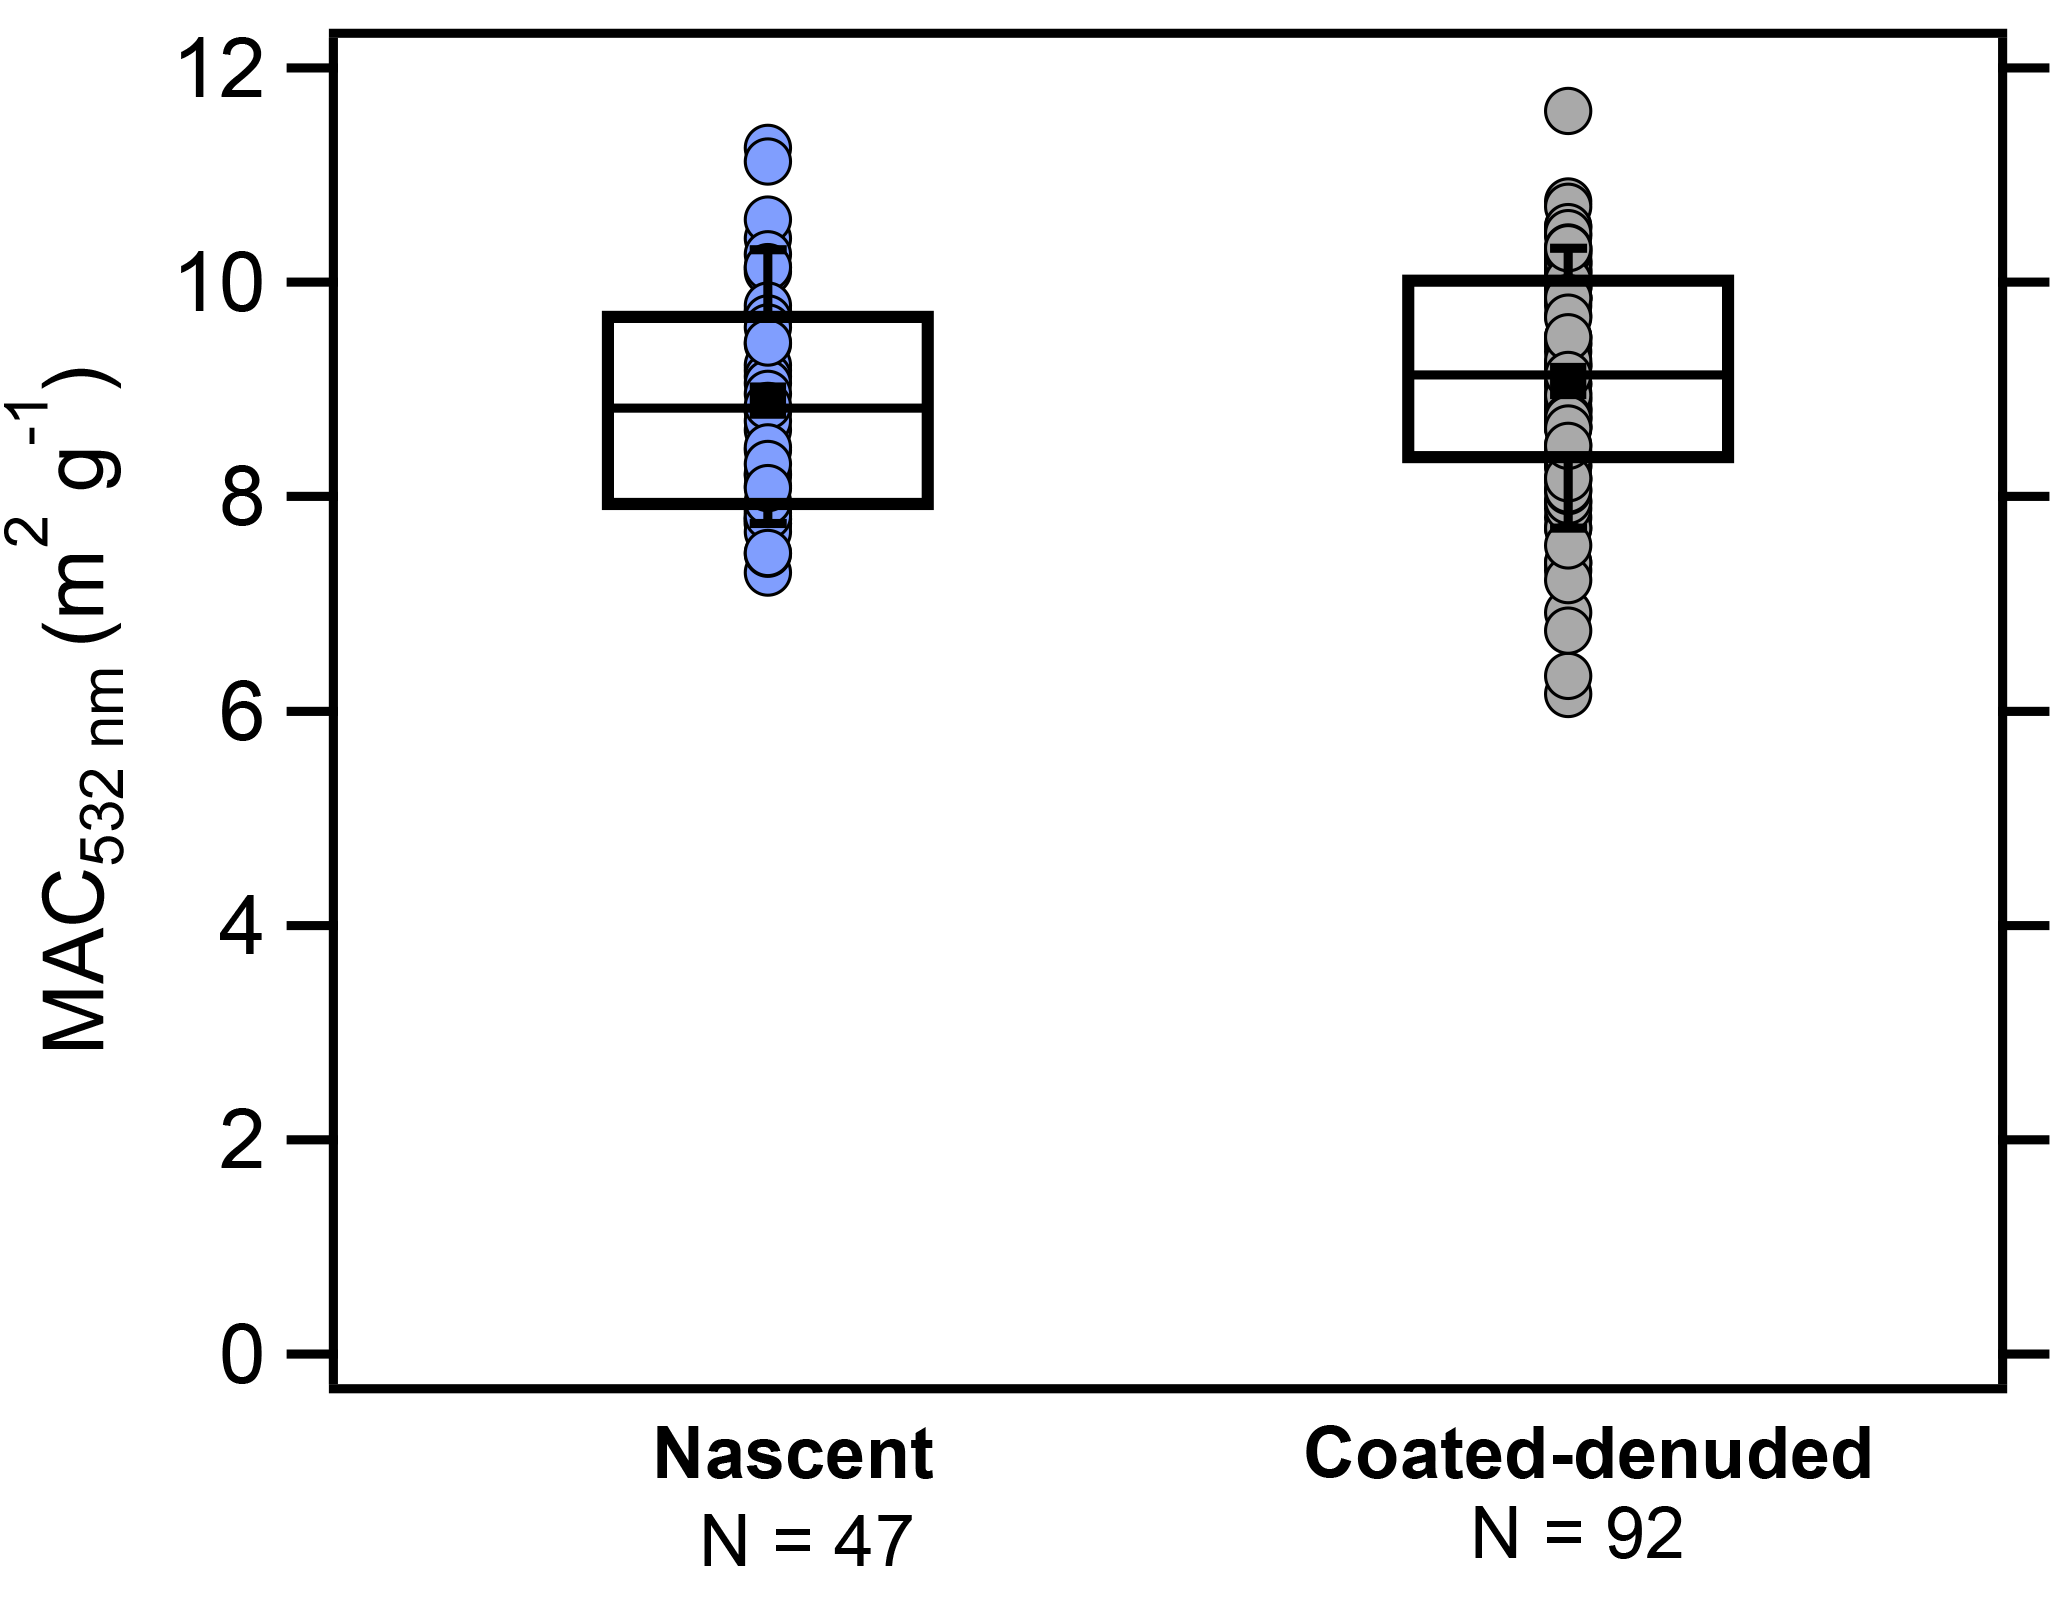
Figure 1A comparison of methane-diffusion-flame-generated nascent (or nascent–denuded; blue circles) and coated–denuded (gray circles) mass absorption coefficients (MACs) at λ=532 nm for x>0.90 for BC3, BC3+, and BC4 experiments. Note that conditioning (and therefore the shape) of the soot does not affect the observed MACs. The box and whisker plots show the mean (▪), median (–), lower and upper quartile (boxes), and 9th and 91st percentile (whisker).
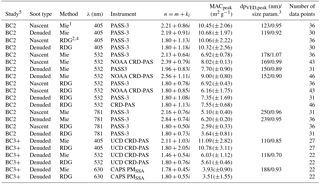
Table 1Refractive indices for methane diffusion flame soot retrieved via fitting Mie theory and the RDG approximation to the σabs observations. Nascent and denuded data are combined (see text for details).
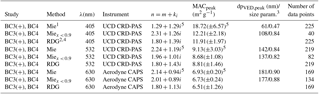
1 Uncertainties in the MAC are 1σ from the reduced χ2 fit. See Figs. S3 and S4. 2 The n values from the RDG method are nonunique. Therefore, uncertainty estimates from this work are not available. See text for details. 3 VED and the size parameter ( where the peak MAC occurs. 4 There are many degenerate RI combinations that give similar quality fit to RDG theory. Thus, a value of 1.80 was chosen for the effective real refractive index. 5 These values are given for reference purposes only but should not be used due to the inability to fit data well (see text for details).
4.1 Soot optical properties from the methane diffusion flame
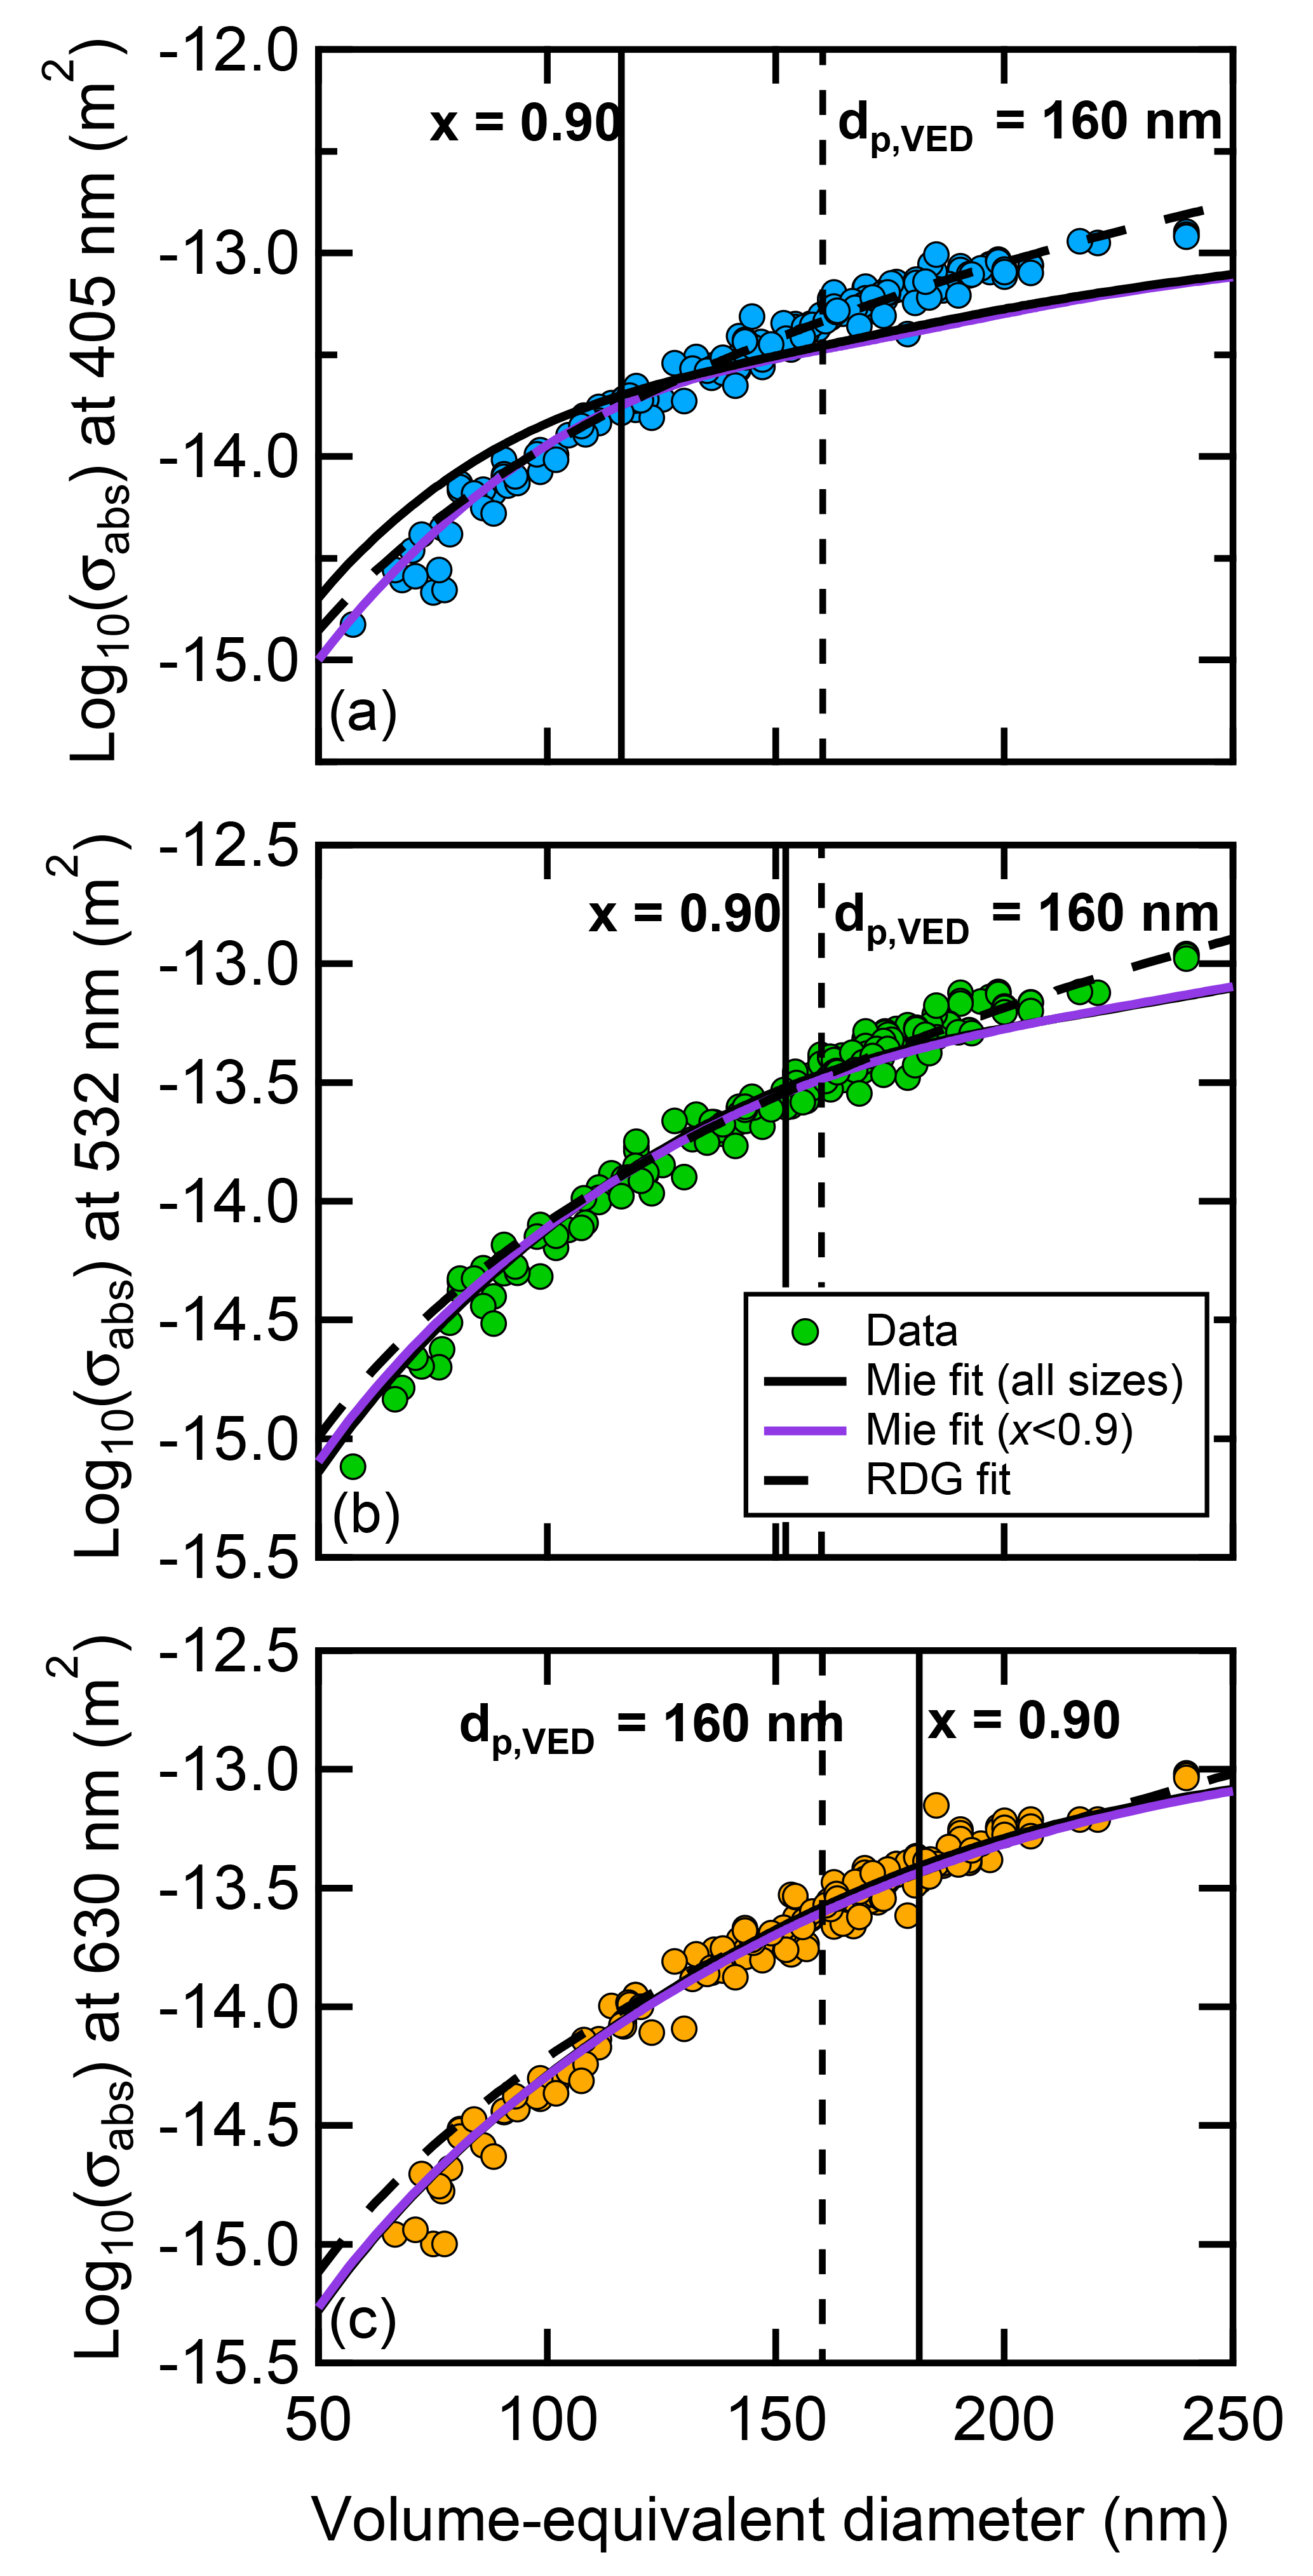
Figure 2Observed σabs vs. dp,VED methane soot data from BC3, BC3+, and BC4. Panels (a) and (b) are λ=405 and 532 nm data, respectively, from the UCD CRD-PAS, and (c) is λ=630 nm data from the CAPS PMSSA. The nascent and coated–denuded data have been combined since there is no significant difference in the absorption cross sections and MACs between the two datasets. Note the inability of Mie theory to reproduce the observed σabs,405 nm for all sizes. Vertical solid lines indicating x=0.9, where observations deviate from Mie theory, are provided for reference. In addition, vertical dashed lines indicate dp,VED=160 nm, above which soot maturity is approximately constant.
4.1.1 MAC values of nascent and coated–denuded soot
Average and median MAC values were determined for BC particles from the methane diffusion flame with x>0.9 (corresponding to a dp,VED=160 nm at λ=532 nm; Table S3). (The dimensionless size parameter , where dp is particle diameter and λ is wavelength.) There are no systematic differences in the MAC values between nascent and nascent–denuded () and coated–denuded () soot at any wavelength for this range of x despite some degree of collapse for the thickly coated–denuded particles (Figs. 1 and S2). The average MAC values for x>0.9 were 12.1±1.4 m2 g−1 at 405 nm, 9.1±1.1 m2 g−1 at 532 nm, and 7.1±1.1 m2 g−1 at 630 nm, where uncertainties are 1σ standard deviations of the measurements. For the reverse-coating experiments, which gave broader BC per-particle mass distributions compared to forward-coating distributions, we found no dependence of the derived MAC values on the distribution width. The collapse was presumably due to the effect of evaporation or condensation of the coating material and not due to the denuding process alone (Bhandari et al., 2017). The observed Df,m independence of the MAC (x>0.9) is consistent with Radney et al. (2014). This contrasts, however, with modeling studies that use non-Mie-based methods that can account for particle shape effects, which indicate that lacy soot (with a fractal dimension, as opposed to mass mobility exponent, of Df=1.8) is more absorbing than “compact” soot (Df=2.4) (Kahnert and Devasthale, 2011; Scarnato et al., 2013). In the calculations, the compact soot particles are less absorbing because the innermost spherules are “shielded” by the outermost spherules. It is possible that the extent of collapse here was insufficient to lead to substantial “shielding” in our experiments. Regardless, given the similarity of the observed nascent and coated–denuded particle cross sections, they have been recombined into a single dataset in what follows.
4.1.2 RI values calculated from Mie theory and the RDG approximation
The σabs have been fit separately using Mie theory and the RDG approximation to determine optimal, theory-specific effective complex RI values. The observations and best fits are shown in Fig. 2 at the three wavelengths (λ=405, 532, and 630 nm), and the derived optimal wavelength-, flame-, and theory-specific values are reported in Table 1. The quality of the best fit obtained is dependent upon both theory and wavelength considered. First, fits performed using Mie theory tend to give reasonably well-defined minima in the calculated , indicating that the optimal m and k are unique (Fig. S3). In contrast, fits performed using the RDG approximation do not give a unique set of m and k but instead a band of [m,k] pairs that describe the data equally well (Fig. S4). Since RDG fits are nonunique, optimal k values are reported at all wavelengths for a fixed value of m=1.80.
There are additional differences between Mie and RDG beyond the uniqueness of the derived optimal RI. At λ=405 nm, Mie theory provides a poor fit to the σabs when the fit is performed using data over the entire size range sampled. In particular, at λ=405 nm the σabs from Mie theory are overestimated below dp,VED∼120 nm (x∼0.9) and underestimated for larger sizes (Fig. 2a). At λ=532 nm, this deviation also occurs at x∼0.9 (dp,VED>160 nm) corresponding to larger size particles. Compared to 405 nm, the overestimate at small x and underestimate at larger x for 532 nm is smaller. At λ=630 nm, the Mie theory fit compares well with the observations at x<0.9 (dp,VED∼180 nm) and with some deviation observed at larger sizes. When the fits are restricted to x<0.9, a reasonable fit using Mie theory is obtained at all wavelengths over this size range, although there is perhaps a small overestimate at the smallest sizes. However, these constrained Mie fits extrapolated to larger sizes (x>0.9) still underestimate the observed absorption. For RDG, generally good fits are obtained at all wavelengths and across all sizes, although the RDG-calculated σabs tends to overestimate the observation at smaller sizes below dp,VED∼100 nm.
It is important to note that the RI values listed in Table 1 are theory- and property-specific. This means that the Mie-derived RI values are not appropriate for use with the RDG approximation and vice versa. Additionally, they must be used assuming a material density of 1.8 g cm−3, since this value was used to convert mp to dp,VED or Nspherule. If, for example, a smaller density were used with these RI values then the particles would have substantially higher MACs. Of note is that both the real and imaginary RIs from Mie theory are larger than RI values that are commonly used in global climate models (Bond et al., 2013), including the RI that is often considered the currently recommended value (1.95−0.79i) (Bond and Bergstrom, 2006). For reference, using RI the MAC at 532 nm calculated for BC in the small particle limit (assuming a material density of 1.8 g cm−3) is only 5.1 m2 g−1, but peaks at 7.5 m2 g−1 around dp,VED=150 nm.
4.1.3 Comparison of measured and calculated MAC values
Another way to look at the extent to which Mie theory or the RDG approximation can reproduce the observations is to compare the observed and calculated MAC values as a function of particle size (or x) rather than the σabs vs. size relationship (as in Fig. 2). Although the MAC is related directly to the σabs, it is nonetheless useful to consider the MAC values because they vary over a much narrower range than do the σabs. The dependence of the MAC on dp,VED and size parameter for both the observations and the models are shown in Fig. 3. The observed MAC values generally increase with dp,VED or size parameter at all wavelengths up to around dp,VED∼160 nm, above which they plateau and are approximately constant. The ranges (minimum and maximum) of binned observed MACs are provided in Table S4.
The MAC values observed here (Table S3) are substantially larger than the value of 5.7±0.8 m2 g−1 at λ=405 nm reported by Radney et al. (2014), who use a Santoro-type burner (i.e., co-flow diffusion flame). They did not report any notable size dependence for their MAC values. Our MAC values (especially for x>0.5) compare well with the value of 8.16 m2 g−1 at λ=532 reported by You et al. (2016) (extrapolated from 7.89±0.25 m2g−1 at λ=550 nm) for soot particles generated from the combustion of organic fuel stock over the dp,VED range ∼80 to ∼210 nm. They also compare favorably to the range of values 7.2 to 8.5 m2 g−1 reported for λ=532 nm for dp,VED∼100 nm observed in Saliba et al. (2016) for particles generated from a cookstove. Some particle size dependence was reported by Khalizov et al. (2009), who used propane with a Santoro-type burner, with reported MACs at λ=532 nm of 6.7±0.7 m2 g−1 for dm=155 nm particles and 8.7±0.1 m2 g−1 for dm=320 nm particles. This general behavior was also observed for soot particles generated from a methane diffusion flame in Dastanpour et al. (2017), with MAC values reported at λ=660 nm of ∼5 m2 g−1 for dp,VED=50 nm and ∼7 m2 g−1 for dp,VED=100 nm. One key reason that differences may exist between studies is that the BC particles sampled had differing maturity. Soot maturity refers to the extent to which the BC has a more disordered internal structure with high hydrogen content (low maturity) vs. a more ordered, graphite-like structure with low hydrogen content (high maturity) (Johansson et al., 2017). The absorption cross section for BC likely increases with increasing soot maturity (López-Yglesias et al., 2014).
The observations are compared with the calculated MAC values, based on the fits from Fig. 2. MAC values from the RDG approximation are independent of x, as the particle MAC is equal to the MAC of the individual spherules making up the particle. Here, the observed MAC values in the plateau (large x) regime correspond reasonably well with the MACs as calculated from RDG values when the optimal RI values are used. The constant RDG MAC value at λ=532 nm (= 8.8 m2 g−1) is slightly larger than the often suggested value for atmospheric BC by Bond and Bergstrom (2006) of 7.75±1.2 m2 g−1 (extrapolated from 7.5 at λ=550 nm using 1 for the AAE) and is identical to that reported for soot from a Santoro-type diffusion burner operating on propane (Zhang et al., 2008). However, the MACs predicted from RDG overestimate the observed MACs at x<0.90, since the RDG fits are weighted by the greater number of data points at x>0.9 where MACs are approximately constant.
For Mie theory, calculated MAC values for highly absorbing substances, such as BC, have a characteristic shape where the MAC is constant up to x∼0.2, increases monotonically by ∼40 % until x∼0.9, and then decreases rapidly towards larger x. The Mie theory curves calculated here reproduce the observed values at x<0.90 (especially for λ=532 and 630 nm) but substantially underestimated MACs at x>0.90. This facilitates an understanding of the Mie model underestimate of σabs at large x (Fig. 2). Above x∼0.9 the calculated Mie MAC declines with x for all wavelengths, but the observations indicate that the MAC is constant. Because x occurs at smaller dp,VED for shorter wavelengths than for longer wavelengths, the model–measurement difference in both σabs and MAC is more noticeable at 405 nm than it is at 532 nm, which is more noticeable than at 630 nm. This is a consequence of a greater number of data points at x>0.9 at 405 nm, past the peak in the Mie-calculated MAC.
The reasonable correspondence between the observed and Mie-calculated MAC at smaller sizes is, however, somewhat surprising given that Mie assumes spherical particles, yet the particles are not spherical. One potential reason for the observed dependence of the MAC on particle size is that the chemical and optical properties of the particles change with size, and the different chemical composition coincidentally improves agreement with Mie theory. For the diffusion flame, changes in the particle size distribution were induced by changing the amount of dilution nitrogen in the sheath flow. This can influence the maturity of the soot and consequently the soot absorption (López-Yglesias et al., 2014). The observed increase in MAC with dp,VED here exhibits some wavelength dependence, which could reflect differences in the sensitivity of the MAC to maturation. The observed differences between the MACs observed at the smallest x and the maximum MAC values were 21 %, 41 %, and 37 % for λ=405 nm, λ=532 nm, and λ=630 nm, respectively. However, one additional difference between the wavelengths is that at λ=405 nm, there is a small increase in MAC going from dp,VED∼60 nm (x405 nm=0.6) to ∼100 nm (x=0.9) after which the MAC is constant, while at λ=630 nm there is much more of a continuous increase in the MAC up to larger particle sizes. This could indicate that, at some point, further changes in the soot maturity (composition) have no influence at short wavelengths but do at longer wavelengths. As a complementary explanation, Dastanpour et al. (2017) observed an increase in primary spherule size with overall particle size for methane-diffusion-flame-generated soot. They attribute the increase in MAC with dp,VED to changes in the internal structure and/or the degree of graphitization that occur with changes in spherule size.
The observation of constant MAC values for mature soot (x>0.9 or dp,VED∼160 nm at λ=532 nm) is an important result in the context of how BC is commonly treated in climate models. Most climate models simulate the optical properties of BC using spherical particle Mie theory. The observations indicate that Mie theory will likely underestimate the absorption by BC for particles with x>0.9 because, when the particles are sufficiently absorbing, the attenuation of light by the outer layers of the (spherical) causes the mass in the center of the particle to not interact with the electromagnetic field (Bond and Bergstrom, 2006; Kahnert and Devasthale, 2011). This suggests that the RDG approximation, or even an assumption of a constant MAC, may provide a more accurate representation of BC absorption than Mie theory in climate models, at least for uncoated BC. This conclusion is independent of soot maturity, as the falloff in the MAC with increasing size for Mie theory occurs for all strongly absorbing particles. Although atmospheric BC particles are predominately generated through the combustion of fossil fuels or through biomass burning (Bond et al., 2013), flame-generated BC particles have been shown to be a suitable proxy for atmospheric BC particles, both in terms of chemical bonding and structural properties (Slowik et al., 2007; Hopkins et al., 2007). For example, Hopkins et al. (2007) find that the sp2 content of ethylene and methane flame soot are similar to diesel soot (63 %, 60 %, and 56 %, respectively) and have similar aromatic content. There is also a reasonable similarity between SP-AMS mass spectra of flame soot and soot particles in diesel exhaust or smoke from biomass burning (Onasch et al., 2015a). The absolute values of the derived RI may be different for diesel or biomass BC particles, but it can be reasonably assumed that Mie theory does not reproduce the behavior of atmospheric BC particles.
The discrepancy between Mie theory and the observations is both size and wavelength dependent. Consequently, the extent to which the true absorption by BC is underestimated by a given atmospheric model due to the inappropriate use of Mie theory will depend importantly on the assumed size distribution, both the position and the width, and the wavelength. Using the effective RI values determined here, we estimate that absorption is underestimated by around 20 %–40 % when Mie theory is used with reasonable BC size distributions. The underestimate in absorption from the use of Mie theory will be even larger if non-theory-specific (typically lower) imaginary RI values are used, such as that suggested by Hess et al. (1998) or Bond and Bergstrom (2006), as discussed by Stier et al. (2007). Consider that the maximum MAC predicted using the Hess et al. (1998) RI () from Mie theory is only 3.8 m2 g−1.
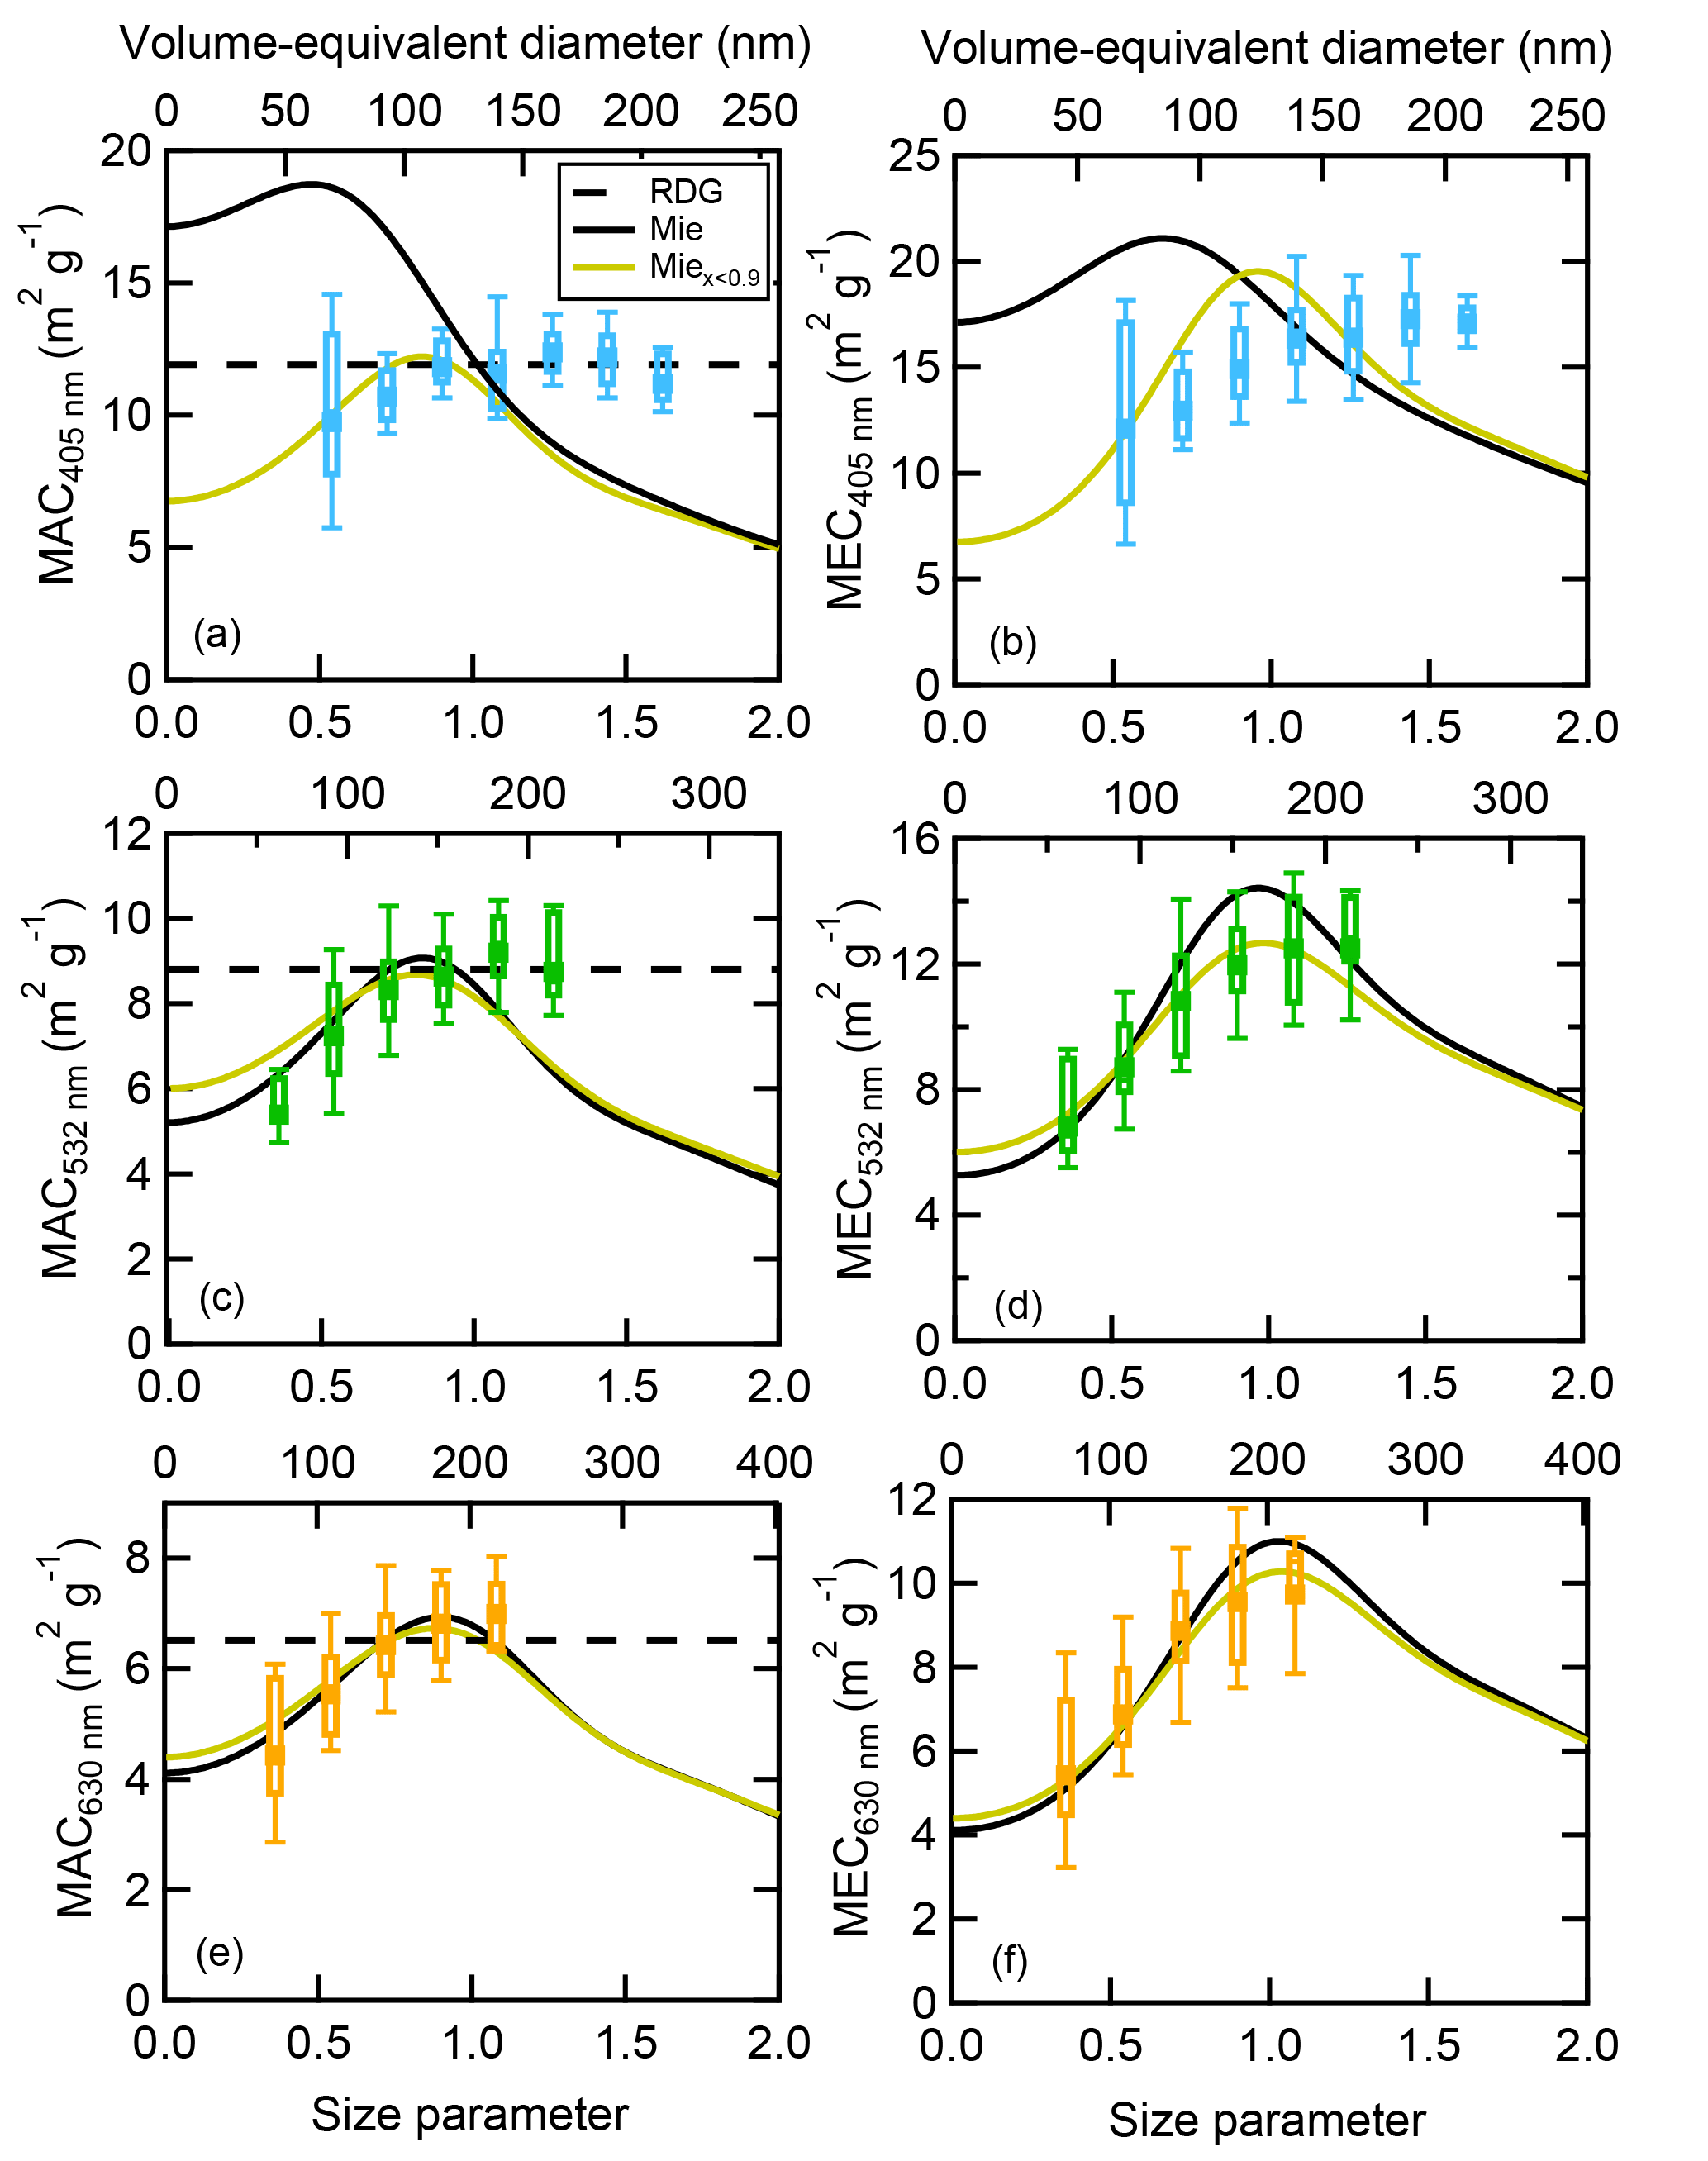
Figure 3Box plots of MACs and MECs as a function of size parameter, with Δx=0.18. The volume-equivalent diameters are provided at the top of the plots for reference. Also shown are Mie theory curves for all particles (black solid lines), Mie theory curves for x<0.90 (gold line), and RDG curves (dashed line) calculated from the RI values in Table 1. RI fitting was performed using only the absorption measurements. Panels (a) and (b) are λ=405 nm data from the UCD CRD-PAS, (c) and (d) are λ=532 nm data from the UCD CRD-PAS, and (e) and (f) are λ=630 nm data from the CAPS PMSSA. The poor match between the calculated Mie theory curves at λ=405 nm reflects the difficulties in fitting spherical particle Mie theory to the observed σabs,405 nm over the entire size range. Although the same particle sizes were sampled over all wavelengths, the size parameters sampled at each wavelength are different. Therefore, there are different numbers of boxes for each wavelength. Note that this figure is directly related to Fig. 2, the difference being that the y axis values in Fig. 2 (cross sections) have been divided by the per-particle mass to give the MAC or MEC. Points in each bin range from N=10 at x1.62 to N=81 at x1.26 for λ=405 nm, N=5 at x0.36 to N=82 at x1.08 at λ=532 nm, and N=8 at x1.08 to N=67 at x0.9 at λ= 630 nm.
4.1.4 MEC and SSA values of nascent and coated–denuded soot
Measurement of bext and the MEC were made in addition to the babs and MAC measurements (Fig. 3). Above, the RI fitting was performed using only the absorption measurements, in part because the calculation of extinction using RDG requires additional assumptions regarding the particle shape. Nonetheless, it is informative to compare the σext and MEC observations to Mie theory calculations since the overall climate impacts of BC depend on both absorption and scattering. As with the MAC values, the observed MEC values also increase with x up to 0.90 (or dp,VED up to 160 nm), after which point they are relatively constant (Fig. 3). The Mie theory MECs calculated using the RIs determined by fitting the absorption measurements (Table 1) agree reasonably well with observations when x<0.9 (using the fits that were constrained to this range), but, as with absorption, Mie theory underestimates the MEC above x=0.9. For a given particle size, there is somewhat greater scatter in the observed MECs than in the MACs. This is likely a result of the scattering being more sensitive to the shape of the soot particles than is absorption and of the nascent and coated–denuded particle results being combined here.
Given this, the dependence of the SSA on particle size is considered separately for the nascent (more lacy) and coated–denuded (more compact) particles. The coated–denuded particle SSAs increase with dp,VED, most noticeably for dp,VED>100 nm, up until dp,VED∼160 nm. Above this size the SSA values are approximately constant at a value of ∼ 0.30 (Fig. 4a). (Results at λ=532 nm are shown in Fig. 4a, but there is a strong correlation between SSA at 532 nm and at 405 or 630 nm; Fig. S5). In contrast, the nascent SSAs increase slightly from dp,VED∼50 to 80 nm but above 80 nm are approximately constant at ∼0.20. This demonstrates that particle collapse leads to an increase in the SSA for BC, consistent with Radney et al. (2014). This behavior is also consistent with modeling studies, which have predicted that compact agglomerates exhibit higher SSA values than lacy agglomerates, with an absolute increase of ΔSSA ∼0.1 (Scarnato et al., 2013) or by a factor of 1.2–2.2, depending on the extent of compaction (China et al., 2015a, b). The increase upon collapse is attributed to the stronger scattering and electromagnetic coupling between spherules in compact aggregates. Here, the difference between the SSA for nascent and coated–denuded soot increases somewhat with particle size, which may result from changes in soot maturity with size. The SSAs from this study compare reasonably well to values reported previously at visible wavelengths. For example, Saliba et al. (2016) report SSA = 0.16 to 0.26 for nascent soot emitted from a cookstove; Schnaiter et al. (2003, 2006) report SSA = 0.2 to 0.3 for soot from a propane diffusion flame, SSA = 0.18 to 0.25 for kerosene-derived soot, and SSA = 0.1 to 0.25 for methane diffusion flame soot; and Sharma et al. (2013) report SSA = 0.18 to 0.25 for soot generated from a kerosene lamp. However, the values reported here are much smaller than the value of 0.5 reported in Radney et al. (2014). The Mie-theory-calculated SSA values are similar to observations, although they show a somewhat stronger increase with size and seem to plateau at larger SSA values at large sizes compared to observations.
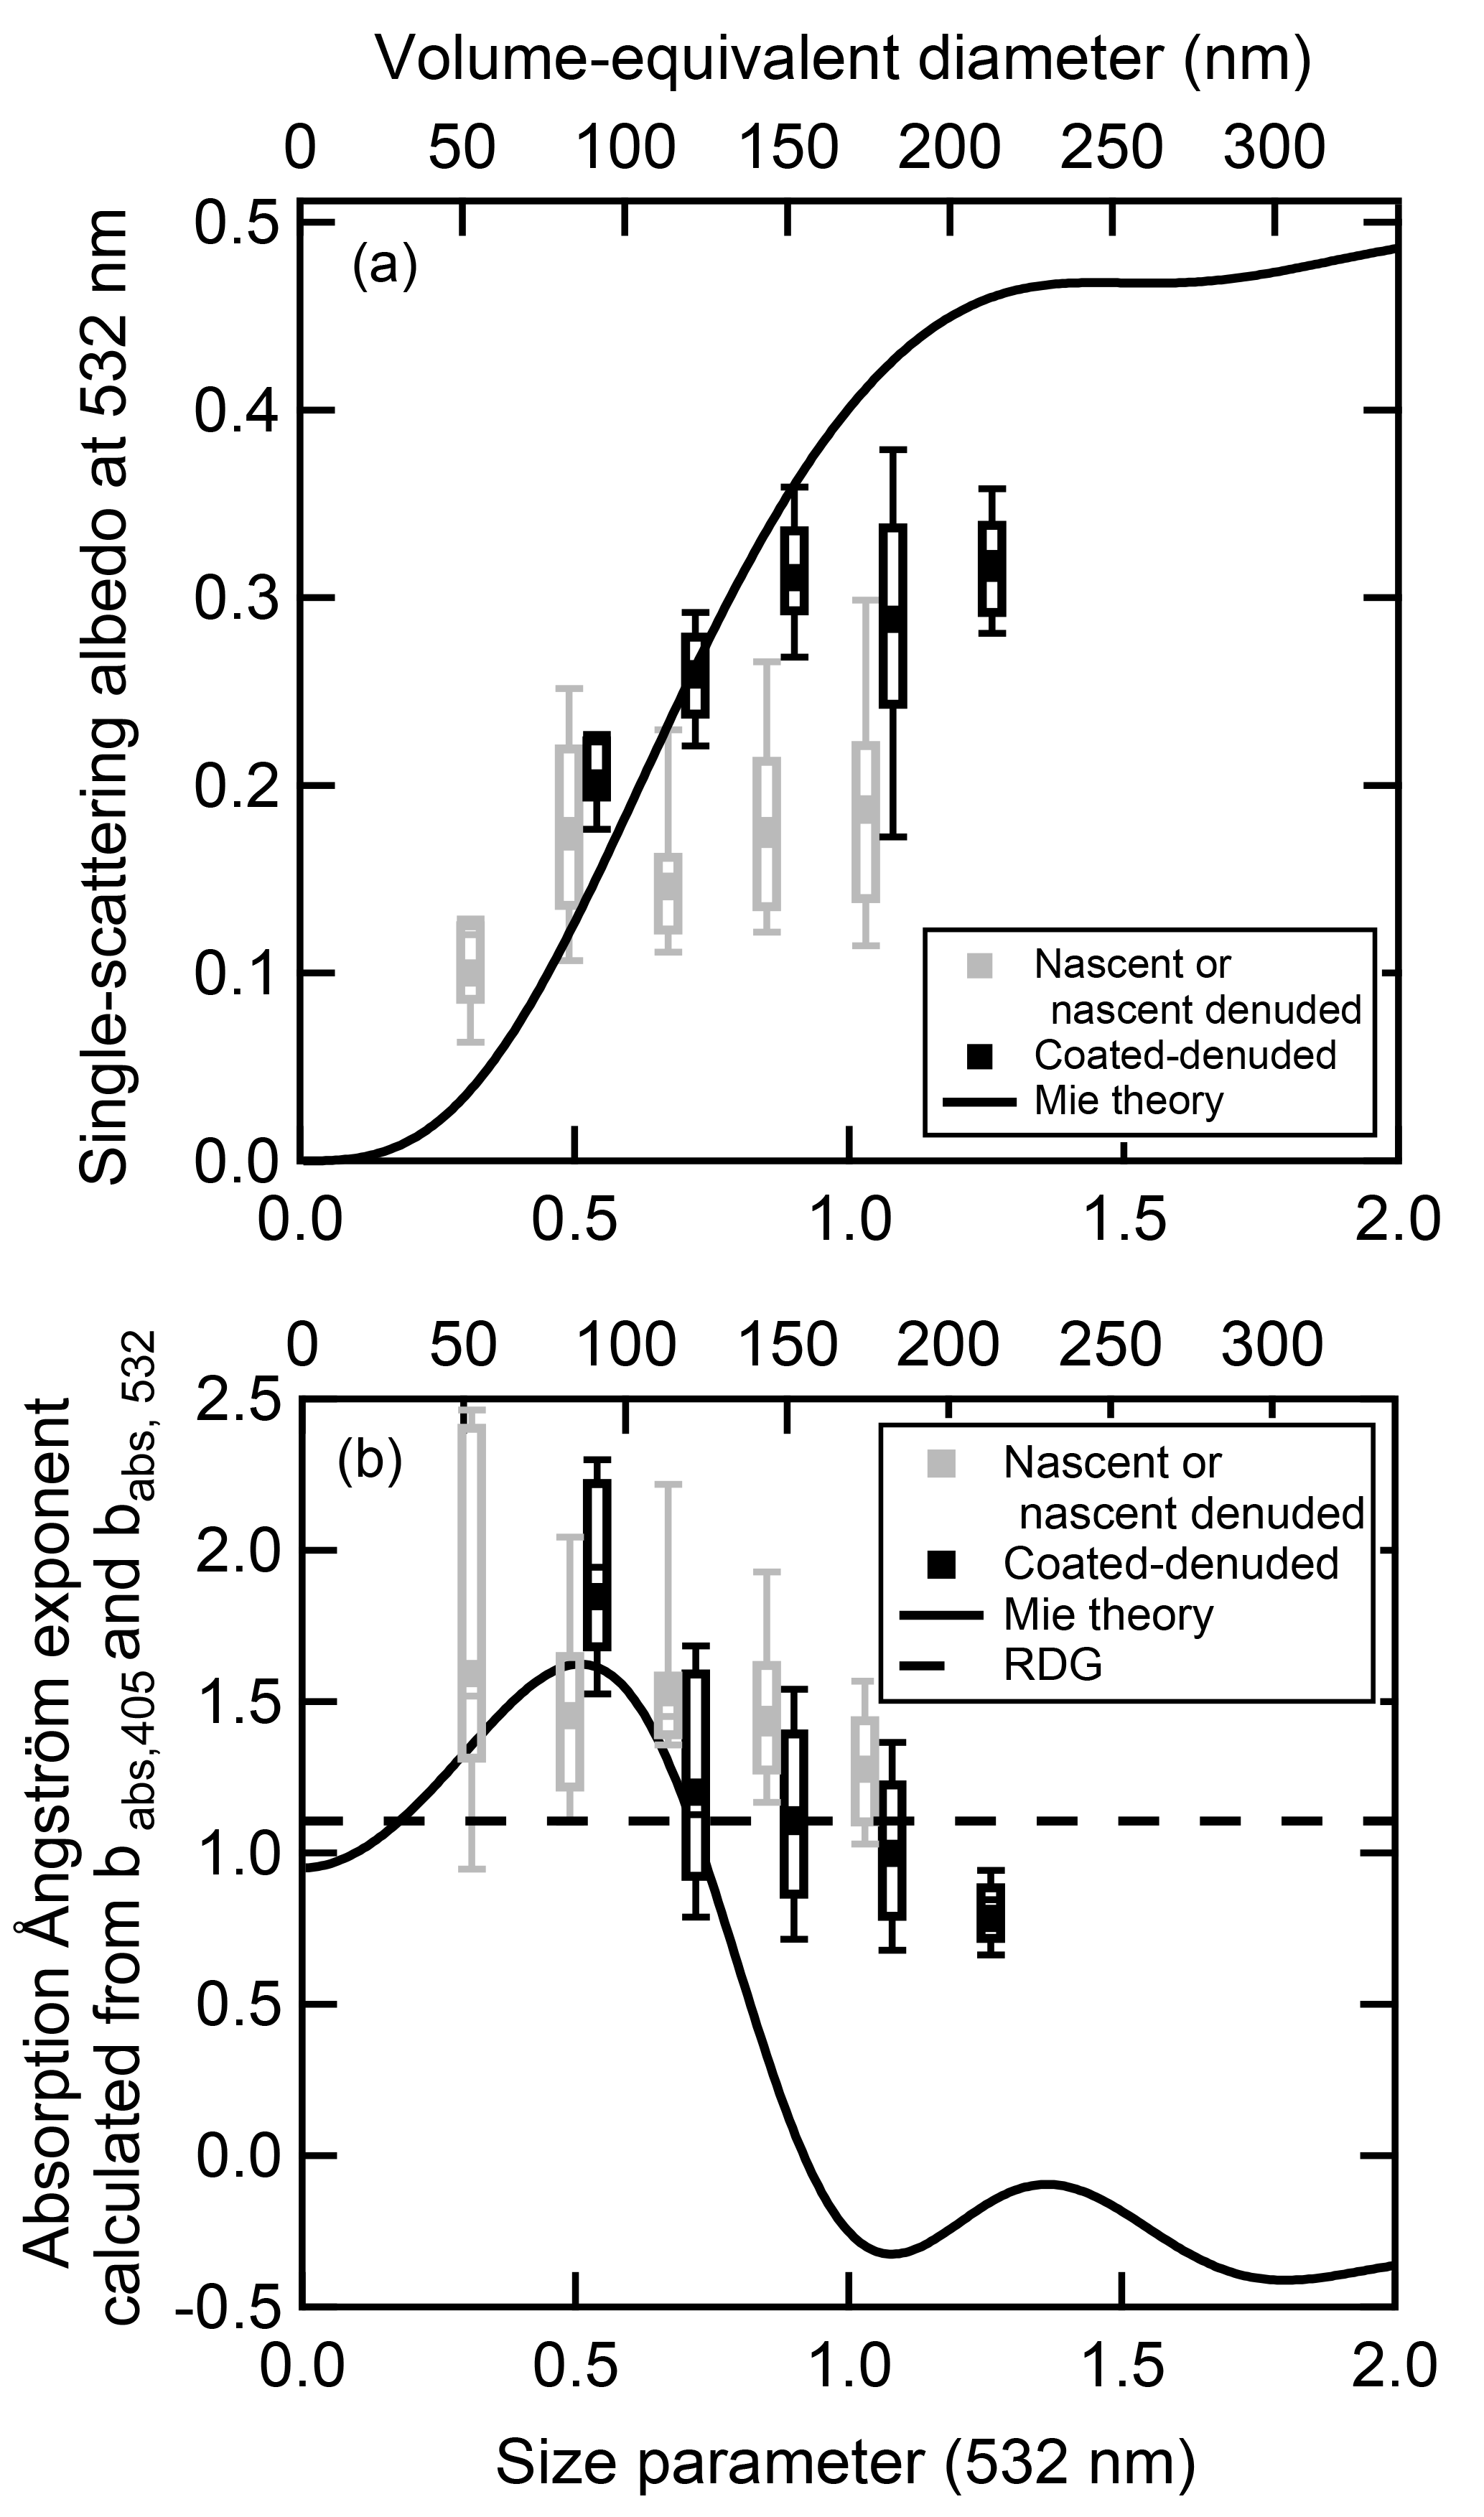
Figure 4Box and whisker plots of λ= 532 nm (a) single-scattering albedo (SSA) and (b) absorption Ångström exponent (AAE) as a function of volume-equivalent diameter produced from the methane diffusion flame. The black points are coated–denuded data (coating material is evaporated following coating with DOS or sulfuric acid) and are potentially collapsed due to coating, and the gray points are nascent or nascent–denuded data. The black lines are the SSA or AAE predicted by spherical particle Mie theory, and the dashed black line in (b) is AAE predicted from the RDG approximation using the effective refractive indices listed in Table 1. The nascent or nascent–denuded boxes (black) are shifted by X=0.05. Points in each bin range from N=6 at x0.36 to N=26 at x1.08 for nascent (or nascent–denuded) and N=5 at x0.54 to N=9 at x1.26 for coated–denuded points.
4.1.5 AAE of nascent and coated–denuded soot
The wavelength dependence of absorption has been considered by calculating the AAE using the measurements at λ=405 and 532 nm (Fig. 4b). The nascent AAEs at larger particle sizes are slightly larger than the coated–denuded AAEs, suggesting that particle collapse leads to a slight decrease in the wavelength dependence of absorption. The average AAE was 1.38 ± 0.36 (N=85) and 1.10 ± 0.37 (N=135) for nascent and coated–denuded particles, respectively. There is some indication that AAE decreases with particle size. This may again be the result of the soot maturity increasing (and the composition changing) with size. The AAE values from Mie theory, based on the best-fit RI values determined above, exhibit an increase to x∼0.5 where they peak and then decrease sharply. This predicted decrease is inconsistent with the observations. The AAEs calculated using the RDG approximation from the best-fit RI values are constant.
BC is commonly assumed to have an AAE = 1 (Bergstrom, 1973). The measurements here are consistent with this expectation for the collapsed (coated–denuded) particles, but the nascent particles give an AAE that is somewhat larger than 1. The observed AAE values are similar to results from previous studies examining either freshly emitted soot particles or soot particles containing very little organic material (Schnaiter et al., 2003, 2006; Kirchstetter et al., 2004; Bergstrom et al., 2002; You et al., 2016; Sharma et al., 2013).
4.2 Optical properties of BC from the ethylene flat-burner flames
4.2.1 Results from BC2: sampling high above the burner surface
During BC2, the ethylene flame was sampled at a height of ∼ 20.3 cm above the surface. At this height, the particles were likely reasonably mature, at least relative to sampling that was performed further into the flame, as was done in BC3+. Particle optical properties were quantified at λ=405, 532, and 781 nm, with two independent measurements at 532 nm considered (NOAA and PASS-3). As with the methane diffusion flame, the data were fit using Mie theory and the RDG approximation to determine optimal, theory-specific, wavelength-dependent RI values (Table 2). The soot particles from this flame had, overall, a greater amount of intrinsic organic carbon associated with them compared to the particles from the methane diffusion flame. As such, denuding even of the nascent particles led to changes in the optical properties and particle masses. Thus, the nascent and denuded particles are considered separately, and we focus on the denuded particles. The range of particle sizes considered was also overall smaller than that for the methane diffusion flame.
Table 2Theory-specific effective refractive indices for ethylene premixed flame soot from BC2 and BC3+ retrieved via fitting Mie theory and the RDG approximation to the σabs observations. Nascent and denuded experiments are considered separately.
1 Uncertainties in MACs are 1σ from the least χ2 fit. See Figs. S7 and S8. 2 The n values from the RDG method are nonunique. Therefore, uncertainty estimates from this work are not available. See text for details. 3 VED and the size parameter ( where the peak MAC occurs. 4 There are many degenerate RI combinations that give similar quality fit to RDG theory. Thus, a value of 1.80 was chosen for the effective real refractive index. 5 In BC2 the ethylene flat-burner flame was sampled 20.3 cm between the burner surface and the sampling inlet, and during BC3 the flame was sampled ca. 5 cm between the burner surface and the sampling inlet.
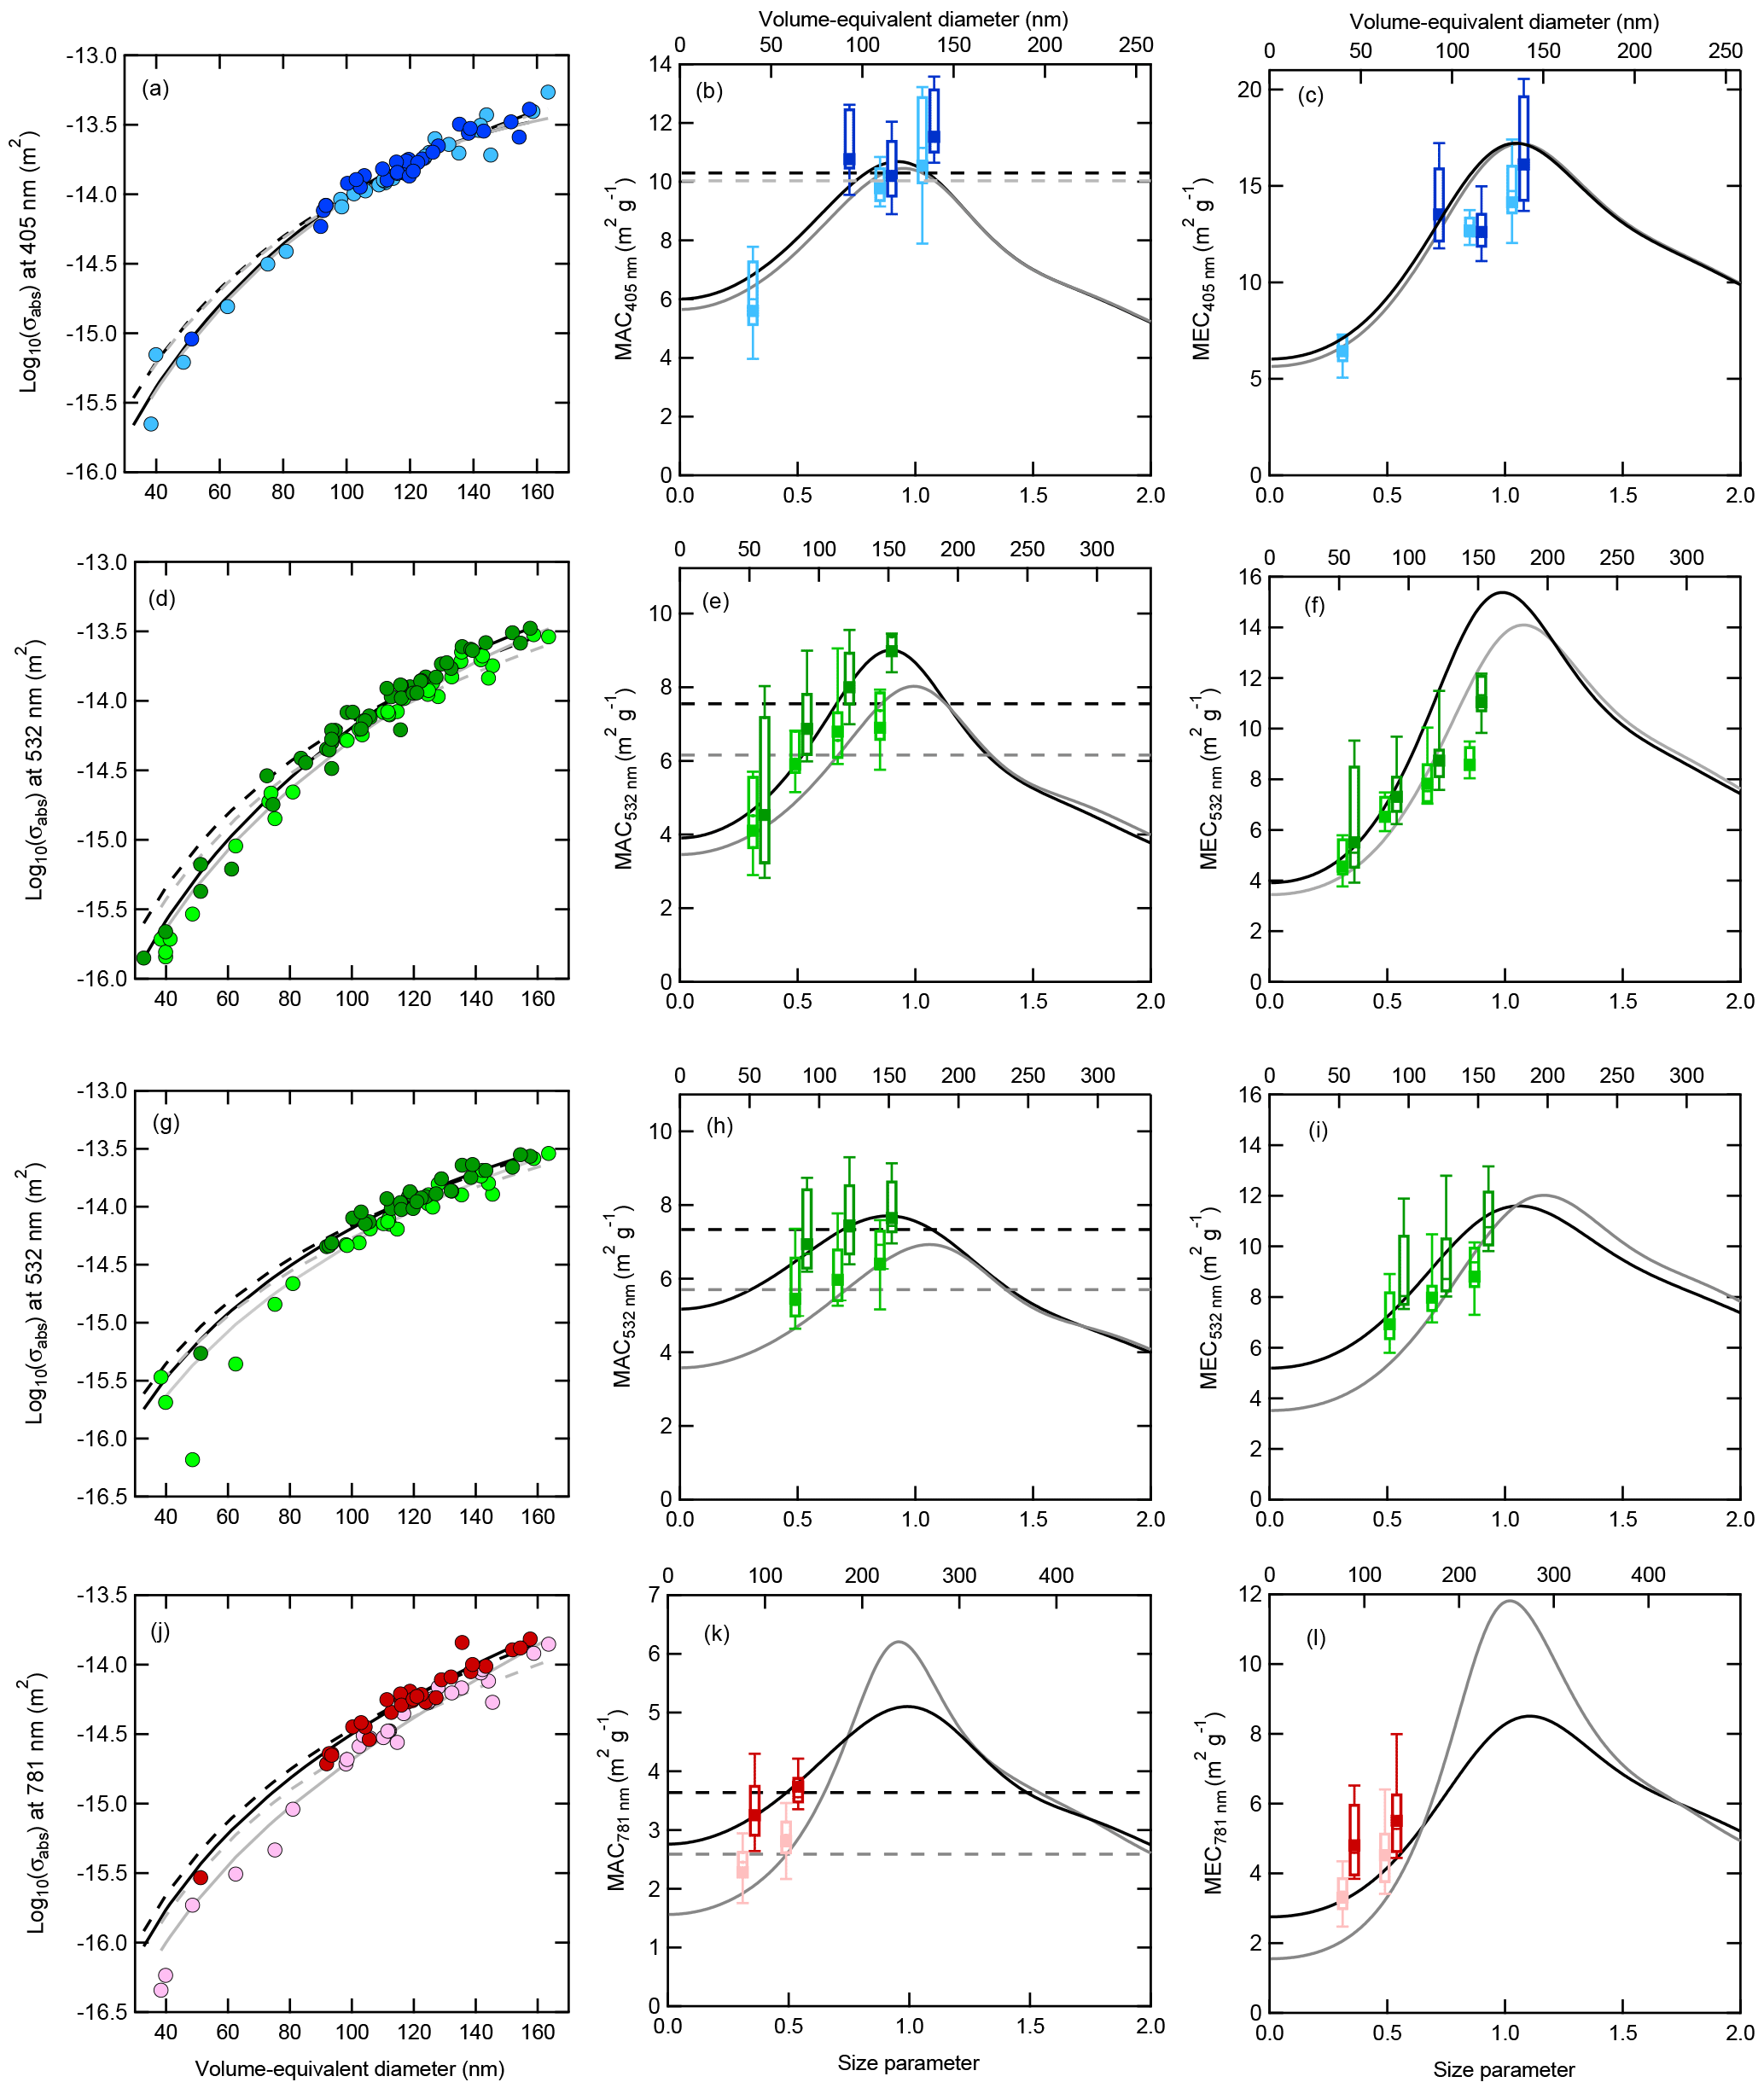
Figure 5Measured absorption cross sections vs. volume-equivalent diameter (panels in the first column) and mass absorption and extinction coefficients (MACs and MECs; panels in the second and third column, respectively) for ethylene soot sampled 20.3 cm from burner surface of the McKenna flame as a function of size parameter () (bottom axes) and volume-equivalent diameter (top axes). for BC2. Panels (a–c) show PASS-3 data at λ=405 nm, (d–f) show NOAA PAS data at λ=532 nm, (g–i) show PASS-3 data at λ=532 nm, and (j–l) show PASS-3 data at λ=781 nm. The dashed black and gray lines are the RDG fits to denuded and nascent data, respectively, and the solid black and gray lines are Mie fits to denuded and nascent data, respectively.
The retrieval of effective refractive indices for this flame using Mie theory resulted in a good fit to σabs vs. dp,VED for all λ and dp,VED (Fig. 5a, d, g, and j, and Figs. S6–S7). This difference from the methane diffusion flame is in large part due to the more restricted size range encountered here, with BC particles only up to dp,VED=160 nm used. The RDG approximation yielded a reasonably good fit across all particle sizes for the ethylene particles, although with some overestimation at smaller sizes. The MAC values tended to increase with particle size or size parameter, most obviously at 532 nm where the most data points are available (Fig. 5b, e, h, and k). The range of binned MACs shown in Fig. 5 is listed in Table S4. The MAC values determined using the two PAS instruments at 532 nm differ somewhat, with the NOAA PAS MACs slightly larger than PASS-3 MACs, although the differences are within the measurement uncertainties. Most likely, this instrument difference stems from differences in calibration methods.

Figure 6Box and whisker plots of (a) single-scattering albedo (SSA) and (b) absorption Ångström exponent (AAE) as a function of size parameter and volume-equivalent diameter produced from the ethylene flame during BC2. The SSA was calculated using data from the NOAA PAS, and the AAE was calculated using data from the λ=405 nm PASS-3 and the λ=532 nm NOAA PAS data. The black points are coated–denuded data (coating material is evaporated following coating with DOS or sulfuric acid) and are potentially collapsed due to coating, and the gray points are nascent–denuded points (evaporation of intrinsic organic matter produced from the ethylene flame). The black lines are the SSAs predicted using spherical particle Mie theory using the effective complex refractive index retrieved from fitting the σabs,532 nm from the NOAA PAS. Here points are binned with a constant Δx=0.18 for the purpose of comparison between the different particle treatments. N=6 for nascent or nascent–denuded points, N=5 for DOS coated–denuded points, and , , and for H2SO4 coated–denuded points.
The observed MAC values tend to be larger for the denuded particles than for the nascent particles, most likely due to less-absorbing organics present in nascent soot that contribute ∼25 % of the particle mass (Cross et al., 2010). The MAC values at λ=405 and 532 nm for the denuded BC2 ethylene flame soot are comparable, within uncertainty, to the MAC values for the methane diffusion flame soot for the particles with dp,VED∼150 nm. This indicates that the BC from these two flames is similarly absorbing in nature.
The impact of particle morphology on the SSA and AAE is considered by comparing the results for nascent–denuded particles with coated–denuded particles (Fig. 6). Nascent particles are excluded because the presence of intrinsic organics can increase AAE if the organic material contains brown carbon and can increase the SSA independent of the underlying BC morphology. The Df,m values were 2.12±0.06, 2.49±0.07, and 2.17±0.06 for nascent–denuded, sulfuric acid coated–denuded, and DOS coated–denuded soot, respectively (Cross et al., 2010). The nascent–denuded and DOS coated–denuded particles have SSA values close to 0, whereas the sulfuric acid coated–denuded particles have SSA values closer to 0.15 at x>0.5, consistent with particle collapse leading to an increase in SSA (Fig. 6a). The SSA values for the nascent–denuded particles from this flame are smaller than the SSA values for the nascent particles from the methane diffusion flame. The reason for this is not clear but is likely related to differences in the particle shapes and/or the sizes of the spherules; the Df,m for the nascent–denuded particles here (Df,m=2.12) is slightly smaller than for the particles from the methane diffusion flame (Df,m=2.28) (Fig. S8). The sulfuric acid coated–denuded particle SSA values from the BC2 ethylene flame are also lower than the methane diffusion flame coated–denuded SSA values for a given size (Fig. 6a), despite having similar Df,m values.
The AAE values (using the λ=405 and 532 nm pair) for nascent–denuded and coated–denuded particles are generally similar when compared over the same size range (Fig. 6b). However, the sulfuric acid coated–denuded particle AAE values may be slightly smaller than for the nascent–denuded or DOS coated–denuded particles; all are close to unity at x∼0.8. This indicates that changes in morphology do not lead to substantial changes in AAE. The AAEs for the coated–denuded particles decrease strongly with dp,VED, with the mean AAE ∼ 1.6 for the smallest particles (x=0.5) and an AAE mean of ∼0.5 for the largest particles (x=0.9). Values below 1 contrast with the methane data but have been observed in a few previous studies (Clarke et al., 2007; Hadley et al., 2008; Lack et al., 2008). While such a decrease with size is consistent with Mie theory predictions, given the MAC results, it seems more likely that the size dependence of the AAE is related to changes in the soot maturity with particle size. To the extent that the larger particles, which tend to have larger MAC values, are reflective of more mature soot, this suggests that mature soot from this flame type has an AAE < 1.
4.2.2 Results from BC3+: sampling near the burner surface
During BC3+, the particles were sampled at variable heights above the burner surface to select for particles in different size ranges, but most often they were sampled from relatively close to the burner surface (5.1 cm) compared to BC2 sampling conditions (20.3 cm). It is likely that these different sampling conditions gave rise to particles with different chemical properties. Multiple studies have shown changes in soot maturity and soot optical properties as a function of sampling height in ethylene premixed flames, though at a distance significantly closer to the flame front than sampled here (Olofsson et al., 2015; Migliorini et al., 2011). The particles during BC3+ had very little, if any, intrinsic organic carbon, unlike the BC2 particles that were ∼25 % organic by mass. However, the small organic content for BC3+ was likely a consequence of the use of a hot sampling line prior to dilution. Consequently, the optical properties of both nascent and denuded ethylene soot particles from BC3+ (sampled close to the burner) differ substantially from the BC2 particles (sampled well above the burner). Average MAC values over various size ranges are listed in Table S5. In general, the MACs for BC3+ ethylene particles are similar to BC2 particles at λ=405 nm, whereas the λ=532 nm MAC for BC3+ particles are smaller than those for BC2 particles. (Measurements at λ=30 nm were not made during BC2, nor were measurements at 781 nm made during BC3+.) At dp,VED>70 nm, the λ=405 nm MAC values were approximately constant with increasing dp,VED (Fig. S9). The behavior is consistent with methane diffusion flame observations, but the constant MAC seems to occur at a lower dp,VED.The number of data points available for the BC3+ ethylene particles is limited, making conclusions regarding the size dependence of properties somewhat tenuous. The AAE for BC3+ ethylene particles are reasonably independent of particle size (Fig. S10). The average value of AAE for x>0.5, which is higher than observed for the methane diffusion flame for this range of x (). These observations indicate that differences in sampling and soot maturity result in different optical properties. Previous studies have observed differences in optical properties, chemical composition, and primary spherule size for different flame sampling heights (Bladh et al., 2011; Olofsson et al., 2015; Migliorini et al., 2011). Absorption by less mature soot appears to decrease more rapidly with wavelength than for more mature soot, such that the MAC values in the mid-visible (e.g., λ=532 and 630 nm) are lower for less mature soot. These wavelength-dependent optical results appear to match trends observed previously using active remote-sensing techniques to characterize particles within flames (Olofsson et al., 2015; Migliorini et al., 2011). The extent to which this conclusion can be generalized will require further investigation.
Light absorption and extinction cross sections were measured for nascent, denuded, and coated–denuded soot particles that were produced from two different flame types that operated on different fuels (methane or ethylene). These measurements were used in conjunction with particle mass and size measurements to determine various intensive optical properties (e.g., MAC, SSA, and AAE) for uncoated BC particles in the size range 50 nm nm (corresponding to 0.1 fg 5 fg). The optical properties varied somewhat with particle size, most likely due to changes in the chemical nature (i.e., maturity) of the BC that results from variations in the combustion and sampling conditions. However, for larger, mature particles, corresponding to those with nm, the observed intensive properties were generally size-independent. The observed MAC values for BC, measured over multiple studies, are independent of particle collapse and thus provide evidence that absorption by soot of a given maturity level is dictated primarily by the individual spherules and is thus largely size- and shape-independent. The observed MAC values are also larger than the recommended value of Bond and Bergstrom (2006), i.e., 8.6 m2 g−1 vs. 7.75 m2 g−1 at 532 nm.
The observations serve as the basis for the determination of wavelength- and theory-specific effective complex refractive indices, using both Mie theory and the RDG approximation. With Mie theory, good fits were only obtained for size parameters smaller than ∼0.90 (corresponding to dp,VED∼160 nm for λ=532 nm). Above this size, Mie theory predicts a sharp decrease in the MAC while the observed MAC are constant. Thus, Mie theory systematically underpredicts the observed absorption for x>0.9, and a good fit is not possible. This is because with Mie theory when the particles are sufficiently absorbing and large, light is attenuated by the outer layers of the (spherical) particle such that the mass in the center of the particle does not interact efficiently with the electromagnetic field (Bond and Bergstrom, 2006; Kahnert and Devasthale, 2011).
Our analysis has important implications for the calculation of absorption in atmospheric models. Atmospheric models that use Mie theory, which is the majority, likely underestimate the actual absorption by uncoated BC whether or not theory-specific RI values are used; the magnitude of the underestimation will depend on the assumed BC size distributions, increasing with increasing dp,VED and size distribution width. This may be especially important to consider for the simulation of absorption by BC particles from biomass burning, which are larger than those from urban sources (Schwarz et al., 2008). The underestimate of absorption by Mie theory will likely be even larger if non-theory-specific RI values that inherently underestimate MAC values are used, which includes some of the more commonly used RI values.
Overall, our results demonstrate that either an assumption of a constant MAC or the use of the RDG approximation with theory-specific RI values (which are equivalent) in atmospheric models are likely to provide for a more accurate representation of absolute absorption by uncoated BC than does Mie theory. Further work will be necessary to understand how these results for uncoated BC will impact calculations of absorption by coated BC, for which absorption can be enhanced. However, our results suggest that the absolute absorption by coated particles will be similarly underestimated if core-shell Mie theory is used, regardless of the accuracy of the absorption enhancement calculation.
The data associated with this paper are archived at the UC Davis DASH data repository and are available for download from https://doi.org/10.25338/B8JP4V (Forestieri and Cappa, 2018).
The supplement related to this article is available online at: https://doi.org/10.5194/acp-18-12141-2018-supplement.
SDF and CDC led the analysis. TBO and PD conceived the overall project, with contributions from CDC, ATL, and others on experimental design. All coauthors contributed to data collection and/or processing. SDF and CDC prepared the paper with particular input from TBO and contributions from all coauthors.
The authors declare that they have no conflict of interest.
The BC2 study was supported by the US Department of Energy (DOE) grant no.
DE-FG02-05ER63995 and the Atmospheric Chemistry Program of the National
Science Foundation grants no. ATM-0525355. The BC3 and BC3+ studies were
supported by the DOE ASR program grant DE-SC0006980, the EPA STAR Program
grant R835033, and the NSF grant ATM-0854916. The BC4 study was supported by
DOE grant DE-SC0011935 and the NSF grants AGS-1244918 (Boston College) and
AGS-1244999 (Aerodyne), and the participation of the SP2 was made possible by
DOE. LANL thanks the US Department of Energy's Atmospheric System Research, an
Office of Science, Office of Biological and Environmental Research program
for funding.
Edited by: Delphine
Farmer
Reviewed by: three anonymous referees
Bergstrom, R. W.: Extinction and absorption coefficients of the atmospheric aerosol as a function of particle size, Contrib. Atmos. Phys., 46, 223–234, 1973.
Bergstrom, R. W., Russell, P. B., and Hignett, P.: Wavelength dependence of the absorption of black carbon particles: Predictions and results from the TARFOX experiment and implications for the aerosol single scattering albedo, J. Atmos. Sci., 59, 567–577, https://doi.org/10.1175/1520-0469(2002)059<0567:wdotao>2.0.co;2, 2002.
Bhandari, J., China, S., Onasch, T., Wolff, L., Lambe, A., Davidovits, P., Cross, E., Ahern, A., Olfert, J., Dubey, M., and Mazzoleni, C.: Effect of Thermodenuding on the Structure of Nascent Flame Soot Aggregates, Atmosphere, 8, 166, https://doi.org/10.3390/atmos8090166, 2017.
Bladh, H., Johnsson, J., Olofsson, N. E., Bohlin, A., and Bengtsson, P. E.: Optical soot characterization using two-color laser-induced incandescence (2C-LII) in the soot growth region of a premixed flat flame, Proc. Combust. Inst., 33, 641–648, https://doi.org/10.1016/j.proci.2010.06.166, 2011.
Bohren, C. F. and Huffman, D. R.: Absorption and scattering of light by small particles, Wiley, New York, 1983.
Bond, T. C. and Bergstrom, R. W.: Light Absorption by Carbonaceous Particles: An Investigative Review, Aerosol Sci. Tech., 40, 27–67, https://doi.org/10.1080/02786820500421521, 2006.
Bond, T. C., Doherty, S. J., Fahey, D. W., Forster, P. M., Berntsen, T., DeAngelo, B. J., Flanner, M. G., Ghan, S., Kärcher, B., Koch, D., Kinne, S., Kondo, Y., Quinn, P. K., Sarofim, M. C., Schultz, M. G., Schulz, M., Venkataraman, C., Zhang, H., Zhang, S., Bellouin, N., Guttikunda, S. K., Hopke, P. K., Jacobson, M. Z., Kaiser, J. W., Klimont, Z., Lohmann, U., Schwarz, J. P., Shindell, D., Storelvmo, T., Warren, S. G., and Zender, C. S.: Bounding the role of black carbon in the climate system: A scientific assessment, J. Geophys. Res.-Atmos., 118, 5380–5552, https://doi.org/10.1002/jgrd.50171, 2013.
Boucher, O., Randall, D., Artaxo, P., Bretherton, C., Feingold, G., Forster, P., Kerminen, V.-M., Kondo, Y., Liao, H., Lohmann, U., Rasch, P., Satheesh, S. K., Sherwood, S., Stevens, B., and Zhang, X. Y.: Clouds and Aerosols, in: Climate Change 2013: The Physical Science Basis, Contribution of Working Group I to the Fifth Assessment Report of the Intergovernmental Panel on Climate Change, edited by: Stocker, T. F., Qin, D., Plattner, G.-K., Tignor, M., Allen, S. K., Boschung, J., Nauels, A., Xia, Y., Bex, V., and Midgley, P. M., Cambridge University Press, Cambridge, UK, New York, NY, USA, 571–658, 2013.
Canagaratna, M. R., Jayne, J. T., Jimenez, J. L., Allan, J. D., Alfarra, M. R., Zhang, Q., Onasch, T. B., Drewnick, F., Coe, H., Middlebrook, A., Delia, A., Williams, L. R., Trimborn, A. M., Northway, M. J., DeCarlo, P. F., Kolb, C. E., Davidovits, P., and Worsnop, D. R.: Chemical and microphysical characterization of ambient aerosols with the aerodyne aerosol mass spectrometer, Mass Spectrom. Rev., 26, 185–222, https://doi.org/10.1002/mas.20115, 2007.
Cappa, C. D. and Wilson, K. R.: Evolution of organic aerosol mass spectra upon heating: implications for OA phase and partitioning behavior, Atmos. Chem. Phys., 11, 1895–1911, https://doi.org/10.5194/acp-11-1895-2011, 2011.
Cappa, C. D., Onasch, T. B., Massoli, P., Worsnop, D. R., Bates, T. S., Cross, E. S., Davidovits, P., Hakala, J., Hayden, K. L., Jobson, B. T., Kolesar, K. R., Lack, D. A., Lerner, B. M., Li, S.-M., Mellon, D., Nuaaman, I., Olfert, J. S., Petäjä, T., Quinn, P. K., Song, C., Subramanian, R., Williams, E. J., and Zaveri, R. A.: Radiative Absorption Enhancements Due to the Mixing State of Atmospheric Black Carbon, Science, 337, 1078–1081, https://doi.org/10.1126/science.1223447, 2012.
China, S., Kulkarni, G., Scarnato, B. V., Sharma, N., Pekour, M., Shilling, J. E., Wilson, J., Zelenyuk, A., Chand, D., and Liu, S.: Morphology of diesel soot residuals from supercooled water droplets and ice crystals: implications for optical properties, Environ. Res. Lett., 10, 114010, https://doi.org/10.1088/1748-9326/10/11/114010, 2015a.
China, S., Scarnato, B., Owen, R. C., Zhang, B., Ampadu, M. T., Kumar, S., Dzepina, K., Dziobak, M. P., Fialho, P., Perlinger, J. A., Hueber, J., Helmig, D., Mazzoleni, L. R., and Mazzoleni, C.: Morphology and mixing state of aged soot particles at a remote marine free troposphere site: Implications for optical properties, Geophys. Res. Lett., 42, 1243–1250, https://doi.org/10.1002/2014GL062404, 2015b.
Chow, J. C., Watson, J. G., Chen, L.-W. A., Arnott, W. P., Moosmüller, H., and Fung, K.: Equivalence of elemental carbon by thermal/optical reflectance and transmittance with different temperature protocols, Environ. Sci. Technol., 38, 4414–4422, https://doi.org/10.1021/es034936u, 2004.
Clarke, A., McNaughton, C., Kapustin, V., Shinozuka, Y., Howell, S., Dibb, J., Zhou, J., Anderson, B., Brekhovskikh, V., Turner, H., and Pinkerton, M.: Biomass burning and pollution aerosol over North America: Organic components and their influence on spectral optical properties and humidification response, J. Geophys. Res.-Atmos., 112, D12S18, https://doi.org/10.1029/2006jd007777, 2007.
Cross, E. S., Onasch, T. B., Ahern, A., Wrobel, W., Slowik, J. G., Olfert, J., Lack, D. A., Massoli, P., Cappa, C. D., Schwarz, J. P., Spackman, J. R., Fahey, D. W., Sedlacek, A., Trimborn, A., Jayne, J. T., Freedman, A., Williams, L. R., Ng, N. L., Mazzoleni, C., Dubey, M., Brem, B., Kok, G., Subramanian, R., Freitag, S., Clarke, A., Thornhill, D., Marr, L. C., Kolb, C. E., Worsnop, D. R., and Davidovits, P.: Soot Particle Studies – Instrument Inter-Comparison – Project Overview, Aerosol Sci. Technol., 44, 592–611, https://doi.org/10.1080/02786826.2010.482113, 2010.
Dastanpour, R., Momenimovahed, A., Thomson, K., Olfert, J., and Rogak, S.: Variation of the optical properties of soot as a function of particle mass, Carbon, 124, 201–211, https://doi.org/10.1016/j.carbon.2017.07.005, 2017.
Flowers, B. A., Dubey, M. K., Mazzoleni, C., Stone, E. A., Schauer, J. J., Kim, S.-W., and Yoon, S. C.: Optical-chemical-microphysical relationships and closure studies for mixed carbonaceous aerosols observed at Jeju Island; 3-laser photoacoustic spectrometer, particle sizing, and filter analysis, Atmos. Chem. Phys., 10, 10387–10398, https://doi.org/10.5194/acp-10-10387-2010, 2010.
Forestieri, S. and Cappa, C.: Measurement and modeling of the multi-wavelength optical properties of uncoated flame-generated soot: Data from the BC2, BC3, BC3+ and BC4 studies, UC Davis Dash, Dataset, https://doi.org/10.25338/B8JP4V, 2018.
Ghazi, R., Tjong, H., Soewono, A., Rogak, S. N., and Olfert, J. S.: Mass, Mobility, Volatility, and Morphology of Soot Particles Generated by a McKenna and Inverted Burner, Aerosol Sci. Technol., 47, 395–405, https://doi.org/10.1080/02786826.2012.755259, 2013.
Hadley, O. L., Corrigan, C. E., and Kirchstetter, T. W.: Modified Thermal-Optical Analysis Using Spectral Absorption Selectivity To Distinguish Black Carbon from Pyrolized Organic Carbon, Environ. Sci. Technol., 42, 8459–8464, https://doi.org/10.1021/es800448n, 2008.
Hess, M., Koepke, P., and Schult, I.: Optical Properties of Aerosols and Clouds: The Software Package OPAC, B. Am. Meteorol. Soc., 79, 831–844, https://doi.org/10.1175/1520-0477(1998)079<0831:opoaac>2.0.co;2, 1998.
Hopkins, R. J., Tivanski, A. V., Marten, B. D., and Gilles, M. K.: Chemical bonding and structure of black carbon reference materials and individual carbonaceous atmospheric aerosols, J. Aerosol Sci., 38, 573–591, https://doi.org/10.1016/j.jaerosci.2007.03.009, 2007.
Huffman, J. A., Ziemann, P. J., Jayne, J. T., Worsnop, D. R., and Jimenez, J. L.: Development and characterization of a fast-stepping/scanning thermodenuder for chemically-resolved aerosol volatility measurements, Aerosol Sci. Technol., 42, 395–407, https://doi.org/10.1080/02786820802104981, 2008.
Johansson, K. O., El Gabaly, F., Schrader, P. E., Campbell, M. F., and Michelsen, H. A.: Evolution of maturity levels of the particle surface and bulk during soot growth and oxidation in a flame, Aerosol Sci. Technol., 51, 1333–1344, https://doi.org/10.1080/02786826.2017.1355047, 2017.
Kahnert, M. and Devasthale, A.: Black carbon fractal morphology and short-wave radiative impact: a modelling study, Atmos. Chem. Phys., 11, 11745–11759, https://doi.org/10.5194/acp-11-11745-2011, 2011.
Khalizov, A. F., Xue, H., Wang, L., Zheng, J., and Zhang, R.: Enhanced Light Absorption and Scattering by Carbon Soot Aerosol Internally Mixed with Sulfuric Acid, J. Phys. Chem. A, 113, 1066–1074, https://doi.org/10.1021/jp807531n, 2009.
Kirchstetter, T. W., Novakov, T., and Hobbs, P. V.: Evidence that the spectral dependence of light absorption by aerosols is affected by organic carbon, J. Geophys. Res.-Atmos., 109, D21208, https://doi.org/10.1029/2004jd004999, 2004.
Laborde, M., Mertes, P., Zieger, P., Dommen, J., Baltensperger, U., and Gysel, M.: Sensitivity of the Single Particle Soot Photometer to different black carbon types, Atmos. Meas. Tech., 5, 1031–1043, https://doi.org/10.5194/amt-5-1031-2012, 2012.
Lack, D. A., Lovejoy, E. R., Baynard, T., Pettersson, A., and Ravishankara, A. R.: Aerosol absorption measurement using photoacoustic spectroscopy: Sensitivity, calibration, and uncertainty developments, Aerosol Sci. Technol., 40, 697–708, https://doi.org/10.1080/02786820600803917, 2006.
Lack, D. A., Cappa, C. D., Covert, D. S., Baynard, T., Massoli, P., Sierau, B., Bates, T. S., Quinn, P. K., Lovejoy, E. R., and Ravishankara, A. R.: Bias in filter-based aerosol light absorption measurements due to organic aerosol loading: Evidence from ambient measurements, Aerosol Sci. Technol., 42, 1033–1041, https://doi.org/10.1080/02786820802389277, 2008.
Lack, D. A., Richardson, M. S., Law, D., Langridge, J. M., Cappa, C. D., McLaughlin, R. J., and Murphy, D. M.: Aircraft Instrument for Comprehensive Characterization of Aerosol Optical Properties, Part 2: Black and Brown Carbon Absorption and Absorption Enhancement Measured with Photo Acoustic Spectroscopy, Aerosol Sci. Technol., 46, 555–568, https://doi.org/10.1080/02786826.2011.645955, 2011.
Lambe, A. T., Ahern, A. T., Williams, L. R., Slowik, J. G., Wong, J. P. S., Abbatt, J. P. D., Brune, W. H., Ng, N. L., Wright, J. P., Croasdale, D. R., Worsnop, D. R., Davidovits, P., and Onasch, T. B.: Characterization of aerosol photooxidation flow reactors: heterogeneous oxidation, secondary organic aerosol formation and cloud condensation nuclei activity measurements, Atmos. Meas. Tech., 4, 445–461, https://doi.org/10.5194/amt-4-445-2011, 2011.
Langridge, J. M., Richardson, M. S., Lack, D., Law, D., and Murphy, D. M.: Aircraft Instrument for Comprehensive Characterization of Aerosol Optical Properties, Part I: Wavelength-Dependent Optical Extinction and Its Relative Humidity Dependence Measured Using Cavity Ringdown Spectroscopy, Aerosol Sci. Technol., 45, 1305–1318, https://doi.org/10.1080/02786826.2011.592745, 2011.
Lohmann, U. and Feichter, J.: Global indirect aerosol effects: a review, Atmos. Chem. Phys., 5, 715–737, https://doi.org/10.5194/acp-5-715-2005, 2005.
López-Yglesias, X., Schrader, P. E., and Michelsen, H. A.: Soot maturity and absorption cross sections, J. Aerosol Sci., 75, 43–64, https://doi.org/10.1016/j.jaerosci.2014.04.011, 2014.
Mackowski, D. W. and Mishchenko, M. I.: Calculation of the T matrix and the scattering matrix for ensembles of spheres, J. Opt. Soc. Am. A, 13, 2266–2278, https://doi.org/10.1364/josaa.13.002266, 1996.
Massoli, P., Kebabian, P. L., Onasch, T. B., Hills, F. B., and Freedman, A.: Aerosol Light Extinction Measurements by Cavity Attenuated Phase Shift (CAPS) Spectroscopy: Laboratory Validation and Field Deployment of a Compact Aerosol Particle Extinction Monitor, Aerosol Sci. Technol., 44, 428–435, https://doi.org/10.1080/02786821003716599, 2010.
Medalia, A. I. and Heckman, F. A.: Morphology of aggregates – II. Size and shape factors of carbon black aggregates from electron microscopy, Carbon, 7, 567–582, https://doi.org/10.1016/0008-6223(69)90029-3, 1969.
Migliorini, F., Thomson, K., and Smallwood, G.: Investigation of optical properties of aging soot, Appl. Phys. B-Lasers O, 104, 273–283, https://doi.org/10.1007/s00340-011-4396-4, 2011.
Mullins, J. and Williams, A.: The optical properties of soot: a comparison between experimental and theoretical values, Fuel, 66, 277–280, https://doi.org/10.1016/0016-2361(87)90255-9, 1987.
Olofsson, N.-E., Simonsson, J., Török, S., Bladh, H., and Bengtsson, P.-E.: Evolution of properties for aging soot in premixed flat flames studied by laser-induced incandescence and elastic light scattering, Appl. Phys. B, 119, 669–683, https://doi.org/10.1007/s00340-015-6067-3, 2015.
Onasch, T. B., Trimborn, A., Fortner, E. C., Jayne, J. T., Kok, G. L., Williams, L. R., Davidovits, P., and Worsnop, D. R.: Soot Particle Aerosol Mass Spectrometer: Development, Validation, and Initial Application, Aerosol Sci. Technol., 46, 804–817, https://doi.org/10.1080/02786826.2012.663948, 2012.
Onasch, T. B., Fortner, E. C., Trimborn, A. M., Lambe, A. T., Tiwari, A. J., Marr, L. C., Corbin, J. C., Mensah, A. A., Williams, L. R., Davidovits, P., and Worsnop, D. R.: Investigations of SP-AMS Carbon Ion Distributions as a Function of Refractory Black Carbon Particle Type, Aerosol Sci. Technol., 49, 409–422, https://doi.org/10.1080/02786826.2015.1039959, 2015a.
Onasch, T. B., Massoli, P., Kebabian, P. L., Hills, F. B., Bacon, F. W., and Freedman, A.: Single Scattering Albedo Monitor for Airborne Particulates, Aerosol Sci. Technol., 49, 267–279, https://doi.org/10.1080/02786826.2015.1022248, 2015b.
Park, K., Cao, F., Kittelson, D. B., and McMurry, P. H.: Relationship between Particle Mass and Mobility for Diesel Exhaust Particles, Environ. Sci. Technol., 37, 577–583, https://doi.org/10.1021/es025960v, 2003.
Purcell, E. M. and Pennypacker, C. R.: Scattering and absorption of light by nonspherical dielectric grains, Astrophys. J., 186, 705–714, https://doi.org/10.1086/152538, 1973.
Radney, J. G., You, R., Ma, X., Conny, J. M., Zachariah, M. R., Hodges, J. T., and Zangmeister, C. D.: Dependence of Soot Optical Properties on Particle Morphology: Measurements and Model Comparisons, Environ. Sci. Technol., 48, 3169–3176, https://doi.org/10.1021/es4041804, 2014.
Ramanathan, V. and Carmichael, G.: Global and regional climate changes due to black carbon, Nat. Geosci., 1, 221–227, https://doi.org/10.1038/ngeo156, 2008.
Saliba, G., Subramanian, R., Saleh, R., Ahern, A. T., Lipsky, E. M., Tasoglou, A., Sullivan, R. C., Bhandari, J., Mazzoleni, C., and Robinson, A. L.: Optical properties of black carbon in cookstove emissions coated with secondary organic aerosols: Measurements and modeling, Aerosol Sci. Technol., 50, 1264–1276, https://doi.org/10.1080/02786826.2016.1225947, 2016.
Scarnato, B. V., Vahidinia, S., Richard, D. T., and Kirchstetter, T. W.: Effects of internal mixing and aggregate morphology on optical properties of black carbon using a discrete dipole approximation model, Atmos. Chem. Phys., 13, 5089–5101, https://doi.org/10.5194/acp-13-5089-2013, 2013.
Schnaiter, M., Horvath, H., Mohler, O., Naumann, K. H., Saathoff, H., and Schock, O. W.: UV-VIS-NIR spectral optical properties of soot and soot-containing aerosols, J. Aerosol Sci., 34, 1421–1444, https://doi.org/10.1016/s0021-8502(03)00361-6, 2003.
Schnaiter, M., Gimmler, M., Llamas, I., Linke, C., Jäger, C., and Mutschke, H.: Strong spectral dependence of light absorption by organic carbon particles formed by propane combustion, Atmos. Chem. Phys., 6, 2981–2990, https://doi.org/10.5194/acp-6-2981-2006, 2006.
Schwarz, J. P., Gao, R. S., Spackman, J. R., Watts, L. A., Thomson, D. S., Fahey, D. W., Ryerson, T. B., Peischl, J., Holloway, J. S., Trainer, M., Frost, G. J., Baynard, T., Lack, D. A., de Gouw, J. A., Warneke, C., and Del Negro, L. A.: Measurement of the mixing state, mass, and optical size of individual black carbon particles in urban and biomass burning emissions, Geophys. Res. Lett., 35, L13810, https://doi.org/10.1029/2008GL033968, 2008.
Sharma, N., Arnold, I. J., Moosmüller, H., Arnott, W. P., and Mazzoleni, C.: Photoacoustic and nephelometric spectroscopy of aerosol optical properties with a supercontinuum light source, Atmos. Meas. Tech., 6, 3501–3513, https://doi.org/10.5194/amt-6-3501-2013, 2013.
Slowik, J. G., Cross, E. S., Han, J.-H., Davidovits, P., Onasch, T. B., Jayne, J. T., Williams, L. R., Canagaratna, M. R., Worsnop, D. R., Chakrabarty, R. K., Moosmueller, H., Arnott, W. P., Schwarz, J. P., Gao, R.-S., Fahey, D. W., Kok, G. L., and Petzold, A.: An inter-comparison of instruments measuring black carbon content of soot particles, Aerosol Sci. Technol., 41, 295–314, https://doi.org/10.1080/02786820701197078, 2007.
Sorensen, C. M.: Light Scattering by Fractal Aggregates: A Review, Aerosol Sci. Technol., 35, 648–687, https://doi.org/10.1080/02786820117868, 2001.
Sorensen, C. M.: The Mobility of Fractal Aggregates: A Review, Aerosol Sci. Technol., 45, 765–779, https://doi.org/10.1080/02786826.2011.560909, 2011.
Stier, P., Seinfeld, J. H., Kinne, S., and Boucher, O.: Aerosol absorption and radiative forcing, Atmos. Chem. Phys., 7, 5237–5261, https://doi.org/10.5194/acp-7-5237-2007, 2007.
Stipe, C. B., Higgins, B. S., Lucas, D., Koshland, C. P., and Sawyer, R. F.: Inverted co-flow diffusion flame for producing soot, Rev. Sci. Instrum., 76, 023908, https://doi.org/10.1063/1.1851492, 2005.
Wang, R., Balkanski, Y., Boucher, O., Ciais, P., Schuster, G. L., Chevallier, F., Samset, B. H., Liu, J., Piao, S., Valari, M., and Tao, S.: Estimation of global black carbon direct radiative forcing and its uncertainty constrained by observations, J. Geophys. Res.-Atmos., 121, 5948–5971, https://doi.org/10.1002/2015JD024326, 2016.
Wu, J.-S., Krishnan, S., and Faeth, G.: Refractive indices at visible wavelengths of soot emitted from buoyant turbulent diffusion flames, J. Heat Transf., 119, 230–237, https://doi.org/10.1115/1.2824213, 1997.
You, R., Radney, J. G., Zachariah, M. R., and Zangmeister, C. D.: Measured Wavelength-Dependent Absorption Enhancement of Internally Mixed Black Carbon with Absorbing and Nonabsorbing Materials, Environ. Sci. Technol., 50, 7982–7990, https://doi.org/10.1021/acs.est.6b01473, 2016.
Zhang, R., Khalizov, A. F., Pagels, J., Zhang, D., Xue, H., and McMurry, P. H.: Variability in morphology, hygroscopicity, and optical properties of soot aerosols during atmospheric processing, P. Natl. Acad. Sci. USA, 105, 10291–10296, https://doi.org/10.1073/pnas.0804860105, 2008.