the Creative Commons Attribution 4.0 License.
the Creative Commons Attribution 4.0 License.
 | 15 Aug 2018
Characterization of aerosol composition, aerosol acidity, and organic acid partitioning at an agriculturally intensive rural southeastern US site
Theodora Nah
Hongyu Guo
Amy P. Sullivan
Yunle Chen
David J. Tanner
Athanasios Nenes
Armistead Russell
Nga Lee Ng
L. Gregory Huey
The implementation of stringent emission regulations has resulted in the decline of anthropogenic pollutants including sulfur dioxide (SO2), nitrogen oxides (NOx), and carbon monoxide (CO). In contrast, ammonia (NH3) emissions are largely unregulated, with emissions projected to increase in the future. We present real-time aerosol and gas measurements from a field study conducted in an agriculturally intensive region in the southeastern US during the fall of 2016 to investigate how NH3 affects particle acidity and secondary organic aerosol (SOA) formation via the gas–particle partitioning of semi-volatile organic acids. Particle water and pH were determined using the ISORROPIA II thermodynamic model and validated by comparing predicted inorganic HNO3- and NH3- gas–particle partitioning ratios with measured values. Our results showed that despite the high NH3 concentrations (average 8.1±5.2 ppb), PM1 was highly acidic with pH values ranging from 0.9 to 3.8, and an average pH of 2.2±0.6. PM1 pH varied by approximately 1.4 units diurnally. Formic and acetic acids were the most abundant gas-phase organic acids, and oxalate was the most abundant particle-phase water-soluble organic acid anion. Measured particle-phase water-soluble organic acids were on average 6 % of the total non-refractory PM1 organic aerosol mass. The measured molar fraction of oxalic acid in the particle phase (i.e., particle-phase oxalic acid molar concentration divided by the total oxalic acid molar concentration) ranged between 47 % and 90 % for a PM1 pH of 1.2 to 3.4. The measured oxalic acid gas–particle partitioning ratios were in good agreement with their corresponding thermodynamic predictions, calculated based on oxalic acid's physicochemical properties, ambient temperature, particle water, and pH. In contrast, gas–particle partitioning ratios of formic and acetic acids were not well predicted for reasons currently unknown. For this study, higher NH3 concentrations relative to what has been measured in the region in previous studies had minor effects on PM1 organic acids and their influence on the overall organic aerosol and PM1 mass concentrations.
- Article
(1774 KB) - Full-text XML
-
Supplement
(5067 KB) - BibTeX
- EndNote


Ammonia (NH3) is the most abundant basic gas in the troposphere and plays an important role in many atmospheric processes. It is a major neutralizer of atmospheric acidic species, reacting readily with sulfuric acid (H2SO4) and nitric acid (HNO3) to form ammonium sulfate and nitrate salts (e.g., (NH4)2SO4, and other forms such as NH4HSO4, (NH4)3H(SO4)2, and NH4NO3), which are often the main inorganic components of atmospheric aerosols. The formation of particle-phase ammonium sulfate and nitrate salts in the aerosol phase depends on the thermodynamic states of their precursors and the environmental conditions, which can consequently affect aerosol pH. For example, Guo et al. (2017b) showed that for southeastern US summertime conditions, as aerosol pH increases, the relative fractions of and increase and decrease, respectively. Wet and dry deposition are the principle NH3 sinks (Dentener and Crutzen, 1994). NH3 is spatially heterogeneous, with the highest concentrations typically found near emission sources (Seinfeld and Pandis, 2016). The dominant NH3 sources in rural areas are agricultural in nature, and include the application of fertilizers and volatilization of livestock waste (Reis et al., 2009; Ellis et al., 2013; Van Damme et al., 2014). Biomass burning, either from wildfires or from controlled burning during land-clearing operations, is also a significant source of NH3 in rural environments. The primary source of NH3 in urban areas is industrial emissions (e.g., NH3 synthesis, manufacture of ammonium nitrate and urea, fluid, and thermal catalytic cracking processes in petroleum refineries), though vehicular emissions can be a significant NH3 source in some heavily populated cities (Reis et al., 2009; Lamarque et al., 2010; Yao et al., 2013; Sun et al., 2017). Vehicular NH3 emissions are thought to be produced primarily from the reaction of nitrogen oxide with hydrogen in the presence of carbon monoxide in three-way catalysts of gasoline light-duty vehicles (Barbier Jr. and Duprez, 1994; Whittington et al., 1995; Livingston et al., 2009; Suarez-Bertoa et al., 2014).
In the US, implementation of stringent emission controls on traditional anthropogenic air pollutants, such as sulfur dioxide (SO2), nitrogen oxides (NOx), and carbon monoxide (CO), have led to steady decreases in their emissions, and consequently their concentrations (Blanchard et al., 2013b; Xing et al., 2013). In contrast, NH3 emissions are largely unregulated and are projected to increase due to increased agricultural operations to feed a growing world population (Reis et al., 2009; Ellis et al., 2013). Satellite observations showed that gas-phase NH3 concentrations have increased substantially in US agricultural areas from 2002 to 2014 (Warner et al., 2017). More wildfires from a changing climate, or from controlled burning for land clearing for agricultural use, may also lead to increased NH3 emissions (Reis et al., 2009; Pechony and Shindell, 2010; Warner et al., 2016). These trends suggest that NH3 could play an increasingly important role in atmospheric chemistry.
Previous laboratory studies have shown that NH3 can influence secondary organic aerosol (SOA) formation and processing. For example, NH3 increases SOA mass yields in the α-pinene ozonolysis system and is hypothesized to be due to the formation of ammonium salts from the reaction of NH3 with organic acids (Na et al., 2007). The heterogeneous uptake of NH3 by SOA can also lead to the formation of particulate organonitrogen compounds, a class of brown carbon species that can reduce visibility and impact climate (J. Laskin et al., 2010; Updyke et al., 2012; Lee et al., 2013; A. Laskin et al., 2015).
The southeastern US is a natural outdoor laboratory for studying the effects of biogenic–anthropogenic interactions on atmospheric aerosol formation and processing. Subtropical vegetation composed mainly of mixed conifer and deciduous forests emits large quantities of biogenic volatile organic compounds (BVOCs) that can act as precursors for SOA formation (Blanchard et al., 2011, 2013a; Guenther et al., 2012). Large urban centers and small towns are surrounded by large expanses of forests and widespread rural areas with agricultural activities. Scattered within the southeastern US are also coal-burning power plants and industrial facilities. Anthropogenic activities in this region emit large concentrations of VOCs, SO2, NOx, CO, NH3, and aerosols (Blanchard et al., 2013c). Similar to other parts of the US, SO2, CO, and NOx concentrations have decreased steadily in the southeastern US due to the implementation of emission controls (Blanchard et al., 2013b). In contrast, gas-phase NH3 concentrations have increased in the southeastern US over the same time period (Saylor et al., 2015). These factors make the southeastern US an intriguing place to study the influence of NH3 on atmospheric aerosol chemistry.
We performed aerosol and gas measurements during a field study conducted in Yorkville, Georgia, US, in the fall of 2016, with the goal of understanding how NH3 affects aerosol acidity and SOA formation. The field site is surrounded by forest and agricultural land, affording an opportunity to make ambient observations in an area impacted by local emissions of BVOCs and NH3. In this paper, we present gas and aerosol composition measurements that include a suite of organic acids. The thermodynamic equilibrium model, ISORROPIA II, is used to calculate particle water and pH based on measured inorganic aerosol and gas composition (Nenes et al., 1998; Fountoukis and Nenes, 2007), and these predictions are compared to observed gas–particle partitioning of NH3, HNO3, and organic acids. Together, these measurements are used to determine how aerosol acidity affects the mass concentration of particle-phase organic acids at this site.
2.1 Field site
Aerosol and gas measurements were conducted at the Yorkville, Georgia (33.929∘ N, 85.046∘ W) SouthEastern Aerosol Research and Characterization (SEARCH) field site from mid-August to mid-October 2016. This is one of the sampling sites for the Southeastern Center for Air Pollution and Epidemiology (SCAPE) study in which aerosol characterization measurements were conducted in the summer and winter of 2012 (Xu et al., 2015a, b). A detailed description of the field site can be found in Hansen et al. (2003). This rural site is situated in a mixed forest–agriculture area approximately 55 km northwest and generally upwind of Atlanta. The immediate surrounding area is used for cattle grazing and poultry concentrated animal feeding operations (CAFOs) (Fig. S1 in the Supplement). There are no major roads near the field site and nearby traffic emissions were negligible. A large coal-fired power plant (Plant Bowen) is situated approximately 25 km north of the site. Hence, the field site is impacted mainly by BVOC and NH3 emissions, with occasional spikes in SO2 and minimal influence from urban anthropogenic pollutants such as HNO3, O3, NOx, and CO (Fig. S2). The sampling period was characterized by moderate temperatures (24.0 ∘C average, 32.6 ∘C maximum, 9.5 ∘C minimum) and high relative humidities (RHs) (68.9 % RH average, 100 % RH maximum, 21.6 % RH minimum). Meteorological data are shown in Fig. S3. Data reported are displayed in eastern daylight time (EDT).
2.2 Instrumentation
Instruments were housed in a temperature-controlled (∼ 20 ∘C) trailer during the field study. Gas-phase HNO3, SO2, and organic acids (formic, acetic, oxalic, butyric, glycolic, propionic, valeric, malonic, and succinic acids) were measured with a custom-built chemical ionization mass spectrometer (CIMS) using sulfur hexafluoride ions () as reagent ions. SO2 and HNO3 were detected as fluoride adducts ( and , respectively) while the organic acids (HX) were detected primarily as conjugated anions (X−) using the quadrupole mass spectrometer (Huey et al., 1995, 2004; Nah et al., 2018). This CIMS is referred to hereafter as the SF6-CIMS. Gas-phase NH3 was measured with an additional custom-built CIMS using protonated ethanol clusters () as reagent ions. NH3 was detected primarily as ions with the quadrupole mass spectrometer (Nowak et al., 2002; Yu and Lee, 2012; You et al., 2014a). This CIMS is referred to hereafter as the NH3-CIMS.
Since HNO3, NH3, and organic acids may condense on surfaces, both SF6-CIMS and NH3-CIMS used inlet configurations that minimized wall interactions (Huey et al., 2004; Nowak et al., 2006). Each CIMS was connected to an inlet (a 7.6 cm ID aluminum pipe) that protruded beyond the trailer's wall by ∼40 cm into the ambient air. Both inlets were ∼2 m above the ground. A donut-shaped ring was attached to the ambient sampling port of each pipe to curtail the influence of crosswinds on the pipe's flow dynamics. Both rings were wrapped with a fine wire mesh to prevent ingestion of insects. A flow of ∼2800 L min−1 was maintained in each pipe using regenerative blowers (Ametek Windjammer 116637-03). Part of this flow (7 L min−1 for the SF6-CIMS and 4.6 L min−1 for the NH3-CIMS) was sampled through a custom-made three-way PFA Teflon valve, which connected the pipe's center to the CIMS sampling orifice and could be switched automatically between ambient and background measurements.
Background measurements were performed every 25 min for 4 min for both the SF6-CIMS and NH3-CIMS. During each background measurement, the sampled air flow was passed through an activated charcoal scrubber (Sigma Aldrich) that removed SO2, HNO3, and organic acids prior to delivery into the SF6-CIMS, and through a silicon phosphate scrubber (Perma Pure LLC) that removed NH3 prior to delivery into the NH3-CIMS. More than 99 % of the targeted species were removed during background measurements for both the SF6-CIMS and NH3-CIMS. Standard addition calibrations were performed every 5 h for the SF6-CIMS using the outputs of a 1.12 ppm 34SO2 gas cylinder (Scott Marrin Inc.) and a formic or acetic acid permeation device (VICI Metronics). Calibrations for the other gases measured by the SF6-CIMS were performed in post-field laboratory work, details of which can be found in Nah et al. (2018) and Supplement Sect. S1. Standard addition calibrations were performed hourly for the NH3-CIMS using the output of a NH3 permeation device (KIN-TEK). The outputs of the formic and acetic acid permeation devices were measured periodically by scrubbing the output of the permeation tube in deionized water, followed by ion chromatography analysis for formate and acetate. The emission rate of the NH3 permeation device was measured using UV optical absorption (Neuman et al., 2003).
The detection limits for species measured by the SF6-CIMS and NH3-CIMS were approximated from 3 times the standard deviation values (3σ) of the ion signals measured during background mode. The detection limits for HNO3, SO2, and the various organic acids measured by the SF6-CIMS ranged from 1 to 60 ppt for 2.5 min integration periods, which corresponded to the length of a background measurement with a ∼4 % duty cycle for each m∕z (Table S1 in the Supplement). Measurement uncertainties for the concentrations of HNO3, SO2, and the various organic acids originate mainly from calibration measurements and were between 12 % and 25 % (Table S1). The detection limit for NH3 measured by the NH3-CIMS was 1 ppb for 2.3 min integration periods, which corresponded to the length of a background measurement with a ∼29 % duty cycle for the ion. Measurement uncertainties for NH3 concentrations were 13 %.
A high-resolution time-of-flight aerosol mass spectrometer (HR-ToF-AMS, Aerodyne Research Inc.) was used to measure the elemental composition of ambient non-refractory PM1 (particles with aerodynamic diameters <1 µm). Ambient air was sampled at 16.7 L min−1 through a URG PM1 cyclone and then through a Nafion dryer prior to delivery into the HR-ToF-AMS. Aerosols were dried to RH <20 % to eliminate the influence of RH on the HR-ToF-AMS's particle collection efficiency. A detailed description of the HR-ToF-AMS can be found in the literature (DeCarlo et al., 2006; Canagaratna et al., 2007, 2015). Briefly, the aerodynamic lens of the HR-ToF-AMS focused the dried submicron aerosols into a narrow beam. The aerosols were then impacted onto a heated tungsten surface (∼600 ∘C) on which they were flash vaporized. The resulting vapors were ionized by electron impact ionization (70 eV), and the ions were detected by a time-of-flight mass spectrometer. Gas-phase interferences were accounted for by subtracting the signals obtained during daily measurements of filtered, particle-free sampling air. Ionization efficiency calibrations were performed weekly using 300 nm ammonium nitrate and ammonium sulfate particles. Composition-dependent collection efficiency (CDCE) values of 0.44 to 0.55 were determined using the procedure detailed by Middlebrook et al. (2012), in which CDCE values are derived based largely on aerosol inorganic species concentrations and the RH in the sampling line. In addition, a constant collection efficiency (CE) value of 0.9 was determined from the comparison of raw HR-ToF-AMS data with other particulate measurements performed during the study. Comparisons of aerosol mass concentrations obtained from the application of CDCE values (i.e., 0.44 to 0.55) vs. a constant CE value (i.e., 0.9) to the raw HR-ToF-AMS data are discussed in Sect. 3.2. Uncertainties in HR-ToF-AMS measurements were estimated to be approximately 25 % (Canagaratna et al., 2007).
Particle-phase water-soluble organic acids and inorganic cations and anions were measured using two particle-into-liquid sampler (PILS) systems coupled to ion chromatographs (ICs) (Orsini et al., 2003). Each PILS sampled ambient air at nominally 16.7 L min−1 through a URG PM1 cyclone. Before PILS1, which was used to measure water-soluble inorganic cation and anions, two long (24 cm) URG glass annular denuders coated with sodium carbonate and phosphorous acid were used to remove acidic and basic gases. Before PILS2, which measured water-soluble organic acids, a 28 cm parallel plate carbon denuder (Sunset Lab) was used to remove organic gases (Eatough et al., 1993). In each PILS, aerosols were mixed with water vapor at ∼100 ∘C generated from heated ultrapure deionized water (Weber et al., 2001; Orsini et al., 2003). The resulting droplets were impacted onto a plate, with the resulting liquid sample analyzed using the ICs. Each IC system was calibrated at the beginning and end of the study using five multi-compound standards in order to create calibration curves. Periodically, a HEPA filter (Pall Life Sciences) was placed on the inlet to determine the background in near real time. The measurement uncertainty for each IC system was about 10 %.
PILS1 was connected to two Dionex ICS-1500 ICs (Thermo Fisher Scientific) to measure the water-soluble inorganic ions. These two IC systems include an isocratic pump, self-regenerating anion or cation suppressor, and conductivity detector. This system will be referred to hereafter as the PILS–IC. Anions were separated using a Dionex IonPac AS15 guard and analytical column (4×250 mm, Thermo Fisher Scientific) employing an eluent of 38 mM sodium hydroxide at a flow rate of 1.5 mL min−1. Cations were separated using a Dionex IonPac CS12A guard and analytical column (4×250 mm, Thermo Fisher Scientific) employing an eluent of 18 mM methanesulfonic acid at a flow rate of 1 mL min−1. A new chromatogram was obtained every 30 min with a sample loop fill time (i.e., ambient sample integration time) of 20 min. The limit of detection for the various anions and cations was approximately 0.01 µg m−3.
PILS2 was coupled to a Dionex ICS-4000 capillary high-pressure ion chromatography (HPIC) system to measure the water-soluble organic acids. The HPIC includes an eluent generator, isocratic pump, degausser, suppressor, carbonate removal device, and conductivity detector. This system will be referred to hereafter as the PILS–HPIC. The organic acids were separated using a Dionex AS11-HC-4 µm capillary guard and analytical column (0.4×250 mm, Thermo Fisher Scientific), which used a potassium hydroxide gradient separation method at a flow rate of 0.015 mL min−1. A new chromatogram was obtained every 60 min with a sample loop fill time of 2 min. The limit of detection for the various organic acids was approximately 0.001 µg m−3.
Particle- and gas-phase water-soluble organic carbon (WSOCp and WSOCg, respectively) were measured using two Sievers 900 series total organic carbon (TOC) analyzers (GE Analytical Instruments), as described by Sullivan et al. (2004). For WSOCp measurements, ambient air was sampled at 15.2 L min−1 through a URG PM1 cyclone and a parallel plate carbon denuder into a PILS coupled to the first TOC analyzer. For WSOCg measurements, ambient air was sampled at 20 L min−1 through a Teflon filter (45 mm diameter, 2.0 µm pore size, Pall Life Sciences) to remove particles in the air stream. This filter was changed every 3 to 4 days. The particle-free air was then directed to a MIST chamber filled with ultrapure deionized water, which scrubbed the soluble gases at an air flow rate of 20 L min−1. Soluble gases with Henry's law constants greater than 103 were scrubbed into deionized water in the MIST chamber (Spaulding et al., 2002). The resulting MIST chamber liquid sample was analyzed by the second TOC analyzer. The TOC analyzers converted the organic carbon in the liquid samples to carbon dioxide using UV radiation and chemical oxidation. The carbon dioxide formed was then measured by conductivity. The amount of organic carbon in the liquid samples is proportional to the measured increase in conductivity of the dissolved carbon dioxide. Each WSOCp and WSOCg measurement lasted 4 min. Background WSOCp and WSOCg measurements were performed for 45 min every 12 h by stopping the sample air flow and rinsing the system with deionized water. Both TOC analyzers were calibrated at the beginning and end of the study using varying concentrations of sucrose solutions to create calibration curves (as specified by the instrument manual). The limit of detections for WSOCp and WSOCg were 0.2 and 0.4 µg C m−3, respectively. The measurement uncertainties for WSOCp and WSOCg were estimated to be 10 % based on uncertainties in the TOC analyzer, sample air, and liquid flows.
A suite of instruments operated by the SEARCH network provided supporting gas and aerosol measurements (Hansen et al., 2003; Edgerton et al., 2005, 2006, 2007). O3 was measured with a UV absorption instrument (Thermo Fisher Scientific) with a temporal resolution of 1 min. NO and NOx were measured using a chemiluminescence instrument (Thermo Fisher Scientific) with a temporal resolution of 1 min. NO2 was obtained from the difference between NO and NOx. CO was measured using a nondispersive infrared absorption instrument (Thermo Fisher Scientific) with a temporal resolution of 1 min. NH3 was measured by a denuder-based instrument (ARA) with a temporal resolution of 5 min. Comparisons of measurements by the NH3-CIMS and denuder-based instrument will be presented in Sect. 3.1. A filter-based particle composition monitor (ARA) provided 24 h-integrated PM2.5 measurements of particle mass and major inorganic ions measured offline by ion chromatography. Organic carbon (OC) and elemental carbon (EC) in PM2.5 were measured by an OC–EC analyzer (Sunset Labs) with a temporal resolution of 1 h. This analyzer determined OC by thermal optical transmittance. VOCs were measured by a gas chromatography–flame ionization detector (GC-FID, Agilent Technologies) with a temporal resolution of 1 h.
2.3 Particle pH and water calculation
The thermodynamic equilibrium model ISORROPIA II was used to determine the phase state and composition of an –––Cl−–Na+–Ca2+–K+–Mg2+–water inorganic aerosol in equilibrium with its corresponding gas-phase species (Fountoukis and Nenes, 2007; Nenes et al., 1998). This approach was used in previous studies to determine particle water and pH in different parts of the world (Guo et al., 2015, 2016, 2017a, c; Bougiatioti et al., 2016; Weber et al., 2016; Shi et al., 2017). The pH of an aqueous solution is defined as the negative logarithm of the hydronium ion (H3O+) activity on a molality basis (http://www.goldbook.iupac.org/html/P/P04524.html, last access: 6 July 2018):
where a(H+) is the hydronium ion activity in an aqueous solution, m(H+) is the hydronium ion molality, γm(H+) is the molality-based hydronium ion activity coefficient, and mθ is the standard molality (1 mol kg−1). For simplicity, H3O+ is denoted here as H+ even though we recognize that the un-hydrated hydrogen ion is rare in aqueous solutions. Since most thermodynamic equilibrium models (e.g., ISORROPIA II, E-AIM) do not report liquid concentrations, but instead report species in terms of concentration per volume of air (e.g., µg m−3, µmol m−3), we have calculated the particle pH by
where is the hydronium ion activity coefficient (assumed to be 1), is the concentration of hydronium ions in particle water in moles per liter (i.e., the density of water is assumed to be 1000 kg m−3, and so pH is calculated in terms of molality), (µg m−3) is the hydronium ion concentration per volume of air, and Wi and Wo (µg m−3) are the bulk particle water concentrations associated with inorganic and organic species per volume of air, respectively. In Eq. (1b), the molecular weight of H+ is taken as 1 g mole−1, and 1000 is the factor needed for unit conversion of grams per liter to micrograms per cubic meter. and Wi are outputs of the ISORROPIA II model. Previous studies have shown that particle pH values predicted using only Wi are reasonably accurate since the sensitivity of particle pH to the effects of Wo is small (Guo et al., 2015). For the southeastern US, Guo et al. (2015) reported that particle pH values predicted using only Wi were systematically 0.15 to 0.23 units lower than those predicted using Wi+Wo during the 2013 Southern Oxidant Aerosol Study (SOAS) and SCAPE campaigns. Given this small deviation and that organic aerosol hygroscopicity was not measured in this field study, we report particle pH only considering Wi.
ISORROPIA II was run in “forward” mode, which assumes that aerosols are “metastable” with no solid precipitates, to predict particle pH and the partitioning of semi-volatile compounds. In forward mode, the model calculates the gas–particle equilibrium partitioning concentrations based on the input of the total concentration of a species (i.e., gas + particle). In reverse mode, the model calculates the gas–particle equilibrium partitioning concentrations based on the input of only the particle-phase concentration of a species. We used forward mode because the reverse mode is sensitive to measurement errors, which often result in large model biases in the predicted particle pH (Hennigan et al., 2015). The measured particle-phase inorganic , , and concentrations and gas-phase HNO3 and NH3 concentrations were used as model inputs. The metastable assumption is reasonable since the high RH (average RH 68.9 %) observed during the study indicated that the aerosols had likely deliquesced. We excluded data for periods when the RH was above 95 % since the exponential growth in particle liquid water with RH introduces large pH uncertainties (Malm and Day, 2001; Guo et al., 2015).
In using ISORROPIA II to predict particle pH and the partitioning of semi-volatile compounds, we also assumed that the aerosols are internally mixed and that the particle pH does not change with particle size (i.e., the overall particle pH is characterized by the particle's bulk properties). As long as some small fraction of sulfate is mixed with various aerosol components, (e.g., non-volatile cations), the assumption that aerosols are completely internally mixed has a small effect on the predicted pH (Guo et al., 2017b). However, the presence of multiple organic and inorganic species in ambient aerosols may lead to multiple phases within the particle (i.e., phase separation). Consequently, this may result in the unequal distribution of inorganic species among different phases, each with its own water activity and inorganic concentration. Previous studies have shown that liquid–liquid and solid–liquid phase separations may occur for mixed organic and inorganic aerosols at low RH and organic aerosol oxygen-to-carbon atomic ratios (O∕C) (Bertram et al., 2011; Song et al., 2012; You et al., 2013, 2014b; You and Bertram, 2015). Phase separations were always observed at , while no phase separation was observed at . The probability for the occurrence of phase separation decreased at higher RH for . The average O∕C for this field study is 0.69±0.06. Organic acids were not included in the calculation of particle pH. This is reasonable since their total mass concentration was small compared to the total inorganic mass concentration. The average ratio of the organic acid mass concentration to the inorganic mass concentration is 0.25. Furthermore, Song et al. (2018) showed that including organic acid mass concentrations in thermodynamic model calculations had minor effects on particle pH if the system is in equilibrium. The validity of these assumptions and the resulting thermodynamic model predictions will be evaluated by comparing the predicted gas–particle partitioning ratios of semi-volatile inorganic compounds with measured values in Sect. 3.3.
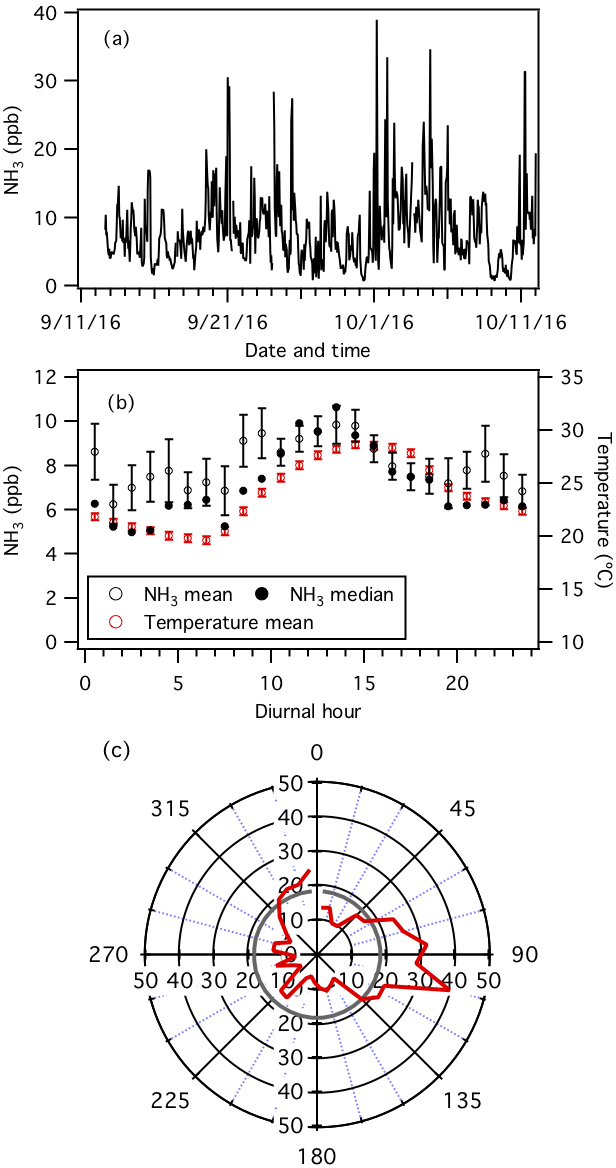
Figure 1Measurements by the NH3-CIMS during the second half of the study. (a) Time series of NH3 concentration. The data are displayed as 1 h averages. (b) Diurnal profiles of NH3 concentration (mean and median) and temperature. Error bars shown are the standard errors. Dates and times displayed are local time. All the concentrations represent averages in 1 h intervals and the standard errors are plotted as error bars. (c) Average NH3 concentration normalized to wind speed (i.e., NH3 concentration (ppb) × wind speed (m s−1)) in each 10∘ bin (red line). The average normalized NH3 concentration is shown as a grey line.
3.1 NH3 observations
Continuous measurements of NH3 were made using the NH3-CIMS from 13 September to 12 October. Figure 1a and b show the time series and average diurnal profile of NH3, respectively. NH3 concentrations ranged from 0.7 to 39.0 ppb (0.5 to 28.5 µg m−3) and exhibited consistent diurnal cycles. NH3 was generally higher in the late mornings and early afternoons. Concentrations started to increase at 07:30, which coincided with an increase in temperature at sunrise (Fig. S3). Possible reasons for the morning increase include volatilization of particulate ammonium and animal waste, entrainment from the residual layer where NH3 may not have been depleted, evaporation of dew or fog that contained dissolved NH3, and emission from plant stomata (Ellis et al., 2011). NH3 decreased at 14:30, approximately 1 h before temperature decreased, and may be due to changes in the boundary layer height. However, this hypothesis cannot be tested since the boundary layer height was not measured during the study. The diurnal plot does not account for dilution as the boundary layer expanded and only indicates that if emissions were solely from the surface and lower concentrations aloft, these NH3 sources were of significant magnitude.
The average NH3 concentration measured by the NH3-CIMS is 8.1±5.2 ppb. This is approximately 2 times higher than the average NH3 concentration (3.8±2.9 ppb) measured by the denuder-based instrument operated by the SEARCH network over the same time period (Fig. S4). Differences in NH3 concentrations measured by the two instruments may be due to positive and negative sampling artifacts caused by differences in sampling inlets (e.g., inlet length and location), frequency of calibration and background measurements, and (in the case of the denuder-based instrument) possible sample contamination during chemical analysis. Discussions on how differences in measured NH3 concentrations affect PM1 pH predictions will be presented in Sect. 3.3. Nevertheless, there is a record of NH3 concentrations measured by the denuder-based instrument at this site since 2008. Just prior to and during this study, NH3 concentrations are generally the highest observed since 2011 (Fig. S5). These elevated NH3 concentrations may be due to sporadic biomass burning episodes caused by elevated temperatures and widespread drought across the southeastern US in 2016 (Park Williams et al., 2017; Case and Zavodsky, 2018).
The NH3-CIMS measurements are examined with the meteorological data to gain insights into the primary NH3 sources during the sampling period. To account for wind speed, the 1 h averaged NH3 concentrations are first multiplied by their corresponding 1 h averaged wind speeds. These normalized NH3 concentrations are then used to construct a wind direction polar plot showing the average normalized NH3 concentration per 10∘ bin (Fig. 1c). The wind direction polar plot shows that the normalized NH3 is approximately 2 times greater than the average when air masses are transported from the southeast, the general direction of the poultry CAFOs located approximately 2 km from the field site (Fig. S1), which are known for having high NH3 emissions. This conclusion is reaffirmed by NH3 measurements from the SEARCH network's denuder-based instrument.
NH3 concentrations measured by the two instruments in this study are substantially higher than those measured in three recent field studies conducted in the continental US: the 2010 California Nexus (CalNex) study, 2013 Southeast Nexus (SENEX) study, and 2013 SOAS study (see Table 1). The differences in NH3 may be attributed to differences in land use, proximity to CAFOs, and meteorological conditions. The high NH3 concentrations in this study allow us to make ambient observations of the effect of NH3 on particle acidity and the gas–particle partitioning of semi-volatile inorganic and organic compounds, and compare them with previous studies.
3.2 PM1 composition
The aerosol inorganic chemical composition was measured by several instruments during this study. The HR-ToF-AMS, PILS–IC and PILS–HPIC measured the composition of PM1, while a filter-based particle composition monitor measured the composition of PM2.5. Comparisons of aerosol , , and mass concentrations obtained from the application of CDCE values to the raw HR-ToF-AMS data are compared to those measured by the other three instruments in Fig. S6. measurements by the PILS–IC are not available for comparison due to denuder breakthrough that occurred during the study.
measurements by the various instruments are generally well correlated with each other, with R2 values ranging from 0.64 to 0.92. Although PM1 measurements by the two PILS systems show good agreement with each other, HR-ToF-AMS CDCE-applied measurements are approximately 2 times higher than the PILS and filter measurements. Similar systematic differences are also observed for and measurements. and measurements from the four instruments are moderately correlated (R2=0.54 to 0.79 and R2=0.94, respectively). measurements from the PILS and filter systems are mostly similar; however, HR-ToF-AMS CDCE-applied PM1 and measurements are approximately 3 times and 2 times higher than the PILS and filter measurements. One possible reason is that the calculated CDCE is lower due to organics dominating the aerosol composition during the study (average of 74.2±7.9 % of the non-refractory PM1 mass concentration). Lee et al. (2015) suggested that a high organic mass fraction may impede the complete efflorescence of aerosols when they are passed through the drier prior to delivery into the HR-ToF-AMS, thus reducing the particle bounce and increasing the CE value. Hence, we estimated HR-ToF-AMS PM1 mass concentrations that would be consistent with PILS and filter measurements by multiplying all the raw HR-ToF-AMS data by a constant CE value of 0.9, which was obtained from comparisons of the raw HR-ToF-AMS data with PILS–IC and PILS–HPIC measurements. The constant CE-applied HR-ToF-AMS data are used in all our subsequent analyses.
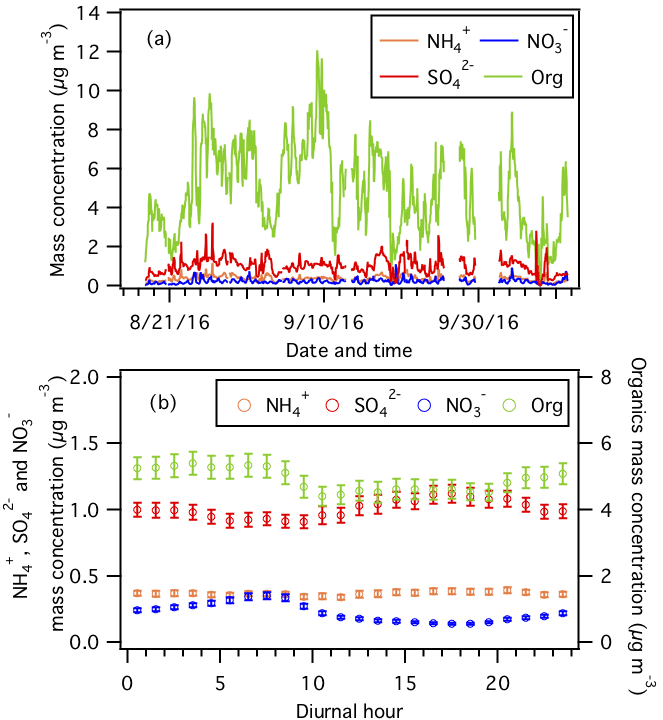
Figure 2(a) Time series and (b) diurnal profiles of non-refractory PM1 species measured by the AMS. Error bars shown in (b) are the standard errors. Dates and times displayed are local time.
Figure 2 shows the time series and average diurnal profiles of non-refractory PM1 species. The average non-refractory PM1 organics, , , and mass concentrations are 5.0±2.3, 1.6±0.4, 0.2±0.1, and 0.4±0.2 µg m−3, respectively. Organics are the dominant non-refractory PM1 species, accounting for 74.2±7.9 % of the non-refractory PM1 mass concentration during the field study. Organic aerosol mass concentration was slightly higher at night, which is likely caused by changes in the boundary layer height, emission sources, and SOA formation processes (Xu et al., 2015b). Previous studies have shown that nighttime SOA production in the southeastern US is largely attributed to nitrate radical oxidation and ozonolysis of monoterpenes, which are abundant at night (Pye et al., 2015; Xu et al., 2015a, b; Lee et al., 2016; Zhang et al., 2018). Specifically, the nitrate radical oxidation of some monoterpenes (e.g., β-pinene) could form low-volatility organic nitrates that are condensable and could contribute substantially to the nocturnal organic aerosol mass (Boyd et al., 2015, 2017; Ng et al., 2017). Apportionment of organic aerosol sources will be discussed in an upcoming publication. is the second most abundant non-refractory PM1 species (16.3±5.7 % mass fraction), followed by (5.9±2 % mass fraction) and (3.6±2.2 % mass fraction). mass concentration peaked in the afternoon due to enhanced SO2 photooxidation (Weber et al., 2003). The mass concentration measured by the HR-ToF-AMS is the nitrate functional group (-ONO2) present on organic and inorganic nitrates. Hence, the diurnal profile of the mass concentration in Fig. 2 has contributions from both organic and inorganic nitrates. The mass concentrations of organic and inorganic nitrates increased after sunset and peaked at sunrise (Fig. S7), likely due to the formation of organic nitrates from nighttime NO3 chemistry and increased gas-to-particle partitioning of organic and inorganic nitrates as temperature decreased (Xu et al., 2015a, b). Quantification and characterization of organic nitrates based on HR-ToF-AMS and PILS–IC PM1 measurements will be discussed in a future publication. mass concentration has moderate diurnal variations with marginally higher concentrations in the afternoon, likely due to the contrasting day–night phases of ammonium sulfate and ammonium nitrate formation. , , and molar concentrations indicated that is mainly associated with in PM1.
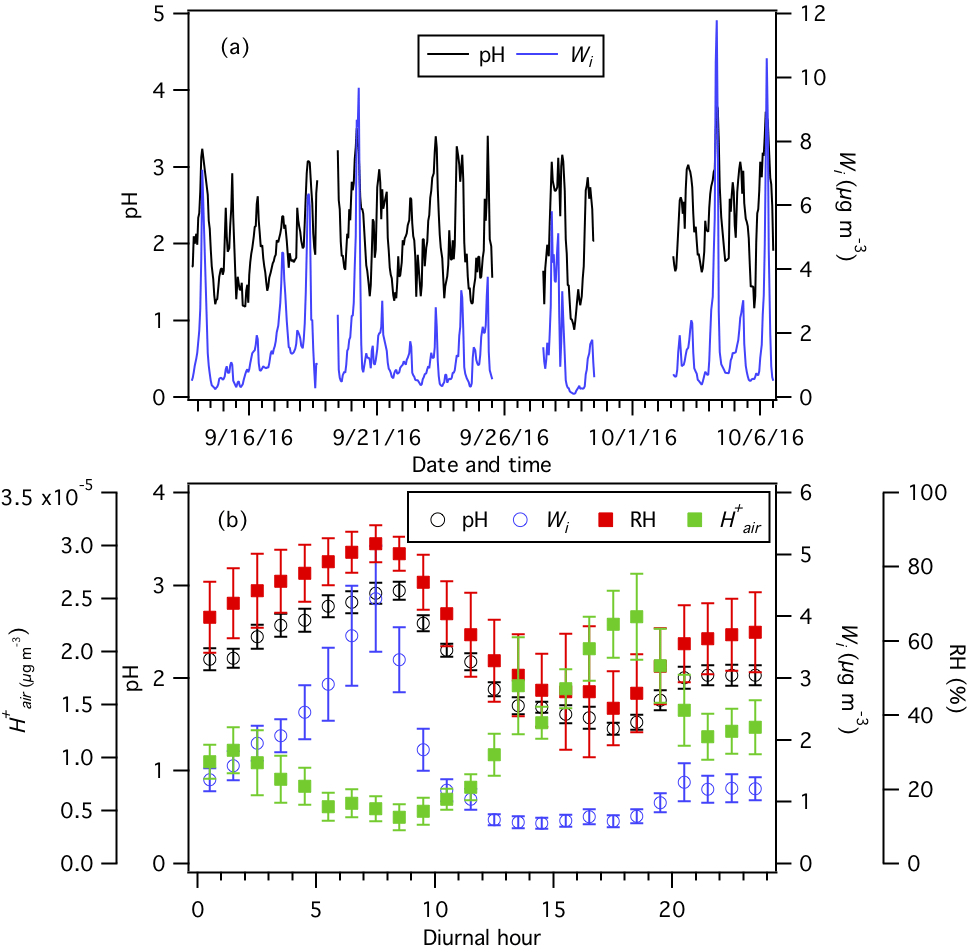
Figure 3(a) Time series and (b) diurnal profiles of ISORROPIA-predicted PM1 pH and Wi. The diurnal profiles of RH and ISORROPIA-predicted are also shown in (b). Dates and times displayed are local time. All the data shown here represent averages in 1 h intervals. Error bars shown in (b) are the standard errors.
3.3 PM1 pH predictions
CIMS HNO3 and NH3 data, HR-ToF-AMS PM1 and data, PILS–IC PM1 and non-volatile cation (Cl−, Na+, Ca2+, K+, and Mg2+) data, measured temperature, and RH are used as ISORROPIA II model inputs to predict PM1 Wi and pH from 13 September to 6 October. Figure 3 shows the time series and average diurnal profiles of ISORROPIA-predicted PM1 Wi and pH. PM1 is highly acidic with pH values ranging from 0.9 to 3.8 and an average pH of 2.2±0.6. The average PM1 pH is 2.5±0.6 during periods when the NH3 concentration is higher than 13.3 ppb (i.e., average NH3 concentration +1 standard deviation = ppb). The PM1 pH values in this study are generally similar to those reported by Guo et al. (2015) at the same field site during winter 2012. Our observation that PM1 is acidic despite the high NH3 concentrations in this study is consistent with previous studies showing that particle pH has weak sensitivities to wide NH3 and mass concentration ranges due to pH buffering caused by the partitioning of NH3 between the gas and particle phases (Weber et al., 2016; Guo et al., 2017c). This weak particle pH sensitivity also explains the small changes in PM1 pH values (about 10 % lower, Fig. S8) when NH3 measurements by the SEARCH network denuder-based instrument are used in ISORROPIA II calculations (instead of NH3-CIMS measurements).
Table 1Comparisons among different field campaigns for particle pH, major inorganic ions and gases, and meteorological conditions. All pH values were calculated using ISORROPIA II run in forward mode. These statistics were previously compiled by Guo et al. (2017a). Campaign acronyms used here stand for the California Research at the Nexus of Air Quality and Climate Change (CalNex), Southern Oxidant and Aerosol Study (SOAS), and Southeastern Nexus of Air Quality and Climate (SENEX).
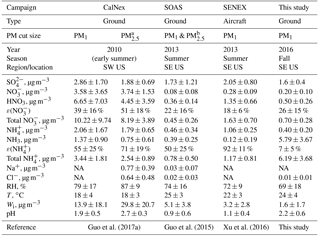
a Only during the last week of CalNex.
b PM2.5 was sampled in the first half and PM1 sampled in the
second half of the study. Various parameters were similar in both cases.
Crustal components were higher but are overall generally at low
concentrations so the differences had minor effects. For example, PM2.5
Na+ was 0.06±0.09 µg m−3 and PM1 Na+ was
0.01±0.01 µg m−3.
NA = not available.
PM1 pH varied by approximately 1.4 units throughout the day. Wi has an average value of 1.6±1.7 µg m−3. PM1 Wi and pH showed similar diurnal profiles, with both peaking in the midmorning and reaching their minima in the midafternoon. These diurnal trends are consistent with those previously reported by Guo et al. (2015) for PM1 measured during the summer and winter in different parts of the southeastern US. Also shown in Fig. 3b is the diurnal profile of , which peaked in the midafternoon. The Wi and maximum ∕ minimum ratios are comparable (6.5 and 5.3, respectively), thus indicating that the diurnal variation in particle pH is driven by both Wi and .
The average PM1 pH for this study is about 1 unit higher than that for the SENEX and SOAS campaigns (Table 1) and is likely due to the much higher abundance of NH3 in this study. The average NH3 mass concentration in this study is approximately 49 times and 15 times higher than that in the SENEX and SOAS campaigns, respectively. The average PM1 pH for this study is similar to that for the CalNex campaign even though the average NH3 mass concentration in this study is only approximately 4 times higher than that in the CalNex campaign (Guo et al., 2017a). This may be due, in part, to PM1 and mass concentrations at CalNex being approximately 2 times and 18 times larger than those of this study, respectively. Aerosol inorganic and species are hygroscopic species. The much higher mass concentrations in the CalNex campaign (due, in part, to high NOx emissions) increased particle Wi substantially, which diluted H+ and raised particle pH, resulting in more gas-to-particle partitioning of , and eventually leading to pH levels similar to those observed in this study. This type of feedback does not happen in the southeastern US, where non-volatile dominates the uptake of particle water. It is also possible that the higher RH and lower temperatures during the CalNex campaign (relative to this study) contributed to high particle Wi, which diluted H+ and raised particle pH levels similar to those observed in this study.
The validity of this study's thermodynamic model predictions is evaluated by comparing the predicted gas–particle partitioning ratios of semi-volatile inorganic compounds (i.e., and ) with measured values (Fig. S9). CIMS HNO3 and NH3 data, PILS–IC , and HR-ToF-AMS data are used in this comparison. ε() and ε() are defined as the particle-phase molar concentration divided by the total molar concentration (gas + particle), i.e., and . Predicted NH3, , and ε() values are generally within 10 % of and are highly correlated (R2=0.96 to 0.99) with measured values (Fig. S9). While predicted HNO3 values generally agreed with measurements, substantial scatter can be seen between the predicted and measured values for and ε(). This scatter can be attributed, at least in part, to uncertainties brought about by the low PM1 mass concentrations and effects of coarse-mode cations (e.g., Na+, Ca2+, K+, and Mg2+) on fine-mode HNO3– gas–particle equilibrium (i.e., HNO3 can partition to both fine and coarse modes, thereby affecting fine-mode concentrations; no such effect occurs for NH3– gas–particle equilibrium). In general, the overall good agreement between model predictions and measurements indicated that our assumptions that aerosols are metastable (i.e., aerosols are supersaturated aqueous droplets) with no phase separation for the thermodynamic calculations are reasonable for the conditions of this study and do not affect model predictions.
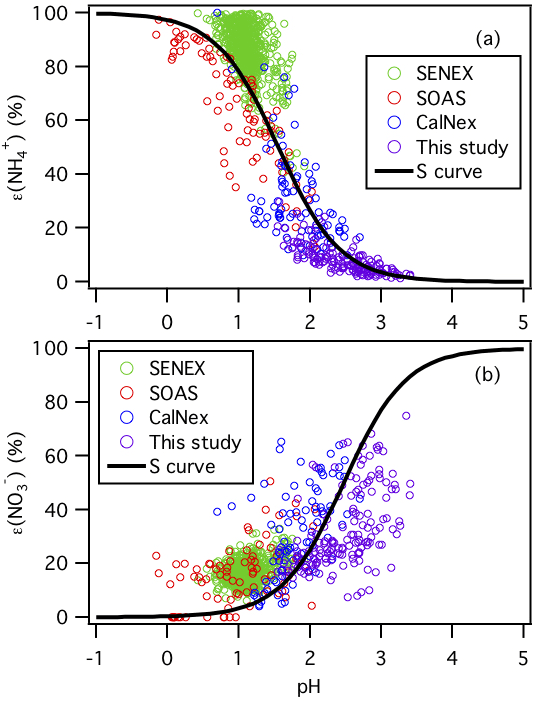
Figure 4Analytically calculated S curves of ε() and ε() and ambient data plotted against ISORROPIA-predicted particle pH for this study, SENEX, SOAS, and CalNex. For the ambient data sets, a narrow range of Wi (1 to 4 µg m−3) and temperature (15 to 25 ∘C) is selected to be close to the analytical calculation input (i.e., Wi=2.5 µg m−3 and temperature = 20 ∘C). Similar to Guo et al. (2017a), and are used for the analytically calculated S curves.
The molar fractions of and in the particle phase (i.e., ε() and ε()) measured in this study are compared with those measured during the CalNex, SENEX, and SOAS campaigns. Figure 4 shows the measured ε() and ε() values as a function of their ISORROPIA-predicted particle pH for the various field studies. For each field study, only a subset of the data are chosen for this comparison ( µg m−3 and 15 ∘C ≤ temperature ≤ 25 ∘C) to reduce the effects of variability in Wi and temperature on gas–particle partitioning for comparison with the calculated S (or sigmoidal) curves, which are calculated based on Wi=2.5 µg m−3 and temperature = 20 ∘C. The S curves for HNO3– and NH3– partitioning as a function of particle pH are also plotted as solid lines. The S curves are calculated based on the solubility and dissociation of and species in water:
where and () are equilibrium constants and are the products of the Henry's law constant and the dissociation constant of HNO3 and NH3, respectively; R is the gas constant (8.314 ); T is temperature (K); and γi's are activity coefficients. and values at 20 ∘C are calculated using equations found in Clegg and Brimblecombe (1990) and Clegg et al. (1998), respectively. Activity coefficients predicted by ISORROPIA II are , and . Derivations of the analytically calculated S curves for ε() and ε() in Eqs. (2) and (3) can be found in Guo et al. (2017a). As shown in Fig. 4, the measured ε() and ε() values for the four field studies all generally converged on the calculated S curves. The higher particle pH values in this study and the CalNex campaign relative to those for the SENEX and SOAS campaigns resulted in less NH3 and more HNO3 partitioned to the particle phase, as predicted by these simple analytical expressions. A similar analysis will be performed for the organic acids in Sect. 3.5.
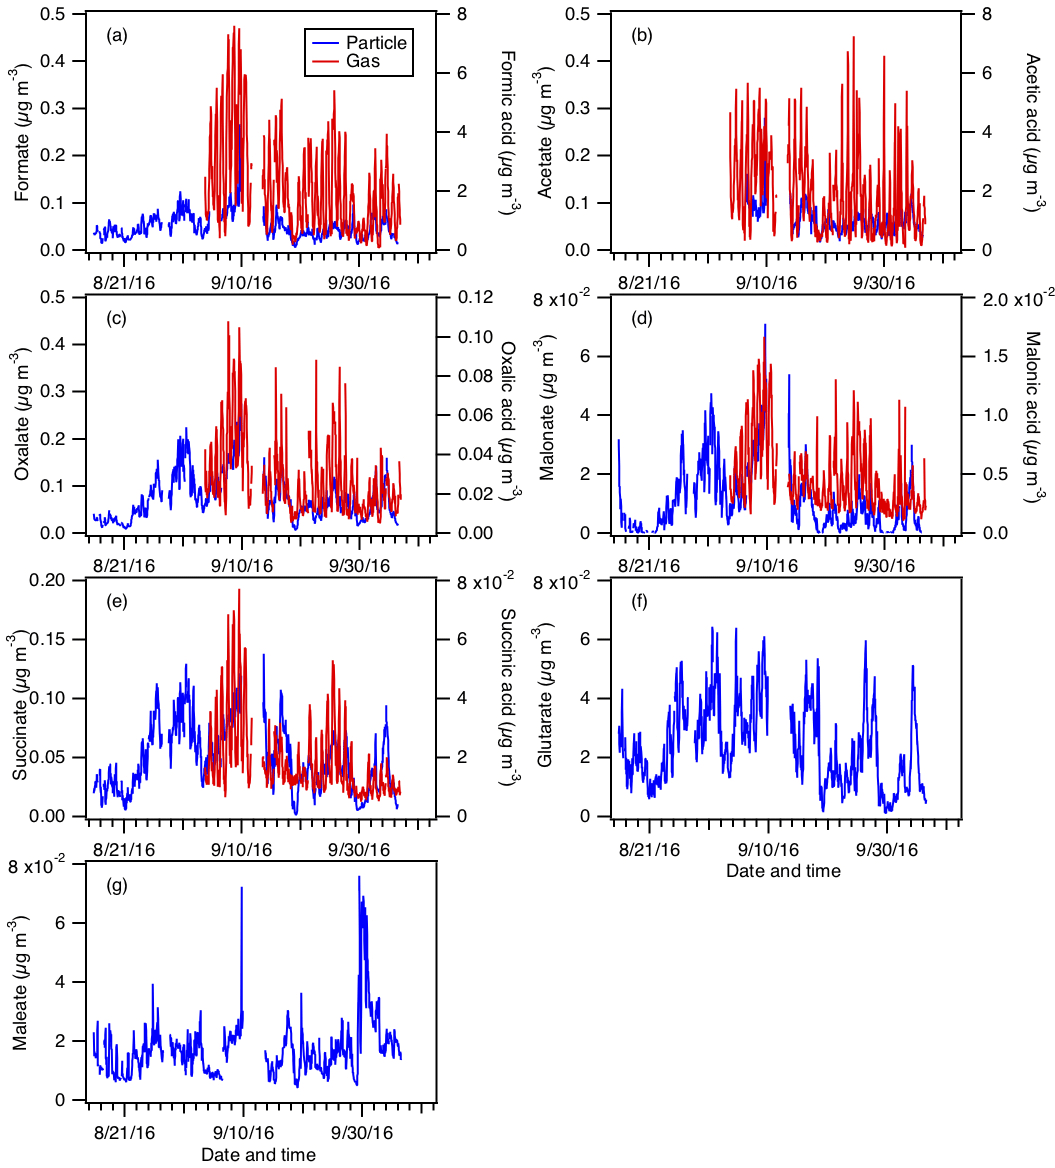
Figure 5Particle- and gas-phase measurements of (a) formic, (b) acetic, (c) oxalic, (d) malonic, (e) succinic, (f) glutaric, and (g) maleic acids. Particle-phase measurements are shown on the left y axes, while gas-phase measurements are shown on the right y axes. Dates and times displayed are local time. Gas-phase measurements of glutaric and maleic acids are not available.
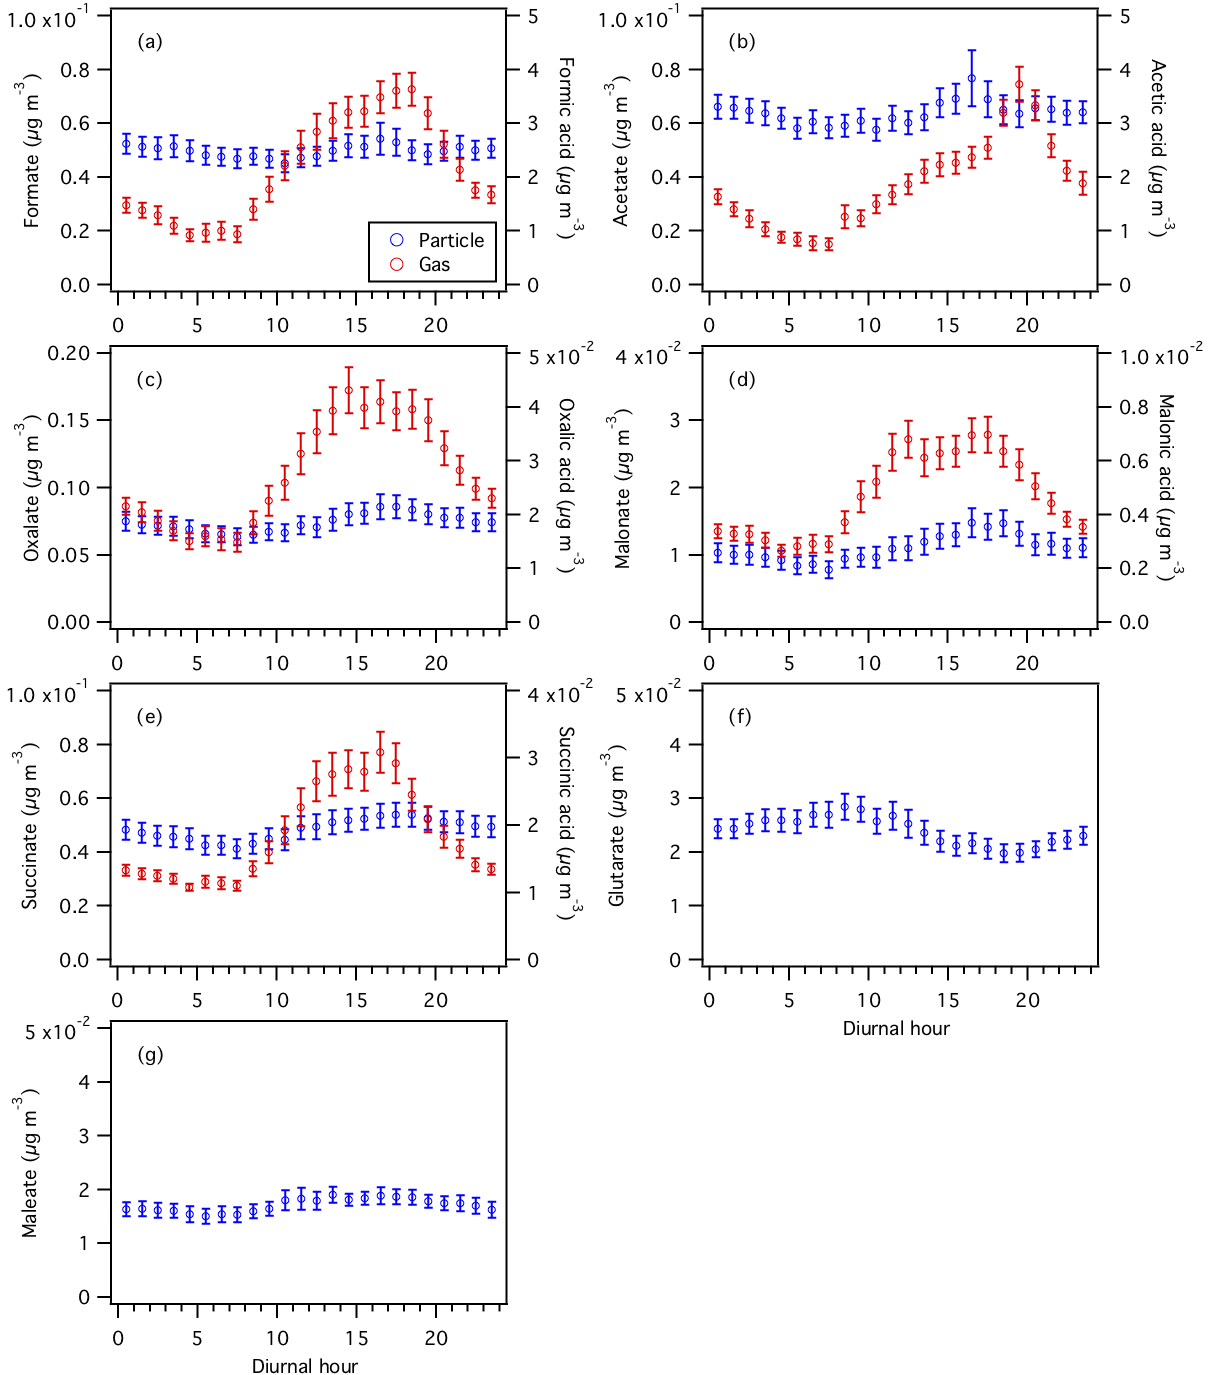
Figure 6Diurnal profiles of particle- and gas-phase (a) formic, (b) acetic, (c) oxalic, (d) malonic, (e) succinic, (f) glutaric, and (g) maleic acids. Particle-phase measurements are shown on the left y axes, while gas-phase measurements are shown on the right y axes. All the data shown here represent averages in 1 h intervals. Error bars shown are the standard errors.
3.4 WSOC and water-soluble organic acids
The time series and average diurnal profiles of WSOCg and WSOCp are shown in Fig. S10. The average WSOCg mass concentration (3.6±2.7 µg C m−3) is roughly 4 times higher than that of WSOCp (1.0±0.6 µg C m−3). The diurnal profile of WSOCp is somewhat flat, likely due to various organic aerosol sources having different water solubility and diurnal cycles and compensating for each other throughout the day (Xu et al., 2015b, 2017). In contrast, WSOCg displayed strong diurnal variations. WSOCg increased at 07:30, which coincided with the sharp increase in solar irradiance (Fig. S3). WSOCg decreased at 21:30, approximately 2 h after sunset. Also shown in Fig. S10 are the time series and average diurnal profile of the mass fraction of total WSOC in the particle phase, i.e., . The peak Fp coincided with the minima of WSOCg at 07:30.
The average WSOCg and WSOCp (3.6±2.7 µg C m−3 and 1.0±0.6 µg C m−3) are slightly lower than those measured during the SOAS campaign (SOAS WSOCg=4.9 µg C m−3 and WSOCp=1.7 µg C m−3) (Xu et al., 2017). While the diurnal profiles of WSOCp in both studies are flat, the diurnal profiles of WSOCg measured in the two studies are different. WSOCg measured in the SOAS study decreased at sunset, while WSOCg measured in this study decreased 2 h after sunset. Differences in WSOCg diurnal profiles in the two studies are likely due to differences in emission sources as a result of different sampling periods (SOAS was in early summer and this study was in early fall), land use, and/or land cover. The ratio of WSOCp to OC for this study was estimated at 30 %, but this comparison is imprecise because WSOCp was PM1 and OC was PM2.5 (refer to Fig. S11 and Supplement Sect. S2).
Figure 5 shows the time series of particle- and gas-phase concentrations of formic, acetic, oxalic, malonic, succinic, glutaric, and maleic acids. Their diurnal profiles are shown in Fig. 6. Gas-phase measurements of glutaric and maleic acids are not available. Gas-phase measurements of butyric, glycolic, propionic, and valeric acids were also measured during the study and have been presented in Nah et al. (2018), but will not be discussed here since their particle-phase measurements are not available.
Assuming that all the measured organic acids are completely water soluble, 30 % of the WSOCg is comprised of these organic acids (Nah et al., 2018). Formic and acetic acids are the most abundant gas-phase organic acids, with averages of 2.2±1.6 and 1.9±1.3 µg m−3, respectively. The average carbon mass fraction of WSOCg comprised of formic and acetic acids is 7 % and 13 %, respectively. All the gas-phase organic acids displayed strong and consistent diurnal cycles, with higher concentrations being measured during warm and sunny days. Their concentrations start to increase at sunrise (at 07:30), building to a peak between 15:30 and 19:30, then decrease overnight.
Nah et al. (2018) previously showed that the measured gas-phase organic acids during the study, including oxalic acid, likely have the same or similar sources. Poor correlations between gas-phase organic acid concentrations and those of anthropogenic pollutants (HNO3, SO2, CO, and O3) indicated that these organic acids are not due to anthropogenic emissions and are likely biogenic in nature. Biogenic emissions of gas-phase organic acids and/or their BVOC precursors are elevated at high temperatures, resulting in higher organic acid concentrations during warm and sunny days. For example, isoprene, which is the dominant BVOC in Yorkville, has a somewhat similar diurnal profile to the organic acids. In addition, the concentration of isoprene is moderately correlated with those of formic and acetic acids (Fig. S10 of Nah et al., 2018), which are known products of isoprene photooxidation. Some of these gas-phase organic acids may also be formed in the particle phase during organic aerosol photochemical aging, with subsequent volatilization into the gas phase. The gas–particle partitioning of organic acids likely depends on thermodynamic conditions, which are controlled by particle pH and Wi and meteorological conditions, as will be shown in Sect. 3.5.
The measured particle-phase water-soluble organic acids contributed on average 6 % to the HR-ToF-AMS-measured organic aerosol mass concentration. The average carbon mass fraction of WSOCp comprised of these organic acids is 4 %. Previous studies have shown that particle-phase organic acids found in rural environments are oxidation products of gas-phase aliphatic monocarboxylic acids, which are formed in the photochemical oxidation of biogenic unsaturated fatty acids and other BVOC precursors (Kawamura and Gagosian, 1987; Kawamura and Ikushima, 1993; Kerminen et al., 2000; Kawamura and Bikkina, 2016). These particle-phase organic acids can also be produced during the multiphase photochemical aging of ambient organic aerosols (Ervens et al., 2004; Lim et al., 2005; Sorooshian et al., 2007, 2010).
Oxalate is the most abundant measured particle-phase water-soluble organic acid anion (contributing on average 26 % to the total particle-phase organic acid mass concentration), with mass concentrations ranging from 0.01 to 0.34 µg m−3 and an average of 0.07±0.05 µg m−3. Acetate (average of 0.06±0.03 µg m−3) and formate (average of 0.05±0.03 µg m−3) are the second and third most abundant measured particle-phase water-soluble organic acid anions, respectively. Particle-phase formate, acetate, and maleate showed weak diurnal variations, and may be due, in part, to various emission sources having different diurnal cycles and compensating for each other throughout the day. Particle-phase oxalate, malonate, and succinate peaked in the middle to late afternoon, while glutarate generally peaked in the midmorning. This suggests that while the production of these organic acids is photochemically driven, they may have different BVOC precursors and/or different photochemical production pathways. In addition, since oxalic (C2), malonic (C3), succinic (C4), and glutaric (C5) acids belong to the same homologous series of organic diacids, it is possible that the photochemical aging of particle-phase glutaric acid resulted in the formation of its successive homologues via the cleavage of C–C bonds. Hence, organic aerosol photochemical aging may also have contributed to the diurnal profiles of particle-phase oxalate, malonate, succinate, and glutarate.
3.5 Gas–particle partitioning of organic acids
The online and simultaneous measurements of gas- and particle-phase organic acid mass concentrations provided the opportunity to study gas–particle partitioning behavior of semi-volatile organic compounds with respect to particle pH, as is more commonly done with semi-volatile inorganic species (see Sect. 3.3). Since formic, acetic, and oxalic acids are the three most abundant measured organic acids present in the gas and particle phases, we focus on the gas–particle partitioning behaviors of these three organic acids. The average molar fractions (±1 standard deviation) of formic, acetic, and oxalic acid in the particle phase (i.e., ε(HCOO−), ε(), and ε()) are 3.6±3.6 %, 5.8±5.0 %, and 73.7±9.8 %, respectively. The uncertainties of these ratios for formic, acetic, and oxalic acids are 16 %, 16 %, and 17 %, respectively, which are obtained from the propagation of their SF6-CIMS and PILS–HPIC measurement uncertainties.
3.5.1 Oxalic acid
To investigate the factors affecting oxalic acid gas–particle partitioning, the equation for the S curve describing the dependence of oxalic acid gas–particle partitioning (i.e., ) on particle pH is derived. As shown in Supplement Sect. S3, the analytically calculated S curve for ε() can be simplified to
where () is the Henry's law constant for oxalic acid, Ka1 (mole L−1) is the first acid dissociation constant for oxalic acid, R is the gas constant (8.314 ), T is temperature (K), and γi's are activity coefficients. We used the web version of AIOMFAC (http://www.aiomfac.caltech.edu, last access: 6 December 2017) (Zuend et al., 2008, 2011, 2012) to compute an average value of 0.0492. Since AIOMFAC does not predict , we assumed that and used the ISORROPIA-predicted value of 0.07. We used the average of values provided by Clegg et al. (1996), Compernolle and Müller (2014), and Saxena and Hildemann (1996) (6.11×10⁸ at 25 ∘C) and accounted for the effect of temperature using Eq. (19) in Sander (2015). Although Ka1 also depends on temperature, we used the Ka1 value at 25 ∘C ( mole L−1, Haynes, 2014) for all the oxalic acid S curve calculations since equations that compute Ka1 values for pure aqueous oxalic acid solutions at different temperatures are not available in the literature. In addition, the temperatures observed in this study were close to 25 ∘C (study-average temperature = 23.4±4.0 ∘C).
Different S curves for ε() are calculated using 1 h average values obtained from the diurnal profiles of temperature and Wi (specifically at 00:30, 06:30, and 12:30). The shape of the S curve changes with the time of day due to the diurnal variations in temperature and Wi (Fig. S12 and Supplement Sect. S3). The S curves for ε() are very different from those of other acids, such as ε() (shown in Fig. 4b). From the S curves for ε(), which are calculated using conditions in this study, some molar fraction of oxalic acid is always expected to be present in the particle phase, even at low particle pH (i.e., the S curve does not go to zero at low pH). In contrast, HNO3 is expected to be present primarily in the gas phase at low particle pH (i.e., pH<1) under similar temperature and Wi conditions. This is due primarily to differences in the Henry's law constants for the two acids. (2.57×10⁵ ) at 23.4 ∘C is 3 orders of magnitude smaller than (7.27×10⁸ ) (Clegg and Brimblecombe, 1990; Sander, 2015). This means that some undissociated form of oxalate can be found in the particle phase at any pH, and the molar fraction of this form increases with particle Wi (see Fig. S12). Oxalic acid's very high Henry's law constant combined with the Wi conditions in this study ensures that some fraction of the organic acid will be in the particle phase regardless of the particle pH.
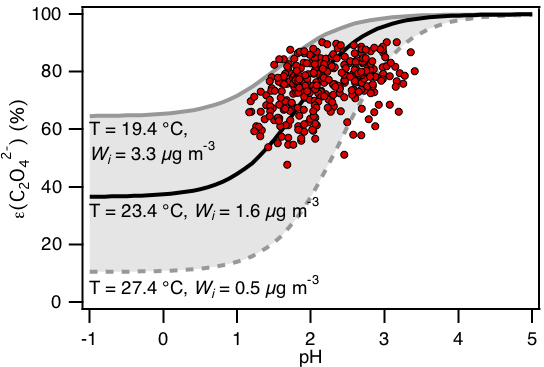
Figure 7Analytically calculated S curve of ε() and ambient data from 13 September to 6 October 2016 plotted against ISORROPIA-predicted particle pH. For the ambient data, a range in Wi (0.5 to 4 µg m−3) and temperature (15 to 31 ∘C) is chosen to be close to the analytically calculated outputs. For the analytically calculated S curves, we used (AIOMFAC predicted). We also assumed that and used the ISORROPIA-predicted . The black line is the S curve calculated using the selected time period's average temperature (23.4±4.0 ∘C) and Wi (1.6±1.7 µg m−3). The grey lines are S curves calculated using 1 standard deviation from the average temperature and Wi (i.e., temperature = 27.4 ∘C and Wi=0.5 µg m−3 for dotted grey line; temperature = 19.4 ∘C and Wi=3.3 µg m−3 for solid grey line).
Figure 7 compares the measured ε() vs. ISORROPIA-predicted PM1 pH to the analytically calculated S curve(s). The S curve is calculated based on the average temperature and Wi from 13 September to 6 October (23.4±4.0 ∘C and 1.6±1.7 µg m−3, respectively). We also calculated the “upper” and “lower” bounds of this S curve based on 1 standard deviation from the average temperature and average Wi. A temperature = 27.4 ∘C and Wi=0.5 µg m−3 are used for calculations of the lower bound, while a temperature = 19.4 ∘C and Wi=3.3 µg m−3 are used for calculations of the upper bound. For the ambient data, a range in Wi (0.5 to 4 µg m−3) and temperature (15 to 31 ∘C) is chosen to be close to the analytical calculation. As shown in Fig. 7, the measured ε() generally converged around the S curve calculated using the average temperature and Wi values. Although there is some scatter, the measured ratios are mostly within the upper and lower bounds of the S curve.
Since the measured ε() values are in general agreement with the analytically calculated S curve (Fig. 7), we can use the S curve to understand qualitatively how high NH3 events at the site affect oxalic acid gas–particle partitioning. Here we define high NH3 events as periods when the NH3 concentration was higher than 13.3 ppb (which is the average NH3 concentration +1 standard deviation). As discussed in Sect. 3.3, the PM1 pH during high NH3 events is 2.5±0.6, which is slightly higher than the average PM1 pH of 2.2±0.6. Based on the S curve calculated using the average temperature and Wi values, ε() increases from 81 % to 89 % when particle pH increases from 2.2 to 2.5. While this result indicates that high NH3 concentrations can raise the particle pH sufficiently such that it can promote gas-to-particle partitioning of oxalic acid, this is not always the case. Specifically, increasing the particle pH from −2 (or lower) to 1 will not result in a significant increase in ε(). Therefore, whether or not particle pH, and consequently oxalic acid gas–particle partitioning, is sensitive to NH3 concentration depends strongly on particle pH values.
We also examined how well the analytically calculated S curve for ε() captures diurnal variations in the measured ε(). The ambient data are divided into two 12 h sets (08:00 to 19:59 and 20:00 to 07:59) based on the diurnal profile of solar irradiance. Two S curves and their corresponding upper and lower bounds are calculated based on the average temperature and Wi of the two data sets and are subsequently compared to the ambient data. As shown in Fig. S13, the measured ε() values in both data sets are generally consistent with predicted values.
A number of inferences can be drawn from the overall good agreement between the predicted and measured molar fractions of oxalic acid in the particle phase in Figs. 7 and S13. Our assumptions regarding the activity coefficients, Henry's law constant, and acid dissociation constants used in the S curve calculations of ε() are reasonable for the conditions of this study (or are at least self-consistent). Analytically calculated S curves are a simple way of exploring how the gas–particle partitioning of semi-volatile inorganic and organic compounds in the atmosphere are affected by the compound's physicochemical properties (e.g., Henry's law constants and acid dissociation constants), temperature, Wi, and pH. Overall, these results indicate that particle-phase oxalate is in equilibrium with gas-phase oxalic acid and that particle pH can influence particle-phase oxalate concentrations. It also showed that particle-phase oxalate can be found over a broad pH range and that the presence of oxalate does not necessarily provide insights into the particle pH. Because of its high Henry's law constant, particle-phase oxalate can be found in aerosols even at extremely low pH values (i.e., the flat region in Fig. 7), although our data cannot be used to test this since ambient particle pH values in this study are too high.
3.5.2 Formic and acetic acids
Similar comparisons between the predicted and measured ε(HCOO−) and ε() can also be made. Derivation of the equations for S curves describing the dependence of formic and acetic acid gas–particle partitioning (i.e., and , respectively) on particle pH are similar to that of HNO3 since they are monoprotic acids:
where HHCOOH and () are the Henry's law constants for formic and acetic acid, Ka1's (mole L−1) are the first acid dissociation constants, R is the gas constant (8.314 ), T is temperature (K), and γi's are activity coefficients. We used the web version of AIOMFAC (http://www.aiomfac.caltech.edu, last access: 6 December 2017) (Zuend et al., 2008, 2011, 2012) to compute average γHCOOH and values of 0.334 and 2.150, respectively. Similar to the case of oxalic acid, we assumed that and used the ISORROPIA-predicted value of 0.07. Temperature-dependent HHCOOH and values are obtained from Sander (2015) using the same methodology employed to determine temperature-dependent values. We used Ka1 values at 25 ∘C ( mole L−1 for formic acid, and mole L−1 for acetic acid; Haynes, 2014) for the S curve calculations.
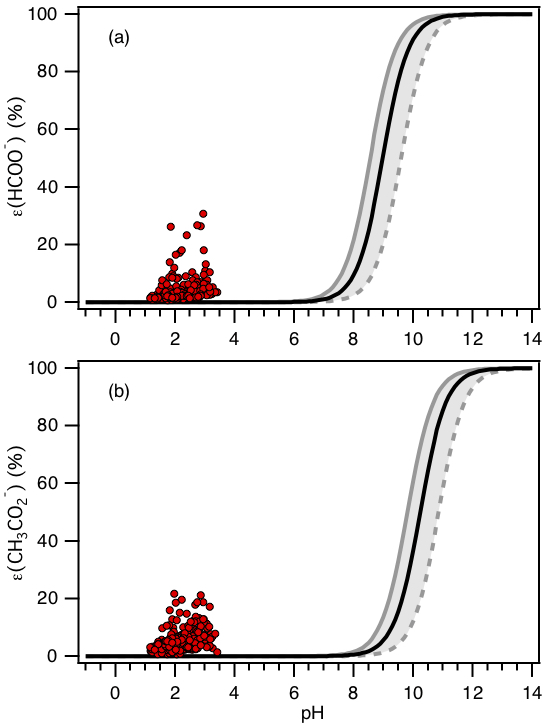
Figure 8Analytically calculated S curves of ε(HCOO−) and ε() (solid black lines) and ambient data from 13 September to 6 October 2016 plotted against ISORROPIA-predicted particle pH (shown in a and b, respectively). For the ambient data, a narrow range in Wi (0.5 to 4 µg m−3) and RH (20 % to 90 %) is chosen to be close to the analytically calculated outputs. For the analytically calculated S curves, we used γHCOOH=0.334 and (AIOMFAC predicted). We also assumed that and used the ISORROPIA-predicted . The black lines are S curves calculated using the selected time period's average temperature (23.4±4.0 ∘C) and Wi (1.6±1.7 µg m−3). The grey lines are S curves calculated using 1 standard deviation from the average temperature and Wi (i.e., temperature = 27.4 ∘C and Wi=0.5 µg m−3 for dotted grey line; temperature = 19.4 ∘C and Wi=3.3 µg m−3 for solid grey line).
S curves for ε(HCOO−) and ε() calculated based on temperature = 23.4 ∘C and Wi=1.6 µg m−3 can be seen in Fig. 8. Practically no formic or acetic acids are predicted to partition to the particle phase (relative to oxalic acid) for the range of PM1 pH calculated in this study. This is due to significant differences in the Henry's law constants and acid dissociation constants for the three organic acids. HHCOOH and (9540 and 5370 , respectively) at 23.4 ∘C are substantially smaller than (7.27×10⁸ ) (Sander, 2015). The Ka1 values for formic and acetic acids ( and mole L−1, respectively) are also considerably smaller than the Ka1 value for oxalic acid ( mole L−1) (Haynes, 2014). Note that is between that of and those of HHCOOH and (compare Fig. 4b with Figs. 7 and 8).
As shown in Fig. 8, higher-than-expected levels of formate and acetate are observed in the particle phase. This has also been reported in previous studies (Liu et al., 2012). Laboratory tests showed that the disagreement cannot be explained by positive biases in the particle-phase formate and acetate PILS–HPIC measurements resulting from less than 100 % gas removal by the carbon denuder. The measured denuder efficiency for formic acid was ≥99.97 % (Supplement Sect. S4). The possibility that formic and acetic acid dimers in the aqueous phase (Schrier et al., 1964; Gilson et al., 1997; Chen et al., 2008) may result in higher-than-predicted molar fractions of formate and acetate in the particle phase was explored but also could not explain the observed gas–particle partitioning of these acids (Supplement Sect. S5). The disagreement could be due to incorrect Henry's law constants for formic and acetic acids. However, the Henry's law constants for formic and acetic acid would have to be ∼104 times and times larger than their literature values, respectively, in order for their S curves to match our measured molar fractions of formic and acetic acid in the particle phase. In addition, formic and acetic acids may not be internally mixed with most of the other PM1 aerosol components (e.g., , , , ) and thus are not associated with acidic aerosols, as assumed above. They may instead be associated with aerosols largely composed of non-volatile cations and have a pH closer to neutral. More research is needed to explain this disagreement.
Gas- and particle-phase measurements were conducted in Yorkville, Georgia (a rural field site), during fall 2016. The goal of the field study was to understand how NH3 affects particle acidity and consequently SOA formation through the gas–particle partitioning of semi-volatile inorganic and organic compounds. Since it is a rural site surrounded by forest, agricultural land, and CAFOs, this study provided an opportunity for ambient observations in an area impacted by high local emissions of BVOCs and NH3.
NH3 concentrations measured by the NH3-CIMS ranged from 0.7 to 39.0 ppb (average 8.1±5.2 ppb), which were substantially higher than typical levels in the southeastern US. PM1 inorganic chemical composition, gas-phase HNO3 and NH3 concentrations, temperature, and RH were used as model inputs in the ISORROPIA II thermodynamic model to calculate PM1 pH and Wi. PM1 pH ranged from 0.9 to 3.8, with an average pH of 2.2±0.6. The measured and predicted HNO3– and NH3– gas–particle partitioning ratios were in good agreement. The measured gas-phase organic acids were estimated to contribute 30 % of the overall WSOCg on a carbon mass basis, whereas measured particle-phase organic acids comprised 6 % of the total organic aerosol mass concentration and 4 % of the overall WSOCp on a carbon mass basis. Formic and acetic acids were the most abundant gas-phase organic acids, with averages of 2.2±1.6 and 1.9±1.3 µg m−3, respectively. Oxalate was the most abundant particle-phase water-soluble organic acid anion, with an average of 0.07±0.05 µg m−3. Measured oxalic acid gas–particle partitioning ratios generally agreed with analytical predictions, which were based on oxalic acid's physicochemical properties (specifically, its Henry's law constants, acid dissociation constants, and activity coefficients), temperature, Wi, and particle pH. The partitioning of oxalic acid to the particle phase is highly sensitive to temperature and Wi. In contrast, the partitioning of formic and acetic acids to the particle phase was higher than predicted for reasons currently unknown.
Although past air regulations have resulted in decreased sulfate, nitrate, and ammonium aerosol mass concentrations across the US, our study suggests that the current limited regulation of NH3 emissions may result in some increase in the organic aerosol mass concentration due to increased gas-to-particle partitioning of some organic acids. However, in this study, the effect was small since the organic acids comprised a small fraction of the overall organic aerosol mass.
Data can be accessed by request (rweber@eas.gatech.edu).
The supplement related to this article is available online at: https://doi.org/10.5194/acp-18-11471-2018-supplement.
Principle investigator RJW and co-investigators LGH, NLN, and AR planned the field study. TN, HG, APS, YC, and DJT conducted the field study. TN, HG, APS, and YC analyzed the data. TN, RJW, LGH, NLN, AR, and AN were involved in data interpretation. TN and RJW wrote the paper.
The authors declare that they have no conflict of interest.
The authors thank Eric Edgerton (Atmospheric Research and Analysis, Inc.) for providing SEARCH network measurements and meteorological data.
This publication was developed under U.S. Environmental Protection Agency
(EPA) STAR grant R835882 awarded to the Georgia Institute of Technology. It has
not been formally reviewed by the EPA. The views expressed in this document
are solely those of the authors and do not necessarily reflect those of the
EPA. The EPA does not endorse any products or commercial services mentioned in
this publication.
Edited by: Kimitaka Kawamura
Reviewed by: two anonymous referees
Barbier Jr., J. and Duprez, D.: Steam Effects in 3-way catalysis, Appl. Catal. B-Environ., 4, 105–140, https://doi.org/10.1016/0926-3373(94)80046-4, 1994.
Bertram, A. K., Martin, S. T., Hanna, S. J., Smith, M. L., Bodsworth, A., Chen, Q., Kuwata, M., Liu, A., You, Y., and Zorn, S. R.: Predicting the relative humidities of liquid-liquid phase separation, efflorescence, and deliquescence of mixed particles of ammonium sulfate, organic material, and water using the organic-to-sulfate mass ratio of the particle and the oxygen-to-carbon elemental ratio of the organic component, Atmos. Chem. Phys., 11, 10995–11006, https://doi.org/10.5194/acp-11-10995-2011, 2011.
Blanchard, C. L., Hidy, G. M., Tanenbaum, S., and Edgerton, E. S.: NMOC, ozone, and organic aerosol in the southeastern United States, 1999–2007: 3. Origins of organic aerosol in Atlanta, Georgia, and surrounding areas, Atmos. Environ., 45, 1291–1302, https://doi.org/10.1016/j.atmosenv.2010.12.004, 2011.
Blanchard, C. L., Hidy, G. M., Tanenbaum, S., Edgerton, E. S., and Hartsell, B. E.: The Southeastern Aerosol Research and Characterization (SEARCH) study: Spatial variations and chemical climatology, 1999–2010, J. Air Waste Manage., 63, 260–275, https://doi.org/10.1080/10962247.2012.749816, 2013a.
Blanchard, C. L., Hidy, G. M., Tanenbaum, S., Edgerton, E. S., and Hartsell, B. E.: The Southeastern Aerosol Research and Characterization (SEARCH) study: Temporal trends in gas and PM concentrations and composition, 1999–2010, J. Air Waste Manage., 63, 247–259, https://doi.org/10.1080/10962247.2012.748523, 2013b.
Blanchard, C. L., Tanenbaum, S., and Hidy, G. M.: Source Attribution of Air Pollutant Concentrations and Trends in the Southeastern Aerosol Research and Characterization (SEARCH) Network, Environ. Sci. Technol., 47, 13536–13545, https://doi.org/10.1021/es402876s, 2013c.
Bougiatioti, A., Nikolaou, P., Stavroulas, I., Kouvarakis, G., Weber, R., Nenes, A., Kanakidou, M., and Mihalopoulos, N.: Particle water and pH in the eastern Mediterranean: source variability and implications for nutrient availability, Atmos. Chem. Phys., 16, 4579–4591, https://doi.org/10.5194/acp-16-4579-2016, 2016.
Boyd, C. M., Sanchez, J., Xu, L., Eugene, A. J., Nah, T., Tuet, W. Y., Guzman, M. I., and Ng, N. L.: Secondary organic aerosol formation from the β-pinene + NO3 system: effect of humidity and peroxy radical fate, Atmos. Chem. Phys., 15, 7497–7522, https://doi.org/10.5194/acp-15-7497-2015, 2015.
Boyd, C. M., Nah, T., Xu, L., Berkemeier, T., and Ng, N. L.: Secondary Organic Aerosol (SOA) from Nitrate Radical Oxidation of Monoterpenes: Effects of Temperature, Dilution, and Humidity on Aerosol Formation, Mixing, and Evaporation, Environ. Sci. Technol., 51, 7831–7841, https://doi.org/10.1021/acs.est.7b01460, 2017.
Canagaratna, M. R., Jayne, J. T., Jimenez, J. L., Allan, J. D., Alfarra, M. R., Zhang, Q., Onasch, T. B., Drewnick, F., Coe, H., Middlebrook, A., Delia, A., Williams, L. R., Trimborn, A. M., Northway, M. J., DeCarlo, P. F., Kolb, C. E., Davidovits, P., and Worsnop, D. R.: Chemical and microphysical characterization of ambient aerosols with the aerodyne aerosol mass spectrometer, Mass Spectrom. Rev., 26, 185–222, https://doi.org/10.1002/mas.20115, 2007.
Canagaratna, M. R., Jimenez, J. L., Kroll, J. H., Chen, Q., Kessler, S. H., Massoli, P., Hildebrandt Ruiz, L., Fortner, E., Williams, L. R., Wilson, K. R., Surratt, J. D., Donahue, N. M., Jayne, J. T., and Worsnop, D. R.: Elemental ratio measurements of organic compounds using aerosol mass spectrometry: characterization, improved calibration, and implications, Atmos. Chem. Phys., 15, 253–272, https://doi.org/10.5194/acp-15-253-2015, 2015.
Case, J. L. and Zavodsky, B. T.: Evolution of 2016 drought in the Southeastern United States from a Land surface modeling perspective, Results Phys., 8, 654–656, https://doi.org/10.1016/j.rinp.2017.12.029, 2018.
Chen, J. H., Brooks, C. L., and Scheraga, H. A.: Revisiting the carboxylic acid dimers in aqueous solution: Interplay of hydrogen bonding, hydrophobic interactions, and entropy, J. Phys. Chem. B, 112, 242–249, https://doi.org/10.1021/jp074355h, 2008.
Clegg, S. L. and Brimblecombe, P.: Equilibrium partial pressures and mean activity and osmotic coefficients of 0–100-percent nitric-acid as a function of temperature, J. Phys. Chem., 94, 5369–5380, https://doi.org/10.1021/j100376a038, 1990.
Clegg, S. L., Brimblecombe, P., and Khan, L.: The Henry's law constant of oxalic acid and its partitioning into the atmospheric aerosol, Idojaras, 100, 51–68, 1996.
Clegg, S. L., Brimblecombe, P., and Wexler, A. S.: Thermodynamic model of the system H+----H2O at tropospheric temperatures, J. Phys. Chem. A, 102, 2137–2154, https://doi.org/10.1021/jp973042r, 1998.
Compernolle, S. and Müller, J.-F.: Henry's law constants of diacids and hydroxy polyacids: recommended values, Atmos. Chem. Phys., 14, 2699–2712, https://doi.org/10.5194/acp-14-2699-2014, 2014.
DeCarlo, P. F., Kimmel, J. R., Trimborn, A., Northway, M. J., Jayne, J. T., Aiken, A. C., Gonin, M., Fuhrer, K., Horvath, T., Docherty, K. S., Worsnop, D. R., and Jimenez, J. L.: Field-deployable, high-resolution, time-of-flight aerosol mass spectrometer, Anal. Chem., 78, 8281–8289, https://doi.org/10.1021/ac061249n, 2006.
Dentener, F. J. and Crutzen, P. J.: A three-dimensional model of the global ammonia cycle, J. Atmos. Chem., 19, 331–369, https://doi.org/10.1007/bf00694492, 1994.
Eatough, D. J., Wadsworth, A., Eatough, D. A., Crawford, J. W., Hansen, L. D., and Lewis, E. A.: A multiple-system, multi-channel diffusion denuder sampler for the determination of fine-particulate organic material in the atmosphere, Atmos. Environ. A-Gen., 27, 1213–1219, https://doi.org/10.1016/0960-1686(93)90247-V, 1993.
Edgerton, E. S., Hartsell, B. E., Saylor, R. D., Jansen, J. J., Hansen, D. A., and Hidy, G. M.: The southeastern aerosol research and characterization study: Part II. Filter-based measurements of fine and coarse particulate matter mass and composition, J. Air Waste Manage., 55, 1527–1542, 2005.
Edgerton, E. S., Hartsell, B. E., Saylor, R. D., Jansen, J. J., Hansen, D. A., and Hidy, G. M.: The Southeastern Aerosol Research and Characterization Study, part 3: Continuous measurements of fine particulate matter mass and composition, J. Air Waste Manage., 56, 1325–1341, https://doi.org/10.1080/10473289.2006.10464585, 2006.
Edgerton, E. S., Saylor, R. D., Hartsell, B. E., Jansen, J. J., and Hansen, D. A.: Ammonia and ammonium measurements from the southeastern United States, Atmos. Environ., 41, 3339–3351, https://doi.org/10.1016/j.atmosenv.2006.12.034, 2007.
Ellis, R. A., Murphy, J. G., Markovic, M. Z., VandenBoer, T. C., Makar, P. A., Brook, J., and Mihele, C.: The influence of gas-particle partitioning and surface-atmosphere exchange on ammonia during BAQS-Met, Atmos. Chem. Phys., 11, 133–145, https://doi.org/10.5194/acp-11-133-2011, 2011.
Ellis, R. A., Jacob, D. J., Sulprizio, M. P., Zhang, L., Holmes, C. D., Schichtel, B. A., Blett, T., Porter, E., Pardo, L. H., and Lynch, J. A.: Present and future nitrogen deposition to national parks in the United States: critical load exceedances, Atmos. Chem. Phys., 13, 9083–9095, https://doi.org/10.5194/acp-13-9083-2013, 2013.
Ervens, B., Feingold, G., Frost, G. J., and Kreidenweis, S. M.: A modeling study of aqueous production of dicarboxylic acids: 1. Chemical pathways and speciated organic mass production, J. Geophys. Res.-Atmos., 109, D15205, https://doi.org/10.1029/2003jd004387, 2004.
Fountoukis, C. and Nenes, A.: ISORROPIA II: a computationally efficient thermodynamic equilibrium model for K+–Ca2+–Mg2+––Na+–––Cl−–H2O aerosols, Atmos. Chem. Phys., 7, 4639–4659, https://doi.org/10.5194/acp-7-4639-2007, 2007.
Gilson, M. K., Given, J. A., Bush, B. L., and McCammon, J. A.: The statistical-thermodynamic basis for computation of binding affinities: A critical review, Biophys. J., 72, 1047–1069, https://doi.org/10.1016/s0006-3495(97)78756-3, 1997.
Guenther, A. B., Jiang, X., Heald, C. L., Sakulyanontvittaya, T., Duhl, T., Emmons, L. K., and Wang, X.: The Model of Emissions of Gases and Aerosols from Nature version 2.1 (MEGAN2.1): an extended and updated framework for modeling biogenic emissions, Geosci. Model Dev., 5, 1471–1492, https://doi.org/10.5194/gmd-5-1471-2012, 2012.
Guo, H., Xu, L., Bougiatioti, A., Cerully, K. M., Capps, S. L., Hite Jr., J. R., Carlton, A. G., Lee, S.-H., Bergin, M. H., Ng, N. L., Nenes, A., and Weber, R. J.: Fine-particle water and pH in the southeastern United States, Atmos. Chem. Phys., 15, 5211–5228, https://doi.org/10.5194/acp-15-5211-2015, 2015.
Guo, H., Sullivan, A. P., Campuzano-Jost, P., Schroder, J. C., Lopez-Hilfiker, F. D., Dibb, J. E., Jimenez, J. L., Thornton, J. A., Brown, S. S., Nenes, A., and Weber, R. J.: Fine particle pH and the partitioning of nitric acid during winter in the northeastern United States, J. Geophys. Res.-Atmos., 121, 10355–10376, https://doi.org/10.1002/2016jd025311, 2016.
Guo, H., Liu, J., Froyd, K. D., Roberts, J. M., Veres, P. R., Hayes, P. L., Jimenez, J. L., Nenes, A., and Weber, R. J.: Fine particle pH and gas–particle phase partitioning of inorganic species in Pasadena, California, during the 2010 CalNex campaign, Atmos. Chem. Phys., 17, 5703–5719, https://doi.org/10.5194/acp-17-5703-2017, 2017a.
Guo, H., Nenes, A., and Weber, R. J.: The underappreciated role of nonvolatile cations on aerosol ammonium-sulfate molar ratios, Atmos. Chem. Phys. Discuss., https://doi.org/10.5194/acp-2017-737, in review, 2017b.
Guo, H., Weber, R. J., and Nenes, A.: High levels of ammonia do not raise fine particle pH sufficiently to yield nitrogen oxide-dominated sulfate production, Sci. Rep.-UK, 7, 12109, https://doi.org/10.1038/s41598-017-11704-0, 2017c.
Hansen, D. A., Edgerton, E. S., Hartsell, B. E., Jansen, J. J., Kandasamy, N., Hidy, G. M., and Blanchard, C. L.: The southeastern aerosol research and characterization study: Part 1 – overview, J. Air Waste Manage., 53, 1460–1471, 2003.
Haynes, W. M.: CRC handbook of chemistry and physics: A ready-reference book of chemical and physical data, CRC Press, Boca Raton, 2014.
Hennigan, C. J., Izumi, J., Sullivan, A. P., Weber, R. J., and Nenes, A.: A critical evaluation of proxy methods used to estimate the acidity of atmospheric particles, Atmos. Chem. Phys., 15, 2775–2790, https://doi.org/10.5194/acp-15-2775-2015, 2015.
Huey, L. G., Hanson, D. R., and Howard, C. J.: Reactions of and I− with Atmospheric Trace Gases, J. Phys. Chem., 99, 5001–5008, https://doi.org/10.1021/j100014a021, 1995.
Huey, L. G., Tanner, D. J., Slusher, D. L., Dibb, J. E., Arimoto, R., Chen, G., Davis, D., Buhr, M. P., Nowak, J. B., Mauldin, R. L., Eisele, F. L., and Kosciuch, E.: CIMS measurements of HNO3 and SO2 at the South Pole during ISCAT 2000, Atmos. Environ., 38, 5411–5421, https://doi.org/10.1016/j.atmosenv.2004.04.037, 2004.
Kawamura, K. and Bikkina, S.: A review of dicarboxylic acids and related compounds in atmospheric aerosols: Molecular distributions, sources and transformation, Atmos. Res., 170, 140–160, https://doi.org/10.1016/j.atmosres.2015.11.018, 2016.
Kawamura, K. and Gagosian, R. B.: Implication of omega-oxocarboxylic acids in the remote marine atmosphere for photo-oxidation of unsaturated fatty acids, Nature, 325, 330–332, https://doi.org/10.1038/325330a0, 1987.
Kawamura, K. and Ikushima, K.: Seasonal changes in the distribution of dicarboxylic acids in the urban atmosphere, Environ. Sci. Technol., 27, 2227–2235, https://doi.org/10.1021/es00047a033, 1993.
Kerminen, V. M., Ojanen, C., Pakkanen, T., Hillamo, R., Aurela, M., and Merilainen, J.: Low-molecular-weight dicarboxylic acids in an urban and rural atmosphere, J. Aerosol Sci., 31, 349–362, https://doi.org/10.1016/s0021-8502(99)00063-4, 2000.
Lamarque, J.-F., Bond, T. C., Eyring, V., Granier, C., Heil, A., Klimont, Z., Lee, D., Liousse, C., Mieville, A., Owen, B., Schultz, M. G., Shindell, D., Smith, S. J., Stehfest, E., Van Aardenne, J., Cooper, O. R., Kainuma, M., Mahowald, N., McConnell, J. R., Naik, V., Riahi, K., and van Vuuren, D. P.: Historical (1850–2000) gridded anthropogenic and biomass burning emissions of reactive gases and aerosols: methodology and application, Atmos. Chem. Phys., 10, 7017–7039, https://doi.org/10.5194/acp-10-7017-2010, 2010.
Laskin, A., Laskin, J., and Nizkorodov, S. A.: Chemistry of Atmospheric Brown Carbon, Chem. Rev., 115, 4335–4382, https://doi.org/10.1021/cr5006167, 2015.
Laskin, J., Laskin, A., Roach, P. J., Slysz, G. W., Anderson, G. A., Nizkorodov, S. A., Bones, D. L., and Nguyen, L. Q.: High-Resolution Desorption Electrospray Ionization Mass Spectrometry for Chemical Characterization of Organic Aerosols, Anal. Chem., 82, 2048–2058, https://doi.org/10.1021/ac902801f, 2010.
Lee, B. H., Mohr, C., Lopez-Hilfiker, F. D., Lutz, A., Hallquist, M., Lee, L., Romer, P., Cohen, R. C., Iyer, S., Kurten, T., Hu, W. W., Day, D. A., Campuzano-Jost, P., Jimenez, J. L., Xu, L., Ng, N. L., Guo, H. Y., Weber, R. J., Wild, R. J., Brown, S. S., Koss, A., de Gouw, J., Olson, K., Goldstein, A. H., Seco, R., Kim, S., McAvey, K., Shepson, P. B., Starn, T., Baumann, K., Edgerton, E. S., Liu, J. M., Shilling, J. E., Miller, D. O., Brune, W., Schobesberger, S., D'Ambro, E. L., and Thornton, J. A.: Highly functionalized organic nitrates in the southeast United States: Contribution to secondary organic aerosol and reactive nitrogen budgets, P. Natl. Acad. Sci. USA, 113, 1516–1521, https://doi.org/10.1073/pnas.1508108113, 2016.
Lee, B. P., Li, Y. J., Yu, J. Z., Louie, P. K. K., and Chan, C. K.: Characteristics of submicron particulate matter at the urban roadside in downtown Hong Kong-Overview of 4 months of continuous high-resolution aerosol mass spectrometer measurements, J. Geophys. Res.-Atmos., 120, 7040–7058, https://doi.org/10.1002/2015jd023311, 2015.
Lee, H. J., Laskin, A., Laskin, J., and Nizkorodov, S. A.: Excitation-Emission Spectra and Fluorescence Quantum Yields for Fresh and Aged Biogenic Secondary Organic Aerosols, Environ. Sci. Technol., 47, 5763–5770, https://doi.org/10.1021/es400644c, 2013.
Lim, H. J., Carlton, A. G., and Turpin, B. J.: Isoprene forms secondary organic aerosol through cloud processing: Model simulations, Environ. Sci. Technol., 39, 4441–4446, https://doi.org/10.1021/es048039h, 2005.
Liu, J., Zhang, X., Parker, E. T., Veres, P. R., Roberts, J. M., de Gouw, J. A., Hayes, P. L., Jimenez, J. L., Murphy, J. G., Ellis, R. A., Huey, L. G., and Weber, R. J.: On the gas-particle partitioning of soluble organic aerosol in two urban atmospheres with contrasting emissions: 2. Gas and particle phase formic acid, J. Geophys. Res.-Atmos., 117, D00V21, https://doi.org/10.1029/2012jd017912, 2012.
Livingston, C., Rieger, P., and Winer, A.: Ammonia emissions from a representative in-use fleet of light and medium-duty vehicles in the California South Coast Air Basin, Atmos. Environ., 43, 3326–3333, https://doi.org/10.1016/j.atmosenv.2009.04.009, 2009.
Malm, W. C. and Day, D. E.: Estimates of aerosol species scattering characteristics as a function of relative humidity, Atmos. Environ., 35, 2845–2860, https://doi.org/10.1016/s1352-2310(01)00077-2, 2001.
Middlebrook, A. M., Bahreini, R., Jimenez, J. L., and Canagaratna, M. R.: Evaluation of Composition-Dependent Collection Efficiencies for the Aerodyne Aerosol Mass Spectrometer using Field Data, Aerosol Sci. Tech., 46, 258–271, https://doi.org/10.1080/02786826.2011.620041, 2012.
Na, K., Song, C., Switzer, C., and Cocker, D. R.: Effect of ammonia on secondary organic aerosol formation from alpha-Pinene ozonolysis in dry and humid conditions, Environ. Sci. Technol., 41, 6096–6102, https://doi.org/10.1021/es061956y, 2007.
Nah, T., Ji, Y., Tanner, D. J., Guo, H., Sullivan, A. P., Ng, N. L., Weber, R. J., and Huey, L. G.: Real-time measurements of gas-phase organic acids using chemical ionization mass spectrometry, Atmos. Meas. Tech. Discuss., https://doi.org/10.5194/amt-2018-46, in review, 2018.
Nenes, A., Pandis, S. N., and Pilinis, C.: ISORROPIA: A new thermodynamic equilibrium model for multiphase multicomponent inorganic aerosols, Aquat. Geochem., 4, 123–152, https://doi.org/10.1023/a:1009604003981, 1998.
Neuman, J. A., Ryerson, T. B., Huey, L. G., Jakoubek, R., Nowak, J. B., Simons, C., and Fehsenfeld, F. C.: Calibration and evaluation of nitric acid and ammonia permeation tubes by UV optical absorption, Environ. Sci. Technol., 37, 2975–2981, https://doi.org/10.1021/es026422I, 2003.
Ng, N. L., Brown, S. S., Archibald, A. T., Atlas, E., Cohen, R. C., Crowley, J. N., Day, D. A., Donahue, N. M., Fry, J. L., Fuchs, H., Griffin, R. J., Guzman, M. I., Herrmann, H., Hodzic, A., Iinuma, Y., Jimenez, J. L., Kiendler-Scharr, A., Lee, B. H., Luecken, D. J., Mao, J., McLaren, R., Mutzel, A., Osthoff, H. D., Ouyang, B., Picquet-Varrault, B., Platt, U., Pye, H. O. T., Rudich, Y., Schwantes, R. H., Shiraiwa, M., Stutz, J., Thornton, J. A., Tilgner, A., Williams, B. J., and Zaveri, R. A.: Nitrate radicals and biogenic volatile organic compounds: oxidation, mechanisms, and organic aerosol, Atmos. Chem. Phys., 17, 2103–2162, https://doi.org/10.5194/acp-17-2103-2017, 2017.
Nowak, J. B., Huey, L. G., Eisele, F. L., Tanner, D. J., Mauldin, R. L., Cantrell, C., Kosciuch, E., and Davis, D. D.: Chemical ionization mass spectrometry technique for detection of dimethylsulfoxide and ammonia, J. Geophys. Res.-Atmos., 107, 4363, https://doi.org/10.1029/2001jd001058, 2002.
Nowak, J. B., Huey, L. G., Russell, A. G., Tian, D., Neuman, J. A., Orsini, D., Sjostedt, S. J., Sullivan, A. P., Tanner, D. J., Weber, R. J., Nenes, A., Edgerton, E., and Fehsenfeld, F. C.: Analysis of urban gas phase ammonia measurements from the 2002 Atlanta Aerosol Nucleation and Real-Time Characterization Experiment (ANARChE), J. Geophys. Res.-Atmos., 111, 14, https://doi.org/10.1029/2006jd007113, 2006.
Orsini, D. A., Ma, Y. L., Sullivan, A., Sierau, B., Baumann, K., and Weber, R. J.: Refinements to the particle-into-liquid sampler (PILS) for ground and airborne measurements of water soluble aerosol composition, Atmos. Environ., 37, 1243–1259, https://doi.org/10.1016/s1352-2310(02)01015-4, 2003.
Park Williams, A., Cook, B. I., Smerdon, J. E., Bishop, D. A., Seager, R., and Mankin, J. S.: The 2016 Southeastern U.S. Drought: An Extreme Departure From Centennial Wetting and Cooling, J. Geophys. Res.-Atmos., 122, 10888–10905, https://doi.org/10.1002/2017JD027523, 2017.
Pechony, O. and Shindell, D. T.: Driving forces of global wildfires over the past millennium and the forthcoming century, P. Natl. Acad. Sci. USA, 107, 19167–19170, https://doi.org/10.1073/pnas.1003669107, 2010.
Pye, H. O. T., Luecken, D. J., Xu, L., Boyd, C. M., Ng, N. L., Baker, K. R., Ayres, B. R., Bash, J. O., Baumann, K., Carter, W. P. L., Edgerton, E., Fry, J. L., Hutzell, W. T., Schwede, D. B., and Shepson, P. B.: Modeling the Current and Future Roles of Particulate Organic Nitrates in the Southeastern United States, Environ. Sci. Technol., 49, 14195–14203, https://doi.org/10.1021/acs.est.5b03738, 2015.
Reis, S., Pinder, R. W., Zhang, M., Lijie, G., and Sutton, M. A.: Reactive nitrogen in atmospheric emission inventories, Atmos. Chem. Phys., 9, 7657–7677, https://doi.org/10.5194/acp-9-7657-2009, 2009.
Sander, R.: Compilation of Henry's law constants (version 4.0) for water as solvent, Atmos. Chem. Phys., 15, 4399–4981, https://doi.org/10.5194/acp-15-4399-2015, 2015.
Saxena, P. and Hildemann, L. M.: Water-soluble organics in atmospheric particles: A critical review of the literature and application of thermodynamics to identify candidate compounds, J. Atmos. Chem., 24, 57–109, https://doi.org/10.1007/bf00053823, 1996.
Saylor, R., Myles, L., Sibble, D., Caldwell, J., and Xing, J.: Recent trends in gas-phase ammonia and PM2.5 ammonium in the Southeast United States, J. Air Waste Manage., 65, 347–357, https://doi.org/10.1080/10962247.2014.992554, 2015.
Schrier, E. E., Pottle, M., and Scheraga, H. A.: The Influence of Hydrogen and Hydrophobic Bonds on the Stability of the Carboxylic Acid Dimers in Aqueous Solution, J. Am. Chem. Soc., 86, 3444–3449, https://doi.org/10.1021/ja01071a009, 1964.
Seinfeld, J. H. and Pandis, S. N.: Atmospheric chemistry and physics: from air pollution to climate change, Third edn., John Wiley & Sons, Inc., Hoboken, New Jersey, xxvi, 1120 pp., 2016.
Shi, G. L., Xu, J., Peng, X., Xiao, Z. M., Chen, K., Tian, Y. Z., Guan, X. B., Feng, Y. C., Yu, H. F., Nenes, A., and Russell, A. G.: pH of Aerosols in a Polluted Atmosphere: Source Contributions to Highly Acidic Aerosol, Environ. Sci. Technol., 51, 4289–4296, https://doi.org/10.1021/acs.est.6b05736, 2017.
Song, M., Marcolli, C., Krieger, U. K., Zuend, A., and Peter, T.: Liquid-liquid phase separation and morphology of internally mixed dicarboxylic acids/ammonium sulfate/water particles, Atmos. Chem. Phys., 12, 2691–2712, https://doi.org/10.5194/acp-12-2691-2012, 2012.
Song, S., Gao, M., Xu, W., Shao, J., Shi, G., Wang, S., Wang, Y., Sun, Y., and McElroy, M. B.: Fine-particle pH for Beijing winter haze as inferred from different thermodynamic equilibrium models, Atmos. Chem. Phys., 18, 7423–7438, https://doi.org/10.5194/acp-18-7423-2018, 2018.
Sorooshian, A., Ng, N. L., Chan, A. W. H., Feingold, G., Flagan, R. C., and Seinfeld, J. H.: Particulate organic acids and overall water-soluble aerosol composition measurements from the 2006 Gulf of Mexico Atmospheric Composition and Climate Study (GoMACCS), J. Geophys. Res.-Atmos., 112, 16, https://doi.org/10.1029/2007jd008537, 2007.
Sorooshian, A., Murphy, S. M., Hersey, S., Bahreini, R., Jonsson, H., Flagan, R. C., and Seinfeld, J. H.: Constraining the contribution of organic acids and AMS m∕z 44 to the organic aerosol budget: On the importance of meteorology, aerosol hygroscopicity, and region, Geophys. Res. Lett., 37, 5, https://doi.org/10.1029/2010gl044951, 2010.
Spaulding, R. S., Talbot, R. W., and Charles, M. J.: Optimization of a mist chamber (cofer scrubber) for sampling water-soluble organics in air, Environ. Sci. Technol., 36, 1798–1808, https://doi.org/10.1021/es011189x, 2002.
Suarez-Bertoa, R., Zardini, A. A., and Astorga, C.: Ammonia exhaust emissions from spark ignition vehicles over the New European Driving Cycle, Atmos. Environ., 97, 43–53, https://doi.org/10.1016/j.atmosenv.2014.07.050, 2014.
Sullivan, A. P., Weber, R. J., Clements, A. L., Turner, J. R., Bae, M. S., and Schauer, J. J.: A method for on-line measurement of water-soluble organic carbon in ambient aerosol particles: Results from an urban site, Geophys. Res. Lett., 31, L13105, https://doi.org/10.1029/2004gl019681, 2004.
Sun, K., Tao, L., Miller, D. J., Pan, D., Golston, L. M., Zondlo, M. A., Griffin, R. J., Wallace, H. W., Leong, Y. J., Yang, M. M., Zhang, Y., Mauzerall, D. L., and Zhu, T.: Vehicle Emissions as an Important Urban Ammonia Source in the United States and China, Environ. Sci. Technol., 51, 2472–2481, https://doi.org/10.1021/acs.est.6b02805, 2017.
Updyke, K. M., Nguyen, T. B., and Nizkorodov, S. A.: Formation of brown carbon via reactions of ammonia with secondary organic aerosols from biogenic and anthropogenic precursors, Atmos. Environ., 63, 22–31, https://doi.org/10.1016/j.atmosenv.2012.09.012, 2012.
Van Damme, M., Clarisse, L., Heald, C. L., Hurtmans, D., Ngadi, Y., Clerbaux, C., Dolman, A. J., Erisman, J. W., and Coheur, P. F.: Global distributions, time series and error characterization of atmospheric ammonia (NH3) from IASI satellite observations, Atmos. Chem. Phys., 14, 2905–2922, https://doi.org/10.5194/acp-14-2905-2014, 2014.
Warner, J. X., Wei, Z., Strow, L. L., Dickerson, R. R., and Nowak, J. B.: The global tropospheric ammonia distribution as seen in the 13-year AIRS measurement record, Atmos. Chem. Phys., 16, 5467–5479, https://doi.org/10.5194/acp-16-5467-2016, 2016.
Warner, J. X., Dickerson, R. R., Wei, Z., Strow, L. L., Wang, Y., and Liang, Q.: Increased atmospheric ammonia over the world's major agricultural areas detected from space, Geophys. Res. Lett., 44, 2875–2884, https://doi.org/10.1002/2016gl072305, 2017.
Weber, R. J., Orsini, D., Daun, Y., Lee, Y. N., Klotz, P. J., and Brechtel, F.: A particle-into-liquid collector for rapid measurement of aerosol bulk chemical composition, Aerosol Sci. Tech., 35, 718–727, https://doi.org/10.1080/02786820152546761, 2001.
Weber, R. J., Lee, S., Chen, G., Wang, B., Kapustin, V., Moore, K., Clarke, A. D., Mauldin, L., Kosciuch, E., Cantrell, C., Eisele, F., Thornton, D. C., Bandy, A. R., Sachse, G. W., and Fuelberg, H. E.: New particle formation in anthropogenic plumes advecting from Asia observed during TRACE-P, J. Geophys. Res.-Atmos., 108, 13, https://doi.org/10.1029/2002jd003112, 2003.
Weber, R. J., Guo, H., Russell, A. G., and Nenes, A.: High aerosol acidity despite declining atmospheric sulfate concentrations over the past 15 years, Nat. Geosci., 9, 282, https://doi.org/10.1038/ngeo2665, 2016.
Whittington, B. I., Jiang, C. J., and Trimm, D. L.: Vehicle exhaust catalysis: I. The relative importance of catalytic oxidation, steam reforming and water-gas shift reactions, Catal. Today, 26, 41–45, https://doi.org/10.1016/0920-5861(95)00093-u, 1995.
Xing, J., Pleim, J., Mathur, R., Pouliot, G., Hogrefe, C., Gan, C.-M., and Wei, C.: Historical gaseous and primary aerosol emissions in the United States from 1990 to 2010, Atmos. Chem. Phys., 13, 7531–7549, https://doi.org/10.5194/acp-13-7531-2013, 2013.
Xu, L., Guo, H., Boyd, C. M., Klein, M., Bougiatioti, A., Cerully, K. M., Hite, J. R., Isaacman-VanWertz, G., Kreisberg, N. M., Knote, C., Olson, K., Koss, A., Goldstein, A. H., Hering, S. V., de Gouw, J., Baumann, K., Lee, S.-H., Nenes, A., Weber, R. J., and Ng, N. L.: Effects of anthropogenic emissions on aerosol formation from isoprene and monoterpenes in the southeastern United States, P. Natl. Acad. Sci. USA, 112, 37–42, https://doi.org/10.1073/pnas.1417609112, 2015a.
Xu, L., Suresh, S., Guo, H., Weber, R. J., and Ng, N. L.: Aerosol characterization over the southeastern United States using high-resolution aerosol mass spectrometry: spatial and seasonal variation of aerosol composition and sources with a focus on organic nitrates, Atmos. Chem. Phys., 15, 7307–7336, https://doi.org/10.5194/acp-15-7307-2015, 2015b.
Xu, L., Middlebrook, A. M., Liao, J., de Gouw, J. A., Guo, H., Weber, R. J., Nenes, A., Lopez-Hilfiker, F. D., Lee, B. H., Thornton, J. A., Brock, C. A., Neuman, J. A., Nowak, J. B., Pollack, I. B., Welti, A., Graus, M., Warneke, C., and Ng, N. L.: Enhanced formation of isoprene-derived organic aerosol in sulfur-rich power plant plumes during Southeast Nexus, J. Geophys. Res.-Atmos., 121, 11137–11153, https://doi.org/10.1002/2016jd025156, 2016.
Xu, L., Guo, H. Y., Weber, R. J., and Ng, N. L.: Chemical Characterization of Water-Soluble Organic Aerosol in Contrasting Rural and Urban Environments in the Southeastern United States, Environ. Sci. Technol., 51, 78–88, https://doi.org/10.1021/acs.est.6b05002, 2017.
Yao, X. H., Hu, Q. J., Zhang, L. M., Evans, G. J., Godri, K. J., and Ng, A. C.: Is vehicular emission a significant contributor to ammonia in the urban atmosphere?, Atmos. Environ., 80, 499–506, https://doi.org/10.1016/j.atmosenv.2013.08.028, 2013.
You, Y. and Bertram, A. K.: Effects of molecular weight and temperature on liquid–liquid phase separation in particles containing organic species and inorganic salts, Atmos. Chem. Phys., 15, 1351–1365, https://doi.org/10.5194/acp-15-1351-2015, 2015.
You, Y., Renbaum-Wolff, L., and Bertram, A. K.: Liquid–liquid phase separation in particles containing organics mixed with ammonium sulfate, ammonium bisulfate, ammonium nitrate or sodium chloride, Atmos. Chem. Phys., 13, 11723–11734, https://doi.org/10.5194/acp-13-11723-2013, 2013.
You, Y., Kanawade, V. P., de Gouw, J. A., Guenther, A. B., Madronich, S., Sierra-Hernández, M. R., Lawler, M., Smith, J. N., Takahama, S., Ruggeri, G., Koss, A., Olson, K., Baumann, K., Weber, R. J., Nenes, A., Guo, H., Edgerton, E. S., Porcelli, L., Brune, W. H., Goldstein, A. H., and Lee, S.-H.: Atmospheric amines and ammonia measured with a chemical ionization mass spectrometer (CIMS), Atmos. Chem. Phys., 14, 12181–12194, https://doi.org/10.5194/acp-14-12181-2014, 2014a.
You, Y., Smith, M. L., Song, M., Martin, S. T., and Bertram, A. K.: Liquid-liquid phase separation in atmospherically relevant particles consisting of organic species and inorganic salts, Int. Rev. Phys. Chem., 33, 43–77, https://doi.org/10.1080/0144235x.2014.890786, 2014b.
Yu, H. and Lee, S. H.: Chemical ionisation mass spectrometry for the measurement of atmospheric amines, Environ. Chem., 9, 190–201, https://doi.org/10.1071/en12020, 2012.
Zhang, H. F., Yee, L. D., Lee, B. H., Curtis, M. P., Worton, D. R., Isaacman-VanWertz, G., Offenberg, J. H., Lewandowski, M., Kleindienst, T. E., Beaver, M. R., Holder, A. L., Lonneman, W. A., Docherty, K. S., Jaoui, M., Pye, H. O. T., Hu, W. W., Day, D. A., Campuzano-Jost, P., Jimenez, J. L., Guo, H. Y., Weber, R. J., de Gouw, J., Koss, A. R., Edgerton, E. S., Brune, W., Mohr, C., Lopez-Hilfiker, F. D., Lutz, A., Kreisberg, N. M., Spielman, S. R., Hering, S. V., Wilson, K. R., Thornton, J. A., and Goldstein, A. H.: Monoterpenes are the largest source of summertime organic aerosol in the southeastern United States, P. Natl. Acad. Sci. USA, 115, 2038–2043, https://doi.org/10.1073/pnas.1717513115, 2018.
Zuend, A., Marcolli, C., Luo, B. P., and Peter, T.: A thermodynamic model of mixed organic–inorganic aerosols to predict activity coefficients, Atmos. Chem. Phys., 8, 4559–4593, https://doi.org/10.5194/acp-8-4559-2008, 2008.
Zuend, A., Marcolli, C., Booth, A. M., Lienhard, D. M., Soonsin, V., Krieger, U. K., Topping, D. O., McFiggans, G., Peter, T., and Seinfeld, J. H.: New and extended parameterization of the thermodynamic model AIOMFAC: calculation of activity coefficients for organic-inorganic mixtures containing carboxyl, hydroxyl, carbonyl, ether, ester, alkenyl, alkyl, and aromatic functional groups, Atmos. Chem. Phys., 11, 9155–9206, https://doi.org/10.5194/acp-11-9155-2011, 2011.
Zuend, A., Marcolli, C., Luo, B. P., and Peter, Th.: Corrigendum to “A thermodynamic model of mixed organic–inorganic aerosols to predict activity coefficients” published in Atmos. Chem. Phys., 8, 4559–4593, 2008, Atmos. Chem. Phys., 12, 10075–10075, https://doi.org/10.5194/acp-12-10075-2012, 2012.