the Creative Commons Attribution 4.0 License.
the Creative Commons Attribution 4.0 License.
 | 03 Aug 2018
Influence of the vapor wall loss on the degradation rate constants in chamber experiments of levoglucosan and other biomass burning markers
Amelie Bertrand
Giulia Stefenelli
Simone M. Pieber
Emily A. Bruns
Brice Temime-Roussel
Jay G. Slowik
Henri Wortham
André S. H. Prévôt
Imad El Haddad
Nicolas Marchand
Vapor wall loss has only recently been shown a potentially significant bias in atmospheric chamber studies. Yet, previous works aiming at the determination of the degradation rate of semi-volatile organic compounds (SVOCs) often did not account for this process. Here, we evaluate the influence of vapor wall loss on the determination of the gas-phase reaction rate kOH of several biomass burning markers (levoglucosan, mannosan, coniferyl aldehyde, 3-guaiacyl propanol, and acetosyringone) with hydroxyl radicals (OH). Emissions from the combustion of beech wood were injected into a 5.5 m3 Teflon atmospheric chamber, and aged for 4 h (equivalent to 5–8 h in the atmosphere). The particle-phase compound concentrations were monitored using a thermal desorption aerosol gas chromatograph coupled to a high-resolution time-of-flight aerosol mass spectrometer (TAG-AMS). The observed depletion of the concentration was later modeled using two different approaches: the previously published approach which does not take into consideration partitioning and vapor wall loss, and an approach with a more complex theoretical framework which integrates all the processes likely influencing the particle-phase concentration. We find that with the first approach one fails to predict the measured markers' concentration time evolution. With the second approach, we determine that partitioning and vapor wall loss play a predominant role in the particle-phase concentration depletion of all the compounds, while the reactivity with OH has a non-significative effect. Furthermore, we show that kOH cannot be determined precisely without a strong constraint of the whole set of physical parameters necessary to formally describe the various processes involved. It was found that the knowledge of the saturation mass concentration C* is especially crucial. Therefore, previously published rate constants of levoglucosan and more generally SVOCs with hydroxyl radicals inferred from atmospheric chamber experiments must be, at least, considered with caution.
- Article
(3143 KB) - Full-text XML
-
Supplement
(1605 KB) - BibTeX
- EndNote


Biomass burning is known to emit a significant amount of organic aerosol (OA) (Bruns et al., 2015; Sippula, 2010) in the atmosphere with consequences on health and the climate (Kanakidou et al., 2005; Pope and Dockery, 2006). Many efforts have been made to quantify the contribution of biomass burning organic aerosol (BBOA) to ambient OA concentrations. Often, these contributions are estimated using molecular markers, i.e., compounds specific to a source and assumed, at least implicitly, to be stable toward atmospheric oxidation and re-volatilization/partitioning processes. The anhydrosugar levoglucosan is a byproduct of the pyrolysis of cellulose and is ubiquitous in our environment. It is a unambiguous organic marker of biomass burning emissions (Simoneit et al., 1999). However, several studies have recently pointed out the apparent lack of stability of the compound towards oxidation by the hydroxyl radical OH. This has been shown in aqueous solution (Hoffmann et al., 2010), on model particles, and with particles generated from nebulization in a flow reactor (Kessler et al., 2010; Lai et al., 2014), and with calculations based on quantum chemistry (Bai et al., 2013), as well as its overall lack of stability during aging (Fortenberry et al., 2018; Bertrand et al., 2018). Most pertinent in regards to the work conducted here are the atmospheric chamber experiments performed by Hennigan et al. (2010, 2011). In those, biomass burning emissions were aged under relevant atmospheric conditions in Teflon atmospheric chambers, and the atmospheric lifetime of levoglucosan was estimated to be of 0.7 to 2.2 days. However, these considerably short lifetimes seem to contrast the high concentration of levoglucosan found in the environment, up to several µg m−3 (e.g., Jordan et al., 2006; Puxbaum et al., 2007; Favez et al., 2010; Piot et al., 2012; Crippa et al., 2013; Bonvalot et al., 2016; Bozzetti et al., 2017).
Recent studies demonstrated that vapor losses at the chamber walls can be substantial, which may lead to false data interpretations and may hinder OA concentration calculations (Matsunaga and Ziemann, 2010; Zhang et al., 2014; Bian et al., 2015; Trump et al., 2016; La et al., 2016). The walls of the chamber act as a condensation sink for the condensable material. They represent a competing reservoir to the suspended material in the chamber. The interactions of the vapors with the walls can cause underestimations as much as a factor of 4 of the secondary organic aerosol (SOA) mass formed (Zhang et al., 2014). In general, they influence the concentration of any semi-volatile organic compounds (SVOCs) present in the chamber by causing a depletion of the compound. Vapor wall loss can thus intrinsically modify the chemical composition of the OA measured in an atmospheric chamber.
In the last few years, levoglucosan has been revisited as a SVOC, and authors have attempted to estimate its saturation mass concentration C* (µg m−3). C* is a semi-empirical compound physical property, a key parameter of the partitioning theory (Donahue et al., 2009) which governs the concentration equilibrium of a compound between the gas and the particle phases for a given OA concentration. The saturation mass concentration C* of SVOCs ranges between 1 × 10⁻² and 1 × 10² µg m−3 (Pandis et al., 2013). It is a relatively complex parameter to constrain. To determine the C* of levoglucosan, May et al. (2012) measured the evaporation of single component particles with a thermodenuder. They determined a C* of 13 µg m−3 at 298 K is consistent with the estimation by the SIMPOL theoretical approach (8 µg m−3) (Pankow and Asher, 2008) (at 293 K). In accordance with these results, Ye et al. (2016) investigated the vapor wall loss of levoglucosan in an atmospheric chamber along with other known SVOCs and showed the significant and irreversible loss of the compounds to the walls (on the order of 3.8±0.3 h−1). Such behavior can possibly explain the very fast degradation rates of levoglucosan calculated by Hennigan et al. (2010) in the absence of vapor wall loss considerations.
In the present paper, we investigate further the impact of vapor wall loss on the apparent depletion kinetics of several biomass burning SVOCs, including levoglucosan, mannosan, coniferyl aldehyde, acetosyringone, and 3-guaiacyl propanol. We measured their concentration as a function of OH exposure by means of a thermal desorption aerosol gas chromatograph coupled to a high-resolution time-of-flight aerosol mass spectrometer (TAG-AMS) (Williams et al., 2006, 2014) during atmospheric chamber experiments. In previous publications, we determined the primary organic aerosol (POA) emission factors and secondary aerosol production potential (SAPP) and described the overall modification of the molecular fingerprint of BBOA during aging (Bertrand et al., 2017, 2018). Here, we model the concentrations of abovementioned SVOCs with and without vapor wall loss/partitioning considerations and compare them to our measurements.
2.1 Setup
Experiments were conducted in the atmospheric chamber of the Paul Scherrer Institute (PSI, Villigen, Switzerland) (Platt et al., 2013; Klein et al., 2016). The full setup and protocol of our experiments were already described in Bertrand et al. (2017, 2018). Emissions originated from the combustion of beech logs in residential woodstoves. The modified combustion efficiency (MCE) of the combustion varied between 0.83 and 0.95, and was thus considered a mix of flaming and smoldering. The emissions were injected into the atmospheric chamber via heated (140 ∘C) stainless-steel lines. Prior to injection, the emissions were diluted by a factor of 10 by an ejector dilutor (DI-1000, Dekati Ltd). The chamber is a 5.5 m3 Teflon bag mounted on an aluminum frame, set to 2 ∘C (275 K) and with a 50 % relative humidity (RH). A dedicated suite of instruments was deployed for real-time or near-real-time monitoring of particle- and gas-phase emissions. This included, a TAG-AMS (Aerodyne Research Inc.) for the organic speciation of the organic aerosol, a HR-ToF-AMS (Aerodyne Research Inc.) equipped with a PM2.5 aerodynamic inlet lens for the bulk chemical composition of the non-refractory fraction of the aerosol and operated under standard conditions (i.e., temperature of the vaporizer set at 600 ∘C, electronic ionization (EI) at 70 eV with a temporal resolution of 1 min), an aethalometer AE33 (Aerosol d.o.o.) (Drinovec et al., 2015) with a time resolution of 1 min for the black carbon (BC), a scanning mobility particle sizer (SMPS, CPC 3022, TSI, and custom-built differential mobility analyzer) for particle number size distribution information from 16 to 914 nm (with a time resolution of 5 min), and a proton transfer reaction time-of-flight mass spectrometer (PTR-ToF-MS 8000, Ionicon Analytics) operated under standard conditions (i.e., ion drift pressure at 2.2 mbar and drift field intensity at 125 Td) for the monitoring of the volatile organic compounds (VOCs) (with a time resolution of 1 min). The Teflon lines sampling the gaseous-phase emissions from the atmospheric chamber were temperature controlled at 60 ∘C to limit condensation losses. After injection, emissions were left static for approximately 30 min for homogenization. Nitrous acid (HONO) was then injected continuously in the chamber at a flow rate of 1 L min−1 and photolyzed under a set of 40 × 100 W UV lights to initiate the photochemistry by OH radical formation. Emissions were left aging for approximately 4 h. After each experiment, the atmospheric chamber was set to 100 % RH and flushed overnight (≈ 12 h) with ozone (1000 ppm) at ambient temperature.
TAG-AMS (Williams et al., 2006, 2014) enables the online collection and analysis of the organic aerosol at the molecular level with a high time resolution. This version of TAG-AMS also included a system for in situ derivatization of the most polar compounds (Isaacman et al., 2014). An entire experiment allowed for five to seven measurements by TAG-AMS, with one always carried out before photo-oxidation. The sampling time was progressively increased to compensate for the loss of materials to the walls. It ranged between 5 and 25 min. The sampling flow rate was set to 2 L min−1. An additional line carrying air filtered from a high-efficiency particulate arrestance (HEPA) filter was installed to make up for the missing flow rate. The total sampling flow rate was set to 9 L min−1. The sampling line was equipped with a parallel plate charcoal denuder to remove any traces of organic vapor. A series of deuterated standards including adipic acid-D10, phthalic acid-D4, eicosane-D42, and tetracosane-D50 was used for quantification. Authentic standards were injected for positive identification and calibration of TAG-AMS. Prior to the campaign, tests in the lab allowed us to estimate the uncertainties on the quantification of derivatized compounds at approximately 10 % (based on replicated injection of standards).
2.2 Correction for particle wall loss
The concentrations measured during aging were corrected for particle wall loss following the method developed by Weitkamp et al. (2007) and Hildebrandt et al. (2009). Briefly, the particle loss rate kwall∕p is constrained by fitting the decay of an inert particulate tracer with an exponential fit (here BC). Here, we consider the aerosol to be internally mixed (the black carbon and organic aerosol deposit on the wall at the same rate). The particle size distribution shown in Fig. S1 in the Supplement does suggest that all primary particles are in one mode, which grows with SOA formation. Therefore, there is no indication in our data that BC and OA particles are externally mixed. Evidence from several studies focusing on the mixing state of biomass burning organic aerosol suggests that this is a reasonable assumption (Reid et al., 2005; Schwarz et al., 2008; Raatikainen et al., 2015; Kecorius et al., 2017).
The exponential decays and the associated fits are shown in Fig. S2 for each experiment. While a constant kwall∕p for each experiment is appropriate to describe the losses of BC, we tested a time-dependent kwall∕p by fitting the logarithmic form of the decay on a 30 min time interval. Using this time dependency, the k rate increased the corrected signal of normalized levoglucosan by < 5 % (see Fig. S3). Considering the TAG measurement uncertainties (about 10 %), we consider that the use of a constant kwall∕p for each experiment will not influence the results presented hereafter.
We determine a rate constant on the order of 0.2–0.3 h−1 depending on the experiments (Table 1). This is within the range of values reported by Platt et al. (2013) with the same atmospheric chamber. Assuming the limiting case where vapors only condense on the suspended material, one can estimate a lower bound for the wall-loss-corrected concentration Ci∕p_WLC using
where Ci∕p is the concentration of the particle-phase emissions measured by TAG-AMS in µg m−3.
Table 1Organic aerosol concentration before and after aging (corrected for particle wall loss), and levoglucosan concentration measured by TAG-AMS before aging.
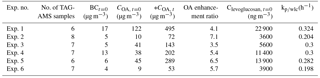
*Values are corrected for the particulate wall loss and indicated for an integrated OH exposure of 5.106 molecules cm−3 h.
2.3 OH exposure
Butanol-D9 (1 µL) was added prior to the start of the aging experiment. To account for the dilution by continuous HONO injection, the OH concentration was retrieved based on the differential reactivity of naphthalene ([C10H8]H+, m∕z 129.070) and butanol-D9 ([C4D9]+, m∕z 66.126), measured by PTR-ToF-MS, and using their respective rate constant with OH (k 3.14 × 10⁻¹² cm3 molecule−1 s−1 and k 2.30 × 10⁻¹¹ cm3 molecule−1 s−1 (Barmet et al., 2012; Bertrand et al., 2017, 2018). After 4 h of aging, the integrated OH exposures were in the range of 5–8 × 10⁶ molecule cm−3 h. This is equivalent to 5–8 h of atmospheric aging (on the basis of an average constant OH concentration of 1 × 10⁶ molecules cm−3).
A previous publication already addressed the particulate-phase emissions by the different stoves (Bertrand et al., 2017). Briefly, the organic fraction represented 67 %–93 % of the total PM mass observed in the chamber after injection. Black carbon made up for the rest of the composition. The POA concentration in the chamber ranged from 9.3 to 122.3 µg m−3 (Table 1). After an aging period corresponding to approximately 5 h (integrated OH exposure of 5 × 10⁶ molecules cm−3 h), we observed an average OA enhancement ratio of 5.3 (3.5 to 7.1). This is equivalent to an OA concentration of 53–495 µg m−3 after aging. TAG-AMS resolved between 26 % and 64 % of the total POA mass concentration but less than 10 % of the total OA mass concentration after aging (integrated OH exposure of 5 × 10⁶ molecule cm−3) (Bertrand et al., 2018). Levoglucosan was the most abundant marker (14 %–42 % of the total POA mass concentration). Its absolute concentration, after particle wall loss correction, decreased significantly over time. We observed a decay of the concentration of levoglucosan by approximately 50 %–80 %. In Bertrand et al. (2018), we report 43 other compounds along with levoglucosan whose concentration decayed during aging. The main compounds include mannosan, coniferyl aldehyde, acetosyringone, and 3-guaiacyl propanol.
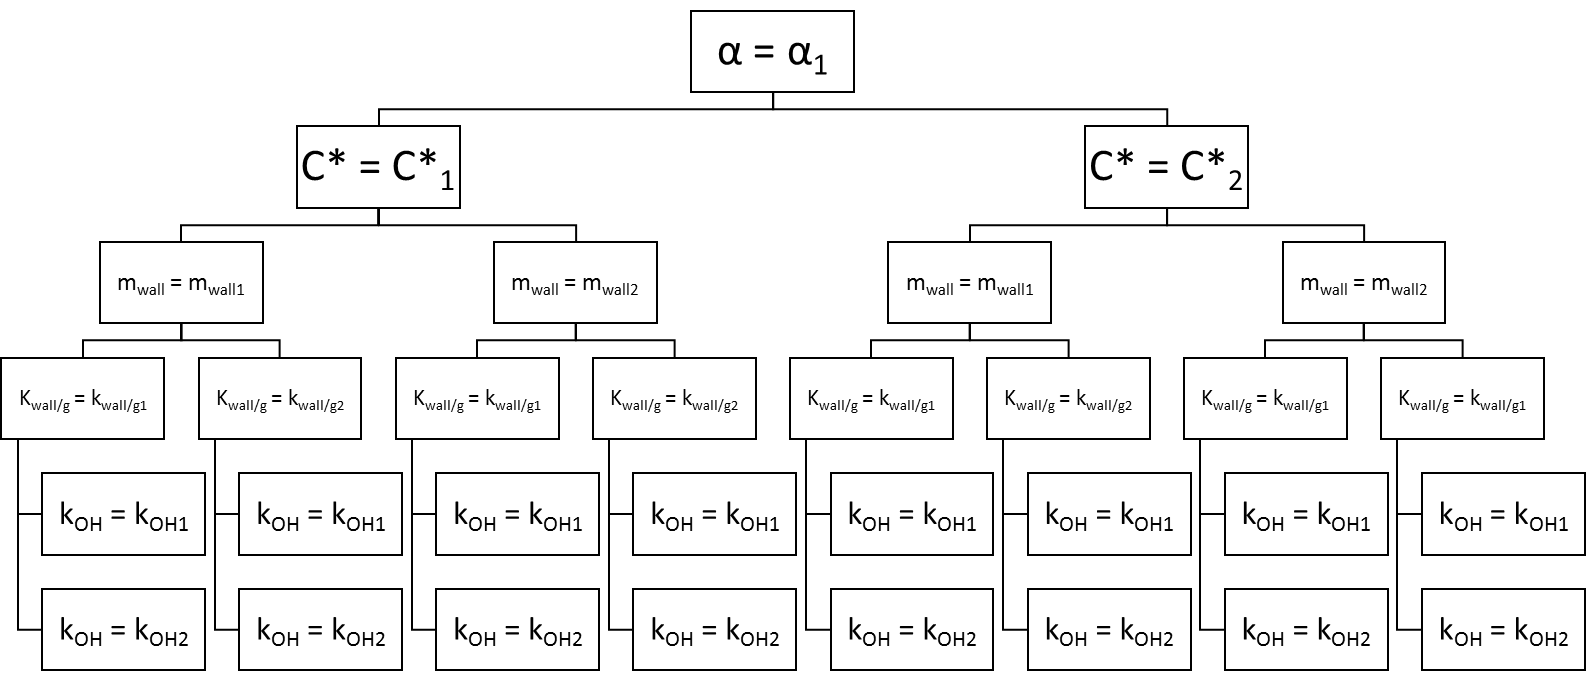
Several processes may explain the decay of these SVOCs in an atmospheric chamber. They are detailed in Fig. 1. First, particles are lost to the walls and the magnitude of the loss is dependent on the rate constant kwall∕p. Depending on their saturation mass concentration C*, compounds in the particle phase can also volatilize and react with the hydroxyl radical OH with a rate constant kOH. Finally, vapors can also be adsorbed onto the Teflon walls of the chamber with a rate constant kwall∕g.

Figure 1Theoretical framework representing the interactions between the gas phase, the particle phase, and the walls.
Because most of the parameters needed to fully describe the various processes occurring during atmospheric chamber experiments are unknown or subject to large uncertainties, we model, in a first approach, the evolution of the concentration of levoglucosan in the particle phase as measured by TAG-AMS by only considering its reactivity towards OH and the particle wall loss (Hennigan et al., 2010, 2011; Kessler et al., 2010; Lambe et al., 2010; Weitkamp et al., 2007). The aim of this first approach is mostly to compare our own data set with others, previously published (Hennigan et al., 2010, 2011). In a second approach, we consider all the processes, using a brute-force search approach to determine the unknown parameters.
3.1 First approach for levoglucosan without consideration for vapor wall loss
Figure 2a shows the particle wall-loss-corrected (pWLC) concentration of levoglucosan in the particle phase at time t normalized to the initial concentration. As stated above, after an integrated OH exposure of 5 × 10⁶ molecules cm−3 h, the concentration of levoglucosan had decreased down to 50 %–80 % of its initial concentration. The loss rate was typically higher within the first hour of aging and the concentration tended toward stabilization from this point onward.

Figure 2Particle wall-loss-corrected (pWLC) concentration of levoglucosan (normalized to its initial concentration) as a function of the integrated OH exposure.
As the concentration of OH stays roughly constant in these experiments (1–2 × 10⁶ molecules cm−3), the reaction of an organic marker with OH in atmospheric chamber experiments is often described as a pseudo-first-order reaction (Hennigan et al., 2010, 2011; Kessler et al., 2010; Lambe et al., 2010; Weitkamp et al., 2007). With this approach, the degradation rate corresponds to the slope of the relative decay of the organic marker concentration logarithmically plotted as a function of the OH exposure (Fig. 2b). Our data, in regards to the magnitude of the depletion of levoglucosan, are consistent with those of Hennigan et al. (2010, 2011) (at 295 K) with a slope of 2.5 × 10⁻¹¹ cm3 molecules−1 s−1 which is equivalent to an atmospheric lifetime of 0.5 days (considering an average OH concentration of 1 × 10⁶ molecules cm−3) with lower and upper limits of 0.2 and 1.8 days. In comparison, Hennigan et al. (2010, 2011) determined an atmospheric lifetime for levoglucosan ranging from 0.7 to 2.2 days (Fig. 2b).
However, we note the weak correlation between the fit and the experimental data (R2= 0.19, n=41, with n the total number of samples). This indicates that a pseudo-first-order reaction model fails to explain the effective depletion of levoglucosan within the atmospheric chamber during the aging phase. The experiments show a strong depletion within the first 2 h of atmospheric aging, but then the concentration remains at a stable level (experiments 2, 3, 5, and 6). This suggests that this simple approach without considering the entire processes involved cannot fully explain the observed depletion of a compound in the atmospheric chamber.
3.2 Dynamic approach with consideration for vapor wall loss
In order to take into account the entire processes occurring in an atmospheric chamber, we developed a more systematic and dynamic approach. The model here aims at predicting the concentration of a marker in the particle phase, in the gas phase, and at the walls, at any time in the atmospheric chamber (from the injection and there on) taking into account the entire processes involved: gas–particle partitioning, particle wall loss, vapor wall loss, and reactivity with the hydroxyl radicals (OH).
3.2.1 Mathematical formalism of the model
Here, the change in the concentration of a particle-phase marker i is expressed using Eq. (2):
where Ci, g is the gas-phase concentration of a compound i in µg m−3, is the gas-phase concentration at equilibrium in µg m−3, and ksink is the condensation sink in s−1. It describes the ability of the suspended particle to remove vapor by condensation and is related to the particle surface area (Erupe et al., 2010; Kulmala et al., 2001) (Eq. 3).
where Dgas is the gas-phase molecular diffusivity (10−5 m2 s−1), Nn is the particle number concentration in m3 in the size class n as measured by the SMPS, dpn is the particle diameter of the respective size class, and Fn is the Fuks-Sutugin transitional correction factor. Fn is given by Fuks and Sutugin (1971) (Eq. 4).
Kn is the dimensionless Knudsen number derived from Eq. (5), and α is the particle mass accommodation coefficient.
where λ is the gas mean free path (68 nm).
Equation (2) accounts for the gas–particle partitioning and deposition to the wall. On the premise of simplifying the equations, we now consider Ci, p as the particle wall-loss-corrected concentration of a compound i in the particle phase (see Sect. 3.1). Equation (2) can therefore be rewritten in the following manner:
Gas-phase reactivity of organic compounds with OH radicals has been demonstrated to be significantly larger than heterogeneous reactivity (by 2 or 3 orders of magnitude higher) (Esteve et al., 2006; Lambe et al., 2009; Hennigan et al., 2011; Socorro et al., 2016). Therefore, in this study, we assume the heterogeneous process to be negligible compared to the gas-phase reactions and thus only consider reactions in the gas phase. Taking into account the reactivity of the compound, its partitioning, and the deposition to the wall of the vapors, we can express the change in the concentration of a gas-phase marker Ci, g using Eq. (7):
where is the gas-phase concentration at equilibrium in µg m−3 and kwall∕g is the vapor wall loss rate in s−1. McMurry and Grosjean (1985) have defined the vapor wall loss as dependent on the surface-to-volume ratio (here, S∕V increased by approximately a factor of 2 during the experiment). Implementing in the model the loss as a function of S∕V is however difficult with our instrumentation. Therefore, the vapor wall loss rate kwall∕g determined here should be considered as an average rate for all experiments at different experimental times. is defined as the residence time of the vapors in the atmospheric chamber. and can be formulated using Eqs. (8) and (9):
and
where COAis the particle wall-loss-corrected organic aerosol concentration in µg m−3 measured by the HR-ToF-AMS, mwall is the equivalent organic mass concentration at the wall in µg m−3, and Ci,w is the concentration of the marker i at the walls in µg m−3. The change in the concentration is expressed using Eq. (10):
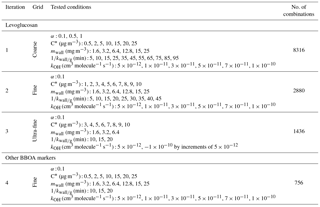
The rate constant kOH along with the accommodation coefficient α, the saturation concentration of the marker , the equivalent organic mass concentration of the wall mwall, and the residence time for the vapors are virtually unknown parameters. Unlike the particle loss rate kwall∕p, they cannot be easily constrained by experimental measurements. We determine these parameters by a brute-force search. In a brute-force search, successive conditions out of a predefined range are tested against the observed data in order to determine the optimum conditions. A loop was written in IGOR Pro 6.3 (WaveMetrics Inc.) to test for all possible combinations with a set arrangement as shown in Fig. 3. While this approach is always likely to yield a solution, it comes with a high computational cost. In order to reduce this computational cost, we initially tested the parameters over a coarse grid. This allowed us to identify the most sensitive parameters. In further iterations, we constrained the range of few parameters on a smaller range and adjusted the resolution of the gridding (Table 2).
Table 2Conditions tested for every iteration of the model in the case of levoglucosan as well as other BBOA markers (mannosan, coniferyl aldehyde, acetosyringone, and 3-guaiacyl propanol).
We use the root mean square error (RMSE) and mean bias (MB) between predicted and observed values of the particle-phase concentration (normalized to the concentration before lights are turned on) to evaluate the performance of the model and determine the best solution. The RMSE is the standard deviation of the residuals (difference between the observed and predicted value) and can be expressed as a percentage using Eq. (11):
where n is the number of samples (n=41), m is the predicted value, and o is the observed value. We calculate a general RMSE that accounts for all the samples from every experiment. A well-fitting model should minimize the RMSE. It is here our most important criterion to evaluate the accuracy of the model. The MB evaluates the tendency of the model to overestimate (negative MB) or underestimate (positive MB) the predicted values compared to the measurements.
The upper and lower limits of the range tested for each parameter were defined according to previous contributions made by other groups. The particle mass accommodation coefficient α is generally poorly constrained, although most authors have typically made use of a particle mass accommodation coefficient α comprised between 0.1 and 1 (Saleh and Khlystov, 2009; May et al., 2012; Ye et al., 2016; Platt et al., 2017). In other works, Julin et al. (2014) and Krechmer et al. (2017) determined a coefficient of near 1, and more recently Sinha et al. (2017) estimated a coefficient of 0.1–1 for fresh and aged BBOA emissions, while Bian et al. (2015) found a coefficient of 0.01–1 was applicable in their own simulation for BBOA emissions. In regards to the equivalent organic mass concentration of the wall mwall, studies typically use a mwall on the order of a few mg m−3, yet Matsunaga and Ziemann (2010) determined significantly higher mwall between 2 and 24 mg m−3 (2 mg m−3 for alkanes, 10 mg m−3 for alcohols, 4 mg m−3 for alkenes, and 24 mg m−3 for ketones). We broaden their values to include in our testing range 1.6 and 25 mg m−3 also. The residence time for the vapors is a function of the RH and atmospheric chamber characteristics. Higher RH and active mixing decrease the residence time (Loza et al., 2010). The authors have determined that residence time comprised between several hours and down to a few minutes in the case where the chamber is equipped with an active mixing system (McMurry and Grosjean, 1985; Ye et al., 2016; Krechmer et al., 2016). Ye et al. (2016) determined the residence time could also vary in proportion with the saturation concentration and is therefore compound dependent. Here, we initially considered a residence time comprised between 5 and 90 min. The work by May et al. (2012) was used as a first assumption to constrain the range of the saturation mass concentration. Considering their value of 13 µg m−3 at 298 K and an enthalpy of vaporization ΔHvap,i of 101 kJ mol−1, we calculated a of 0.5 µg m−3 at 275 K. This constituted the lower limit of the tested range for the C* of levoglucosan. The upper limit was set at 25 µg m−3. Finally, the rate constant kOH was varied between 5 × 10⁻¹² and an upper limit of 1 × 10⁻¹⁰ cm3 molecule−1 s−1 according to the collision theory of reaction rates (Seinfeld and Pandis, 2006), although we note that in their work based on a structural-activity relationship, Ziemann and Atkinson (2012) yield a value at the gas-kinetic limit >10−10 cm3 molecule−1 s−1.
3.2.2 Optimization strategy of the parameters for levoglucosan
Coarse grid – influence of the parameters
In a first iteration, the parameters are varied on a coarse grid (Table 2). The particle mass accommodation coefficient α is set to either 0.1, 0.5, or 1. The equivalent organic mass concentration at the wall mwall is set to 1.6, 3.2, 6.4, 12.8, 15, or 25 mg m−3. The residence time is set between 5 and 95 min with 10 min increments. The saturation mass concentration is set to either 0.5, 2, 5, 10, 15, 20, or 25 µg m−3. Finally, the rate constant kOH is set to either 5 × 10⁻¹², 1 × 10⁻¹¹, 3 × 10⁻¹¹, 5 × 10⁻¹¹, 7 × 10⁻¹¹, or 1 × 10⁻¹⁰ cm3 molecule−1 s−1. Over 8000 combinations are tested in this iteration.
In this first iteration, the RMSE spans 2 orders of magnitude (from 8 % to 351 %, average of 43.2 %) and a MB comprised between −35 % and 286% (average of 25 %) and greatly depends on the set of parameters used in the model. Therefore, we investigate the mean effect of each parameter on the performance of the model (RMSE) by means of a design of experiment (DOE) analysis in order to narrow down the ranges of the parameters that best fit the experimental data. The analysis was carried out using a full factorial design within the statistical tool Minitab (Minitab 17, Minitab, Inc.). Figure 4 shows the average RMSE obtained for each level of each of the parameters to be optimized. While these plots only display an average response for a given parameter and by no means should be considered as the best optimum parameters, they nonetheless serve to narrow the ranges tested and to get a more general understanding of the importance of the various processes involved.
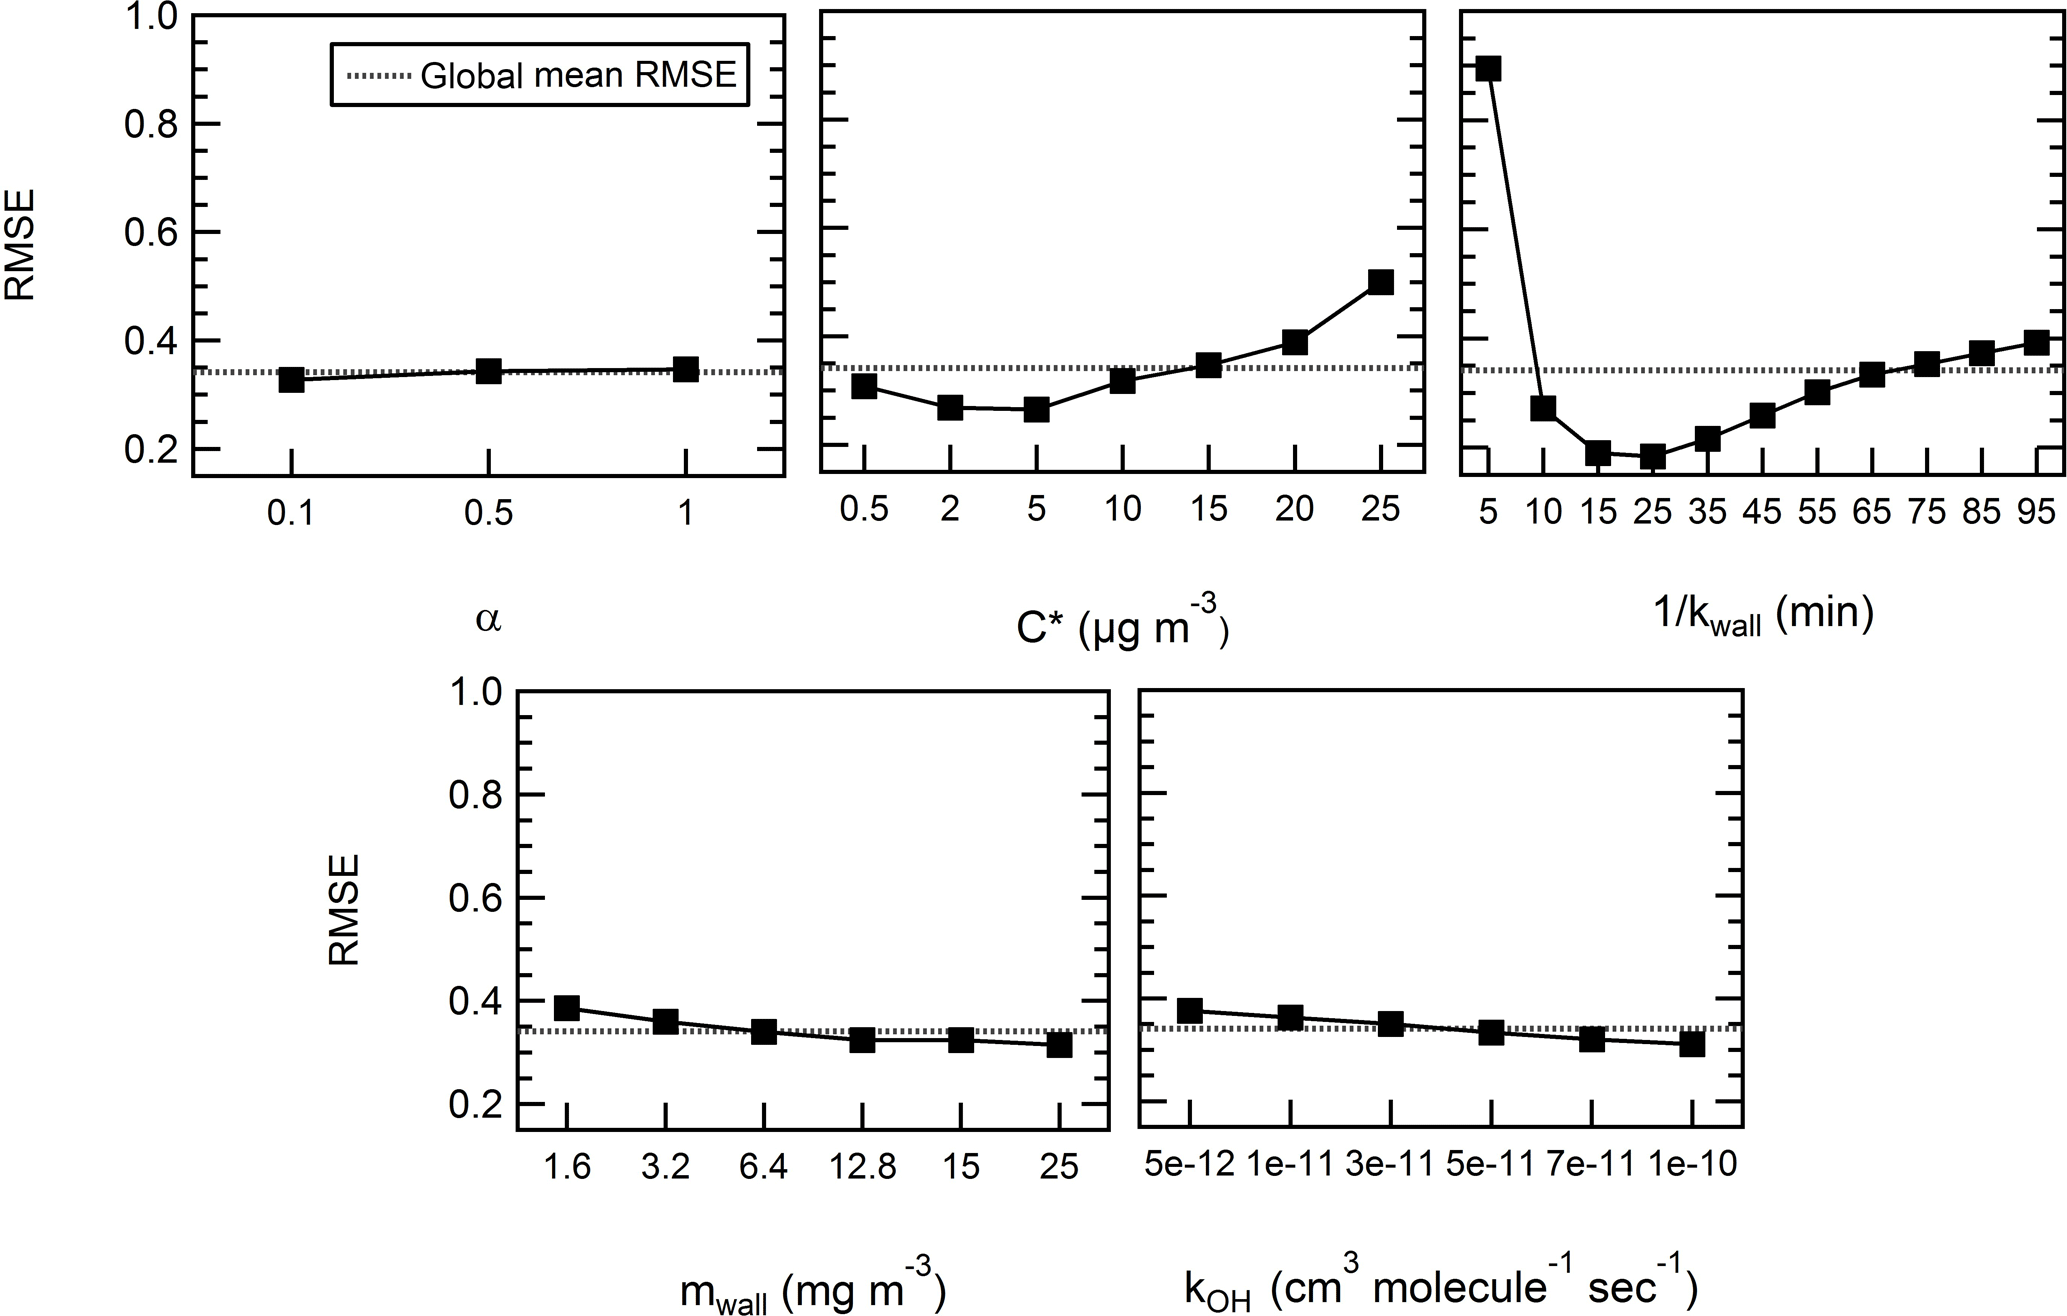
Figure 4Influence of the factors on the model in the case of levoglucosan – mean effect plots for RMSE.
Overall, the model is not sensitive to the particle mass accommodation coefficient α over the range tested. The mean RMSEs for each of the three levels, 0.1, 0.5, and 1, are 32.7 %, 34.3 %, and 34.7 %, respectively; thus, there is an amplitude between the results of only 2 %. The accommodation coefficient is used to determine the condensation sink ksink. The timescale for the condensation sink is a few seconds to less than a couple of minutes (see Fig. S4). It increases by approximately a factor of 2 within the range of accommodation coefficient values tested. The residence time and have the highest influence on the response of the model as they contribute to vary the RMSE between 18.4 % and 89.4 % and between 26.6 % and 50 %; thus, the amplitudes are 71 % and 23 %. Even without considering a residence time of 5 min which appears as an extreme, the RMSE still varies with the different levels on an amplitude of 21 %. Finally, the equivalent organic mass concentration of the wall mwall and the rate constant kOH has only a moderate impact within the range tested. The mean RMSE varies on an amplitude of 7 % and 6.5 %.
Typically, within the range tested, lower saturation mass concentration between 2 and 10 µg m−3 contributes to improve the model performance. At 0.5 µg m−3, we fail to systematically yield an acceptable result. The model underestimates the depletion every time (MB of 20 % to 30 %). The RMSE varies between 20 % and 35 %. The situation is somewhat more complex in regards to the residence time. A residence time comprised between 10 and 45 min increases the performance of the model. Best performance was obtained with a comprised between 15 and 25 min. At = 5 min, the model is generally unable to predict the observed data. A look at the effect of the interactions between the parameters (see Fig. S5) reveals this is especially true with higher saturation mass concentrations . With a high , thus assuming the compound is more volatile, and with a high vapor loss rate, the initial depletion is overestimated while the particle-phase concentration of the compound increases later on. The residence time does not influence the response of the model in the case of lower saturation mass concentrations (<5 µg m−3), or as explicitly stated, a compound with a lower volatility has a lower probability to partition in the gas phase; thus, its concentration in the particle phase cannot be driven by the vapor loss rate.
Fine grid – results
In a second iteration, the parameters are varied over a finer grid (Table 2). The ranges are selected based upon the observations made after the first iteration. Considering the model is not sensitive to the particle mass accommodation coefficient α, this parameter is set at a constant value of 0.1. The mwall and kOH parameters are left unchanged as no definite conclusion could be drawn from the first iteration. The saturation concentration is tested this time on a narrower range, between 1 and 10 µg m−3 with an increment of 1 µg m−3. The residence time of the vapor is further tested between 10 and 45 min. These ranges yield over 3000 combinations. The RMSE for each is plotted in Fig. 5. Overall, this finer grid allows to find parameters with better model performance. The RMSE varies between 7.63 % and 32.7 % (average of 19.8 %), with a MB comprised between −22.2 % and 27.6 % (average of 12.4 %). In this range, the sensitivity of the saturation mass concentration and residence time is lower than on the coarse grid. The response of the model varies, respectively, by an amplitude of 10 % (17.5 % to 27.5 %) and 14 % (13.5 % to 27.5 %). The influence of the equivalent organic mass concentration of the wall mwall on the response of the model and the reactivity is decreased as well and is not significant within the studied range (amplitude <1 % for the mwall and <3 % for the reactivity).
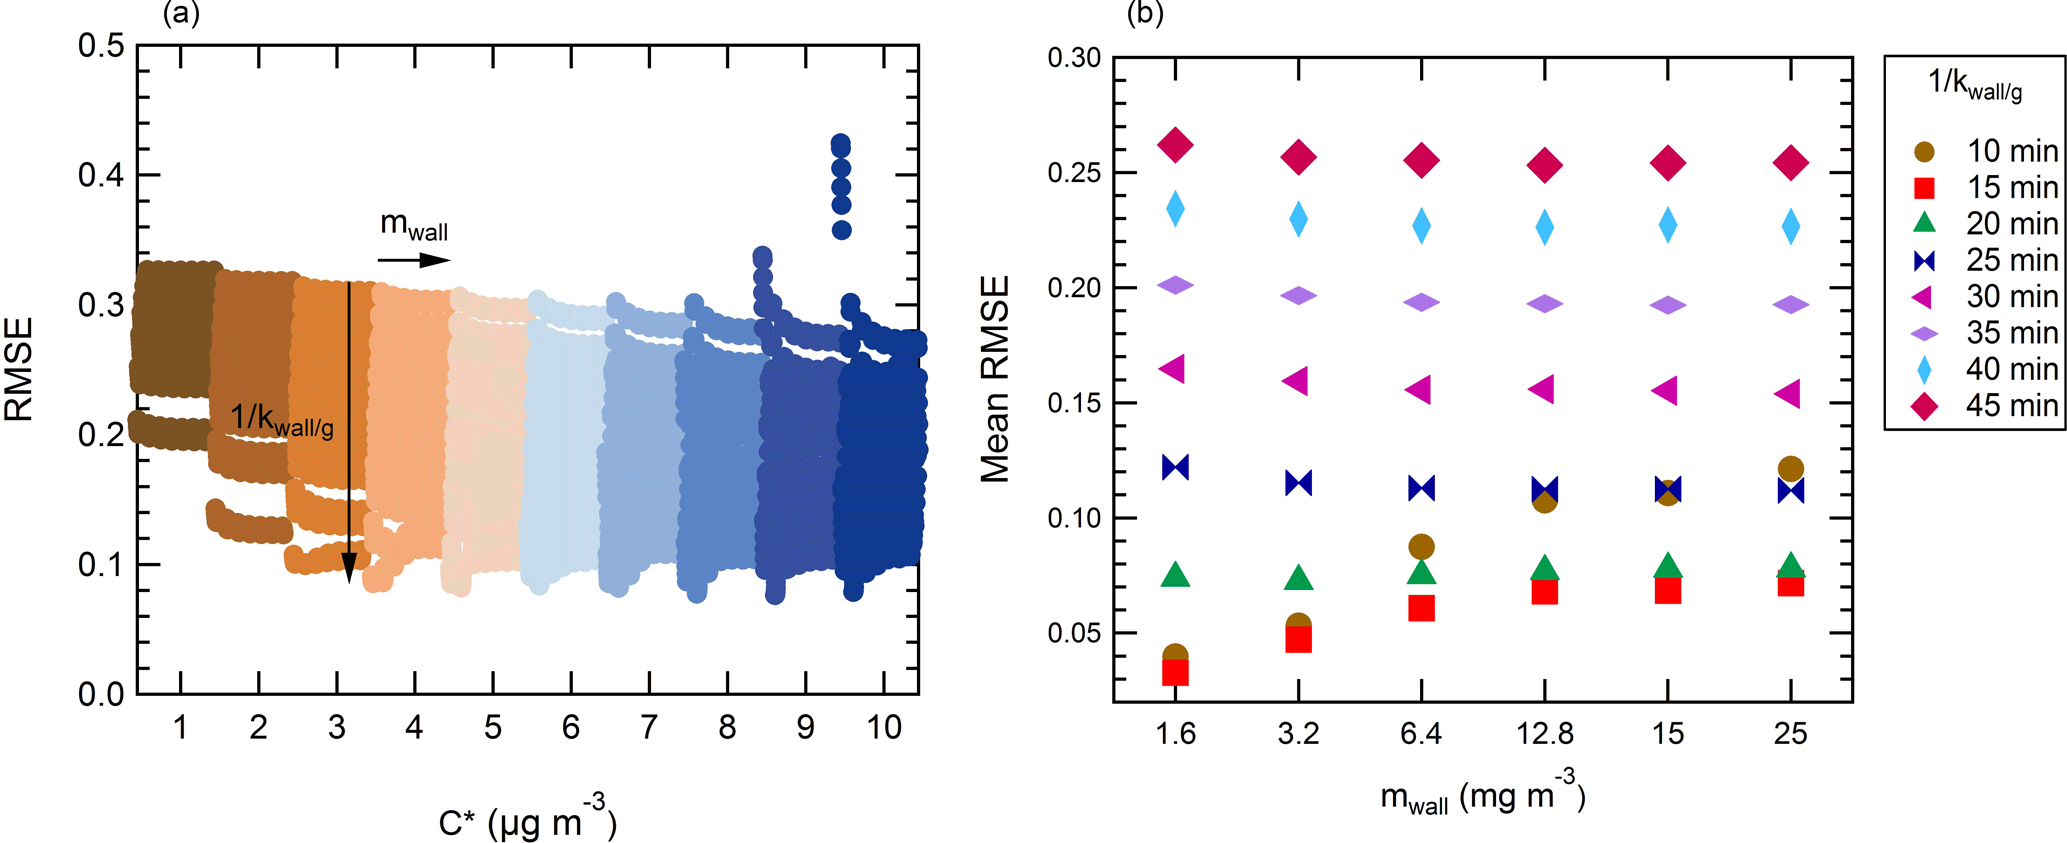
Figure 5Influence of the different conditions (tested over a fine grid) on the performance (RMSE) of the model. The accommodation coefficient is set at 0.1. (a) Illustration of the influence of the saturation mass concentration parameter. Each condition with a same is highlighted in a specific color. (b) Illustration of the average influence of the loss rate constant of the vapors kwall∕g and equivalent organic mass concentration of the wall mwall on the performance of the model (average over the whole range of tested).
Based on this iteration, we are able to determine the optimized range of parameters that best fits the experimental data (Table 3) and thus better understand the mechanism behind the observed depletion of levoglucosan. In Fig. 6, we show the observed and best fit model (RMSE of 7.63 %, MB of 0.8 %, R2 of 0.84). Considering this best fit only, experiments 1 to 4 were the best represented by the model. The model underestimated the decay of levoglucosan in the case of experiment 5. We note that, for experiments 1 to 4, the model fails to systematically represent the last data point; i.e., the model shows a continuous decay of levoglucosan, whereas the data points show the concentration is stabilizing.
Table 3Performance of the model for levoglucosan (iteration 2). Initial conditions for this run are presented in Table 2. The accommodation coefficient was set at 0.1. Best fit of the model data with the experimental measurements revealed a RMSE of 7.63 %.
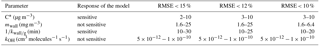
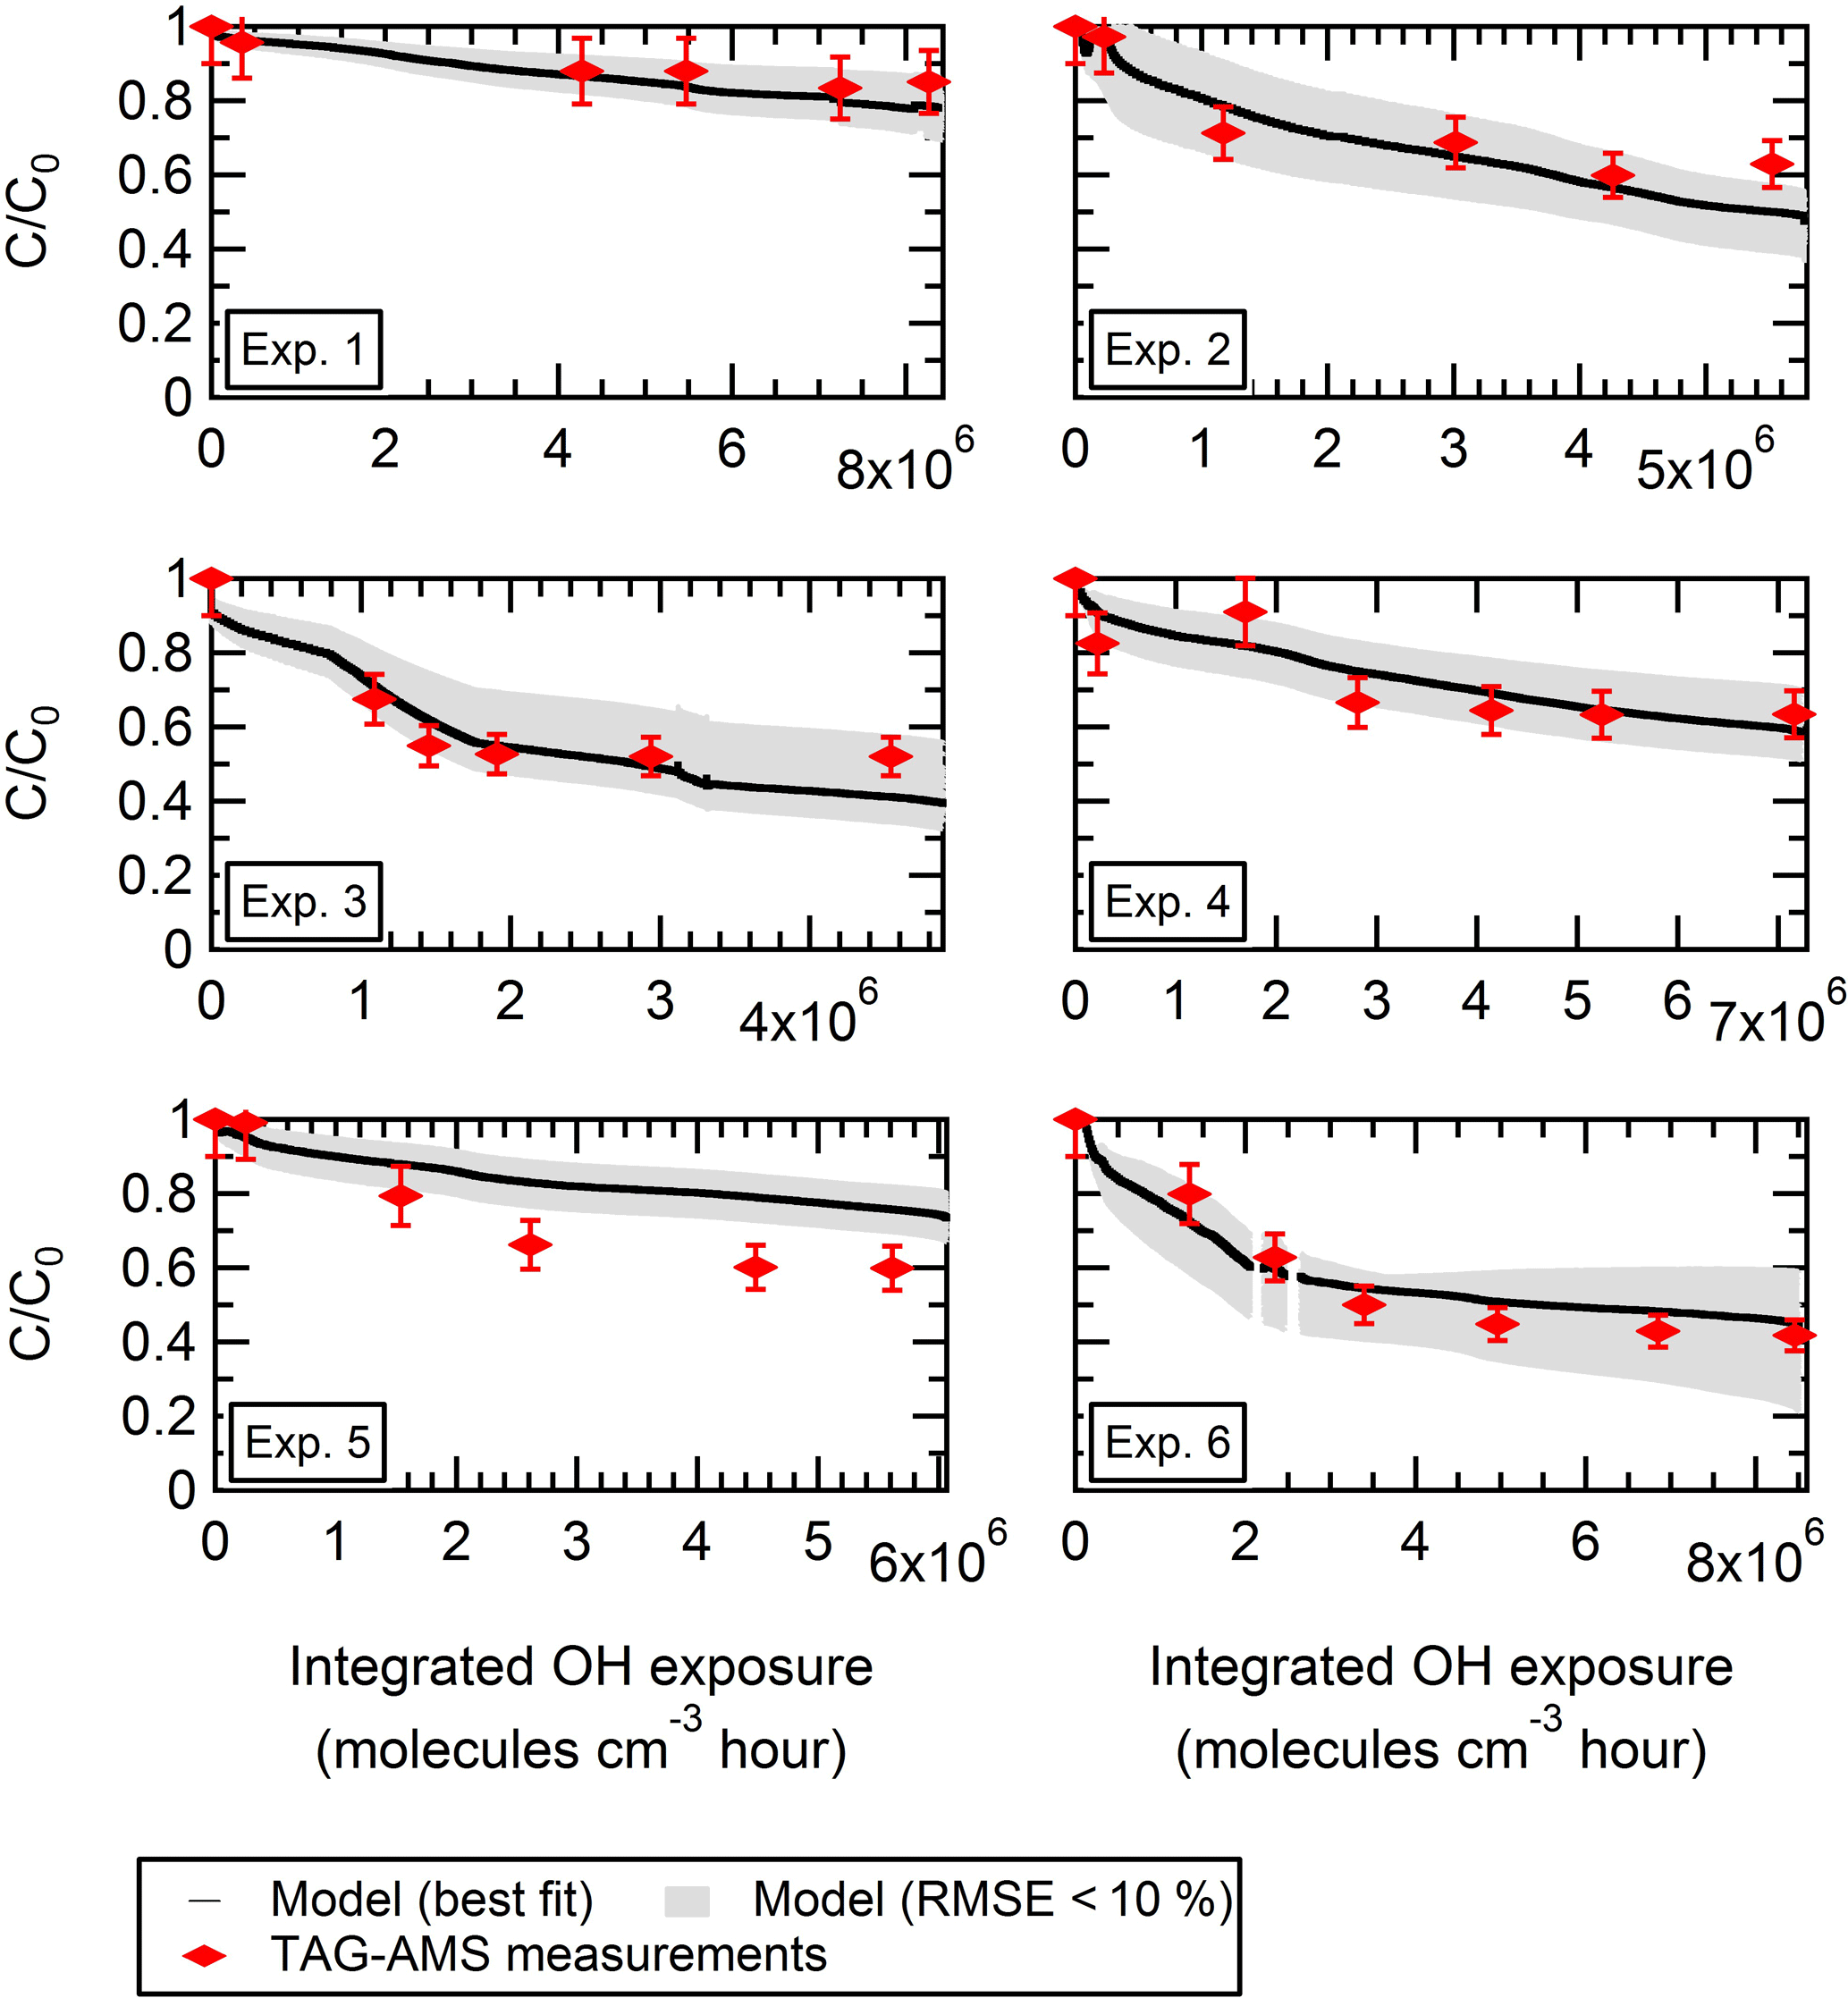
Figure 6For each replicate, observed and modeled evolution during aging of the particle-phase concentration of levoglucosan pWLC (and normalized to the initial concentration) is shown. The colored markers are the TAG-AMS measurements. The solid black line represents the best fit (with α = 0.1, 9 µg m−3, mwall = 1600 µg m−3, = 15 min, and kOH = 5 × 10⁻¹² cm3 molecules−1 s−1). RMSE is 7.63 %, and mean bias is 0.008. The grey area shows all the individual combinations with a RMSE < 10 % (see iteration 2 in Table 2).
Overall, and as in the first iteration, only the saturation mass concentration and residence time explain the depletion of levoglucosan. Typically, considering a RMSE <15 %, the optimal is comprised between 2 and 10 µg m−3 and the comprised between 10 and 35 min. With a higher degree of confidence (RMSE <12 %), it is possible to narrow the range of acceptable between 3 and 10 µg m−3. One has to consider a RMSE <10 % to narrow the range of acceptable values for the residence time to 10–25 min. The optimized range is higher than the values suggested by May et al. (2014) at 275 K; however, as stated in Sect. 3.2.1, a saturation concentration of less than 1 µg m−3 consistently failed to predict the depletion of levoglucosan observed during the experiment. The optimum range for the residence time is somewhat higher than that observed by Ye et al. (2016) on a chamber of about the same proportion (Teflon, 10 m3, 5.3 min, 273–288 K) for levoglucosan but overall constant with the whole broad range of SVOCs tested (15.7 min) (Fig. S6). Note that these parameters as evidenced before (Fig. S5) are intrinsically linked to one another, and not all combinations within the range proposed will yield satisfactory solutions. For instance, in the case of a high value, it is only when associated with a high residence time that one might observe a good fit of the data. Overall, these results are more evidence for the semi-volatile nature of levoglucosan and show the depletion of levoglucosan in the chamber can simply be explained by the significant vapor wall loss occurring during the experiment, rather than the reactivity itself.
While the mwall parameter fails to show a strong influence on the performance of the model at this level and thus cannot be considered a critical parameter to explain the depletion, we note all solutions with a RMSE < 10 % have a mwall value between 1.6 and 6.4 mg m−3 and are therefore on the lower end of the tested range. Typically, a higher associated with a lower mwall does yield a better RMSE. This optimal range is lower than that expected based on the work by Matsunaga and Ziemann (2010) (10 mg m−3 for alcohol, 298 K), but as mentioned before, the residence time and saturation concentration considered here implies that a higher mwall would only degrade the performance of the model by a margin of less than 1 %. Therefore, our results do not challenge the conclusions established by Matsunaga and Ziemman (2010).
Table 4Performance of the model for BBOA markers (iteration 4). Initial conditions for this run are presented in Table 2. The accommodation coefficient was set at 0.1.
*For mannosan, RMSE < 16 %.
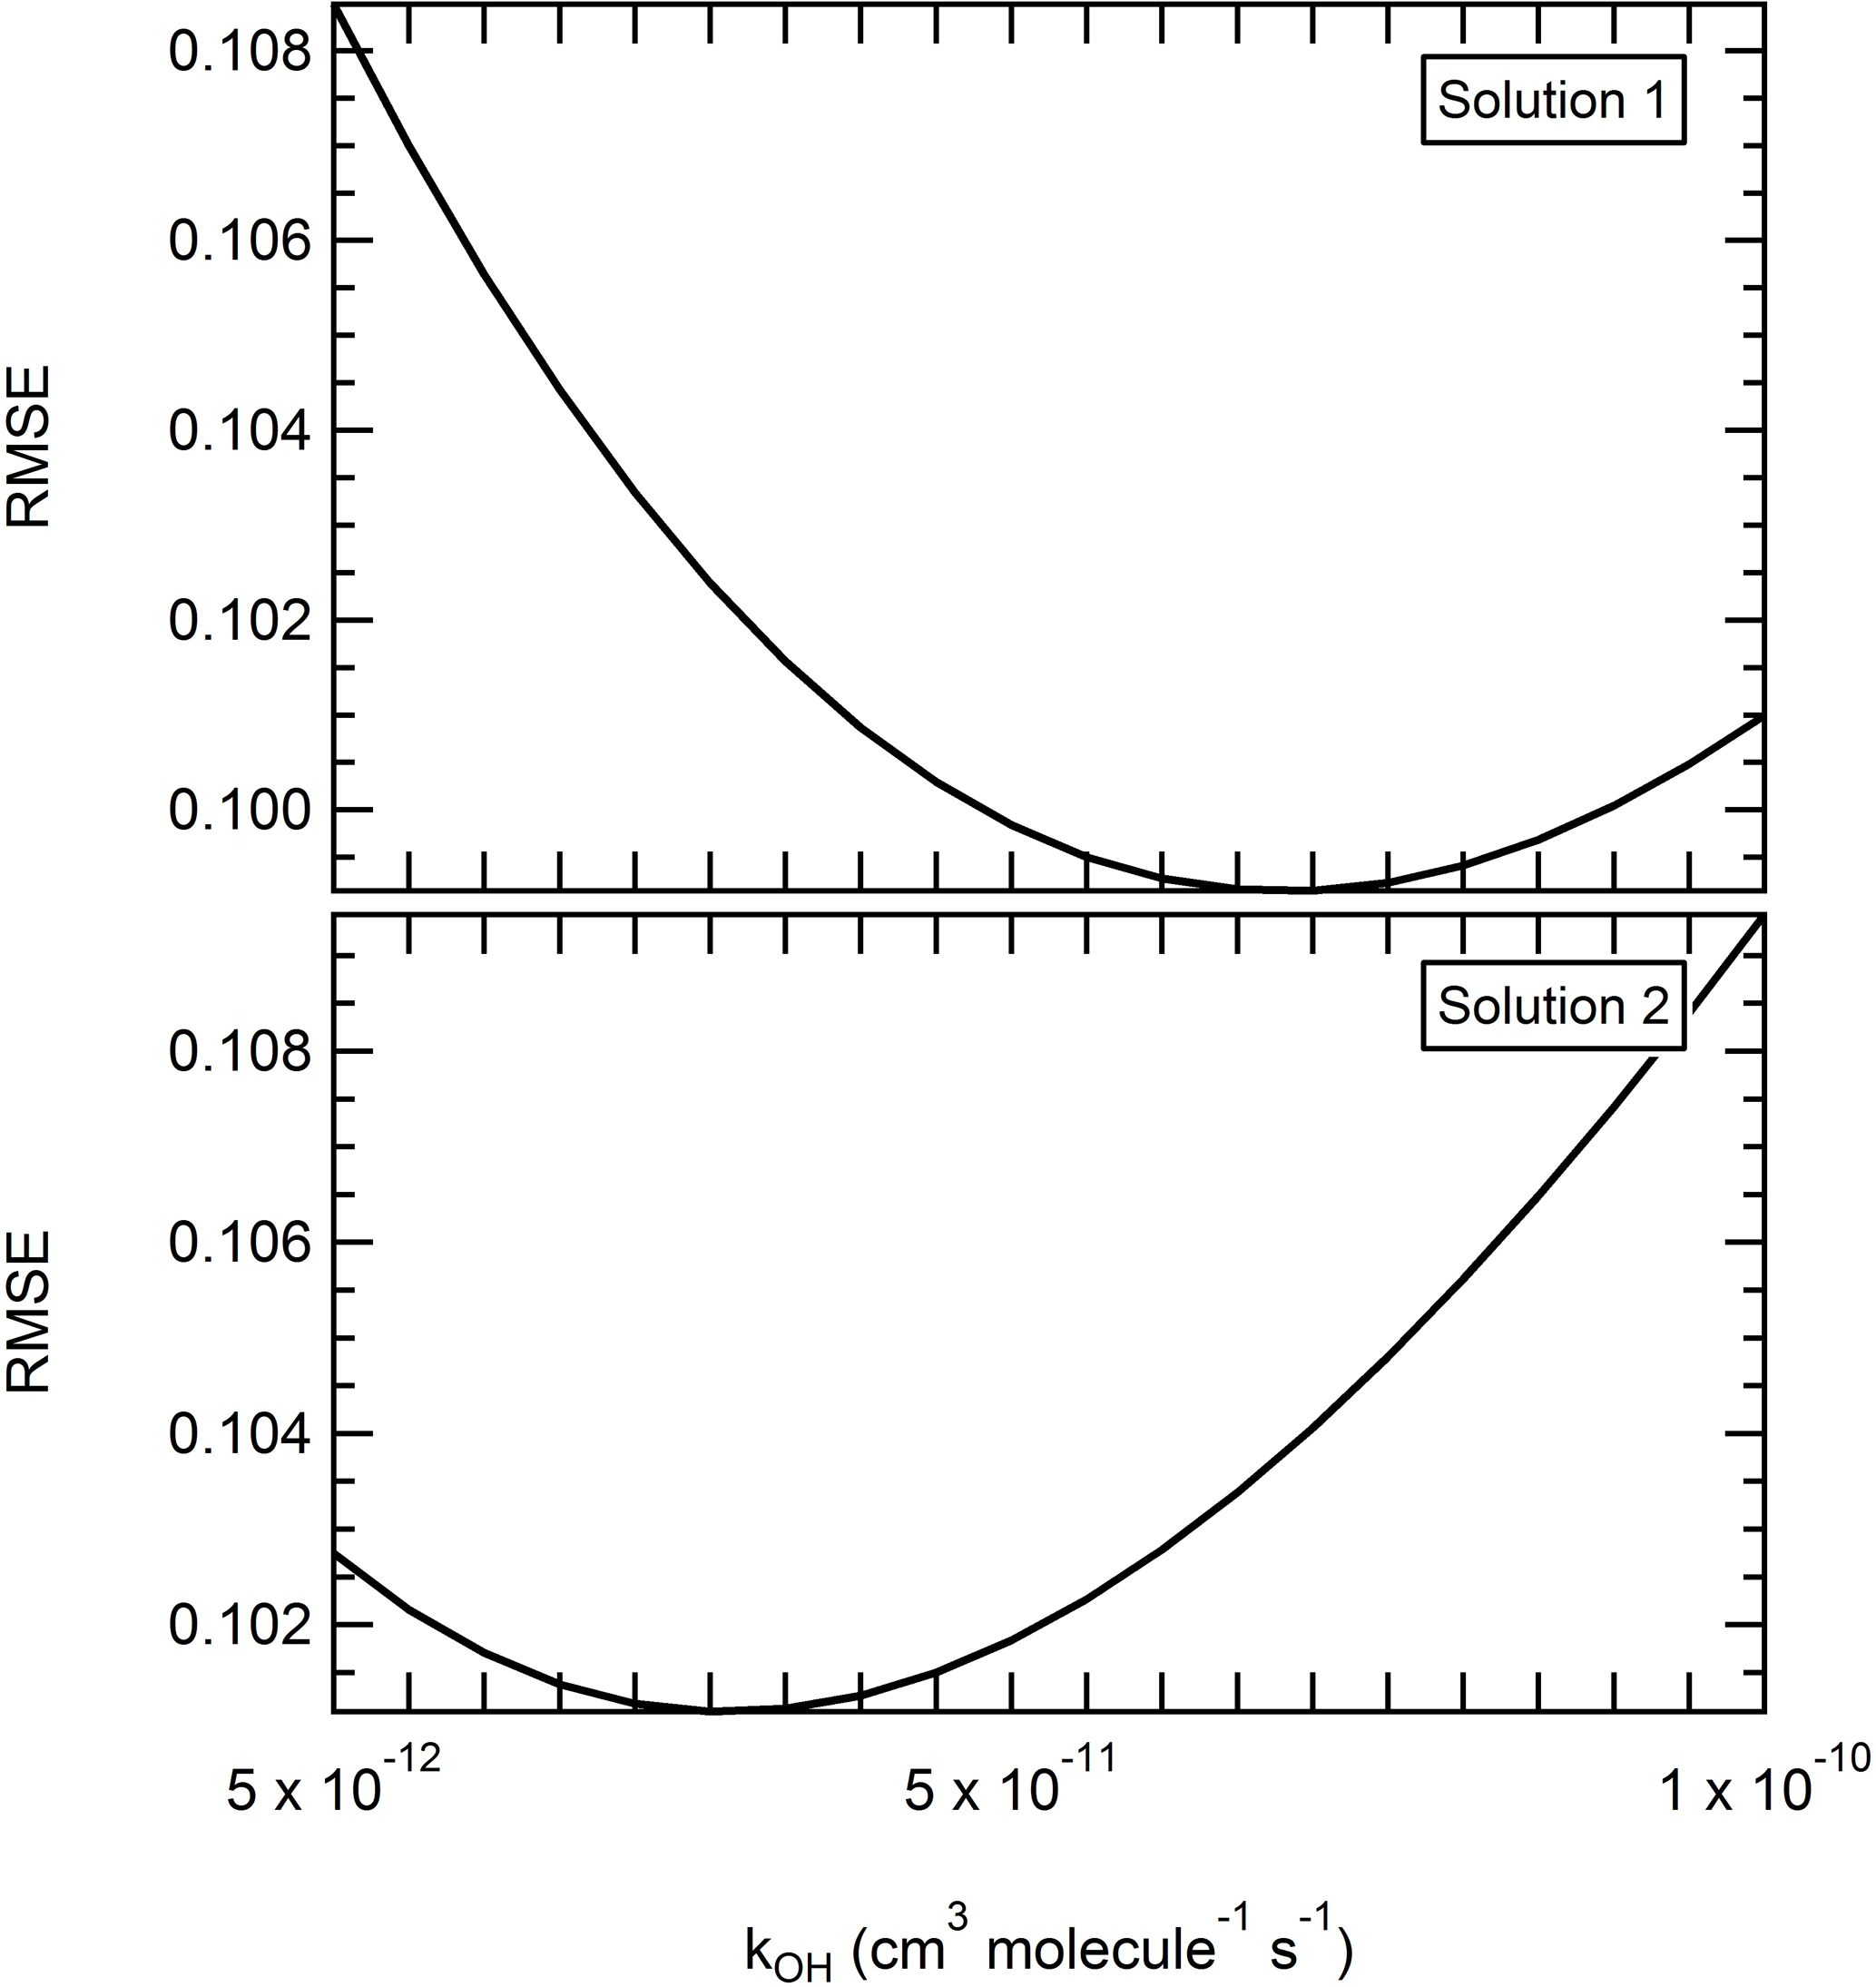
Figure 7Effect of the reactivity on the performance of the model. The reaction rate constant kOH was varied between 5 × 10⁻¹² and 1 × 10⁻¹⁰ cm3 molecules−1 s−1 by increments of 5 × 10⁻¹² cm3 molecules−1 s−1. Other parameters were set as follows: solution 1 – α = 0.1, 8 µg m−3, mwall = 1.6 mg m−3, = 20 min. Solution 2 – α = 0.1, 8 µg m−3, mwall = 3.2 mg m−3, = 20 min.
While kOH has little influence on the overall depletion occurring here, the reactivity rate constant remains an important parameter to determine. Atmospheric implications in the evidence of a high reaction rate of levoglucosan towards OH could be significant. Determining a meaningful range for the reaction rate constant kOH is however more complex. While here a higher kOH value appeared to overall improve the performance of the model, the RMSE still did not vary by a significant range (<3 % as mentioned before) when varying the kOH parameter. Furthermore, no trend among the best solutions (RMSE < 10 %) points toward a narrow range of kOH values. To better illustrate the complexity of the matter, a third iteration is ran (ultra-fine grid, Table 2). All the parameters but the reaction rate kOH are varied on a grid with only the assumed optimized range determined in iteration 2. The particle mass accommodation coefficient α is set at 0.1. The saturation mass concentration is tested between 3 and 10 µg m−3, the equivalent organic mass concentration of the wall mwall is tested between 1.6 and 6.4 mg m−3, and the residence time is tested between 10 and 20 min. The reaction rate constant kOH is varied with a finer resolution, between 5 × 10⁻¹² and 1 × 10⁻¹⁰ cm3 molecules−1 s−1 by increments of 5 × 10⁻¹² cm3 molecules−1 s−1. Over 1400 combinations are tested in this iteration. The RMSE varies between 7.63 % and 21 % (average of 12.0 %), with a MB ranging from −17.2 % to 16.2 % (average of 0.3 %). While the performance of the model now appears to be optimized with a reaction rate constant comprised between 5 × 10⁻¹² and 2 × 10⁻¹¹cm3 molecules−1 s−1, it is important to consider the small amplitude of the mean RMSE for this parameter (less than 1 %). This means that within the tested range, all the other parameters influence the response of the model more so than the reactivity does. Furthermore, these other parameters also influence the effect of the reactivity on the performance of the model. Here, even a minor change in the conditions impacts the response toward the reactivity, and two sets of conditions relatively similar to one another can generate significant differences in terms of what is a pertinent kOH. For instance, Fig. 7 shows the RMSE for different levels of the kOH in the case of two sets of conditions where the only parameter changing is the mwall (1.6 to 3.2 mg m−3). With the first set of conditions, the performance of the model is optimized with higher kOH and with a local minima around 7 × 10⁻¹² cm3 molecules−1 s−1. With the second set of conditions, we obtained a mirror evolution of the RMSE where the performance of the model was optimized with lower rate constant and a local minimum around 3 × 10⁻¹² cm3 molecules−1 s−1. Note also the range of RMSE at which the solution varied here is between 10.1 % and 10.9 % and thus has an amplitude of less than 1 %. Therefore, not only can the reactivity of levoglucosan not be considered as the decisive parameter to explain the depletion of levoglucosan observed here, but we also demonstrate that the rate constant cannot be realistically approached with this method without a better constraint on the vapor wall loss rate and the saturation mass concentration.
3.2.3 Extension to other BBOA markers
The lack of a determining effect by the degradation rate constant kOH on the depletion of the particle-phase concentration can be illustrated with other BBOA markers. We tested the model for mannosan and three methoxyphenols: coniferyl aldehyde, acetosyringone, and 3-guaiacyl propanol. The compounds are among the most abundant compounds after levoglucosan detected in the POA (Bertrand et al., 2017). We observed with TAG-AMS a depletion of these compounds comprised between 40 % and 70 % (Fig. S7). To run the model, we assumed the following parameters (Table 2): the particle mass accommodation coefficient α is set to 0.1. The equivalent organic mass concentration at the wall mwall is set to 1.6, 3.2, 6.4, 12.8, 15, or 25 mg m−3. The residence time is set between 5 and 95 min with 10 min increments. The saturation mass concentration is set to 0.5, 2, 3, 4, 5, 6, 7, 8, 9, 10, 15, 20, or 25 µg m−3. Finally, the rate constant kOH is set to either 5 × 10⁻¹², 1 × 10⁻¹¹, 3 × 10⁻¹¹, 5 × 10⁻¹¹, 7 × 10⁻¹¹, or 1 × 10⁻¹⁰ cm3 molecule−1 s−1. A total of 5148 combinations are tested for each compound.
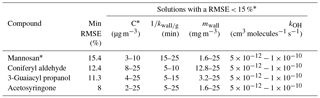
In Table 4, we report the results of the modeling. The RMSE of the best fit for each compound is reported as the minimum RMSE in the table and is under 15 % for the methoxyphenols (respectively, 12.4 %, 11.3 %, and 8 % for coniferyl aldehyde, 3-guaiacyl propanol, and acetosyringone) and at 15.4 % for mannosan. Other than the best fit, and as shown in Fig. S7, we consider that the combinations with a RMSE < 15 % (<16 % for mannosan) are acceptable solutions as well. They represent less than 13 % of all combinations. We observe that the saturation mass concentration of these sets of combinations ranges from 3 to 10 µg m−3 for mannosan, and 8 to 25, 4 to 25, and 2 to 25 µg m−3 for coniferyl aldehyde, 3-guaiacyl propanol, and acetosyringone. The residence time ranges from 15 to 25 min for mannosan, and 5 to 10, 5 to 15, and 5 to 25 min for coniferyl aldehyde, 3-guaiacyl propanol, and acetosyringone. Thus, similar to our observations made with levoglucosan, we find that only the combinations with a higher saturation mass concentration associated with a lower residence time can possibly explain the effective depletion of the compounds. It is not possible, however, to constrain the range of kOH. All tested values contain very good solutions. We calculate that, on average, a change in the rate constant kOH modifies the performance of the model by less than 0.01 %. Here as well, the rate constant kOH is not a determining parameter to explain the effective concentration depletion.
In light of the new findings regarding the importance of vapor wall loss in atmospheric chambers (Teflon) and the semi-volatile behavior of many biomass burning markers including levoglucosan, we developed a systematic modeling strategy in order to better understand the depletion of the concentration of these compounds as measured by a TAG-AMS during atmospheric chamber experiments. We attempted to model that depletion taking into account the different processes involved: vapor wall loss, particle wall loss, partitioning, and reactivity. As many of the parameters are virtually unknown or subjected to high uncertainties, we adopted a brute-force search approach. This thorough approach allowed us to predict the observed concentration of levoglucosan with a RMSE of 7.63 %, MB of 0.8 %, and a R2 of 0.84 between observed and simulated values. We determined a saturation concentration of the levoglucosan in the range of 3–10 µg m−3 and a residence time for the vapors on the order of 10–15 min. The model also succeeded in predicting the evolution of other makers (RMSE of mannosan is 14.4 %, RMSE of coniferyl aldehyde is 12.4 %, RMSE of 3-guaiacyl propanol is 11.3 %, and RMSE of acetosyringone is 8 %. We determined the following : 3–10 µg m−3 for mannosan, 8–25 µg m−3 for coniferyl aldehyde, 4–25 µg m−3 for 3-guaiacyl propanol, and 2–25 µg m−3 for acetosyringone, as well as a residence time ranging from 15 to 25 min for mannosan, 5 to 10 min for coniferyl aldehyde, 5 to 15 min for 3-guaiacyl propanol, and 5 to 25 min for acetosyringone. Overall, this approach clearly demonstrates the predominant role of the partitioning processes of the compounds towards the gas phase and their subsequent loss at the walls, on both speed and magnitude of the depletion of levoglucosan and that of other markers in the atmospheric chamber. Reactivity towards OH is, on the other hand, a non-sensitive or poorly sensitive parameter and appears to play only a minor role in the effective concentration depletion. Thus, the reaction rate kOH cannot be determined precisely without a strong constraint of the whole set of physical parameters necessary to formally describe the various processes involved, and in the first rank of which is the saturation concentration C*. Therefore, previously published rate constants of levoglucosan and more generally SVOCs with hydroxyl radicals inferred from atmospheric chamber experiments must be, at least, considered with caution.
The data sets are available upon request to the corresponding authors.
The supplement related to this article is available online at: https://doi.org/10.5194/acp-18-10915-2018-supplement.
AB was the main author. NM and AB designed the experimental strategy. AB and IEH developed the model. NM, IEH, ASP, HW, and JS were the project leaders for this measurement campaign. GS led the smog chamber operation and part of the data analysis. EB, SP, and BTR supported operations of the smog chamber and analysis of the data. All contributed to the corrections of the paper.
The authors declare that they have no conflict of interest.
This work was supported by the French Environment and Energy Management
Agency (ADEME) project VULCAIN (grant no. 1562C0019). Amelie Bertrand also
acknowledges ADEME and the Provence-Alpes-Côte d'Azur (PACA) region for
their support. The Paul Scherrer Institute acknowledges the financial contribution by the SNF
project WOOSHI and the IPR-SHOP SNF starting grant. The authors gratefully
acknowledge the MASSALYA instrumental plateform (Aix-Marseille
Université, https://lce.univ-amu.fr/, last access: 20 June 2018).
Edited by: James
Roberts
Reviewed by: two anonymous referees
Bai, J., Sun, X., Zhang, C., Xu, Y., and Qi, C.: The OH-initiated atmospheric reaction mechanism and kinetics for levoglucosan emitted in biomass burning, Chemosphere, 93, 2004–2010, https://doi.org/10.1016/j.chemosphere.2013.07.021, 2013.
Barmet, P., Dommen, J., DeCarlo, P. F., Tritscher, T., Praplan, A. P., Platt, S. M., Prévôt, A. S. H., Donahue, N. M., and Baltensperger, U.: OH clock determination by proton transfer reaction mass spectrometry at an environmental chamber, Atmos. Meas. Tech., 5, 647–656, https://doi.org/10.5194/amt-5-647-2012, 2012.
Bertrand, A., Stefenelli, G., Bruns, E. A., Pieber, S. M., Temime-Roussel, B., Slowik, J. G., Prévôt, A. S. H., Wortham, H., El Haddad, I., and Marchand, N.: Primary emissions and secondary aerosol production potential from woodstoves for residential heating: Influence of the stove technology and combustion efficiency, Atmos. Environ., 169, 65–79, https://doi.org/10.1016/j.atmosenv.2017.09.005, 2017.
Bertrand, A., Stefenelli, G., Jen, C. N., Pieber, S. M., Bruns, E. A., Ni, H., Temime-Roussel, B., Slowik, J. G., Goldstein, A. H., El Haddad, I., Baltensperger, U., Prévôt, A. S. H., Wortham, H., and Marchand, N.: Evolution of the chemical fingerprint of biomass burning organic aerosol during aging, Atmos. Chem. Phys., 18, 7607–7624, https://doi.org/10.5194/acp-18-7607-2018, 2018.
Bian, Q., May, A. A., Kreidenweis, S. M., and Pierce, J. R.: Investigation of particle and vapor wall-loss effects on controlled wood-smoke smog-chamber experiments, Atmos. Chem. Phys., 15, 11027–11045, https://doi.org/10.5194/acp-15-11027-2015, 2015.
Bonvalot, L., Tuna, T., Fagault, Y., Jaffrezo, J.-L., Jacob, V., Chevrier, F., and Bard, E.: Estimating contributions from biomass burning, fossil fuel combustion, and biogenic carbon to carbonaceous aerosols in the Valley of Chamonix: a dual approach based on radiocarbon and levoglucosan, Atmos. Chem. Phys., 16, 13753–13772, https://doi.org/10.5194/acp-16-13753-2016, 2016.
Bozzetti, C., El Haddad, I., Salameh, D., Daellenbach, K. R., Fermo, P., Gonzalez, R., Minguillón, M. C., Iinuma, Y., Poulain, L., Elser, M., Müller, E., Slowik, J. G., Jaffrezo, J.-L., Baltensperger, U., Marchand, N., and Prévôt, A. S. H.: Organic aerosol source apportionment by offline-AMS over a full year in Marseille, Atmos. Chem. Phys., 17, 8247–8268, https://doi.org/10.5194/acp-17-8247-2017, 2017
Bruns, E. A., Krapf, M., Orasche, J., Huang, Y., Zimmermann, R., Drinovec, L., Mocnik, G., El-Haddad, I., Slowik, J. G., Dommen, J., Baltensperger, U., and Prévôt, A. S. H.: Characterization of primary and secondary wood combustion products generated under different burner loads, Atmos. Chem. Phys., 15, 2825–2841, https://doi.org/10.5194/acp-15-2825-2015, 2015.
Crippa, M., DeCarlo, P. F., Slowik, J. G., Mohr, C., Heringa, M. F., Chirico, R., Poulain, L., Freutel, F., Sciare, J., Cozic, J., Di Marco, C. F., Elsasser, M., Nicolas, J. B., Marchand, N., Abidi, E., Wiedensohler, A., Drewnick, F., Schneider, J., Borrmann, S., Nemitz, E., Zimmermann, R., Jaffrezo, J.-L., Prévôt, A. S. H., and Baltensperger, U.: Wintertime aerosol chemical composition and source apportionment of the organic fraction in the metropolitan area of Paris, Atmos. Chem. Phys., 13, 961–981, https://doi.org/10.5194/acp-13-961-2013, 2013.
Donahue, N. M., Robinson, A. L., and Pandis, S. N.: Atmospheric organic particulate matter: From smoke to secondary organic aerosol, Atmos. Environ., 43, 94–106, https://doi.org/10.1016/j.atmosenv.2008.09.055, 2009.
Drinovec, L., Mocnik, G., Zotter, P., Prévôt, A. S. H., Ruckstuhl, C., Coz, E., Rupakheti, M., Sciare, J., Müller, T., Wiedensohler, A., and Hansen, A. D. A.: The “dual-spot” Aethalometer: an improved measurement of aerosol black carbon with real-time loading compensation, Atmos. Meas. Tech., 8, 1965–1979, https://doi.org/10.5194/amt-8-1965-2015, 2015.
Erupe, M. E., Benson, D. R., Li, J., Young, L.-H., Verheggen, B., Al-Refai, M., Tahboub, O., Cunningham, V., Frimpong, F., Viggiano, A. A., and Lee, S.-H.: Correlation of aerosol nucleation rate with sulfuric acid and ammonia in Kent, Ohio: An atmospheric observation, J. Geophys. Res., 115, https://doi.org/10.1029/2010JD013942, 2010.
Esteve, W., Budzinski, H., and Villenave, E.: Relative rate constants for the heterogeneous reactions of NO2 and OH radicals with polycyclic aromatic hydrocarbons adsorbed on carbonaceous particles, Part 2: PAHs adsorbed on diesel particulate exhaust SRM 1650a, Atmos. Environ., 40, 201–211, https://doi.org/10.1016/j.atmosenv.2005.07.053, 2006.
Favez, O., El Haddad, I., Piot, C., Boréave, A., Abidi, E., Marchand, N., Jaffrezo, J.-L., Besombes, J.-L., Personnaz, M.-B., Sciare, J., Wortham, H., George, C., and D'Anna, B.: Inter-comparison of source apportionment models for the estimation of wood burning aerosols during wintertime in an Alpine city (Grenoble, France), Atmos. Chem. Phys., 10, 5295–5314, https://doi.org/10.5194/acp-10-5295-2010, 2010.
Fortenberry, C. F., Walker, M. J., Zhang, Y., Mitroo, D., Brune, W. H., and Williams, B. J.: Bulk and molecular-level characterization of laboratory-aged biomass burning organic aerosol from oak leaf and heartwood fuels, Atmos. Chem. Phys., 18, 2199–2224, https://doi.org/10.5194/acp-18-2199-2018, 2018.
Fuks, N. A. and Sutugin, A. G.: Highly Dispersed Aerosols (Vysokodispersne Aerozoli), 90, 1971.
Hennigan, C. J., Sullivan, A. P., Collett, J. L., and Robinson, A. L.: Levoglucosan stability in biomass burning particles exposed to hydroxyl radicals, Geophys. Res. Lett., 37, L09806, https://doi.org/10.1029/2010GL043088, 2010.
Hennigan, C. J., Miracolo, M. A., Engelhart, G. J., May, A. A., Presto, A. A., Lee, T., Sullivan, A. P., McMeeking, G. R., Coe, H., Wold, C. E., Hao, W.-M., Gilman, J. B., Kuster, W. C., de Gouw, J., Schichtel, B. A., Collett Jr., J. L., Kreidenweis, S. M., and Robinson, A. L.: Chemical and physical transformations of organic aerosol from the photo-oxidation of open biomass burning emissions in an environmental chamber, Atmos. Chem. Phys., 11, 7669–7686, https://doi.org/10.5194/acp-11-7669-2011, 2011.
Hildebrandt, L., Donahue, N. M., and Pandis, S. N.: High formation of secondary organic aerosol from the photo-oxidation of toluene, Atmos. Chem. Phys., 9, 2973–2986, https://doi.org/10.5194/acp-9-2973-2009, 2009.
Hoffmann, D., Tilgner, A., Iinuma, Y., and Herrmann, H.: Atmospheric Stability of Levoglucosan: A Detailed Laboratory and Modeling Study, Environ. Sci. Technol., 44, 694–699, https://doi.org/10.1021/es902476f, 2010.
Isaacman, G., Kreisberg, N. M., Yee, L. D., Worton, D. R., Chan, A. W. H., Moss, J. A., Hering, S. V., and Goldstein, A. H.: Online derivatization for hourly measurements of gas- and particle-phase semi-volatile oxygenated organic compounds by thermal desorption aerosol gas chromatography (SV-TAG), Atmos. Meas. Tech., 7, 4417–4429, https://doi.org/10.5194/amt-7-4417-2014, 2014.
Jordan, T. B., Seen, A. J., Jacobsen, G. E., and Gras, J. L.: Radiocarbon determination of woodsmoke contribution to air particulate matter in Launceston, Tasmania, Atmos. Environ., 40, 2575–2582, https://doi.org/10.1016/j.atmosenv.2005.12.024, 2006.
Julin, J., Winkler, P. M., Donahue, N. M., Wagner, P. E., and Riipinen, I.: Near-Unity Mass Accommodation Coefficient of Organic Molecules of Varying Structure, Environ. Sci. Technol., 48, 12083–12089, https://doi.org/10.1021/es501816h, 2014.
Kanakidou, M., Seinfeld, J. H., Pandis, S. N., Barnes, I., Dentener, F. J., Facchini, M. C., Van Dingenen, R., Ervens, B., Nenes, A., Nielsen, C. J., Swietlicki, E., Putaud, J. P., Balkanski, Y., Fuzzi, S., Horth, J., Moortgat, G. K., Winterhalter, R., Myhre, C. E. L., Tsigaridis, K., Vignati, E., Stephanou, E. G., and Wilson, J.: Organic aerosol and global climate modelling: a review, Atmos. Chem. Phys., 5, 1053–1123, https://doi.org/10.5194/acp-5-1053-2005, 2005.
Kecorius, S., Ma, N., Teich, M., van Pinxteren, D., Zhang, S., Größ, J., Spindler, G., Müller, K., Iinuma, Y., Hu, M., Herrmann, H., and Wiedensohler, A.: Influence of biomass burning on mixing state of sub-micron aerosol particles in the North China Plain, Atmos. Environ., 164, 259–269, https://doi.org/10.1016/j.atmosenv.2017.05.023, 2017.
Kessler, S. H., Smith, J. D., Che, D. L., Worsnop, D. R., Wilson, K. R., and Kroll, J. H.: Chemical Sinks of Organic Aerosol: Kinetics and Products of the Heterogeneous Oxidation of Erythritol and Levoglucosan, Environ. Sci. Technol., 44, 7005–7010, https://doi.org/10.1021/es101465m, 2010.
Klein, F., Platt, S. M., Farren, N. J., Detournay, A., Bruns, E. A., Bozzetti, C., Daellenbach, K. R., Kilic, D., Kumar, N. K., Pieber, S. M., Slowik, J. G., Temime-Roussel, B., Marchand, N., Hamilton, J. F., Baltensperger, U., Prévôt, A. S. H., and El Haddad, I.: Characterization of Gas-Phase Organics Using Proton Transfer Reaction Time-of-Flight Mass Spectrometry: Cooking Emissions, Environ. Sci. Technol., 50, 1243–1250, https://doi.org/10.1021/acs.est.5b04618, 2016.
Krechmer, J. E., Day, D. A., Ziemann, P. J., and Jimenez, J. L.: Direct Measurements of Gas/Particle Partitioning and Mass Accommodation Coefficients in Environmental Chambers, Environ. Sci. Technol., 51, 11867–11875, https://doi.org/10.1021/acs.est.7b02144, 2017.
Kulmala, M., Maso, M., Mäkelä, J. M., Pirjola, L., Väkevä, M., Aalto, P., Miikkulainen, P., Hämeri, K., and O'dowd, C. D.: On the formation, growth and composition of nucleation mode particles, Tellus B, 53, 479–490, 2001.
Krechmer, J. E., Pagonis, D., Ziemann, P. J., and Jimenez, J. L.: Quantification of Gas-Wall Partitioning in Teflon Environmental Chambers Using Rapid Bursts of Low-Volatility Oxidized Species Generated in Situ, Environ. Sci. Technol., 50, 5757–5765, https://doi.org/10.1021/acs.est.6b00606, 2016.
La, Y. S., Camredon, M., Ziemann, P. J., Valorso, R., Matsunaga, A., Lannuque, V., Lee-Taylor, J., Hodzic, A., Madronich, S., and Aumont, B.: Impact of chamber wall loss of gaseous organic compounds on secondary organic aerosol formation: explicit modeling of SOA formation from alkane and alkene oxidation, Atmos. Chem. Phys., 16, 1417–1431, https://doi.org/10.5194/acp-16-1417-2016, 2016.
Lai, C., Liu, Y., Ma, J., Ma, Q., and He, H.: Degradation kinetics of levoglucosan initiated by hydroxyl radical under different environmental conditions, Atmos. Environ., 91, 32–39, https://doi.org/10.1016/j.atmosenv.2014.03.054, 2014.
Lambe, A. T., Miracolo, M. A., Hennigan, C. J., Robinson, A. L., and Donahue, N. M.: Effective Rate Constants and Uptake Coefficients for the Reactions of Organic Molecular Markers (n-Alkanes, Hopanes, and Steranes) in Motor Oil and Diesel Primary Organic Aerosols with Hydroxyl Radicals, Environ. Sci. Technol., 43, 8794–8800, https://doi.org/10.1021/es901745h, 2009.
Lambe, A. T., Chacon-Madrid, H. J., Nguyen, N. T., Weitkamp, E. A., Kreisberg, N. M., Hering, S. V., Goldstein, A. H., Donahue, N. M., and Robinson, A. L.: Organic Aerosol Speciation: Intercomparison of Thermal Desorption Aerosol GC/MS (TAG) and Filter-Based Techniques, Aerosol Sci. Technol., 44, 141–151, https://doi.org/10.1080/02786820903447206, 2010.
Loza, C. L., Chan, A. W., Galloway, M. M., Keutsch, F. N., Flagan, R. C., and Seinfeld, J. H.: Characterization of vapor wall loss in laboratory chambers, Environ. Sci. Technol., 44, 5074–5078, 2010.
Matsunaga, A. and Ziemann ‡, P. J.: Gas-Wall Partitioning of Organic Compounds in a Teflon Film Chamber and Potential Effects on Reaction Product and Aerosol Yield Measurements, Aerosol Sci. Technol., 44, 881–892, https://doi.org/10.1080/02786826.2010.501044, 2010.
May, A. A., Saleh, R., Hennigan, C. J., Donahue, N. M., and Robinson, A. L.: Volatility of Organic Molecular Markers Used for Source Apportionment Analysis: Measurements and Implications for Atmospheric Lifetime, Environ. Sci. Technol., 46, 12435–12444, https://doi.org/10.1021/es302276t, 2012.
McMurry, P. H. and Grosjean, D.: Gas and aerosol wall losses in Teflon film smog chambers, Environ. Sci. Technol., 19, 1176–1182, https://doi.org/10.1021/es00142a006, 1985.
Pandis, S. N., Donahue, N. M., Murphy, B. N., Riipinen, I., Fountoukis, C., Karnezi, E., Patoulias, D., and Skyllakou, K.: Introductory lecture: Atmospheric organic aerosols: insights from the combination of measurements and chemical transport models, Faraday Discuss., 165, 9–24, https://doi.org/10.1039/c3fd00108c, 2013.
Pankow, J. F. and Asher, W. E.: SIMPOL.1: a simple group contribution method for predicting vapor pressures and enthalpies of vaporization of multifunctional organic compounds, Atmos. Chem. Phys., 8, 2773–2796, https://doi.org/10.5194/acp-8-2773-2008, 2008.
Piot, C., Jaffrezo, J.-L., Cozic, J., Pissot, N., El Haddad, I., Marchand, N., and Besombes, J.-L.: Quantification of levoglucosan and its isomers by High Performance Liquid Chromatography – Electrospray Ionization tandem Mass Spectrometry and its applications to atmospheric and soil samples, Atmos. Meas. Tech., 5, 141–148, https://doi.org/10.5194/amt-5-141-2012, 2012.
Platt, S. M., El Haddad, I., Zardini, A. A., Clairotte, M., Astorga, C., Wolf, R., Slowik, J. G., Temime-Roussel, B., Marchand, N., Ježek, I., Drinovec, L., Mocnik, G., Möhler, O., Richter, R., Barmet, P., Bianchi, F., Baltensperger, U., and Prévôt, A. S. H.: Secondary organic aerosol formation from gasoline vehicle emissions in a new mobile environmental reaction chamber, Atmos. Chem. Phys., 13, 9141–9158, https://doi.org/10.5194/acp-13-9141-2013, 2013.
Platt, S. M., El Haddad, I., Pieber, S. M., Zardini, A. A., Suarez-Bertoa, R., Clairotte, M., Daellenbach, K. R., Huang, R.-J., Slowik, J. G., Hellebust, S., Temime-Roussel, B., Marchand, N., de Gouw, J., Jimenez, J. L., Hayes, P. L., Robinson, A. L., Baltensperger, U., Astorga, C., and Prévôt, A. S. H.: Gasoline cars produce more carbonaceous particulate matter than modern filter-equipped diesel cars, Sci. Rep., 7, 4926, https://doi.org/10.1038/s41598-017-03714-9, 2017.
Pope, C. A. and Dockery, D. W.: Health Effects of Fine Particulate Air Pollution: Lines that Connect, J. Air Waste Manag. Assoc., 56, 709–742, https://doi.org/10.1080/10473289.2006.10464485, 2006.
Puxbaum, H., Caseiro, A., Sánchez-Ochoa, A., Kasper-Giebl, A., Claeys, M., Gelencsér, A., Legrand, M., Preunkert, S., and Pio, C.: Levoglucosan levels at background sites in Europe for assessing the impact of biomass combustion on the European aerosol background, J. Geophys. Res., 112, D23S05, https://doi.org/10.1029/2006JD008114, 2007.
Raatikainen, T., Brus, D., Hyv arinen, A.-P., Svensson, J., Asmi, E., and Lihavainen, H.: Black carbon concentrations and mixing state in the Finnish Arctic, Atmos. Chem. Phys., 15, 10057–10070, https://doi.org/10.5194/acp-15-10057-2015, 2015.
Reid, J. S., Koppmann, R., Eck, T. F., and Eleuterio, D. P.: A review of biomass burning emissions part II: intensive physical properties of biomass burning particles, Atmos. Chem. Phys., 5, 799–825, https://doi.org/10.5194/acp-5-799-2005, 2005.
Saleh, R. and Khlystov, A.: Determination of Activity Coefficients of Semi-Volatile Organic Aerosols Using the Integrated Volume Method, Aerosol Sci. Technol., 43, 838–846, https://doi.org/10.1080/02786820902959474, 2009.
Schwarz, J. P., Gao, R. S., Spackman, J. R., Watts, L. A., Thomson, D. S., Fahey, D. W., Ryerson, T. B., Peischl, J., Holloway, J. S., Trainer, M., Frost, G. J., Baynard, T., Lack, D. A., de Gouw, J. A., Warneke, C., and Del Negro, L. A.: Measurement of the mixing state, mass, and optical size of individual black carbon particles in urban and biomass burning emissions, Geophys. Res. Lett., 35, L13810, https://doi.org/10.1029/2008GL033968, 2008.
Seinfeld, J. H. and Pandis, S. N.: Atmospheric chemistry and physics: from air pollution to climate change, 2 edn., J. Wiley, Hoboken, N.J., 2006.
Simoneit, B. R., Schauer, J. J., Nolte, C. G., Oros, D. R., Elias, V. O., Fraser, M. P., Rogge, W. F., and Cass, G. R.: Levoglucosan, a tracer for cellulose in biomass burning and atmospheric particles, Atmos. Environ., 33, 173–182, 1999.
Sinha, A., Saleh, R., Robinson, E. S., Ahern, A. T., Tkacik, D. S., Presto, A. A., Sullivan, R. C., Robinson, A. L., and Donahue, N. M.: Mass accommodation coefficients of fresh and aged biomass-burning emissions, Aerosol Sci. Technol., 52, 1–10, https://doi.org/10.1080/02786826.2017.1413488, 2017.
Sippula, O.: Fine particle formation and emissions in biomass combustion, available at: http://www.atm.helsinki.fi/faar/reportseries/rs-108.pdf (last access: 7 June 2016), 2010.
Socorro, J., Durand, A., Temime-Roussel, B., Gligorovski, S., Wortham, H., and Quivet, E.: The persistence of pesticides in atmospheric particulate phase: An emerging air quality issue, Scientific Reports, 6, 33456, 2016.
Trump, E. R., Epstein, S. A., Riipinen, I., and Donahue, N. M.: Wall effects in smog chamber experiments: A model study, Aerosol Sci. Technol., 50, 1180–1200, https://doi.org/10.1080/02786826.2016.1232858, 2016.
Weitkamp, E. A., Sage, A. M., Pierce, J. R., Donahue, N. M., and Robinson, A. L.: Organic Aerosol Formation from Photochemical Oxidation of Diesel Exhaust in a Smog Chamber, Environ. Sci. Technol., 41, 6969–6975, https://doi.org/10.1021/es070193r, 2007.
Williams, B. J., Goldstein, A. H., Kreisberg, N. M., and Hering, S. V.: An In-Situ Instrument for Speciated Organic Composition of Atmospheric Aerosols: T hermal Desorption A erosol G C/MS-FID (TAG), Aerosol Sci. Technol., 40, 627–638, https://doi.org/10.1080/02786820600754631, 2006.
Williams, B. J., Jayne, J. T., Lambe, A. T., Hohaus, T., Kimmel, J. R., Sueper, D., Brooks, W., Williams, L. R., Trimborn, A. M., Martinez, R. E., Hayes, P. L., Jimenez, J. L., Kreisberg, N. M., Hering, S. V., Worton, D. R., Goldstein, A. H., and Worsnop, D. R.: The First Combined Thermal Desorption Aerosol Gas Chromatograph – Aerosol Mass Spectrometer (TAG-AMS), Aerosol Sci. Technol., 48, 358–370, https://doi.org/10.1080/02786826.2013.875114, 2014.
Ye, P., Ding, X., Hakala, J., Hofbauer, V., Robinson, E. S., and Donahue, N. M.: Vapor wall loss of semi-volatile organic compounds in a Teflon chamber, Aerosol Sci. Technol., 50, 822–834, https://doi.org/10.1080/02786826.2016.1195905, 2016.
Zhang, X., Cappa, C. D., Jathar, S. H., McVay, R. C., Ensberg, J. J., Kleeman, M. J., and Seinfeld, J. H.: Influence of vapor wall loss in laboratory chambers on yields of secondary organic aerosol, Proc. Natl. Acad. Sci. USA, 111, 5802–5807, https://doi.org/10.1073/pnas.1404727111, 2014.
Ziemann, P. J. and Atkinson, R.: Kinetics, products, and mechanisms of secondary organic aerosol formation, Chem. Soc. Rev., 41, 6582, https://doi.org/10.1039/c2cs35122f, 2012.