the Creative Commons Attribution 4.0 License.
the Creative Commons Attribution 4.0 License.
 | 26 Jul 2018
Contributions of residential coal combustion to the air quality in Beijing–Tianjin–Hebei (BTH), China: a case study
Xia Li
Jiarui Wu
Miriam Elser
Tian Feng
Junji Cao
Imad El-Haddad
Rujin Huang
Xuexi Tie
André S. H. Prévôt
Guohui Li
In the present study, the WRF-Chem model is used to assess contributions of residential coal combustion (RCC) emissions to the air quality in Beijing–Tianjin–Hebei (BTH) during a persistent air pollution episode from 9 to 25 January 2014. In general, the predicted temporal variations and spatial distributions of the mass concentrations of air pollutants are in good agreement with observations at monitoring sites in BTH. The WRF-Chem model also reasonably reproduces the temporal variations in aerosol species when compared with the aerosol mass spectrometer measurements in Beijing. The RCC emissions play an important role in the haze formation in BTH, contributing about 23.1 % of PM2.5 (fine particulate matter) and 42.6 % of SO2 during the simulation period on average. Organic aerosols dominate the PM2.5 from the RCC emissions in BTH, with a contribution of 42.8 %, followed by sulfate (17.1 %). The air quality in Beijing is remarkably improved when the RCC emissions in BTH and the surrounding areas are excluded in model simulations, with a 30 % decrease in PM2.5 mass concentrations. However, if only the RCC emissions in Beijing are excluded, the local PM2.5 mass concentration is decreased by 18.0 % on average. Our results suggest that the implementation of the residential coal replacement by clean energy sources in Beijing is beneficial to the local air quality. Should residential coal replacement be carried out in BTH and its surrounding areas, the air quality in Beijing would be improved remarkably. Further studies would need to consider uncertainties in the emission inventory and meteorological fields.
- Article
(14460 KB) - Full-text XML
- BibTeX
- EndNote


Over the several past decades, China has experienced rapid economic growth, accompanied by accelerating industrialization and urbanization, which has seriously deteriorated air quality (e.g., Zhang et al., 2009, 2012, 2015). Recently, haze pollution has become the primary concern about air quality in most key regions and cities in China, especially in Beijing–Tianjin–Hebei (BTH) and the Yangtze River Delta (YRD) (e.g., Wang et al., 2005, 2014; An et al., 2007; Chen et al., 2016; Gao et al., 2016). The severe and persistent haze pollution with high concentrations of fine particulate matter (PM2.5) and the consequent low visibility is mainly caused by heavy anthropogenic emissions and unfavorable synoptic situations (e.g., Seinfeld and Pandis, 2006; Lei et al., 2011; Lv et al., 2016; Wang et al., 2016; Zíková et al., 2016). According to China's Ministry of Environment Protection (MEP), the annual mean mass concentration of PM2.5 was 102 µg m−3 in 2013 and 93 µg m−3 in 2014 in BTH, far beyond the World Health Organization (WHO) interim target 1 of 35 µg m−3 for the annual mean PM2.5 mass concentration and the secondary class standard in China's new National Ambient Air Quality Standards (NAAQS, GB3095-2012). Therefore, in order to improve the air quality in BTH, the Chinese State Council issued the Air Pollution Prevention and Control Action Plan (APPCAP) in September 2013 to reduce PM2.5 by 25 % by 2017 relative to 2012 levels. Since implementation of the APPCAP, stringent control strategies have been carried out to reduce pollutant emissions from power plants, industries, and transportation (Sheehan et al., 2014; Liu et al., 2015; Yang et al., 2016). Control strategies have also been implemented to reduce residential emissions, but evaluation means constrained by observations are still lacking.
The air pollution in China is a typical coal-smoke pollution, which is considered to be closely associated with China's special energy consumption structure (e.g., Quan et al., 2014; Archernicholls et al., 2016; Liu et al., 2016; Xue et al., 2016). Coal plays a key role in China's energy structure, and as the most abundant and a relatively cheap energy resource, coal is regarded as a dominant energy supply in China in the foreseeable future. According to the BP statistical review of world energy (2016), from the 1980s to present day, the proportion of coal in China's primary energy production and consumption has been around 70 %, which is much higher than that of around 20 % in OECD (Organization for Economic Co-operation and Development) countries. Entering the 21st century, coal consumption in China increased sharply, and by 2013, China's coal consumption accounted for 50.3 % of the global coal consumption, which was 4.2 and 6.7 times higher than that of the United States and European Union, respectively. It is reported that in 2013, coal is responsible for 79, 54, 40, 35, 40, and 17 % of the SO2, NOx, PM10, PM2.5, black carbon (BC), and organic carbon (OC) emissions in China, respectively (Ma et al., 2017).
Residential coal combustion (RCC) emissions are recognized as a significant source of air pollution, affecting both local and regional air quality and posing a serious threat to human health and environment by releasing hazardous air pollutants, including particulate matter (PM), BC, OC, SO2, nitrogen oxide (NOx), CO, CO2, and polycyclic aromatic hydrocarbons (e.g., Wornat et al., 2001; Ge et al., 2004; Zhi et al., 2008; Shen et al., 2010; Cheng et al., 2016; Li et al., 2016). Recently, chemical transport models have been used to investigate the contribution of RCC emissions to the ambient air pollution in China. Using the CMAQ model, Xue et al. (2016) have shown that during the winter heating season of 2012, the contribution of RCC emissions in Beijing to the mass concentrations of local PM10, SO2, NOx, and CO was 11.6, 27.5, 2.8, and 7.3 %, respectively. Simulations using the GEOS-Chem model by Ma et al. (2017) have demonstrated that coal combustion contributed 40 % of the total PM2.5 mass concentrations on national average in 2013. Among major coal-burning sectors, industrial coal burning contributes 17 % of the PM2.5 concentrations, followed by power plants (9.8 %) and the domestic sector (4.0 %). Liu et al. (2016) used the Weather Research and Forecasting model coupled with Chemistry (WRF-Chem) to simulate the air pollution in BTH in January and February 2010, indicating that annual elimination of residential sources in BTH reduces emissions of primary PM2.5 by 32 %, compared with 5, 6, and 58 % of transportation, power plants, and industrial sectors, respectively. Using the source-oriented CMAQ model, Qiao et al. (2017) conducted simulations to evaluate source apportionment of PM2.5 in 25 Chinese provincial capitals and municipalities and concluded that industrial and residential sources are predicted to be the largest contributor to PM2.5 for all the city groups, with annual fractional contributions of 25.0–38.6 % and 9.6–27 %, respectively.
Until now, there have been few studies focusing specially on the impacts of RCC emissions on the air quality in BTH. In the present study, we use the WRF-Chem model to assess the contribution of RCC emissions to the air quality in BTH during a persistent air pollution episode from 9 to 25 January 2014. The WRF-Chem model configurations and methodology are described in Sect. 2. Model results and discussions are represented in Sect. 3, and conclusions are given in Sect. 4.
2.1 WRF-Chem model and configurations
The WRF-Chem model used in this study was developed by Li et al. (2010, 2011a, b, 2012) at the Molina Center for Energy and the Environment, based on previous studies (Grell et al., 2005; Fast et al., 2006). The wet deposition of aerosols follows the method used in the CMAQ module and the dry deposition of chemical species is parameterized following Wesely (1989). The photolysis rates are calculated using the fast radiation transfer model (FTUV), including the aerosol and cloud effects on photolysis (Tie et al., 2003; Li et al., 2005, 2011a). The inorganic aerosols are calculated using ISORROPIA version 1.7 (Nenes et al., 1998). The secondary organic aerosol (SOA) is predicted using the volatility basis-set (VBS) modeling method, with contributions from glyoxal and methylglyoxal.
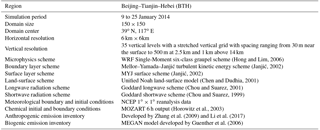
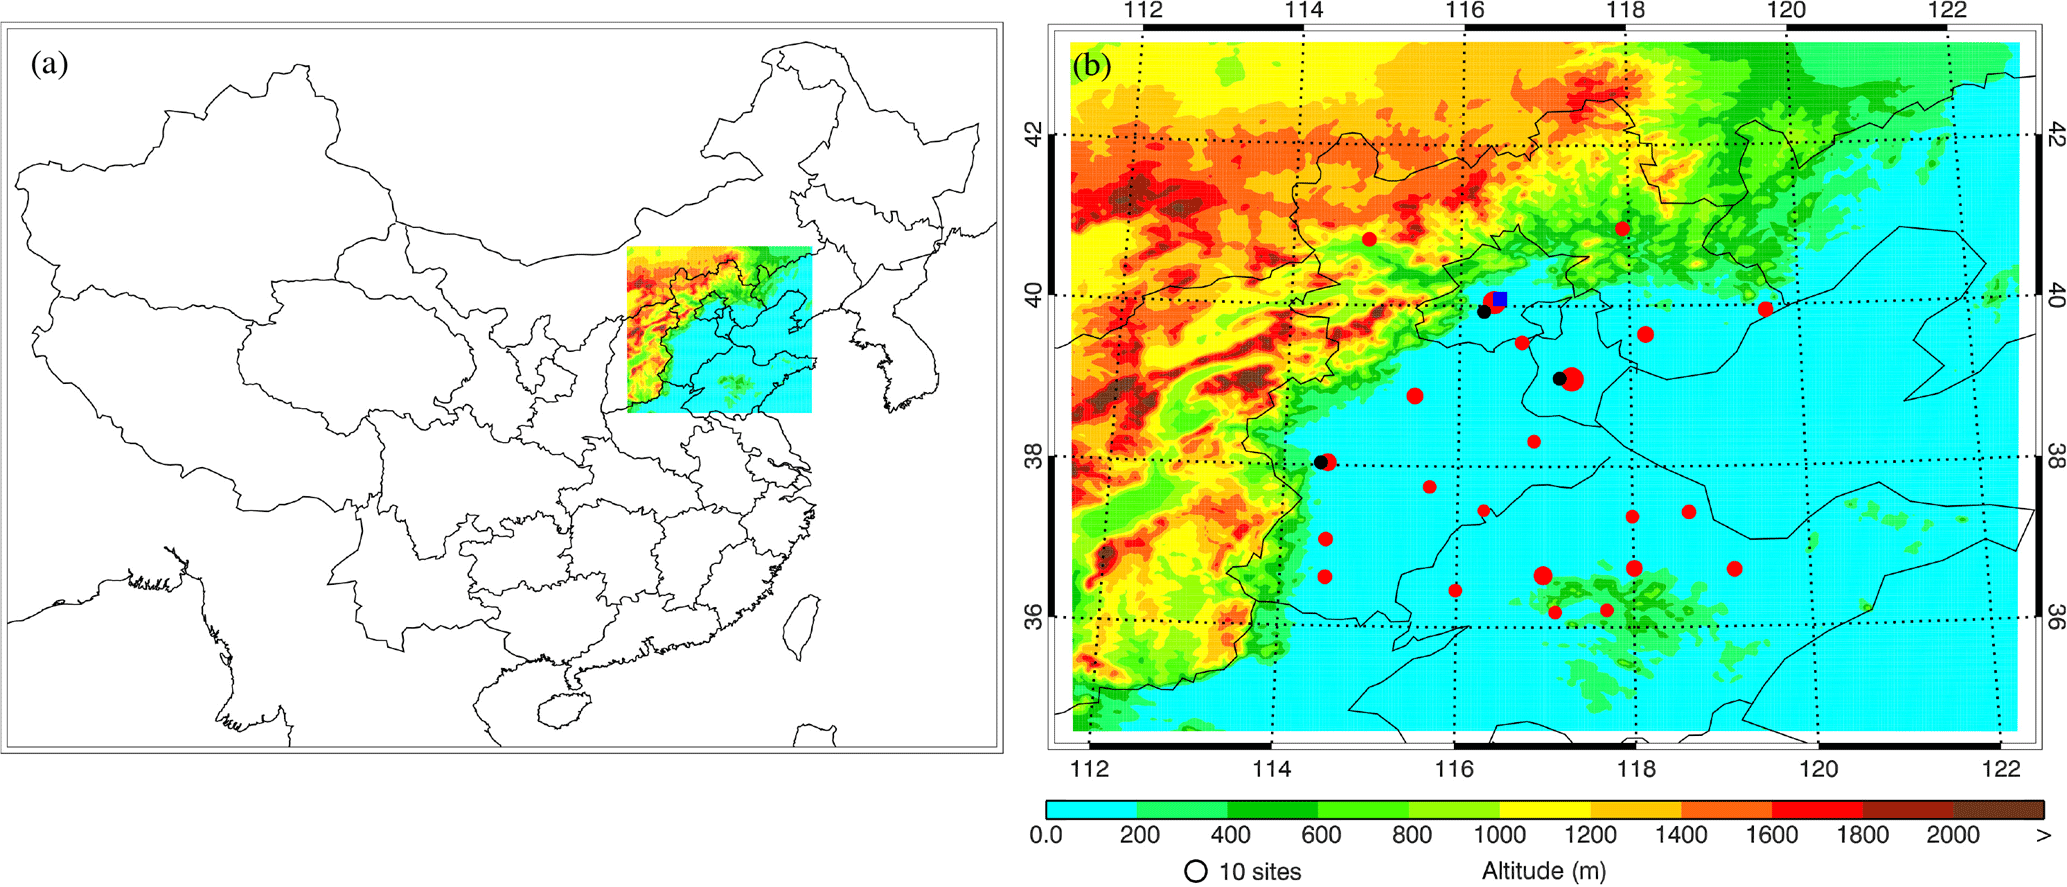
Figure 1(a) Map showing the location of Beijing–Tianjin–Hebei and (b) WRF-Chem model simulation domain with topography. In (b), the filled red circles represent centers of cities with an ambient monitoring site and the size of the circle denotes the number of ambient monitoring sites in cities. The filled blue rectangle denotes the deployment location of the HR-ToF-AMS in Beijing. The three filled black circles represent the locations of the meteorological observation stations in Beijing, Tianjin, and Shijiazhuang.
The WRF-Chem model adopts one grid with a horizontal resolution of 6 km centered at 39∘ N, 117∘ E, and 35 sigma vertical levels with a stretched vertical grid with spacing ranging from 30 m near the surface to 500 m at 2.5 km and 1 km above 14 km, and the grid cells used for the domain are 150 × 150. The physical parameterizations employed in the simulation include the microphysics scheme of Hong and Lim (2006), the unified Noah land-surface model (Chen and Dudhia, 2001), the Goddard longwave scheme (Chou and Suarez, 2001), and the Goddard shortwave scheme (Chou and Suarez, 1999). The National Centers for Environmental Prediction (NCEP) 1∘ × 1∘ reanalysis data are used for the meteorological initial and boundary conditions, and the meteorological simulations are not nudged in the study. The chemical initial and boundary conditions are interpolated from the 6 h output of MOZART (Horowitz et al., 2003). The spin-up time of the WRF-Chem model is 28 h. The monthly average anthropogenic emissions with a 6 km horizontal resolution in the North China Plain (NCP) are developed by Zhang et al. (2009) with the base year of 2013, including contributions from agriculture, industry, power generation, residential, and transportation sources, and the volatile organic compound (VOC) speciation is based on the SAPRC99 chemical mechanism. The temporal allocation for different sources follows that in Zhang et al. (2009). The biogenic emissions are calculated online using the MEGAN (Model of Emissions of Gases and Aerosol from Nature) model developed by Guenther et al. (2006).
A persistent air pollution episode from 9 to 25 in January 2014 in BTH is simulated using the WRF-Chem model. During the study period, the average PM2.5 mass concentration in BTH is 161.9 µg m−3, with a maximum of 323.5 µg m−3. The average temperature and relative humidity in Beijing during the period is −1.7∘ and 32.3 %, respectively, and the average wind speed is about 2.8 m s−1. The model simulation domain is shown in Fig. 1, and detailed model configurations can be found in Table 1.
The brute force method is used to quantify the contribution of the RCC emissions in BTH and its surrounding areas to the air quality (Dunker et al., 1996). It is worth noting that, although the method can evaluate the importance of the certain emission source, it still has flaws in quantifying the source contribution, considering the complicated nonlinear processes in the atmosphere (Zhang and Ying, 2011). In the present study, we have conducted one reference simulation in which emissions from various anthropogenic and biogenic sources are considered (hereafter referred to as the REF case). The results from the REF case are compared with observations in BTH to validate the model performance. An additional two sensitivity simulations have also been performed, without the RCC emissions in BTH and its surrounding areas and Beijing (hereafter referred as to the SEN-BTH case and SEN-PEK case). In the sensitivity simulation, the emissions of NOx, CO, VOCs, SO2, BC, OC, primary sulfate, and unspecified particulate matters from the RCC are turned off. The difference between the reference and sensitivity simulations is used to evaluate contributions of RCC emissions to the air quality in BTH and Beijing.
2.2 Statistical methods for comparisons
In the present study, we use the mean bias (MB), root mean square error (RMSE), and index of agreement (IOA) to validate the WRF-Chem model performance in simulating air pollutants and aerosol species against observations and measurements. IOA describes the relative difference between the model predictions and observations, ranging from 0 to 1, with 1 indicating perfect agreement of predictions and observations.
Here Pi and Oi are the predicted and observed mass concentrations of pollutants, respectively. N is the total number of the predictions used for comparisons, and and represent the average of predictions and observations, respectively.
2.3 Pollutant measurements
The hourly near-surface CO, SO2, NO2, O3, and PM2.5 mass concentrations released by China's MEP can be downloaded from the website http://www.aqistudy.cn/ (last access: July 2018). The sulfate, nitrate, ammonium, and organic aerosols (OAs) have been measured by the Aerodyne high-resolution time-of-flight aerosol mass spectrometer (HR-ToF-AMS) with a novel PM2.5 lens from 9 to 25 January 2014 at the Institute of Remote Sensing and Digital Earth (IRSDE), Chinese Academy of Sciences (40.00∘ N, 116.38∘ E) in Beijing (Fig. 1) (Williams et al., 2013). The positive matrix factorization (PMF) technique is used with constraints implemented in SoFi (Source Finder) (Canonaco et al., 2013) to analyze the sources of OA and five components are separated by their mass spectra and time series. The components include hydrocarbon-like OA (HOA), cooking OA (COA), biomass burning OA (BBOA), coal combustion OA (CCOA), and oxygenated OA (OOA). HOA, COA, BBOA, and CCOA are interpreted for surrogates of primary OA (POA), and OOA is a surrogate for SOA. Detailed information about the HR-ToF-AMS measurements and data analysis can be found in Elser et al. (2016).
3.1 Model performance
3.1.1 Air pollution simulations in BTH
Considering the key role of meteorological fields in determining the formation, transformation, diffusion, transport, and removal of the air pollutants, Fig. 2 presents the diurnal profiles of the observed and simulated temperature, relative humidity (RH), and wind speed and direction at meteorological sites in Beijing, Tianjin, and Shijiazhuang during the simulation period. The WRF-Chem model predicts the diurnal variations in the temperature reasonably well in the three cities against observations, with IOAs of around 0.80. The model also yields the temporal variation in the RH in Beijing well when compared with observations, but it tends to underestimate the RH in Tianjin and Shijiazhuang with IOAs less than 0.70, and generally fails to capture the high RH exceeding 80 %. The temporal variations in the wind speed and direction in BTH are also reasonably reproduced, but the model biases are still rather large.
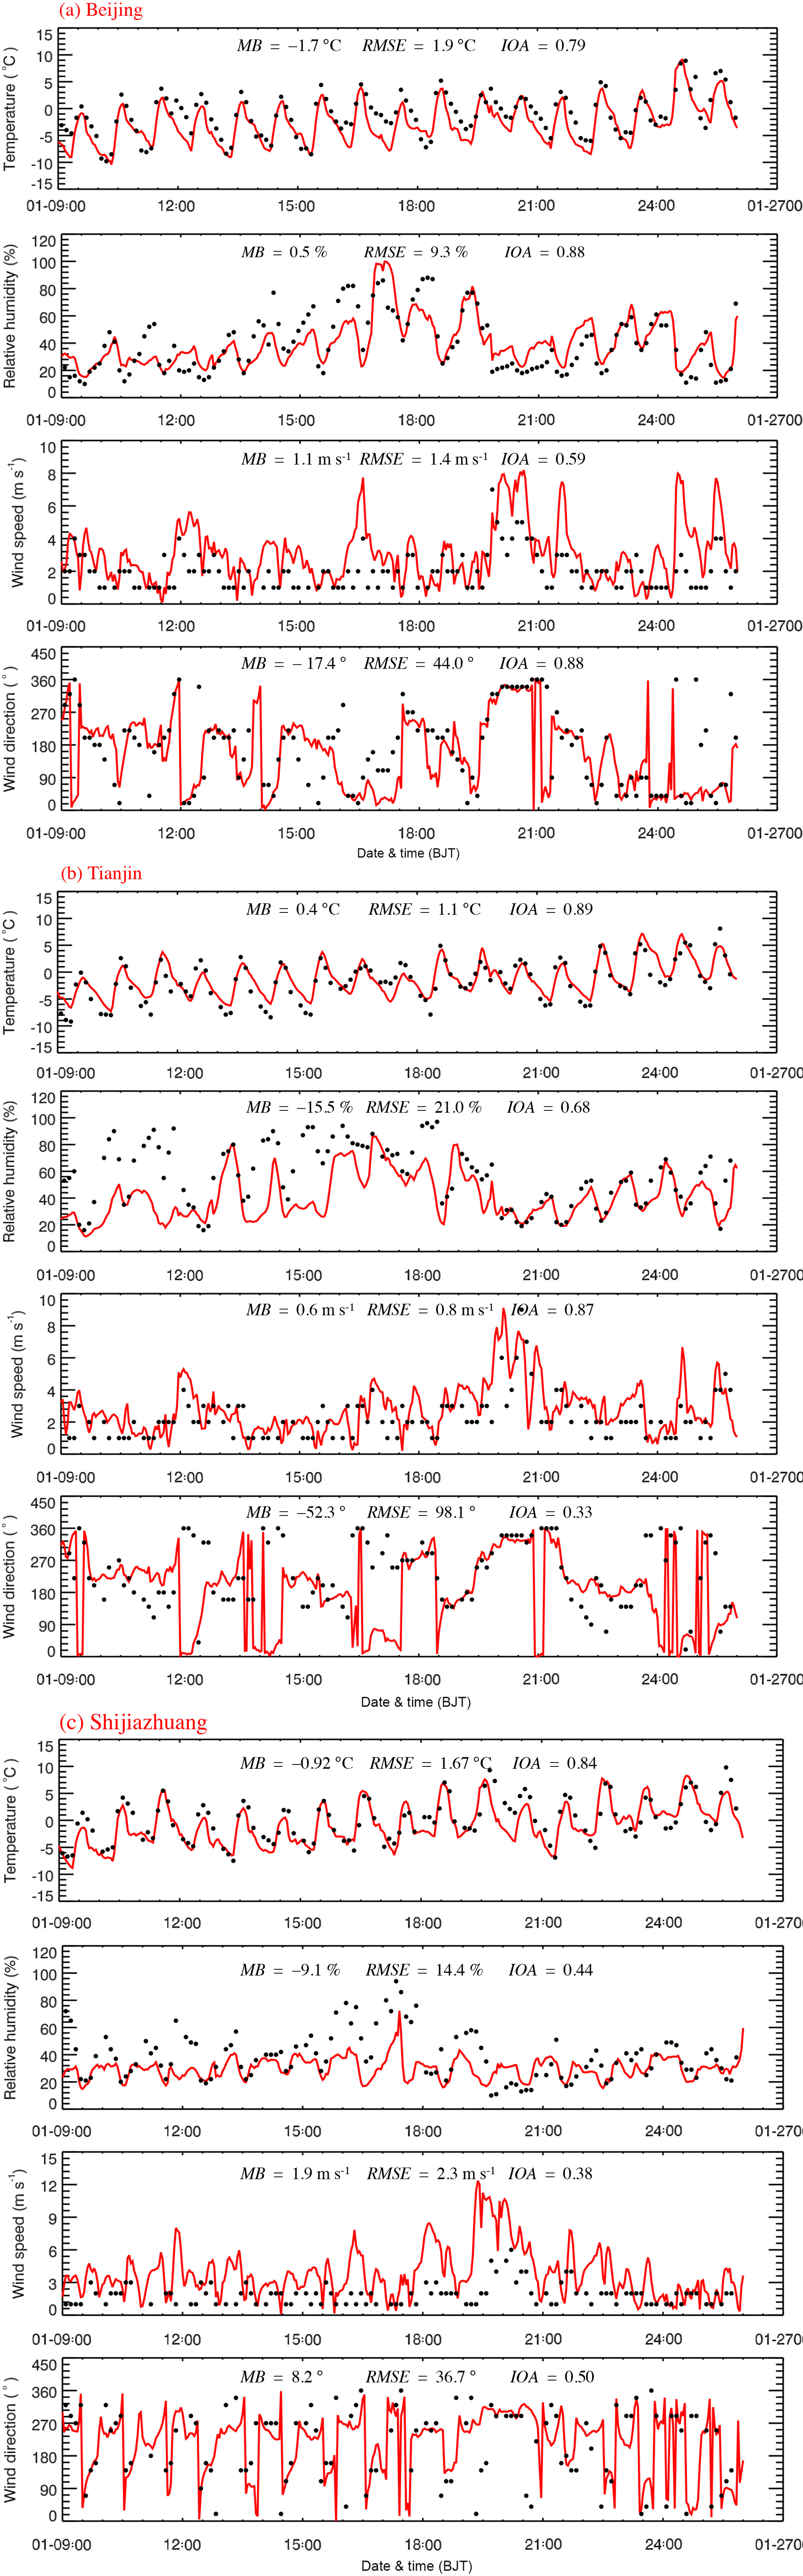
Figure 2Comparisons of observed (black dots) and simulated (solid red lines) diurnal profiles of near-surface temperature (T), relative humidity (RH), wind speed (WS), and wind direction (WD) at meteorological sites in (a) Beijing, (b) Tianjin, and (c) Shijiazhuang from 9 to 25 January 2014.
Figure 3 presents the distributions of predicted and observed near-surface mass concentrations of PM2.5, O3, NO2, and SO2 along with the simulated wind fields averaged from 9 to 25 January 2014 in BTH. Generally, the predicted spatial pattern of PM2.5 is consistent with observations at ambient monitoring sites in BTH. The WRF-Chem model reasonably reproduces the high PM2.5 concentrations exceeding 150 µg m−3 in the plain region of BTH. Apparently, during the simulation period, the weak winds in the plain region of BTH facilitated the accumulation of PM2.5, causing severe air pollution. The average simulated PM2.5 mass concentrations exceed 250 µg m−3 in southern Hebei, which is generally in good agreement with observations. The observed and simulated O3 concentrations are rather low in the plain region of BTH with high PM2.5 levels, varying from 10 to 30 µg m−3. There are several reasons for the low O3 concentrations in the plain region of BTH. First, during wintertime, the insolation is weak in northern China, which is unfavorable for O3 photochemical production. Additionally, high PM2.5 concentrations and frequent occurrence of clouds during haze days further attenuate the incoming solar radiation in the planetary boundary layer (PBL), decreasing the O3 levels. Second, weak winds indicate stagnant situations, lacking the O3 transport from outside BTH. Third, high NOx emissions cause titration of O3, which is shown by the high NO2 concentrations in the plain region of BTH. The elevated NO2 and SO2 concentrations are observed and simulated in the plain region of BTH, particularly in cities and their surrounding areas, ranging from 50 to 100 µg m−3 and 50 to 150 µg m−3, respectively. It is worth noting that the simulated NO2 is generally distributed evenly in the plain region of BTH, indicating the dominant contribution of area sources.
Figure 4 presents the diurnal profiles of observed and simulated near-surface PM2.5, O3, NO2, SO2, and CO mass concentrations averaged over all monitoring sites in BTH from 9 to 25 January 2014. The WRF-Chem model reproduces the diurnal variations in PM2.5 mass concentrations when compared with observations in BTH during the simulation period. The MB and RMSE are only −2.7 and 40.9 µg m−3, respectively, and the IOA is 0.94. During the persistent haze episode in BTH, the model generally replicates the haze developing stage well, but tends to underestimate the PM2.5 concentrations against observations during the haze dissipation stage. One of the most likely reasons is the uncertainty of the simulated meteorological fields, which determine the formation, transformation, diffusion, transport, and removal of air pollutants in the atmosphere (Bei et al., 2012, 2013). Should the predicted winds be intensified earlier than observations in BTH during the haze dissipation stage, the simulated PM2.5 concentrations would decline earlier, causing the model underestimation. The predicted NO2 diurnal variations are generally well consistent with observations, with a MB of 4.2 µg m−3 and an IOA of 0.93. The model also yields reasonable predictions for SO2 and CO temporal variations with IOAs exceeding 0.85. However, the RMSE for SO2 is rather large, showing considerable deviations in the SO2 simulations. A large fraction of SO2 is emitted from power plants or agglomerated industrial zones, which can be regarded as point sources; thus the transport of SO2 is more sensitive to uncertainties in simulated wind fields. The early occurrence of intensified winds in simulations also causes rapid falloff of SO2 and CO mass concentrations during the haze dissipation stage. In addition to uncertainties in meteorological field simulations, uncertainties in emission inventories are also responsible for the model biases of air pollutants. Since implementation of the APPCAP, strict emission control measures have been made to improve the air quality in BTH, and the spatiotemporal variations in anthropogenic emissions in BTH have changed considerably (Li et al., 2017), which is not reflected in the emission inventory used in the present study.
Recently, observational studies have used CO as an aerosol proxy to investigate atmospheric aerosols based on the remote-sensing technique. Figure 5 shows the scatter plots of observed and simulated PM2.5 with CO mass concentrations averaged over all ambient monitoring sites in BTH during the simulation period. The observed and simulated CO mass concentrations are well correlated with those of PM2.5, with the R2 exceeding 0.81.
Figure 3Pattern comparisons of simulated (color counters) vs. observed (colored circles) near-surface mass concentrations of (a) PM2.5, (b) O3, (c) NO2, and (d) SO2 averaged from 9 to 25 January 2014. The black arrows indicate simulated surface winds.
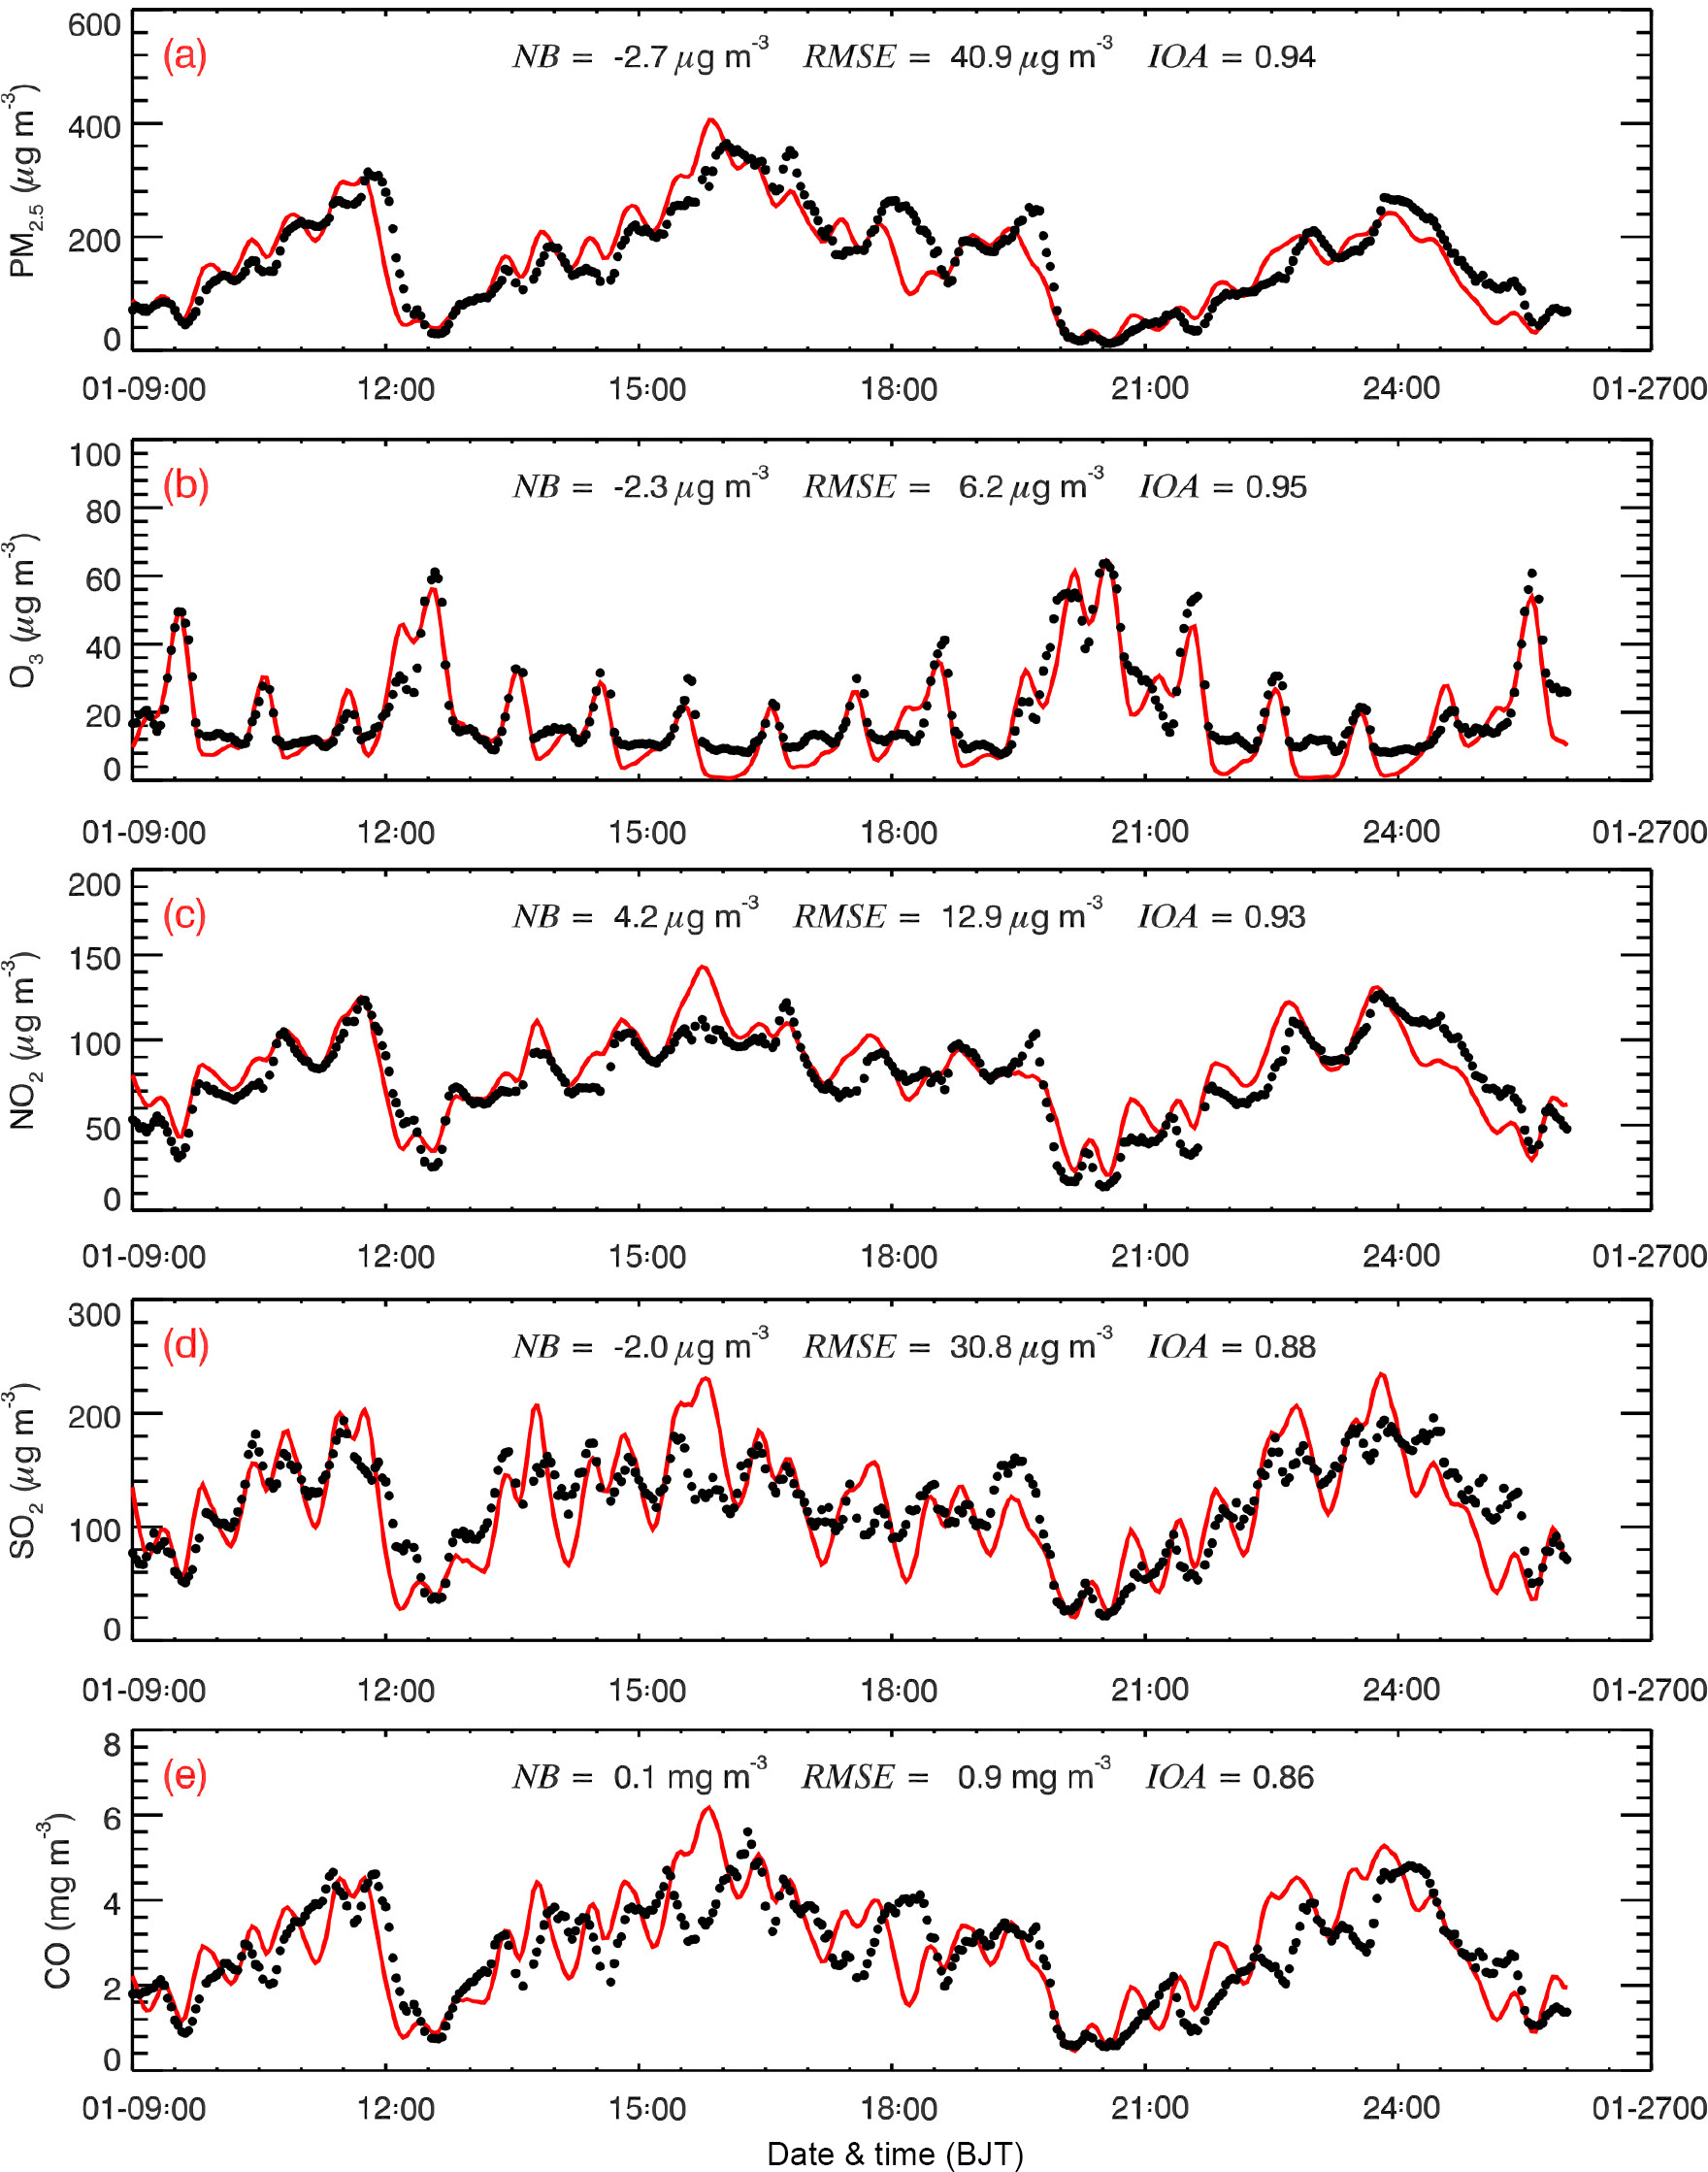
Figure 4Comparisons of observed (black dots) and simulated (solid red lines) diurnal profiles of near-surface hourly mass concentrations of (a) PM2.5, (b) O3, (c) NO2, (d) SO2, and (e) CO averaged at monitoring sites in BTH from 9 to 25 January 2014.
3.1.2 Aerosol species simulations in Beijing
Figure 6 presents the temporal profiles of measured and simulated OA, CCOA, sulfate, nitrate, and ammonium mass concentrations at the IRSDE site in Beijing from 9 to 25 January 2014. The model generally performs reasonably well in simulating the diurnal variations in aerosol species when compared with the HR-ToF-AMS measurements, with IOAs exceeding 0.80. OA in Beijing is primarily determined by direct emissions from various sources, including vehicles, cooking, biomass burning, coal combustion, and secondary formation, as well as transport from outside Beijing. Therefore, uncertainties in anthropogenic emissions and the simulated meteorological fields markedly influence the OA simulations (Bei et al., 2017). Although the IOA for OA is 0.84, the model slightly overestimates the OA mass concentrations with a MB of 5.1 µg m−3, and the deviation of OA simulations is also large, with a RMSE of 42.3 µg m−3. In addition, the model fails to reproduce the measured OA peaks during the nighttime on 11 and 17 January 2014, which is perhaps caused by the emission uncertainties. The model also generally tracks the measured diurnal variations in CCOA mass concentrations, with an IOA of 0.81. The model frequently underestimates or overestimates the CCOA mass concentrations and is also subject to missing the observed CCOA peaks. The CCOA is mainly emitted from industries and residential coal combustion. In general, the CCOA emissions from industries have clear diurnal variations but are opposite for those from RCC, causing large model biases for the CCOA simulation. The simulated time series of sulfate, nitrate, and ammonium are also in good agreement with observations, with IOAs of 0.83, 0.87, and 0.90, respectively. The model considerably overestimates the inorganic aerosol mass concentrations from 16 to 18 January. One of the possible reasons is the decreased emissions, particularly from industries before the Chinese New Year, which are not reflected in the emission inventory used in the study.
Table 2Validation of WRF-Chem model performance in simulations of air pollutants.
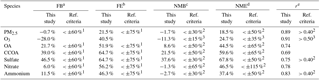
a Fractional bias (FB): FB = × 100. b Fractional error (FE): FE = × 100. c Normalized mean bias (NMB): NMB = × 100. d Normalized mean error (NME): NME = × 100. e Correlation coefficient (r): r = , where subscript j represents the pairing of N, observations O, and predictions P, by site and time. r = 1 is perfect correlation; r = 0 is totally uncorrelated. 1 Boylan and Russell (2006). 2 Emery et al. (2017). 3 US EPA (2005).
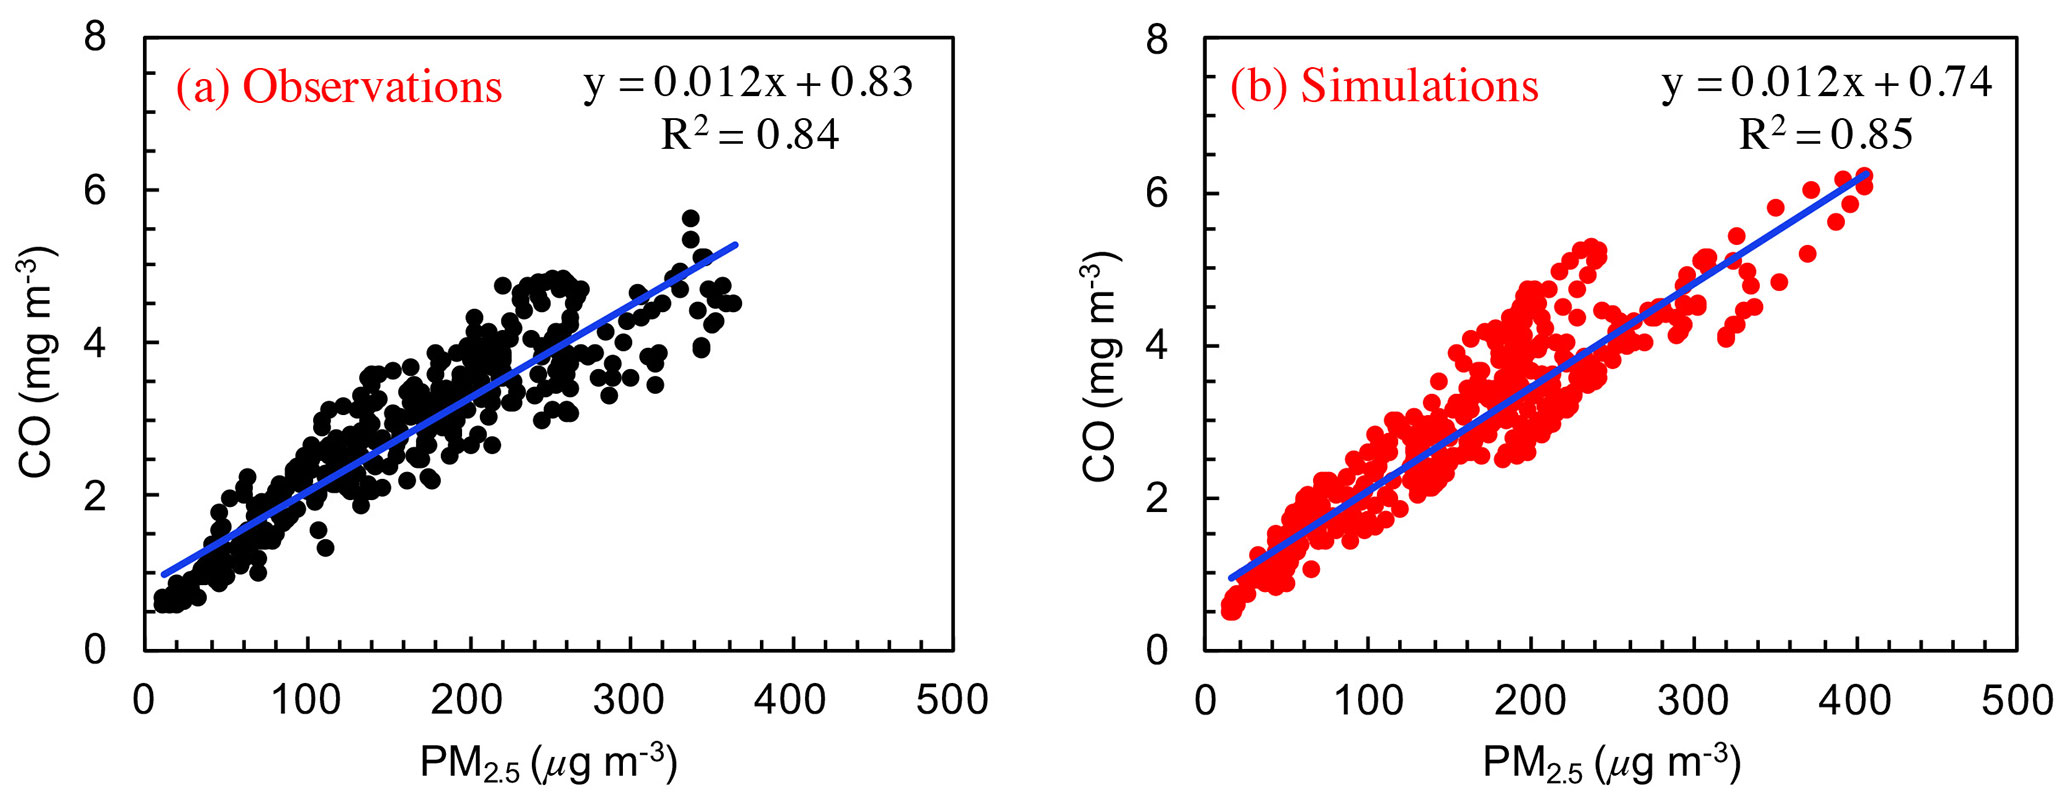
Figure 5Scatter plots of the (a) observed and (b) simulated PM2.5 with CO mass concentrations averaged over all ambient monitoring sites in BTH from 9 to 25 January 2014.
Figure 7 presents the contributions of aerosol species to the simulated PM2.5 concentration in BTH and Beijing averaged from 9 to 25 January 2014. The modeled PM2.5 mass concentration averaged during the simulation period in BTH and Beijing is 111.6 and 97.7 µg m−3, respectively. OAs dominate the PM2.5 in BTH, with a contribution of around 43.1 %. Although the simulated O3 concentration is low, the secondary aerosols, including SOA, sulfate, nitrate, and ammonium still make up about 40 % of the PM2.5 mass concentration, with contributions of 7.9, 11.3, 12.4, and 9.6 %, respectively. Elemental carbon and the unspecified aerosol species account for 7.5 and 16.2 % of the PM2.5 mass concentration, respectively. In Beijing, sulfate, nitrate, and ammonium constitute 10.6, 14.0, and 9.1 % of the PM2.5 mass concentrations, respectively. OAs are also the dominant constituents of the simulated PM2.5 in Beijing, with a contribution of about 44.1 %. The simulated ratio of the primary to secondary OA in Beijing is 4.6, which is close to the observed ratio of 4.3. The simulated chemical composition in Beijing is generally comparable to the observation in January 2013 by Huang et al. (2014), showing that OA constitutes a major fraction (40.7 %) of the total PM2.5, followed by sulfate (16.0 %), nitrate (12.0 %), and ammonium (9.8 %). It is worth noting that the simulated sulfate contribution to PM2.5 mass concentrations in Beijing is lower than the observation in Huang et al. (2014), and vice versa for the nitrate aerosol. Implementation of the APPCAP since 2013 September has considerably decreased SO2 emissions in BTH, lowering sulfate formation. Additionally, the decrease in sulfate aerosol reduces its competition with ammonia in the atmosphere, facilitating nitrate formation.
Table 2 presents further validation of WRF-Chem model simulations of air pollutants based on statistics methods suggested by previous studies (US EPA, 2005; Boylan and Russell, 2006; Emery et al., 2017). Compared to the suggested model performance criteria of air pollutants, the WRF-Chem model performs well in simulating the air pollutants and aerosol species in this study. The fractional bias (FB), fractional error (FE), normalized mean bias (NMB), and normalized mean error (NME) of PM2.5 and O3 are generally within the benchmarks, with the correlation coefficients approaching 0.90, showing good consistency between the simulations and observations. As for the aerosol species, except for sulfate, the differences between the observed and simulated organic aerosol, nitrate, and ammonium are all less than the reference criteria. The FB and FE of sulfate are reasonable, but the NMB of 37.6 % and NME of 67.8 % are slightly higher than the suggested criteria.
The good agreements of the simulated mass concentrations of air pollutants with observations at ambient monitoring sites in BTH and aerosol species with HR-ToF-AMS measurements in Beijing show that the simulated wind fields and emission inventory used in the present study are generally reasonable, providing a reliable base for further evaluations.
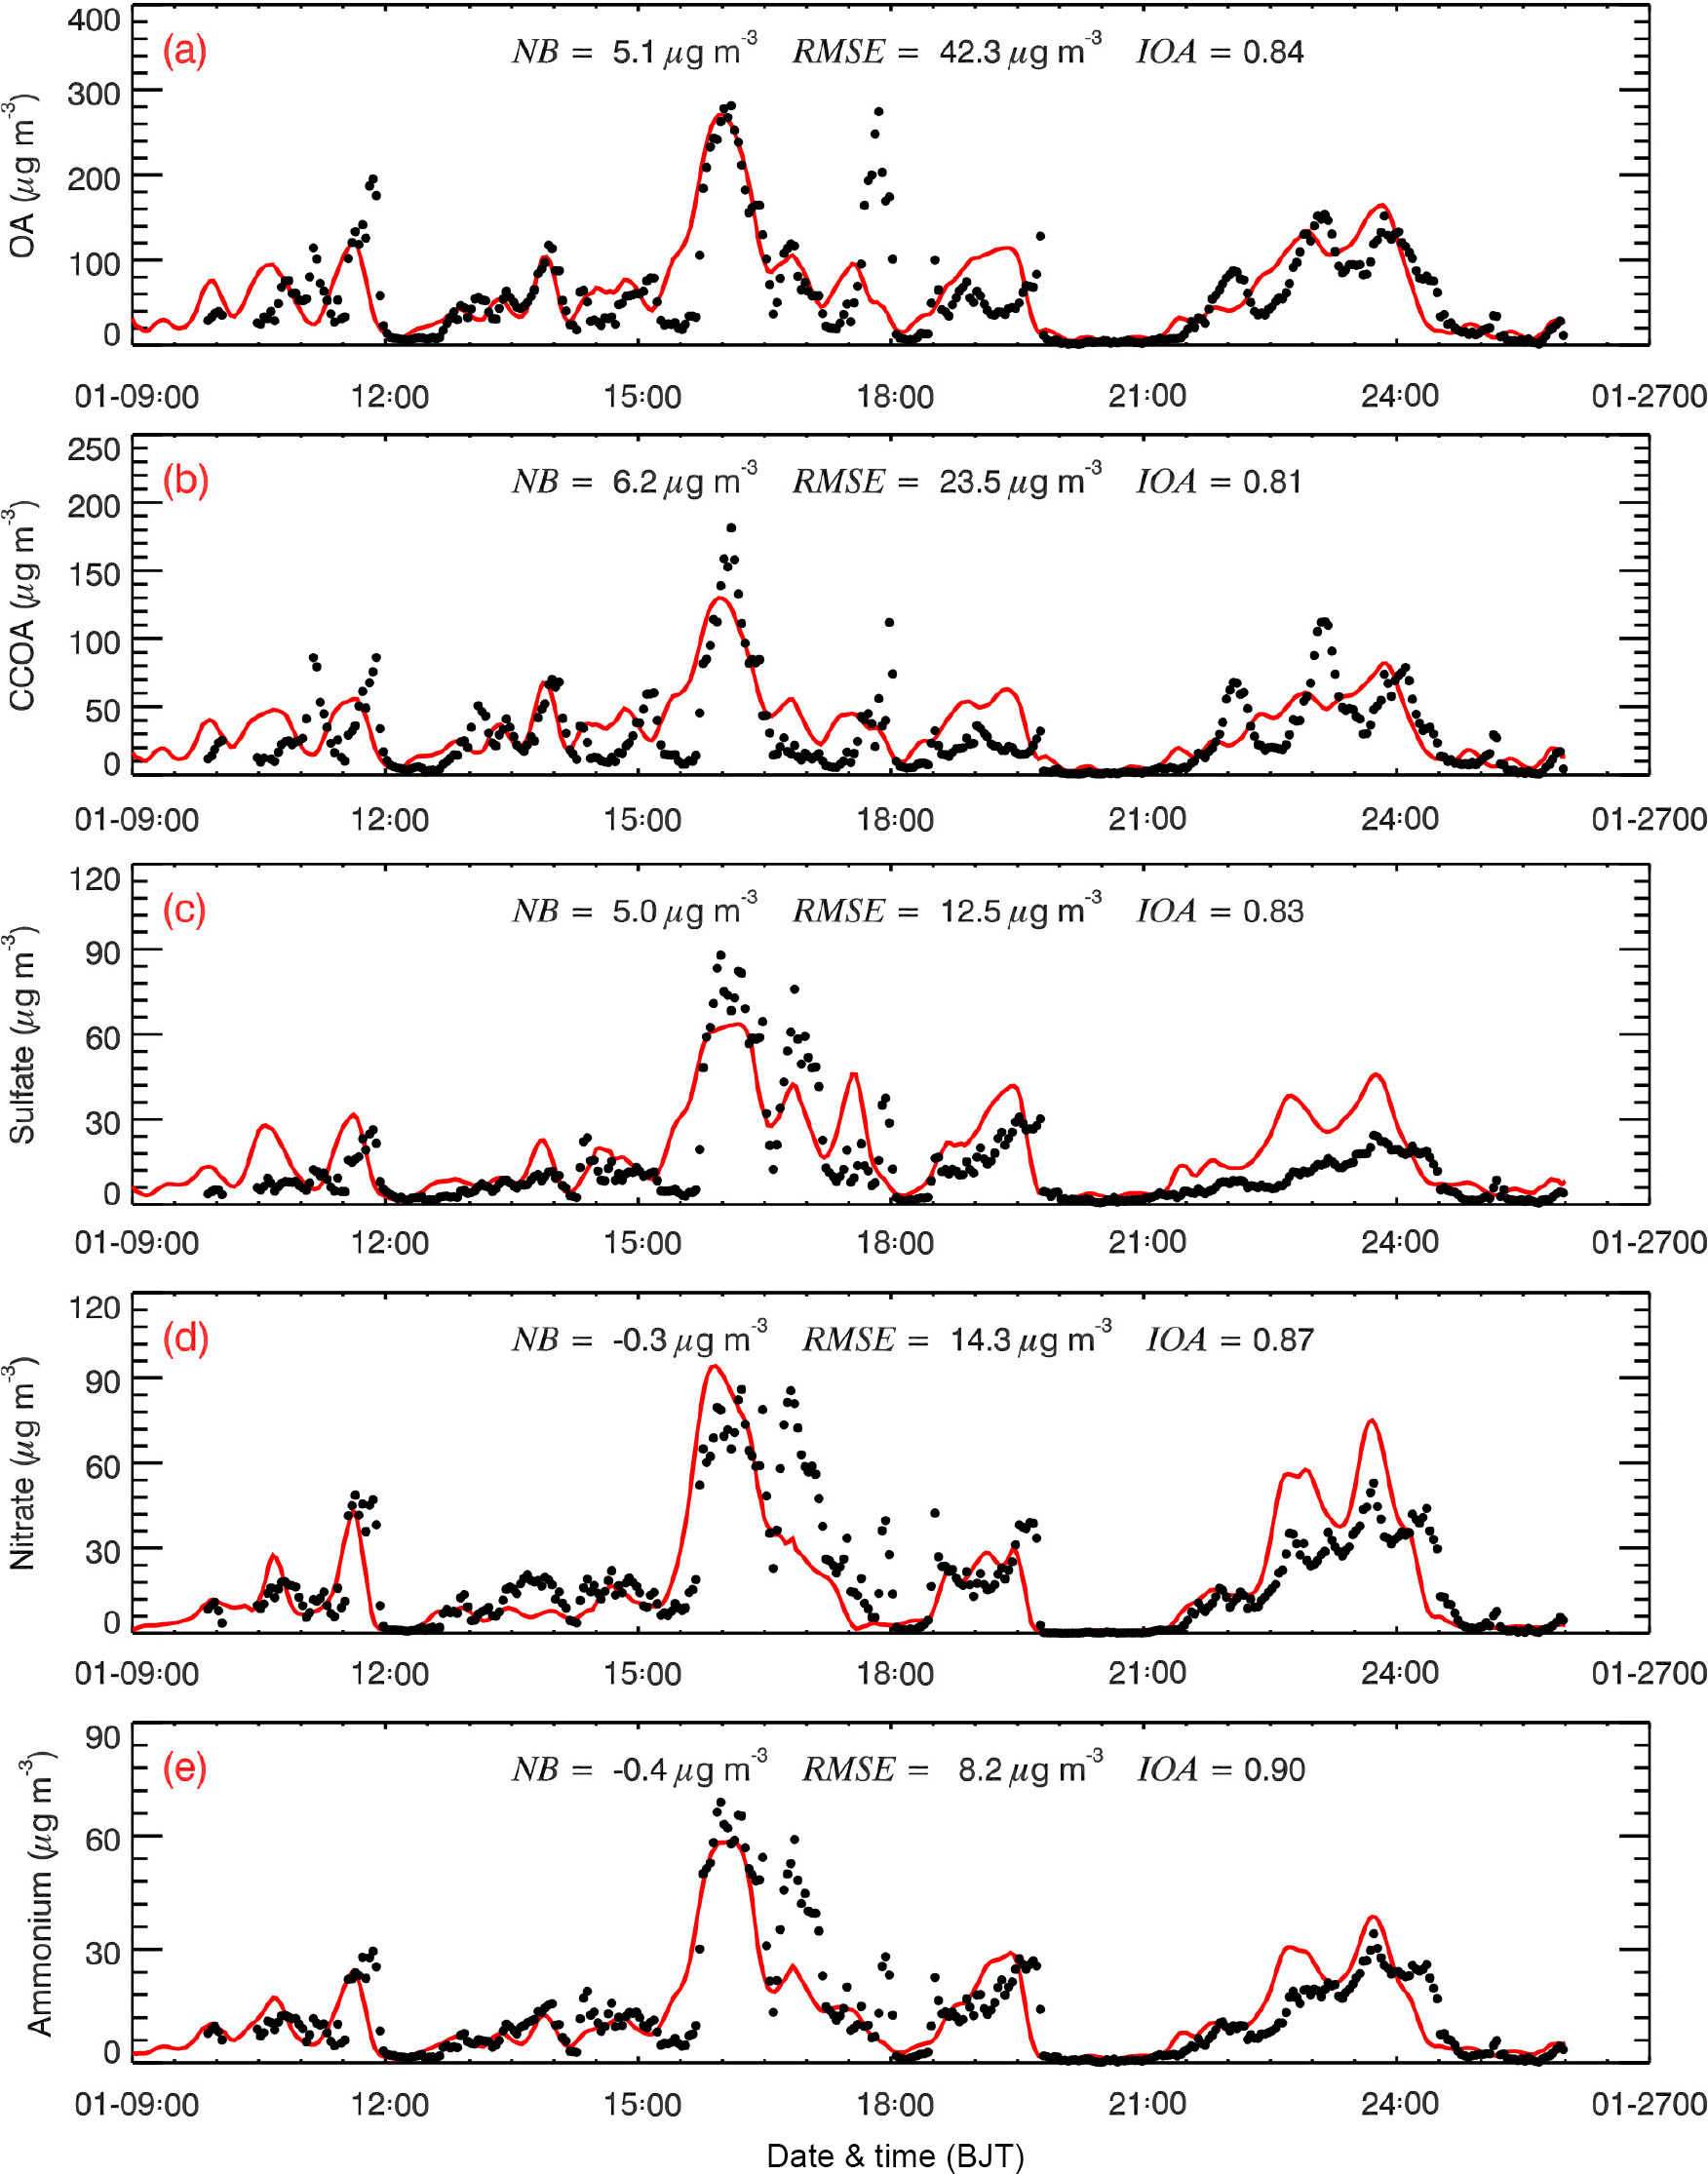
Figure 6Comparisons of measured (black dots) and simulated (solid red lines) diurnal profiles of (a) organic aerosol (OA), (b) coal combustion organic aerosol (CCOA), (c) sulfate, (d) nitrate, and (e) ammonium in Beijing from 9 to 25 January 2014.
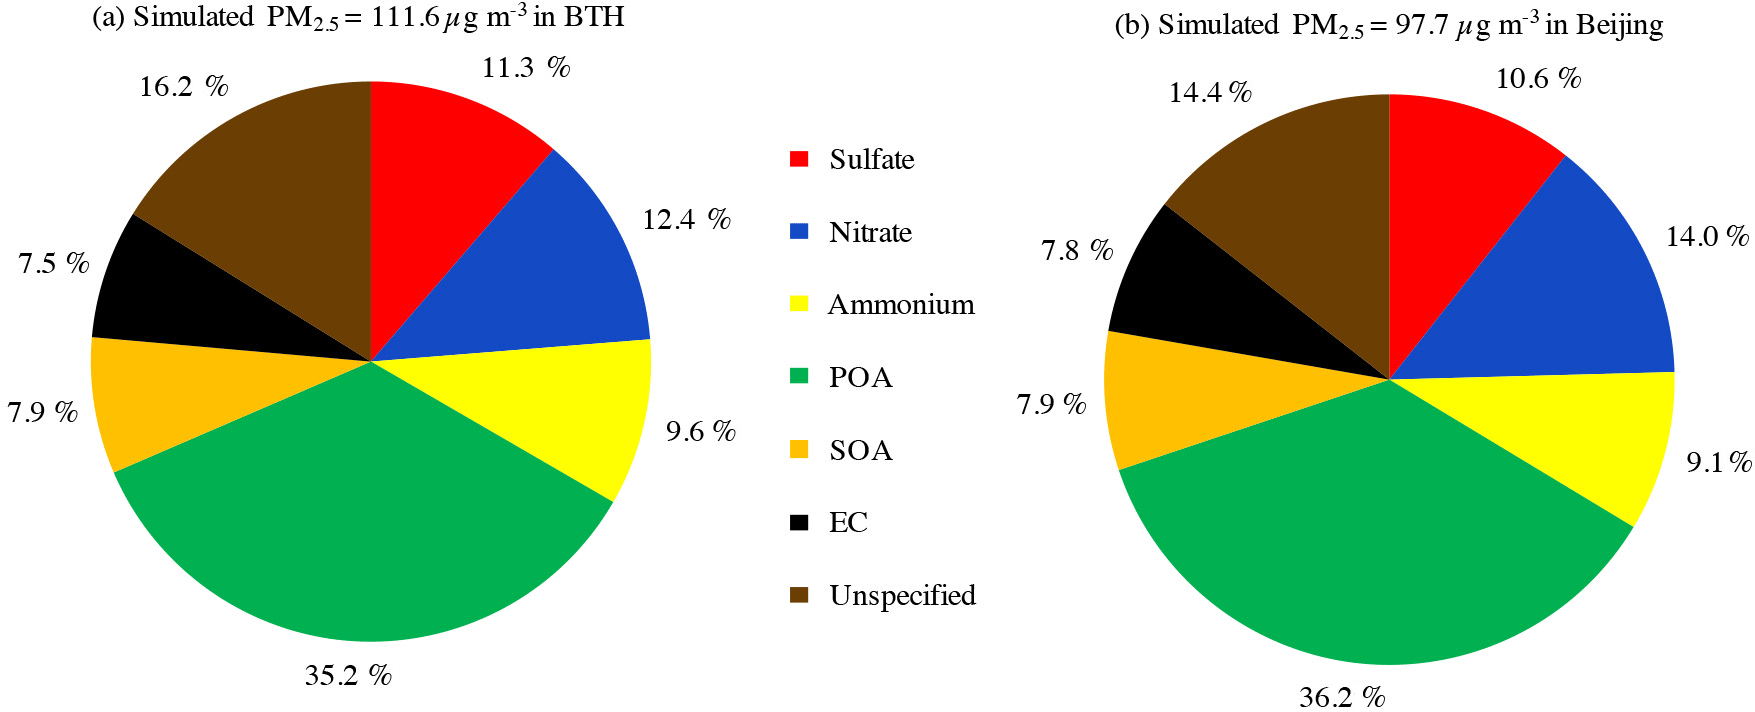
Figure 7Chemical composition of PM2.5 averaged from 9 to 25 January 2014 in (a) BTH and (b) Beijing.
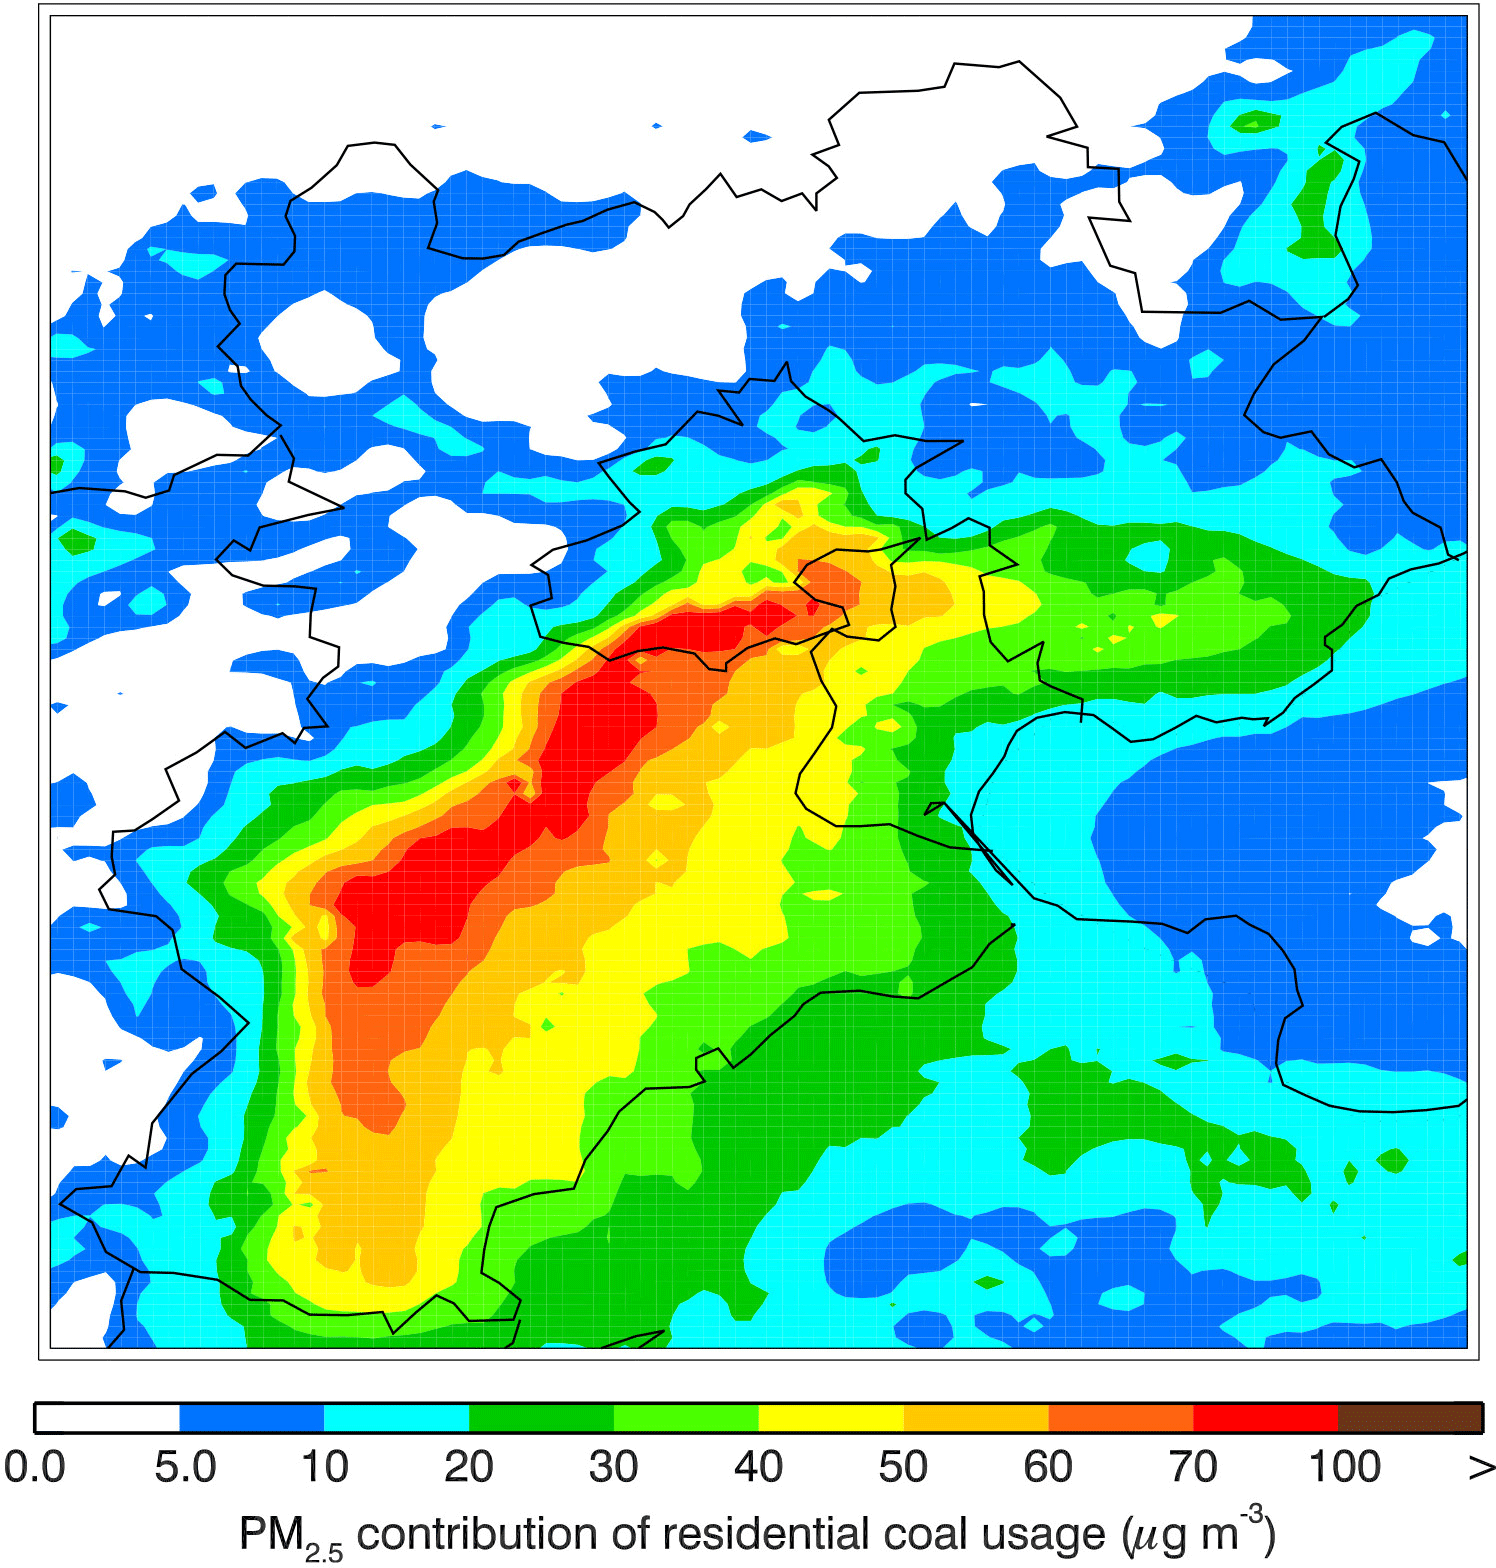
Figure 8Spatial distribution of the average contribution of the RCC emissions in BTH to PM2.5 mass concentrations from 9 to 25 January 2014.
3.2 Contributions of the RCC emissions to the air quality in BTH
The contribution of the RCC emissions to the air quality in BTH is investigated by the sensitivity study without RCC emissions in BTH and its surrounding areas compared to the reference simulation. Figure 8 shows the spatial distribution of the average contribution of the RCC emissions in BTH to PM2.5 mass concentrations during the simulation period (REF – SEN-BTH). The RCC emissions play an important role in the PM2.5 level in the plain area of BTH, with contributions varying from 30 to 70 µg m−3. Over the mountain areas of BTH, the contribution of RCC emissions to the PM2.5 mass concentration is generally less than 10 µg m−3.
Table 3Average mass concentrations of air pollutants in the REF case and SEN-BTH case from 9 to 25 January 2014 in BTH and Beijing. (Unit: µg m−3 for PM2.5, O3, NO2, and SO2 and mg m−3 for CO.)
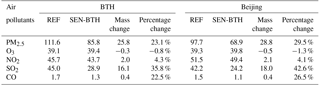
Table 3 presents the average change of air pollutant mass concentrations during the simulation period in BTH and Beijing. The average PM2.5 mass concentration is 111.6 µg m−3 in BTH in the REF case and decreased to be 85.8 µg m−3 in the SEN-BTH case when the RCC emissions in BTH were excluded. The RCC emissions contribute about 23.1 % of PM2.5 mass concentrations in BTH on average. In addition, the RCC emissions are an important source of SO2 and CO, contributing about 35.8 % of SO2 and 22.5 % of CO mass concentrations. The RCC emissions do not substantially influence the NO2 level in BTH, with a contribution of 4.2 %. When the RCC emissions in BTH are not considered, the O3 concentration slightly increases due to the decrease in NO2 concentration. The PM2.5 mass concentration is decreased by around 30 % in Beijing on average when the RCC emissions in BTH are excluded, showing that the air quality in Beijing would be remarkably improved if the residential coal in BTH and its surrounding areas could be replaced by other clean energy sources, such as natural gas or electricity. Furthermore, the RCC emissions in BTH contribute about 42.6 % of SO2 and 26.5 % of CO mass concentrations in Beijing.
Figure 9 shows the average chemical composition of PM2.5 contributed by the RCC emissions in BTH and Beijing during the simulation period. The RCC emissions contribute about 25.8 µg m−3 PM2.5 in BTH on average, of which about 42.8 % is from OA. The sulfate aerosol constitutes 17.1 % of the PM2.5 from the RCC emissions, exceeding the contribution from unidentified aerosol species (15.8 %), elemental carbon (11.5 %), ammonium (9.5 %), and nitrate (3.3 %) aerosol. The results indicate that the priority to mitigate effects of RCC emissions on the air quality in BTH is to decrease the emissions of OA and SO2 from RCC. In Beijing, OA is still the major contributor to PM2.5 from the RCC emissions, accounting for about 48.5 %, which is more than that averaged in BTH. The sulfate and ammonium contributions to the PM2.5 from the RCC emissions are 13.3 and 7.2 %, respectively. The chemical composition of the PM2.5 from the RCC emissions in Beijing shows more contribution of OA and less contribution of SO2. It is worth noting that light-absorbing aerosols are thought to alter the ambient temperature profile locally (Wang, 2013; Zhang et al., 2015; Peng et al., 2017). The sensitivity results indicate that if the RCC emissions in BTH and its surrounding areas are excluded, the surface temperature in BTH is decreased by about 0.23∘ on average during the study period, about half of which is contributed by light-absorbing aerosols.
3.3 Contributions of local RCC emissions to the air quality in Beijing
As the capital of China, the air quality in Beijing often becomes the focus of attention in China or globally. Beijing is situated at the northern tip of the NCP, one of the most polluted areas in China, caused by rapid industrialization and urbanization (Zhang et al., 2013). In addition, Beijing is surrounded from the southwest to northeast by the Taihang Mountains and the Yan Mountains, which block the dispersion of air pollutants when southern or eastern winds are prevalent in the NCP (Long et al., 2016). Therefore, in addition to the contribution of local emissions, the air quality in Beijing is also substantially influenced by the transport of air pollutants from outside of the area (Wu et al., 2017).

Figure 9Chemical composition of PM2.5 from the RCC emissions in BTH averaged from 9 to 25 January 2014 in (a) BTH and (b) Beijing.
Since implementation of the APPCAP issued in September 2013, Beijing has carried out aggressive emission control strategies to improve air quality. Great efforts have been made to replace coal used in residential living with natural gas or electricity, which is highly anticipated to help clean the air in Beijing. However, frequent occurrence of heavy haze with extremely high levels of PM2.5 during the wintertime of 2015 and 2016 has caused controversy about the effect of the coal replacement plan in Beijing. Therefore, a further sensitivity study has been performed in this study, in which only the RCC emissions in Beijing are excluded (SEN-PEK) to explore the contribution of the local RCC emissions in Beijing to the haze formation. Comparisons of the REF case with the SEN-PEK case show that when the RCC emissions in Beijing are not considered or the residential coal is replaced by other clean energy sources, the local PM2.5 level decreases from 97.7 to 80.1 µg m−3 or by 18.0 % on average during the simulation period. The average decreases in SO2 and CO concentrations are 24.2 and 19.9 %, respectively. It is worth noting that electricity is principally from coal burning in China, and the main air pollutants emitted from coal-burning power plants are NOx and SO2. However, the major pollutants emitted by RCC include organic carbon, SO2, and NOx. Considering the dominant role of OA in the PM2.5 in Beijing, the coal replacement in residential living is more effective than that in power plants. Therefore, the coal replacement plan in Beijing can improve the local air quality considerably but is not expected to substantially improve the air quality.
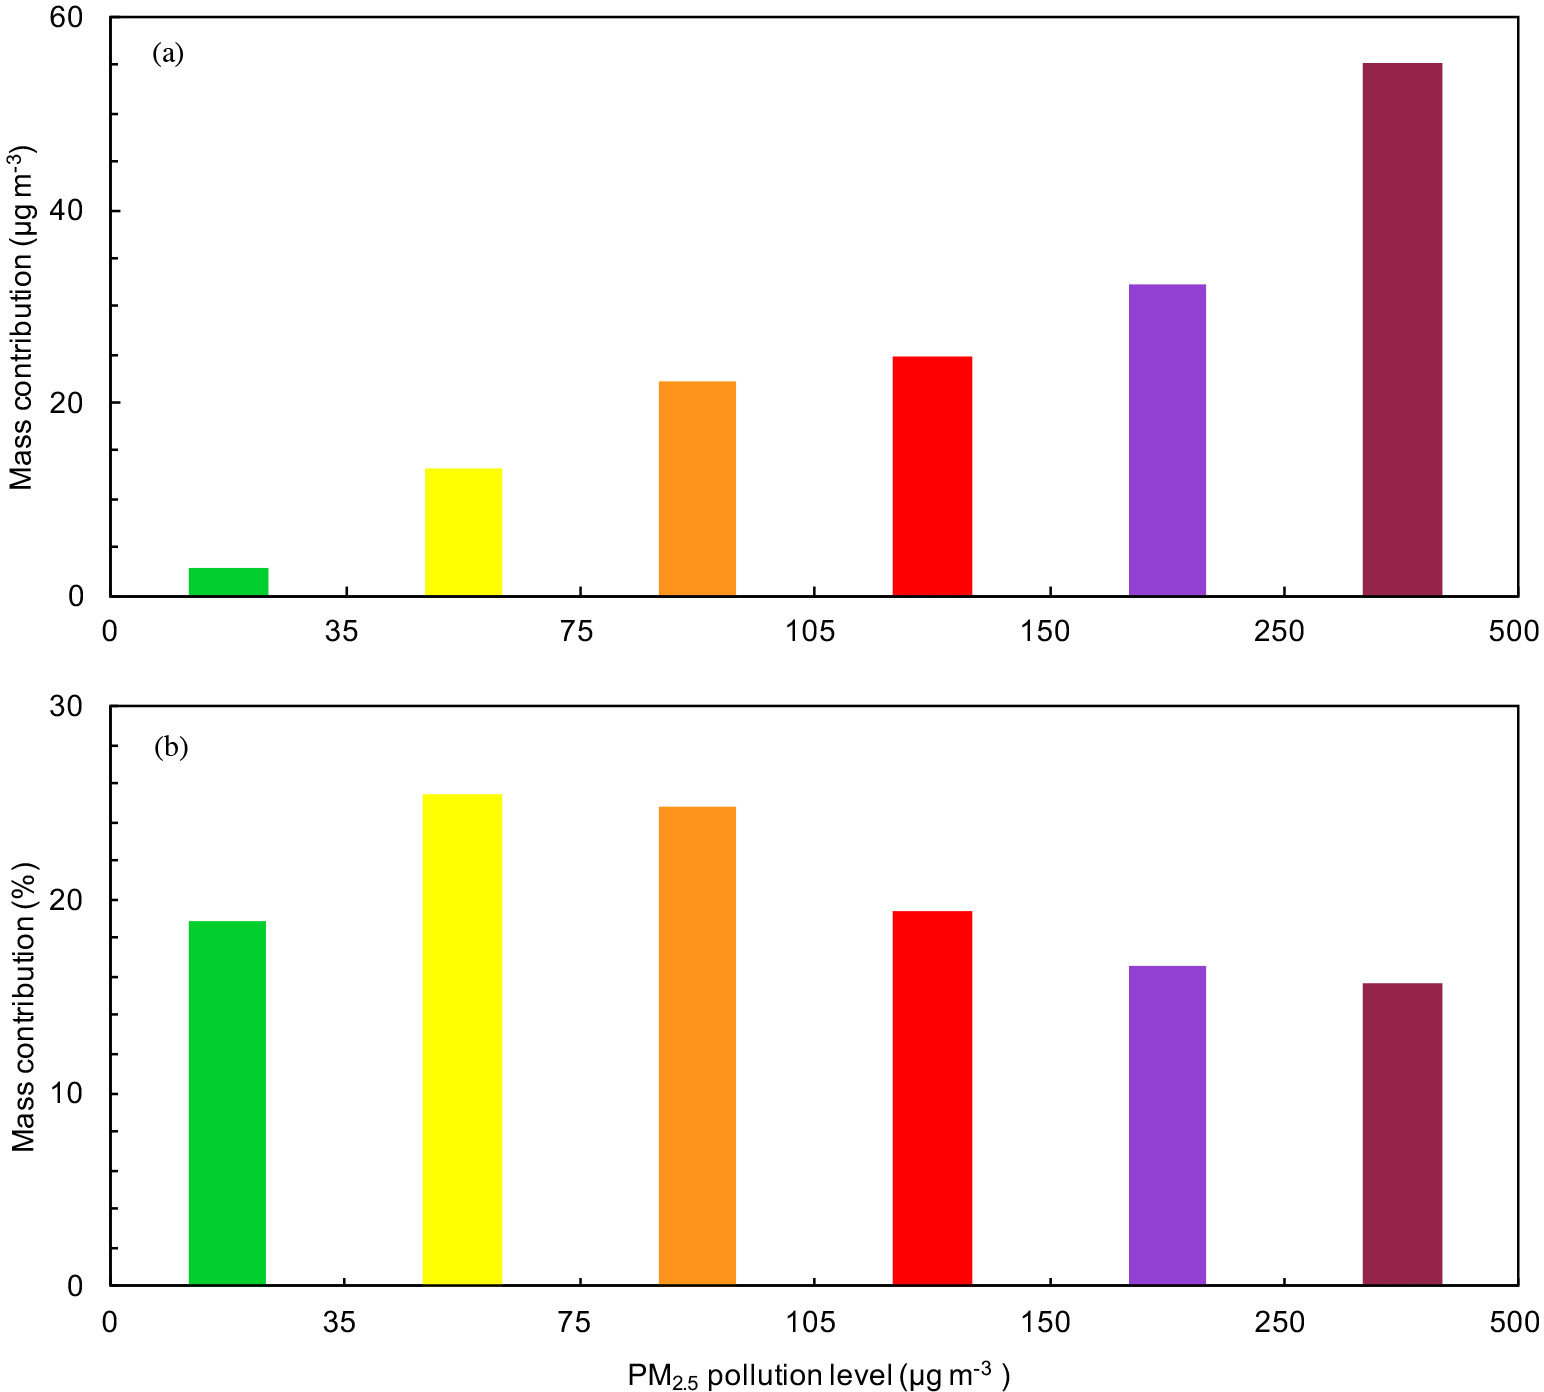
Figure 10Average contributions of the RCC emissions in Beijing to the local PM2.5 mass concentrations under different haze pollution levels from 9 to 25 January 2014. Green, yellow, orange, red, purple, and dark red represent excellent, good, slightly polluted, moderately polluted, heavily polluted, and severely polluted levels of air quality, respectively.
It is still debatable whether local emissions or transport dominate the air quality in Beijing (Guo et al., 2010, 2014; Li et al., 2015; Zhang et al., 2015; Wu et al., 2017). Sensitivity studies show that when only the RCC emissions in Beijing are excluded in simulations, the PM2.5 level is decreased by 18 %, much less than the about 30 % decrease caused by the exclusion of the RCC emissions in BTH and its surrounding areas, showing the important contribution of trans-boundary transport to the air quality in Beijing. Analyses are further made to examine the contribution of the RCC emissions in Beijing to the PM2.5 mass concentrations under different pollution levels. The simulated hourly near-surface PM2.5 mass concentrations in the REF case during the whole episode in Beijing are first subdivided into six bins according to the air quality standard in China for PM2.5 (Feng et al., 2016), i.e., 0–35 (excellent), 35–75 (good), 75–115 (lightly polluted), 115–150 (moderately polluted), 150–250 (heavily polluted), and greater than 250 (severely polluted) µg m−3. The PM2.5 mass concentrations in the REF case and SEN-PEK case are assembled in accordance with the bin concentrations previously mentioned following the grid cells, and an average of PM2.5 mass concentrations in each bin is calculated. Figure 10 presents the contribution of the RCC emissions in Beijing to the local PM2.5 mass concentrations. Apparently, the mitigation effect is the best under good and lightly polluted conditions in terms of PM2.5 levels, and the PM2.5 mass concentration decreases by around 25 % when the RCC emissions in Beijing are not considered, indicating that the local RCC emissions do not constitute the main PM2.5 pollution source in Beijing. However, with the deterioration of haze pollution from moderately to severely polluted conditions, the PM2.5 contribution from the local RCC emissions in Beijing decreases from 20 to 15 %, showing the regional transport of PM2.5.
In the present study, a persistent air pollution episode in BTH from 9 to 25 January 2014 is simulated using the WRF-Chem model to assess contributions of the RCC emissions to the air quality in BTH. In general, the WRF-Chem model performs well in simulating the temporal variations in and spatial distributions of air pollutants when compared with observations over monitoring sites in BTH. The simulated diurnal variations in aerosol species are also in good agreement with the HR-ToF-AMS measurements in Beijing.
Sensitivity studies show that, on average, the RCC emissions contribute about 23.1 % of PM2.5 mass concentrations in BTH during the simulation period and are also an important SO2 and CO source, accounting for about 35.8 % of SO2 and 22.5 % of CO mass concentrations. OA is the major contributor to PM2.5 from the RCC emissions, with a contribution of 42.8 %, followed by sulfate (17.1 %), unspecified species (15.8 %), elemental carbon (11.5 %), ammonium (9.5 %), and nitrate (3.3 %) aerosol. Exclusion of the RCC emissions in BTH decreases the PM2.5 concentration by around 30 % in Beijing, indicating that the air quality in Beijing will be remarkably improved if the residential coal in BTH and its surrounding areas can be replaced by other clean energy sources.
When only the RCC emissions in Beijing are excluded in simulations, does Beijing's PM2.5 level decrease by 18.0 % on average during the simulation period. Hence, the coal replacement plan in Beijing is beneficial to the local air quality, but is not anticipated to substantially improve the air quality. The mitigation effect of the coal replacement plan on PM2.5 in Beijing is the best under good and lightly polluted conditions, decreasing the PM2.5 mass concentration by around 25 %. However, under heavy or severe haze pollution, the local RCC emissions contribute about 15 % of PM2.5 in Beijing, showing the regional transport of PM2.5.
This study mainly aims to quantitatively evaluate the contributions of the RCC emissions to the air quality in BTH. Our results indicate that if the residential coal replacement is only implemented in Beijing, Beijing's air quality will be improved considerably, but not enough, considering the impact of trans-boundary transport. Implementation of the residential coal replacement in BTH and its surrounding areas can remarkably improve Beijing's air quality. Although the WRF-Chem model reasonably captures the temporal and spatial variations in air pollutants in BTH and diurnal variations in aerosol species in Beijing, the model biases still exit. Future studies need to be conducted to improve the WRF-Chem model simulations, considering the rapid changes in anthropogenic emissions since the implementation of APPCAP. Further sensitivity simulations of various emission mitigation measures also need to be performed to provide efficient emission control strategies to improve the air quality in BTH.
The real-time O3 and PM2.5 mass concentrations are accessible to the public on the website http://106.37.208.233:20035/ (China MEP, 2013a). One can also access the historic profiles of the observed ambient air pollutants by visiting http://www.aqistudy.cn/ (China MEP, 2013b).
GL designed the study. XL and GL wrote the paper. XL, JW, TF, and XT performed model simulations. ME, IE-H, JC, RH, and ASHP performed the HR-ToF-AMS measurements and analyzed the data. All authors reviewed and commented on the paper.
The authors declare that they have no conflict of interest.
This article is part of the special issue “Regional transport and transformation of air pollution in eastern China”. It is not associated with a conference.
This work is financially supported by the National Key
R & D Plan (Quantitative Relationship and Regulation Principle between
Regional Oxidation Capacity of Atmospheric and Air Quality, 2017YFC0210000).
Guohui Li is supported by the “Hundred Talents Program” of
the Chinese Academy of Sciences and the National Natural Science Foundation
of China (no. 41661144020).
Edited by: Yuan Wang
Reviewed by: three anonymous referees
An, X., Zhu, T., Wang, Z., Li, C., and Wang, Y.: A modeling analysis of a heavy air pollution episode occurred in Beijing, Atmos. Chem. Phys., 7, 3103–3114, https://doi.org/10.5194/acp-7-3103-2007, 2007.
Archernicholls, S., Carter, E. M., Kumar, R., Xiao, Q., Yang, L., Frostad, J., Forouzanfar, M. H., Cohen, A., Brauer, M., Baumgartner, J., and Wiedinmyer, C.: The regional impacts of cooking and heating emissions on ambient air quality and disease burden in China, Environ. Sci. Technol., 50, 9416–8423, https://doi.org/10.1021/acs.est.6b02533, 2016.
Bei, N., Li, G., and Molina, L. T.: Uncertainties in SOA simulations due to meteorological uncertainties in Mexico City during MILAGRO-2006 field campaign, Atmos. Chem. Phys., 12, 11295–11308, https://doi.org/10.5194/acp-12-11295-2012, 2012.
Bei, N., Li, G., Zavala, M., Barrera, H., Torres, R., Grutter, M., Gutierrez, W., Garcia, M., Ruiz-Suarez, L. G., Ortinez, A., Guitierrez, Y., Alvarado, C., Flores, I., and Molina, L. T.: Meteorological overview and plume transport patterns during Cal-Mex 2010, Atmos. Environ., 70, 477–489, https://doi.org/10.1016/j.atmosenv.2012.01.065, 2013.
Bei, N., Wu, J., Elser, M., Feng, T., Cao, J., El-Haddad, I., Li, X., Huang, R., Li, Z., Long, X., Xing, L., Zhao, S., Tie, X., Prévôt, A. S. H., and Li, G.: Impacts of meteorological uncertainties on the haze formation in Beijing–Tianjin–Hebei (BTH) during wintertime: a case study, Atmos. Chem. Phys., 17, 14579–14591, https://doi.org/10.5194/acp-17-14579-2017, 2017.
Boylan, J. W. and Russell, A. G.: PM and light extinction model performance metrics, goals, and criteria for three-dimensional air quality models, Atmos. Environ., 40, 4946–4959, https://doi.org/10.1016/j.atmosenv.2005.09.087, 2006.
BP Statistical Review of World Energy: available at: https://www.bp.com/en/global/corporate/energy-economics/statistical-review-of-world-energy.html/2017-4-5 (last access: July 2018), 2016.
Canonaco, F., Crippa, M., Slowik, J. G., Baltensperger, U., and Prévôt, A. S. H.: Sofi, an IGOR-based interface for the efficient use of the generalized multilinear engine (ME-2) for the source apportionment: ME-2 application to aerosol mass spectrometer data, Atmos. Meas. Tech., 6, 3649–3661, https://doi.org/10.5194/amt-6-3649-2013, 2013.
Chen, F. and Dudhia, J.: Coupling an advanced land surface-hydrology model with the Penn State-NCAR MM5 modeling system. Part I: Model implementation and sensitivity, Mon. Weather Rev., 129, 569–585, https://doi.org/10.1175/1520-0493(2001)129<0569:caalsh>2.0.co;2, 2001.
Chen, Y., Schleicher, N., Cen, K., Liu, X., Yu, Y., Zibat, V., Dietze, V., Fricker, M., Kaminski, U., Chen, Y., Chai, F., and Norra, S.: Evaluation of impact factors on PM2.5 based on long-term chemical components analyses in the megacity Beijing, China, Chemosphere, 155, 234–242, https://doi.org/10.1016/j.chemosphere.2016.04.052, 2016.
Cheng, M., Zhi, G., Tang, W., Liu, S., Dang, H., Guo, Z., Du, J., Du, X., Zhang, W., Zhang, Y., and Meng, F.: Air pollutant emission from the underestimated households' coal consumption source in China, Sci. Total Environ., 580, 641–650, https://doi.org/10.1016/j.scitotenv.2016.12.143, 2016.
China MEP – Ministry of Environmental Protection: Air Quality Observation Real-time Release Platform of MEP Data Center, available at: http://106.37.208.233:20035/ (last access: July 2018), 2013a.
Chine MEP – Ministry of Environmental Protection: Online Monitoring and Analysis Platform of China Air Quality, available at: http://www.aqistudy.cn/ (last access: July 2018), 2013b.
Chou, M. D. and Suarez, M. J.: A solar radiation parameterization for atmospheric studies, NASA TM-104606, Nasa Tech. memo 15, 1999.
Chou, M. D., Suarez, M. J., Liang, X. Z., Yan, M. H., and Cote, C.: A Thermal Infrared Radiation Parameterization for Atmospheric Studies, NASA TM-2001-104606, Max. J. 19, 2001.
Dunker, A. M., Morris, R. E., Pollack, A. K., Schleyer, C. H., and Yarwood, G: Photochemical modeling of the impact of fuels and vehicles on urban ozone using auto oil program data, Environ. Sci. Technol., 30, 787–801, 1996.
Elser, M., Huang, R., Wolf, R., Slowik, J. G., Wang, Q., Canonaco, F., Li, G., Bozzetti, C., Daellenbach, K. R., Huang, Y., Zhang, R., Li, Z., Cao, J., Baltensperger, U., El-Haddad, I., and Prévôt, A. S. H.: New insights into PM2.5 chemical composition and sources in two major cities in China during extreme haze events using aerosol mass spectrometry, Atmos. Chem. Phys., 16, 3207–3225, https://doi.org/10.5194/acp-16-3207-2016, 2016.
Emery, C., Liu, Z., Russell, A. G., Odman, M. T., Yarwood, G., and Kumar, N.: Recommendations on statistics and benchmarks to assess photochemical model performance, J. Air Waste Manage. Assoc., 67, 582–598, https://doi.org/10.1080/10962247.2016.1265027, 2017.
Fast, J. D., Jr, W. I. G., Easter, R. C., Zaveri, R. A., Barnard, J. C., Chapman, E. G., Grell, G. A., and Peckham, S. E.: Evolution of ozone, particulates, and aerosol direct radiative forcing in the vicinity of Houston using a fully coupled meteorology-chemistry-aerosol model, J. Geophys. Res.-Atmos., 111, D21305, https://doi.org/10.1029/2005JD006721, 2006.
Feng, T., Li, G., Cao, J., Bei, N., Shen, Z., Zhou, W., Liu, S., Zhang, T., Wang, Y., Huang, R., Tie, X., and Molina, L. T.: Simulations of organic aerosol concentrations during springtime in the Guanzhong Basin, China, Atmos. Chem. Phys., 16, 10045–10061, https://doi.org/10.5194/acp-16-10045-2016, 2016.
Gao, M., Carmichael, G. R., Wang, Y., Saide, P. E., Yu, M., Xin, J., Liu, Z., and Wang, Z.: Modeling study of the 2010 regional haze event in the North China Plain, Atmos. Chem. Phys., 16, 1673–1691, https://doi.org/10.5194/acp-16-1673-2016, 2016.
Ge, S., Xu, X., Chow, J.C., Watson, J., Sheng, Q., Liu, W., Bai, Z., Zhu, T., and Zhang, J.: Emissions of air pollutants from household Stoves: honeycomb coal versus coal cake, Environ. Sci. Technol., 38, 4612–4618, https://doi.org/10.1021/es049942k, 2004.
Grell, G. A., Peckham, S. E., Schmitz, R., McKeen, S. A., Frost, G., Skamarock, W. C., and Eder, B.: Fully coupled “online” chemistry within the WRF model, Atmos. Environ., 39, 6957–6975, https://doi.org/10.1016/j.atmosenv.2005.04.027, 2005.
Guenther, A., Karl, T., Harley, P., Wiedinmyer, C., Palmer, P. I., and Geron, C.: Estimates of global terrestrial isoprene emissions using MEGAN (Model of Emissions of Gases and Aerosols from Nature), Atmos. Chem. Phys., 6, 3181–3210, https://doi.org/10.5194/acp-6-3181-2006, 2006.
Guo, S., Hu, M., Wang, Z., Slanina, J., and Zhao, Y.: Size-resolved aerosol water-soluble ionic compositions in the summer of Beijing: implication of regional secondary formation, Atmos. Chem. Phys., 10, 947–959, https://doi.org/10.5194/acp-10-947-2010, 2010.
Guo, S., Hu, M., Zamora, M. L., Peng, J., Shang, D., Zheng, J., Du, Z. F., Wu, Z., Shao, M., Zeng, L. M., Molina, M. J., and Zhang, R.: Elucidating severe urban haze formation in China, P. Natl. Acad. Sci. USA, 111, 17373–17378, https://doi.org/10.1073/pnas.1419604111, 2014.
Hong, S. Y. and Lim, J. O. J.: The WRF Single-Moment 6-Class Microphysics Scheme (WSM6), Asia-Pacif. J. Atmos. Sci., 42, 129–151, 2006.
Horowitz, L. W., Walters, S., Mauzerall, D. L., Emmons, L. K., Rasch, P. J., Granier, C., Tie, X., Lamarque, J. F., Schultz, M. G., Tyndall, G. S., Orlando, J. J., and Brasseur, G. P.: A global simulation of tropospheric ozone and related tracers: Description and evaluation of MOZART, version 2, J. Geophys. Res., 108, 4784, https://doi.org/10.1029/2002jd002853, 2003.
Huang, R., Zhang, Y., Bozzetti, C., Ho, K. F., Cao, J., Han, Y., Daellenbach, K. R., Slowik, J. G., Platt, S. M., Canonaco, F., Zotter, P., Wolf, R., Pieber, S. M., Bruns, E. A., Crippa, M., Ciarelli, G., Piazzalunga, A., Schwikowski, M., Abbaszade, G., Schnelle-Kreis, J., Zimmermann, R., An, Z., Szidat, S., Baltensperger, U., El Haddad, I., and Prevot, A. S. H.: High secondary aerosol contribution to particulate pollution during haze events in China, Nature, 514, 218–222, https://doi.org/10.1038/nature13774, 2014.
Janjić, Z. I.: Nonsingular Implementation of the Mellor-Yamada Level 2.5 Scheme in the NCEP Meso Model, NCEP Office Note 437, 2002.
Lei, Y., Zhang, Q., He, K., and Streets, D. G.: Primary anthropogenic aerosol emission trends for China, 1990–2005, Atmos. Chem. Phys., 11, 931–954, https://doi.org/10.5194/acp-11-931-2011, 2011.
Li, G., Zhang, R., Fan, J., and Tie, X.: Impacts of black carbon aerosol on photolysis and ozone, J. Geophys. Res.-Atmos., 110, D23206, https://doi.org/10.1029/2005JD005898, 2005.
Li, G., Lei, W., Zavala, M., Volkamer, R., Dusanter, S., Stevens, P., and Molina, L. T.: Impacts of HONO sources on the photochemistry in Mexico City during the MCMA-2006/MILAGO Campaign, Atmos. Chem. Phys., 10, 6551–6567, https://doi.org/10.5194/acp-10-6551-2010, 2010.
Li, G., Bei, N., Tie, X., and Molina, L. T.: Aerosol effects on the photochemistry in Mexico City during MCMA-2006/MILAGRO campaign, Atmos. Chem. Phys., 11, 5169–5182, https://doi.org/10.5194/acp-11-5169-2011, 2011a.
Li, G., Zavala, M., Lei, W., Tsimpidi, A. P., Karydis, V. A., Pandis, S. N., Canagaratna, M. R., and Molina, L. T.: Simulations of organic aerosol concentrations in Mexico City using the WRF-Chem model during the MCMA-2006/MILAGRO campaign, Atmos. Chem. Phys., 11, 3789–3809, https://doi.org/10.5194/acp-11-3789-2011, 2011b.
Li, J., Huang, X., Yang, H., Chuai, X., Li, Y., Qu, J., and Zhang, Z.: Situation and determinants of household carbon emissions in Northwest China, Habitat Int., 51, 178–187, https://doi.org/10.1016/j.habitatint.2015.10.024, 2016.
Li, M., Zhang, Q., Kurokawa, J. I., Woo, J. H., He, K., Lu, Z., Ohara, T., Song, Y., Streets, D. G., Carmichael, G. R., Cheng, Y., Hong, C., Huo, H., Jiang, X., Kang, S., Liu, F., Su, H., and Zheng, B.: MIX: a mosaic Asian anthropogenic emission inventory under the international collaboration framework of the MICS-Asia and HTAP, Atmos. Chem. Phys., 17, 935–963, https://doi.org/10.5194/acp-17-935-2017, 2017.
Li, X., Zhang, Q., Zhang, Y., Zheng, B., Wang, K., and Chen, Y.: Source contributions of urban PM2.5 in the Beijing-Tianjin-Hebei region: Changes between 2006 and 2013 and relative impacts of emissions and meteorology, Atmos. Environ., 123, 229–239, https://doi.org/10.1016/j.atmosenv.2015.10.048, 2015.
Liu, F., Zhang, Q., Tong, D., Zheng, B., Li, M., Huo, H., and He, K.: High-resolution inventory of technologies, activities, and emissions of coal-fired power plants in China from 1990 to 2010, Atmos. Chem. Phys., 15, 13299–13317, https://doi.org/10.5194/acp-15-13299-2015, 2015.
Liu, J., Mauzerall, D. L., Chen, Q., Zhang, Q., Song, Y., Peng, W., Klimont, Z., Qiu, X., Zhang, S., Hu, M., Lin, W., Smith, K. R., Zhu, T.: Air pollutant emissions from Chinese households: a major and underappreciated ambient pollution source, P. Natl. Acad. Sci. USA, 113, 7756–7761, https://doi.org/10.1073/pnas.1604537113, 2016.
Long, X., Tie, X., Cao, J., Huang, R., Feng, T., Li, N., Zhao, S., Tian, J., Li, G., and Zhang, Q.: Impact of crop field burning and mountains on heavy haze in the North China Plain: a case study, Atmos. Chem. Phys., 16, 9675–9691, https://doi.org/10.5194/acp-16-9675-2016, 2016.
Lv, B., Zhang, B., and Bai, Y.: A systematic analysis of PM2.5 in Beijing and its sources from 2000 to 2012, Atmos. Environ., 124, 98–108, https://doi.org/10.1016/j.atmosenv.2015.09.031, 2016.
Ma, Q., Cai, S., Wang, S., Zhao, B., Martin, R. V., Brauer, M., Cohen, A., Jiang, J., Zhou, W., Hao, J., Frostad, J., Forouzanfar, M. H., and Burnett, R. T.: Impacts of coal burning on ambient PM2.5 pollution in China, Atmos. Chem. Phys., 17, 4477–4491, https://doi.org/10.5194/acp-17-4477-2017, 2017.
Nenes, A., Pandis, S. N., and Pilinis, C.: ISORROPIA: A new thermodynamic equilibrium model for multiphase multi-component inorganic aerosols, Aquat. Geochem., 4, 123–152, https://doi.org/10.1023/a:1009604003981, 1998.
Peng, J., Hu, M., Guo, S., Du, Z., Shang, D., Zheng, J., Zheng, J., Zeng, L., Shao, M., Wu, Y., Collins, D., and Zhang, R.: Ageing and hygroscopicity variation of black carbon particles in Beijing measured by a quasi-atmospheric aerosol evolution study (QUALITY) chamber, Atmos. Chem. Phys., 17, 10333–10348, https://doi.org/10.5194/acp-17-10333-2017, 2017.
Qiao, X., Ying, Q., Li, X., Zhang, H., Hu, J., Tang, Y., and Chen, X.: Source apportionment of PM2.5 for 25 Chinese provincial capitals and municipalities using a source-oriented Community Multiscale Air Quality model, Sci. Total Environ., 612, 462–471, https://doi.org/10.1016/j.scitotenv.2017.08.272, 2017.
Quan, J., Tie, X., Zhang, Q., Liu, Q., Li, X., Gao, Y., and Zhao, D.: Characteristics of heavy aerosol pollution during the 2012–2013 winter in Beijing, China, Atmos. Environ., 88, 83–89, https://doi.org/10.1016/j.atmosenv.2014.01.058, 2014.
Seinfeld, J. H. and Pandis, S. N.: Atmospheric Chemistry and Physics: From Air Pollution to Climate Change, 2nd Edn., John Wiley and Sons Inc., New York, 2006.
Sheehan, P., Cheng, E., English, A., and Sun, F.: China's response to the air pollution shock, Nat. Clim. Change, 4, 306–309, https://doi.org/10.1038/nclimate2197, 2014.
Shen, G., Yang, Y., Wang, W., Tao, S., Zhu, C., Min, Y., Xue, M., Ding, J., Wang, B., Wang, R., Shen, H., Li, W., Wang, X., and Russell, A. G.: Emission factors of particulate matter and elemental carbon for crop residues and coals burned in typical household stoves in China, Environ. Sci. Technol., 44, 7157–7162, https://doi.org/10.1021/es101313y, 2010.
Tie, X., Madronich, S., Walters, S., Zhang, R., Rasch, P., and Collins, W.: Effect of clouds on photolysis and oxidants in the troposphere, J. Geophys. Res., 108, 4642, https://doi.org/10.1029/2003jd003659, 2003.
US EPA – United States Environmental Protection Agency: Guidance on the Use of Models and Other Analyses in Attainment Demonstrations for the 8-hour Ozone NAAQS, EPA-454/R-05-002, 2005.
Wang, C.: Impact of anthropogenic absorbing aerosols on clouds and precipitation: a review of recent progresses, Atmos. Res., 122, 237–249, https://doi.org/10.1016/j.atmosres.2012.11.005, 2013.
Wang, G., Zhang, R., Gomez, M. E., Yang, L., Zamora, M. L., Hu, M., Lin, Y., Peng, J., Guo, S., Meng, J., Li, J., Cheng, C., Hu, T., Ren, Y., Wang, Y., Gao, J., Cao, J., An, Z., Zhou, W., Li, G., Wang, J., Tian, P., Marrero-Ortiz, W., Secrest, J., Du, Z., Zheng, J., Shang, D., Zeng, L., Shao, M., Wang, W., Huang, Y., Wang, Y., Zhu, Y., Li, Y., Hu, J., Pan, B., Cai, L., Cheng, Y., Ji, Y., Zhang, F., Rosenfeld, D., Liss, P. S., Duce, R. A., Kolb, C. E., and Molina, M. J.: Persistent sulfate formation from London fog to Chinese haze, P. Natl. Acad. Sci. USA, 113, 13630–13635, https://doi.org/10.1073/pnas.1616540113, 2016.
Wang, L., Wei, Z., Yang, J., Zhang, Y., Zhang, F., Su, J., Meng, C., and Zhang, Q.: The 2013 severe haze over southern Hebei, China: model evaluation, source apportionment, and policy implications, Atmos. Chem. Phys., 14, 3151–3173, https://doi.org/10.5194/acp-14-3151-2014, 2014.
Wang, X., Carmichael, G., Chen, D., Tang, Y., and Wang, T.: Impacts of different emission sources on air quality during March 2001 in the Pearl River Delta (PRD) region, Atmos. Environ., 39, 5227–5241, https://doi.org/10.1016/j.atmosenv.2005.04.035, 2005.
Wesely, M. L.: Parameterization of surface resistances to gaseous dry deposition in regional-scale numerical models, Atmos. Environ., 23, 1293–1304, https://doi.org/10.1016/0004-6981(89)90153-4, 1989.
Williams, L. R., Gonzalez, L. A., Peck, J., Trimborn, D., McInnis, J., Farrar, M. R., Moore, K. D., Jayne, J. T., Robinson, W. 80 A., Lewis, D. K., Onasch, T. B., Canagaratna, M. R., Trimborn, A., Timko, M. T., Magoon, G., Deng, R., Tang, D., de la Rosa Blanco, E., Prévôt, A. S. H., Smith, K. A., and Worsnop, D. R.: Characterization of an aerodynamic lens for transmitting particles greater than 1 micrometer in diameter into the Aerodyne 85 aerosol mass spectrometer, Atmos. Meas. Tech., 6, 3271–3280, https://doi.org/10.5194/amt-6-3271-2013, 2013.
Wornat, M. J., Ledesma, E. B., Sandrowitz, A. K., Roth, M. J., Dawsey, S. M., Qiao, Y. L., and Chen, W.: Polycyclic aromatic hydrocarbons identified in soot extracts from domestic coal-burning stoves of Henan province, China, Environ. Sci. Technol., 35, 1943–1952, https://doi.org/10.1021/es001664b, 2001.
Wu, J., Li, G., Cao, J., Bei, N., Wang, Y., Feng, T., Huang, R., Liu, S., Zhang, Q., and Tie, X.: Contributions of trans-boundary transport to summertime air quality in Beijing, China, Atmos. Chem. Phys., 17, 2035–2051, https://doi.org/10.5194/acp-17-2035-2017, 2017.
Xue, Y., Zhou, Z., Nie, T., Wang, K., Nie, L., Pan, T., Wu, X., Tian, H., Zhong, L., Li, J., Liu, H., Liu, S., and Shao, P.: Trends of multiple air pollutants emissions from residential coal combustion in Beijing and its implication on improving air quality for control measures, Atmos. Environ., 142, 303–312, https://doi.org/10.1016/j.atmosenv.2016.08.004, 2016.
Yang, H., Chen, J., Wen, J., Tian, H., and Liu, X.: Composition and sources of PM2.5, around the heating periods of 2013 and 2014 in Beijing: implications for efficient mitigation measures, Atmos. Environ., 124, 378–386, https://doi.org/10.1016/j.atmosenv.2015.05.015, 2016.
Zhang, H. and Ying, Q.: Contributions of local and regional sources of NOx to ozone concentrations in Southeast Texas, Atmos. Environ., 45, 2877–2887, 2011.
Zhang, L., Wang, T., Lv, M., and Zhang, Q.: On the severe haze in Beijing during January 2013: unraveling the effects of meteorological anomalies with WRF-Chem, Atmos. Environ., 104, 11–21, https://doi.org/10.1016/j.atmosenv.2015.01.001, 2013.
Zhang, L., Liu, L., Zhao, Y., Gong, S., Zhang, X., Henze, D. K., Capps, S. L., Fu, T., Zhang, Q. and Wang, Y.: Source attribution of particulate matter pollution over North China with the adjoint method, Environ. Res. Lett., 10, 084011, https://doi.org/10.1088/1748-9326/10/8/084011, 2015.
Zhang, Q., Streets, D. G., Carmichael, G. R., He, K., Huo, H., Kannari, A., Klimont, Z., Park, I. S., Reddy, S., Fu, J., Chen, D., Duan, L., Lei, Y., Wang, L., and Yao, Z.: Asian emissions in 2006 for the NASA INTEX-B mission, Atmos. Chem. Phys., 9, 5131–5153, https://doi.org/10.5194/acp-9-5131-2009, 2009.
Zhang, Q., He, K., and Huo, H.: Policy: cleaning china's air, Nature, 484, 161–162, https://doi.org/10.1038/484161a, 2012.
Zhang, R., Wang, L., Khalizova, A. F., Zhao, J., Zheng, J., Mc-Grawb, R. L., and Molina, L. T.: Formation of nanoparticles of blue haze enhanced by anthropogenic pollution, P. Natl. Acad. Sci. USA, 106, 17650–17654, 2009.
Zhang, R., Jing, J., Tao, J., Hsu, S. C., Wang, G., Cao, J., Lee, C. S. L., Zhu, L., Chen, Z., Zhao, Y., and Shen, Z.: Chemical characterization and source apportionment of PM2.5 in Beijing: seasonal perspective, Atmos. Chem. Phys., 13, 7053–7074, https://doi.org/10.5194/acp-13-7053-2013, 2013.
Zhang, X., Wang, Y., Niu, T., Zhang, X., Gong, S., Zhang, Y., and Sun, J.: Atmospheric aerosol compositions in China: spatial/temporal variability, chemical signature, regional haze distribution and comparisons with global aerosols, Atmos. Chem. Phys., 11, 26571–26615, https://doi.org/10.5194/acpd-11-26571-2011, 2011.
Zhi, G., Chen, Y., Feng, Y., Xiong, S., Li, J., Zhang, G., Sheng, G., and Fu, J.: Emission characteristics of carbonaceous particles from various residential coal-stoves in China, Environ. Sci. Technol., 42, 3310–3315, https://doi.org/10.1021/es702247q, 2008.
Zíková, N., Wang, Y., Yang, F., Li, X., Tian, M., and Hopke, P. K.: On the source contribution to Beijing PM2.5 concentrations, Atmos. Environ., 134, 84–95, https://doi.org/10.1016/j.atmosenv.2016.03.047, 2016.