the Creative Commons Attribution 4.0 License.
the Creative Commons Attribution 4.0 License.
 | 25 Jul 2018
Comparison of air quality at different altitudes from multi-platform measurements in Beijing
Hongzhu Ji
Siying Chen
Yinchao Zhang
He Chen
Pan Guo
Peitao Zhao
The features of upper-air visibility at altitudes of 0.1, 0.3, and 0.5 km and the two-dimensional haze characteristics in the northwest of downtown Beijing were studied by using a multi-platform analysis during haze episodes between 17 December 2016 and 6 January 2017. Through the multi-platform data analysis in hourly and daily variation, the upper-air visibility increased along with the decrease of PM2.5 mass concentration. And the upper-air visibility on non-haze days was about 3–5 times higher than that on haze days with the ground-based Raman–Mie lidar data between 13 December 2016 and 11 January 2017. The vertical transport of pollutants can be inferred from the delayed variation of upper-air visibility between high altitude and low altitude. In addition, the two-dimensional haze characteristics could be studied by analyzing the correlation between vertical haze parameters (atmospheric boundary layer, haze thickness, and aerosol optical thickness) and horizontal haze parameter (upper-air visibility). The characteristics of multi-parameters have been analyzed and concluded for different haze levels.
- Article
(2690 KB) - Full-text XML
- BibTeX
- EndNote


Due to increasing anthropogenic emissions resulting from China's rapid economy growth and urbanization, haze pollution has been a common problem in East Asia, especially China (Han et al., 2016; Guan et al., 2017; Liu et al., 2013). During the past two decades, scientists have carried out many experiments to explain the formation and evolution mechanism of haze (Chen and Wang, 2015; Tao et al., 2014; Wu et al., 2012; Xin et al., 2014; Zhao et al., 2017). The annual haze days in northern China were relatively few in the 1960s but increased sharply in the 1970s and have remained stable to the present through the analysis of long-term variation during the period of 1960–2012 (Chen and Wang, 2015). To characterize the haze phenomena, it is important to understand the haze parameters determined by aerosol optical properties. It is known that visibility mainly reflects the information of horizontal extinction near the surface and can be considered a good indicator of haze pollution (Sun et al., 2016; Yang et al., 2013). According to research of Wu et al. (2012), the visibility on sunny days at 543 stations in China was analyzed, and the results indicated the annual mean visibility on sunny days is higher in northwestern China and lower in southeastern China, which is similar to the distribution of aerosol optical thickness (AOT). In addition, the visibility impairment is attributed to the scattering and absorption of the particulate and gaseous pollutants in the atmosphere (Mishra and Kulshrestha, 2016; Song et al., 2003; Yang et al., 2007).
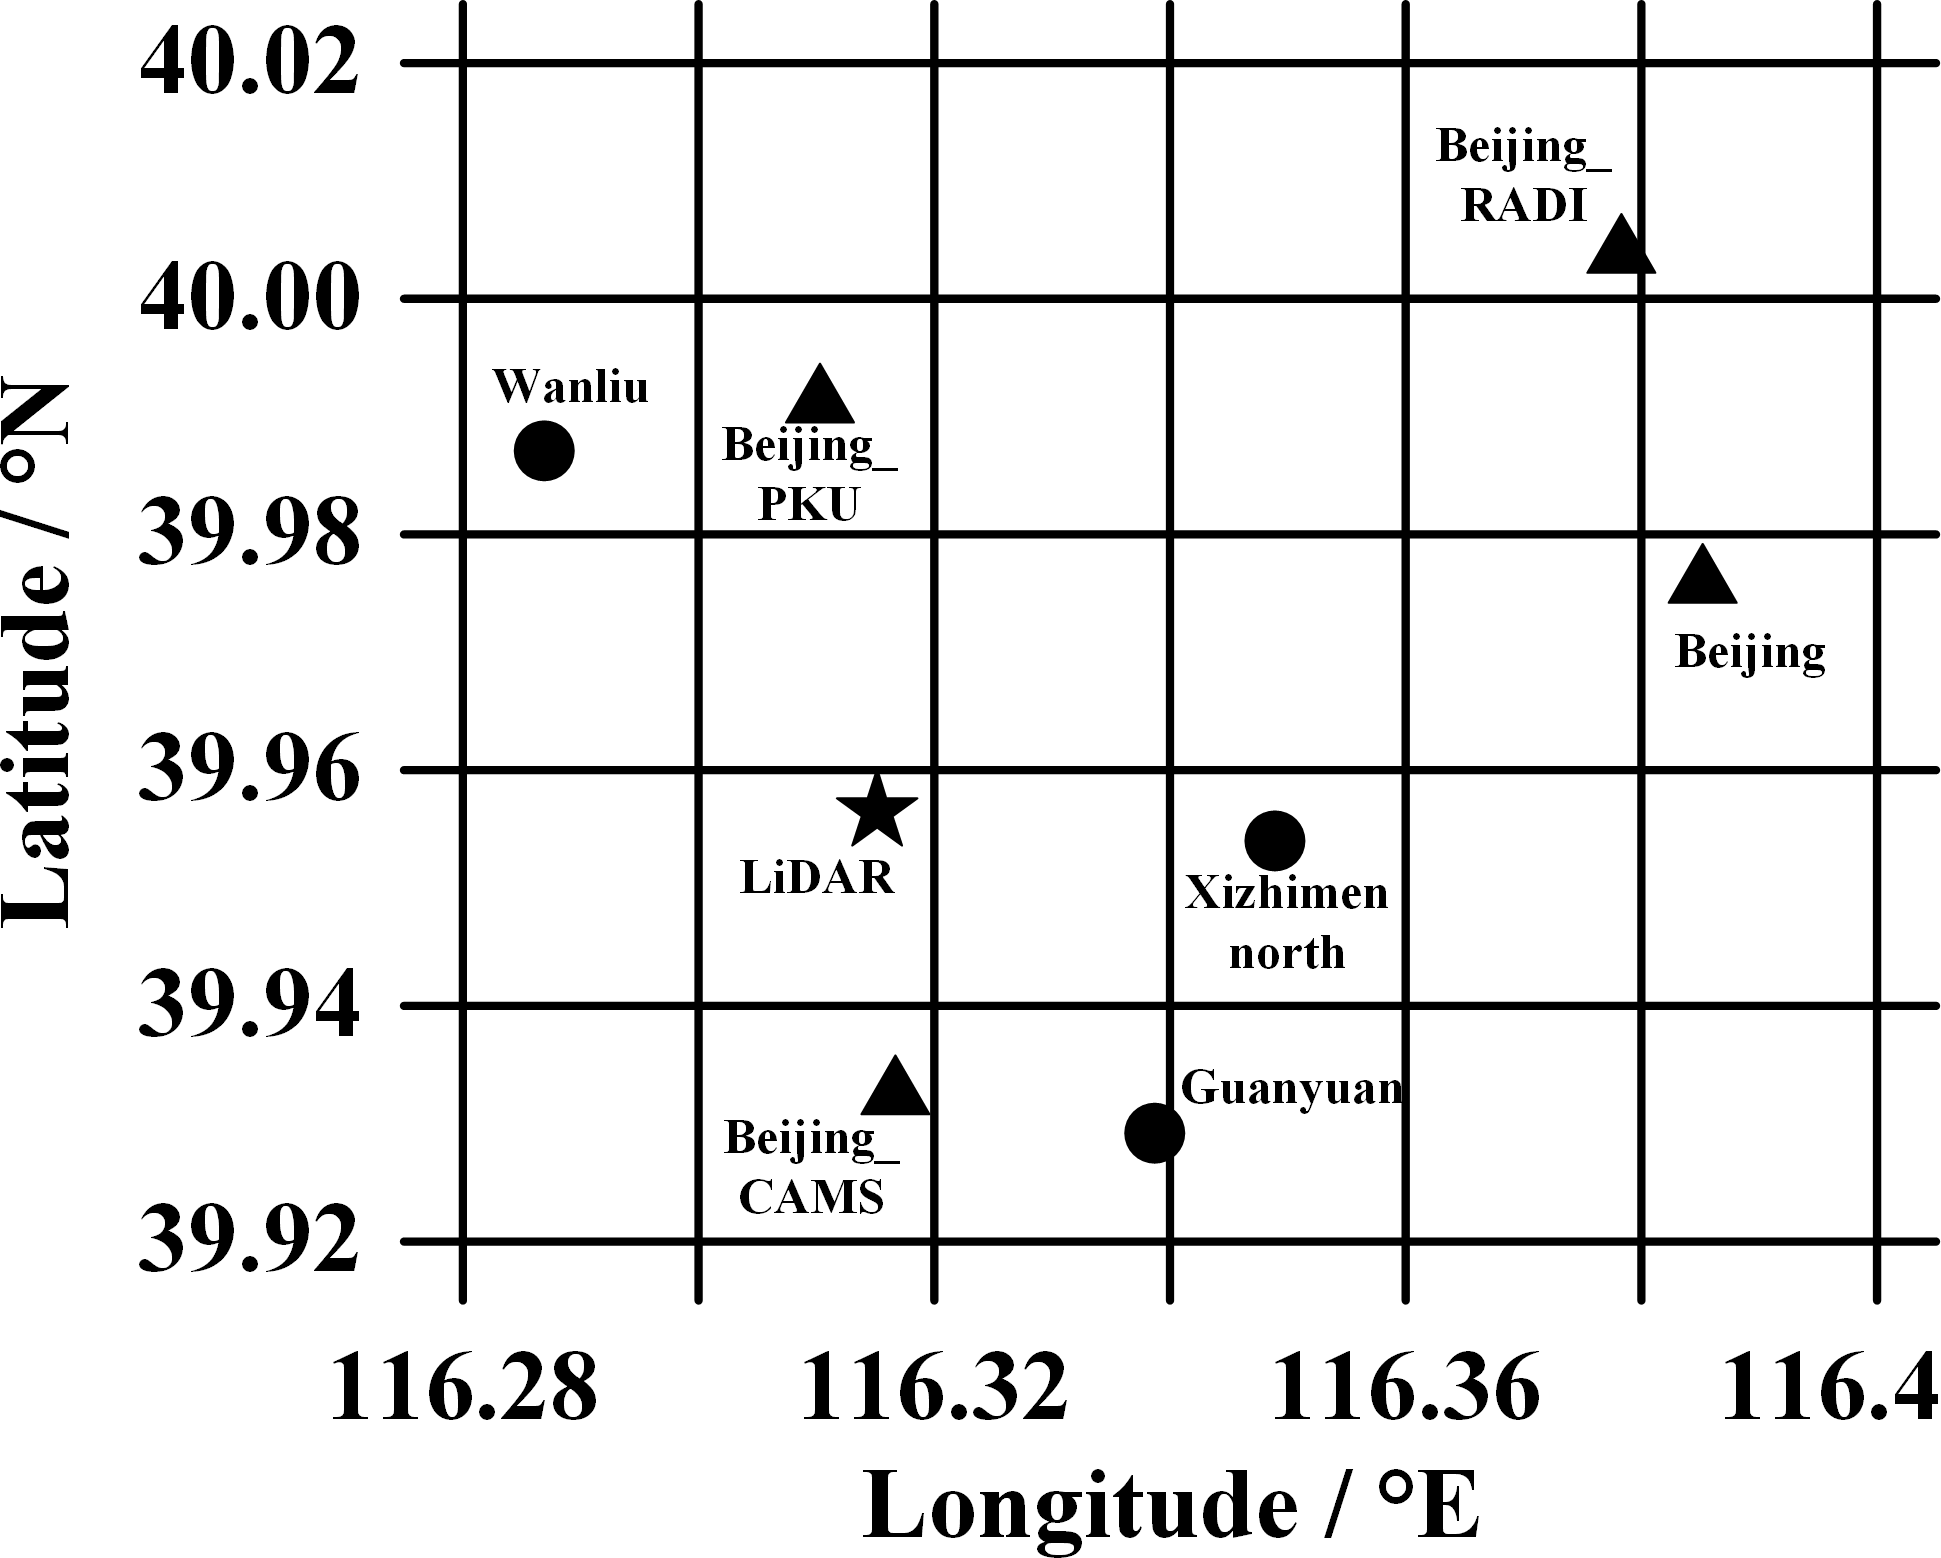
Figure 1Geographic coordinates of the ground-based lidar site (star), air quality monitoring sites (circles) and AERONET sites (triangles).
The height of the atmospheric boundary layer (ABL) is an important parameter to study the remote sensing of particulate matter near the ground, which has the closest relationship with human activities and the ecological environment (Amiridis et al., 2007; Dong et al., 2017; Li et al., 2017; Sawyer and Li, 2013; Stull, 2012). And the height of ABL changes rapidly (about 1 h) with surface effects (Chen et al., 2016; Wu et al., 2013; Zhang et al., 2013). Satellite observations show that the extensive haze layers, caused by widespread haze pollution, over northern China look like clouds, which are usually called “haze clouds” to indicate their large coverage (Tao et al., 2012, 2014). The dense haze layer can evidently alter regional radiation and the hydrological cycle. Then the near-surface horizontal visibility will be further impaired due to radiative feedback (Gao et al., 2015; Li et al., 2017; Qian et al., 2009). Tao et al. (2014) presented that the formation and variation of thick haze layers are mostly associated with regional transport and moist airflows. AOT is defined as the extinction of monochromatic light due to the presence of aerosols in the atmosphere, and can be retrieved by the integration of aerosol extinction coefficient over the entire column. Much research has reported the importance of AOT to visibility (Alexandrov et al., 2016; Bäumer et al., 2008; Dong et al., 2017; Li et al., 2007; Xin et al., 2014). Through observing the deterioration process of air quality in Germany, Bäumer et al. (2008) found that a distinct decreasing trend in visibility was accompanied by a significant increase in AOT. So far, many researches have been conducted to study the effect of different haze parameters on visibility. However, the above research mainly focused on the horizontal visibility near the ground, with less focus on the characteristics of upper-air visibility (Up-Vis), which is used as a proxy for aerosol extinction at different altitudes (Chao, 1955; Middleton, 1951). Moreover, there is not much research on two-dimensional haze characteristics, especially the consistency between ground-level and upper-level measurements.
In this paper, the characteristic of Up-Vis and potential correlation with various vertical haze parameters (ABL, AOT and haze thickness) were investigated in the northwest of downtown Beijing during haze episodes between 17 December 2016 and 6 January 2017. The research was conducted by using the ground-based Raman–Mie lidar, meteorological ground-based observation equipment, and the ground-based remote sensing aerosol robotic network (AERONET). This paper aims to (1) present the hourly and daily variation of haze parameters during the haze episode in the northwest of downtown Beijing; (2) reveal the impact of the vertical transport of PM2.5 (particulate matter with a diameter less than 2.5 µm) mass concentration on Up-Vis and investigate the two-dimensional haze phenomenon based on the correlation between vertical haze parameter (ABL, AOT and haze thickness) and horizontal haze parameter (Up-Vis); (3) understand the classification standard of haze levels, proposed by World Meteorological Organization (WMO), based on the multi-parameter analysis.
2.1 Site description
Figure 1 shows the geographic coordinates of multi-platform sites, including one ground-based lidar detecting site (denoted as a star), three air quality monitoring sites (circles) and four AERONET sites (triangles). The ground-based Raman–Mie lidar site is located at the lidar lab of Beijing Institute of Technology in Beijing, China. The detected pure rotational Raman and elastic returns are used to obtain the vertical characteristic of aerosols. The selected three air quality monitoring sites around the lidar site include Xizhimen north, Wanliu, and Guanyuan. The PM2.5 mass concentration is one of the variables to be monitored. The data collected from four AERONET sites, including Beijing site, Beijing_RADI site, Beijing_PKU site, and Beijing_CAMS site, are used to acquire the AOT value at the lidar site by using statistical calculation. The distances between the lidar site and other ones range from 2.63 to 7.59 km. Moreover, the periods of all the downloading PM2.5 mass concentration data and AOT data are the same as the detecting time, between 13 December 2016 and 11 January 2017, of ground-based lidar site.
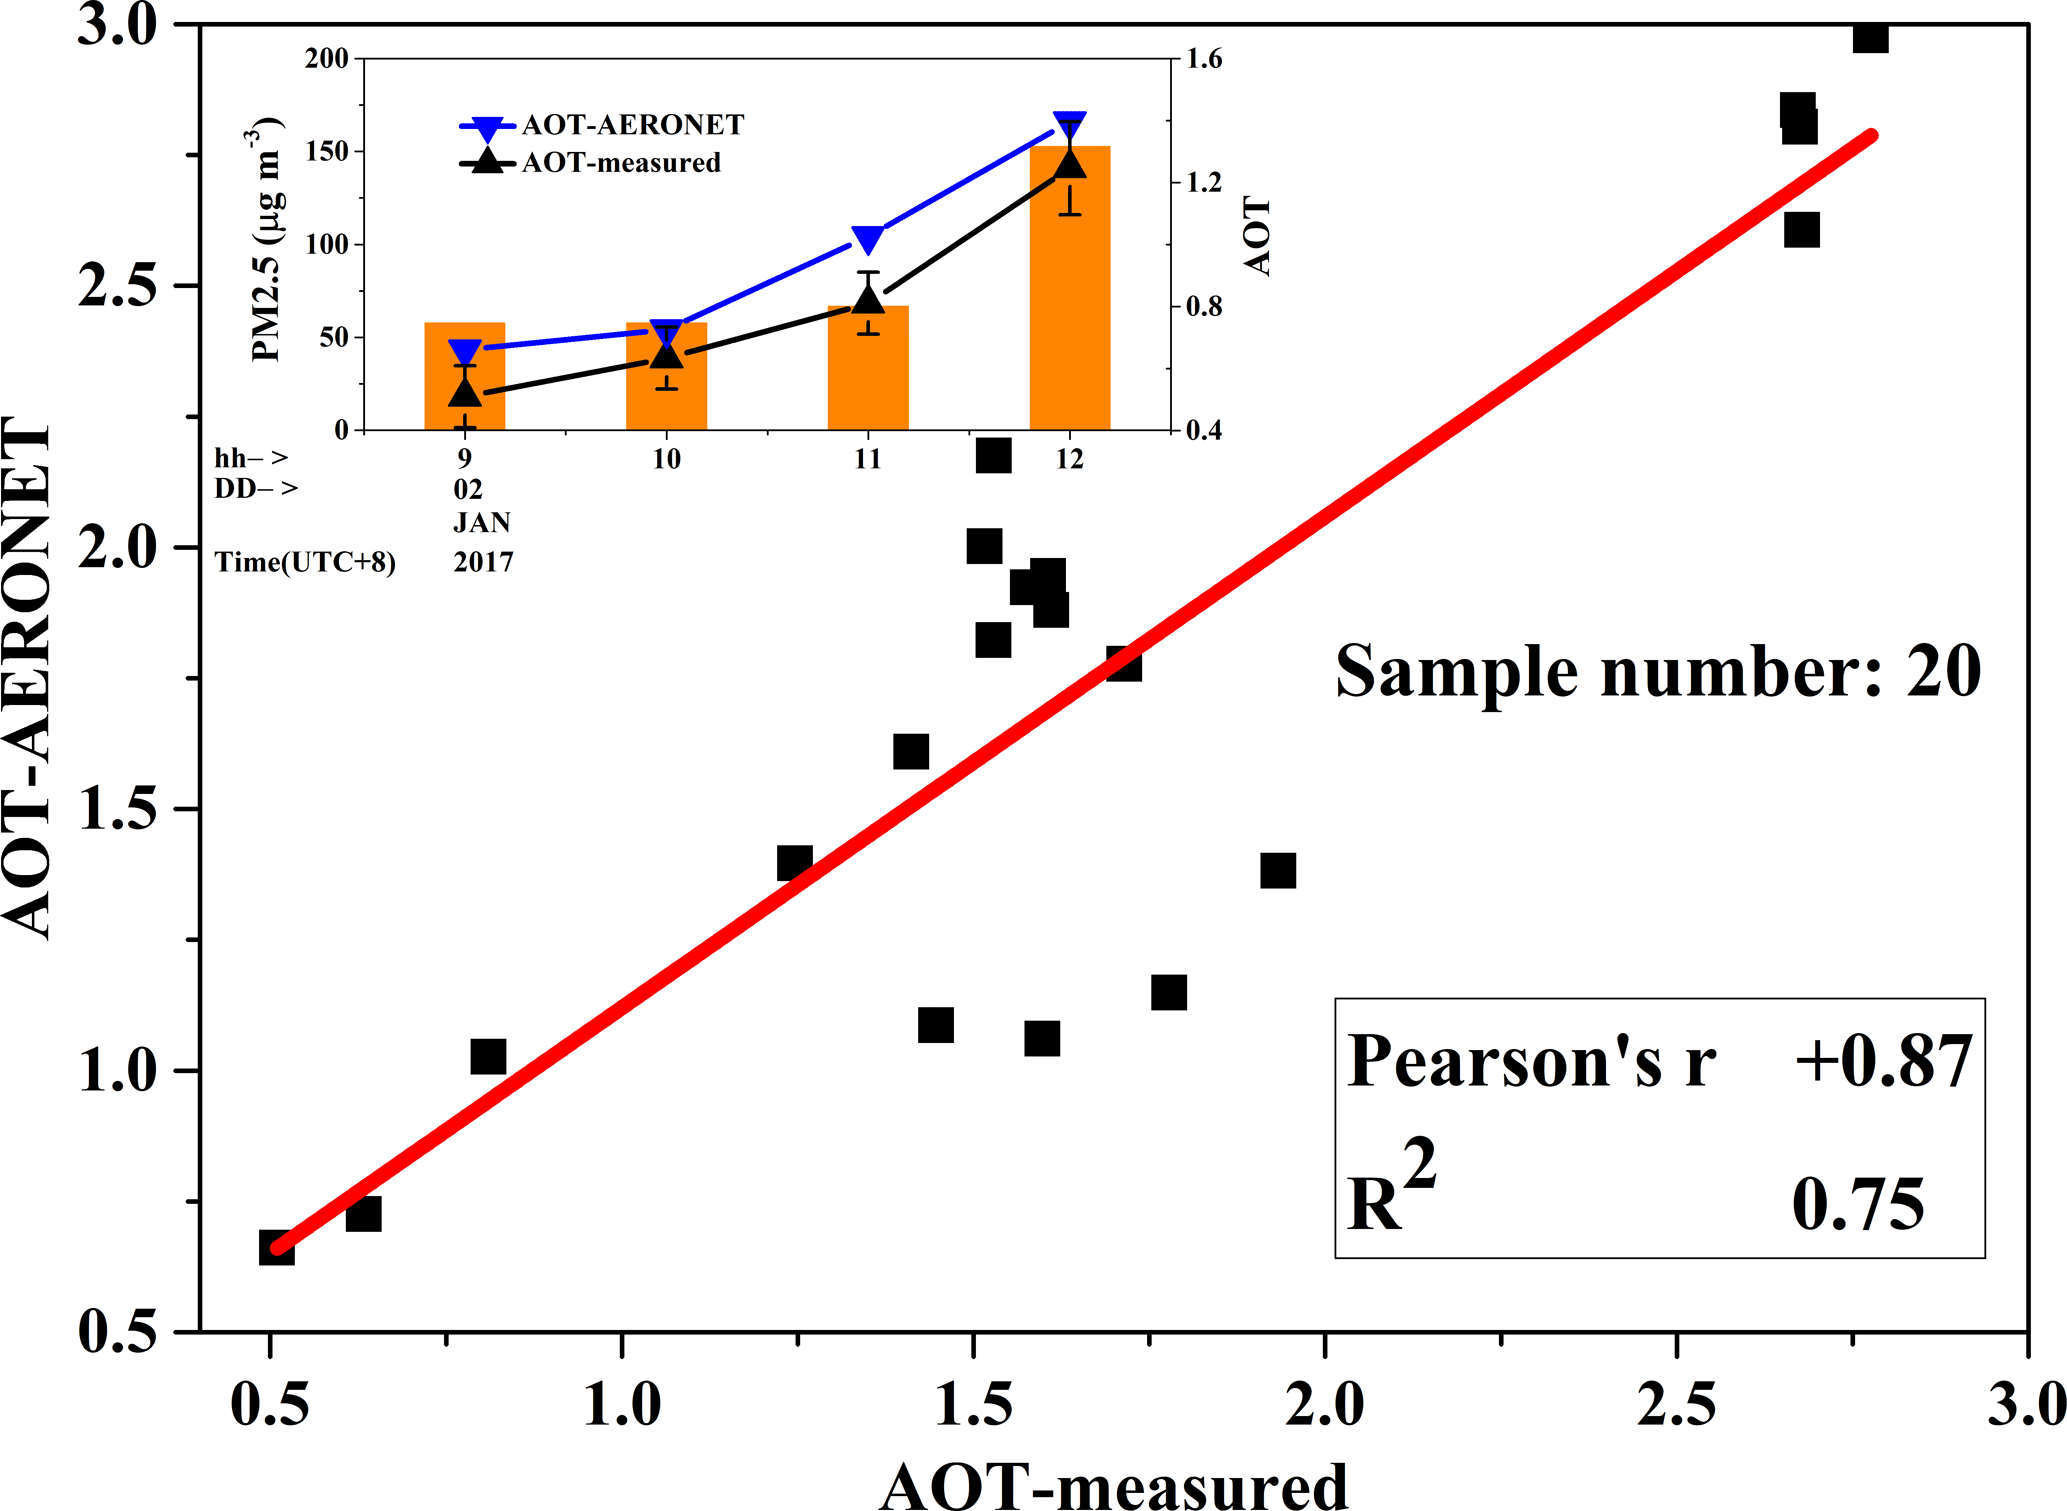
Figure 2Correlation of the AOT values deduced from AERONET sites and ground-based lidar data. The inserted chart gives the changes of PM2.5 mass concentration and AOT values at the ground-based lidar site on 2 January 2017.
2.2 Data analysis method
To obtain the PM and AOT values in the ground-based lidar site accurately and reliably, three air quality sites and four AERONET sites (Fig. 1) are selected for collecting data. According to the distance information between the lidar site and the selected sites, the PM and AOT values at the lidar site are calculated with the following statistical equations:
where PMi represents the PM value of the selected three air quality sites supplied by the Beijing Municipal Environmental Monitoring Center (BJMEMC); AOTi describes the AOT value of the four AERONET sites; Gi and Qi denote the normalized weight function which is inversely proportional to the distance between lidar site and the selected sites. According to the definition of AOT, it can be obtained by the integration of aerosol extinction coefficient over the entire column with the expression of , where αa(z) is the aerosol extinction coefficient (AEC) which is retrieved from ground-based Raman–Mie lidar data with some robust inversion methods (Ji et al., 2017). As shown in Fig. 2, it is believed that the AOT value deduced from ground-based lidar data is reasonable and reliable due to the excellent Pearson correlation coefficient (+0.87) and R2 value (0.75). Besides, AOT is classified as vertical haze parameter because of its representative significance to pollutant concentration at the vertical column.
The Up-Vis is defined as the horizontal visibility at different altitudes, which is classified as a horizontal haze parameter. According to the Koschmieder's formula (Larson and Cass, 1989; Lee and Shang, 2016), the Up-Vis at a certain altitude is calculated with the following equation:
where A is the limiting contrast threshold for the average human observer, with the common value of 0.02 (Middleton, 1951). bext is the total extinction coefficient. According to the research of Song et al. (2003), the visibility impairment mainly depends on the light scattering extinction by particles in bext.
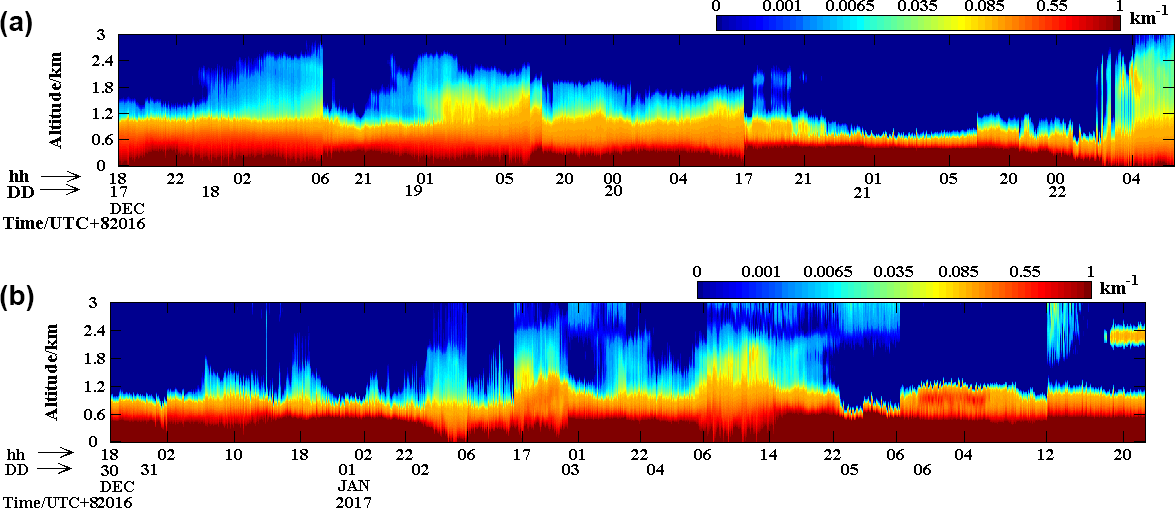
Figure 3Space–time diagram of AEC in the northwest of downtown Beijing during two haze episodes around 1 January 2017.
According to the observation and forecasting level of haze (QX/T 113-2010) and the requirements for human health (Jarraud, 2008; Han et al., 2016), when the Up-Vis at a certain altitude is about 5 km based on Eq. (3), the haze thickness (HT) can be defined as the value of this altitude. Therefore, HT reflects the main region of high-concentration pollution and can be classified as vertical haze parameter.
The height of ABL is affected by the underlying surface and can be retrieved by detecting the rapid drop-off in extinction or backscatter coefficient between the free troposphere and the mixing layer as shown in the following equation (Flamant et al., 1997; Sawyer and Li, 2013):
Tang et al. (2015) indicated the ABL represents the atmospheric diffusion capacity in vertical direction, so it can be classified as the vertical haze parameter.
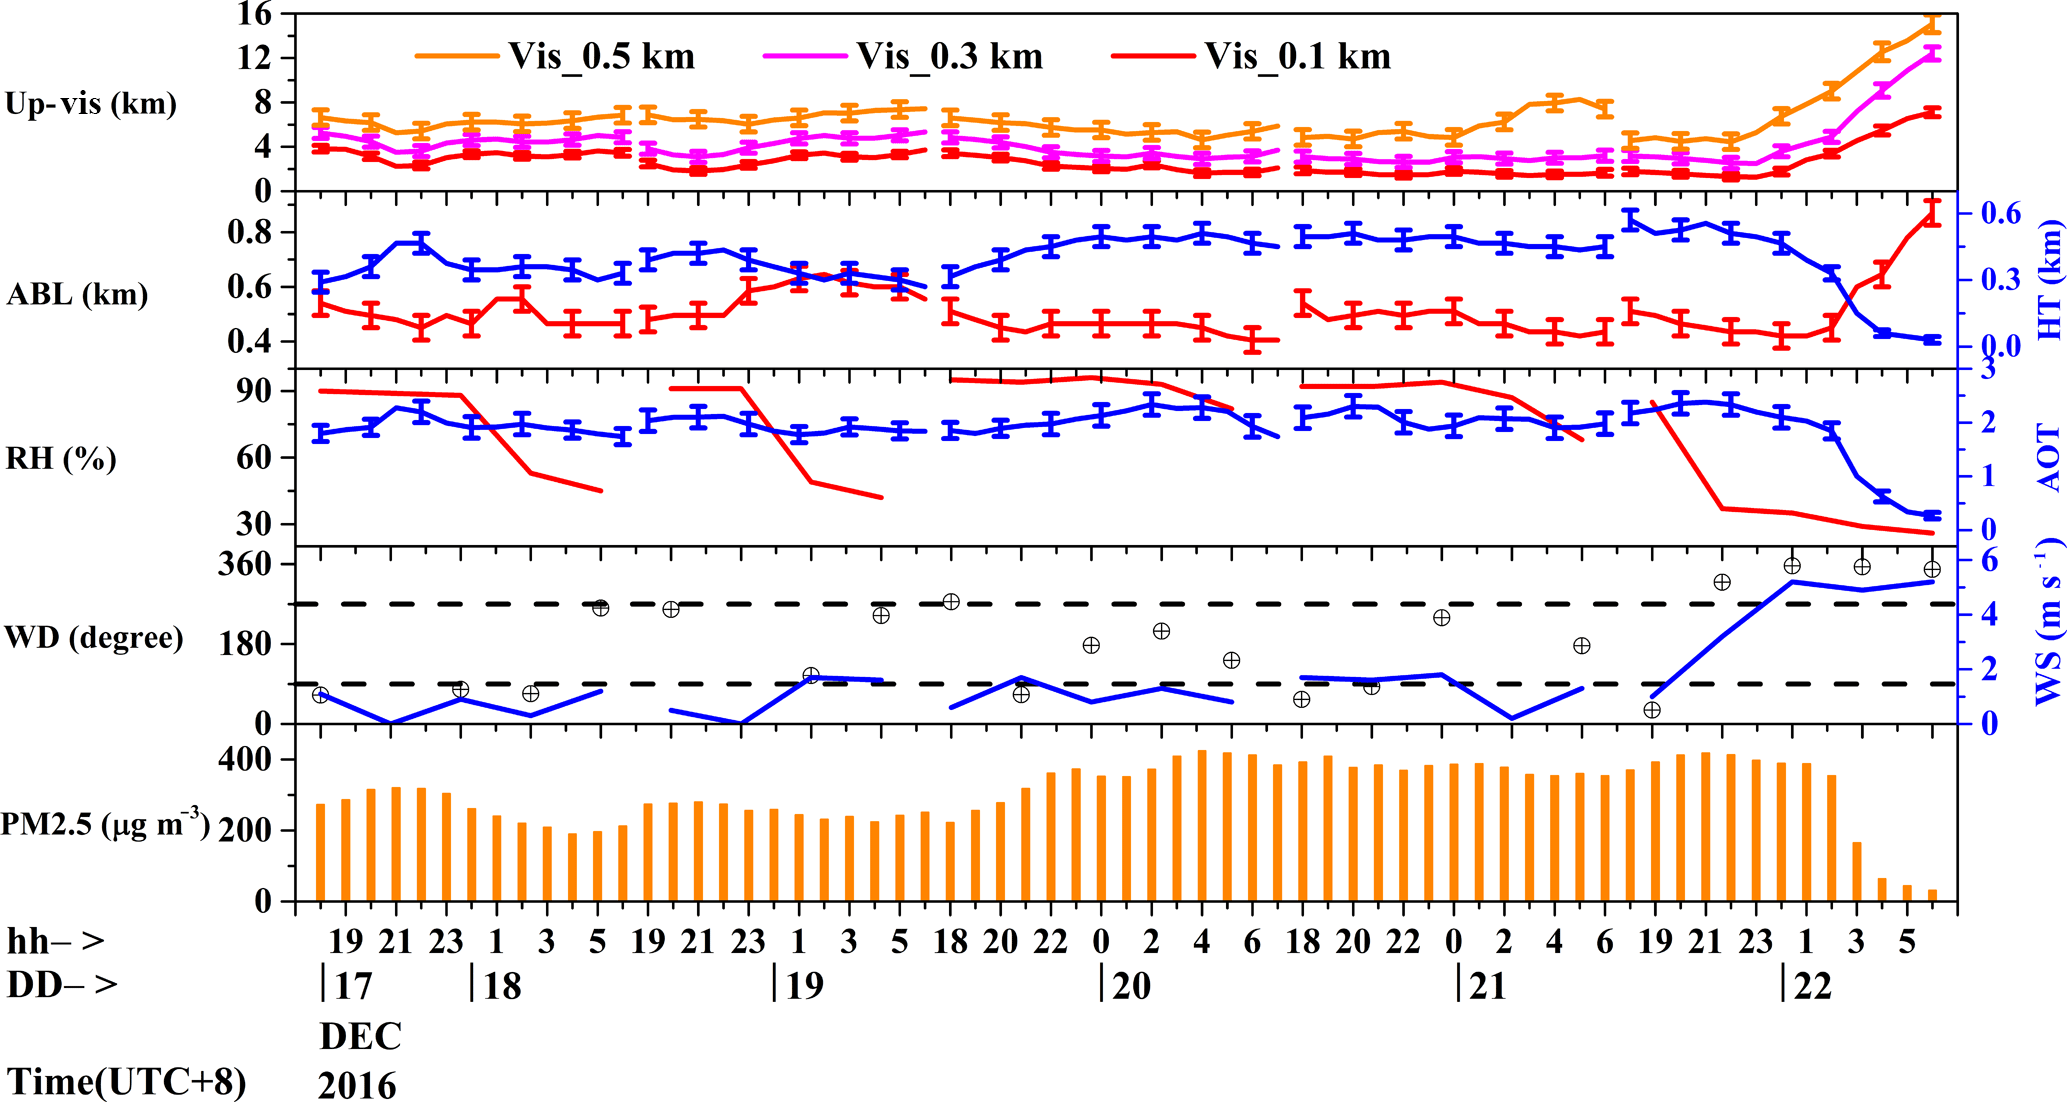
Figure 4Hourly variation of multi-platform data between 17 December 2016 and 22 December 2016 in the northwest of downtown Beijing.
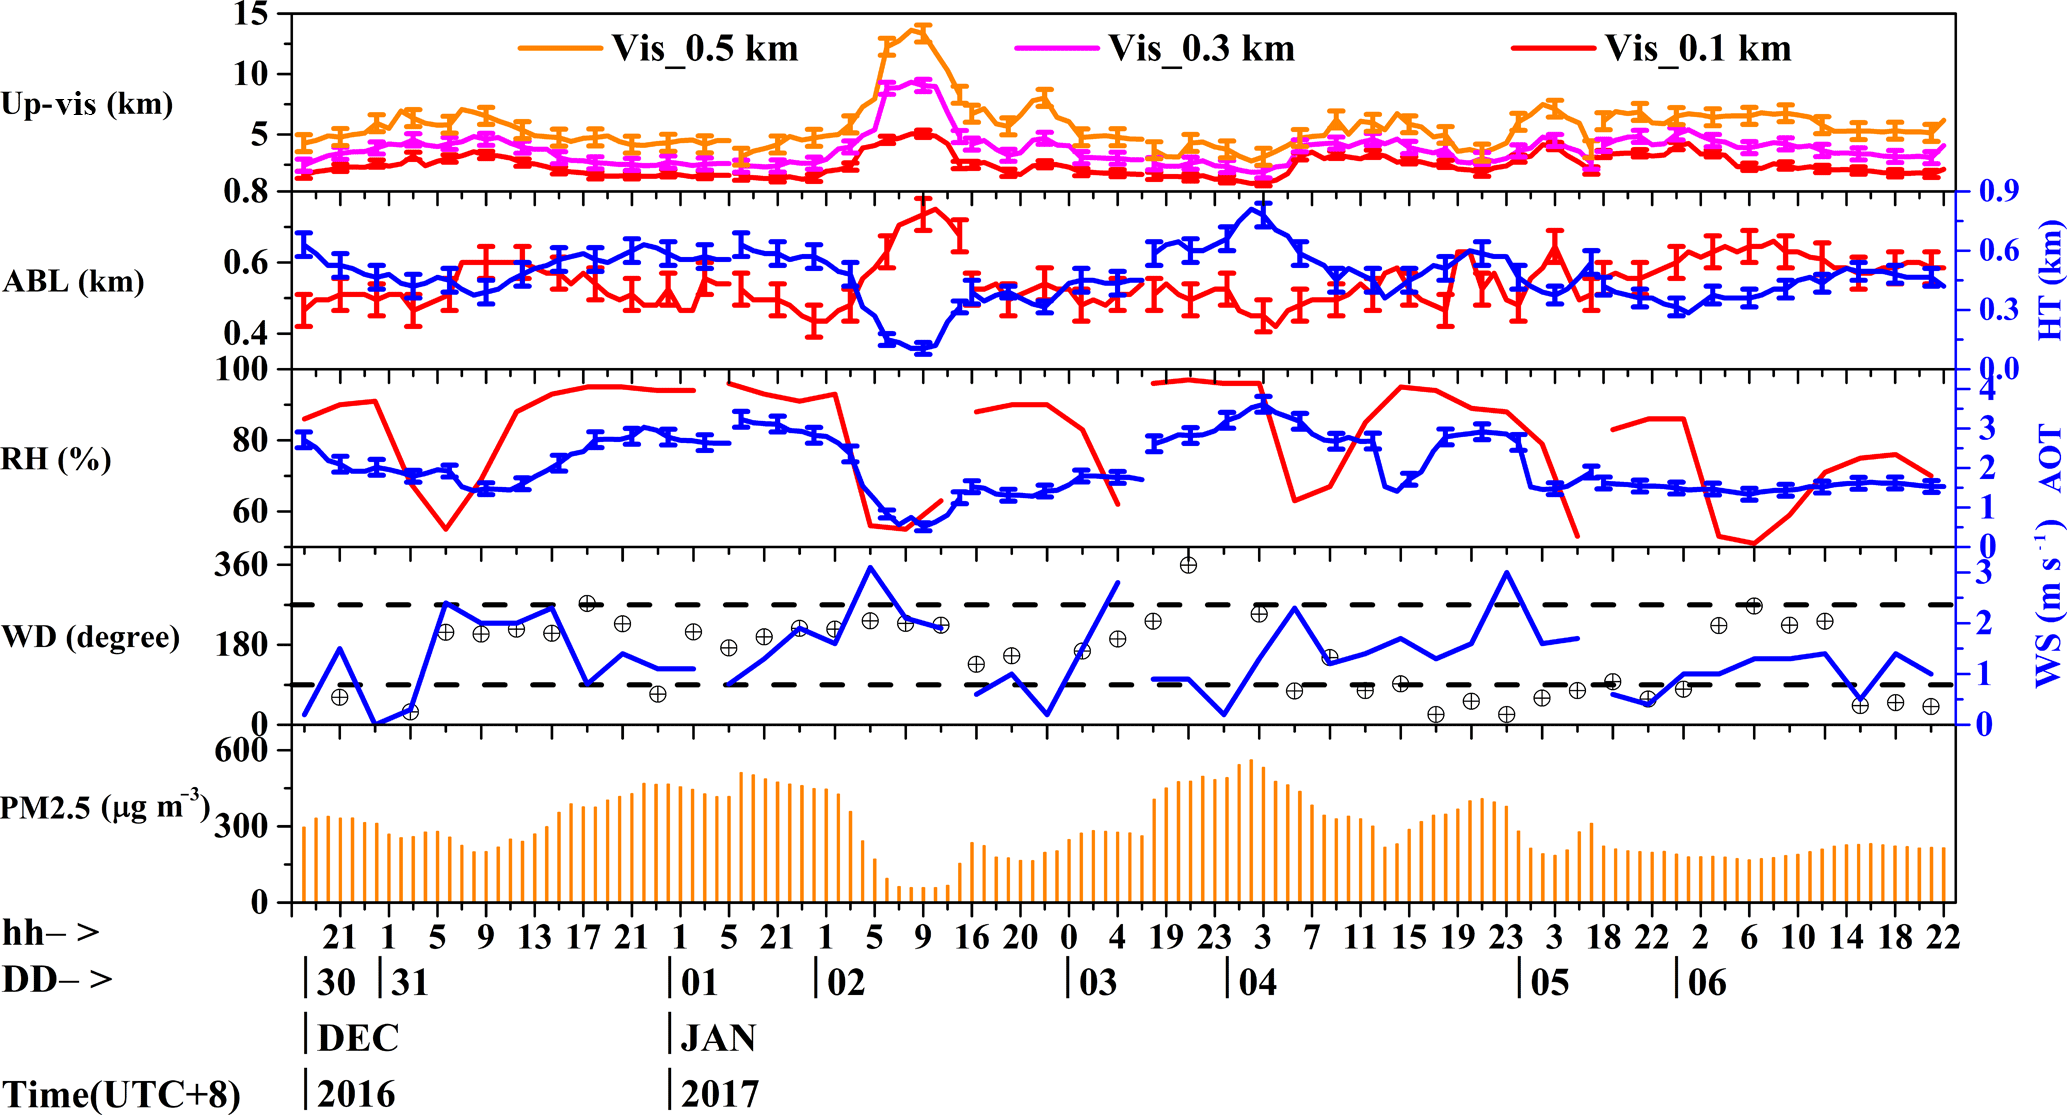
Figure 5Hourly variation of multi-platform data between 30 December 2016 and 6 January 2017 in the northwest of downtown Beijing.
Figure 3 shows the space–time diagram of AEC by analyzing the detected data from ground-based lidar during two successive haze episodes in the northwest of downtown Beijing. Figure 3a shows the height of the haze layer (denoted as a high extinction area) increased to the maximum value at 17:00 on 20 December 2016; afterwards, the haze almost dissipates at 03:00 on 22 December 2016. A thicker haze layer of about 0.6 km could be generally observed as shown in Fig. 3b. Moreover, the variation of some haze parameters would be further obtained by analyzing the two successive haze episodes, which is detailed in the sections below. Section 3.1 denotes the hourly changes of multi-platform data, Sect. 3.2 the daily variation of multi-platform data, and Sect. 3.3 the relationship between multiple parameters.
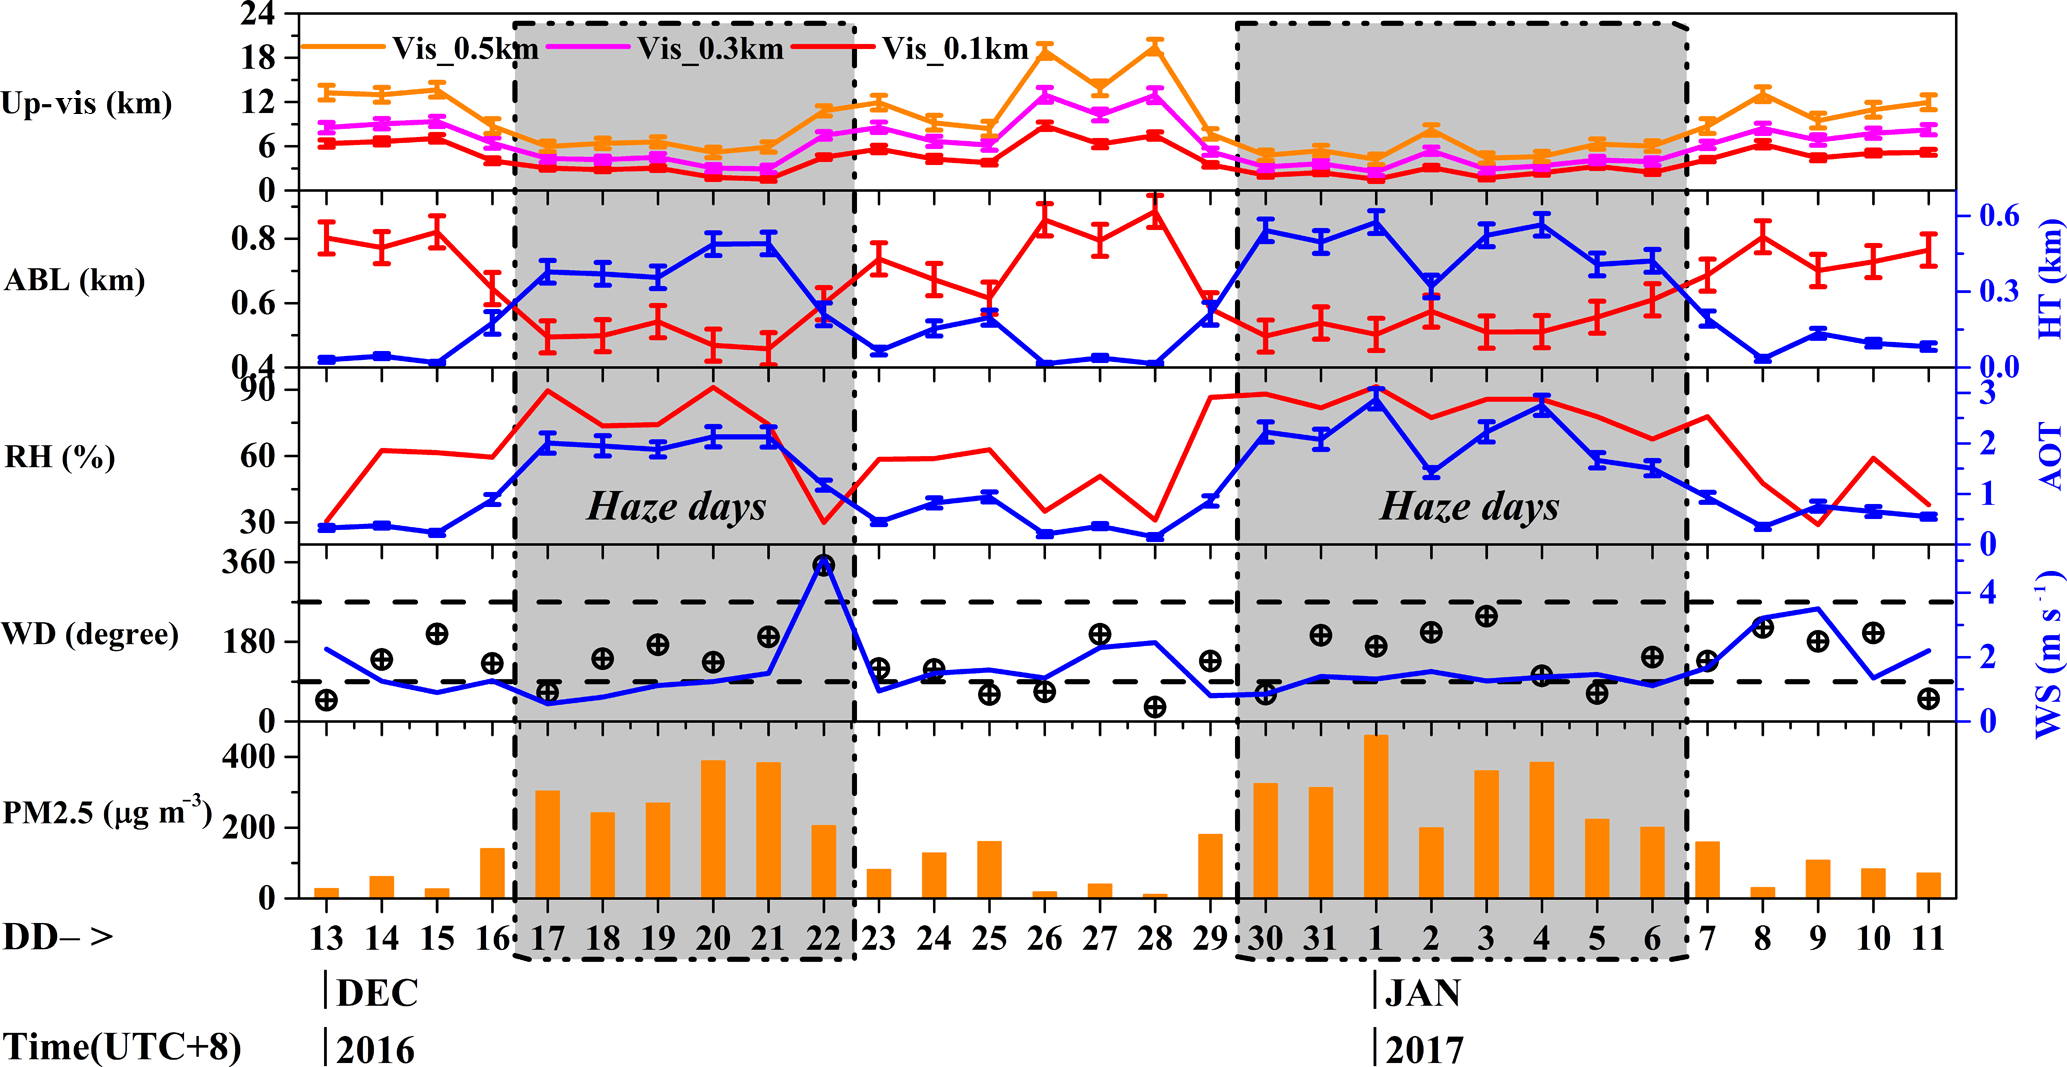
Figure 6Daily variation of multi-platform data during successive haze episodes in the northwest of downtown Beijing.
3.1 Hourly variation of multi-platform data
Figure 4 plots the hourly variation of haze parameters and meteorological elements during the first haze episode shown in Fig. 3a. The meteorological elements include PM2.5 mass concentration supplied by BJMEMC, relative humidity (RH), temperature, wind direction (WD), and wind speed (WS) supplied by China Meteorological Administration (CMA). It is shown that the maximum Up-Vis (about 7.1, 12.4, and 15 km at the altitudes of 0.1, 0.3, and 0.5 km, respectively) and the maximum ABL height (about 0.9 km) were obtained at 06:00 on 22 December 2016, where the variation trend is in contrast to the PM2.5 mass concentration. However, the peak and valley values of HT and AOT, respectively, occurred at 21:00 on 21 December 2016 and at 06:00 on 22 December 2016, following the same trend as the PM2.5 mass concentration. Influenced by the effects of RH, the high RH enhanced the photochemical transformation of secondary aerosols that leads to a higher concentration of fine-mode particles, which exacerbates the atmospheric elements, for example, impairment of Up-Vis, turbulence in ABL, and increase in HT and AOT (Hennigan et al., 2008). According to the topographic feature of Beijing, a strong north wind would accelerate the diffusion of pollutants which gradually make the haze pollution better after 22 December 2016. The error bars indicate data uncertainty, which probably originated from signals fluctuation by atmospheric variability and the inaccurate calibration parameters of the inversion method.
Similar results can be found in the other haze episodes shown in Fig. 5. The Up-Vis and ABL have a negative correlation with the tendency of PM2.5 mass concentration. The Up-Vis reached peak values of about 5, 9.3, and 13.6 km at the altitudes of 0.1, 0.3, and 0.5 km, respectively, in the daytime on 2 January 2017, where the Up-Vis corresponded to the PM2.5 mass concentration of 58 µg m−3 and a smaller RH of 55 %. On the contrary, the maximum HT and AOT of about 0.8 km and about 3.6 were obtained at 02:00 on 4 January 2017, which corresponded to the PM2.5 mass concentration of 561 µg m−3 and a larger RH of 97 %. In addition, the continuous moderate pollution after 5 January 2017 could be attributed to the strong north wind with a maximum wind speed of 3 m s−1 in the nighttime of 4 January 2017 and the weak south wind with a mean wind speed of about 1.3 m s−1 on 6 January 2017 (Han et al., 2016; Zhao et al., 2013). A higher PM2.5 mass concentration led to the increase in AOT, which was accompanied by the decrease in Up-Vis, as derived by Dong et al. (2017) from a combination of the Moderate-Resolution Imaging Spectroradiometer (MODIS) and the Multi-angle Imaging SpectroRadiometer (MISR) across Guanzhong Plain. Additionally, the error bars indicate data uncertainty with the same origination as Fig. 4.
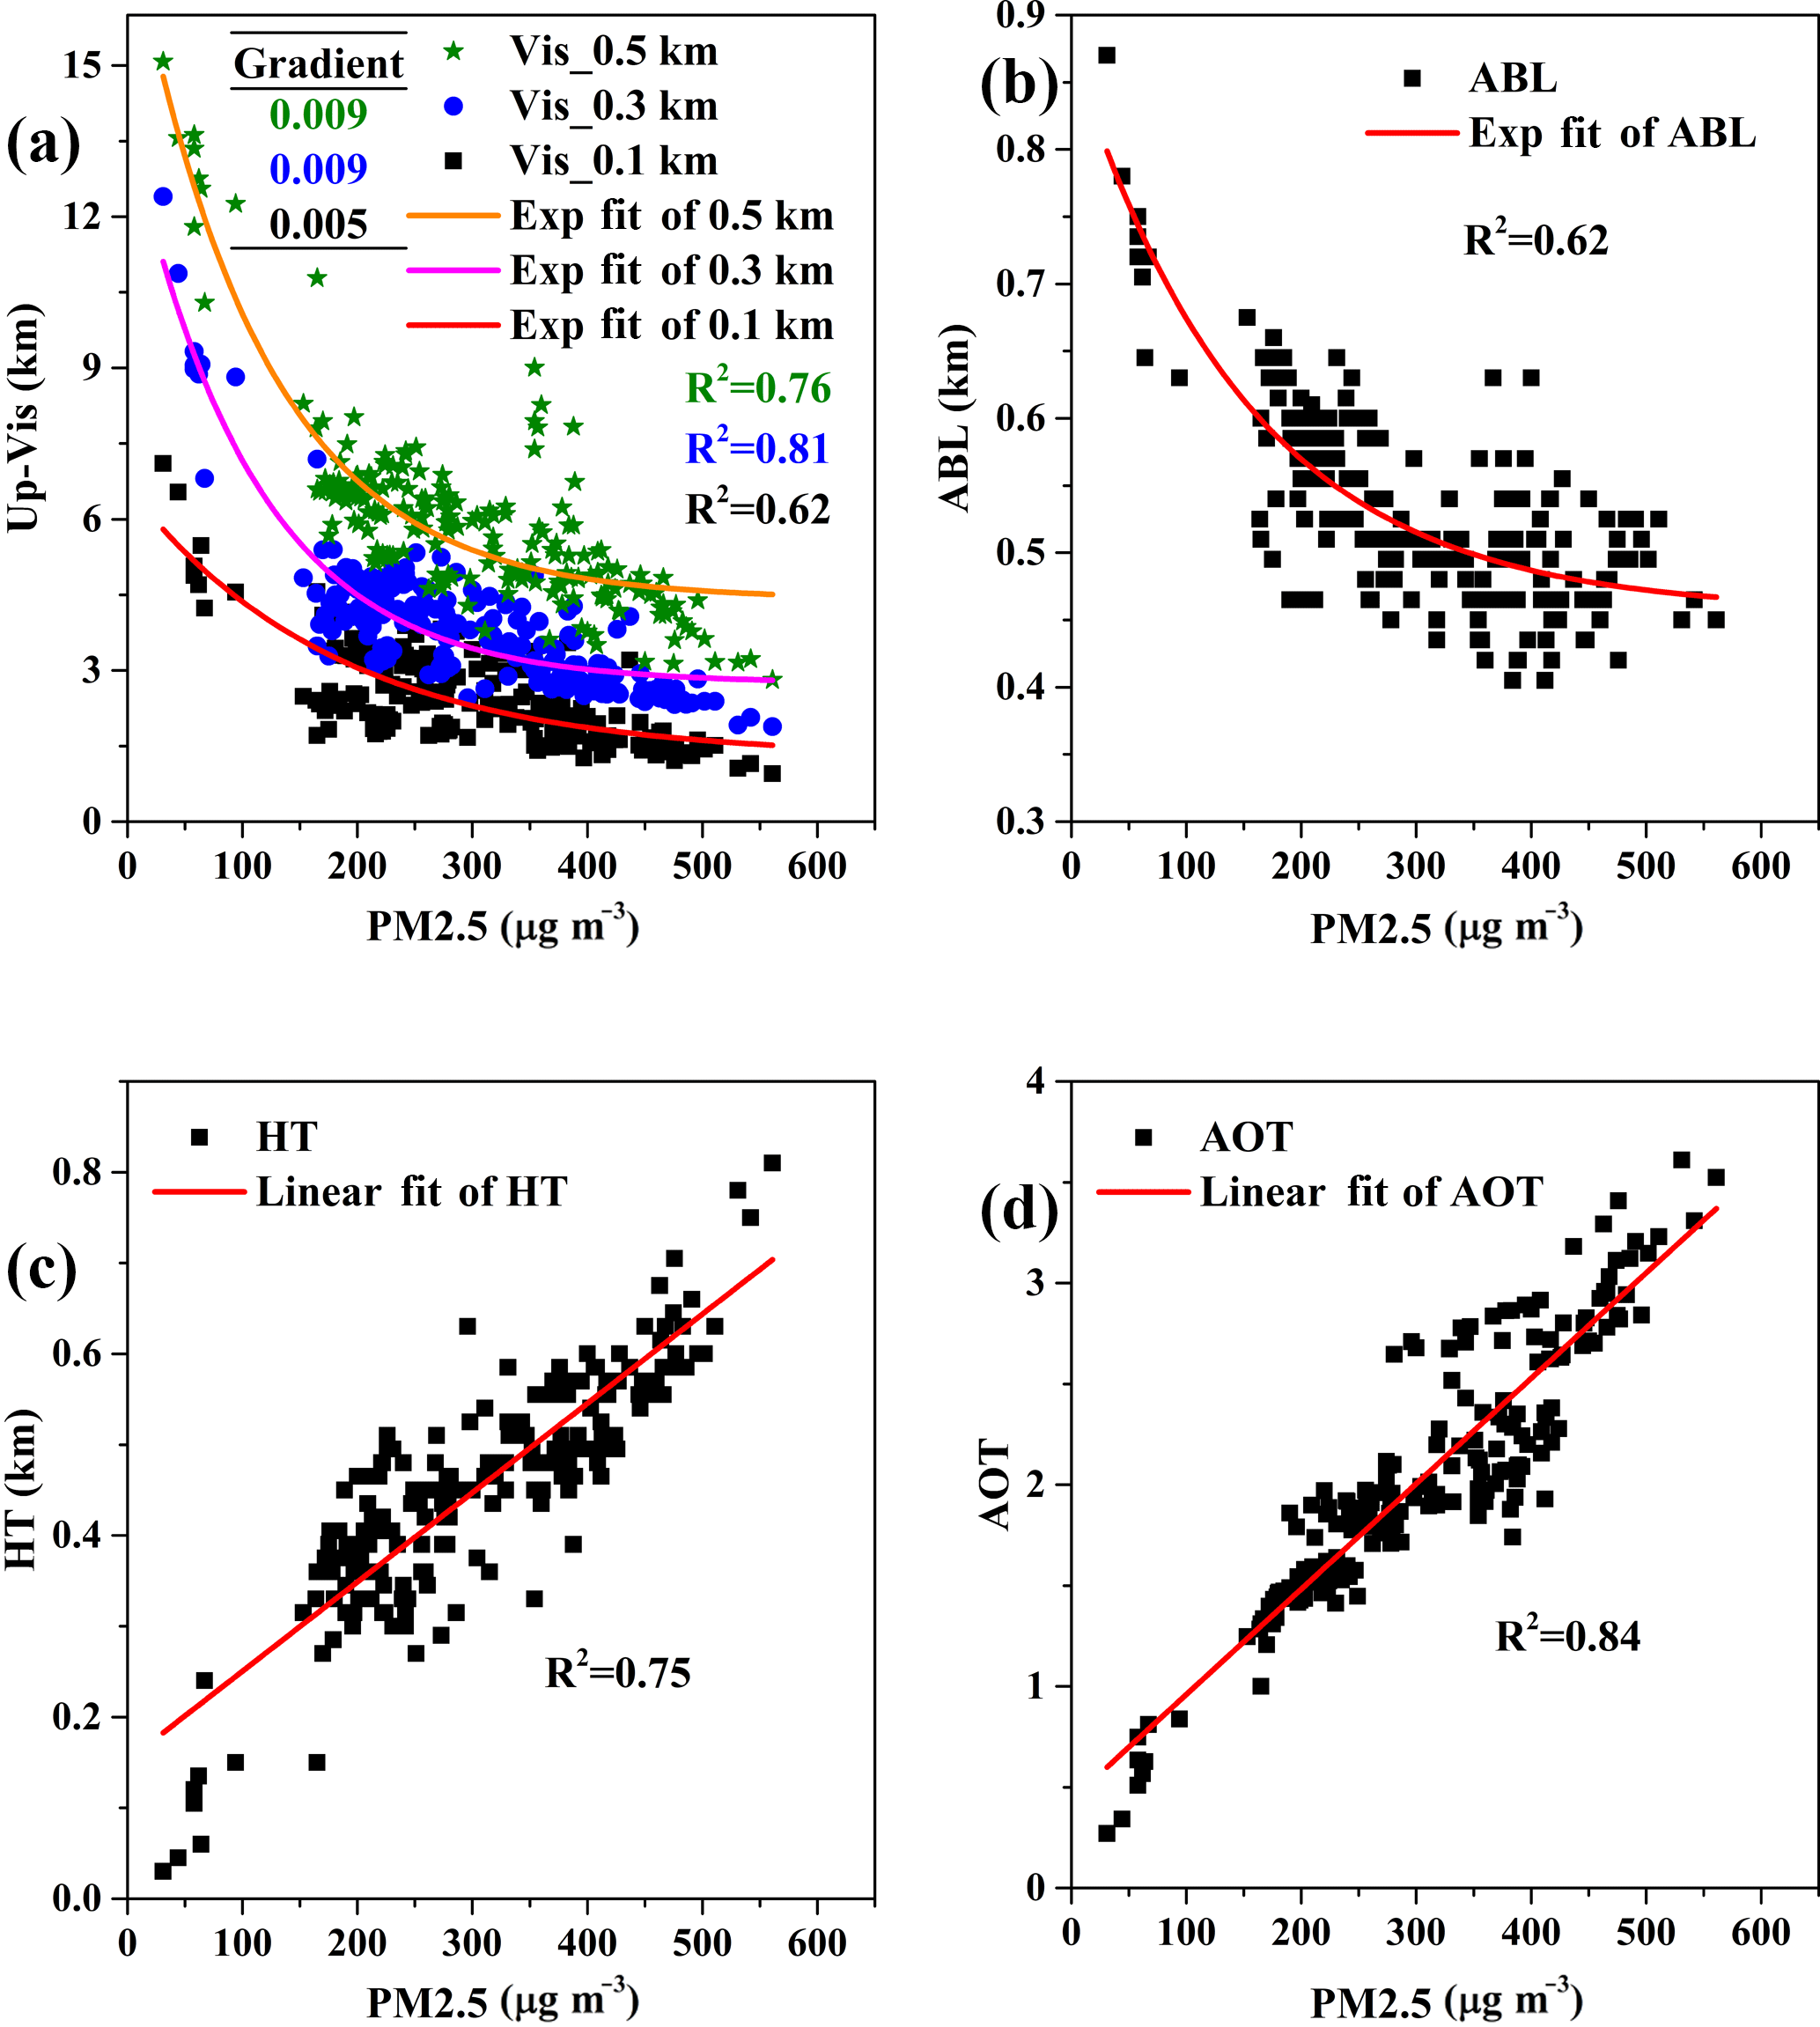
Figure 7Scatter plot of PM2.5 mass concentration and haze parameters of Up-Vis, ABL, HT, and AOT in the northwest of downtown Beijing. The inserted table in (a) denotes the statistical gradient of Up-Vis at different altitudes.
3.2 Daily variation of multi-platform data
To compare and analyze the difference of haze parameters on haze days and non-haze days, Fig. 6 presents the daily variation of Up-Vis, ABL, HT, and AOT with the meteorological elements. The haze days are shown in the areas highlighted in grey in Fig. 6. The following phenomena are concluded from Fig. 6: (1) the minimum Up-Vis values were about 1.5, 2.5, and 4.2 km at the altitudes of 0.1, 0.3, and 0.5 km, respectively. The Up-Vis on non-haze days was about 3–5 times higher than that on haze days. (2) The height of ABL was about 0.5 km on haze days and ranged from 0.6 to 0.9 km on non-haze days. (3) The trends that contradicted to the Up-Vis and ABL could be found in the results of HT and AOT. By combining meteorological elements, a lower Up-Vis and higher HT can be measured when PM2.5 and RH values were higher and the wind blew from the south. When the prevailing wind came from the north and the RH value decreased, the diffusion of pollutants was accelerated, which improved the air quality and enhanced the Up-Vis. A high RH may favor the local contribution of humidity-related physicochemical processing in haze pollution, so the Up-Vis decreased on haze days, which is similar to the research from Tang et al. (2015). In addition, the error bars in Fig. 6 have the same meaning and origin as that in Fig. 4.
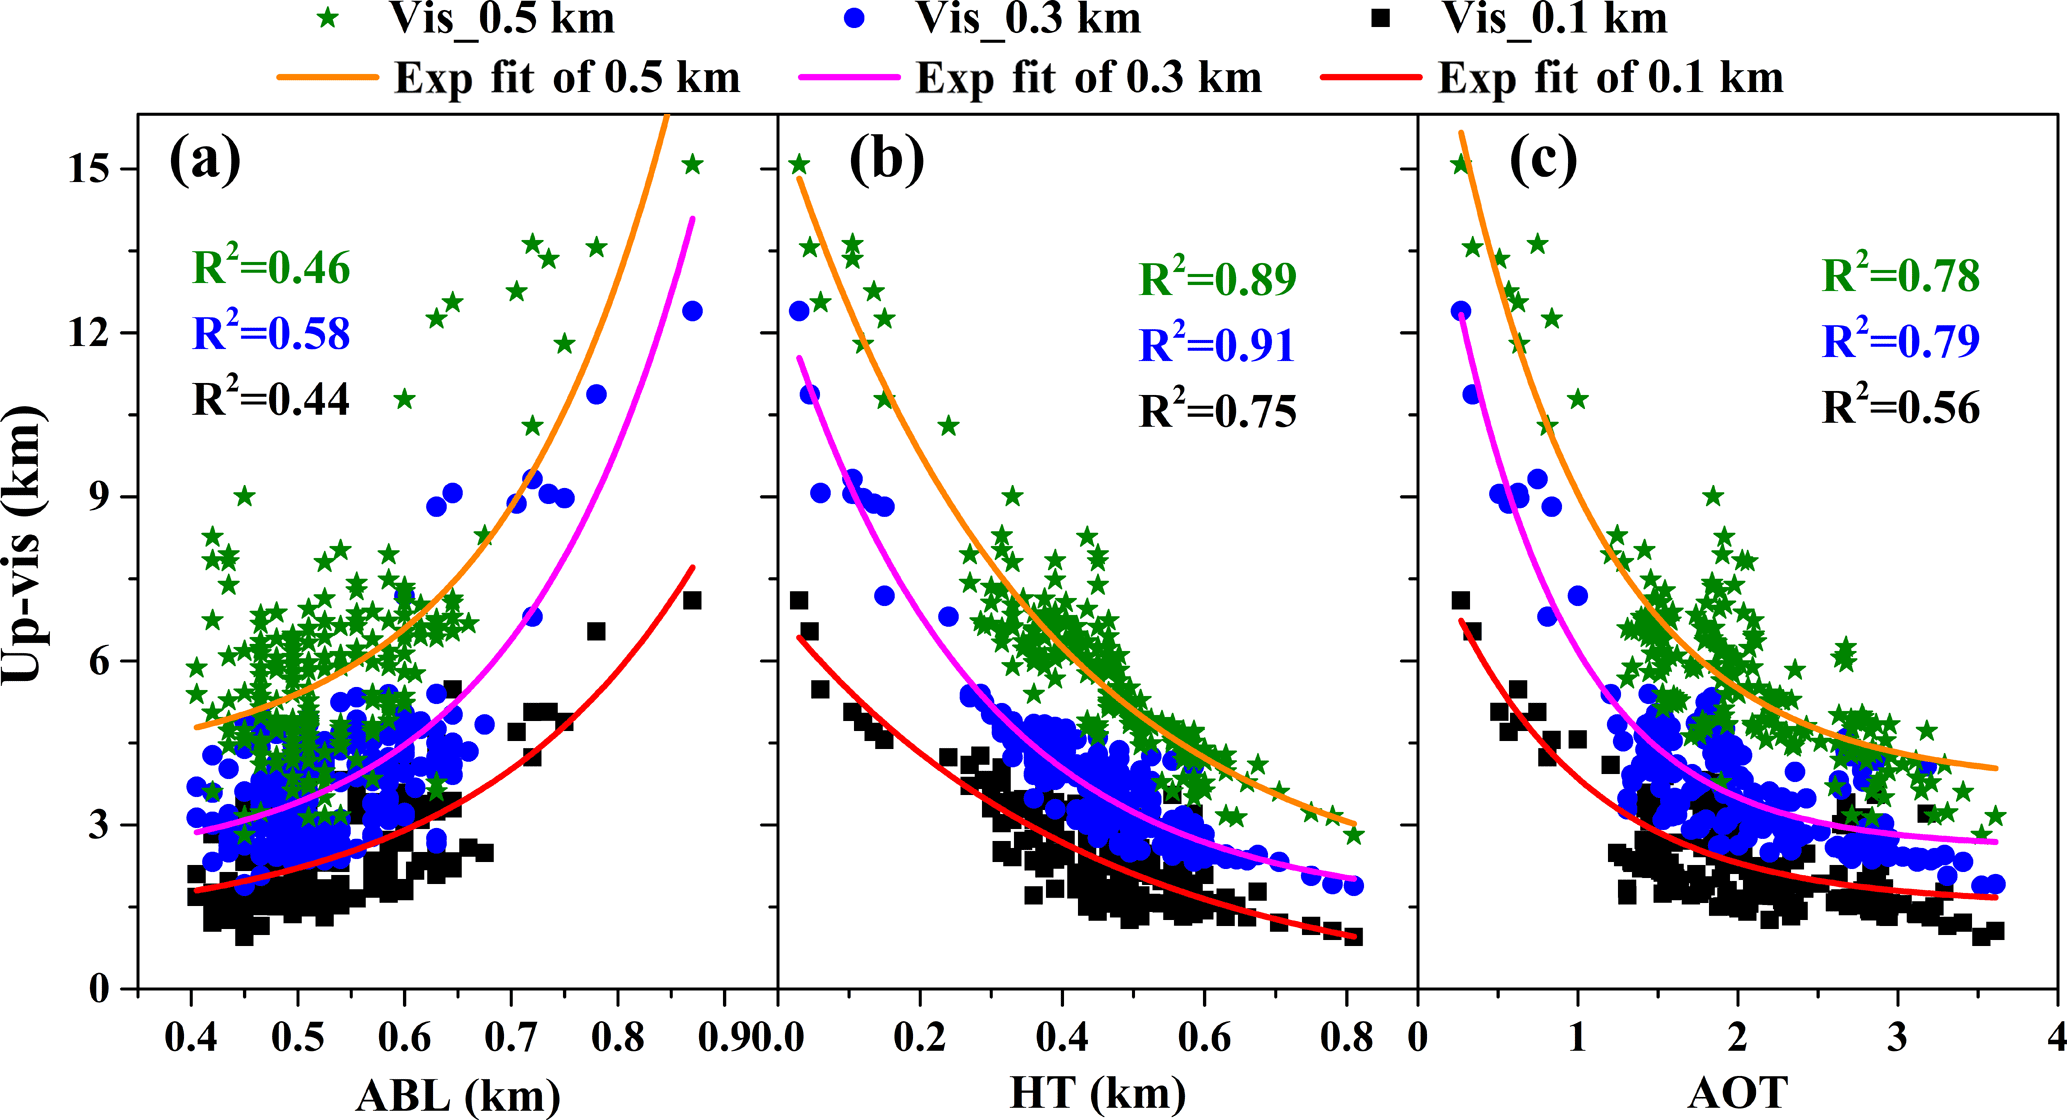
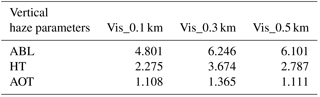
Figure 9Scatter plot of Up-Vis and vertical haze parameters of ABL, HT, and AOT in the northwest of downtown Beijing.
Table 1Statistical gradient of Up-Vis with different vertical haze parameters at different altitudes for Fig. 9.
3.3 Correlation between Up-Vis, ABL, HT, AOT, and PM2.5 mass concentration
As shown in Fig. 7, the correlation between PM2.5 mass concentration and haze parameters was established based on the 201 statistical samples in Figs. 4 and 5, which describe the impact of near-ground particle concentration on haze parameters in the northwest of downtown Beijing. Figure 7a and b plot the exponential reduction of the ABL and Up-Vis values when PM2.5 mass concentration increased, with R2 values at about 0.73 (mean value of 0.76, 0.81, and 0.62) and 0.62, respectively. Moreover, owing to the location of detecting sites (located in the center of Beijing) and the different influence of human activities on Up-Vis at individual altitudes, the correlations between surface PM2.5 and Up-Vis at altitudes of 0.3 and 0.5 km (0.81 and 0.76, respectively) are much stronger than the correlation between surface PM2.5 and Up-Vis at an altitude of 0.1 km (0.62). In Fig. 7a, with the decreasing of PM2.5 mass concentration, the Up-Vis at the altitude of 0.1 km gradually increases, but the Up-Vis at the altitudes of 0.3 and 0.5 km increases much faster as shown in the inserted table. The exponential correlation between ABL height and PM2.5 mass concentration is similar to the studies of Zhao et al. (2017) as shown in Fig. 7b. From Fig. 7c and d, it can be observed that the HT and AOT values increased linearly with the growing PM2.5 mass concentration, with the R2 values at 0.75 and 0.84, respectively. With the accumulation of pollutants, the aerosol column concentration and the PM2.5 mass concentration would increase, which aggravates the light scattering and absorption.
Table 2Values of haze parameters and meteorological elements corresponding to the haze levels.
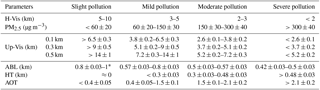
* Range of ABL is 0.3–1 km (Garratt, 1994).
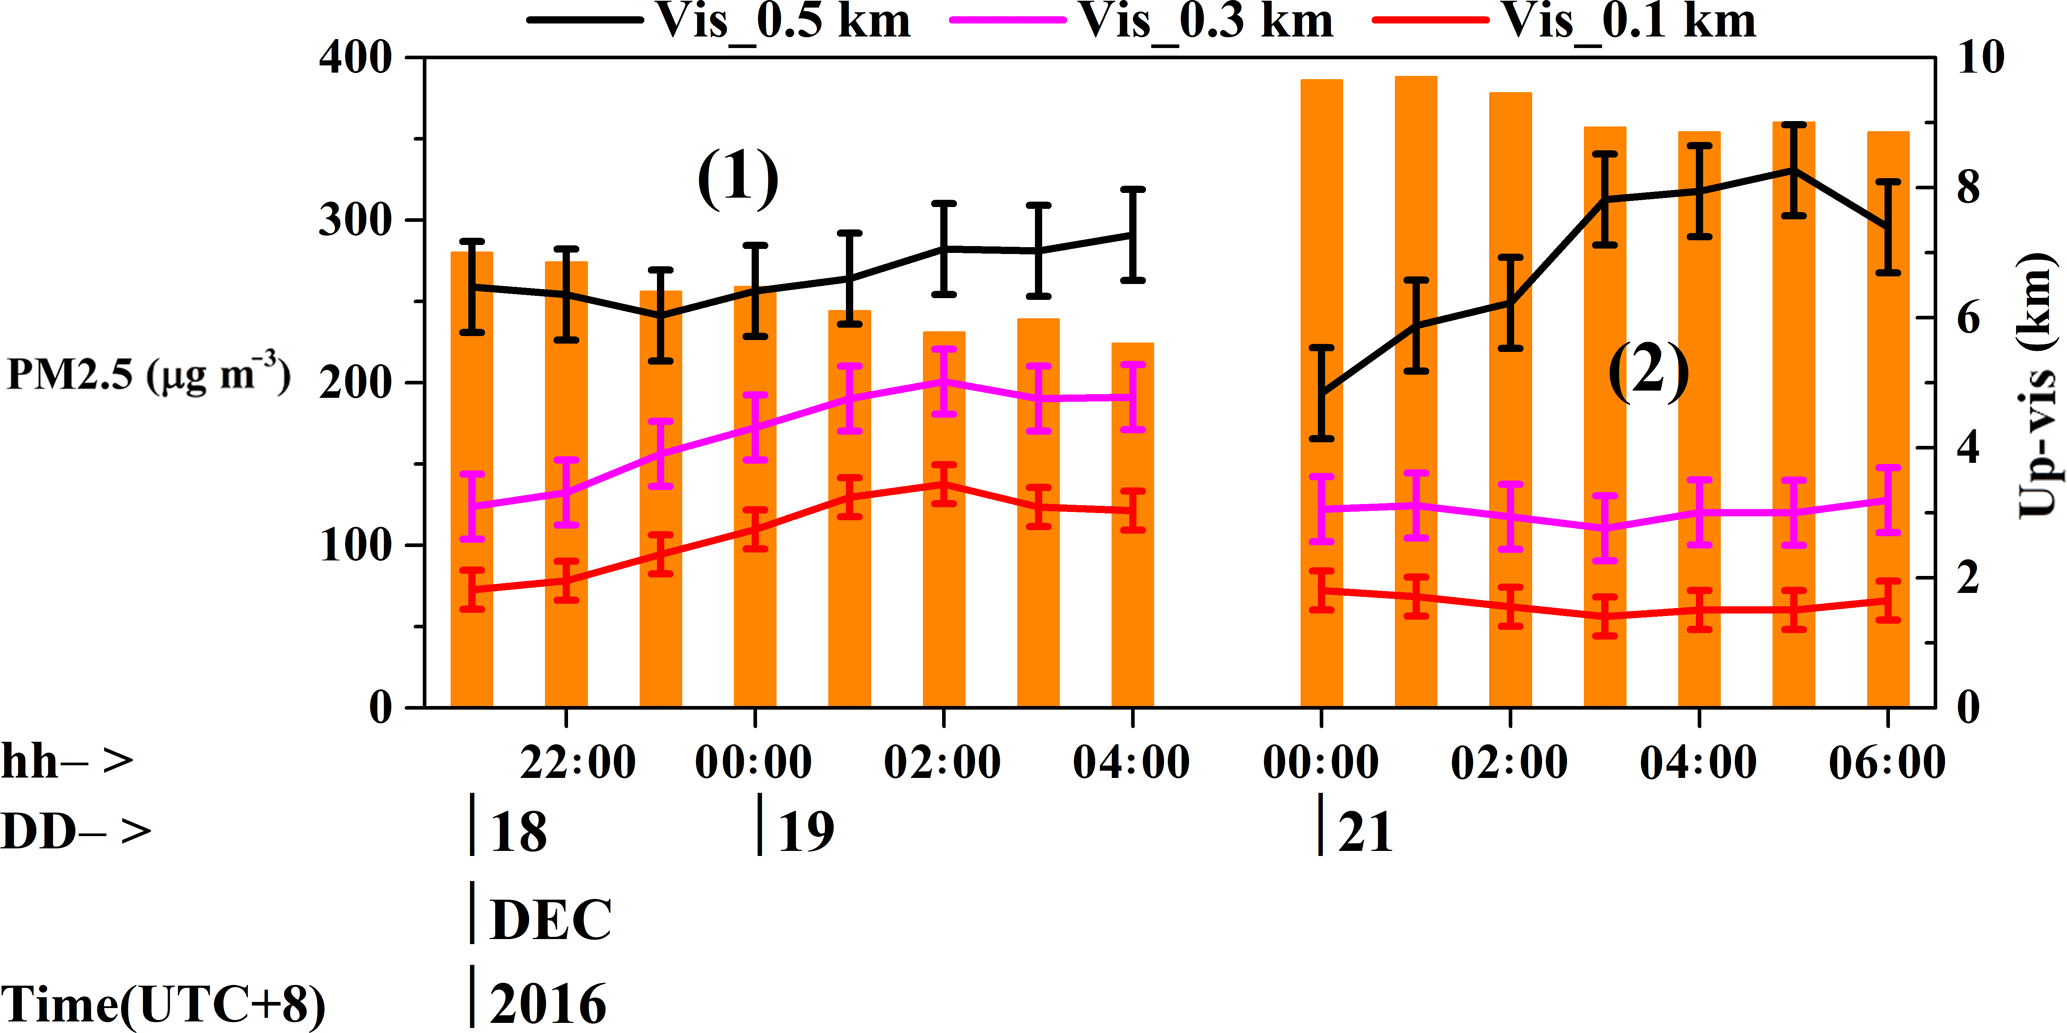
As shown in Fig. 8, the vertical transport of particles is acquired by comparing hourly variations of PM2.5 mass concentration and Up-Vis at different altitudes in certain periods. In Fig. 8(1), as the PM2.5 mass concentration near the ground decreased, the Up-Vis at the altitude of 0.5 km increased 3 h later than that at the altitudes of 0.1 and 0.3 km. This indicates pollutants might ascend and prevent the improvement of Up-Vis at the altitude of 0.5 km. In Fig. 8(2), the Up-Vis at the altitude of 0.5 km increased rapidly, while the Up-Vis at the altitudes of 0.1 and 0.3 km increased slowly 4 h later. This demonstrates that the delayed diffusion might result from the descent of pollutants. And the descent of pollutants caused the slow reduction of near-ground PM2.5 mass concentration during this period. Therefore, the delayed variations of Up-Vis between high altitude and low altitude indirectly reveal the influence of vertical transport of pollutants on variation of haze parameters.
According to the 201 statistical samples mentioned above, the correlations between vertical haze parameters (ABL, HT and AOT) and horizontal haze parameters (Up-Vis) are plotted in Fig. 9 to analyze the two-dimensional characteristic of haze phenomenon. Figure 9a shows a positive exponential correlation between ABL and Up-Vis, with R2 values of 0.44, 0.58, and 0.46 at the altitudes of 0.1, 0.3, and 0.5 km, respectively. Because the ABL represents the atmospheric diffusion capacity in vertical direction indicated by Tang et al. (2015), the increasing ABL would be accompanied with the increase in Up-Vis. However, when the HT or AOT values increase, the Up-Vis would decrease exponentially as shown in Fig. 9b and c. Compared with the studies of Dong et al. (2017), the similar anticorrelation can be inferred between visibility and AOT. And the exponential changes in Up-Vis and AOT or HT could be attributed to the rapid accumulation of aerosol particles near the surface. Table 1 shows the statistical gradient of Up-Vis at different altitudes changing with the vertical haze parameters. It is found that the Up-Vis at an altitude of 0.3 km changed faster than that at altitudes of 0.1 and 0.5 km. Therefore, through the analysis of the correlation between vertical haze parameters (ABL, HT and AOT) and horizontal haze parameter (Up-Vis), the haze characteristics could be well investigated in two dimensions.
According to the observation and forecasting levels of haze (QX/T 113-2010) supplied by CMA, there are four forecasting levels of haze: slight pollution, mild pollution, moderate pollution, and severe pollution (CMA, 2010). Table 2 provides the standard range of horizontal visibility on the surface (H-Vis) for different haze levels. When slight pollution occurred with the H-Vis of 5–10 km, the corresponding PM2.5 mass concentration is less than 60±20 µg m−3, the Up-Vis at the altitudes of 0.1, 0.3, and 0.5 km is larger than 6.5±0.3, 9±0.5, and 14±1 km, respectively, and the ABL is higher than 0.8±0.03 km. When mild pollution occurred with the H-Vis of 3–5 km, the minimum Up-Vis decreased to 3.8±0.2, 5.1±0.2, and 7.2±0.3 km at the altitudes of 0.1, 0.3, and 0.5 km, respectively. While the ABL would also decline, with the minimum value of 0.57±0.03 km. However, the AOT would increase from 0.4±0.05 to 1.5±0.1. When the H-Vis value is between 2 and 3 km, the haze level is classified as moderate pollution. The PM2.5 mass concentration changes from 150±30 to 300±40 µg m−3. The Up-Vis would decrease from the minimum value of mild pollution to 2.6±0.1, 3.7±0.2, and 5.2±0.2 km at the altitudes of 0.1, 0.3, and 0.5 km, respectively. Simultaneously, the HT of between 0.3±0.03 and 0.48±0.03 km could be obtained. Once the H-Vis is lower than 2 km, severe pollution would occur, with the corresponding PM2.5 mass concentration higher than 300±40 µg m−3. The Up-Vis would decrease further based on the minimum value of moderate pollution, and the turbulent ABL height could range from 0.42±0.03 to 0.5±0.03 km. Moreover, the HT and AOT would further deteriorated to larger than 0.48±0.03 km and 2.1±0.2, respectively, as shown in Table 2.
In this study, the traits of upper-air visibility and the two-dimensional haze characteristic were investigated during the haze episodes between 17 December 2016 and 6 January 2017 in the northwest of downtown Beijing by using a multi-platform analysis. The close connection with AERONET's statistical results demonstrates that the retrieved aerosol extinction coefficient with the lidar data is reliable and believable. Compared with the changes of PM2.5 mass concentration, an opposite tendency appears for Up-Vis by hourly and daily haze analysis. The Up-Vis on non-haze days was about 3–5 times higher than that on haze days with the ground-based Raman–Mie lidar data between 13 December 2016 and 11 January 2017. Higher relative humidity would aggravate the haze characteristics owing to the enhanced photochemical transformation of secondary aerosols, but north wind would accelerate the diffusion of pollutants due to the topographic feature of Beijing. Besides, a strong correlation between near-surface PM2.5 mass concentration and haze parameters shows a direct and significant influence of near-ground fine-particle pollutants on haze parameters. The delayed variations of Up-Vis between high altitude and low altitude reveal the vertical transport of pollutants. And the correlation between vertical haze parameters (ABL, AOT and HT) and horizontal haze parameter (Up-Vis) is helpful to investigate the two-dimensional haze characteristics.
Reference AOT data are downloaded from https://aeronet.gsfc.nasa.gov/ (AERONET Version 2, last access: 20 July 2018). PM2.5 mass concentration data supplied by the Beijing Municipal Environmental Monitoring Center (BJMEMC) can be downloaded from http://beijingair.sinaapp.com/ (last access: 20 July 2018). The ground meteorological data are from the website http://data.cma.cn/ (CMA, 2017). The ground-based Raman–Mie data are available from https://doi.org/10.5281/zenodo.1315375 (Ji and Chen, 2018).
SC and YZ contributed to the conception and analysis of the data. YZ and PG carried out the device fabrication and experiments. HJ and HC contributed to the data inversion and analysis. PZ performed the radiosonde measurements. HJ and SC wrote the manuscript.
The authors declare that they have no conflict of interest.
This article is part of the special issue “Regional transport and transformation of air pollution in eastern China”. It is not associated with a conference.
This research is supported by the National Natural
Science Foundation of China (no. 61505009).
Edited by: Zhanqing Li
Reviewed by: Jianjun Liu and two anonymous referees
Alexandrov, M. D., Geogdzhayev, I. V., Tsigaridis, K., Marshak, A., Levy, R., and Cairns, B.: New Statistical Model for Variability of Aerosol Optical Thickness: Theory and Application to MODIS Data over Ocean, J. Atmos. Sci., 73, 821–837, 2016.
Amiridis, V., Melas, D., Balis, D. S., Papayannis, A., Founda, D., Katragkou, E., Giannakaki, E., Mamouri, R. E., Gerasopoulos, E., and Zerefos, C.: Aerosol Lidar observations and model calculations of the Planetary Boundary Layer evolution over Greece, during the March 2006 Total Solar Eclipse, Atmos. Chem. Phys., 7, 6181–6189, https://doi.org/10.5194/acp-7-6181-2007, 2007.
Bäumer, D., Vogel, B., Versick, S., Rinke, R., Möhler, O., and Schnaiter, M.: Relationship of visibility, aerosol optical thickness and aerosol size distribution in an ageing air mass over South-West Germany, Atmos. Environ., 42, 989–998, 2008.
Chao, B. L.: UPPER AIR VISIBILITY AND VERTICAL VISIBILITY, Acta Scientiarum Naturalium Universitatis Pekinensis, 1955 (in Chinese).
Chen, H. and Wang, H.: Haze Days in North China and the associated atmospheric circulations based on daily visibility data from 1960 to 2012, J. Geophys. Res., 120, 5895–5909, 2015.
Chen, L., Zhang, M., and Wang, Y.: Model analysis of urbanization impacts on boundary layer meteorology under hot weather conditions: a case study of Nanjing, China, Theor. Appl. Climatol., 125, 713–728, 2016.
CMA (China Meteorological Administration): National meteorological standard of the People's Republic of China: Observation and forecast levels of haze (QX/T113-2010), China Meteorological Press, Beijing, China, 2010 (in Chinese).
Dong, Z., Li, Z., Yu, X., Cribb, M., Li, X., and Dai, J.: Opposite long-term trends in aerosols between low and high altitudes: a testimony to the aerosol-PBL feedback, Atmos. Chem. Phys., 17, 7997–8009, https://doi.org/10.5194/acp-17-7997-2017, 2017.
Flamant, C., Pelon, J., Flamant, P., and Durand, P.: Lidar Determination of the Entrainment Zone Thickness at the Top of the Unstable Marine, Bound. Lay. Meteorol., 83, 247–284, 1997.
Gao, Y., Zhang, M., Liu, Z., Wang, L., Wang, P., Xia, X., Tao, M., and Zhu, L.: Modeling the feedback between aerosol and meteorological variables in the atmospheric boundary layer during a severe fog-haze event over the North China Plain, Atmos. Chem. Phys., 15, 4279–4295, https://doi.org/10.5194/acp-15-4279-2015, 2015.
Garratt, J. R.: The atmospheric boundary layer, Earth Sci. Rev., 37, 89–134, 1994.
Guan, Q., Sun, X., Yang, J., Pan, B., Zhao, S., and Wang, L.: Dust Storms in Northern China: Long-Term Spatiotemporal Characteristics and Climate Controls, J. Climate, 30, 6683–6700, 2017.
Han, R., Wang, S., Shen, W., Wang, J., Wu, K., Ren, Z., and Feng, M.: Spatial and temporal variation of haze in China from 1961 to 2012, J. Environ. Sci., 46, 134–146, 2016.
Hennigan, C. J., Bergin, M. H., Dibb, J. E., and Weber, R. J.: Enhanced secondary organic aerosol formation due to water uptake by fine particles, Geophys. Res. Lett., 35, L18801 https://doi.org/10.1029/2008GL035046, 2008.
Jarraud, M.: Guide to meteorological instruments and methods of observation (WMO-No. 8), World Meteorological Organisation: Geneva, Switzerland, 2008.
Ji, H. and Chen, S.: Mie data for haze analysis [Data set], Zenodo, https://doi.org/10.5281/zenodo.1315375, 2018.
Ji, H., Chen, S., Zhang, Y., Chen, H., Guo, P., and Chen, H.: Calibration method for the reference parameter in Fernald and Klett inversion combining Raman and Elastic return, J. Quant. Spectrosc. Ra. Transf., 188, 71–78, 2017.
Larson, S. M. and Cass, G. R.: Characteristics of summer midday low-visibility events in the Los Angeles area, Environ. Sci. Technol., 23, 281–289, https://doi.org/10.1021/es00180a003, 1989.
Lee, Z. and Shang, S.: Visibility: How Applicable is the Century-Old Koschmieder Model?, J. Atmos. Sci., 73, 4573–4581, 2016.
Li, Z., Guo, J., Ding, A., Liao, H., Liu, J., Sun, Y., Wang, T., Xue, H., Zhang, H., and Zhu, B.: Aerosol and boundary-layer interactions and impact on air quality, Natl. Sci. Rev., 4, 810–833, https://doi.org/10.1093/nsr/nwx117, 2017.
Li, Z., Xia, X., Cribb, M., Mi, W., Holben, B., Wang, P., Chen, H., Tsay, S. C., Eck, T., and Zhao, F.: Aerosol optical properties and their radiative effects in northern China, J. Geophys. Res. Atmos., 112, D22S01, https://doi.org/10.1029/2006JD007382, 2007.
Liu, X. G., Li, J., Qu, Y., Han, T., Hou, L., Gu, J., Chen, C., Yang, Y., Liu, X., Yang, T., Zhang, Y., Tian, H., and Hu, M.: Formation and evolution mechanism of regional haze: a case study in the megacity Beijing, China, Atmos. Chem. Phys., 13, 4501–4514, https://doi.org/10.5194/acp-13-4501-2013, 2013.
Middleton, W. E. K.: Visibility in Meteorology, Am. Meteorol. Soc., 155, 50–63, 1951.
Mishra, M. and Kulshrestha, U.: Estimation of carbonaceous emission impact on urban soil-dust in Delhi, J. Clim. Change, 2, 119–127, 2016.
Qian, Y., Gong, D., Fan, J., Leung, L. R., Bennartz, R., Chen, D., and Wang, W.: Heavy pollution suppresses light rain in China: Observations and modeling, J. Geophys. Res.-Atmos., 114, D00K02, https://doi.org/10.1029/2008JD011575, 2009.
Sawyer, V. and Li, Z.: Detection, variations and intercomparison of the planetary boundary layer depth from radiosonde, lidar and infrared spectrometer, Atmos. Environ., 79, 518–528, 2013.
Song, Y., Tang, X., Fang, C., Zhang, Y., Hu, M., Zeng, L., Li, C., Mao, J., and Michael, B.: Relationship between the visibility degradation and particle pollution in Beijing, Acta Sci. Circum., 23, 468–471, 2003 (in Chinese).
Stull, R. B.: An introduction to boundary layer meteorology, Springer Science & Business Media, New York, 2012.
Sun, T., Che, H., Wu, J., Wang, H., Wang, Y., and Zhang, X.: The variation in visibility and its relationship with surface wind speed in China from 1960 to 2009, Theor. Appl. Climatol., 131, 335–347, https://doi.org/10.1007/s00704-016-1972-x, 2016.
Tang, G., Zhu, X., Hu, B., Xin, J., Wang, L., Münkel, C., Mao, G., and Wang, Y.: Impact of emission controls on air quality in Beijing during APEC 2014: lidar ceilometer observations, Atmos. Chem. Phys., 15, 12667–12680, https://doi.org/10.5194/acp-15-12667-2015, 2015.
Tao, M., Chen, L., Su, L., and Tao, J.: Satellite observation of regional haze pollution over the North China Plain, J. Geophys. Res.-Atmos., 117, D12203, https://doi.org/10.1029/2012JD017915, 2012.
Tao, M., Chen, L., Xiong, X., Zhang, M., Ma, P., Tao, J., and Wang, Z.: Formation process of the widespread extreme haze pollution over northern China in January 2013: Implications for regional air quality and climate, Atmos. Environ., 98, 417–425, 2014.
Wu, J., Fu, C., Zhang, L., and Tang, J.: Trends of visibility on sunny days in China in the recent 50 years, Atmos. Environ., 55, 339–346, 2012.
Wu, M., Wu, D., Fan, Q., Wang, B. M., Li, H. W., and Fan, S. J.: Observational studies of the meteorological characteristics associated with poor air quality over the Pearl River Delta in China, Atmos. Chem. Phys., 13, 10755–10766, https://doi.org/10.5194/acp-13-10755-2013, 2013.
Xin, J., Zhang, Q., Wang, L., Gong, C., Wang, Y., Liu, Z., and Gao, W.: The empirical relationship between the PM 2.5 concentration and aerosol optical depth over the background of North China from 2009 to 2011, Atmos. Res., 138, 179–188, 2014.
Yang, L.-X., Wang, D.-C., Cheng, S.-H., Wang, Z., Zhou, Y., Zhou, X.-H., and Wang, W.-X.: Influence of meteorological conditions and particulate matter on visual range impairment in Jinan, China, Sci. Total Environ., 383, 164–173, 2007.
Yang, X., Ferrat, M., and Li, Z.: New evidence of orographic precipitation suppression by aerosols in central China, Meteorol. Atmos. Phys., 119, 17–29, 2013.
Zhang, W., Zhang, Y., Lv, Y., Li, K., and Li, Z.: Observation of atmospheric boundary layer height by ground-based LiDAR during haze days, J. Remote Sens., 17, 981–992, 2013.
Zhao, H., Che, H., Ma, Y., Wang, Y., Yang, H., Liu, Y., Wang, Y., Wang, H., and Zhang, X.: The Relationship of PM Variation with Visibility and Mixing-Layer Height under Hazy/Foggy Conditions in the Multi-Cities of Northeast China, Int. J. Environ. Res. Public Health, 14, p. 471, https://doi.org/10.3390/ijerph14050471, 2017.
Zhao, X. J., Zhao, P. S., Xu, J., Meng,, W., Pu, W. W., Dong, F., He, D., and Shi, Q. F.: Analysis of a winter regional haze event and its formation mechanism in the North China Plain, Atmos. Chem. Phys., 13, 5685–5696, https://doi.org/10.5194/acp-13-5685-2013, 2013.