the Creative Commons Attribution 4.0 License.
the Creative Commons Attribution 4.0 License.
Multi-year monitoring of atmospheric total gaseous mercury at a remote high-altitude site (Nam Co, 4730 m a.s.l.) in the inland Tibetan Plateau region
Xiufeng Yin
Shichang Kang
Benjamin de Foy
Yaoming Ma
Yindong Tong
Wei Zhang
Xuejun Wang
Guoshuai Zhang
Qianggong Zhang
Total gaseous mercury (TGM) concentrations were continuously measured at Nam Co Station, a remote high-altitude site (4730 m a.s.l.), on the inland Tibetan Plateau, China, from January 2012 to October 2014 using a Tekran 2537B instrument. The mean concentration of TGM during the entire monitoring period was 1.33±0.24 ng m−3 (mean ± standard deviation), ranking it as the lowest value among all continuous TGM measurements reported in China; it was also lower than most of sites in the Northern Hemisphere. This indicated the pristine atmospheric environment on the inland Tibetan Plateau. Long-term TGM at the Nam Co Station exhibited a slight decrease especially for summer seasons. The seasonal variation of TGM was characterized by higher concentrations during warm seasons and lower concentrations during cold seasons, decreasing in the following order: summer (1.50±0.20 ng m−3) > spring (1.28±0.20 ng m−3) > autumn (1.22±0.17 ng m−3) > winter (1.14±0.18 ng m−3). Diurnal variations of TGM exhibited uniform patterns in different seasons: the daily maximum was reached in the morning (around 2–4 h after sunrise), followed by a decrease until sunset and a subsequent buildup at night, especially in the summer and the spring. Regional surface reemission and vertical mixing were two major contributors to the temporal variations of TGM while long-range transported atmospheric mercury promoted elevated TGM during warm seasons. Results of multiple linear regression (MLR) revealed that humidity and temperature were the principal covariates of TGM. Potential source contribution function (PSCF) and FLEXible PARTicle dispersion model (WRF-FLEXPART) results indicated that the likely high potential source regions of TGM to Nam Co were central and eastern areas of the Indo-Gangetic Plain (IGP) during the measurement period with high biomass burning and anthropogenic emissions. The seasonality of TGM at Nam Co was in phase with the Indian monsoon index, implying the Indian summer monsoon as an important driver for the transboundary transport of air pollution onto the inland Tibetan Plateau. Our results provided an atmospheric mercury baseline on the remote inland Tibetan Plateau and serve as new constraint for the assessment of Asian mercury emission and pollution.
- Article
(4715 KB) - Full-text XML
-
Supplement
(4387 KB) - BibTeX
- EndNote
Mercury (Hg) is one of the most toxic environmental pollutants due to the easy uptake of its organic forms by biota and the neurological and cardiovascular damage to humans resulting from bioaccumulation (Schroeder and Munthe, 1998). The majority of the mercury released to the environment is emitted into the atmosphere and can be transported from emission sources to deposition sites around the globe. Unlike other metals in the atmosphere, the majority of atmospheric mercury largely exists in the elemental form (gaseous elemental mercury, GEM). The global residence time of GEM is in the range of 0.5–2 years due to its high volatility, low solubility and chemical stability (Schroeder and Munthe, 1998; Shia et al., 1999). Therefore, it is transported globally over long distances (tens of thousands of kilometers) far from pollution sources. Horowitz et al. (2017) recently reported that the chemical lifetime of tropospheric GEM against oxidation may be much shorter than previously reported: it could be as short as 2.7 months. GEM accounts for more than 95 % of TGM (TGM, total gaseous mercury; RGM, reactive gaseous mercury; TGM = GEM + RGM). RGM and Hg-p (particle-bound mercury) compounds make up the remaining fraction of mercury in the atmosphere, and these two compounds have an estimated lifetime ranging from several days to a few weeks. RGM can be expected to be removed a few tens to a few hundreds of kilometers from their source while Hg-p is likely to be deposited at intermediate distances of hundreds to thousands of kilometers (Schroeder and Munthe, 1998). RGM and Hg-p are generally depicted as local and regional pollutants, and the dry and wet deposition of RGM and Hg-p are much faster than GEM (Schroeder and Munthe, 1998; Lin and Pehkonen, 1999; Lindberg and Stratton, 1998).
East Asia and South Asia are two of the regions in the world with the fastest economic growth and the highest population density. These two areas are known for their heavily polluted air (Mukherjee et al., 2009), and anthropogenic mercury emissions in these regions are among the world's highest (Pirrone et al., 2010). China is the largest anthropogenic emitter of mercury worldwide with most of the emissions originating from coal combustion and non-ferrous smelting production (AMAP/UNEP, 2013; Pacyna et al., 2010). Geographically, most of China's mercury emissions are located in eastern and central China (Streets et al., 2005; Wu et al., 2016) (Fig. S1 in the Supplement). Atmospheric mercury concentrations in Guizhou, one of the most important mercury and coal producing regions in China, was reported to be 6.2–9.7 ng m−3 of TGM in the capital city of Guiyang between 2001 and 2009 (Feng et al., 2004; Liu et al., 2011; Fu et al., 2011). Measurements of atmospheric mercury at background and remote sites in China include the following sites: Wuzhishan (2011–2012), Mt. Changbai (2008–2010), Mt. Waliguan (2007–2008), Mt. Ailao (2011–2012), Shangri-La (2009–2010) and Mt. Gongga (2005–2006) with concentrations ranging from 1.58 to 3.98 ng m−3 (Liu et al., 2016; Fu et al., 2012a, b, 2015, 2008; Zhang et al., 2015). Similarly, South Asia has serious problems with environmental pollution due to elevated mercury emissions (AMAP/UNEP, 2013), resulting in hazardous mercury levels reported in water, lake sediment and fish samples (Karunasagar et al., 2006; Parvathi et al., 2010; Subramanian, 2004). Anthropogenic mercury emissions in South Asia were mostly on the Indo-Gangetic Plain (IGP) including most of northern and eastern India, the eastern parts of Pakistan, and all of Bangladesh (Fig. S1), all of which have high population density and many industrial centers. Biomass burning is another important source of atmospheric mercury, especially for TGM/GEM (Pirrone et al., 2010), and can lead to high TGM concentration events at sites far from emission sources (de Foy et al., 2012). Plenty of fire hot spots were observed in South Asia and East Asia including the IGP, the Indo-China Peninsula and southeastern China indicating biomass burning in these areas (Fig. S2), while few biomass burning events were detected on the Tibetan Plateau (Fig. S2).
Located between South Asia and East Asia, the Tibetan Plateau is a vast high-altitude landform featured by remote and pristine environments. There are limited local anthropogenic activities on the Tibetan Plateau and previous studies have reported that the atmospheric environment of the area remains at global background levels (Fu et al., 2012a; Sheng et al., 2013; Xiao et al., 2012). Notably, mercury records from glaciers and lake sediments suggest that the Tibetan Plateau is an important part of the global mercury cycle, acting as both a sink (mercury deposition to snow) and a source (release of mercury from melting ice) (e.g., Kang et al., 2016; Yang et al., 2010; Sun et al., 2017, 2018). Further, it has been increasingly perceived that the inland Tibetan Plateau can be influenced by transboundary air pollution such as black carbon originating from biomass burning in South Asia, which crosses the Himalayas (Xia et al., 2011; Cong et al., 2015; Wan et al., 2015; Li et al., 2016). Studies of mercury in precipitation and water vapor evidenced that the Tibetan Plateau is likely sensitive to pollutant input including mercury (Huang et al., 2012, 2013). Furthermore, the particulate-bound mercury in total suspended particulates was found at high concentrations in Lhasa with an average of 224 pg m−3, which was comparable to other cities in China (Huang et al., 2016). A few measurements of atmospheric mercury at sites on the fringes of the Tibetan Plateau reported TGM concentrations in the range of 1.98–3.98 ng m−3 (Fu et al., 2012a, 2008; Zhang et al., 2015), which were slightly higher than the background level in the Northern Hemisphere, implying the possible impact of anthropogenic emissions. In recent years, China and India signed the Minamata Convention and will probably control mercury emissions more strictly (Selin, 2014). Wu et al. (2017) stated that atmospheric mercury emissions from iron and steel production decreased from 35.6 Mg in 2013 to 32.7 Mg in 2015, and Pacyna et al. (2010) estimated that total mercury emissions in China would decrease from 635 Mg in 2005 to 290–380 Mg in 2020. However, Burger et al. (2013) estimated that total mercury emissions in India would increase from 310 Mg in 2010 to 540 Mg in 2020. In the context of serious mercury pollution and fast changes in regional mercury emission, atmospheric mercury observations at background sites neighboring regions of higher mercury pollution can provide a scientific basis for evaluating the extent of mercury pollution, for determining potential sources of atmospheric mercury and for informing public policy. The Nam Co Station, an inland site on the Tibetan Plateau, is an ideal site to determine the TGM of the inland Tibetan Plateau because it is rarely affected by locally anthropogenic emission of mercury.
In this study, high time resolution TGM was measured at the Nam Co Station from January 2012 to October 2014 and the temporal characteristics of atmospheric mercury were studied. Comparison with meteorological data, multiple linear regression (MLR) and a box model were used to investigate the temporal mercury variations at the Nam Co Station. HYSPLIT (HYbrid Single Particle Lagrangian Integrated Trajectory), WRF-FLEXPART (FLEXible PARTicle dispersion model) and potential source contribution function (PSCF) were used to identify potential sources and impacts from long-range transport. The objectives of this study were to (1) summarize the levels and temporal characteristics of TGM at a remote site on the inland Tibetan Plateau in a long-term measurement, (2) identify potential source regions of TGM at the Nam Co Station and (3) provide an in situ observational constraint that may contribute to understanding changes in Asian mercury pollution.
2.1 Measurement site
The Nam Co comprehensive observation and research station (namely the Nam Co Station, 30∘46.44′ N, 90∘59.31′ E, and 4730 m a.s.l.) is a remote site between Nam Co Lake and the Nyainqêntanglha mountain range (Fig. 1). Nam Co Station was established in 2005 to maintain a long-term record of the meteorological, ecological and atmospheric measurements on the Tibetan Plateau (Cong et al., 2007; Li et al., 2007; Kang et al., 2011; Huang et al., 2012; Liu et al., 2015; de Foy et al., 2016b). There are restricted point sources of anthropogenic mercury emissions near Nam Co Station. Damxung County is the nearest town on the southern slopes of the Nyainqêntanglha mountain range approximately 60 km south from and 500 m lower than the Nam Co Station. Nomadism and tourism are the only human activities in the region, and they mostly take place during the summer. Lhasa, the largest city in Tibet, is ∼125 km south of Nam Co Station. There was discontinuous snow at Nam Co Station from October to March; however, due to strong wind during this period and the flat terrain surrounding the station, the snow did not remain on the ground for more than a few days at a time.
TGM measurements were conducted at Nam Co Station from 15 January 2012 until 4 October 2014 (Fig. S3). Field operators checked the instruments and created a monitoring log file each day. Measurements were intermittently interrupted due to equipment maintenance and an unstable power supply, which resulted from damage to the electrical wires due to strong winds. All data displayed in this study are in UTC+8 and solar noon at Nam Co Station is at 13:56 in UTC+8 (China Standard Time, Beijing Time).
2.2 Measurements: TGM, surface ozone and meteorology
Measurements of TGM concentrations were performed with a Tekran model 2537B instrument (Tekran Instruments Corp., Toronto, Ontario, Canada). The Tekran 2537 B was installed in the monitoring house at Nam Co Station and ambient air was introduced from the inlet, which was 1.5 m above the roof and 4 m above the ground. A 45 mm diameter Teflon filter (pore size 0.2 µm) was placed in front of the inlet and it was changed every two weeks. The Tekran 2537B measurements are based on the amalgamation of mercury onto a pure gold surface. By using a dual cartridge design, continuous measurements of mercury in the air can be made. The amalgamated mercury was thermally desorbed into an argon carrier gas stream and analyzed using an internal detector, which was designed by cold vapor atomic fluorescence spectrophotometry (λ=253.7 nm) (Landis et al., 2002) and provided TGM analysis at sub-ng m−3 levels. The sampling interval of the Tekran 2537B was 5 min and the sampling flow rate was 0.8 L min−1 (at standard temperature and pressure). The Tekran 2537B was calibrated automatically every 25 h using the internal mercury permeation source and was calibrated manually using a Tekran 2505 randomly once or twice a year. At the Nam Co Station, the TGM fraction mostly consisted of GEM (more than 98 %). The operationally defined RGM accounted for less than 2 % of TGM (Fig. S1 in the Supplement in de Foy et al., 2016b). We consider the Tekran data to represent TGM in line with previous studies (e.g., Kock et al., 2005; Slemr et al., 2008; Müller et al., 2012).
Surface ozone was measured as a surrogate measure of the oxidizing potential of the atmosphere (Stamenkovic et al., 2007) at Nam Co Station using a UV photometric instrument (Thermo Environmental Instruments, USA, Model 49i), which uses the absorption of radiation at 254 nm and has a dual cell design. The monitor was calibrated using a 49i-PS calibrator (Thermo Environmental Instruments, USA) before measurements and using aperiodic calibration during the monitoring periods. Details and analysis of the surface ozone measurements at Nam Co Station were reported in Yin et al. (2017).
Measurements of temperature (T), relative humidity (RH), wind speed (WS), wind direction (WD) and downward shortwave radiation (SWD) were conducted at Nam Co Station by a local weather station system (Milos 520, Vaisala Co., Finland) and a radiation measurement system (CNR1, Kipp & Zonen Co., US), respectively (Ma et al., 2008).
2.3 Meteorological simulations
Gridded meteorological data for backward trajectories were obtained from the Global Data Assimilation System (GDAS-1) of the US National Oceanic and Atmospheric Administration (NOAA) with 1∘ × 1∘ latitude and longitude horizontal resolution and vertical levels of 23 from 1000 hPa to 20 hPa (http://www.arl.noaa.gov/gdas1.php, last access: October 2017).
Backward trajectories and clusters were calculated by the NOAA-HYSPLIT model (Draxler and Rolph, 2003, http://ready.arl.noaa.gov/HYSPLIT.php, last access: October 2017) using TrajStat (Wang et al., 2009), which is a free software plugin from MeteoInfo (Wang, 2014). The backward trajectories arrival height in HYSPLIT was set at 500 m above the surface and the total run time was 120 h for each backward trajectory. Results of air masses at different heights (500, 1000 and 1500 m) showed similar patterns; hence, we selected trajectories released at a height of 500 m as representative, as 500 m is suitable for considerations of both the long-range transport and transport in the planetary boundary layer. Trajectory positions were stored at time intervals of 3 h. Angular distance was chosen to calculate clusters in the HYSPLIT calculation. HYSPLIT backward trajectories were used to calculate the potential source contribution function (Sect. 2.6) which serves to investigate the potential sources contributing to atmospheric mercury at Nam Co Station.
In addition to HYSPLIT, WRF-FLEXPART (Brioude et al., 2013) was used to obtain clusters of particle trajectories reaching Nam Co Station. One thousand particles were released per hour in the bottom 100 m surface layer above Nam Co Station and were tracked in backward mode for 4 days (de Foy et al., 2016b). The use of two different trajectory models (HYSPLIT and WRF-FLEXPART) with different input meteorology can add robustness to the discussion as was done for the ozone study at Nam Co (Yin et al., 2017). Furthermore, the WRF-FLEXPART simulations were some of the parameters used in the multiple linear regression model (Sect. 2.4). Residence time analysis (RTA) (Ashbaugh et al., 1985) was utilized to show the dominant transport paths of air masses impacting the samples (Wang et al., 2016, 2017). Six clusters were found to represent the prevailing flow patterns to Nam Co Station simulated using WRF-FLEXPART.
2.4 Multiple linear regression model and box model
A multiple linear regression (MLR) model was used to quantify the main factors affecting the hourly concentrations of TGM. The method follows the description provided in de Foy et al. (2016a, c) and de Foy (2017) and was used to analyze surface ozone concentrations at Nam Co Station (Yin et al., 2017). The inputs to the MLR model include meteorological parameters (wind speed, temperature, solar radiation and humidity), surface ozone, interannual variation factors, seasonal factors, diurnal factors, WRF boundary layer heights, WRF-FLEXPART trajectory clusters and a CAMx stratospheric ozone tracer (see Yin et al., 2017, for more details). Briefly, the interannual factors are separate scaling factors for each year of the measurements, the seasonal factors are 12-month and 6-month harmonic terms (sine and cosine), and the diurnal factors are scaling factors for each hour of the day. The inputs to the model were normalized linearly. An iteratively reweighted least squares (IRLS) procedure was used to screen for outliers. Measurement times when the model residual was greater than two standard deviations of all the residuals were excluded from the analysis. This was repeated iteratively until the method converged on a stable set of outliers. The variables to be included in the regression were obtained iteratively. At each iteration, the variable leading to the greatest increase in the square of the Pearson's correlation coefficient was added to the inputs as long as the increase was greater than 0.005.
The distribution of the TGM concentrations is approximately normal (see details in Sect. 3.1), and so a linear model was used. TGM was scaled linearly to have a mean of zero and a standard deviation of one in the regression model. A Kolmogorov–Zurbenko filter (Rao et al., 1997) was used to separate the time series of specific humidity and temperature into a synoptic scale signal (> 3–5 days) and a diurnal scale signal using 5 passes of a 13-point moving average. Only the synoptic scale signal was included in the final regression results, as the diurnal variation was characterized by the other variables in the analysis. The other meteorological parameters used were the 24 h average boundary layer height from WRF and the 8 h local measured wind speeds (4 directions, 5 wind speed segments for a total of 20 factors corresponding to different wind speeds from different wind directions). The 24 h average of ozone measurements (log-transformed) contributed to the model. In addition, a seasonal Kolmogorov–Zurbenko (KZ) filtered time series of a CAMx tracer for transport from the free troposphere (above 300 hPa) to the surface contributed to the model.
TGM at the Nam Co Station is expected to be well mixed and the site is not influenced by local sources. Therefore, it is expected that a box model should be able to reproduce the diurnal profile of concentrations. A box model that accurately simulates the diurnal profile of TGM would provide constraints on known processes affecting the concentrations. Comparisons with measured profiles would further identify missing processes in the model. This approach was used for reactive mercury at the same site, where it identified the role of the reduction of reactive mercury to gaseous elementary mercury mediated by sunlight (de Foy et al., 2016b). A box model was made that included free parameters to represent known chemical reactions and dispersion processes. An optimization algorithm was used to identify the parameters required to fit the model to the data, as was done in de Foy et al. (2016b). Preliminary tests of the box model were made using solar radiation and temperature to represent chemical transformations, as well as using wind speed and boundary layer height to represent dilution. However, these attempts failed to reproduce the diurnal variation found in the measurements. Therefore, a simplified exploratory model was sought that would represent the measured diurnal variations as simply as possible, according to Occam's razor (Larsen et al., 2014). This model does not yield direct information on known processes, although it does identify the kinds of processes and their magnitude that would be required to accurately represent the measured diurnal profile. The final model combined the following five inputs: TGM increases at sunrise and in the early evening, constant TGM reductions 24 h a day, a constant lifetime for TGM loss during daylight hours and TGM dilution due to vertical mixing.
2.5 Anthropogenic mercury emissions and fire hot spot distribution
The mercury emission inventory of China was obtained from Wu et al. (2016), which used a technology-based approach to compile a comprehensive estimate of Chinese provincial emissions for all primary anthropogenic sources. The emissions over other Asian countries were from UNEP global anthropogenic emission inventory (AMAP/UNEP, 2013). These inventories were for the year 2010 and had a horizontal resolution of 0.5∘ × 0.5∘.
MODIS fire spots were obtained from Fire Information for Resource Management System (FIRMS) operated by NASA in the US (Giglio et al., 2003; Davies et al., 2004).
2.6 Potential source contribution function (PSCF)
PSCF assumes that back-trajectories arriving at times of higher mixing ratios likely point to the more significant source directions (Ashbaugh et al., 1985). PSCF has been applied in previous studies to locate sources of TGM for different sites (Fu et al., 2012a, b; Zhang et al., 2015). The PSCF values for the grid cells in the study domain are based on a count of the trajectory segment (hourly trajectory positions) that terminate within each cell (Ashbaugh et al., 1985). Let nij be the total number of endpoints that fall in the ijth cell during whole simulation period. Let mij represents the number of points in the same cell that have arrival times at the sampling site corresponding to TGM concentrations higher than a set criterion. In this study, we calculate the PSCF based on trajectories corresponding to concentrations that exceed the mean level (1.33 ng m−3) of TGM. The PSCF value for the ijth cell is then defined as follows:
The PSCF value can be interpreted as the conditional probability that the TGM concentration at the measurement site is greater than the mean mixing ratios if the air parcel passes though the ijth cell before arriving at the measurement site. Cells with high PSCF values are associated with the arrival of air parcels at the receptor site that have TGM concentrations that exceed the criterion value. These cells are indicative of areas of “high potential” contributions for the chemical constituent.
Identical PSCFij values can be obtained from cells with very different counts of back-trajectory points (e.g., grid cell A with mij=5000 and nij=10 000 and grid cell B with mij=5 and nij=10). In this extreme situation, grid cell A has 1000 times more air parcels passing through than grid cell B. Because of the sparse particle count in grid cell B, the PSCF values are more uncertain and the contribution from B is limited. To account for the uncertainty due to low values of nij, the PSCF values were scaled by a weighting function Wij (Polissar et al., 1999). The weighting function reduced the PSCF values when the total number of the endpoints in a cell was less than about 3 times the average value of the end points per each cell. In this case, Wij was set as follows:
where Nave represents the mean nij of all grid cells. The weighted PSCF values were obtained by multiplying the original PSCF values by the weighting factor: weighted PSCF result = Wij × PSCF.
3.1 TGM concentrations
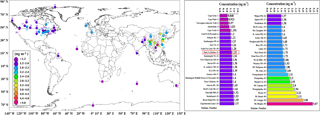
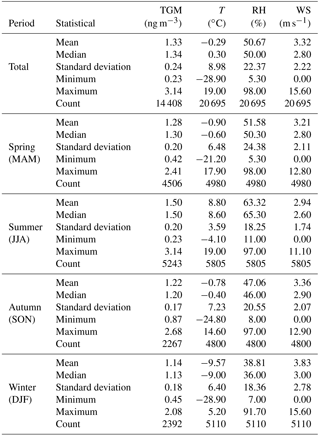
The mean TGM concentration at Nam Co Station is 1.33 ± 0.24 ng m−3, which is the lowest among all reported TGM concentrations at remote and rural sites in China (Liu et al., 2016; Fu et al., 2012b, a, 2015, 2008, 2010; Ci et al., 2011; Dou et al., 2013; Zhang et al., 2015, 2013; Li et al., 2011; Yu et al., 2015; Chen et al., 2013). The mean concentration of TGM is slightly lower than the annual mean concentration at background sites in the Northern Hemisphere (1.55 ng m−3 in 2013 and 1.51 ng m−3 in 2014), and higher than those in the Southern Hemisphere (0.93 ng m−3 in 2013 and 0.97 ng m−3 in 2014) (Sprovieri et al., 2016). Comparable results were reported from EvK2CNR on the south slope of the Himalayas (1.2 ng m−3, Gratz et al., 2013) and from tropical sites in the Global Mercury Observation System in the Northern Hemisphere (1.23 ng m−3 in 2013 and 1.22 ng m−3 in 2014) (Sprovieri et al., 2016). Compared to the three sites at the edge of the Tibetan Plateau (Mt. Waliguan, Shangri-La and Mt. Gongga, Table S1), the mean TGM concentration at Nam Co Station was substantially lower, indicating that the inland Tibetan Plateau has a more pristine environment than the edges of the plateau.
The frequency distribution of TGM at Nam Co Station was normally distributed (Fig. S4). Eighty-one percent of the hourly average TGM concentrations were in the range from 1.0 to 1.6 ng m−3 with a few episodically elevated TGM and low TGM concentrations. Of all hourly mean TGM data (n=14 408), 1.6 % (n=236) were greater than 1.81 ng m−3 (overall mean TGM + 2× SD, namely 1.33 + 2 × 0.24 = 1.81), and 1.5 % (n=213) were lower than 0.85 ng m−3 (overall mean TGM − 2× SD, namely 1.33–2 × 0.24 = 0.85).
The monthly average TGM at Nam Co Station showed a weak decrease (slope = −0.006) during the entire monitoring period, and the decrease was more pronounced in the summer (slope = −0.013). Despite the short time span of the TGM time series with some missing data mostly in the winter, the slight decrease of TGM especially in the summer was in agreement with a recent study using plant biomonitoring; this prior study identified decreasing atmospheric mercury since 2010 near Damxung County (Tong et al., 2016) as well as decreases of TGM at other sites (Slemr et al., 2011; Zhang et al., 2016).
3.2 Seasonal variations of TGM
In contrast with many previous observations in China (Zhang et al., 2015; Fu et al., 2008, 2009, 2010, 2011, 2012b; Feng et al., 2004; Xiu et al., 2009; Xu et al., 2015; Wan et al., 2009) and most AMNet (Atmospheric Mercury Network) sites (Lan et al., 2012), TGM at Nam Co Station showed a seasonal variation with a maximum in the summer (June, July and August) and a minimum in the winter (December, January and February) (Fig. 2). The seasonal mean TGM values decreased in the following order: summer (1.50 ± 0.20 ng m−3) > spring (1.28 ± 0.20 ng m−3) > autumn (1.22 ± 0.17 ng m−3) > winter (1.14 ± 0.18 ng m−3) (Table 1). The highest monthly mean TGM concentration of 1.54 ng m−3 in July was 0.43 ng m−3 higher than the lowest concentration of 1.11 ng m−3 in November.
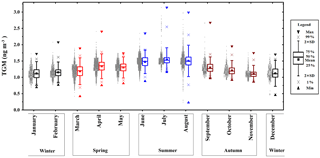
Figure 2Monthly average and statistical parameters of TGM at Nam Co Station during the whole measurement period (spring (MAM) in red; summer (JJA) in blue; autumn (SON) in dark red; and winter (DJF) in black).
Measurements of TGM in other sites on the Tibetan Plateau also reported diverse seasonal patterns (Fig. 3). For example, Fu et al. (2012a) found that the maximum TGM concentration at Waliguan was in January 2008, resulting from long-range transport of pollutants from northern India. Aside from January, monthly mean TGM concentrations at Waliguan had a clear trend with high levels in warm seasons, and lower levels in cold seasons. The TGM variation at Mt. Gongga (Fu et al., 2008) had a minimum in the summer, possibly due to the accelerated oxidation followed by dry deposition and wet scavenging processes in the summer. The winter maximum of TGM at Mt. Gongga (Fu et al., 2008) implied an impact from anthropogenic mercury emissions in the cold months. The seasonal variation of TGM at Shangri-La (Zhang et al., 2015) had high levels in the spring and autumn, and low levels in the summer and winter, which was different from all the other sites on the Tibetan Plateau.
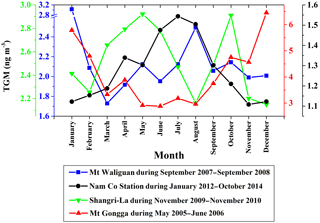
Figure 3Variations of monthly mean TGM at four sites (Mt. Waliguan (Fu et al., 2012a), Nam Co, Mt. Gongga (Fu et al., 2008) and Shangri-La (Zhang et al., 2015)) on the Tibetan Plateau.
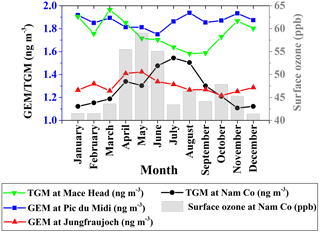
Figure 4Monthly average GEM/TGM at Nam Co Station and three high-altitude background stations in the Northern Hemisphere (Denzler et al., 2017; Fu et al., 2016a; Ebinghaus et al., 2002) (average TGM at Mace Head in green; average GEM at Pic du Midi in blue; median GEM at Jungfraujoch in red; average TGM at Nam Co Station in black); and monthly average surface ozone at Nam Co in column.
Compared to other high-altitude background sites in the midlatitudes in Europe (Fig. 4) (Denzler et al., 2017; Fu et al., 2016a; Ebinghaus et al., 2002) and sites in midlatitudes in the US (Holmes et al., 2010; Weiss-Penzias et al., 2003; Sigler et al., 2009; Yatavelli et al., 2006), the lower concentration of TGM at Nam Co Station in the winter might be indicative of atmospheric mercury removal during this period caused by reactive halogens (Br and Br2). The reaction rates for these reactions are a strong inverse function of temperature (de Foy et al., 2016b; Goodsite et al., 2004), and are accompanied by lower surface ozone concentration (Yin et al., 2017); surface ozone is catalytically destroyed by halogens (Bottenheim et al., 1986; Obrist et al., 2011).
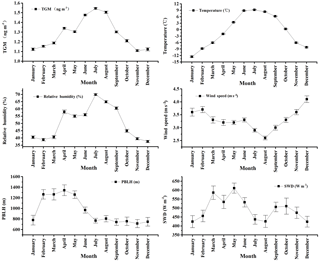
Figure 5Monthly variations of TGM, relative humidity, temperature, SWD (downward shortwave radiation), wind speed and PBLH (planetary boundary layer height) during the whole measurement period at Nam Co Station. Error bars are 95 % confidence levels.
The summer peak of TGM at Nam Co Station may be related to both the local reemission of mercury from the Earth's surface, and long-range transport from South Asia (see details in Sect. 3.5). At Nam Co Station, daily mean TGM had a correlation coefficient with daily mean temperature that reached 0.56. Higher temperature in the warm seasons (Fig. 5) might lead to the remobilization of soil mercury reemission, which has been evidenced by a recent study on surface–air mercury exchange on the northern Tibetan Plateau (Ci et al., 2016). It is also possible that weaker wind speeds during the warm season (Fig. 5) suppressed the dilution of TGM with fresh air aloft in a low boundary layer. Furthermore, most precipitation happens in the summer at Nam Co Station (You et al., 2007) and can increase the emission of mercury from the Earth's surface by the physical displacement of interstitial soil air by the infiltrating water (Ci et al., 2016) and by the additional input of mercury from wet deposition (Huang et al., 2012). Besides local emissions, the summer monsoon can facilitate the transport of air masses with higher TGM concentrations from South Asia; hence, it may also contribute to the summer peak of TGM.
The month of April in both 2012 and 2013 had higher monthly TGM levels than the months before and after (Fig. S3), possibly resulting from mercury emission from Nam Co Lake as the lake started to thaw at this time of year (Gou et al., 2015).
3.3 Diurnal variations of TGM
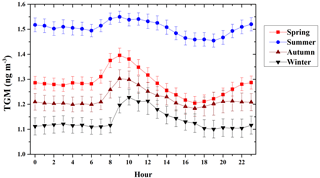
Diurnal variations of TGM in different seasons exhibited a regular pattern, characterized by a sharp rise shortly after sunrise and a fairly steady decrease from the morning peak until sunset (Fig. 6). After sunset, TGM increased until midnight in the summer, the spring and the autumn. The diurnal variation of TGM at Nam Co Station was similar to that at Mt. Gongga (Fu et al., 2009), Mt. Leigong (Fu et al., 2010), Mt. Changbai (Fu et al., 2012b), Mt. Waliguan (Fu et al., 2012a) and Reno (Peterson et al., 2009), except that the morning increase occurred earlier and was shorter compared to other sites that have a gradual increase throughout the morning.
Figure 7 shows the comparison of TGM concentrations with a box model simulation by seasons. The best match in the box model was obtained by using variables including constant TGM reduction throughout the day, TGM increases at sunrise, TGM increases in the early evening, TGM dilution due to vertical mixing and a lifetime of TGM loss during daylight hours (Table 2). The R2 values of the model simulations ranged from 0.91 to 0.99, suggesting that the simulations reproduced the diurnal variations accurately. As described above, both the measurements and the model have sharp bursts of TGM in the morning (07:00–09:00) and in the evening (18:00–22:00) during all seasons. Constant reductions existed in the spring, summer and autumn which would correspond to reduction rates of around 1 to 2 ng m−2 h−1.
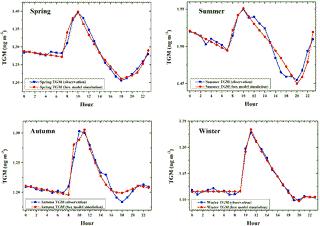
Figure 7Diurnal profiles of average hourly TGM at Nam Co Station by season during the measurement period compared with the box model simulation.
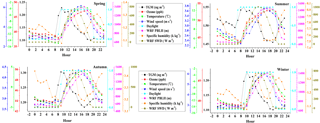
Figure 8Diurnal profiles of TGM, ozone and meteorological parameters (temperature, wind speed, daylight, WRF PBLH (planetary boundary layer height), specific humidity and WRF SWD (downward shortwave radiation)) at Nam Co Station by season for the measurement period.
Figure 8 shows the seasonal diurnal profiles of TGM and meteorological parameters. TGM concentrations were stable or decreased slightly after midnight (00:00–06:00) under shallow nocturnal boundary layers. Notably, the morning increase of TGM happens immediately after sunrise, but before the increases in temperature, wind speed or humidity. The atmospheric mercury burst in the morning (07:00–09:00) is probably due to prompt reemission of the nocturnal mercury deposition on the Earth's surface (Fu et al., 2016b; Howard and Edwards, 2018; Kim, 2010). The stable nocturnal boundary layer terminated at sunrise at which point mercury, including the mercury in the soil indigenously and/or deposited overnight, started to be reemitted into the shallow stable boundary layer before the increase of temperature which leads to an increase in the mixing height. As the temperature and radiation increased, so did the boundary layer height. This then developed into a convective mixed boundary layer and generated greater vertical mixing between the surface and aloft. At the same time, the surface wind speed also increased. With increased vertical and horizontal dispersion, TGM released from the surface was diluted during the daytime (Liu et al., 2011; Lee et al., 1998). When the temperature decreased and the boundary layer converted back into a nocturnal boundary layer after sunset, depressed vertical mixing facilitated the buildup of TGM and such buildup was more significant in the warm seasons. In the evening, increases in TGM correspond to increases in specific humidity, especially in the summer.
3.4 Multiple linear regression and WRF-FLEXPART clusters results
Results of the MLR simulations for the entire measurement period (2012–2014) had a close correlation with the measurements: the correlation coefficient was 0.77 when all 12 649 data points were included and 0.84 excluding the 383 outliers (Fig. 9). The primary contributor to the variance of the simulated time series was the seasonal signal, including the 12-month and 6-month harmonics as well as the smoothed specific humidity and temperature time series (Table 3). These were grouped together when presenting the results because they were not orthogonal to each other, and they contributed 84 % of the variance of TGM in the MLR simulation. The diurnal factors accounted for 4 % of the variance, the WRF boundary layer heights accounted for 4 % of the variance, and the local winds were associated with 1 % of the variance. These factors showed that there was an impact from horizontal and vertical dispersion as well as daily cycling patterns due to either transport or chemistry, but that these factors were considerably smaller than the seasonal variation at the site. Only 1 % of the variance was associated with the annual signal, showing that the decrease in the concentrations reported in Sect. 3.1 was a small contributor to variations in TGM at Nam Co. The time series of surface ozone concentration contributed 3 % to the variance and the stratospheric ozone tracer contributed 3 %. We hypothesized that this was because ozone concentrations acted as an indicator of the oxidative potential of the air mass, although in the case of surface ozone concentration it could also be because they were a tracer of aged polluted air masses.
Table 3Contribution from the different groups to the total variance of the model. The standard deviation of each group gives a sense of the contribution of each group to the variance in units of ng m−3. The variance contribution shows the percentage that each group contributes to the total variance of the model.
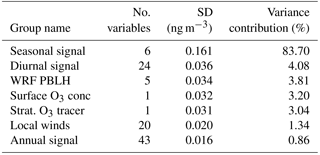
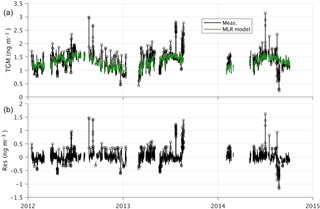
Figure 9The measurements and multi linear regression (MLR) model of TGM (top) and model residual (bottom) (residual = measurement − simulation). The outliers are shown as circles.
The regression analysis screens for high and low outliers. In particular, high outliers were significant in terms of TGM concentrations: they had an average concentration of 1.91 ng m−3 which is 0.58 ng m−3 higher than the average of the measurements retained in the simulations (Fig. 9). Figure 9 shows that a number of the high outliers are associated with specific peak events, indicating that occasional plumes of high TGM are not associated with recurring emissions or periodically occurring conditions. A significant amount of TGM not accounted for in the model was due to the high outliers. Additionally, a few events with very low TGM concentrations were not simulated; they had an average concentration of 0.9 ng m−3. Figure 10a shows the six wind transport clusters based on the hourly WRF-FLEXPART simulations. The figure shows the average residence time analysis for all the hours in each cluster, which characterizes the path of the air masses arriving at the measurement site for each cluster. The most frequent clusters were clusters 1 and 2 which accounted for 30 and 34 % of measurement hours, respectively. For measurement times during these clusters, the air masses clearly came from the west with a slight southern component for cluster 1 and a slight northern component in the case of cluster 2. Cluster 3 represented hours influenced by transport from the north which occurred during 15 % of the measurement period. These were associated with the passage of storms at Nam Co: as the low pressure system moved to the east, the winds shifted from northwesterly to northeasterly. Clusters 4, 5 and 6 occurred less frequently and all represented different types of wind transport across the Himalayas from the south. Cluster 4 was the least frequent cluster, occurring 5 % of the time. It included transport from the southeast including the northeastern corner of the Indo-Gangetic Plain and occasional transport from southwestern China. This cluster also included transport from the direction of Lhasa. Cluster 5 occurred 7 % of the time and represents transport from the south including Bangladesh. Cluster 6 occurred 9 % of the time and included transport from Nepal and northern India.
The WRF-FLEXPART clusters were included in the MLR analysis and helped to improve the simulations for several tests. However, they did not increase the correlation coefficient of the final regression time series and, consequently, were not included in the final MLR results. This could be because transport was already characterized by the other variables in the model such as temperature and humidity (which can serve as tracers of different air masses) and local wind speed and direction. Nevertheless, the importance of air mass transport can be seen from the probability density function of the TGM concentrations by cluster shown in Fig. 10b. Clusters 1 and 2, which had transport from the west, clearly had the lowest TGM concentrations. Next in terms of increasing TGM concentrations were clusters 3 and 6 which had transport from the north and from the southwest. TGM concentrations above 2 ng m−3 were very clearly associated with cluster 4, which had transport from the east and through Lhasa; this was also probably due to the further impact from eastern Indo-Gangetic Plain and the possibility of episodic transport events from China. Of the 87 h with concentrations higher than 2 ng m−3, 59 % occurred during cluster 4 and 17 % during cluster 5 with less than 8 % for each of the other clusters. This clearly demonstrated that, in addition to having the highest average levels, clusters 4 and 5 accounted for most of the peak concentrations.
3.5 HYSPLIT and PSCF results
Backward trajectories were calculated using HYSPLIT to identify the origins of air masses and the associated TGM concentrations for Nam Co Station. Most HYSPLIT trajectories originated from the west of Nam Co including the western and central Tibetan Plateau, the southwestern part of the Xinjiang Uygur Autonomous Region, South Asia, Central Asia and western Asia. Very few trajectories originated from eastern China (Fig. S5). The backward trajectories were grouped into six clusters. Cluster 3 indicated the air mass from the south, originating from Bhutan and Bangladesh. This cluster had the lowest starting heights as well as traveling heights, but the highest mean TGM concentration (1.48 ng m−3) (Table S2) in agreement with the FLEXPART results (Sect. 3.4). Clusters 1, 2, 4, 5 and 6 originated in the west, including air masses originating from northern India, Pakistan, Afghanistan and Iran that passed over the Himalayas before arriving at Nam Co Station. They had longer pathways through the Tibetan Plateau than cluster 3. Cluster 4 had the longest transport route from the west, suggestive of faster wind speeds, and also the lowest TGM mean concentration (1.12 ng m−3) with relatively high transport height.
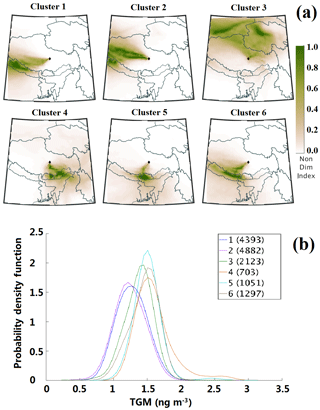
Figure 10Clusters of air mass transport to Nam Co using WRF-FLEXPART back trajectories (a) and probability density function of TGM concentrations for each cluster, with the number of data points in each cluster in parentheses (b).
PSCF calculations were based on concurrent TGM measurements and HYSPLIT backward trajectories, and thus can further constrain the potential source regions. Areas including the IGP, the southern part of the Xinjiang Uygur Autonomous Region, the western part of Qinghai Province and areas near Nam Co Station in the Tibet Autonomous Region were identified as overall high potential sources regions and pathways (Fig. S6). Except for areas near Nam Co Station, these potential source regions correspond well with atmospheric mercury emissions and biomass burning. The Bay of Bengal was identified as a potential source region, probably due to high emissions from its surroundings associated with frequent occurrence of trajectories passing through this area in the summer.
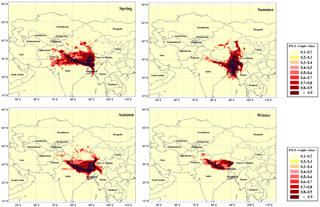
Figure 11Potential source contribution function showing areas with possible emissions or air mass transport associated with higher TGM concentrations at Nam Co Station by season in 2012.
Seasonal PSCFs were calculated in 2012 to investigate the potential sources by seasons (Fig. 11). In the spring, the autumn and the winter, Nam Co Station was dominated by the westerlies. Therefore, pollutants from South Asia might have been diluted by the clean air during transport within the Tibetan Plateau area before they arrived at Nam Co Station (Fig. S7). A zonal region on the central IGP (Fig. 11) with elevated pollution represents a constant potential source (Gautam et al., 2011; Mallik and Lal, 2014). The significant impact of long-range transport pollution from northwestern India on the Tibetan Plateau was also evidenced by TGM measurements at Waliguan (Fu et al., 2012a). In the summer, the Indian monsoon prevails and air masses arrived at Nam Co Station that had shorter pathway after entering the Tibetan Plateau than those in other seasons (Fig. S7). The central IGP was again found to have higher PSCF values than other regions, even though these were much lower than the PSCF values of other seasons. The highest PSCF values in the summer were on the eastern IGP (Fig. 11). For all seasons, the region near Nam Co Station, especially south and west of the station, displayed high PSCF values throughout the year, indicating that air masses with high TGM concentrations predominantly came from the south-southwest.
3.6 Implications for transboundary air pollution to the Tibetan Plateau
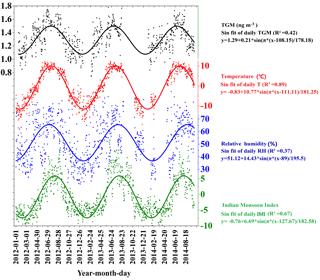
The seasonal atmospheric circulation pattern on the Tibetan Plateau was characterized by the Indian monsoon in the summer and the westerlies in the winter. Such a climate regime exerted a profound impact on the seasonal atmospheric environment by affecting the air transport dynamic and associated climate conditions. Pollutants like black carbon and hexachlorocyclohexanes peaked in the pre-monsoon season and declined during the monsoon season at Nam Co and Lulang, resulting from seasonal rainfall variations that can scavenge aerosols during their transport from source regions to the Tibetan Plateau (Zhang et al., 2017; Wan et al., 2015; Sheng et al., 2013). In contrast, gaseous pollutants showed different seasonal patterns: TGM at Nam Co in this study and persistent organic pollutants (dichlorodiphenyltrichloroethane and polychlorinated biphenyls) at Lulang in a prior study showed higher concentrations during the monsoon season compared to the pre-monsoon season (Sheng et al., 2013). TGM at Nam Co showed strong covariance with temperature and specific humidity, all of which were in phase with the Indian monsoon index (IMI) (Wang and Fan, 1999; Wang et al., 2001) (Fig. 12), indicating the importance of the Indian summer monsoon as a major driver delivering air pollution into the inland Tibetan Plateau via transboundary transport. We suggested that gaseous pollutants were not readily deposited and/or washed out by precipitation during their transport and were more likely associated with the transport dynamics driven by the Indian summer monsoon; hence, pollutants showed high values when the Indian summer monsoon prevailed. Transboundary air pollution was not the sole factor contributing to elevated TGM during summer, temperature-dependent processes such as gas–particle fractionation and surface reemission can also contribute to such seasonal patterns. Nonetheless, the close relationship between TGM and the Indian summer monsoon and the clear difference in seasonal patterns between gaseous and particulate pollutants indicated that additional measurements of multiple pollutants and comparative studies are required to achieve a more comprehensive understanding and assessment of transboundary air pollution to the Tibetan Plateau.
We conducted three years of TGM measurements (from January 2012 to October 2014) at Nam Co Station in the inland region of the Tibetan Plateau, China. The mean TGM concentration was 1.33 ± 0.24 ng m−3 during the whole measurement period, with the low TGM level at Nam Co Station indicating that the environment in the inland region of the Tibetan Plateau is pristine. A weak decrease of TGM was identified over the course of the measurements.
In contrast to many other sites in China, TGM at Nam Co Station showed high concentrations in warm seasons and low concentrations in cold seasons. Compared with other high-altitude background sites, the low concentration of TGM at Nam Co Station in the winter may be due to the removal of mercury owing to halogen. Seasonal variation of TGM at Nam Co Station was influenced by factors such as reemission processes of deposited mercury over the Earth's surfaces, vertical mixing and long-range transport. Multiple linear regression, backward trajectories and PSCF were investigated and results indicated that long-range transports from the central and eastern Indo-Gangetic Plain were potentially the main sources for seasonally elevated TGM due to the alternate impact of the westerlies and of the Indian monsoon. Peak concentrations of TGM at Nam Co Station were associated with air masses from the eastern Indo-Gangetic Plain with the possibility of episodic transport events from China.
At Nam Co Station, the diurnal TGM profile had a peak 2–3 h after sunrise and reached its lowest concentration before sunset. An exploratory box model simulation shows that this diurnal profile can be accurately represented using TGM reductions 24 h per day, TGM increases near sunrise and sunset, and dilution due to vertical mixing. Daily meteorological conditions, such as high temperature, high solar radiation and more precipitation facilitated the Earth's surface mercury emission. The decline of TGM concentrations in the daytime was likely due to vertical dilution from increased vertical mixing, as well as the conversion of GEM to oxidized species that are easily deposited.
Due to the insolubility of TGM, which is different from particulate pollutants, TGM was less affected by precipitation during transport in the monsoon season, and measurement of TGM at Nam Co Station can continually reflect the transboundary air pollution from South Asia to the inland Tibetan Plateau.
The measurements of TGM at Nam Co Station will be useful in providing an atmospheric mercury baseline in the remote inland Tibetan Plateau region, improving the accuracy of modeled concentrations of TGM in this area, and serving as a new constraint for the assessment of Asian mercury emission and pollution.
All the data presented in this paper can be made available for scientific purposes upon request to the corresponding authors (Qianggong Zhang (qianggong.zhang@itpcas.ac.cn) or Shichang Kang (shichang.kang@lzb.ac.cn)).
The supplement related to this article is available online at: https://doi.org/10.5194/acp-18-10557-2018-supplement.
SK, QZ and XY designed the research and performed field measurements. XY, Bd and QZ performed the data analysis and model simulations. XY, Bd and QZ led the manuscript writing. YM and GZ provided the meteorology data. YT, WZ and XW contributed to the scientific discussion and the manuscript preparation.
The authors declare that they have no conflict of interest.
This study was supported by the National Natural Science Foundation of China
(grant numbers: 41630754 and 41630748) and State Key Laboratory of Cryospheric Science
(grant number: SKLCS-ZZ-2018).
Qianggong Zhang acknowledges
financial support from the Youth Innovation Promotion Association of CAS (2016070).
Xiufeng Yin acknowledges the China Scholarship Council.
The authors are grateful to Yaqiang Wang, who is the developer of MeteoInfo and provided generous help.
The authors thank NOAA for providing the HYSPLIT model and the GFS meteorological files.
Finally, the authors would like to thank the editor and referees of this paper for their helpful comments and suggestions.
Edited by: Ralf Ebinghaus
Reviewed by: three anonymous referees
AMAP/UNEP: Technical Background Report for the Global Mercury Assessment 2013, Arctic Monitoring and Assessment Programme, 2013.
Ashbaugh, L. L., Malm, W. C., and Sadeh, W. Z.: A residence time probability analysis of sulfur concentrations at Grand Canyon National Park, Atmos. Environ., 19, 1263–1270, 1985.
Bottenheim, J., Gallant, A. G., and Brice, K. A.: Measurements of NOy species and O3 at 82 N latitude, Geophys. Res. Lett., 13, 113–116, 1986.
Brioude, J., Arnold, D., Stohl, A., Cassiani, M., Morton, D., Seibert, P., Angevine, W., Evan, S., Dingwell, A., Fast, J. D., Easter, R. C., Pisso, I., Burkhart, J., and Wotawa, G.: The Lagrangian particle dispersion model FLEXPART-WRF version 3.1, Geosci. Model Dev., 6, 1889–1904, https://doi.org/10.5194/gmd-6-1889-2013, 2013.
Burger Chakraborty, L., Qureshi, A., Vadenbo, C., and Hellweg, S.: Anthropogenic mercury flows in India and impacts of emission controls, Environ. Sci. Technol., 47, 8105–8113, 2013.
Chen, L., Liu, M., Xu, Z., Fan, R., Tao, J., Chen, D., Zhang, D., Xie, D., and Sun, J.: Variation trends and influencing factors of total gaseous mercury in the Pearl River Delta – A highly industrialised region in South China influenced by seasonal monsoons, Atmos. Environ., 77, 757–766, 2013.
Ci, Z., Peng, F., Xue, X., and Zhang, X.: Air-surface exchange of gaseous mercury over permafrost soil: an investigation at a high-altitude (4700 m a.s.l.) and remote site in the central Qinghai-Tibet Plateau, Atmos. Chem. Phys., 16, 14741–14754, https://doi.org/10.5194/acp-16-14741-2016, 2016.
Ci, Z., Zhang, X., Wang, Z., and Niu, Z.: Atmospheric gaseous elemental mercury (GEM) over a coastal/rural site downwind of East China: temporal variation and long-range transport, Atmos. Environ., 45, 2480–2487, 2011.
Cong, Z., Kang, S., Liu, X., and Wang, G.: Elemental composition of aerosol in the Nam Co region, Tibetan Plateau, during summer monsoon season, Atmos. Environ., 41, 1180–1187, 2007.
Cong, Z., Kawamura, K., Kang, S., and Fu, P.: Penetration of biomass-burning emissions from South Asia through the Himalayas: new insights from atmospheric organic acids, Sci. Rep., 5, 9580, 2015.
Davies, D., Kumar, S., and Descloitres, J.: Global Fire Monitoring Use of MODIS Near-real-time Satellite Data, GIM INT., 18, 41–43, 2004.
Dou, H., Wang, S., Wang, L., Zhang, L., and Hao, J.: Characteristics of total gaseous mercury concentrations at a rural site of Yangtze Delta, China, Huan jing ke xue= Huanjing kexue, 34, 1–7, 2013.
de Foy, B., Wiedinmyer, C., and Schauer, J. J.: Estimation of mercury emissions from forest fires, lakes, regional and local sources using measurements in Milwaukee and an inverse method, Atmos. Chem. Phys., 12, 8993–9011, https://doi.org/10.5194/acp-12-8993-2012, 2012.
de Foy, B., Lu, Z., and Streets, D. G.: Impacts of control strategies, the great recession and weekday variations on NO2 columns above North American cities, Atmos. Environ., 138, 74–86, 2016a.
de Foy, B., Tong, Y., Yin, X., Zhang, W., Kang, S., Zhang, Q., Zhang, G., Wang, X., and Schauer, J. J.: First field-based atmospheric observation of the reduction of reactive mercury driven by sunlight, Atmos. Environ., 134, 27–39, 2016b.
de Foy, B., Lu, Z., and Streets, D. G.: Satellite NO2 retrievals suggest China has exceeded its NOx reduction goals from the twelfth Five-Year Plan, Sci. Rep., 6, 35912, 2016c.
de Foy, B.: City-level variations in NOx emissions derived from hourly monitoring data in Chicago, Atmos. Environ., 176, 128–139, 2017.
Denzler, B., Bogdal, C., Henne, S., Obrist, D., Steinbacher, M., and Hungerbühler, K.: Inversion Approach to Validate Mercury Emissions Based on Background Air Monitoring at the High Altitude Research Station Jungfraujoch (3580 m), Environ. Scie. Technol., 51, 2846–2853, 2017.
Draxler, R. R. and Rolph, G.: HYSPLIT (HYbrid Single-Particle Lagrangian Integrated Trajectory) model access via NOAA ARL READY website, available at: http://www.arl.noaa.gov/ready/hysplit4.html (last access: October 2017), NOAA Air Resources Laboratory, Silver Spring, Md, 2003.
Ebinghaus, R., Kock, H., Coggins, A., Spain, T., Jennings, S., and, Temme, C.: Long-term measurements of atmospheric mercury at Mace Head, Irish west coast, between 1995 and 2001, Atmos. Environ., 36, 5267–5276, 2002.
Feng, X., Shang, L., Wang, S., Tang, S., and Zheng, W.: Temporal variation of total gaseous mercury in the air of Guiyang, China, J. Geophys. Res., 109, D03303, https://doi.org/10.1029/2003JD004159, 2004.
Fu, X., Feng, X., Zhu, W., Wang, S., and Lu, J.: Total gaseous mercury concentrations in ambient air in the eastern slope of Mt. Gongga, South-Eastern fringe of the Tibetan plateau, China, Atmos. Environ., 42, 970–979, 2008.
Fu, X., Feng, X., Wang, S., Rothenberg, S., Shang, L., Li, Z., and Qiu, G.: Temporal and spatial distributions of total gaseous mercury concentrations in ambient air in a mountainous area in southwestern China: Implications for industrial and domestic mercury emissions in remote areas in China, Sci. Total Environ., 407, 2306–2314, 2009.
Fu, X. W., Feng, X., Dong, Z. Q., Yin, R. S., Wang, J. X., Yang, Z. R., and Zhang, H.: Atmospheric gaseous elemental mercury (GEM) concentrations and mercury depositions at a high-altitude mountain peak in south China, Atmos. Chem. Phys., 10, 2425–2437, https://doi.org/10.5194/acp-10-2425-2010, 2010.
Fu, X., Feng, X., Qiu, G., Shang, L., and Zhang, H.: Speciated atmospheric mercury and its potential source in Guiyang, China, Atmos. Environ., 45, 4205–4212, 2011.
Fu, X. W., Feng, X., Liang, P., Deliger, Zhang, H., Ji, J., and Liu, P.: Temporal trend and sources of speciated atmospheric mercury at Waliguan GAW station, Northwestern China, Atmos. Chem. Phys., 12, 1951–1964, https://doi.org/10.5194/acp-12-1951-2012, 2012a.
Fu, X. W., Feng, X., Shang, L. H., Wang, S. F., and Zhang, H.: Two years of measurements of atmospheric total gaseous mercury (TGM) at a remote site in Mt. Changbai area, Northeastern China, Atmos. Chem. Phys., 12, 4215–4226, https://doi.org/10.5194/acp-12-4215-2012, 2012b.
Fu, X. W., Zhang, H., Yu, B., Wang, X., Lin, C.-J., and Feng, X. B.: Observations of atmospheric mercury in China: a critical review, Atmos. Chem. Phys., 15, 9455–9476, https://doi.org/10.5194/acp-15-9455-2015, 2015.
Fu, X., Marusczak, N., Heimbürger, L.-E., Sauvage, B., Gheusi, F., Prestbo, E. M., and Sonke, J. E.: Atmospheric mercury speciation dynamics at the high-altitude Pic du Midi Observatory, southern France, Atmos. Chem. Phys., 16, 5623–5639, https://doi.org/10.5194/acp-16-5623-2016, 2016a.
Fu, X., Zhu, W., Zhang, H., Sommar, J., Yu, B., Yang, X., Wang, X., Lin, C.-J., and Feng, X.: Depletion of atmospheric gaseous elemental mercury by plant uptake at Mt. Changbai, Northeast China, Atmos. Chem. Phys., 16, 12861–12873, https://doi.org/10.5194/acp-16-12861-2016, 2016b.
Gautam, R., Hsu, N. C., Tsay, S. C., Lau, K. M., Holben, B., Bell, S., Smirnov, A., Li, C., Hansell, R., Ji, Q., Payra, S., Aryal, D., Kayastha, R., and Kim, K. M.: Accumulation of aerosols over the Indo-Gangetic plains and southern slopes of the Himalayas: distribution, properties and radiative effects during the 2009 pre-monsoon season, Atmos. Chem. Phys., 11, 12841–12863, https://doi.org/10.5194/acp-11-12841-2011, 2011.
Giglio, L., Descloitres, J., Justice, C. O., and Kaufman, Y. J.: An enhanced contextual fire detection algorithm for MODIS, Remote Sens. Environ., 87, 273–282, 2003.
Goodsite, M. E., Plane, J., and Skov, H.: A theoretical study of the oxidation of Hg0 to HgBr2 in the troposphere, Environ. Sci. Technol., 38, 1772–1776, 2004.
Gou, P., Ye, Q., and Wei, Q.: Lake ice change at the Nam Co Lake on the Tibetan Plateau during 2000–2013 and influencing factors, Progress in Geography, 34, 1241–1249, 2015 (in Chinese with English abstract).
Gratz, L., Esposito, G., Dalla Torre, S., Cofone, F., Pirrone, N., and Sprovieri, F.: First Measurements of Ambient Total Gaseous Mercury (TGM) at the EvK2CNR Pyramid Observatory in Nepal, E3S Web of Conferences, 2013.
Holmes, C. D., Jacob, D. J., Corbitt, E. S., Mao, J., Yang, X., Talbot, R., and Slemr, F.: Global atmospheric model for mercury including oxidation by bromine atoms, Atmos. Chem. Phys., 10, 12037–12057, https://doi.org/10.5194/acp-10-12037-2010, 2010.
Horowitz, H. M., Jacob, D. J., Zhang, Y., Dibble, T. S., Slemr, F., Amos, H. M., Schmidt, J. A., Corbitt, E. S., Marais, E. A., and Sunderland, E. M.: A new mechanism for atmospheric mercury redox chemistry: implications for the global mercury budget, Atmos. Chem. Phys., 17, 6353–6371, https://doi.org/10.5194/acp-17-6353-2017, 2017.
Howard, D. and Edwards, G. C.: Mercury fluxes over an Australian alpine grassland and observation of nocturnal atmospheric mercury depletion events, Atmos. Chem. Phys., 18, 129–142, https://doi.org/10.5194/acp-18-129-2018, 2018.
Huang, J., Kang, S., Zhang, Q., Yan, H., Guo, J., Jenkins, M. G., Zhang, G., and Wang, K.: Wet deposition of mercury at a remote site in the Tibetan Plateau: concentrations, speciation, and fluxes, Atmos. Environ., 62, 540–550, 2012.
Huang, J., Kang, S., Wang, S., Wang, L., Zhang, Q., Guo, J., Wang, K., Zhang, G., and Tripathee, L.: Wet deposition of mercury at Lhasa, the capital city of Tibet, Sci. Total Environ., 447, 123–132, 2013.
Huang, J., Kang, S., Guo, J., Zhang, Q., Cong, Z., Sillanpää, M., Zhang, G., Sun, S., and Tripathee, L.: Atmospheric particulate mercury in Lhasa city, Tibetan Plateau, Atmos. Environ., 142, 433–441, 2016.
Kang, S., Yang, Y., and Zhu, L.: Modern Environmental Process and Changes in the Basin of Nam Co in Tibetan Plateau, China Meteorological Press, Beijing, 2011 (in Chinese with English abstract).
Kang, S., Huang, J., Wang, F., Zhang, Q., Zhang, Y., Li, C., Wang, L., Chen, P., Sharma, C. M., and Li, Q.: Atmospheric mercury depositional chronology reconstructed from lake sediments and ice core in the Himalayas and Tibetan Plateau, Environm. Sci. Technol., 50, 2859–2869, 2016.
Karunasagar, D., Krishna, M. B., Anjaneyulu, Y. A., and Arunachalam, J.: Studies of mercury pollution in a lake due to a thermometer factory situated in a tourist resort: Kodaikkanal, India, Environ. Pollut., 143, 153–158, 2006.
Kim, S. Y.: Continental outflow of polluted air from the US to the North Atlantic and mercury chemical cycling in various atmospheric environments, University of New Hampshire (Natural Resources and Earth Systems Science Program), 2010.
Kock, H., Bieber, E., Ebinghaus, R., Spain, T., and Thees, B.: Comparison of long-term trends and seasonal variations of atmospheric mercury concentrations at the two European coastal monitoring stations Mace Head, Ireland, and Zingst, Germany, Atmos. Environ., 39, 7549–7556, 2005.
Lan, X., Talbot, R., Castro, M., Perry, K., and Luke, W.: Seasonal and diurnal variations of atmospheric mercury across the US determined from AMNet monitoring data, Atmos. Chem. Phys., 12, 10569–10582, https://doi.org/10.5194/acp-12-10569-2012, 2012.
Landis, M. S., Stevens, R. K., Schaedlich, F., and Prestbo, E. M.: Development and characterization of an annular denuder methodology for the measurement of divalent inorganic reactive gaseous mercury in ambient air, Environ. Sci. Technol., 36, 3000–3009, 2002.
Larsen, L., Thomas, C., Eppinga, M., and Coulthard, T.: Exploratory modeling: Extracting causality from complexity, Eos, Trans. Am. Geophys. Union, 95, 285–286, 2014.
Lee, D. S., Dollard, G. J., and Pepler, S.: Gas-phase mercury in the atmosphere of the United Kingdom, Atmos. Environ., 32, 855–864, 1998.
Li, C., Kang, S., Zhang, Q., and Kaspari, S.: Major ionic composition of precipitation in the Nam Co region, Central Tibetan Plateau, Atmos. Res., 85, 351–360, 2007.
Li, C., Bosch, C., Kang, S., Andersson, A., Chen, P., Zhang, Q., Cong, Z., Chen, B., Qin, D., and Gustafsson, Ö.: Sources of black carbon to the Himalayan-Tibetan Plateau glaciers, Nat. Commun., 7, 12574, 2016.
Li, Z., Xia, C., Wang, X., Xiang, Y., and Xie, Z.: Total gaseous mercury in Pearl River Delta region, China during 2008 winter period, Atmos. Environ., 45, 834–838, 2011.
Lin, C.-J. and Pehkonen, S. O.: The chemistry of atmospheric mercury: a review, Atmos. Environ., 33, 2067–2079, 1999.
Lindberg, S. A. and Stratton, W.: Atmospheric mercury speciation: concentrations and behavior of reactive gaseous mercury in ambient air, Environ. Sci. Technol., 32, 49–57, 1998.
Liu, M., Chen, L., Xie, D., Sun, J., He, Q., Cai, L., Gao, Z., and Zhang, Y.: Monsoon-driven transport of atmospheric mercury to the South China Sea from the Chinese mainland and Southeast Asia – Observation of gaseous elemental mercury at a background station in South China, Environ. Sci. Pollut. Res., 23, 21631–21640, 2016.
Liu, N., Qiu, G., Landis, M. S., Feng, X., Fu, X., and Shang, L.: Atmospheric mercury species measured in Guiyang, Guizhou province, southwest China, Atmos. Res., 100, 93–102, 2011.
Liu, Y. W., Xu-Ri, Wang, Y. S., Pan, Y. P., and Piao, S. L.: Wet deposition of atmospheric inorganic nitrogen at five remote sites in the Tibetan Plateau, Atmos. Chem. Phys., 15, 11683–11700, https://doi.org/10.5194/acp-15-11683-2015, 2015.
Ma, Y., Kang, S., Zhu, L., Xu, B., Tian, L., and Yao, T.: ROOF OF THE WORLD: Tibetan observation and research platform: atmosphere-land interaction over a heterogeneous landscape, B. Am. Meteorol. Soc., 89, 1487–1492, 2008.
Mallik, C. and Lal, S.: Seasonal characteristics of SO2, NO2, and CO emissions in and around the Indo-Gangetic Plain, Environ. Monit. Assess., 186, 1295–1310, 2014.
Mukherjee, A. B., Bhattacharya, P., Sarkar, A., and Zevenhoven, R.: Mercury emissions from industrial sources in India and its effects in the environment, in: Mercury Fate and Transport in the Global Atmosphere, Springer, 81–112, 2009.
Müller, D., Wip, D., Warneke, T., Holmes, C. D., Dastoor, A., and Notholt, J.: Sources of atmospheric mercury in the tropics: continuous observations at a coastal site in Suriname, Atmos. Chem. Phys., 12, 7391–7397, https://doi.org/10.5194/acp-12-7391-2012, 2012.
Obrist, D., Tas, E., Peleg, M., Matveev, V., Faïn, X., Asaf, D., and Luria, M.: Bromine-induced oxidation of mercury in the mid-latitude atmosphere, Nat.e Geosci., 4, 22–26, 2011.
Pacyna, E. G., Pacyna, J., Sundseth, K., Munthe, J., Kindbom, K., Wilson, S., Steenhuisen, F., and Maxson, P.: Global emission of mercury to the atmosphere from anthropogenic sources in 2005 and projections to 2020, Atmos. Environ., 44, 2487–2499, 2010.
Parvathi, K., Jayaprakash, K., and Sivakumar, N.: Mercury contamination due to thermometer glass solid waste dumping-a preliminary report, Asian J. Exp. Chem., 5, 46–48, 2010.
Peterson, C., Gustin, M., and Lyman, S.: Atmospheric mercury concentrations and speciation measured from 2004 to 2007 in Reno, Nevada, USA, Atmos. Environ., 43, 4646–4654, 2009.
Pirrone, N., Cinnirella, S., Feng, X., Finkelman, R. B., Friedli, H. R., Leaner, J., Mason, R., Mukherjee, A. B., Stracher, G. B., Streets, D. G., and Telmer, K.: Global mercury emissions to the atmosphere from anthropogenic and natural sources, Atmos. Chem. Phys., 10, 5951–5964, https://doi.org/10.5194/acp-10-5951-2010, 2010.
Polissar, A., Hopke, P., Paatero, P., Kaufmann, Y., Hall, D., Bodhaine, B., Dutton, E., and Harris, J.: The aerosol at Barrow, Alaska: long-term trends and source locations, Atmos. Environ., 33, 2441–2458, 1999.
Rao, S., Zurbenko, I., Neagu, R., Porter, P., Ku, J., and Henry, R.: Space and time scales in ambient ozone data, B. Am. Meteorol. Soc., 78, 2153–2166, 1997.
Schroeder, W. H. and Munthe, J.: Atmospheric mercury – an overview, Atmos. Environ., 32, 809–822, 1998.
Selin, H.: Global environmental law and treaty-making on hazardous substances: the Minamata Convention and mercury abatement, Global Environ. Polit., 14, 1–19, 2014.
Sheng, J., Wang, X., Gong, P., Joswiak, D. R., Tian, L., Yao, T., and Jones, K. C.: Monsoon-driven transport of organochlorine pesticides and polychlorinated biphenyls to the Tibetan Plateau: three year atmospheric monitoring study, Environ. Sci. Technol., 47, 3199–3208, 2013.
Shia, R. L., Seigneur, C., Pai, P., Ko, M., and Sze, N. D.: Global simulation of atmospheric mercury concentrations and deposition fluxes, J. Geophys. Res.-Atmos., 104, 23747–23760, 1999.
Sigler, J. M., Mao, H., and Talbot, R.: Gaseous elemental and reactive mercury in Southern New Hampshire, Atmos. Chem. Phys., 9, 1929–1942, https://doi.org/10.5194/acp-9-1929-2009, 2009.
Slemr, F., Brunke, E.-G., Ebinghaus, R., and Kuss, J.: Worldwide trend of atmospheric mercury since 1995, Atmos. Chem. Phys., 11, 4779–4787, https://doi.org/10.5194/acp-11-4779-2011, 2011.
Slemr, F., Brunke, E. G., Labuschagne, C., and Ebinghaus, R.: Total gaseous mercury concentrations at the Cape Point GAW station and their seasonality, Geophys. Res. Lett., 35, L11807, https://doi.org/10.1029/2008GL033741, 2008.
Sprovieri, F., Pirrone, N., Bencardino, M., D'Amore, F., Carbone, F., Cinnirella, S., Mannarino, V., Landis, M., Ebinghaus, R., Weigelt, A., Brunke, E.-G., Labuschagne, C., Martin, L., Munthe, J., Wängberg, I., Artaxo, P., Morais, F., Barbosa, H. D. M. J., Brito, J., Cairns, W., Barbante, C., Diéguez, M. D. C., Garcia, P. E., Dommergue, A., Angot, H., Magand, O., Skov, H., Horvat, M., Kotnik, J., Read, K. A., Neves, L. M., Gawlik, B. M., Sena, F., Mashyanov, N., Obolkin, V., Wip, D., Feng, X. B., Zhang, H., Fu, X., Ramachandran, R., Cossa, D., Knoery, J., Marusczak, N., Nerentorp, M., and Norstrom, C.: Atmospheric mercury concentrations observed at ground-based monitoring sites globally distributed in the framework of the GMOS network, Atmos. Chem. Phys., 16, 11915–11935, https://doi.org/10.5194/acp-16-11915-2016, 2016.
Stamenkovic, J., Lyman, S., and Gustin, M. S.: Seasonal and diel variation of atmospheric mercury concentrations in the Reno (Nevada, USA) airshed, Atmos. Environ., 41, 6662–6672, 2007.
Streets, D. G., Hao, J., Wu, Y., Jiang, J., Chan, M., Tian, H., and Feng, X.: Anthropogenic mercury emissions in China, Atmos. Environ., 39, 7789–7806, 2005.
Subramanian, V.: Water quality in south Asia, Asian journal of water, Environ. Pollut., 1, 41–54, 2004.
Sun, X., Wang, K., Kang, S., Guo, J., Zhang, G., Huang, J., Cong, Z., Sun, S., and Zhang, Q.: The role of melting alpine glaciers in mercury export and transport: An intensive sampling campaign in the Qugaqie Basin, inland Tibetan Plateau, Environ. Pollut., 220, 936–945, 2017.
Sun, X., Zhang, Q., Kang, S., Guo, J., Li, X., Yu, Z., Zhang, G., Qu, D., Huang, J., and Cong, Z.: Mercury speciation and distribution in a glacierized mountain environment and their relevance to environmental risks in the inland Tibetan Plateau, Sci. Total Environ., 631, 270–278, 2018.
Tong, Y., Yin, X., Lin, H., Wang, H., Deng, C., Chen, L., Li, J., Zhang, W., Schauer, J. J., and Kang, S.: Recent Decline of Atmospheric Mercury Recorded by Androsace tapete on the Tibetan Plateau, Environ. Sci. Technol., 50, 13224–13231, 2016.
Wan, Q., Feng, X., Lu, J., Zheng, W., Song, X., Han, S., and Xu, H.: Atmospheric mercury in Changbai Mountain area, northeastern China I. The seasonal distribution pattern of total gaseous mercury and its potential sources, Environ. Res., 109, 201–206, 2009.
Wan, X., Kang, S., Wang, Y., Xin, J., Liu, B., Guo, Y., Wen, T., Zhang, G., and Cong, Z.: Size distribution of carbonaceous aerosols at a high-altitude site on the central Tibetan Plateau (Nam Co Station, 4730 m asl), Atmos. Res., 153, 155–164, 2015.
Wang, B. and Fan, Z.: Choice of South Asian summer monsoon indices, B. Am. Meteorol. Soc., 80, 629–638, 1999.
Wang, B., Wu, R., and Lau, K.: Interannual variability of the Asian summer monsoon: Contrasts between the Indian and the western North Pacific–East Asian monsoons, J. Climate, 14, 4073–4090, 2001.
Wang, Y., Zhang, X., and Draxler, R. R.: TrajStat: GIS-based software that uses various trajectory statistical analysis methods to identify potential sources from long-term air pollution measurement data, Environ. Modell. Softw., 24, 938–939, 2009.
Wang, Y.: MeteoInfo: GIS software for meteorological data visualization and analysis, Meteorol. Appl., 21, 360–368, 2014.
Wang, Y., Zhang, Y., Schauer, J. J., de Foy, B., Guo, B., and Zhang, Y.: Relative impact of emissions controls and meteorology on air pollution mitigation associated with the Asia-Pacific Economic Cooperation (APEC) conference in Beijing, China, Sci. Total Environ., 571, 1467–1476, 2016.
Wang, Y., de Foy, B., Schauer, J. J., Olson, M. R., Zhang, Y., Li, Z., and Zhang, Y.: Impacts of regional transport on black carbon in Huairou, Beijing, China, Environ. Pollut., 221, 75–84, 2017.
Weiss-Penzias, P., Jaffe, D. A., McClintick, A., Prestbo, E. M., and Landis, M. S.: Gaseous elemental mercury in the marine boundary layer: Evidence for rapid removal in anthropogenic pollution, Environ. Sci. Technol., 37, 3755–3763, 2003.
Wu, Q., Wang, S., Li, G., Liang, S., Lin, C.-J., Wang, Y., Cai, S., Liu, K., and Hao, J.: Temporal Trend and Spatial Distribution of Speciated Atmospheric Mercury Emissions in China During 1978–2014, Environ. Sci. Technol., 50, 13428–13435, 2016.
Wu, Q., Gao, W., Wang, S., and Hao, J.: Updated atmospheric speciated mercury emissions from iron and steel production in China during 2000–2015, Atmos. Chem. Phys., 17, 10423–10433, https://doi.org/10.5194/acp-17-10423-2017, 2017.
Xia, X., Zong, X., Cong, Z., Chen, H., Kang, S., and Wang, P.: Baseline continental aerosol over the central Tibetan plateau and a case study of aerosol transport from South Asia, Atmos. Environ., 45, 7370–7378, 2011.
Xiao, H., Shen, L., Su, Y., Barresi, E., DeJong, M., Hung, H., Lei, Y.-D., Wania, F., Reiner, E. J., and Sverko, E.: Atmospheric concentrations of halogenated flame retardants at two remote locations: The Canadian High Arctic and the Tibetan Plateau, Environ. Pollut., 161, 154–161, 2012.
Xiu, G., Cai, J., Zhang, W., Zhang, D., Büeler, A., Lee, S., Shen, Y., Xu, L., Huang, X., and Zhang, P.: Speciated mercury in size-fractionated particles in Shanghai ambient air, Atmos. Environ., 43, 3145–3154, 2009.
Xu, L., Chen, J., Yang, L., Niu, Z., Tong, L., Yin, L., and Chen, Y.: Characteristics and sources of atmospheric mercury speciation in a coastal city, Xiamen, China, Chemosphere, 119, 530–539, 2015.
Yang, H., Battarbee, R. W., Turner, S. D., Rose, N. L., Derwent, R. G., Wu, G., and Yang, R.: Historical reconstruction of mercury pollution across the Tibetan Plateau using lake sediments, Environ. Sci. Technol., 44, 2918–2924, 2010.
Yatavelli, R. L., Fahrni, J. K., Kim, M., Crist, K. C., Vickers, C. D., Winter, S. E., and Connell, D. P.: Mercury, PM 2.5 and gaseous co-pollutants in the Ohio River Valley region: Preliminary results from the Athens supersite, Atmos. Environ., 40, 6650–6665, 2006.
Yin, X., Kang, S., de Foy, B., Cong, Z., Luo, J., Zhang, L., Ma, Y., Zhang, G., Rupakheti, D., and Zhang, Q.: Surface ozone at Nam Co in the inland Tibetan Plateau: variation, synthesis comparison and regional representativeness, Atmos. Chem. Phys., 17, 11293–11311, https://doi.org/10.5194/acp-17-11293-2017, 2017.
You, Q., Kang, S., Li, C., Li, M., and Liu, J.: Variation features of meteorological elements at Namco Station, Tibetan Plateau, Meteorol. Monthly, 33, 54–60, 2007.
Yu, B., Wang, X., Lin, C. J., Fu, X., Zhang, H., Shang, L., and Feng, X.: Characteristics and potential sources of atmospheric mercury at a subtropical near – coastal site in East China, J. Geophys. Res.-Atmos., 120, 8563–8574, 2015.
Zhang, L., Wang, S. X., Wang, L., and Hao, J. M.: Atmospheric mercury concentration and chemical speciation at a rural site in Beijing, China: implications of mercury emission sources, Atmos. Chem. Phys., 13, 10505–10516, https://doi.org/10.5194/acp-13-10505-2013, 2013.
Zhang, H., Fu, X. W., Lin, C.-J., Wang, X., and Feng, X. B.: Observation and analysis of speciated atmospheric mercury in Shangri-La, Tibetan Plateau, China, Atmos. Chem. Phys., 15, 653–665, https://doi.org/10.5194/acp-15-653-2015, 2015.
Zhang, X., Ming, J., Li, Z., Wang, F., and Zhang, G.: The online measured black carbon aerosol and source orientations in the Nam Co region, Tibet, Environ. Sci. Pollut. Res., 24, 25021–25033, 2017.
Zhang, Y., Jacob, D. J., Horowitz, H. M., Chen, L., Amos, H. M., Krabbenhoft, D. P., Slemr, F., Louis, V. L. S., and Sunderland, E. M.: Observed decrease in atmospheric mercury explained by global decline in anthropogenic emissions, P. Natl. Acad. Sci. USA, 113, 526–531, 2016.


