
the Creative Commons Attribution 4.0 License.
the Creative Commons Attribution 4.0 License.
 | 15 Jul 2026
Aerosol scavenging in DC3 and SEAC4RS deep convective storms
Mary C. Barth
Pedro Campuzano-Jost
Gustavo Cuchiara
Ajay Parottil
Jose L. Jimenez
Miguel Ricardo A. Hilario
Genevieve Rose Lorenzo
Armin Sorooshian
Convective storms frequently occur over the central US during the late spring and summer impacting upper tropospheric composition, which in turn affects the radiative forcing of the climate system. Two important processes in deep convection are vertical transport and removal of trace gases and aerosols by microphysical scavenging. We calculate scavenging efficiencies of speciated aerosol mass concentrations based primarily on aircraft observations from the Deep Convective Clouds and Chemistry (DC3) and the Studies of Emissions, Atmospheric Composition, Clouds and Climate Coupling by Regional Surveys (SEAC4RS) field experiments combined with process-scale modeling. Sulfate and ammonium scavenging efficiencies are generally greater than 75 % for all storms analyzed. Particulate nitrate scavenging efficiencies are moderate (∼ 40 %). In some cases, the particulate nitrate concentrations are larger in the storm outflow region compared to the inflow region. Further analysis shows the roles of entrainment of mid-tropospheric particulate nitrate layers and lightning production of nitrogen oxides in affecting the particulate nitrate outflow concentrations. Organic aerosol scavenging efficiencies are greater than 75 % in severe storms, comparable to sulfate and ammonium, but ∼ 50 % for weak and moderate storms in the southern US where the chemical environment is different than the other storms sampled. Aqueous chemistry is shown to contribute to organic aerosol mass in the outflow regions for the mid-day storms sampled, potentially explaining their lower apparent scavenging efficiencies. These results, which highlight the complex interactions between dynamics, physics, and chemistry in thunderstorms, can be used by chemistry transport models to evaluate convective storm processing of aerosols.
- Article
(4265 KB) - Full-text XML
-
Supplement
(5519 KB) - BibTeX
- EndNote


It is well recognized that atmospheric aerosols play an important role in climate, weather, and air quality (e.g., IPCC, 2021; Seinfeld and Pandis, 2016). Thus, it is important to understand aerosol concentrations and properties, which are determined by the sources and sinks of the different types and sizes of aerosols. Sources of primary aerosols, such as dust, sea salt, primary organic aerosol (POA), and black carbon (BC), are from emissions, while secondary aerosols, such as accumulation mode sulfate (SO), particulate nitrate (pNO3), and organics (SOA), are produced through chemical and physical processes. Although these sources and transport of aerosols have uncertainties associated with them, reducing the uncertainty associated with the wet and dry deposition of aerosols is equally important as these processes control the lifetime of aerosols in the atmosphere (Textor et al., 2006) and by extension aerosol-related effects on radiative forcing and clouds. Global chemistry transport models (CTMs) and chemistry-climate models have shown that aerosol wet deposition is the dominant atmospheric aerosol sink (e.g., Seinfeld and Pandis, 2016). Wet deposition occurs in synoptic-scale weather systems, stratiform clouds, and convective storms. To represent this important sink, regional-scale and global-scale CTMs must reasonably simulate vertical transport and scavenging of aerosols. Of the three types of precipitation systems mentioned, determining vertical transport and scavenging in convective storms is the most challenging for CTMs as they parameterize convective processes on the sub-grid scale. Here, we aim to advance our knowledge on convective cloud processing of aerosols via analysis of measurements taken in the inflow and upper troposphere outflow regions of convective storms.
Deep convective clouds provide an important and efficient mechanism for vertical transport and redistribution of tropospheric particles and trace gases (Dickerson et al., 1987; Yang et al., 2015). The convectively driven vertical transport of aerosols and trace gases from the atmospheric boundary layer (BL) to the upper troposphere can occur on timescales of a few minutes to an hour (Skamarock et al., 2000; Bela et al., 2018) leading to a rapid change in the abundance of aerosols and trace gases transported to the upper troposphere. As the air is lofted in convective updrafts, aerosols and soluble trace gases are incorporated into the cloud particles and removed from the atmosphere via precipitation (Flossmann et al., 1985). The representation of aerosol wet scavenging in CTMs includes nucleation, impaction, and Brownian diffusion scavenging. Nucleation scavenging, also known as cloud-drop activation and in-cloud scavenging, depends on the number of cloud condensation nuclei and supersaturation of the air (Jensen and Charlson, 1984). The conversion of cloud water to precipitating hydrometeors (rain, snow, and graupel) moves the aerosols from the cloud drops to falling precipitation resulting in wet deposition (Seinfeld and Pandis, 2016). Many global and regional-scale CTMs represent this removal mechanism in two steps, first representing the cloud drop activation and tracking aerosols in cloud water, and second computing the conversion rate of aerosols in cloud water to precipitation (e.g., Abdul-Razzak and Ghan, 2000). In cases like convection, cloud drop activation on aerosols entrained into the storm above cloud base occurs. Impaction scavenging is the collection of aerosols by falling precipitation and is represented by either the continuous collection equation or by a scavenging coefficient (Seinfeld and Pandis, 2016; Croft et al., 2009). Impaction scavenging is sometimes termed below-cloud scavenging in the scientific literature. Brownian diffusion also occurs between cloud particles and aerosols but is often small compared to nucleation and impaction scavenging (Flossmann et al., 1985). Aerosol wet scavenging schemes must also represent the evaporation of precipitation and therefore the transfer of aerosol components within cloud hydrometeors back to particles in the gaseous atmosphere (Seinfeld and Pandis, 2016; Mitra et al., 1992). Note that wet deposition to the surface, and conversely the concentrations of aerosols transported into the upper troposphere, are a result of all the processes occurring within deep convection (e.g., scavenging, gas and aqueous-phase chemistry, lightning production of nitrogen oxides). This paper will discuss the potential impact of these other processes on the results reported.
Aerosol wet scavenging is sensitive to the approaches used to represent this process and the grid resolution used in models. Gong et al. (2011) showed that particulate matter (PM) concentrations are strongly affected by the choice of aerosol activation schemes and moderately affected by the choice of scavenging coefficients for below-cloud scavenging of aerosols. On the other hand, Jones et al. (2022) found that the choice of below-cloud scavenging schemes caused substantial changes in accumulation-mode dust lifetime (from 5.4 to 44 d). Schill et al. (2020) suggested that hydrophobic aerosol can be removed within a cloud via impaction scavenging, which improves model-measurement agreement of aerosol concentrations. Yu et al. (2019) also found improved model-measurement agreement when cloud drop activation on aerosols entrained into convection above cloud base was included in their CTM aerosol wet scavenging scheme. The uncertainties associated with aerosol scavenging also depend on how accurately cloud and convective physical and dynamical processes are represented in models, indicating a need for additional analysis of the role of this important sink in global and regional-scale models.
Aqueous-phase chemistry in cloud and rain drops can also increase aerosol mass concentrations (Hegg and Hobbs, 1981, 1982; Ervens et al., 2011). Conversion of aqueous-phase sulfur dioxide (SO2) forms SO, enhancing its mass concentration (Seinfeld and Pandis, 2016). As SO production affects the drop acidity, NH and pNO3 concentrations in cloud water can change in response to the acidity change (Zheng et al., 2023). Further, pNO3 and NH concentrations within the cloud drops can increase from dissolution and subsequent dissociation of nitric acid (HNO3) or organic nitrate gases and ammonia (NH3). Formation in cloud water of SOA from aqueous oxidation of aldehydes and carboxylic acids and from aqueous epoxide chemistry is less well characterized because of the non-linear organic aqueous chemistry (e.g., McNeill, 2015; Tsui et al., 2019; Ervens et al., 2011; Blando and Turpin, 2000).
Previous studies have estimated aerosol wet scavenging efficiencies in various types of clouds. Since nucleation (or in-cloud) scavenging is often the dominant scavenging process (Ohata et al., 2016), comparisons of aerosol concentrations measured in the interstitial cloud air to those measured before a cloud or fog event or in the inflow region can be used to estimate scavenging (e.g., Noone et al., 1992). Similarly, comparisons of cloud water residual with interstitial aerosol concentrations can be used. Analyses of aerosol concentrations in the inflow and outflow regions of clouds have also estimated aerosol scavenging efficiencies (Hegg et al., 1984; Yang et al., 2015; Hilario et al., 2025). The scavenging efficiencies for aerosol SO, NH, and pNO3 generally ranged from 55 %–85 %. Organic aerosol scavenging efficiencies have been estimated only recently (Yang et al., 2015; Hilario et al., 2025). Yang et al. (2015) found 80 %–84 % scavenging for organic aerosols by a severe thunderstorm in Oklahoma, while Hilario et al. (2025) found 53 %–60 % scavenging in shallow to moderate marine tropical convection near the Philippines. These previous studies each focused on a limited number of one to three case studies. Extending the analysis to several more convective storms as performed in this study should provide a more robust quantification of aerosol scavenging.
In this paper we quantify vertical transport and scavenging of aerosols through analysis of ten deep convective storms sampled over the central United States. The analysis uses a variety of measurements primarily obtained aboard the NASA DC-8 aircraft but also includes ground-based radar data and radiosonde data. These data are detailed in Sect. 2. We next describe the analysis method, which employs an entrainment model (Sect. 3). The cases investigated, described in Sect. 4, span a range of convective types from severe convection to moderate and airmass storms. Before presenting estimates of scavenging efficiencies, we discuss the vertical profiles in clear air for the cases studied (Sect. 5), as they are a key component for the scavenging efficiency calculation. In the Results section, we show the scavenging efficiencies derived for each case for SO, NH, pNO3, and organic aerosol (OA). We discuss reasons for the lower pNO3 scavenging efficiencies, including the role of particulate organic nitrates, a mid-troposphere pNO3 layer that is not as pronounced for SO or NH, and lightning-generated nitrogen oxides (NOx= NO + NO2) forming HNO3 and its subsequent partitioning onto aerosols in the upper troposphere convective outflow region. We also explore whether aqueous phase chemistry affects the OA scavenging efficiencies in the Southeast United States.
Measurements are analyzed from the NSF/NASA Deep Convective Clouds and Chemistry (DC3; Barth et al., 2015) and the NASA Studies of Emissions and Atmospheric Composition, Clouds and Climate Coupling by Regional Surveys (SEAC4RS; Toon et al., 2016) field experiments. The DC3 field campaign investigated the impact of deep, mid-latitude continental convective clouds, including their dynamical, physical, and lightning processes, on upper tropospheric composition and chemistry (Barth et al., 2015). The DC3 field campaign sampled storms in northeast Colorado and southwest Nebraska, central Oklahoma, and northern Alabama as well as a mesoscale convective system (MCS) occurring in the Missouri-Arkansas-Mississippi area. The campaign utilized two aircraft platforms (NASA DC-8 and NSF/NCAR GV) to sample inflow, outflow, and clear sky composition as well as extensive ground-based observations to characterize the morphology, kinematics, and lightning activity of the storms. For this analysis, composition measurements from only the NASA DC-8 are analyzed as this aircraft hosted several instruments measuring the concentrations and properties of aerosols.
The SEAC4RS campaign (Toon et al., 2016) included the goal of determining how pollutant emissions are redistributed via deep convection throughout the troposphere to understand how vertical transport modifies upper troposphere chemistry and composition. To achieve this goal, the NASA DC-8 sampled the inflow region and near-cloud-top region of convective storms occurring over the southern United States. The NASA DC-8 instruments used in this analysis are the same for both the SEAC4RS and DC3 field campaigns.
2.1 Aircraft measurements
The NASA DC-8 aircraft measurements used in the aerosol scavenging analysis (Table S1, which also includes acronym definitions) include passive trace gases, such as carbon monoxide (CO; DACOM instrument, Sachse et al., 1987), carbon dioxide (CO2; AVOCET instrument, Vay et al., 2011), n-, i-butane and n-, i-pentane, and other alkanes and alkenes (PTR-MS and WAS instruments, de Gouw and Warneke, 2007; Simpson et al., 2011), to determine both the connectivity between the BL and outflow air masses (using i- to n-ratios of butane and pentane isomers) and the entrainment rate for the storm (Fried et al., 2016; Barth et al., 2016; Cuchiara et al., 2020). The wind components, temperature, pressure, and GPS altitude (MMS instrument, Chan et al., 1998) are used to provide environmental information for the analysis. Liquid or ice water content (FCDP and 2D-S instruments, Lawson, 2011) is used to determine when the DC-8 was in or out of cloud. Nitric acid (HNO3; CIT-CIMS instrument, Crounse et al., 2006) is used for examining total inorganic nitrate scavenging. While SO2 was also examined, its measured values in the outflow or upper troposphere clear sky were reported as missing values for the cases studied, preventing any calculations of total sulfur scavenging. More information on the use of these data is given in Barth et al. (2016) and Cuchiara et al. (2020).
In describing each storm case, several trace gases and aerosols were used to characterize the BL chemical environment. Isoprene and toluene (PTR-MS and WAS instruments) characterized the influence of biogenic and anthropogenic sources on the BL composition. The dry aerosol extinction (from the Langley Aerosol Research Group Experiment TSI 3563 integrating nephelometer, Wagner et al., 2015) for accumulation and coarse aerosols characterized the aerosol abundance (Barth et al., 2015) in the BL, while the OA fraction of particulate matter at < 1 µm in size (PM1) gave information on the composition of the aerosols. PM1 is calculated as the sum of the aerosol mass spectrometer (AMS, DeCarlo et al., 2006; Guo et al., 2021) aerosol concentrations plus the HD-SP2 BC concentration (Schwarz et al., 2013). Other trace gases were used to remove influences from the stratosphere or biomass burning. The CO to ozone (O3; CSD CL instrument, Ryerson et al., 2000; Pollack et al., 2011) ratios were used to filter out stratospheric influence. The influence of biomass burning air masses was removed (or included) based on concentrations of hydrogen cyanide (HCN; CIT-CIMS, Crounse et al., 2006) and acetonitrile (CH3CN; PTR-MS). Aerosol number concentrations (SMPS instrument, Wang and Flagan, 1990), hydroxyl radical (OH; ATHOS instrument, Faloona et al., 2004), and peroxynitrates (MPN, ANs, PNs; TD-LIF instrument, Nault et al., 2015) were also examined for a few specific storm cases.
Aerosol mass concentrations of SO, NH, pNO3, and OA reported by the University of Colorado aircraft AMS (Canagaratna et al., 2007; DeCarlo et al., 2006) are analyzed in this work to derive scavenging efficiencies. The AMS chloride measurements are not discussed here because the chloride concentrations were negligible compared to the other AMS constituents measured and often at or below the detection limit. The 1σ uncertainty (accuracy, not precision) in the AMS measurements is 17 % of the measurement value for the inorganics and 19 % for organic aerosol (Bahreini et al, 2009). AMS 1 Hz detection limits during DC3 were generally in line with the ones reported for the same instrument in Guo et al. (2021) despite significant differences in the data acquisition setup, while for SEAC4RS they were about two times higher, mostly due to the much more polluted conditions during that campaign. These detection limits were rigorously propagated for each storm sampling and data were flagged when average concentrations were below these detection limits, resulting in 100 % scavenging efficiencies for those cases. This treatment had almost no impact on the DC3 cases discussed here, but limited the analysis of some SEAC4RS storm samplings since the outflow intercept time periods were generally short (< 1 min). Examination of the DC3 data showed that the AMS was insensitive to most artifacts associated with ice particle shattering when there was sufficient signal-to-noise (Yang et al., 2015). While the AMS samples PM1 (see Guo et al., 2021 for a detailed description of PM1 for these campaigns), the scavenging efficiencies determined here should be representative for all accumulation mode aerosols as the convective clouds have high supersaturations that should activate hygroscopic aerosols at sizes < 1 µm.
The consistency of the AMS measurements with co-located measurements of aerosol properties on the DC8 has been described in previous work (Liu et al., 2017). For the DC3 campaign, during which most of the storms analyzed in this paper were sampled, we find good agreement not only the campaign-wide comparisons of AMS reported species with other inorganic acid concentrations, but also comparisons of aerosol extinction and aerosol volume (Fig. S1–4). In combination, the aerosol sensors show a consistent aerosol dataset with high correlations and slopes, with the exception of the absolute magnitude of the reported physical volume from the UHSAS instrument, which likely has a 40 % low bias (Fig. S1). The agreement among instruments is found at all altitudes of the atmosphere (Fig. S2) and in the storm inflow and outflow regions (Fig. S3), where disagreements in outflow regions are likely due to the 5–10 min sample collection time of the filter measurements during which background upper troposphere air is collected with the convective outflow air. Comparisons of NH, pNO3, and inorganic nitrates are less robust but are still consistent with each other (Fig. S4).
The AMS-reported pNO3 includes both organic (pRONO2) and inorganic (NO) nitrates (Day et al., 2022; Farmer et al., 2010). In this paper, we report separate efficiencies for both nitrate forms for cases where pRONO2 or NO in both inflow and outflow were above the detection limit. While AMS-reported SO can suffer from similar organic interferences (Schueneman et al., 2021; Chen et al., 2019) that are harder to quantify, SO scavenging efficiencies reported here should be considered for inorganic SO only based on the agreement of the AMS with the SAGA MC-IC instrument (Dibb et al., 2003). The AMS data have been reprocessed for this work to incorporate processing refinements used in the analysis of more recent aircraft campaigns. This includes some features critical for this work, such as additional zero corrections and a refined pRONO2 apportionment.
2.2 Thermodynamic calculations with E-AIM
Significant aerosol acidity gradients typically exist between the BL, the free troposphere and convective outflow (Nault et al., 2021). This can impact the partitioning of NH and NO between the gas and the aerosol phase (Guo et al., 2016; Pye et al., 2020) and hence cause uncertainties in convective transport efficiencies if one assumes a non-volatile aerosol (Yang et al., 2015). To quantify these possible biases, aerosol pH and nitrate partitioning factors are calculated using the E-AIM Model IV (Clegg et al., 1998; Friese and Ebel, 2010) for the AMS aerosol data (using only apportioned NO) and gas-phase HNO3 from the CIT-CIMS instrument, respectively, using the AMATI (Ambient Aerosol Thermodynamic calculator in Igor) package (Campuzano-Jost et al., 2021). Since no in-situ NH3 data are available for either DC3 or SEAC4RS, the same iterative approach as in Nault et al. (2021) was used to estimate NH3 from the other inputs. This approach works well in acidic environments where HNO3 partitioning is mostly controlling the pH (Pye et al., 2020; Li et al., 2024), which applies to most of the data reported here. Only the inorganic nitrate aerosol fractions NO (NO HNO3) in DC3 convective outflow regions are discussed in the results, as SO and NH are not volatile (Seinfeld and Pandis, 2016).
2.3 Ground-based measurements
For both DC3 and SEAC4RS, the National Weather Service (NWS) Next Generation Weather Radar (NEXRAD) reflectivity is used in the analysis. The S-band data from multiple radars are composited into a 3 d product following the gridded NEXRAD algorithm (GridRad v3.1) described by Homeyer and Bowman (2017). Measurements of radar reflectivity are used to identify time periods when the aircraft was in the inflow and outflow regions of the storm. The NEXRAD data also provide storm characteristics, such as the maximum radar reflectivity in a column and storm height of the 20 dBZ level.
Radiosondes are analyzed to obtain information on the thermodynamic environment of the storm. During DC3, radiosondes were launched near the storms from mobile facilities, including the NCAR Mobile Integrated Sounding System for Colorado storms and the NOAA/NSSL mobile sounding system. One DC3 case also utilized the NWS operational radiosonde. For SEAC4RS, the NWS operational radiosondes are used as well as analysis of DC-8 aircraft vertical profiles in clear air near the storms.
The observational analysis for determining scavenging efficiency is a multistep process using an entrainment model that simply represents the mixing of an air parcel with the environment as it is lofted from cloud base to cloud top. This methodology extends the work of Cohan et al. (1999), Borbon et al. (2012), and Yang et al. (2015) from a two-, three-, and four-layer entrainment model approach, respectively, to a 7–10-layer (depending on the height of the storm) entrainment model that uses background air vertical profiles with improved vertical resolution. By having 1 km altitude bins, changes in the vertical distributions of the passive trace gas and aerosol species are better represented.
By sampling the composition of the air in the storm inflow, background free troposphere, and storm outflow regions (Fig. 1), entrainment rate can be estimated using passive trace gases that are insoluble and whose chemical lifetime is much longer than the transport time from cloud base to outflow sampling region. Mathematically, the entrainment rate α (fraction km−1) of background free troposphere air can be determined from
where C is the mixing ratio at altitude bin k of the passive trace gas being lifted from cloud base (k=1) to cloud top (k=N), and CFT is the passive trace gas mixing ratio in the free troposphere and varies with altitude. The values of k at the cloud base and top depend on the storm sampled. Cloud bases are 1.7–2.0 km MSL for Colorado storms, 1.0–1.3 km MSL for Oklahoma storms, and < 1.0 km MSL for SEAC4RS storms. The initial concentration (C0) is the average mixing ratio or concentration during the predefined inflow time period (Table S2) when the aircraft was flying near cloud base and wind flow was toward the storm. Outflow heights are typically 10–12 km MSL, but two cases had outflow heights at ∼ 8 km MSL (Table S2). In some cases, the outflow measurement is taken downwind from the top of the updraft but within the storm anvil because the aircraft did not fly into the cloud top for safety reasons. The entrainment rate can be found through an iterative process by integrating the equation, every 1 km, from cloud base to cloud top. When the cloud-top mixing ratio (Ctop) of the passive trace gas determined by the equation equals the aircraft-measured cloud-top passive trace gas mixing ratio (Cmeas), the entrainment rate is found. Information on the choice of the passive trace gases used to find the entrainment rate is given in the supplementary material (Sect. S1; Table S3) and the previous studies that originally derived the entrainment rates (Barth et al., 2016; Fried et al., 2016; Cuchiara et al., 2020, 2023). Using the same analysis scripts by Barth et al. (2016), n-butane, i-butane, n-pentane, and i-pentane are used as the passive trace gases for most DC3 storms. These non-methane hydrocarbons have similarly shaped vertical profiles (described in Sect. 6), which give consistent estimates of entrainment rate. The average entrainment rate derived from the four non-methane hydrocarbons is used to calculate the scavenging efficiency. For the 2 June 2012 case, CO is used as the passive trace gas. For the SEAC4RS storms, the passive trace gases employed are from Cuchiara et al. (2020) and Cuchiara et al. (2023). CO and CO2 are the passive trace gases for the 2 September 2013 storms, while CO2 is the passive trace gas for the 18 September 2013 land convection and a tracer calculation using the Weather Research and Forecasting (WRF) model is used for the 18 September 2013 marine convection (Cuchiara et al., 2023). We found that there is no systematic difference in entrainment rates when different trace gases are used. Table S3 shows that entrainment rates are 4 % km−1–15 % km−1 using the alkanes and are 8 % km−1–11 % km−1 using CO and CO2 as the passive, insoluble trace gas.
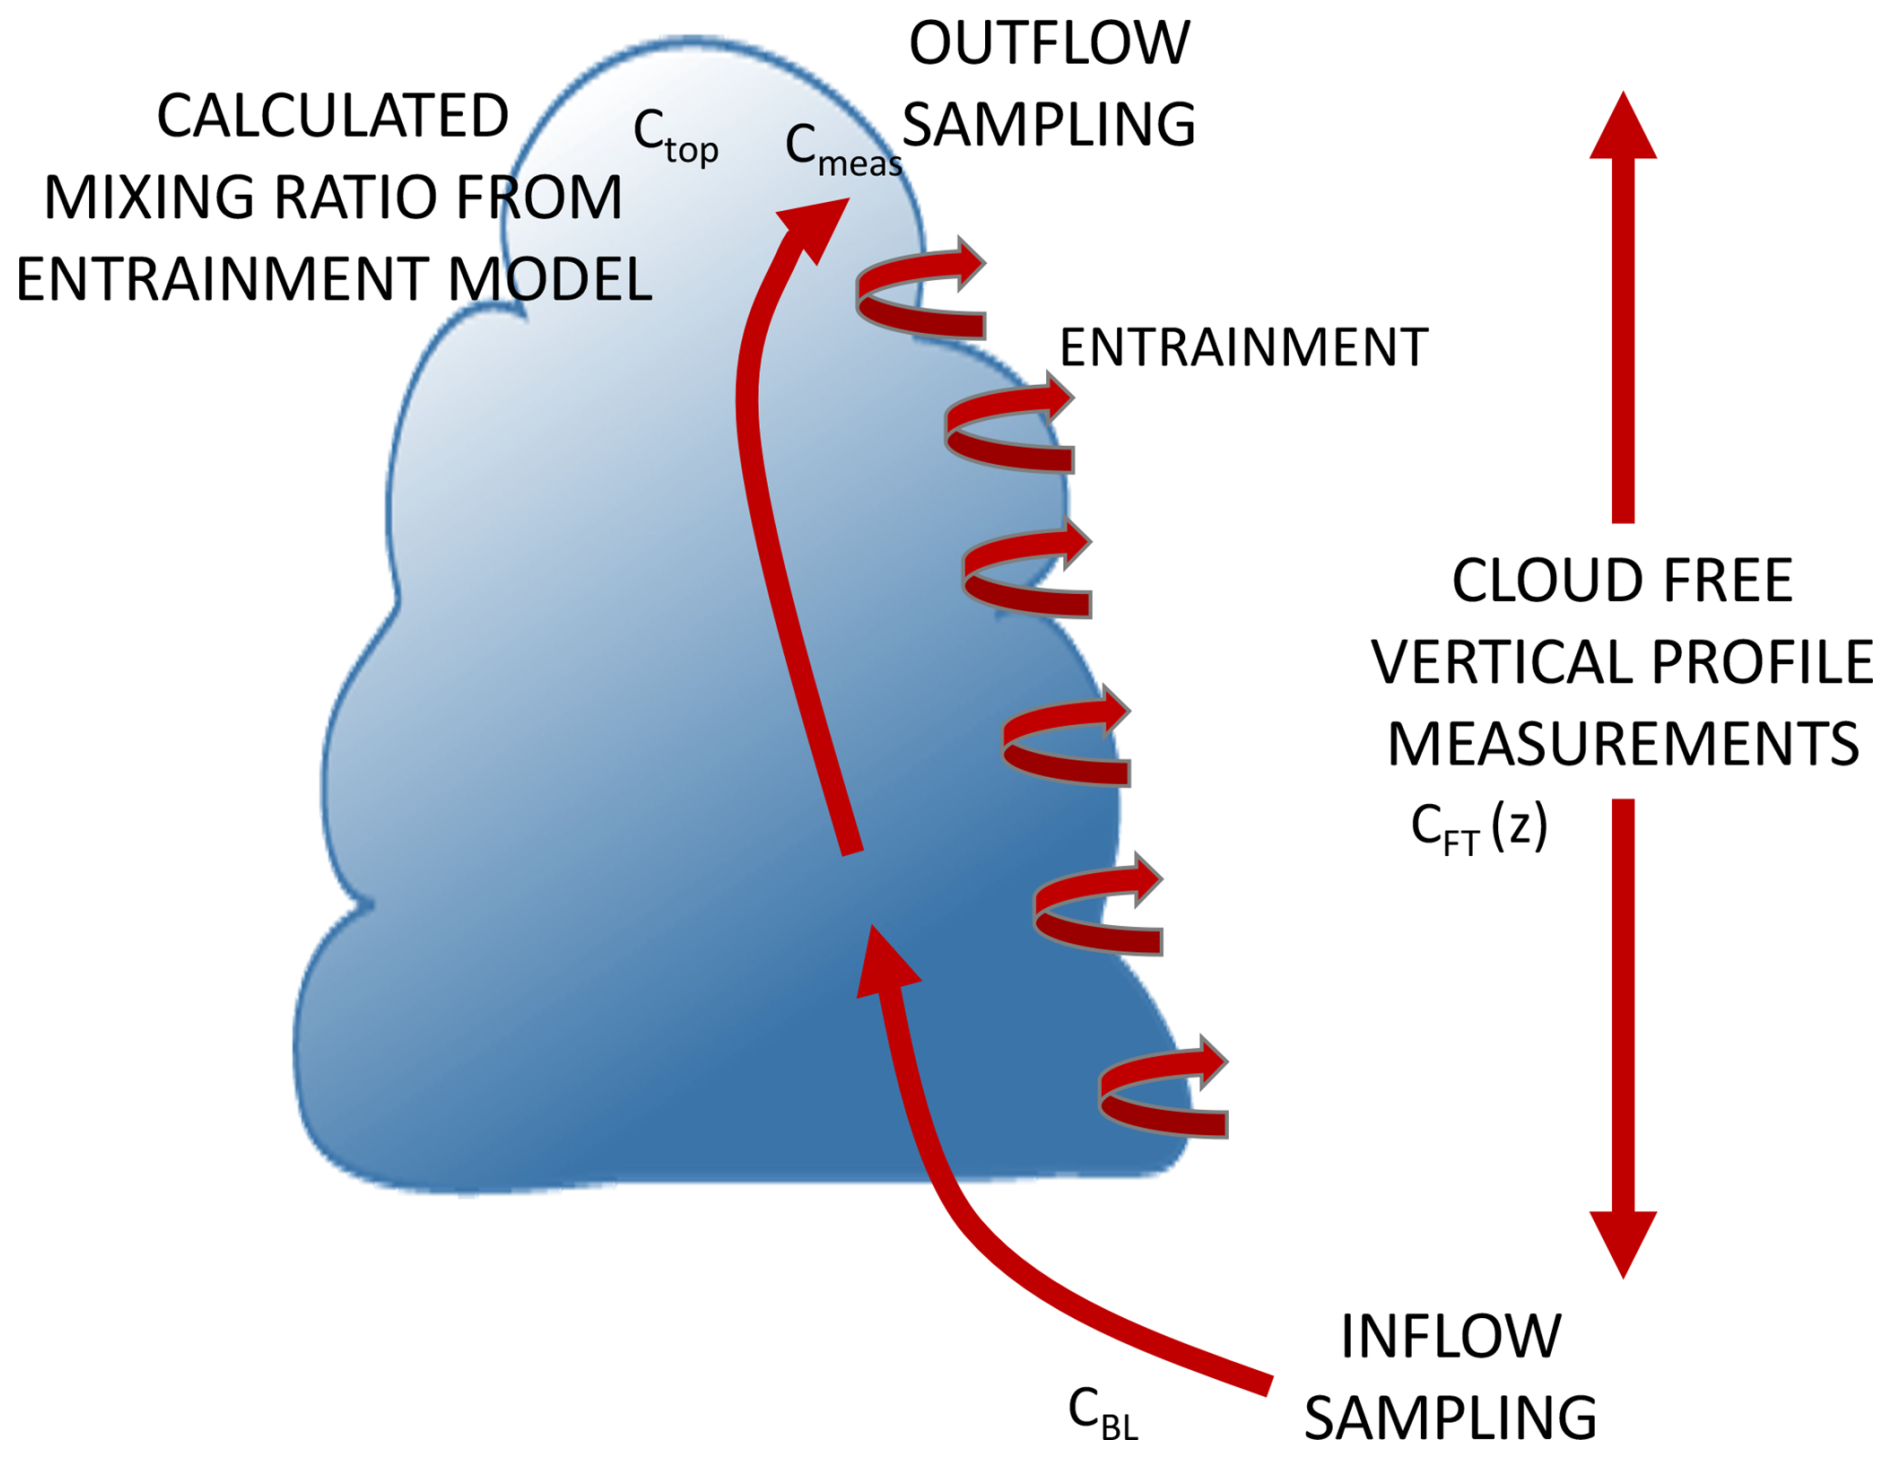
Figure 1Schematic of airflow in a convective storm and sampling regions of the aircraft measurements to illustrate how the entrainment rate calculation is determined. CBL, CFT(z), and Cmeas are aircraft sampled mixing ratios in the boundary layer, free troposphere, and upper troposphere outflow, respectively. Ctop is the cloud top mixing ratio calculated by the entrainment model. The turbulence in the convection creates mixing throughout the width of the cloud.
Using the calculated entrainment rate (Table S3), the same equation can be applied to each aerosol species, Y, to determine their concentrations at the cloud top if only transport and entrainment affected the concentration. The scavenging efficiency (SE, %) of the aerosol species is determined by simply subtracting the measured concentration of the aerosol species (Ymeas) from the calculated cloud-top aerosol concentration (Ytop) determined by the entrainment model and dividing by the calculated cloud-top value (Ytop):
The inflow and outflow time periods, listed in Table S2, were identified previously by Barth et al. (2016) and Cuchiara et al. (2020, 2023). The inflow and outflow regions are identified from flight segments in proximity to the radar reflectivity data. For the inflow region, the aircraft horizontal wind direction is used to confirm that sampled BL air is flowing towards the storm, while outflow time periods are determined by the horizontal winds, chemical signatures of hydrocarbons and CO, and ice water content (IWC). Concentrations of SO, NH, pNO3, and OA measured by the AMS in the inflow and outflow regions are provided in Table S4. To ensure that the inflow and outflow time periods are connected, our previous work (Barth et al., 2016; Fried et al., 2016; Cuchiara et al., 2020; Cuchiara et al., 2023) used ratios of i- to n-butane and i- to n-pentane to confirm that the ratios did not change substantially.
The clear air vertical profiles are found by filtering the aircraft data to liquid plus ice water content < 0.001 g kg−1, O3 CO < 1.25 (to remove stratospheric air mixing into the troposphere), and a latitude-longitude region near the storm. In some storm cases, a time period is also specified to ensure the background air was near the storm of interest or remove impacts of smoke plumes also sampled by the plane but not ingested by the storm.
This observational analysis methodology has successfully been used in our previous studies (Barth et al., 2016; Fried et al., 2016; Cuchiara et al., 2020, 2023), but for determining scavenging efficiencies of formaldehyde, hydrogen peroxide, and methyl hydrogen peroxide. Uncertainties in this approach for calculating scavenging efficiencies arise when other processes affect the aerosol concentration. Production of sulfate and oxalate via aqueous-phase chemistry can lead to higher sulfate and organic aerosol mass concentrations in the outflow region resulting in a lower scavenging efficiency estimate. Production of NOx from lightning will subsequently form HNO3 that partitions onto the aerosols, increasing NO aerosol mass concentrations in the outflow region and reducing NO and pNO3 scavenging efficiency estimates. In addition, the entrainment model relies on vertical profiles of the background air to have a similar shape as that of the passive tracer used to determine the entrainment rate. If the aerosol vertical profile exhibits an anomalous enhancement in the mid to upper troposphere, then the aerosol scavenging efficiency estimate can be reduced because of entraining higher aerosol concentrations. When presenting the scavenging efficiency results below, these other processes are discussed.
A prescribed cloud parcel model with gas and aqueous phase chemistry, described in Cuchiara et al. (2020), is used to examine the potential role of other processes on trace gas mixing ratios at cloud top. The cloud chemistry parcel model calculations focus only on the chemical transformations and do not interact with the entrainment model described above. Thus, the cloud chemistry parcel model calculations provide an indication of how much trace gas mixing ratios are altered, which, in turn, affect the aerosol concentrations in the convective outflow and the estimated aerosol scavenging efficiencies. The simulation and analyses are performed for only the 2 September 2013 SEAC4RS case (Cuchiara et al., 2020), for which additional information from a WRF-chem simulation can be used. The parcel model uses prescribed liquid water content, temperature, and air density that are taken from a WRF-Chem simulation (Cuchiara et al., 2020). The parcel model simulation begins at 15:00 local time and at an altitude of 1.2 km mean sea level (MSL; p=883 hPa, T=295.8 K) and spins up the gas-phase chemistry at this location for a 10-minute period so that short-lived oxidants (e.g., OH and HO2) have typical concentrations. The parcel is then lofted at a constant vertical velocity until 11.5 km MSL. Initial gas-phase mixing ratios are taken from the observed 2 September 2013 BL mixing ratios (Cuchiara et al., 2020) or from WRF-Chem predicted values when observations are not available. A constant “lightning-generated” emission source of NO is applied between 262.15 and 233.15 K so that ∼ 1 ppbv NOx is produced at cloud top, matching the 0.8–1.2 ppbv average enhanced NOx sampled for this storm. The parcel model is run with two different assumed lightning-produced NO (LNO) emission profiles. For a constant updraft of 5 and 2 m s−1, LNO emissions are set to 15 and 8 pptv per 10 s time step, respectively. The gas and aqueous chemistry in the parcel model (Li et al., 2017; Barth et al., 2021) reasonably represents organic acid formation compared to other cloud chemistry models for a relatively clean rural location (Barth et al., 2021). The chemistry mechanism does not include any gas-phase production of organic acids, only aqueous-phase chemistry involving oxidation of dissolved aldehydes by OH. While formic acid (HCOOH) and acetic acid (CH3COOH) have initial gas-phase mixing ratios of 565 and 224 pptv, respectively, the other organic acids (acetic acid, glycolic acid, glyoxylic acid, pyruvic acid, and oxalic acid) are zero at the initial time.
As noted in Sect. 3, analyses of several storms observed during DC3 and SEAC4RS have already been performed for trace gas wet removal (Barth et al., 2016; Fried et al., 2016; Bela et al., 2016, 2018; Cuchiara et al., 2020, 2023). Here and in the supplement, we summarize the characteristics of these storms per these previous studies, to provide a sense of the range of conditions and variability of the storms studied. Scavenging efficiencies are calculated for four storms in the northeast Colorado – southwest Nebraska region and two storms in Oklahoma during DC3 (Table 1; Sect. S2). For SEAC4RS, the analysis is performed for two storms sampled in Mississippi on 2 September 2013 and two storms sampled on 18 September 2013, one over the Gulf of Mexico and the other south of San Antonio, Texas. The storm near San Antonio had two convective cores sampled and therefore two scavenging efficiencies are reported for this storm. The storms differ in type, ranging from airmass to multicell to severe supercell storms. The maximum column radar reflectivity (Fig. S5) during the outflow time periods gives a sense of the storm severity along with the maximum height of the 20 dBZ reflectivity and the severe weather threat (SWEAT) index (Table 1). The SWEAT index, which combines low-level moisture, instability, wind speeds, and warm air advection using values at 850 hPa and 500 hPa, is often used by weather forecasters to predict the potential for severe storms (NWS, 2015). A SWEAT index > 300 indicates the potential for severe convection that could cause damaging winds and hail, while a SWEAT index > 400 indicates the potential for tornado formation. The SWEAT Index for each storm is calculated from radiosonde data or aircraft data. For DC3 storms, the sondes launched near the time and location of the storm as part of the field campaign are used for all cases except for 18 May 2012, which used the North Platte, Nebraska 00:00 UTC 19 May 2012 radiosonde that was launched and located near the sampled storm. For the SEAC4RS cases, aircraft vertical profiles in the storm vicinities are analyzed to determine the SWEAT index because the NWS routine radiosondes occurred several hours before the storms formed. The convective available potential energy (CAPE) and depth of the warm cloud (defined as height of the freezing level minus the height of cloud base) also varied with each storm (Table 1). Storm characteristics, anthropogenic and biogenic volatile organic compound (VOC) BL signatures, BL OA fraction (f(OA)), and aerosol dry extinction measured at 532 nm wavelength of these cases are summarized in the supplement (Sect. S2) for each case (Barth et al., 2015).
Table 1Storm cases analyzed for aerosol mass concentration wet scavenging.
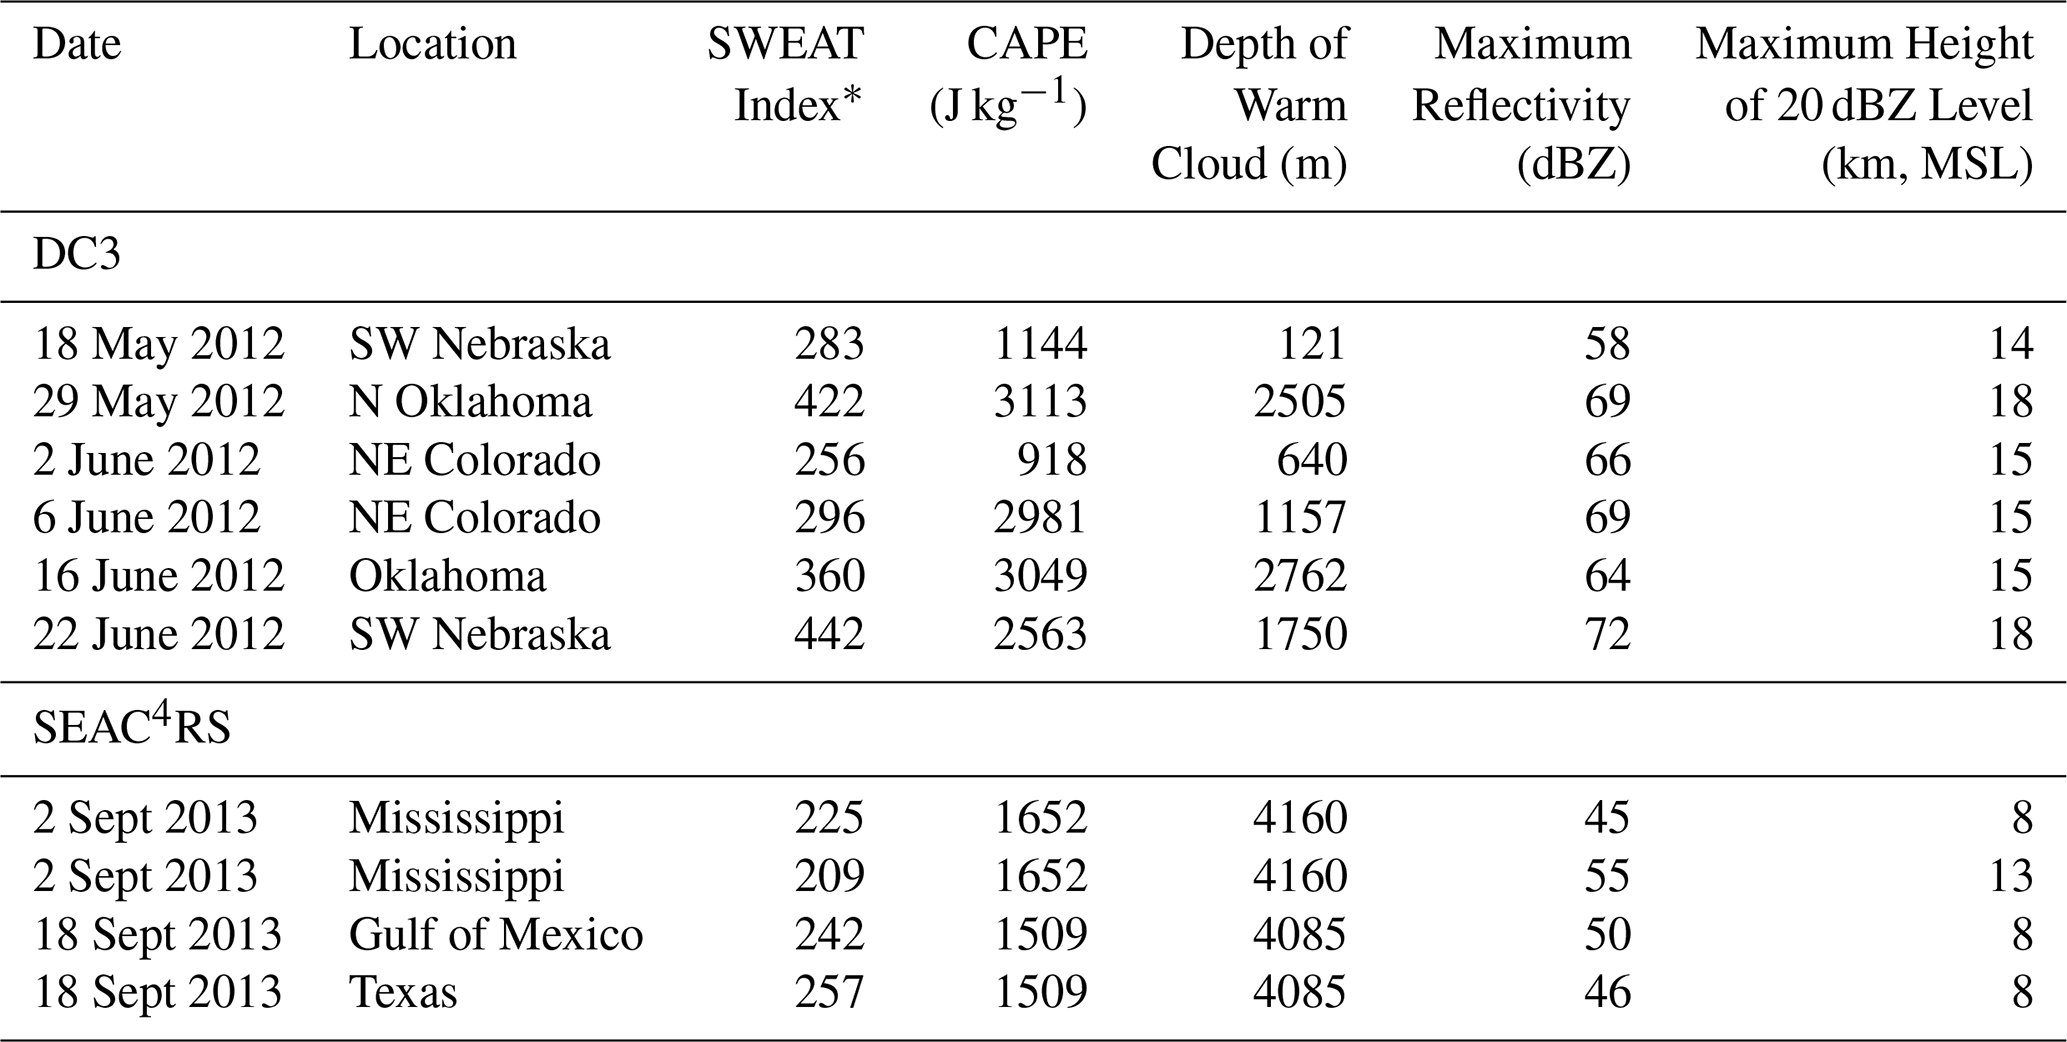
* SWEAT Index = 12 [Td(850 hPa)] + 20 (TT − 49) + 2 (f8) + f5 + 125 (S+0.2), where Td is the dewpoint temperature (°C) at 850 hPa, TT is the total totals index value (TT = T[850 hPa] + Td[850 hPa] − 2 × T[500 hPa], where T is air temperature [°C]), f8 is the wind speed (kn) at 850 hPa, f5 is wind speed (kn) at 500 hPa, and S is the sine of the 500 hPa minus 850 hPa wind direction (NWS, 2015). CAPE and depth of the warm cloud (i.e., height of the freezing level minus height of cloud base) are from radiosonde data. Maximum NEXRAD reflectivity and heights of 20 dBZ levels are taken from the outflow time period of the aircraft sampling.
Clear air vertical profiles of the aerosol mass concentrations are a key part of the analysis as they are used, along with the entrainment rate, to determine how much of the aerosol mass is transported to cloud top. For six out of the ten storms analyzed, the clear air vertical aerosol profiles exhibit typical shapes of high concentrations in the BL and low concentrations in the free troposphere (Fig. 2). The other four storms (18 May, 2, 6, and 22 June 2012) show a mid-troposphere aerosol layer, most pronounced for pNO3, in the mid-troposphere (Fig. 2a, c, d, f). The four storms with the mid-troposphere aerosol layer occurred in the northeast Colorado and southwest Nebraska region. For the 18 May 2012 case, many trace gases, including CO, HCN (a biomass burning tracer), SO2, and HNO3, do not show elevated mixing ratios in the mid-troposphere, but other trace gases or aerosol characteristics do. The measurements with higher values in the mid-troposphere layer include aerosol number concentration, surface area, and volume concentration, CO2, OH, and peroxy nitrates. The butane and pentane isomers did not have elevated mixing ratios in the mid-troposphere except for the 6 June 2012 case (Fig. 2d). In the mid-troposphere layers, the pNO3 partitioning is dominated by NO aerosol for all four storms (Fig. S6). Results from the E-AIM model in iterative mode show that the estimate of NH3 gas-phase mixing ratios did not increase in these mid-troposphere layers. Both the observed and E-AIM predicted partitioning of NO strongly suggest that neither gradients in aerosol acidity nor meteorological factors can explain the large observed increases in inorganic aerosol nitrate in the mid-troposphere layers, but that rather higher total inorganic nitrate (NO HNO3) is driving the shape of the altitude profiles.
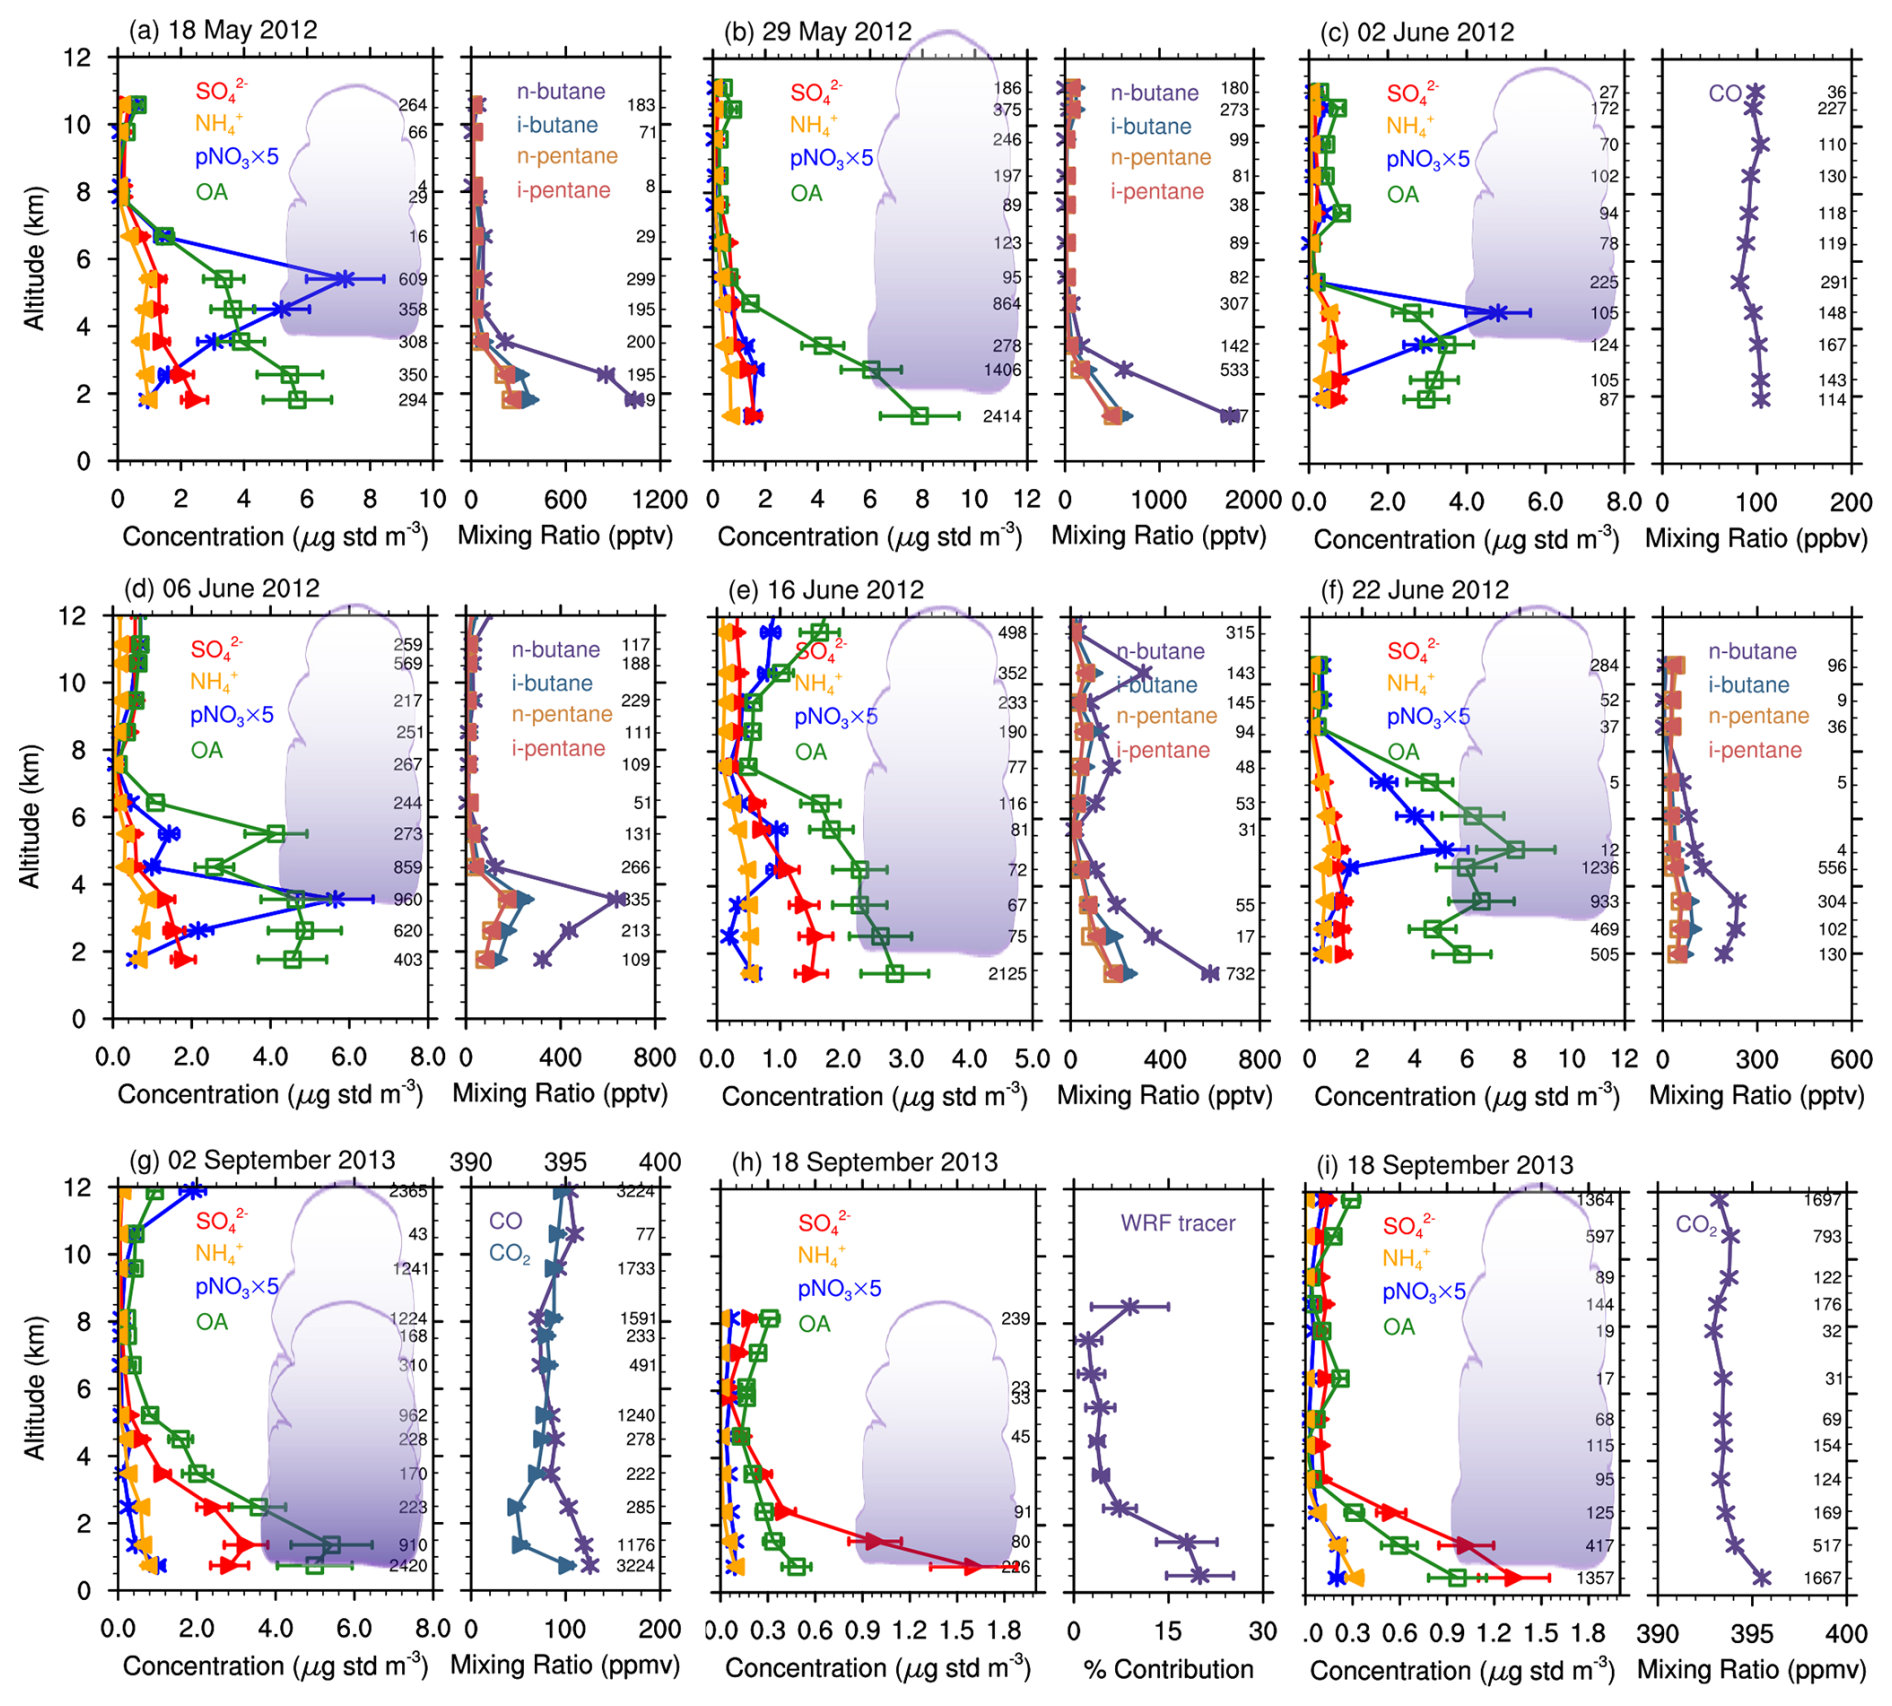
Figure 2Clear air vertical profiles of sulfate (red with right arrows), particulate nitrate (blue with asterisks), ammonium (gold with left arrows), organic aerosol (green with squares) and the passive, insoluble trace gases used in the entrainment model for (a) 18 May 2012, (b) 29 May 2012, (c) 2 June 2012, (d) 6 June 2012, (e) 16 June 2012, (f) 22 June 2012, (g) 2 September 2013, (h) 18 September 2013 over the Gulf of Mexico, and (i) 18 September 2013 over South Texas. Average and standard deviations are plotted for each altitude bin, which is plotted at the average altitude of each 1 km bin. Nitrate concentrations shown are multiplied by a factor of 5 for visibility. In (g), the CO2 mixing ratio (ppmv) axis is at the top of the panel. The cloud schematic in each panel is used to locate the approximate cloud base and cloud top heights for each case. Cloud tops extending above the panel indicate that the actual cloud top was much greater than 12 km and is noted in Table 1. In (g) two cloud tops are shown, ∼ 8 km for the airmass storm and ∼ 13 km for the multicell storm.
The NOAA HYSPLIT model was used to generate back trajectories (Stein et al., 2015; Rolph et al., 2017) to understand potential source regions contributing to the mid-troposphere aerosol layers for the four cases in northeast Colorado and southwest Nebraska. The HYSPLIT back trajectories are initialized at aircraft locations where AMS pNO3 concentrations are high compared to background values. The back trajectory calculations are driven by the North American Mesoscale (NAM) model reanalysis (Δx = 12 km) and run for 48 h. For the 18 May, 6, and 22 June 2012 cases, several back trajectories are at low altitude (< 2 km AGL) in the central to southern Arizona region (Fig. S7), while the back trajectories for 2 June 2012 remain at mid-troposphere levels over the western US. On 2 June 2012, the mid-troposphere aerosol layer may have arrived as outflow from convection upstream of the sampled storms, which are unlikely to be resolved by the NAM reanalysis. The back trajectories from the southwestern US are likely influenced by desert and agricultural emissions and possibly anthropogenic emissions from Phoenix, indicating that the air is being lofted from the desert southwest over the Rocky Mountains and remaining at the mid-troposphere altitudes.
No matter the source of the mid-troposphere aerosol layers, their elevated concentrations can impact the estimates of scavenging efficiencies due to entrainment of the high concentrations into the convection. The impact of the mid-troposphere aerosol layers is explored further in the next section by adjusting the clear-air vertical profiles for the four cases that had the mid-troposphere aerosol layers. Instead of using the measured clear air vertical profile, the vertical profile is adjusted to exclude the mid-troposphere layer (Fig. S8 exemplifies how this is done for the 18 May 2012 case). Using the entrainment model with the adjusted vertical profile, a new entrainment model predicted cloud top concentration is derived and used, together with the measured outflow concentration, to determine the scavenging efficiency by Eq. (2).
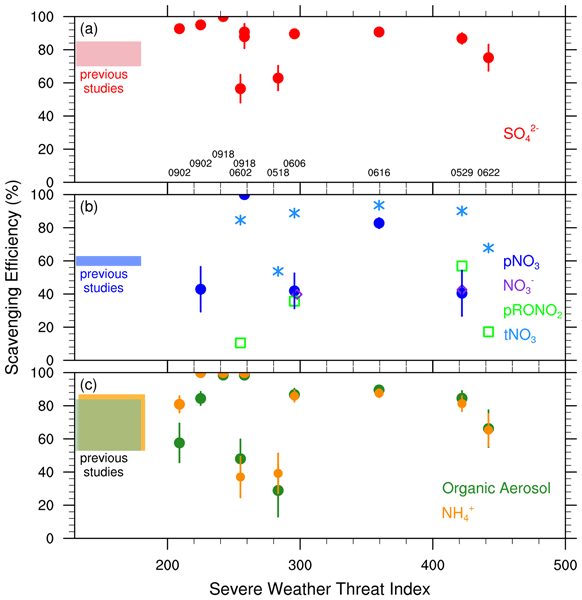
To visualize the aerosol mass scavenging efficiencies for the different convective storms, the average and standard deviation scavenging efficiencies are plotted in the parameter space of the SWEAT Index (Fig. 3), providing a way for understanding the scavenging efficiency results for different strengths of convection. While there is not an obvious correlation between aerosol scavenging efficiencies and the SWEAT index (Fig. 3), the aerosol scavenging efficiencies derived for the DC3 storm cases had a strong correlation with CAPE, a moderate correlation with the depth of the warm cloud, and weaker correlations with 0–6 km wind shear and entrainment rate (Fig. S9). High CAPE values are associated with higher maximum vertical velocity (e.g., Cotton et al., 2011), which may imply that vertical velocities and therefore supersaturation are also higher near cloud base increasing cloud drop activation. The correlation between CAPE and precipitation formation is also positive, at least to some degree. Thus, there is potential for higher aerosol scavenging coefficients in storms with more precipitation in high CAPE environments. However, for the SEAC4RS storms there is no strong correlation of these parameters, including CAPE and aerosol scavenging coefficients, for two reasons: (1) the same NWS sounding was used to calculate these parameters for both storms on each of the two SEAC4RS dates and (2) several outflow aerosol concentrations were below detection limit.
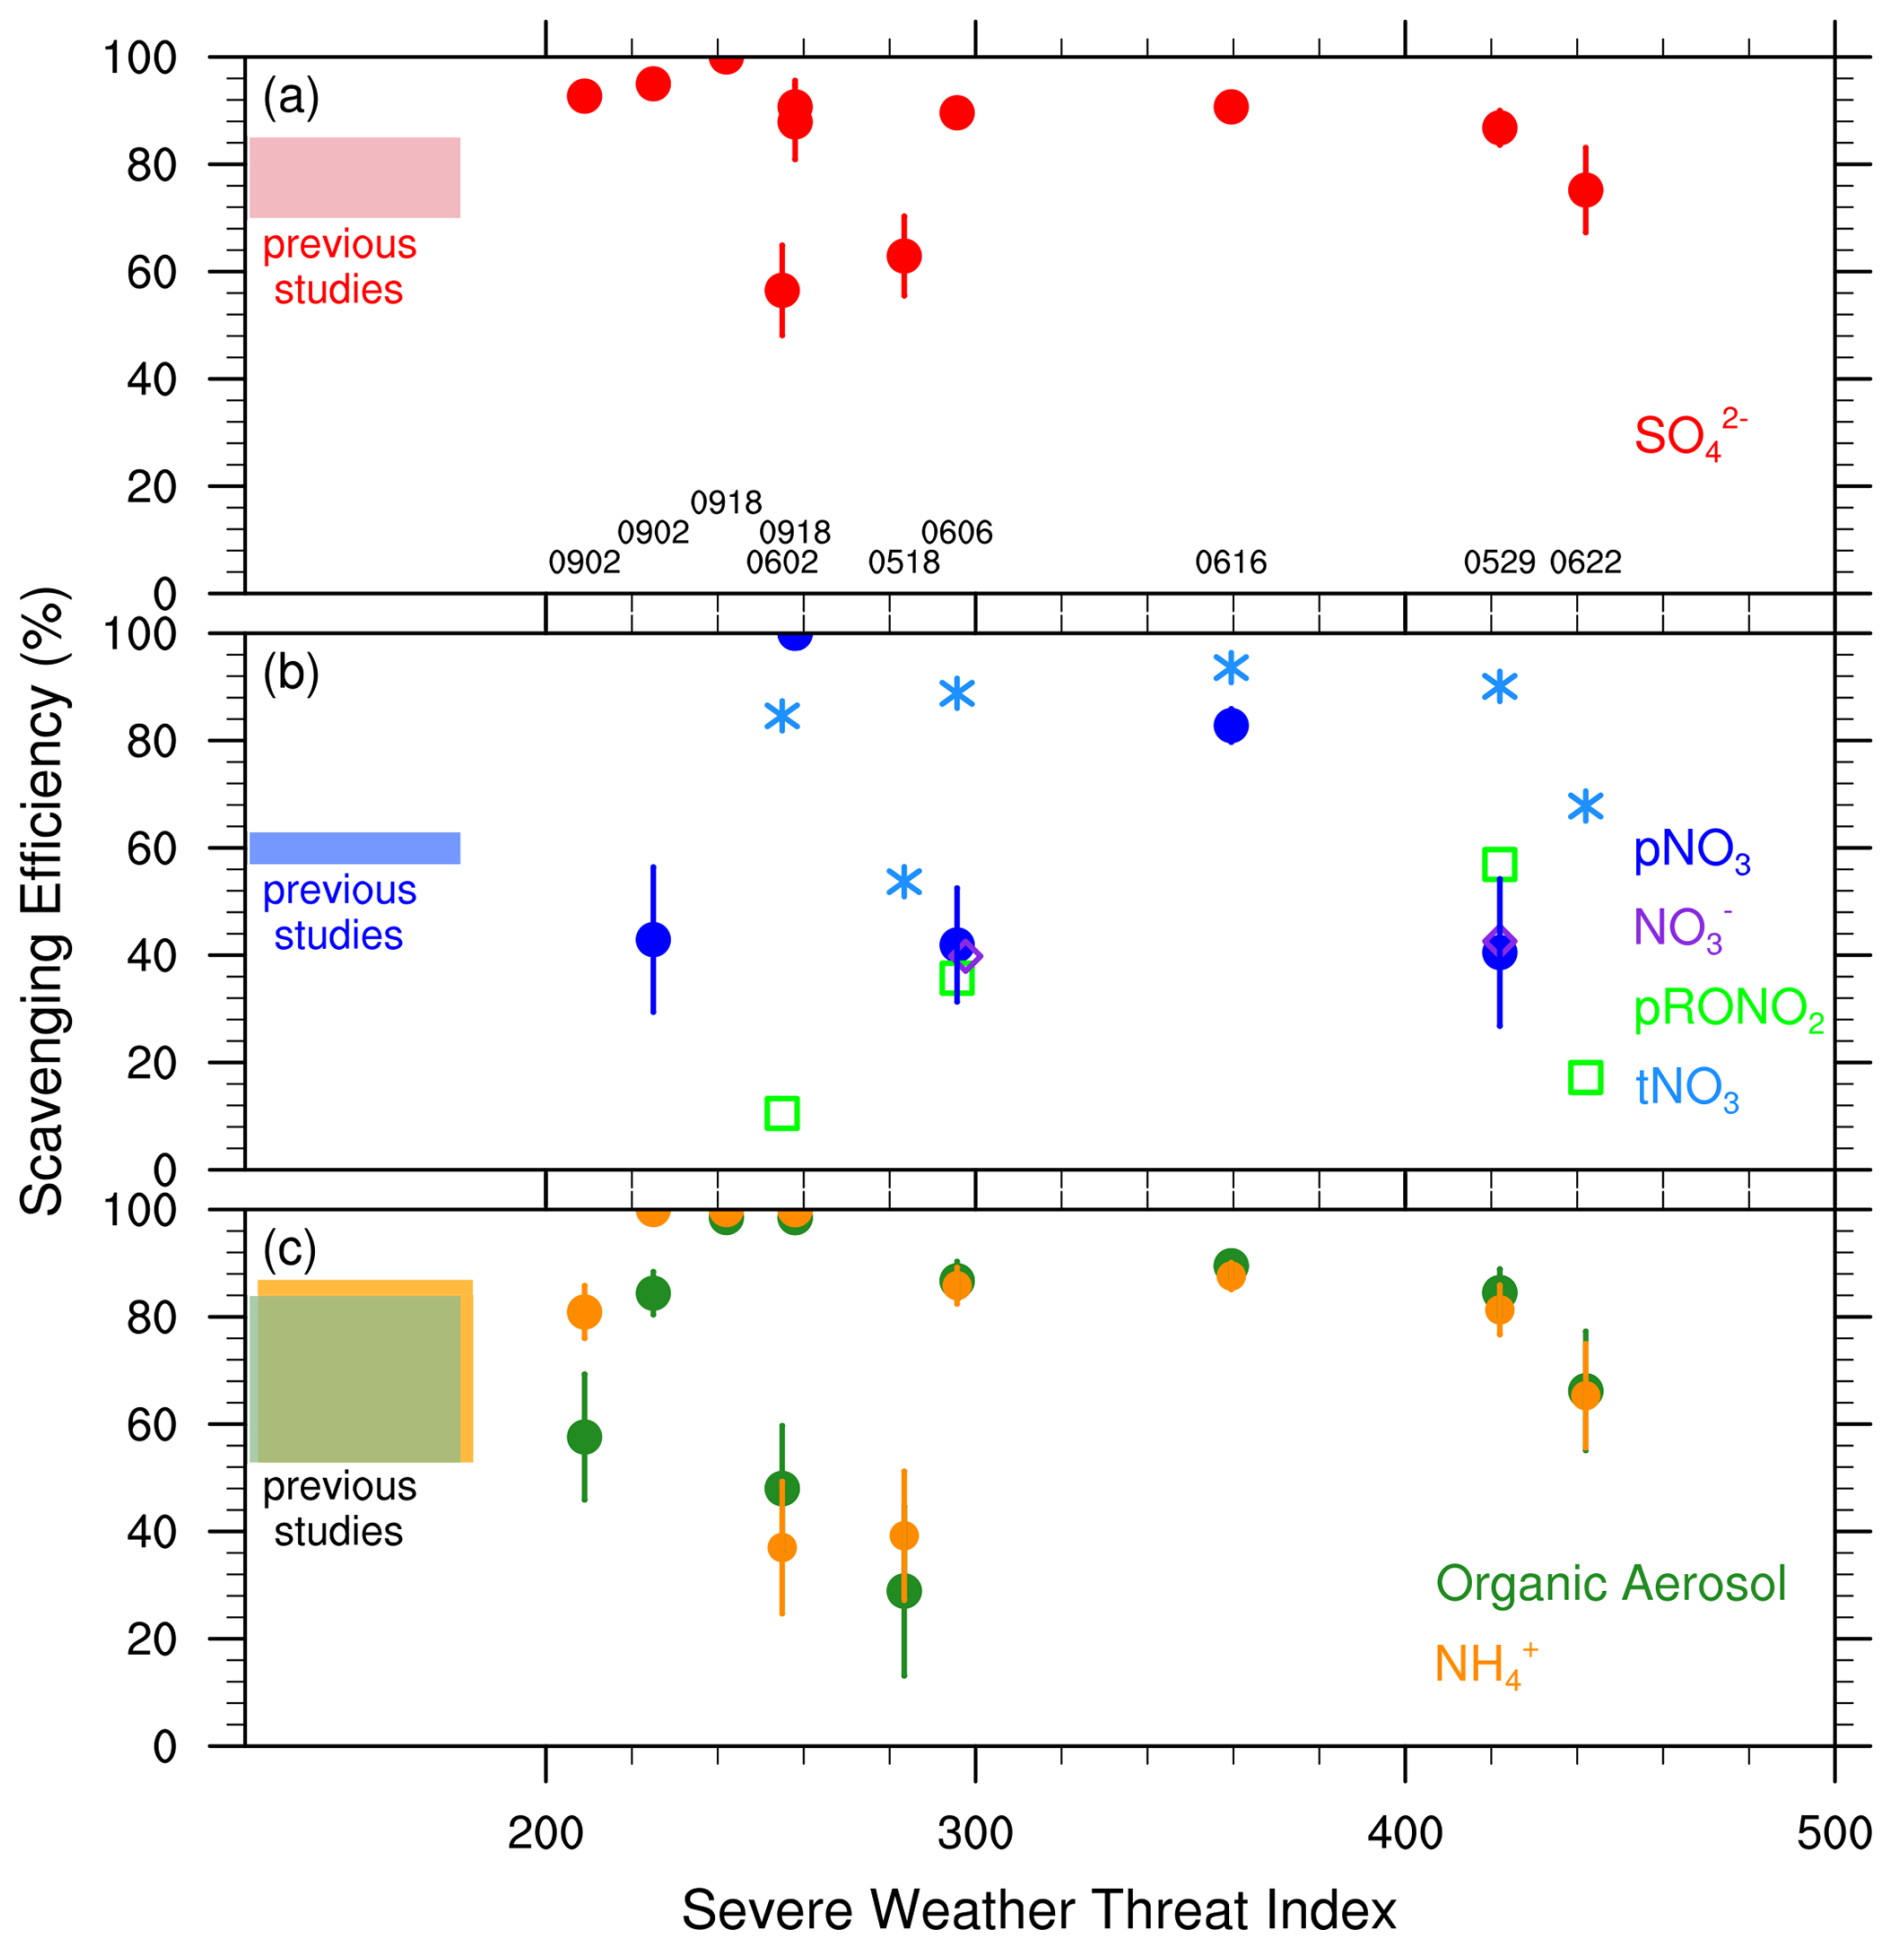
Figure 3Scavenging efficiencies for (a) sulfate, (b) particulate nitrate (pNO3; blue), and (c) ammonium (orange), and organic (green) aerosol mass concentrations for DC3 and SEAC4RS (filled circles) storms, plotted for each storm's SWEAT index. Scavenging efficiencies for inorganic particulate nitrate (NO), organic particulate nitrate (pRONO2), and total nitrate (tNO3= pNO3+ HNO3) are shown in the middle panel as purple diamonds, green squares, and light blue asterisks, respectively. The vertical bars are the maximum between the uncertainty from the propagation of the AMS measurement uncertainty or the standard deviations for the variation in entrainment rates. Dates (mmdd) of each storm are noted in black in panel (a). Scavenging efficiencies from previous studies are shown for comparison but do not have corresponding SWEAT indices.
Table S4 lists the measured aerosol mass concentrations in the inflow and outflow regions, the calculated aerosol mass concentration at cloud top, and the scavenging efficiency for each storm. The variability of the inflow and outflow aerosol mass concentrations is the maximum of the standard deviation or the uncertainty of the AMS measurement. The variability of the scavenging efficiencies represents the maximum of either the variability as a result of the entrainment rate variability or the propagation of uncertainty of the AMS measurements. The entrainment rate variability (Table S3) is equal to the largest deviation of the individual entrainment rate from the average entrainment rate. In all cases except for the land convection on 18 September 2013, the AMS measurement uncertainty propagates to an uncertainty in the derived scavenging efficiencies that is larger than the uncertainty from the entrainment rate variation.
7.1 Sulfate aerosols
The scavenging efficiencies for SO aerosol mass concentrations exceed 75 % for all cases except two cases which give SO scavenging efficiencies of 50 %–60 % (Fig. 3). Obtaining fairly constant SO scavenging efficiencies with different storm severity points to the dominant role of in-cloud scavenging (i.e. cloud drop activation) and efficiency of producing precipitation in comparison to below-cloud scavenging (e.g., Flossmann, 1991 who found 90 % of the aerosol mass scavenged to have been through nucleation scavenging yet ∼ 30 % of the aerosol mass in rain at the ground to be due to below-cloud scavenging). Previous studies have shown that SO deposition fluxes and precipitation fluxes at the surface are positively correlated (e.g., Barth et al., 1992), which would suggest lower SO scavenging efficiencies for weaker convective storms, in contrast to our findings of consistently high SO scavenging. The high SO aerosol scavenging efficiencies agree with other previous studies for convective clouds that found SO aerosol scavenging efficiencies of 70 %–86 % (Hegg et al., 1984; Hilario et al., 2025; Yang et al., 2015). Yang et al. (2015) also analyzed the 29 May 2012 DC3 storm using a 4-layer entrainment model approach, which is similar to the analysis approach in this work. They found a SO aerosol scavenging efficiency of 80 %–84 % while our analysis determined 86.8±3.2 % for that storm (Table S4). Hilario et al. (2025) estimated 87 %–95 % SO scavenging efficiencies for shallow to moderate tropical convection over the West Pacific. The two cases with 50 %–60 % scavenging efficiencies are the 18 May 2012 and 2 June 2012 DC3 cases that both had a significant mid-troposphere aerosol layer (Fig. 2). The SO scavenging efficiency for the 22 June 2012 case, which also has an mid-troposphere aerosol layer, has a somewhat smaller value (77 %) compared to the other severe deep convection cases. By adjusting the clear air vertical profile to remove the mid-troposphere aerosol layer, the aerosol SO transported to cloud top is reduced by 0.06 µg SD m−3 or less (where SD m−3 refers to volume at T=273 K and p=1013 hPa) and scavenging efficiencies are within 3 % of estimated values reported in Table S43. Thus, the mid-troposphere aerosol layer does not substantially affect SO scavenging efficiencies. Instead, other processes, such as aqueous phase production of SO, could play a role. The 18 May and 2 June 2012 DC3 cases also had lower values of CAPE and depth of the warm cloud compared to the other storms (Table 1). The high cloud bases over the High Plains of Colorado and western Nebraska result in shallow warm cloud depths, reducing the time for precipitation formation by cloud drop coalescence and rain-cloud drop collection processes.
7.2 Ammonium aerosols
The NH aerosol scavenging efficiencies are > 60 % for most storms analyzed and 25 %–35 % for the 18 May 2012 and 2 June 2012 DC3 storms (Fig. 3) which were influenced by the mid-troposphere aerosol layers (Fig. 2), lower CAPE values, and shallow warm cloud depths (Table 1). Like SO aerosol scavenging, the 22 June 2012 DC3 storm has a somewhat lower scavenging efficiency (67 %) than the other severe storms. By adjusting the clear air vertical profile to remove the mid-troposphere aerosol layer, the NH transported to cloud top is reduced by 0.06 µg SD m−3 or less, reducing scavenging efficiencies because the denominator in Eq. (1) is smaller. The fairly constant NH scavenging efficiencies with different storm severity suggests that in-cloud scavenging is the dominant scavenging mechanism. Previous estimates of NH aerosol scavenging efficiencies give a similar range (68 %–86 %) as those calculated here for most of the storms. Yang et al. (2015) found the NH aerosol scavenging efficiency to be 80 % for the 29 May 2012 storm using their 4-layer entrainment model approach, which is within the uncertainty of the 81.3 ± 4.6 % estimated here. For tropical, oceanic convection, Hilario et al. (2025) estimated a wide range (54 %–87 %) of NH scavenging efficiencies. Note that the outflow NH concentrations are near zero for some DC3 and SEAC4RS storms (Table S4), which increases the relative uncertainty for those cases.
7.3 Nitrate aerosols
The estimated pNO3 scavenging efficiencies shown in Fig. 3b (blue markers) are for only five of the ten storms analyzed. For two storms (16 June 2012 and 18 September 2013 land convection), pNO3 scavenging efficiencies are > 80 %, while the other three storms (6 June 2012, 29 May 2012, and 2 September 2013 airmass) have moderate pNO3 scavenging efficiencies (∼ 40 %). The remaining five cases have indeterminate scavenging efficiencies because the outflow pNO3 concentration is greater than the inflow concentration or the inflow and outflow concentrations are both below the detection limit (Table S4). Yang et al. (2015) found a moderate pNO3 scavenging efficiency (57 %) for the 29 May 2012 DC3 case that is lower than the SO and NH scavenging efficiencies yet still higher than the 40.5 ± 13.7 % determined in our analysis. The lower pNO3 scavenging efficiencies are surprising because pNO3 aerosols have hygroscopicity values similar to SO and NH and are often internally mixed with NH and SO. Thus, there are likely other processes causing higher outflow-to-inflow pNO3 ratios relative to those for SO and NH. Yang et al. (2015) suggested that outflow pNO3 concentrations are likely affected by the partitioning between gas phase HNO3 and pNO3 in the higher acidity environment of the convective outflow. Their estimate of the total nitrate (tNO3= HNO3 (g) + pNO3) scavenging efficiency is 84 %, supporting this idea. Our scavenging efficiency estimates of tNO3 in the 29 May 2012 storm is 90 % (Fig. 3, light blue markers) and > 85 % for other storms except the 18 May and 22 June 2012 DC3 storms . We note that the low altitude HNO3 concentrations are a factor of 10 greater than pNO3 and that HNO3 does not exhibit a mid-troposphere enhancement (Fig. S6). These factors suggest our calculation of the combined scavenging efficiency is weighted toward the HNO3 scavenging, which is > 85 %.
Employing the mass spectral marker method (Campuzano-Jost et al., 2021) to separate pNO3 into inorganic (NO) and organic (pRONO2) particulate nitrate and the E-AIM calculations (Sect. 2), the partitioning of inorganic nitrate between aerosol and gas phases is calculated, allowing us to quantify the NO fraction of NO HNO3. This fraction is small (< 0.12) in DC3 inflow regions with NO concentrations < 0.1 µg SD m−3 (Table S5). In convective outflow regions the NO fraction increases substantially. The three DC3 cases where pNO3 outflow concentrations are greater than its inflow concentrations have outflow NO fractions of 0.80–0.86. For both inflow and convective outflow regions, there is a positive correlation between the NO fraction and the pNO3 concentration (Fig. S10). Scavenging efficiencies for NO and pRONO2 are calculated only for storms where the inflow and outflow concentrations are at or above the detection limit. The scavenging efficiencies for NO match the pNO3 values for the 6 June and 29 May 2012 storms (Fig. 3, purple diamonds; Table S6). The pRONO2 scavenging efficiencies (Fig. 3, green squares) range from 11 %–57 %. While the wide range of pRONO2 scavenging efficiencies causes uncertainties in drawing conclusions, the similarity between NO and pNO3 scavenging efficiencies suggest processes affecting NO are also affecting pNO3 scavenging efficiencies.
While the shallow warm cloud depths of the Colorado storms (Table 1) are potentially playing a role in reducing pNO3 scavenging efficiencies, the high pNO3 concentrations in the storm outflow regions require a source of pNO3, such as from the mid-troposphere aerosol layer or lightning-generated nitrogen oxides. Entrainment of the mid-troposphere aerosol layer would increase the calculated cloud top aerosol concentration and, consequently, may alter the apparent aerosol scavenging efficiency. To quantify the increase in calculated cloud top pNO3, the clear air vertical profile is adjusted to remove the mid-troposphere aerosol layer (Sect. 6). Without the mid-troposphere aerosol layer, the pNO3 transported to cloud top is reduced by 0.18 µg SD m−3 for the 18 May 2012 case, a 64 % decrease, and 0.06 µg SD m−3 or less (30 %–55 % decrease) for the other cases. For the 18 May, 2, and 22 June 2012 DC3 cases, the outflow pNO3 concentrations are still greater than the transported cloud top pNO3 concentrations. For the 6 June 2012 case, the lower transported cloud top concentration causes a smaller scavenging efficiency than that reported in Table S4 because the denominator in Eq. (1) is also smaller.
Lightning production of nitrogen oxides could be a source of aerosol nitrate as the lightning-NOx photochemically forms HNO3, which partitions to aerosol nitrate. Using a chemistry-climate model, Tost (2017) showed that lightning-NOx increased nitrate aerosol concentrations by more than 50 %, affecting aerosol size distributions and optical properties. Allen et al. (2012), using the CMAQ model, found that lightning-NOx production increased the wet deposition of oxidized nitrogen. Here, we provide an example of production of HNO3 from lightning-NOx to determine the feasibility of this pathway in influencing the pNO3 scavenging efficiency estimates. Results from a cloud chemistry parcel model that was used to examine the role of lightning-NOx on formaldehyde and peroxide scavenging efficiencies (Cuchiara et al., 2020) are analyzed to estimate the production of HNO3. This analysis is applied to the 2 September 2013 SEAC4RS case, which had moderate lightning associated with the multicell storm. Two updrafts, 5 and 2 m s−1, are prescribed with two lightning-NO source strengths that produce ∼ 1 ppbv of NOx at the top of the cloud. In response to the added NO, the HNO3 mixing ratio increases at cloud top by 100–200 pptv or 0.28–0.56 µg SD m−3 (Fig. 4). This increase is larger than the 40 pptv increase of the sum of HNO3 and pNO3 during the 21 June 2012 convective outflow study reported by Nault et al. (2016), who highlighted the multiple inorganic and organic nitrate formation pathways occurring in convective outflow regions. The 100–200 pptv increase in HNO3 from a lightning-NO source indicates that outflow particulate nitrate concentrations can potentially exceed the inflow concentrations as found in our analysis (Table S4). As it is not possible to properly represent lightning NO production in the cloud chemistry parcel model and HNO3 partitioning onto aerosols, these results only indicate the potential pNO3 increase. Chemistry transport modeling that represents cloud morphology and dynamics, lightning NOx production, gas and aqueous phase chemistry, gas-phase HNO3 partitioning onto ice, and gas-aerosol partitioning can be used in the future to further quantify the impact of lightning NO on pNO3 in the upper troposphere.
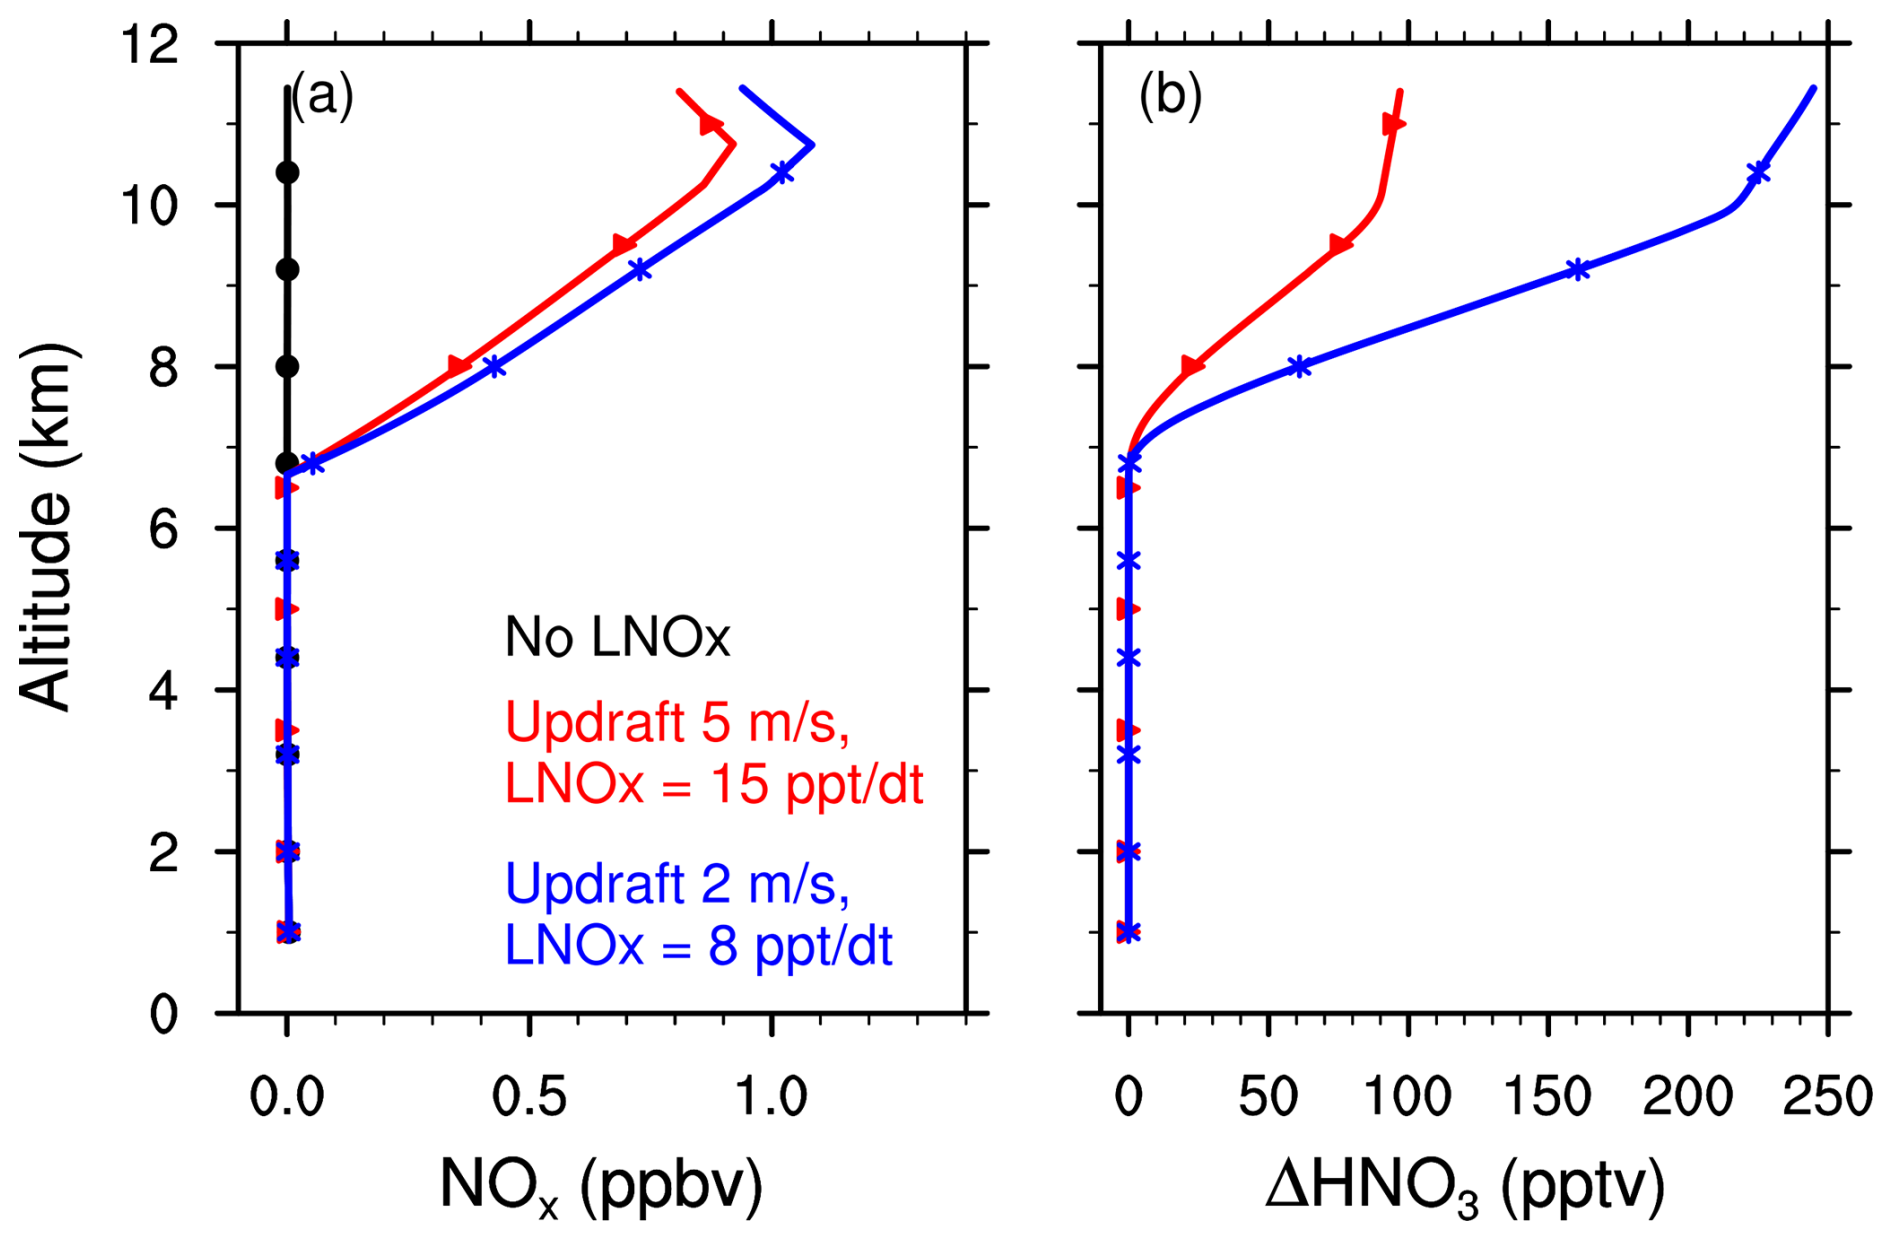
Figure 4Results from the cloud chemistry parcel model of (a) gas + aqueous NOx mixing ratio and (b) change in gas + aqueous HNO3 mixing ratio caused by a lightning-NOx source in the model. In (a) the black line with filled circles is the NOx mixing ratio without a lightning-NOx source, while red with right triangles and blue with asterisks lines include a lightning-NOx source using two different updraft speeds; a 15 pptv per 10 s time step of NO for the 5 m s−1 updraft and a 8 pptv per 10 s time step for the 2 m s−1 updraft. In (b) the red line with right triangles is for the 15 pptv per 10 s time step lightning-NOx source and 5 m s−1 updraft, while the blue with asterisks line is for 8 pptv per 10 s time step lightning-NOx source and updraft 2 m s−1 speed.
The roles of the mid-troposphere aerosol layer and lightning-production are further supported by noting which of the five storms (29 May, 6 June, 16 June 2012, 2 September 2013 airmass, 18 September 2013 land convection) had a mid-troposphere aerosol layer (6 June 2012) and which storms had elevated NOx mixing ratios in the outflow region (29 May and 16 June 2012 NOx>1 ppbv, while 6 June 2012 NOx=660 pptv, 2 September 2013 NOx=146 pptv, and 18 September 2013 NOx=320 pptv). The 18 September 2013 land convection pNO3 scavenging efficiency of 100 % with low NOx and no mid-troposphere aerosol layer supports the expectation that pNO3 scavenging efficiencies should be similar to SO and NH scavenging efficiencies. However, the 2 September 2013 airmass storm, also with low NOx and no mid-troposphere aerosol layer, has a moderate pNO3 scavenging efficiency, suggesting other factors may play a role.
7.4 Organic aerosols
The scavenging efficiencies for organic aerosol mass concentrations vary from 20 %–100 % (Fig. 3). For SWEAT indices 300 and greater, the OA mass concentration scavenging efficiencies are similar to SO and NH scavenging efficiencies and indicate that OA is internally mixed with the more hygroscopic aerosols. Having OA internally mixed with the inorganic aerosols is supported by Schroder et al. (2018) who showed ratios for DC3 and SEAC4RS to be > 0.4 in their Fig. 4. Further, the severe storms have strong updrafts (> 20 m s−1) resulting in high supersaturations that activate most of the CCN to cloud drops.
For SWEAT index < 300, the OA mass scavenging efficiencies in four storms (2 September 2013 airmass and all storms on 18 September 2013) are > 80 % (noting the 18 September 2013 OA outflow concentrations are below the detection limit rendering these storms to have a 100 % scavenging efficiency). There are three storms (18 May, 2 June 2012, and 2 September 2013 multicell) with OA scavenging efficiencies < 60 %, suggesting other processes, such as aerosol or cloud chemistry, could be forming SOA resulting in higher OA concentrations in the convective outflow. While formation of SOA via aerosol chemistry can contribute, the presence of cloud drops through most of the depth of deep convection is a more likely SOA formation pathway. In liquid water, organic aerosol mass can increase from the aqueous phase OH oxidation of aldehydes and monocarboxylic acids to form dicarboxylic acids (Blando and Turpin, 2000; Ervens et al., 2011). Oxalic acid (HOOC-COOH) has been found to be the most abundant dicarboxylic acid in tropospheric aerosol particles (e.g., Kawamura and Sakaguchi, 1999; Ziemba et al., 2011). To assess the extent of aqueous processing, previous studies have used oxalate (the de-protonated form of oxalic acid) in combination with SO for various regions (Hilario et al., 2021; Sorooshian et al., 2007; Yu et al., 2005). Here, we use the same approach as Hilario et al. (2021) to evaluate the potential role of aqueous phase chemistry on OA mass concentrations in the convective outflow of the less severe storms.
Hilario et al. (2021) used the SAGA filter measurements of oxalate and SO concentrations that in the analyzed datasets have a time resolution of 5 min or longer. For comparing oxalate to SO ratios in convective outflow, this time resolution is much longer than the DC-8 aircraft sampling time in some cloud outflow regions (< 40 s). Therefore, we use the 1 s AMS data for this analysis where the 44 measurement represents oxalate or oxalic acid. This approximation is valid as oxalic acid has been shown to correlate strongly with and contribute a large fraction to 44 (Takegawa et al., 2007), with the rest of the signal being strongly impacted by other acids (Yatavelli et al., 2015). Furthermore, we compared all the SEAC4RS oxalate to sulfate ratios from the SAGA measurements to the AMS 44 to SO ratios and found that the ratios have the same behavior for the two instruments in different types of air masses, indicating the AMS 44 to SO ratios can be used to look for signatures of cloud chemistry.
We first examine the 44 to SO ratios in different air mass regions for all SEAC4RS flights. The UTLS region is for cloud free data (total water content < 0.001 g kg−1) sampled above 8 km that also had HCN < 400 and CH3CN < 150 pptv to remove the influence from biomass burning (BB). The atmospheric BL region has the same criteria as the UTLS region, but for measurements sampled below 2 km altitude. Convective storm regions are where the DC-8 was sampling convective storms based on the flight descriptions in Toon et al. (2016) and with low HCN and CH3CN mixing. BB regions are denoted by cloud free data with HCN > 400 and CH3CN > 150 pptv sampled near fires as described by Toon et al. (2016). Similar to Hilario et al. (2021) for oxalate to SO ratios, the 44 to SO ratios for SEAC4RS flights in BB air masses are higher than those without BB influences (Fig. 5). Measurements sampled near convection have higher 44 to SO ratios than those sampled in the BL. However, ratios in the UTLS have even higher 44 to SO ratios.
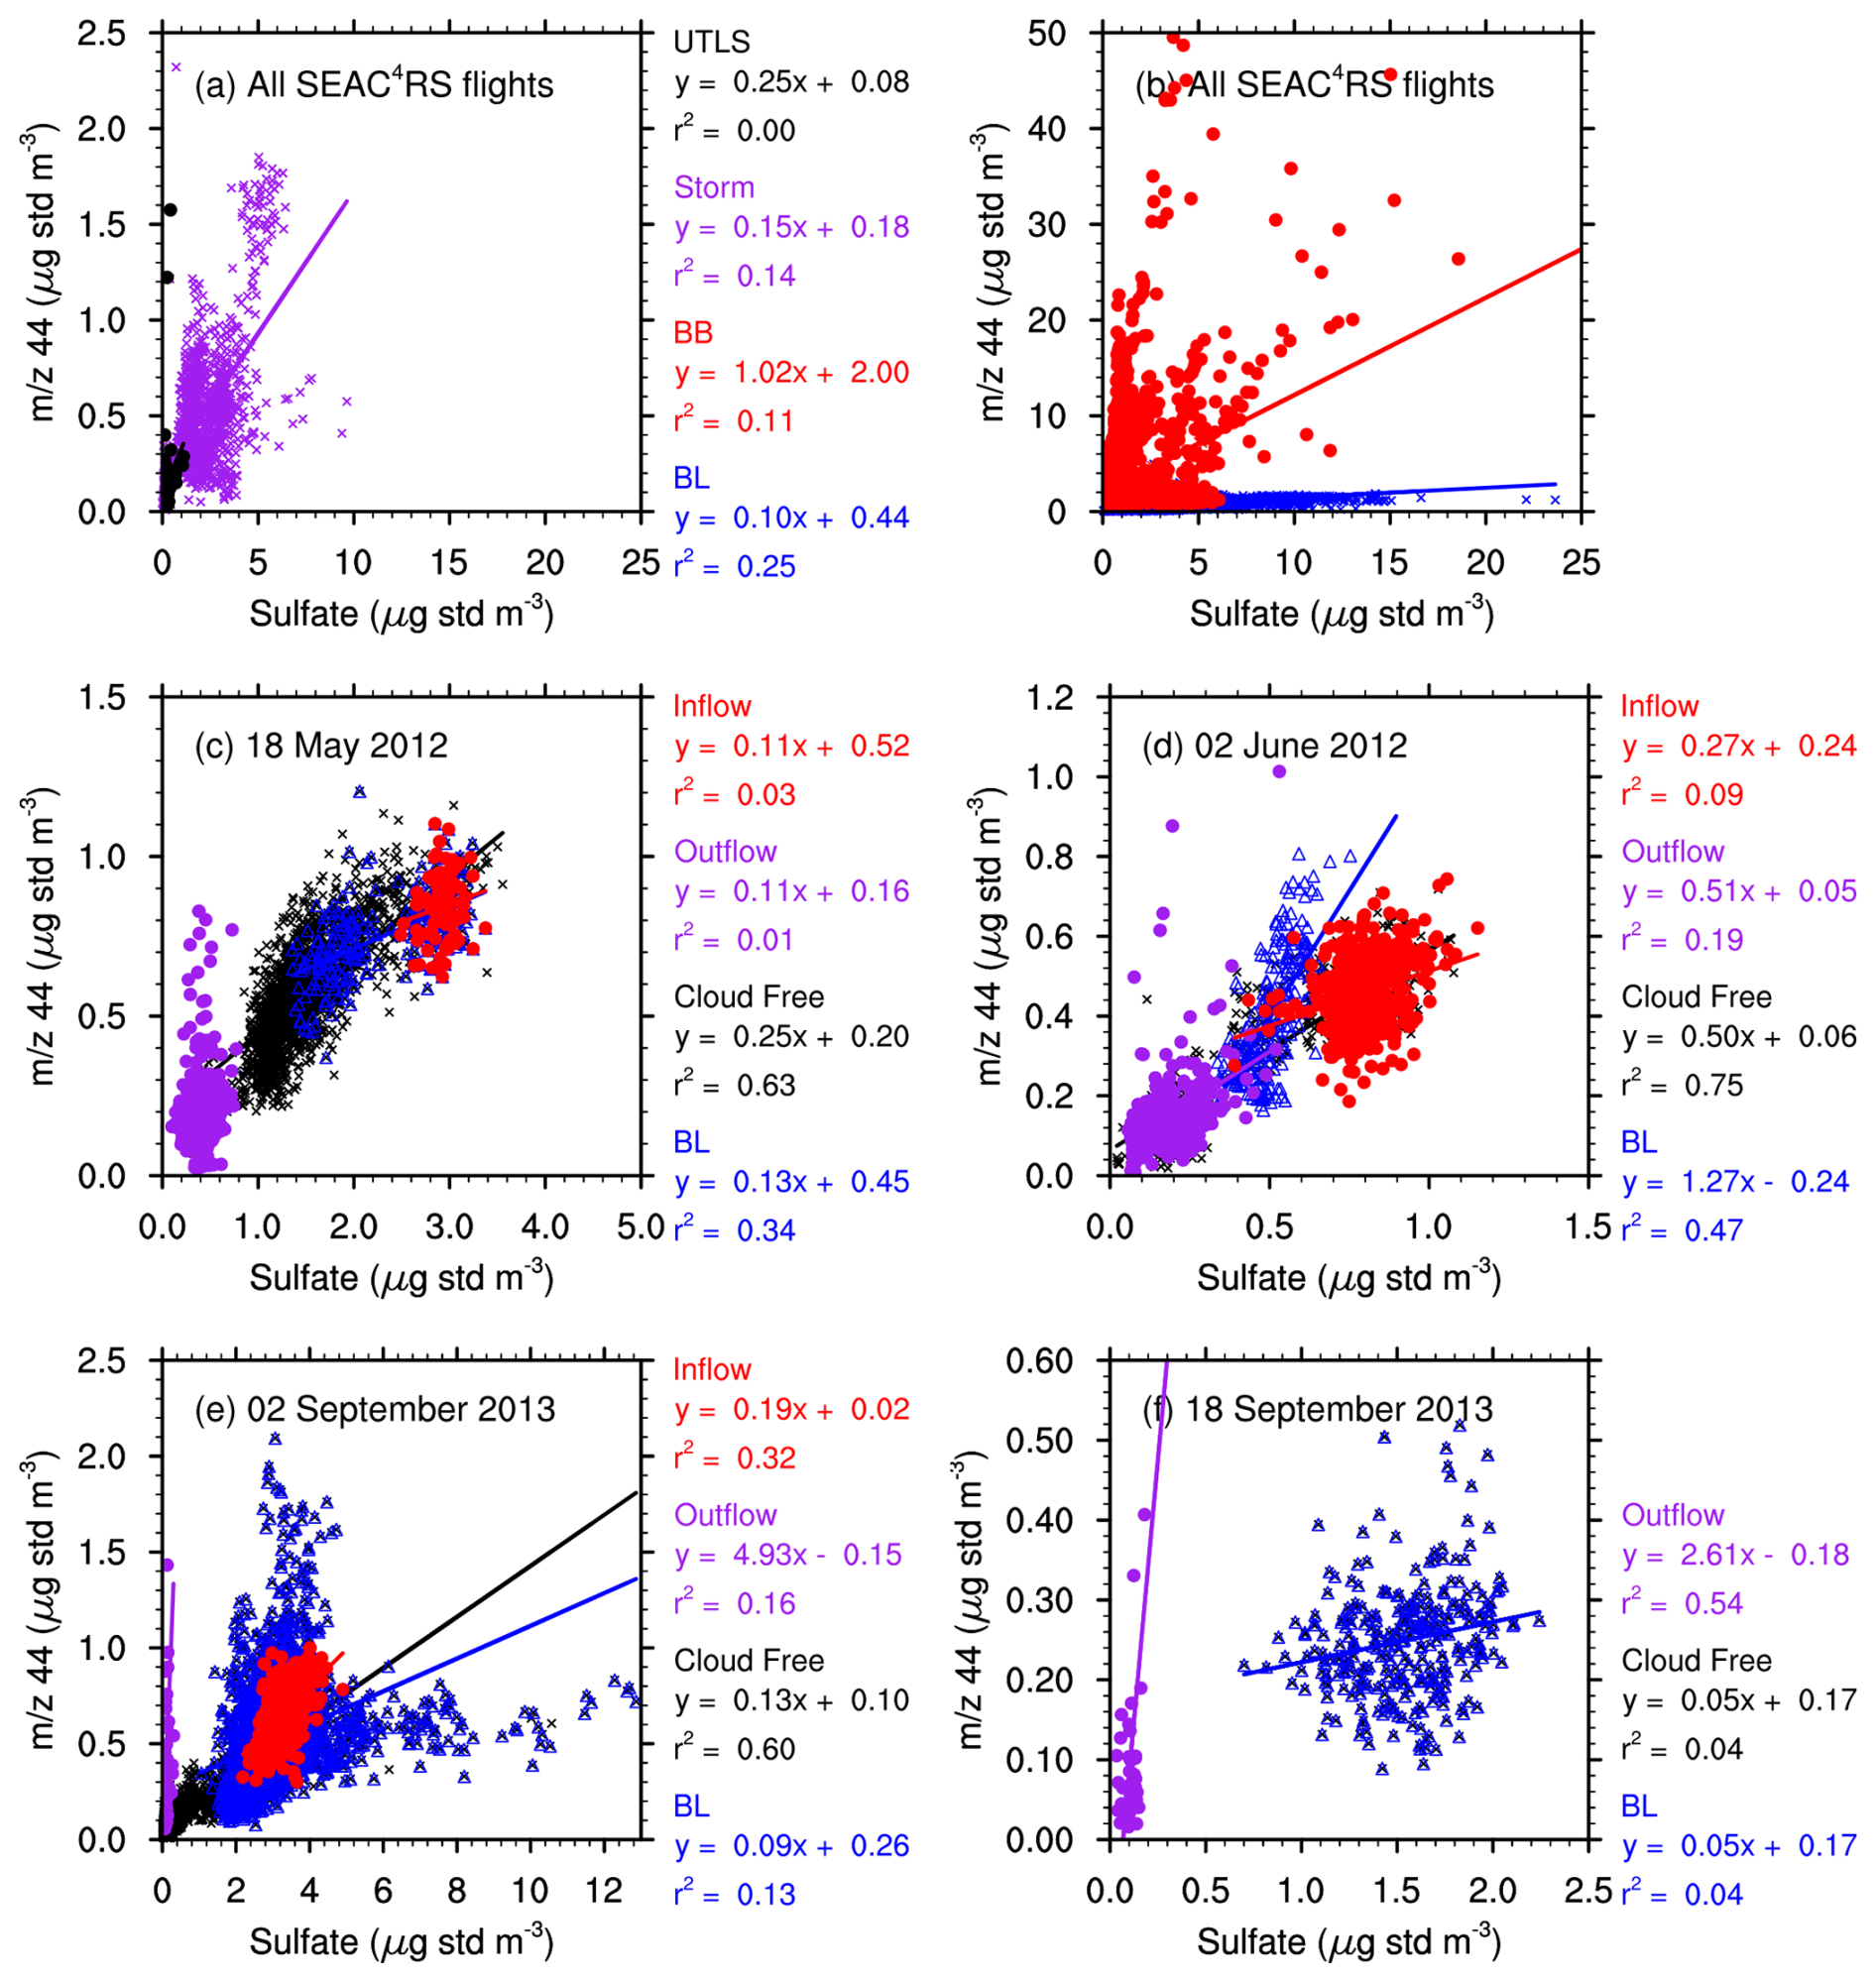
Figure 5Scatter plots of AMS 44 and AMS sulfate concentrations. In (a) and (b) concentrations from all the SEAC4RS flights are shown separating the data by region where (a) shows cloud free UTLS data (black circles) at altitudes > 8 km and data near storms (purple crosses), and (b) shows cloud free BL data (blue crosses) at altitudes < 2 km and data in BB regions (red circles). In panels (c)–(f) data are separated by inflow (red), outflow (purple), cloud free (black), and BL regions (blue) as defined in the scavenging analysis (and BL data is below 2 km) for (c) 18 May 2012, (d) 2 June 2012, (e) 2 September 2013, and (f) 18 September 2013 land convection.
The 18 May, 2 June 2012, and 2 September 2013 multicell cases, which are the storms with OA scavenging efficiencies < 60 % and SWEAT indices < 300, and the 18 September 2013 land convection case are individually analyzed. The OA clear air vertical profiles (Fig. 2) do not exhibit a mid-troposphere layer, although the 2 June 2012 case does have a somewhat higher OA concentration (3.50 µg SD m−3) at 3.5 km altitude compared to the 2.97 µg SD m−3 at 1.9 km altitude. The data are separated into BL, inflow, outflow, and cloud free regions (Fig. 5). All the cases have higher 44 to SO ratios in convective outflow air compared to the inflow air, except for the 18 May 2012 case, which has the same ratio in both air masses. The two SEAC4RS convection cases sampled during midday show a substantial increase in 44 to SO ratios in the outflow region compared to the inflow and BL regions, as illustrated in Fig. 5e and f. The 18 May and 2 June 2012 DC3 convective storms have less of an influence of aqueous-phase chemistry, which may be because those storms were sampled during the late afternoon and early evening after the peak diurnal OH concentration and occurred in a low biogenic VOC environment.
A second approach for investigating the role of aqueous-phase chemistry on OA concentrations in the convective outflow is to use the cloud chemistry parcel model described in Sect. 4 for the 2 September 2013 example case. For this discussion, the source of NO from lightning was set to zero, but results from the simulation with lightning-generated NO did not differ substantially. The liquid water content, prescribed by the WRF-Chem simulation (Cuchiara et al., 2020), shows a deep layer from 1.5 km MSL to 10 km MSL altitude with a peak value at 0.75 g kg−1 (Fig. 6a). Formic acid (HCOOH) is the predominant organic acid in both the aqueous phase and combined gas + aqueous phases (Fig. 6) for altitudes below 4 km. Near cloud base HCOOH and acetic acid (CH3COOH) both rapidly form, while the other organic acids show a steady increase from just above cloud base to cloud top. At the top of the cloud, the estimated SOA mass concentration from the six organic acids is 1.49 µg C SD m−3 and is 2.39 µg C SD m−3 when glycolaldehyde, glyoxal, methylvinylketone, and hydoxyacetone are included in the summation, which is based on the particulate to gas phase partitioning ratios in the absence of clouds listed in Ervens et al. (2008). Of this total SOA estimate, 0.46 µg C SD m−3 is from oxalic acid, which is more than the 0.40 µg SD m−3 for the 44 measurement in the outflow region of the 2 September 2013 case. These simulations initialized glycolic, glyoxalic, pyruvic, and oxalic acids to zero, which may not be realistic. Parcel model calculations using initial formic, acetic, and oxalic acid from those measured by Nah et al. (2018) at a rural site in Georgia during September and October 2016 (1.3, 0.6, 10 pptv, respectively) and other organic acids initialized to 10 pptv resulted in 0.78 µg C SD m−3 oxalic acid and 2.58 µg C SD m−3 for total SOA mass at cloud top. Considering that the parcel model calculations predict higher SOA mass than the measured 1.5 µg OA SD m−3 in the outflow of the 2 September 2013 multicell storm, it is quite likely that aqueous-phase chemistry contributed to higher outflow OA concentrations and thereby reducing the calculated OA scavenging efficiency for this storm. However, further investigation with CTMs of the contribution of organic aqueous phase chemistry to OA concentrations in individual convective storms is needed in order to represent the interactions between dynamics, physics, and chemistry more completely.
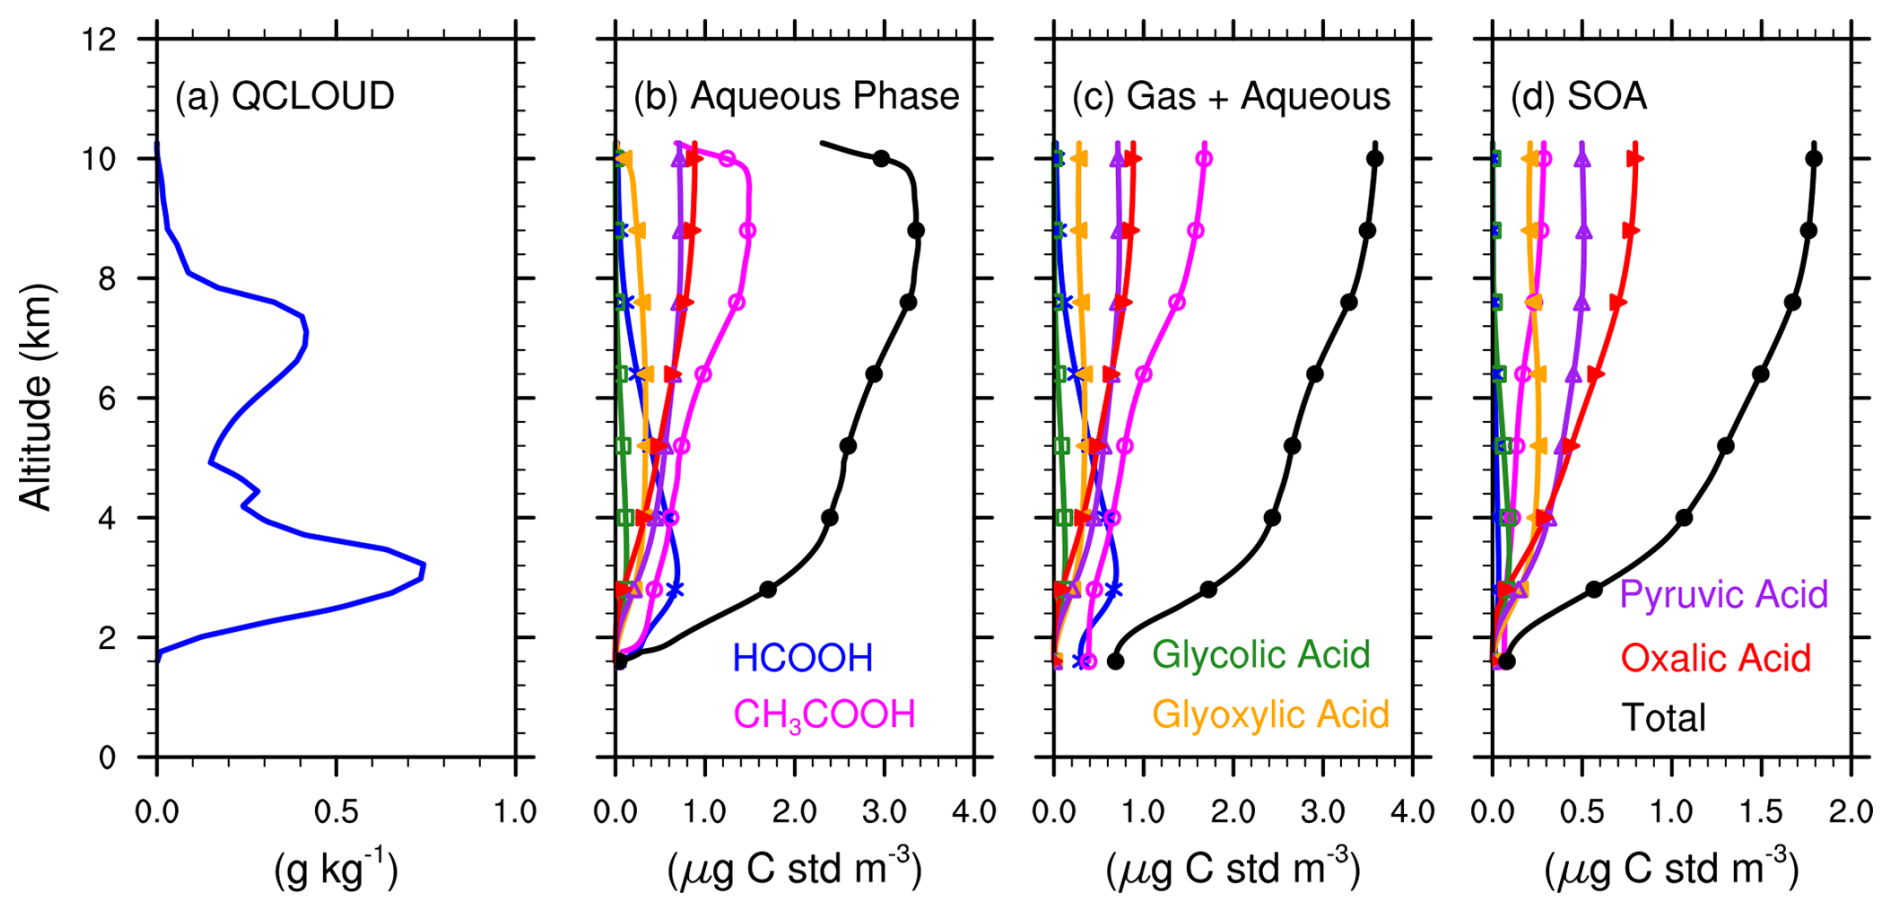
Figure 6Prescribed cloud parcel model results for organic acid formation using the no lightning-NOx scenario for the 2 September 2013 case. Panel (a) shows the prescribed cloud water content (g kg−1) for the model run, panel (b) the aqueous-phase organic acid mixing ratios (µg C SD m−3), panel (c) the total (gas + aqueous) organic acid mixing ratios (µg C SD m−3), and panel (d) potential SOA (µg C SD m−3) using partitioning ratios, for formic acid (blue with asterisks), acetic acid (magenta with open circles), glycolic acid (green with open square), glyoxylic acid (gold with left pointing triangles), pyruvic acid (purple with triangles), oxalic acid (red with right pointing triangles), and the sum of the six organic acids (black with closed circles).
This paper quantifies the vertical transport and scavenging of aerosol mass concentrations through analysis of ten deep convective storms observed during the 2012 DC3 and 2013 SEAC4RS field campaigns. The storms sampled range in severity from weaker airmass convection to severe supercell convection. Similar to previous studies (Barth et al., 2016; Fried et al., 2016; Hilario et al., 2025; Yang et al., 2015), the analysis uses an entrainment model with input from aircraft measurements sampled in the inflow and outflow regions of the convective storms as well as clear-air vertical profiles to determine the scavenging efficiencies of sulfate, ammonium, nitrate, and organic aerosol mass concentrations.
The observationally derived scavenging efficiencies of sulfate and ammonium aerosol mass concentrations are consistently greater than 75 % for weak to severe convection. DC3 storms with somewhat lower sulfate and ammonium scavenging efficiencies also had lower CAPE and shallower warm cloud depths, which potentially play a role in causing lower scavenging efficiencies. The fairly constant scavenging efficiencies with different storm severity indicate that in-cloud scavenging is the dominant scavenging mechanism. The nitrate aerosol mass apparent scavenging efficiencies can be lower than the sulfate and ammonium scavenging efficiencies. For some storms the nitrate aerosol mass concentration in the outflow region of the storm is higher than its concentration in the air ingested by the storm in the BL. Examination of the clear air vertical profiles and their back trajectories suggest that entrainment of an elevated particulate nitrate mid-troposphere layer in some northeast Colorado/southwest Nebraska storms partially contributes to the higher nitrate concentrations in the outflow region. The production of NOx from lightning followed by photochemical production of HNO3 and its partitioning onto existing particles in the convective outflow can also contribute to higher particulate nitrate concentrations in the outflow region. A prescribed cloud parcel model with chemistry calculation shows that 100–200 pptv of HNO3 (0.28–0.56 µg SD m−3) can be produced for ∼ 1 ppbv NO emitted into the mid to upper updraft region of the cloud. While partitioning onto aerosols depends on the thermodynamic state, it is expected that this lightning-NOx production is sufficient for explaining the high aerosol nitrate concentrations in several storms. To better quantify the influence of lightning-NOx emissions on particulate nitrate concentrations in convective outflow regions, detailed cloud-scale chemistry transport modeling should be performed. The particulate organic nitrate scavenging efficiencies range from 11 %–57 % for four DC3 storms with no obvious trend with storm severity, while particulate inorganic nitrate scavenging efficiencies for two DC3 storms are ∼ 40 % and match the total particulate nitrate scavenging for the two storms. In summary, the derived nitrate apparent scavenging efficiencies are influenced by entrainment and lightning-NOx production with gas-aerosol partitioning, suggesting that chemistry transport models must represent these processes well within their convective schemes.
The observationally-derived scavenging efficiencies for organic aerosol mass concentrations are greater than 60 % in most of the storms but is 20 %–50 % in three less severe storms. The DC3 storms in Colorado with elevated organic aerosol concentrations located in a mid-troposphere layer may have reduced the apparent OA scavenging efficiencies, but these same storms also had low CAPE and shallow warm cloud depths, which may also have affected the scavenging. The SEAC4RS storms exhibit influences by aqueous-phase production of OA, resulting in one storm having a scavenging efficiency < 50 %. The ratio of the AMS 44 measurement can be used as a proxy for oxalate to sulfate as an indicator of cloud chemistry (Hilario et al., 2021). The higher 44 to sulfate ratios found in the outflow region compared to the atmospheric boundary layer indicate that cloud chemistry likely affects the calculated scavenging efficiency. This is supported by the prescribed cloud parcel model with chemistry calculations that shows SOA mass from oxalic acid to be 0.5 µg C SD m−3 and from the sum of semi-volatile organic compounds to be 2.4 µg C SD m−3. Thus, organic aerosol scavenging efficiencies can be influenced by cloud chemistry, suggesting that chemistry transport models should include organic aqueous-phase cloud chemistry production of aerosols.
The conclusions from this analysis are limited by a number of factors. The uncertainties associated with the scavenging efficiency calculations due to the uncertainties in the aerosol concentration measurements, the derived entrainment rates, and the estimated inflow and outflow time periods. This paper attempts to quantify these uncertainties, which are mostly < 10 % of the average for sulfate and ammonium scavenging efficiencies and < 16 % for particulate nitrate and organic aerosol scavenging efficiencies. Explanations for why particulate nitrate scavenging efficiencies are lower for some cases are based on simple calculations of entrainment effects and potential impacts of lightning-produced nitrogen oxides. Detailed cloud-resolving chemistry transport modeling can extend our knowledge for both these processes (e.g., Cummings et al., 2024; Pickering et al., 2024). Likewise, the explanations for why organic aerosol scavenging efficiencies are lower in some cases are based on simple parcel model calculations of the aqueous-phase production of organic acids. A more complete representation of gas and aqueous-phase chemistry coupled with aerosol thermodynamics and SOA formation in a cloud-resolving chemistry transport model would provide better quantification of the contribution of aqueous-phase chemistry.
Since scavenging of aerosols by clouds directly affects the aerosol concentrations and lifetime in the atmosphere, this important sink is critical for representing well in air quality and climate models because of the role aerosols have on human health and the atmosphere's energy balance. The analysis presented in this paper highlights that processes within deep convection should be considered together. That is, instead of isolating convective transport and wet scavenging from gas and aqueous-phase chemistry and lightning-NOx production, all these processes should be represented together in the parameterization of convection. While it is especially difficult for regional and global scale models to represent the specific storm cases analyzed in this paper, connecting this analysis with a hierarchy of chemistry transport models, cloud scale to regional scale to global scale, is a way to utilize this detailed observational analysis. The results presented here can be used directly for evaluating cloud-scale chemistry transport model representation of aerosol scavenging. Then, the cloud-scale model results can be expanded to examine ratios of aerosol concentrations to trace gases that are primarily transported through convection. These ratios can then be evaluated in the regional and global scale chemistry transport models. This hierarchical modeling approach, which has not been performed in the past for scavenging studies as far as we know, should also benefit investigations of other chemistry and aerosols processes (e.g., aerosol-cloud interactions) occurring in clouds.
The Extended AIM (E-AIM) aerosol thermodynamics model is available at https://www.aim.env.uea.ac.uk/aim/aim.php (last access: 8 July 2026).
The NCAR Command Language version 6.6.2 (2019) was used for the data analysis and is available at https://www.ncl.ucar.edu/ (last access: 8 July 2026). The cloud chemistry box model source code and input files are available upon request to the corresponding author. The AMATI package is available at https://gitlab.com/JimenezGroup/amati (last access: 8 July 2026).
All data from the DC3 field project can be found at http://data.eol.ucar.edu/master_list/?project=DC3 (last access: 8 July 2026). Specifically, the DC3 and SEAC4RS aircraft data are located at http://www-air.larc.nasa.gov/cgi-bin/ArcView/dc3-seac4rs and https://www-air.larc.nasa.gov/cgi-bin/ArcView/seac4rs (last access: 8 July 2026), respectively. NWS radiosonde data are from the NOAA National Centers for Environmental Information and University of Wyoming archive (https://weather.uwyo.edu/upperair/sounding.shtml (last access: 8 July 2026), respectively. Output from the reprocessed AMS data, NEXRAD composite radar data processed by GridRad, and the cloud chemistry box model output are available from the Zenodo data repository (https://doi.org/10.5281/zenodo.18089618, Barth, 2026).
The supplement related to this article is available online at https://doi.org/10.5194/acp-26-9907-2026-supplement.
MB designed and carried out the analysis. PCJ and JLJ collected the AMS measurements, advised on the analysis method, and provided insight and interpretations of the measurements. GC and AP advised on the analysis method and interpretation of the results. MRAH provided back-trajectory information and GL conducted the sulfate to oxalate analysis, both under the guidance of AS. MB prepared the manuscript with contributions from all co-authors.
At least one of the (co-)authors is a member of the editorial board of Atmospheric Chemistry and Physics. The peer-review process was guided by an independent editor, and the authors also have no other competing interests to declare.
Publisher's note: Copernicus Publications remains neutral with regard to jurisdictional claims made in the text, published maps, institutional affiliations, or any other geographical representation in this paper. The authors bear the ultimate responsibility for providing appropriate place names. Views expressed in the text are those of the authors and do not necessarily reflect the views of the publisher.
The authors thank the DC3 and SEAC4RS Science and Logistics teams for the successful execution of the two field campaigns. We thank Cameron Homeyer (University of Oklahoma) for processing the data from multiple radars, providing three-dimensional composites. We would like to acknowledge the use of the Casper system (https://ncar.pub/casper, last access: 8 July 2026) supported by the NSF National Center for Atmospheric Research (NCAR) at the NSF NCAR-Wyoming Supercomputing Center, sponsored by the National Science Foundation and the State of Wyoming. Miguel Ricardo A. Hilario acknowledges support from the UCAR Next Generation Fellowship and the NSF NCAR Graduate Visitor Program. Genevieve Rose Lorenzo acknowledges support from the NSF NCAR/ACOM Ralph Cicerone Fellowship. The authors very much appreciate the reviews of the paper by the anonymous reviewers and by Behrooz Roozitalab and Warren Smith.
This research has been supported by the NASA Headquarters (grant no. 80NSSC21K1347) and the NSF Directorate for Geosciences, Division of Atmospheric and Geospace Sciences (grant no. 1852977). This material is based upon work supported by the NSF National Center for Atmospheric Research, which is a major facility sponsored by the National Science Foundation under Cooperative Agreement No. 1852977.
This material is based upon work supported by the NSF National Center for Atmospheric Research, which is a major facility sponsored by the National Science Foundation under Cooperative Agreement No. 1852977.
This paper was edited by Jianzhong Ma and reviewed by four anonymous referees.
Abdul-Razzak, H. and Ghan, S. J.: A parameterization of aerosol activation, 2, Multiple aerosol types, J. Geophys. Res., 105, 6837–6844, https://doi.org/10.1029/1999JD901161, 2000.
Allen, D. J., Pickering, K. E., Pinder, R. W., Henderson, B. H., Appel, K. W., and Prados, A.: Impact of lightning-NO on eastern United States photochemistry during the summer of 2006 as determined using the CMAQ model, Atmos. Chem. Phys., 12, 1737–1758, https://doi.org/10.5194/acp-12-1737-2012, 2012.
Bahreini, R., Ervens, B., Middlebrook, A. M., Warneke, C., de Gouw, J. A., DeCarlo, P. F., Jimenez, J. L., Brock, C. A., Neuman, J. A., Ryerson, T. B., Stark, H., Atlas, E., Brioude, J., Fried, A., Holloway, J. S., Peischl, J., Richter, D., Walega, J., Weibring, P., and Fehsenfeld, F. C.: Organic aerosol formation in urban and industrial plumes near Houston and Dallas, Texas, J. Geophys. Res., 114, D00F16, https://doi.org/10.1029/2008JD011493, 2009.
Barth, M.: Aerosol Scavenging in DC3 and SEAC4RS Deep Convective Storms, Zenodo [data set], https://doi.org/10.5281/zenodo.20383616, 2026.
Barth, M. C., Hegg, D. A., and Hobbs, P. V.: Numerical modeling of cloud and precipitation chemistry associated with two rainbands and some comparisons with observations, J. Geophys. Res., 97, 5825–5845, https://doi.org/10.1029/92JD00464, 1992.
Barth, M. C., Cantrell, C. A., Brune, W. H., Rutledge, S. A., Crawford, J. H., Huntrieser, H., Carey, L. D., MacGorman, D., Weisman, M., Pickering, K. E., Bruning, E., Anderson, B., Apel, E., Biggerstaff, M., Campos, T., Campuzano-Jost, P., Cohen, R., Crounse, J., Day, D. A., Diskin, G., Flocke, F., Fried, A., Garland, C., Heikes, B., Honomichl, S., Hornbrook, R., Huey, L. G., Jimenez, J., Lang, T., Lichtenstern, M., Mikoviny, T., Nault, B., O'Sullivan, D., Pan, L., Peischl, J., Pollack, I., Richter, D., Riemer, D., Ryerson, T., Schlager, H., St. Clair, J., Walega, J., Weibring, P., Weinheimer, A., Wennberg, P., Wisthaler, A., Wooldridge, P., and Ziegler, C.: The Deep Convective Clouds and Chemistry (DC3) Field Campaign, Bull. Am. Meteorol. Soc., 96, 1281–1309, https://doi.org/10.1175/BAMS-D-13-00290.1, 2015.
Barth, M. C., Bela, M. M., Fried, A., Wennberg, P., Crounse, J., St. Clair, J., Blake, N., Blake, D. R., Homeyer, C. R., Brune, W. H., Zhang, L., Mao, J., Ren, X., Ryerson, T., Pollack, I. B., Peischl, J., Cohen, R. C., Nault, B. A., Huey, L. G., Liu, X., and Cantrell, C. A.: Convective Transport and Scavenging of Peroxides by Thunderstorms Observed over the Central U.S. during DC3, J. Geophys. Res., 121, 4272–4295, https://doi.org/10.1002/2015JD024570, 2016.
Barth, M. C., Ervens, B., Herrmann, H., Tilgner, A., McNeill, V. F., Tsui, W. G., Deguillaume, L., Chaumerliac, N., Carlton, A., and Lance, S. M.: Box model intercomparison of cloud chemistry, J. Geophys. Res., 126, https://doi.org/10.1029/2021JD035486, 2021.
Bela, M. M., Barth, M. C., Toon, O. B., Fried, A., Homeyer, C. R., Morrison, H., Cummings, K. A., Li, Y., Pickering, K. E., Allen, D., Yang, Q., Wennberg, P. O., Crounse, J. D., St. Clair, J. M., Teng, A. P., O'Sullivan, D., Huey, L. G., Chen, D., Liu, X., Blake, D., Blake, N., Apel, E., Hornbrock, R. S., Flocke, F., Campos, T., and Diskin, G.: Wet scavenging of soluble species in DC3 deep convective storms using aircraft observations and WRF-Chem simulations, J. Geophys. Res., 121, 4233– 4257, https://doi.org/10.1002/2015JD024623, 2016.
Bela, M. M., Barth, M. C., Toon, O. B., Fried, A., Ziegler, C., Cummings, K. A., Li, Y., Pickering, K. E., Homeyer, C. R., Morrison, H., Yang, Q., Mecikalski, R. M., Carey, L., Biggerstaff, M. I., Betten, D. P., and Alford, A. A.: Effects of scavenging, entrainment, and aqueous chemistry on peroxides and formaldehyde in deep convective outflow over the central and Southeast U.S., J. Geophys. Res., 123, 7594– 7614, https://doi.org/10.1029/2018JD028271, 2018.
Blando, J. D. and Turpin, B. J.: Secondary organic aerosol formation in cloud and fog droplets: A literature evaluation of plausibility, Atmos. Environ., 34, 1623–1632, https://doi.org/10.1016/S1352-2310(99)00392-1, 2000.
Borbon, A., Ruiz, M., Bechara, J., Aumont, B., Chong, M., Huntrieser, H., Mari, C., Reeves, C. E., Scialom, G., Hamburger, T., Stark, H.., Afif, C., Jambert, C. Mills, G., Schlager, H., and Perros, P. E.: Transport and chemistry of formaldehyde by mesoscale convective systems in West Africa during AMMA 2006, J. Geophys. Res., 117, D12301, https://doi.org/10.1029/2011JD017121, 2012.
Campuzano-Jost, P., Sueper, D. S., Clegg, S. L., Nault, B., Guo, H., and Jimenez, J. L.: Introducing AMATI, a new tool for rapid aerosol thermodynamic calculations on large field datasets, AGU Fall Meeting 2021, New Orleans, Louisiana, USA, 13–17 December 2021, A45X-2177, https://agu.confex.com/agu/fm21/meetingapp.cgi/Paper/983500 (last access: 8 July 2026), 2021.
Canagaratna, M. R., Jayne, J. T., Jimenez, J. L., Allan, J. D., Alfarra, M. R., Zhang, Q., Onasch, T. B., Drewnick, F., Coe, H., Middlebrook, A., Delia, A., Williams, L. R., Trimborn, A. M., Northway, M. J., DeCarlo, P. F., Kolb, C. E., Davidovits, P., and Worsnop, D. R.: Chemical and microphysical characterization of ambient aerosols with the Aerodyne aerosol mass spectrometer, Mass Spectrom. Rev., 26, 185–222, https://doi.org/10.1002/mas.20115, 2007.
Chan, K. R., Dean-Day, J., Bowen, S. W., and Bui, T. P.: Turbulence measurements by the DC-8 meteorological measurement system, Geophys. Res. Lett., 25, 1355–1358. https://doi.org/10.1029/97GL03590, 1998.
Chen, Y., Xu, L., Humphry, T., Hettiyadura, A. P. S., Ovadnevaite, J., Huang, S., Poulain, L., Schroder, J. C., Campuzano-Jost, P., Jimenez, J. L., Herrmann, H., O'Dowd, C., Stone, E. A., and Ng, N. L.: Response of the Aerodyne aerosol mass spectrometer to inorganic sulfates and organosulfur compounds: Applications in field and laboratory measurements, Environ. Sci. Technol., 53, 5176–5186, https://doi.org/10.1021/acs.est.9b00884 2019.
Clegg, S. L., Brimblecombe, P., and Wexler, A. S.: Thermodynamic model of the system H+-NH-SO-NO-H2O at tropospheric temperatures, J. Phys. Chem. A, 102, 2137–2154, https://doi.org/10.1021/jp973043j, 1998.
Cohan, D. S., Schultz, M. G., Jacob, D. J., Heikes, B. G., and Blake, D. R.: Convective injection and photochemical decay of peroxides in the tropical upper troposphere: Methyl iodide as a tracer of marine convection, J. Geophys. Res., 104, 5717–5724, https://doi.org/10.1029/98JD01963, 1999.
Cotton, W. R., Bryan, G. H., and van den Heever, S. C.: Storm and Cloud Dynamics: The Dynamics of Clouds and Precipitating Mesoscale Systems, Dynamics of clouds and precipitating mesoscale systems, 2nd Edn., International geophysics series, Academic Press, Elsevier, ISBN-10 0120885425, ISBN-13 978-0120885428, 2011.
Croft, B., Lohmann, U., Martin, R. V., Stier, P., Wurzler, S., Feichter, J., Posselt, R., and Ferrachat, S.: Aerosol size-dependent below-cloud scavenging by rain and snow in the ECHAM5-HAM, Atmos. Chem. Phys., 9, 4653–4675, https://doi.org/10.5194/acp-9-4653-2009, 2009.
Crounse, J. D., McKinney, K. A., Kwan, A. J., and Wennberg, P. O.: Measurement of gas-phase hydroperoxides by chemical ionization mass spectrometry, Anal. Chem., 78, 6726–6732, https://doi.org/10.1021/ac0604235, 2006.
Cuchiara, G. C., Fried, A., Barth, M. C., Bela, M., Homeyer, C. R., Gaubert, B., Walega, J., Weibring, P., Richter, D., Wennberg, P., Crounse, J., Kim, M., Diskin, G., Hanisco, T. M., Wolfe, G. M., Beyersdorf, A., Peischl, J., Pollack, I. B., St. Clair, J. M., Woods, S., Tanelli, S., Bui, T. P., Dean-Day, J., Huey, G. L., and Heath, N.: Vertical transport, entrainment, and scavenging processes affecting trace gases in a modeled and observed SEAC4RS case study, J. Geophys. Res., 125, e2019JD031957, doi.org:10.1029/2019JD031957, 2020.
Cuchiara, G. C., Fried, A., Barth, M. C., Bela, M., Homeyer, C. R., Walega, J., Weibring, P., Richter, D., Woods, S., Beyersdorf, A., Bui, T. P., and Dean-Day, J.: Effect of marine and land convection on wet scavenging of ozone precursors observed during a SEAC4RS case study, J. Geophys. Res., 28, e2022JD037107, https://doi.org/10.1029/2022JD037107, 2023.
Cummings, K. A., Pickering, K. E., Barth, M. C., Bela, M. M., Li, Y., Allen, D., Bruning, E., MacGorman, D. R., Ziegler, C. L., Biggerstaff, M. I., Fuchs, B., Davis, T., Carey, L., Mecikalski, R. M., and Finney, D. L.: Evaluation of lightning flash rate parameterizations in a cloud-resolved WRF-Chem simulation of the 29–30 May 2012 Oklahoma severe supercell system observed during DC3, J. Geophys. Res., 129, e2023JD039492, doi.org:10.1029/2023JD039492, 2024.
Day, D. A., Campuzano-Jost, P., Nault, B. A., Palm, B. B., Hu, W., Guo, H., Wooldridge, P. J., Cohen, R. C., Docherty, K. S., Huffman, J. A., de Sá, S. S., Martin, S. T., and Jimenez, J. L.: A systematic re-evaluation of methods for quantification of bulk particle-phase organic nitrates using real-time aerosol mass spectrometry, Atmos. Meas. Tech., 15, 459–483, https://doi.org/10.5194/amt-15-459-2022, 2022.
DeCarlo, P., Kimmel, J., Trimborn, A., Northway, M., Jayne, J., Aiken, A., Gonin, M., Fuhrer, K., Horvath, T., Docherty, K., Worsnop, D., and Jimenez, J.: Field-deployable, high-resolution, time-of-flight aerosol mass spectrometer, Anal. Chem., 78, 8281–8289, https://doi.org/10.1021/ac061249n, 2006.
de Gouw, J. and Warneke, C:, Measurements of volatile organic compounds in the Earth's atmosphere using proton-transfer-reaction mass spectrometry, Mass Spectrom. Rev., 26, 223–257, https://doi.org/10.1002/mas.20119, 2007.
Dibb, J. E., Talbot, R. W., Scheuer, E. M., Seid, G., Avery, M. A., and Singh, H. B.: Aerosol chemical composition in Asian continental outflow during the TRACE-P campaign: Comparison with PEM-West B, J. Geophys. Res., 108, 8815–8815, https://doi.org/10.1029/2002JD003111, 2003.
Dickerson, R. R., Huffman, G. J., Luke, W. T., Nunnermacker, L. J., Pickering, K. E., Leslie, A. C. D., Lindsey, C. G., Slinn, W. G. N., Kelly, T. J., Daum, P. H., Delany, A. C., Greenberg, J. P., Zimmerman, P. R., Boatman, J. F., Ray, J. D., and Stedman, D. H.: Thunderstorms: An important mechanism in the transport of air pollutants, Science, 235, 460–465, https://doi.org/10.1126/science.235.4787.460, 1987.
Ervens, B., Carlton, A. G., Turpin, B. J., Altieri, K. E., Kreidenweis, S. M., and Feingold, G.: Secondary organic aerosol yields from cloud-processing of isoprene oxidation products, Geophys. Res. Lett., 35, L02816, https://doi.org/10.1029/2007GL031828, 2008.
Ervens, B., Turpin, B. J., and Weber, R. J.: Secondary organic aerosol formation in cloud droplets and aqueous particles (aqSOA): A review of laboratory, field and model studie, Atmos. Chem. Phys., 11, 11069–11102, https://doi.org/10.5194/acp-11-11069-2011, 2011.
Faloona, I. C., Tan, D., Lesher, R. L., Hazen, N. L., Frame, C. L., Simpas, J. B., Harder, H., Martinez, M., Di Carlo, P., Ren, X. R., and Brune, W. H.: A laser-induced fluorescence instrument for detecting tropospheric OH and HO2: Characteristics and calibration, J. Atmos. Chem., 47, 139–167, https://doi.org/10.1023/B:JOCH.0000021036.53185.0e, 2004.
Farmer, D. K., Matsunaga, A., Docherty, K. S., Surratt, J. D., Seinfeld, J. H., Ziemann, P. J., and Jimenez, J. L.: Response of an aerosol mass spectrometer to organonitrates and organosulfates and implications for atmospheric chemistry, P. Natl. Acad. Sci. USA, 107, 6670–6675, https://doi.org/10.1073/pnas.0912340107, 2010.
Flossmann, A. I.: The scavenging of two different types of marine aerosol particles calculated using a two-dimensional detailed cloud model, Tellus B, 43, 301–321, https://doi.org/10.1034/j.1600-0889.1991.t01-2-00004.x, 1991.
Flossmann, A. I., Hall, W. D., and Pruppacher, H. R.: A theoretical study of the wet removal of atmospheric pollutants, Part I: The redistribution of aerosol particles captured through nucleation and impaction scavenging by growing cloud drops, J. Atmos. Sci., 42, 583–606, https://doi.org/10.1175/1520-0469(1985)042<0583:ATSOTW>2.0.CO;2, 1985.
Fried, A., Barth, M. C., Bela, M., Weibring, P., Richter, D., Walega, J., Li, Y., Pickering, K. E., Apel, E., Hornbrock, R. S., Hills, A., Riemer, D. D., Blake, N., Blake, D., Schroeder, J. R., Luo, Z. J., Crawford, J. H., Olson, J., Rutledge, S., Betten, D., Biggerstaff, M. I., Diskin, G., Sachse, G., Campos, T., Flocke, F., Weinheimer, A., Cantrell, C., Pollack, I., Peischl, J., Froyd, K., Wisthaler, A., Mikoviny, T., and Woods, S.: Convective Transport of formaldehyde to the upper troposphere and lower stratosphere and associated scavenging in thunderstorms over the Central United States during the 2012 DC3 study, J. Geophys. Res., 120, 7430–7460, https://doi.org/10.1002/2015JD024477, 2016.
Friese, E. and Ebel, A.: Temperature dependent thermodynamic model of the system H+-NH-Na+-SO-NO-Cl−-H2O, J. Phys. Chem. A, 114, 11595–11631, https://doi.org/10.1021/jp101041j, 2010.
Gong, W., Stroud, C., and Zhang, L.: Cloud processing of gases and aerosols in air quality modeling, Atmosphere, 2, 567–616, https://doi.org/10.3390/atmos2040567, 2011.
Guo, H., Sullivan, A. P., Campuzano-Jost, P., Schroder, J. C., Lopez-Hilfiker, F. D., Dibb, J. E., Jimenez, J. L., Thornton, J. A., Brown, S. S., Nenes, A., and Weber, R. J.: Fine particle pH and the partitioning of nitric acid during winter in the northeastern United States, J. Geophys. Res., 121, 500, https://doi.org/10.1002/2016JD025311, 2016.
Guo, H., Campuzano-Jost, P., Nault, B. A., Day, D. A., Schroder, J. C., Kim, D., Dibb, J. E., Dollner, M., Weinzierl, B., and Jimenez, J. L.: The importance of size ranges in aerosol instrument intercomparisons: A case study for the Atmospheric Tomography Mission, Atmos. Meas. Tech., 14, 3631–3655, https://doi.org/10.5194/amt-14-3631-2021, 2021.
Hegg, D. A. and Hobbs, P. V.: Cloud water chemistry and the production of sulfates in clouds, Atmos. Environ., 15, 1597–1604, https://doi.org/10.1016/0004-6981(81)90144-X, 1981.
Hegg, D. A. and Hobbs, P. V.: Measurements of sulfate production in natural clouds, Atmos. Environ., 16, 2663–2668, https://doi.org/10.1016/0004-6981(82)90348-1, 1982.
Hegg, D. A., Hobbs, P. V., and Radke, L. F.: Measurements of the scavenging of sulfate and nitrate in clouds, Atmos. Environ., 18, 1939–1946, https://doi.org/10.1016/0004-6981(84)90371-8, 1984.
Hilario, M. R. A., Crosbie, E., Bañaga, P. A., Betito, G., Braun, R. A., Cambaliza, M. O., Corral, A. F., Cruz, M. T., Dibb, J., Lorenzo, G. R., MacDonald, A. B., Robinson, C. E., Shook, M. A., Simpas, J. B., Stahl, C., Winstead, E., Ziemba, L., and Sorooshian, A.: Particulate oxalate-to-sulfate ratio as an aqueous processing marker: Similarity across field campaigns and limitations, Geophys. Res. Lett., 48, e2021GL096520, https://doi.org/10.1029/2021GL096520, 2021.
Hilario, M. R. A., Barth, M., Bennett, R., Crosbie, E., DiGangi, J. P., Diskin, G. S., Lorenzo, G. R., Rutledge, S., Martin, M. Y., Ziemba, L., and Sorooshian, A.: Quantifying scavenging efficiencies of different aerosol species and size-resolved volume concentrations in tropical convective clouds over the West Pacific, J. Atmos. Sci., 82, 267–282, https://doi.org/10.1175/JAS-D-24-0064.1, 2025.
Homeyer, C. R. and Bowman, K. P.: Algorithm description document for version 3.1 of the three-dimensional gridded NEXRAD WSR-88D radar (GridRad) [Dataset Technical Report], University of Oklahoma, http://gridrad.org/pdf/GridRad-v3.1-Algorithm-Description.pdf (last accessed: 11 August 2025), 2017.
IPCC: Climate Change 2021: The Physical Science Basis, Contribution of Working Group I to the Sixth Assessment Report of the Intergovernmental Panel on Climate Change, edited by: Masson-Delmotte, V., Zhai, P., Pirani, A., Connors, S. L., Péan, C., Berger, S., Caud, N., Chen, Y., Goldfarb, L., Gomis, M. I., Huang, M., Leitzell, K., Lonnoy, E., Matthews, J. B. R., Maycock, T. K., Waterfield, T., Yelekçi, O., Yu, R., and Zhou, B., Cambridge University Press, Cambridge, United Kingdom and New York, NY, USA, 2391 pp., https://doi.org/10.1017/9781009157896, 2021.
Jensen, J. B. and Charlson, R. J.: On the efficiency of nucleation scavenging, Tellus B, 36B, 367–375, https://doi.org/10.1111/j.1600-0889.1984.tb00255.x, 1984.
Jones, A. C., Hill, A., Hemmings, J., Lemaitre, P., Quérel, A., Ryder, C. L., and Woodward, S.: Below-cloud scavenging of aerosol by rain: A review of numerical modelling approaches and sensitivity simulations with mineral dust in the Met Office's Unified Model, Atmos. Chem. Phys., 22, 11381–11407, https://doi.org/10.5194/acp-22-11381-2022, 2022.
Kawamura, K. and Sakaguchi, F.: Molecular distributions of water soluble dicarboxylic acids in marine aerosols over the Pacific Ocean including tropics, J. Geophys. Res., 104, 3501–3509, https://doi.org/10.1029/1998JD100041, 1999.
Lawson, R. P.: Effects of ice particles shattering on the 2D-S probe, Atmos. Meas. Tech., 4, 1361–1381, https://doi.org/10.5194/amt-4-1361-2011, 2011.
Li, E., Pierce, J. R., Juncosa Calahorrano, J. F., Sullivan, A. P., Pollack, I. B., Roscioli, J. R., Caulton, D. R., McCabe, M. E., Jathar, S. H., and Fischer, E. V.: Inorganic nitrogen gas-aerosol partitioning in and around animal feeding operations in northeastern Colorado in late summer 2021, J. Geophys. Res., 129, e2023JD040507, https://doi.org/10.1029/2023JD040507, 2024.
Li, Y., Barth, M. C., Patton, E. G., and Steiner, A. L.: Impact of in-cloud aqueous processes on the chemistry and transport of biogenic volatile organic compounds, J. Geophys. Res., 122, 11131–11153, https://doi.org/10.1002/2017JD026688, 2017.
Liu, X., Huey, L. G., Yokelson, R. J., Selimovic, V., Simpson, I. J., Müller, M., Jimenez, J. L., Campuzano-Jost, P., Beyersdorf, A. J., Blake, D. R., Butterfield, Z., Choi, Y., Crounse, J. D., Day, D. A., Diskin, G. S., Dubey, M. K., Fortner, E., Hanisco, T. F., Hu, W., King, L. E., Kleinman, L., Meinardi, S., Mikoviny, T., Onasch, T. B., Palm, B. B., Peischl, J., Pollack, I. B., Ryerson, T. B., Sachse, G. W., Sedlacek, A. J., Shilling, J. E., Springston, S., St. Clair, J. M., Tanner, D. J., Teng, A. P., Wennberg, P. O., Wisthaler, A., and Wolfe, G. M.: Airborne measurements of western U.S. wildfire emissions: Comparison with prescribed burning and air quality implications, J. Geophys. Res.-Atmos., 122, 6108–6129, https://doi.org/10.1002/2016JD026315, 2017.
McNeill, V. F.: Aqueous organic chemistry in the atmosphere: Sources and chemical processing of organic aerosols, Environ. Sci. Technol., 49, 1237–1244, https://doi.org/10.1021/es5043707, 2015.
Mitra, S. K., Brinkmann, J., and Pruppacher, H. R.: A wind-tunnel study on the drop-to-particle conversion, J. Aerosol Sci., 23, 245–256, https://doi.org/10.1016/0021-8502(92)90326-Q, 1992.
Nah, T., Ji, Y., Tanner, D. J., Guo, H., Sullivan, A. P., Ng, N. L., Weber, R. J., and Huey, L. G.: Real-time measurements of gas-phase organic acids using SF chemical ionization mass spectrometry, Atmos. Meas. Tech., 11, 5087–5104, https://doi.org/10.5194/amt-11-5087-2018, 2018.
Nault, B. A., Garland, C., Pusede, S. E., Wooldridge, P. J., Ullmann, K., Hall, S. R., and Cohen, R. C.: Measurements of CH3O2NO2 in the upper troposphere, Atmos. Meas. Tech., 8, 987–997, https://doi.org/10.5194/amt-8-987-2015, 2015.
Nault, B.. A., Garland, C., Wooldridge, P. J., Brune, W. H., Campuzano-Jost, P., Crounse, J. D., Day, D. A., Dibb, J., Hall, S. R., Huey, L. G., Jimenez, J. L., Liu, X., Mao, J., Mikoviny, T., Peischl, J., Pollack, I. B., Ren, X., Ryerson, T. B., Scheuer, E., Ullmann, K., Wennberg, P. O.,Wisthaler, A., Zhang, L., and Cohen, R. C.: Observational constraints on the oxidation of NOx in the upper troposphere, J. Phys. Chem. A, 120, 1441–1451, https://doi.org/10.1021/acs.jpca.5b07824, 2016.
Nault, B. A., Campuzano-Jost, P., Day, D. A., Jo, D. S., Schroder, J. C., Allen, H. M., Bahreini, R., Bian, H., Blake, D. R., Chin, M., Clegg, S. L., Colarco, P. R., Crounse, J. D., Cubison, M. J., DeCarlo, P. F., Dibb, J. E., Diskin, G. S., Hodzic, A., Hu, W., Katich, J. M., Kim, M. J., Kodros, J. K., Kupc, A., Lopez-Hilfiker, F. D., Marais, E. A., Middlebrook, A. M., Andrew Neuman, J., Nowak, J. B., Palm, B. B., Paulot, F., Pierce, J. R., Schill, G. P., Scheuer, E., Thornton, J. A., Tsigaridis, K., Wennberg, P. O., Williamson, C. J., and Jimenez, J. L.: Chemical transport models often underestimate inorganic aerosol acidity in remote regions of the atmosphere, Commun. Earth Environ., 2, 1–13, https://doi.org/10.1038/s43247-021-00164-0, 2021.
Noone, K. J., Ogren, J. A., Hallberg, A., Heintzenberg, J., Ström, J., Hansson, H.-C., Svenningsson, B., Wiedensohler, A., Fuzzi, S., Facchini, M. C., Arends, B. G., and Berner, A.: Changes in aerosol size- and phase distributions due to physical and chemical processes in fog, Tellus B, 44, 489–504, https://doi.org/10.3402/tellusb.v44i5.15563, 1992.
NWS: Environmental Parameters and Indices, https://www.weather.gov/lmk/indices (last access: 8 July 2026), 2015.
Ohata, S., Moteki, N., Mori, T., Koike, M., and Kondo, Y.: A key process controlling the wet removal of aerosols: New observational evidence, Sci. Rep., 6, 34113, https://doi.org/10.1038/srep34113, 2016.
Pickering, K. E., Li, Y., Cummings, K. A., Barth, M. C., Allen, D. J., Bruning, E. C., and Pollack, I. B.: Lightning NOx in the 29–30 May 2012 Deep Convective Clouds and Chemistry (DC3) severe storm and its downwind chemical consequences, J. Geophys. Res., 129, e2023JD039439, https://doi.org/10.1029/2023JD039439, 2024.
Pollack, I. B., Lerner, B. M., and Ryerson, T. B.: Evaluation of ultraviolet light-emitting diodes for detection of atmospheric NO2 by photolysis – chemiluminescence, J. Atmos. Chem., 65, 111–125, https://doi.org/10.1007/s10874-011-9184-3, 2011.
Pye, H. O. T., Nenes, A., Alexander, B., Ault, A. P., Barth, M. C., Clegg, S. L., Collett Jr., J. L., Fahey, K. M., Hennigan, C. J., Herrmann, H., Kanakidou, M., Kelly, J. T., Ku, I.-T., McNeill, V. F., Riemer, N., Schaefer, T., Shi, G., Tilgner, A., Walker, J. T., Wang, T., Weber, R., Xing, J., Zaveri, R. A., and Zuend, A.: The acidity of atmospheric particles and clouds, Atmos. Chem. Phys., 20, 4809–4888, https://doi.org/10.5194/acp-20-4809-2020, 2020.
Rolph, G., Stein, A., and Stunder, B.: Real-time Environmental Applications and Display sYstem: READY, Environ. Model. Softw., 95, 210–228, https://doi.org/10.1016/j.envsoft.2017.06.025, 2017.
Ryerson, T. B., Williams, E. J., and Fehsenfeld, F. C.: An efficient photolysis system for fast-response NO2 measurements, J. Geophys. Res., 105, 26447–26461, https://doi.org/10.1029/2000JD900389, 2000.
Sachse, G. W., Hill, G. F., Wade, L. O., and Perry, M. G.: Fast-response, high-precision carbon monoxide sensor using a tunable diode laser absorption technique, J. Geophys. Res., 92, 2071–2081, https://doi.org/10.1029/JD092iD02p02071, 1987.
Schill, G. P., Froyd, K. D., Bian, H., Kupc, A., Williamson, C., Brock, C. A., Ray, E., Hornbrook, R. S., Hills, A. J., Apel, E. C., Chin, M., Colarco, P. R., and Murphy, D. M.: Widespread biomass burning smoke throughout the remote troposphere, Nat. Geosci., 13, 422–427, https://doi.org/10.1038/s41561-020-0586-1, 2020.
Schroder, J. C., Campuzano-Jost, P., Day, D. A., Shah, V., Larson, K., Sommers, J. M., Sullivan, A. P., Campos, T., Reeves, J. M., Hills, A., Hornbrook, R. S., Blake, N. J., Scheuuer, E., Guo, H., Fibiger, D. L., McDuffie, E. E., Hayes, P. L., Weber, R. J., Dibb, J. E., Apel, E. C., Jaegle, L., Brown, S. S., Thornton, J. A., and Jimenez, J. L.: Sources and secondary production of organic aerosols in the northeastern United States during WINTER, J. Geophys. Res., 123, 7771–7796, https://doi.org/10.1029/2018JD028475, 2018.
Schueneman, M. K., Nault, B. A., Campuzano-Jost, P., Jo, D. S., Day, D. A., Schroder, J. C., Palm, B. B., Hodzic, A., Dibb, J. E., and Jimenez, J. L.: Aerosol pH indicator and organosulfate detectability from aerosol mass spectrometry measurements, Atmos. Meas. Tech., 14, 2237–2260, https://doi.org/10.5194/amt-14-2237-2021, 2021.
Schwarz, J. P., Samset, B. H., Perring, A. E., Spackman, J. R., Gao, R. S., Stier, P., Schulz, M., Moore, F. L., Ray, E. A., and Fahey, D. W.: Global-scale seasonally resolved black carbon vertical profiles over the Pacific, Geophys. Res. Lett., 40, 5542–5547, https://doi.org/10.1002/2013GL057775, 2013.
Seinfeld, J. H. and Pandis, S. N.: Atmospheric Chemistry and Physics: From Air Pollution to Climate Change, 3rd Edn., John Wiley & Sons, Inc., ISBN 978-1-118-94740-1, 2016.
Simpson, I. J., Akagi, S. K., Barletta, B., Blake, N. J., Choi, Y., Diskin, G. S., Fried, A., Fuelberg, H. E., Meinardi, S., Rowland, F. S., Vay, S. A., Weinheimer, A. J., Wennberg, P. O., Wiebring, P., Wisthaler, A., Yang, M., Yokelson, R. J., and Blake, D. R.: Boreal forest fire emissions in fresh Canadian smoke plumes: C1-C10 volatile organic compounds (VOCs), CO2, CO, NO2, NO, HCN and CH3CN, Atmos. Chem. Phys., 11, 6445–6463, https://doi.org/10.5194/acp-11-6445-2011, 2011.
Skamarock, W. C., Powers, J. G., Barth, M., Dye, J. E., Matejka, T., Bartels, D., Baumann, K., Stith, J., Parrish, D. D., and Hubler, G.: Numerical simulations of the July 10 Stratospheric-Tropospheric Experiment: Radiation, Aerosols, and Ozone/Deep Convection Experiment convective system: Kinematics and transport, J. Geophys. Res., 105, 19973–19990, https://doi.org/10.1029/2000JD900179, 2000.
Sorooshian, A., Lu, M.-L., Brechtel, F. J., Jonsson, H., Feingold, G., Flagan, R. C., and Seinfeld, J. H.: On the source of organic acid aerosol layers above clouds, Environ. Sci. Tech., 41, 4647–4654, https://doi.org/10.1021/es0630442, 2007.
Stein, A. F., Draxler, R. R, Rolph, G. D., Stunder, B. J. B., Cohen, M. D., and Ngan, F.: NOAA's HYSPLIT atmospheric transport and dispersion modeling system, Bull. Am. Meteorol. Soc., 96, 2059–2077, 2015.
Takegawa, N., Miyakawa, T., Kawamura, K., and Kondo, Y.: Contribution of selected dicarboxylic and ω-oxocarboxylic acids in ambient aerosol to the 44 signal of an aerodyne aerosol mass spectrometer, Aerosol Sci. Tech., 41, 418–437, https://doi.org/10.1080/02786820701203215, 2007.
Textor, C., Schulz, M., Guibert, S., Kinne, S., Balkanski, Y., Bauer, S. E., Berntsen, T., Berglen, T. F., Boucher, O., Chin, M., Dentener, F., Diehl, T., Easter, R., Feichter, J., Fillmore, D., Ghan, S., Ginoux, P., Gong, S., Grini, A., Hendricks, J., Horowitz, L., Huang, P., Isaksen, I., Iversen, T., Kloster, S., Koch, D., Kirkevåg, A., Kristjansson, J. E., Krol, M., Lauer, A., Lamarque, J. F., Liu, X., Montanaro, V., Myhre, G., Penner, J., Pitari, G., Reddy, S., Seland, O., Stier, P., Takemura, T., and Tie, X.: Analysis and quantification of the diversities of aerosol life cycles within AeroCom, Atmos. Chem. Phys., 6, 1777–1813, https://doi.org/10.5194/acp-6-1777-2006, 2006.
Toon, O. B., Maring, H., Dibb, J., Ferrare, R., Jacob, D. J., Jensen, E. J., Luo, Z. J., Mace, G. G., Pan, L. L., Pfister, L., Rosenlof, K. H., Redemann, J., Reid, J. S., Singh, H. B., Thompson, A. M., Yokelson, R., Minnis, P., Chen, G., Jucks, K. W., and Pszenny, A.: Planning, implementation, and scientific goals of the Studies of Emissions and Atmospheric Composition, Clouds and Climate Coupling by Regional Surveys (SEAC4RS) field mission, J. Geophys. Res., 121, 4967–5009, https://doi.org/10.1002/2015JD024297, 2016.
Tost, H.: Chemistry–climate interactions of aerosol nitrate from lightning, Atmos. Chem. Phys., 17, 1125–1142, https://doi.org/10.5194/acp-17-1125-2017, 2017.
Tsui, W. G., Woo, J. L., and McNeill, V. F.: Impact of aerosol-cloud cycling on aqueous secondary organic aerosol formation, Atmosphere, 10, 666–666, https://doi.org/10.3390/atmos10110666, 2019.
Vay, S. A., Choi, Y., Vadrevu, K. P., Blake, D. R., Tyler, S. C., Wisthaler, A., Hecobian, A., Kondo, Y., Diskin, G. S., Sachse, G. W., Woo, J.-H., Weinheimer, A. J., Burkhart, J. F., Stohl, A., and Wennberg, P. O.: Patterns of CO2 and radiocarbon across high northern latitudes during IPY 2008, J. Geophys. Res., 116, D14301, https://doi.org/10.1029/2011JD015643, 2011.
Wagner, N. L., Brock, C. A., Angevine, W. M., Beyersdorf, A., Campuzano-Jost, P., Day, D., de Gouw, J. A., Diskin, G. S., Gordon, T. D., Graus, M. G., Holloway, J. S., Huey, G., Jimenez, J. L., Lack, D. A., Liao, J., Liu, X., Markovic, M. Z., Middlebrook, A. M., Mikoviny, T., Peischl, J., Perring, A. E., Richardson, M. S., Ryerson, T. B., Schwarz, J. P., Warneke, C., Welti, A., Wisthaler, A., Ziemba, L. D., and Murphy, D. M.: In situ vertical profiles of aerosol extinction, mass, and composition over the southeast United States during SENEX and SEAC4RS: observations of a modest aerosol enhancement aloft, Atmos. Chem. Phys., 15, 7085–7102, https://doi.org/10.5194/acp-15-7085-2015, 2015.
Wang S. C. and Flagan, R. C.: Scanning Electrical Mobility Spectrometer, Aerosol Sci. Technol., 13, 230–240, https://doi.org/10.1080/02786829008959441, 1990.
Yang, Q., Easter, R. C., Campuzano-Jost, P., Jimenez, J. L., Fast, J. D., Ghan, S. J., Wang, H., Berg, L. K., Barth, M. C., Liu, Y., Shrivastava, M. B., Singh, B., Morrison, H., Fan, J., Ziegler, C. L., Bela, M., Apel, E., Diskin, G. S., Mikoviny T., and Wisthaler, A.: Aerosol transport and wet scavenging in deep convective clouds: A case study and model evaluation using a multiple passive tracer analysis approach, J. Geophys. Res., 120, 8448–8468, https://doi.org/10.1002/2015JD023647, 2015.
Yatavelli, R. L. N., Mohr, C., Stark, H., Day, D. A., Thompson, S. L., Lopez-Hilfiker, F. D., Campuzano-Jost, P.,. Palm, B. B., Vogel, A. L., Hoffmann, T., Heikkinen, L., Äijälä, M., Ng, N. L., Kimmel, J. R., Canagaratna, M. R., Ehn, M., Junninen, H., Cubison, M. J., Petäjä, T., Kulmala, M., Jayne, J. T., Worsnop, D. R., and Jimenez, J. L.: Estimating the contribution of organic acids to northern hemispheric continental organic aerosol, Geophys. Res. Lett., 42, 6084–6090, https://doi.org/10.1002/2015GL064650, 2015.
Yu, J. Z., Huang, X.-F., Xu, J., and Hu, M.: When aerosol sulfate goes up, so does oxalate: Implication for the formation mechanisms of oxalate, Environ. Sci. Tech., 39, 128–133, https://doi.org/10.1021/es049559f, 2005.
Yu, P., Froyd, K. D., Portmann, R. W., Toon, O. B., Freitas, S. R., Bardeen, C. G., Brock, C., Fan, T., Gao, R., Katich, J. M., Kupc, A., Liu, S., Maloney, C., Murphy, D. M., Rosenlof, K. H., Schill, G., Schwarz, J. P., and Williamson, C.: Efficient in-cloud removal of aerosols by deep convection, Geophys. Res. Lett., 46, 1061–1069, https://doi.org/10.1029/2018GL080544, 2019.
Zheng, G., Su, H., and Cheng, Y.: Role of carbon dioxide, ammonia, and organic acids in buffering atmospheric acidity: The distinct contribution in clouds and aerosols, Environ Sci Technol., 57, 12571–12582, https://doi.org/10.1021/acs.est.2c09851, 2023.
Ziemba, L. D., Griffin, R. J., Whitlow, S., and Talbot, R. W.: Characterization of water-soluble organic aerosol in coastal New England: Implications of variations in size distribution, Atmos. Environ., 45, 7319–7329, https://doi.org/10.1016/j.atmosenv.2011.08.022, 2011.
- Abstract
- Introduction
- Field measurements
- Determination of scavenging efficiency
- Cloud chemistry parcel model
- Description of the case studies
- Clear air vertical profiles
- Aerosol scavenging efficiency
- Conclusions
- Code availability
- Data availability
- Author contributions
- Competing interests
- Disclaimer
- Acknowledgements
- Financial support
- Review statement
- References
- Supplement
- Abstract
- Introduction
- Field measurements
- Determination of scavenging efficiency
- Cloud chemistry parcel model
- Description of the case studies
- Clear air vertical profiles
- Aerosol scavenging efficiency
- Conclusions
- Code availability
- Data availability
- Author contributions
- Competing interests
- Disclaimer
- Acknowledgements
- Financial support
- Review statement
- References
- Supplement