
the Creative Commons Attribution 4.0 License.
the Creative Commons Attribution 4.0 License.
 | 09 Jul 2026
Volcanic aerosol effects on warm and cold cloud microphysics: ICON-ART simulations of Holuhraun and La Soufrière eruptions
Julia Bruckert
Gholam Ali Hoshyaripour
Volcanic eruptions are a rich source of particles, such as sulfate and ash, that can act as cloud condensation nuclei (CCN) or ice nucleating particles (INPs). They offer a unique opportunity to study the effects of aerosols on clouds because they create a natural laboratory with high concentrations of aerosols adjacent to an unperturbed environment. In this study, we used the ICON–ART (ICOsahedral Nonhydrostatic weather and climate model with Aerosols and Reactive Trace gases) modeling system to simulate the initial phases of the 2014–2015 Holuhraun and the 2021 La Soufrière eruptions. Our goal was to improve our understanding of how cloud microphysical processes respond to volcanic aerosols. For the Holuhraun eruption, which was non-explosive and rich in SO2, we found that the number concentration of cloud droplets increased significantly due to the presence of volcanic aerosols. Warm rain processes, such as autoconversion and accretion, and consequently rain decreased. Additionally, we found that volcanic aerosols weakened the riming process and reduced the graupel concentration. The La Soufrière eruption provides an opportunity to investigate the competition between homogeneous and heterogeneous ice nucleation because it emitted both ash and SO2. Our results show that ash particles acting as INPs deplete water vapor. This reduces the total number of ice crystals by hindering homogeneous ice nucleation.
- Article
(6190 KB) - Full-text XML
- BibTeX
- EndNote


Depending on their physicochemical properties, aerosols can act as either cloud condensation nuclei (CCN) or ice nucleating particles (INPs). Therefore, changes in aerosol number concentration or chemical composition can affect cloud microphysical processes. However, the response of clouds to such aerosol perturbations is complex and remains subject to considerable uncertainty. Despite many observational and numerical studies attempting to quantify the uncertainty in our understanding of aerosol-cloud interactions (ACI), the impact of aerosols on clouds remains one of the most unresolved questions in climate science (Andreae et al., 2004; Rosenfeld et al., 2008; Tao et al., 2012; Zhao et al., 2024). Twomey (1974) found that higher concentrations of aerosols lead to a higher number of cloud droplets. Consequently, cloud albedo increases due to enhanced scattering, a phenomenon known as the first indirect aerosol effect. Albrecht (1989) hypothesized that aerosol perturbations suppress the formation of warm rain by reducing collision and coalescence processes. This results in less drizzle and allows shallow clouds to retain liquid water for longer, potentially extending their lifetime, which is referred to as the second indirect aerosol effect.
Volcanic eruptions represent a significant source of perturbations in aerosols concentration and composition. Volcanoes emit sulfur dioxide (SO2), which is oxidized mainly by hydroxyl radicals (OH) to form sulfuric acid (H2SO4). Owing to its low volatility, sulfuric acid rapidly condenses or nucleates with water vapor to form sulfate aerosols (Seinfeld and Pandis, 1998). On one hand, sulfate particles can act as CCN for cloud droplets and alter the microphysical properties of warm clouds. On the other hand, they can freeze homogeneously at temperatures below approximately −38 °C (Pruppacher and Klett, 1997; Lohmann et al., 2016) and alter the microphysical properties of cold clouds. At temperatures below −38 °C, ice crystals form homogeneously through the nucleation of ice embryos from supersaturated vapor or supercooled water droplets. As Lohmann et al. (2016) noted, homogeneous ice nucleation from the vapor phase is negligible under typical atmospheric conditions. However, ice crystals in in situ cirrus clouds – those that form without a preexisting liquid cloud – can develop at relative humidities below water saturation. This occurs through homogeneous freezing within liquid aerosol droplets (here sulfate). For a liquid droplet to freeze homogeneously, its water molecules must be in motion and come together in a large enough cluster to initiate ice formation. Dissolved ions in a solution lower the freezing point because higher solute concentrations reduce the availability of unbound water molecules. This raises the thermodynamic barrier to the liquid-to-solid phase transition and suppresses homogeneous ice nucleation (Lohmann et al., 2016). Additionally, since homogeneous ice nucleation is stochastic, the nucleation rate is proportional to the volume of the supercooled solution. This means there is a higher probability that a critical ice embryo will form within the larger droplet (Lohmann et al., 2016). Therefore, larger, more dilute liquid droplets are more likely to freeze than smaller, more concentrated ones (Pruppacher and Klett, 1997; Koop et al., 2000). In addition to influencing CCN activation and homogeneous ice nucleation by emitting sulfate particles, volcanic eruptions can affect ice formation in clouds at temperatures higher than −38 °C by emitting ash particles that serve as INPs. In the atmosphere, water droplets do not immediately freeze at 0 °C and can remain in a supercooled state. Within the temperature range of 0 to −38 °C it is possible to have water vapor, supercooled liquid droplets, and ice crystals present simultaneously. Clouds that represent this three-phase colloidal system are called mixed–phase clouds (MPCs) (Korolev et al., 2017). Ice nucleation in MPCs occurs heterogeneously through four primary mechanisms: deposition nucleation, immersion freezing, condensation freezing, and contact freezing. The presence of ash influences heterogeneous ice nucleation in mixed-phase and ice clouds by affecting immersion freezing and deposition ice nucleation processes (Steinke et al., 2011). When ash particles act as INPs, they consume water vapor, which reduces the maximum supersaturation with respect to ice and suppresses homogeneous nucleation, thereby changing the total number of ice crystals.
The link between volcanic eruptions and weather and climate was first proposed in the 18th century (Schmincke, 2004) and has continued to be explored in recent studies (e.g., Durant et al., 2010; Timmreck, 2012; von Savigny et al., 2020). These studies highlight strong direct interactions between volcanic aerosols and radiation. According to Timmreck (2012), large volcanic eruptions typically lead to surface cooling and stratospheric warming. This is primarily due to the conversion of volcanic SO2 into sulfate aerosols, which scatter incoming solar radiation and contribute to global cooling. Recently, the influence of volcanic aerosols on cloud formation and properties has attracted increasing interest from the weather and climate science communities. Malavelle et al. (2017) studied the effects of a substantial increase in atmospheric SO2 concentrations following the eruption of the Holuhraun volcano in Iceland in the fall of 2014. Using satellite data, they found that the presence of volcanic sulfate particles significantly decreased the effective radius of cloud droplets, though only minor changes in liquid water were observed. Haghighatnasab et al. (2022) investigated the effect of aerosols from the Holuhraun eruption on cloud properties using the ICON (ICOsahedral Nonhydrostatic weather) model (Zängl et al., 2015). While their results showed a significant increase in cloud droplet number concentration, they found no detectable changes in liquid water path (LWP) or cloud fraction attributable to the volcanic aerosols. The results of Peace et al. (2024) showed that air mass history and background meteorological conditions can strongly influence aerosol-cloud interactions. They observed a shift toward smaller and more numerous cloud droplets within the volcanic plume during the first two weeks of the Holuhraun eruption, but this shift was neither observed nor reproduced by models during the third week, when weather conditions were different from the previous two weeks and humidity was lower. While studies have focused on the effect of sulfate particles on warm clouds, fewer have examined the impact of volcanic aerosols on mixed-phase and ice clouds. To this end, researchers have studied ash-rich volcanic eruptions. For example, Steinke et al. (2011) examined the ice nucleation properties of volcanic ash particles collected at a distance of 58 km from the Eyjafjallajökull eruption after the April 2010 event using the AIDA (Aerosol Interaction and Dynamics in the Atmosphere) cloud chamber experiments simulating atmospherically relevant conditions. They observed both ice nucleation by immersion freezing and deposition nucleation, and found that volcanic ash particles initiate deposition nucleation more efficiently than Asian and Saharan dust particles. Lin et al. (2025) investigated the impact of volcanic ash on cirrus cloud properties using satellite measurements. They found evidence of cirrus modification due to volcanic eruptions through ice nucleation on volcanic ash, as indicated by sudden changes in cirrus properties following eruptions. The changes included a significant decrease in the number of ice crystals, an increase in their size, and a higher frequency of cirrus cloud formation following ash-rich volcanic eruptions. In contrast, no such changes were detected following an ash-poor eruption. They attribute the changes in the number and size of ice crystals, as well as the frequency of cirrus clouds, to a cirrus formation mechanism in which volcanic ash acts as a heterogeneous ice nucleating particle, suppressing homogeneous freezing and resulting in fewer, but larger, ice crystals.
Although several recent studies, primarily observational, have examined the effects of volcanic eruptions on clouds, most have focused on the radiative effects associated with changes in cloud droplet number concentration and effective radius. However, there is a clear lack of research investigating how volcanic aerosols affect cloud microphysical processes, particularly in mixed–phase and ice clouds. This study uses numerical simulations to examine how volcanic aerosols impact the microphysical evolution and properties of warm, mixed–phase and ice clouds. The simulations model the initial phase of the 2014–2015 Holuhraun eruption and the 2021 La Soufrière eruption. We selected these cases because the impact of the Holuhraun eruption on warm clouds had already been studied. By examining the processes in mixed-phase clouds, we expanded our understanding of the impact of volcanic aerosols on clouds. We selected the second case, the La Soufrière eruption, because there was previous work with ICON-ART (Aerosols and Reactive Trace gases) on plume development and the direct radiative effects of the eruption.
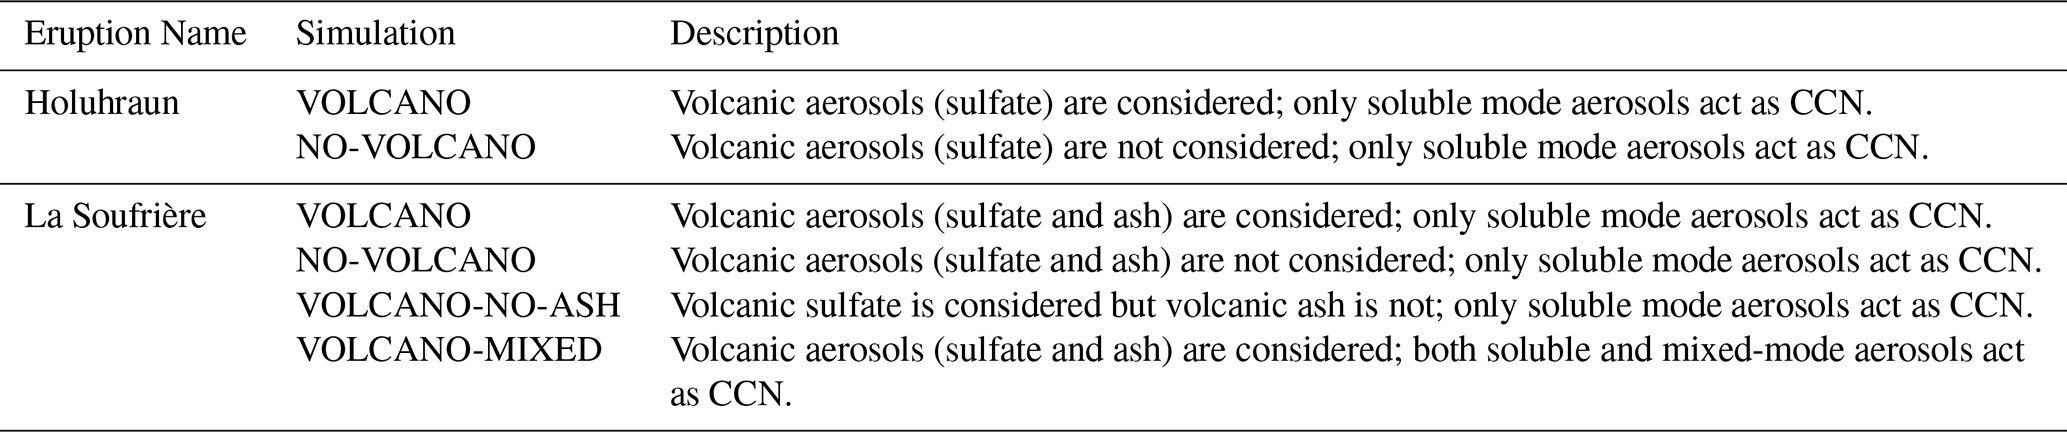
Iceland is home to many active volcanoes. One of these volcanoes is Holuhraun (64.85° N, 16.83° W), which is one of the cases studied in this research. The 2014–2015 Holuhraun volcano started erupting on 31 August 2014 and continued for six months. During this time, it emitted approximately 11 Tg of SO2 into the troposphere (Ilyinskaya et al., 2017). The plume rising from the vent was rich in SO2 and contained large amounts of water vapor, but carried very little volcanic ash (Schmidt et al., 2015). Arason et al. (2015) stated that the maximum plume height close to the eruption site has mainly been in the range 1–3 km above ground and the middle of the plume few kilometers from the eruption site often about 1 km above ground. For the purposes of this study, the eruption is considered to begin at midnight on 1 September, as the SO2 emission rate on 31 August was negligible, according to Carboni et al. (2019). The first six days of the eruption are simulated because the lava field had developed sufficiently, and significant amounts of SO2 were emitted into the atmosphere during this period, as reported by Kolzenburg et al. (2017). To evaluate the influence of volcanic aerosol emissions on cloud microphysical processes and hydrometeors, we conducted a pair of simulations, one with the volcanic plume considered, called VOLCANO, and one without it, called NO-VOLCANO. These two simulations are identical in all other respects, providing a controlled framework for quantifying the pure effect of volcanic aerosols on clouds under the same meteorological conditions. In the VOLCANO simulation, the source strength of SO2 emitted by the Holuhraun eruption is based on the estimate of previous studies, which estimated the SO2 emission rate to be up to 120 kt d−1 in early September 2014 (Schmidt et al., 2015; Malavelle et al., 2017; Carboni et al., 2019). In the NO-VOLCANO simulation, however, the source strength of SO2 was assumed to be zero. Holuhraun is a lava flow field created by fissure eruptions. A fissure is a linear volcanic crater through which lava erupts without explosive activity. In this study, the height of the craters was assumed to be 50 m, based on the estimate in Schmidt et al. (2015). Simulating the Holuhraun eruption, which is rich in SO2, can improve our understanding of the impacts of CCN perturbations in both warm and mixed–phase clouds.
The second case we studied was the La Soufrière volcano (13.20° N, 61.11° W) which is located on the Caribbean island of Saint Vincent. The 2021 La Soufrière eruption started erupting on 9 April 2021 and lasted several days. Unlike the 2014 Holuhraun eruption, the La Soufrière eruption was an explosive eruption characterized by 43 individual eruptive pulses in the first 4 d (Bruckert et al., 2023). This series of eruptions ejected a significant amount of ash and SO2 into the atmosphere, covering the island of Saint Vincent. Most plumes spread near the tropopause at 16–17 km or penetrated the stratosphere at 18–20 km, with overshooting tops reaching up to 23 km (Horváth et al., 2022). This study simulated the first four days of the eruption because most of the eruptive pulses occurred during that time. The volcanic emission setup for simulating this eruption was provided by Bruckert et al. (2023). The presence of both ash and sulfate particles in this case study provides an opportunity to study two key processes. First, the investigation of competition between homogeneous and heterogeneous ice nucleation, Second, the assessment of the behavior of internally mixed aerosols when they act as CCN. The ability of ash particles to act as INPs and the ability of sulfate particles to freeze homogeneously at low temperatures allows us to examine the competition between heterogeneous and homogeneous ice nucleation compared to a sulfate-only scenario where only homogeneous freezing occurs. To evaluate this, we ran three simulations. The first is the VOLCANO simulation, in which the source strength of ash and SO2 is based on the estimate of Bruckert et al. (2023). The second is the VOLCANO-NO-ASH simulation, in which the source strength of SO2 is the same as in the VOLCANO simulation. However, the source strength of ash is assumed to be zero, though ash and sulfate particles are given predefined background values of a number concentration of 100 kg−1 per mode for numerical reasons. The third simulation is the NO-VOLCANO simulation, in which the source strength of both ash and SO2 is zero, and only the background concentrations are considered for both ash and sulfate. The coexistence of ash and sulfate can result in the formation of internally mixed aerosols, wherein insoluble ash particles are coated with soluble sulfate. These aerosols can act as CCN because their outer layer is soluble and hygroscopic. To evaluate the impact of these aerosols acting as CCN on clouds, we ran an additional simulation called VOLCANO-MIXED. This simulation is identical to VOLCANO, except that it allows mixed-mode aerosols to act as CCN in addition to the soluble aerosols.
The name and description of six simulations carried out in this study are outlined in Table 1.
3.1 General setup
In order to accurately simulate the microphysics of clouds formed in the plume – as used here, the term “clouds” refers to meteorological clouds, and the term “plume” refers to the volcanic emissions – and those influenced by volcanic particles transported over long distances, we need detailed information on the efficiency with which aerosols serve as CCN and INPs (Hoose and Möhler, 2012; Ullrich et al., 2017). Additionally, an ice nucleation scheme that accounts for the competition between homogeneous and heterogeneous ice nucleation, INP depletion, and raindrop freezing is essential to evaluate these processes in different ice and mixed–phase cloud regimes (Bangert, 2012; Paukert and Hoose, 2014; Hande and Hoose, 2017; Paukert et al., 2017). The ICON-ART (ICOsahedral Nonhydrostatic weather and climate model with Aerosols and Reactive Trace gases) model meets these requirements. It combines high-resolution simulations with a comprehensive double-moment cloud liquid and ice microphysical scheme (Seifert and Beheng, 2006; Bangert, 2012), along with the aerosol module ART (Rieger et al., 2015; Donner et al., 2016; Gasch et al., 2017; Weimer et al., 2017; Hoshyaripour et al., 2026). The ART module simulates prognostic aerosols by considering the evolution of aerosol concentrations based on physical processes such as emission sources, transport, chemical transformations, and removal processes rather than specifying aerosols as fixed inputs (Rieger et al., 2017; Gruber et al., 2019; Werchner et al., 2022; Seifert et al., 2023). The general simulation setup for all six simulations is summarized in Table 2. As shown there, all simulations were performed on an R2B10 triangular grid with a horizontal resolution of 2.48 km using the limited-area mode (LAM). The Holuhraun ICON domain extends from 50–80° N and 40° W–20° E, as depicted in Fig. 1. The La Soufrière ICON domain extends from 0–26° N and 70–20° W, as shown in Fig. 7. Initial results indicated that volcanic emissions were predominantly transported eastward. Consequently, both domains were designed to extend farther east than west of the volcanoes.
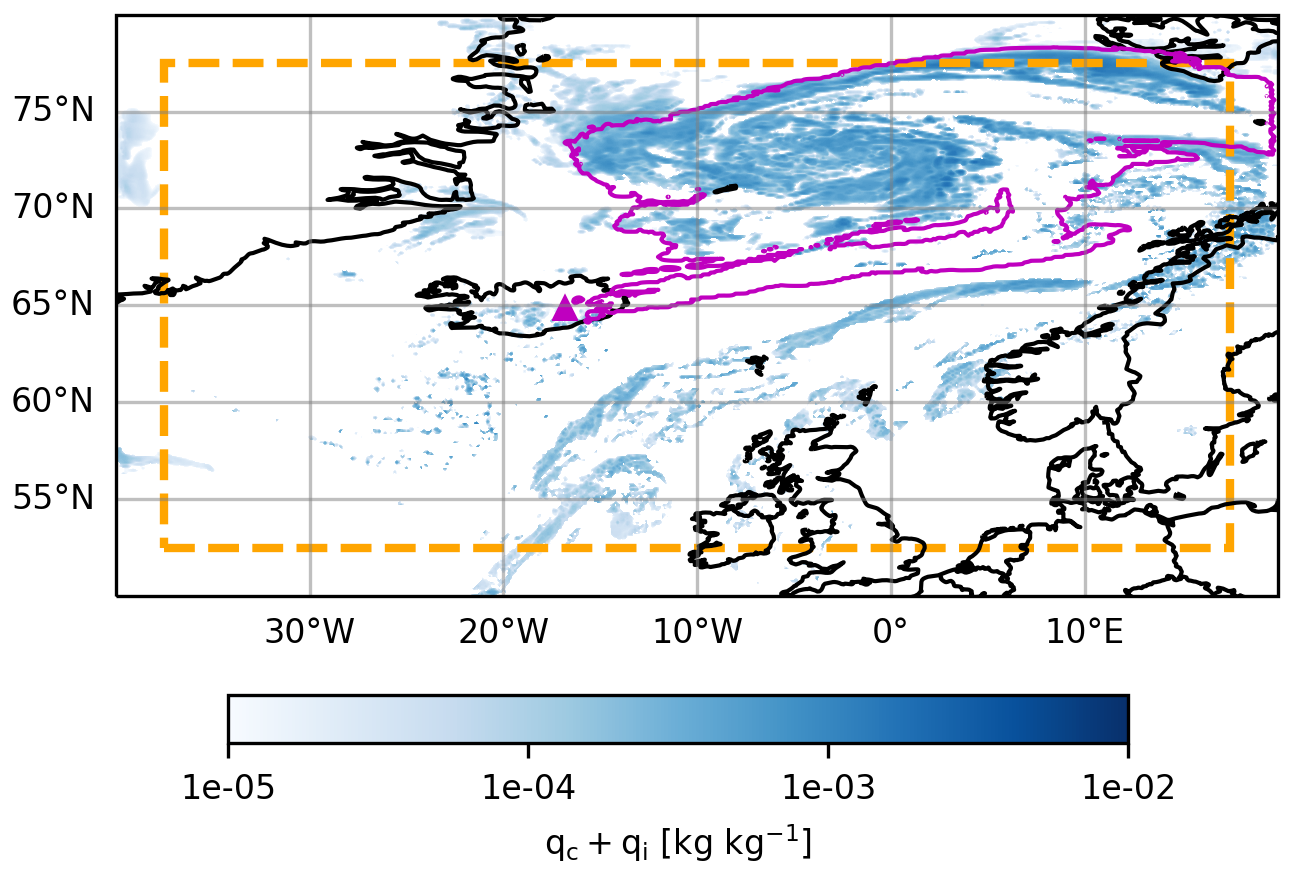
Figure 1Horizontal distribution of the mass mixing ratios of cloud water, qc, and cloud ice, qi, on 3 September 2014 at 23:00 UTC, at an altitude of 1580 m, the level of maximum aerosol content. The cloud mass is indicated by the blue spectrum, and the purple contour shows the sulfate mass equal to 10−12 kg kg−1, which defines the boundary between the regions inside and outside of the volcanic plume. Areas outside the orange box are excluded from the analysis, corresponding to approximately 278 km in the meridional (north–south) direction and 117 km in the zonal (east–west) direction (on average). The magenta triangle marks the location of the Holuhraun volcano.
Table 1Simulations conducted for each eruption and their descriptions.

In addition to the processes represented in ICON, such as advection, turbulence, diffusion, and changes due to subgrid-scale convective transport, the ART module incorporates aerosol-related processes, including sedimentation, washout, coagulation, condensation from the gas phase, radioactive decay, emissions, chemical reaction rates of gaseous species, aerosol nucleation, and interactions between aerosol particles and other physical parameterizations. The latter include cloud microphysical processes, such as CCN activation and INP nucleation. This study employed AERODYN (AEROsol DYNamics), a recently implemented aerosol dynamics module in ART based on the research of Muser et al. (2020). The AERODYN module represents aerosol size distributions in Aitken, accumulation, coarse, and giant modes. It also categorizes particles into three mixing states – soluble, insoluble, and mixed – based on their water solubility. Although the module has the capability to consider various types of aerosols (Hoshyaripour et al., 2026), this study focuses on sea salt (Na+ and Cl−) as the background aerosol, which is calculated prognostically from parameterized emission functions (Monahan et al., 1986; Smith and Harrison, 1998; Mårtensson et al., 2003), as well as sulfate and volcanic ash as the volcanic aerosol components. Further primary and secondary sources, such as continental aerosol emissions or gaseous precursors from the oceans, are neglected in order to investigate the effects of volcanic emissions compared to the dominant natural marine aerosol. Table 3 summarizes the modes and solubility characteristics of the aerosols used in this study.
Table 3Aerosol components and relevant modes in all simulations. A value of “1” indicates inclusion in the simulations, and a value of “0” indicates exclusion. “Accum.” is short for “accumulation”.

The prognostic aerosols simulated with ART are then passed on to the CCN activation and INP nucleation schemes. The cloud droplet formation parameterization used in ART is based on the work of Fountoukis and Nenes (2005), which is based on the original framework of Nenes and Seinfeld (2003). This scheme allows for a log-normal representation of the aerosol size distribution and includes a size-dependent mass transfer coefficient for water droplet growth to account for the effect of size on droplet growth rate. In addition to cloud droplet activation, ART also includes a parameterization of ice nucleation processes. There are two main processes that govern the ice nucleation process, homogeneous and heterogeneous ice nucleation. The ice nucleation scheme used here is based on the work of Barahona and Nenes (2008, 2009a, b), and Ullrich et al. (2017). The Barahona and Nenes (2009b) parametrization provides an analytical solution of the cloud parcel model equations and accounts for competition between homogeneous and heterogeneous nucleation modes. In this work, for heterogeneous ice nucleation the scheme of Ullrich et al. (2017), which considers deposition nucleation and immersion freezing, is used. This scheme was originally developed for mineral dust, but it is being used here under the assumption that volcanic ash exhibits similar nucleation behavior. This parameterization uses the aerosol surface area distribution, temperature, and ice saturation ratio to calculate the number of heterogeneously activated particles. These values are transferred to the Barahona et al. (2010) scheme in ART, where they are included in the total ice crystal concentration, taking into account the competition between homogeneous and heterogeneous processes.
3.2 Model Tuning
To determine the most appropriate setup for the simulations, several test runs were conducted with different configurations of both the code and the simulation parameters. Analysis of the preliminary results from the VOLCANO simulation of the Holuhraun case revealed a significant overestimation of the cloud droplet number concentration (Nc) compared to MODIS (Moderate Resolution Imaging Spectroradiometer) satellite retrievals. Figure A1 shows the relative frequency of the total Nc column before (magenta) and after (cyan) tuning the code, as well as the observational results (black) for the area inside the plume (the area inside and outside the plume is defined in Sect. 4.1). As can be seen, there is a significant difference between the initial simulation results and the observations. The simulation results showed a right-skewed distribution with a large tail, indicating that the simulation produced much larger Nc values. This causes the mean of the Nc distribution in the simulation to be larger than in the observations. The relative enhancement (RE), as defined in Haghighatnasab et al. (2022), was calculated using the mean values of the Nc distributions inside and outside the plume. It is defined as:
RE was calculated for both the VOLCANO simulation and the MODIS data. The SO2 concentrations monitored by the Ozone Mapping and Profile Suite (OMPS) satellite retrievals were used to define the plume area for the MODIS data. The RE value was 6167 % for the VOLCANO simulation before tuning, compared to 42 % for the MODIS data. To improve the accuracy of the simulation results and align them more closely with observations, we examined parameters related to the CCN activation process. In ICON-ART, the number concentration of activated particles depends on the chemical and physical properties of the aerosols as well as the updraft velocity, w (Bangert, 2012). Our analysis shows that w significantly contributes to discrepancies between simulations and observations. Vertical velocity influences the calculation of maximum supersaturation, a key determinant of the number of activated particles. However, coarse-grid models do not explicitly resolve cloud-scale updrafts due to their too low spatial resolution (Morales and Nenes, 2010). Therefore, subgrid-scale parameterizations of vertical velocity must be employed. Many models, including ICON-ART, account for aerosol activation by integrating these parameterizations over a given probability density function (PDF) of vertical velocity within each grid box. In this approach, a Gaussian PDF is typically assumed, with its width determined by turbulent properties such as turbulent kinetic energy (TKE) (Storelvmo et al., 2006). To improve the representation of subgrid-scale turbulence and better align the simulation with observational data, we revised the model to account for the isotropy of turbulence, rather than assuming that all turbulent energy is confined to the vertical direction. Specifically, we reduced the assumed standard deviation of the vertical velocity used in the PDF calculations from σw=2 TKE to . Furthermore, we refined the parameterization of the droplet nucleation rate at the cloud base by replacing the turbulent diffusion coefficient with 0.8 σw, following the estimate proposed by Peng et al. (2005). This modification ensures better consistency with the vertical velocity distribution assumed for Nc calculations. These adjustments led to results that were more aligned with the observations, reducing the RE from 6167 % to 1219 % for the VOLCANO simulation. The same modifications of the CCN activation parameterization were also applied to the La Soufrière case, although liquid clouds were less prevalent there.
In addition to the improvements mentioned above, which significantly reduced the gap between the simulated and observed cloud droplet number concentration distributions, the high relative enhancement in the simulation can also be attributed to biases in aerosol number density inside and outside the plume. Outside the plume, the aerosol number density is likely underestimated because only sea salt is considered the background aerosol. In contrast, a substantial amount of aerosols is present inside the plume due to the prescribed SO2 emissions. As a result, the clean conditions outside the plume, caused by the lack of other sources of background aerosols, lead to an underestimated Nc, while the elevated aerosol concentrations inside the plume result in a significantly higher Nc. This stark contrast in Nc contributes to a stronger RE in the simulations compared to observations. However, as shown in Fig. A1, this discrepancy can be attributed mostly to an overestimation of Nc inside the plume, while the mean Nc outside the plume only deviates about a factor of 2 from the observations. The concentrations inside the plume are driven by the strength of the prescribed volcanic emissions, which are associated with a large uncertainty (Schmidt et al., 2015). To remain consistent with previous studies, we have decided not to tune the source strength. The behavior of LWP was also investigated before and after tuning the code. Figure A2 shows the relative frequency of LWP for the VOLCANO and NO-VOLCANO simulations inside and outside the plume before and after tuning the code. It can be seen that the means and medians for both simulations inside the plume converge through the tuning of the CCN activation scheme. The histograms show that the LWP for NO-VOLCANO (green) is closer to that for VOLCANO (cyan) after adjustment, with a relative enhancement of only 118 % compared to the 1219 % for Nc. These results are consistent with previous studies indicating that the volcanic plume has a minor impact on LWP.
This section discusses the results of the six simulations summarized in Table 1. First, we analyze the results of the Holuhraun simulation by examining the microphysical processes and behavior of hydrometeors in warm and mixed–phase clouds. Since Holuhraun volcanic aerosols had no significant impact on ice and snow, the results for ice clouds are not included. Next, we analyze the La Soufrière simulation results in the mixed and ice phases, focusing on the competition between homogeneous and heterogeneous ice nucleation processes.
4.1 Holuhraun
We analyzed the results of these two simulations, focusing on regions within the clouds. These regions are defined as areas where the combined mass of cloud water and cloud ice exceeds 10−5 kg kg−1, based on the work of Han et al. (2023). Sensitivity tests (not shown) with a lower threshold of 10−6 kg kg−1 have given very similar results. Figure 1 displays the mass mixing ratios of cloud water (qc) and cloud ice (qi) on 3 September 2014 at 23:00 UTC, at an altitude of 1580 m. To assess the impact of volcanic aerosols on clouds, we divided the analysis into two areas: inside and outside the volcanic plume. To determine an appropriate plume boundary, we examined the distribution of total sulfate mass in both the Aitken and accumulation modes. Based on this distribution, we identified a threshold of kg kg−1 – indicated by the purple contour in Fig. 1 – as a reasonable estimate for the plume boundary. We excluded data near the domain boundaries (2.5° in each direction) from our analysis.
4.1.1 Warm clouds
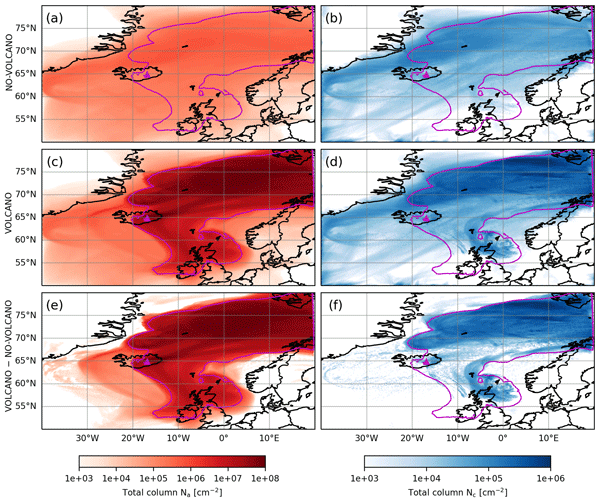
Changes in the number concentration of aerosols (Na) directly affect the number concentration of cloud droplets (Nc) and, consequently, the microphysical processes related to Nc and the resulting hydrometeors, such as raindrops. First, the response of the Nc to an increase in volcanic aerosols was investigated. Figure 2 shows the horizontal distribution of the total columns of Na and Nc in the NO-VOLCANO simulation (a, b), in the VOLCANO (c, d) simulation, and the difference between the two simulations (e,f). As shown, the presence of volcanic aerosols significantly increases the number of cloud droplets.
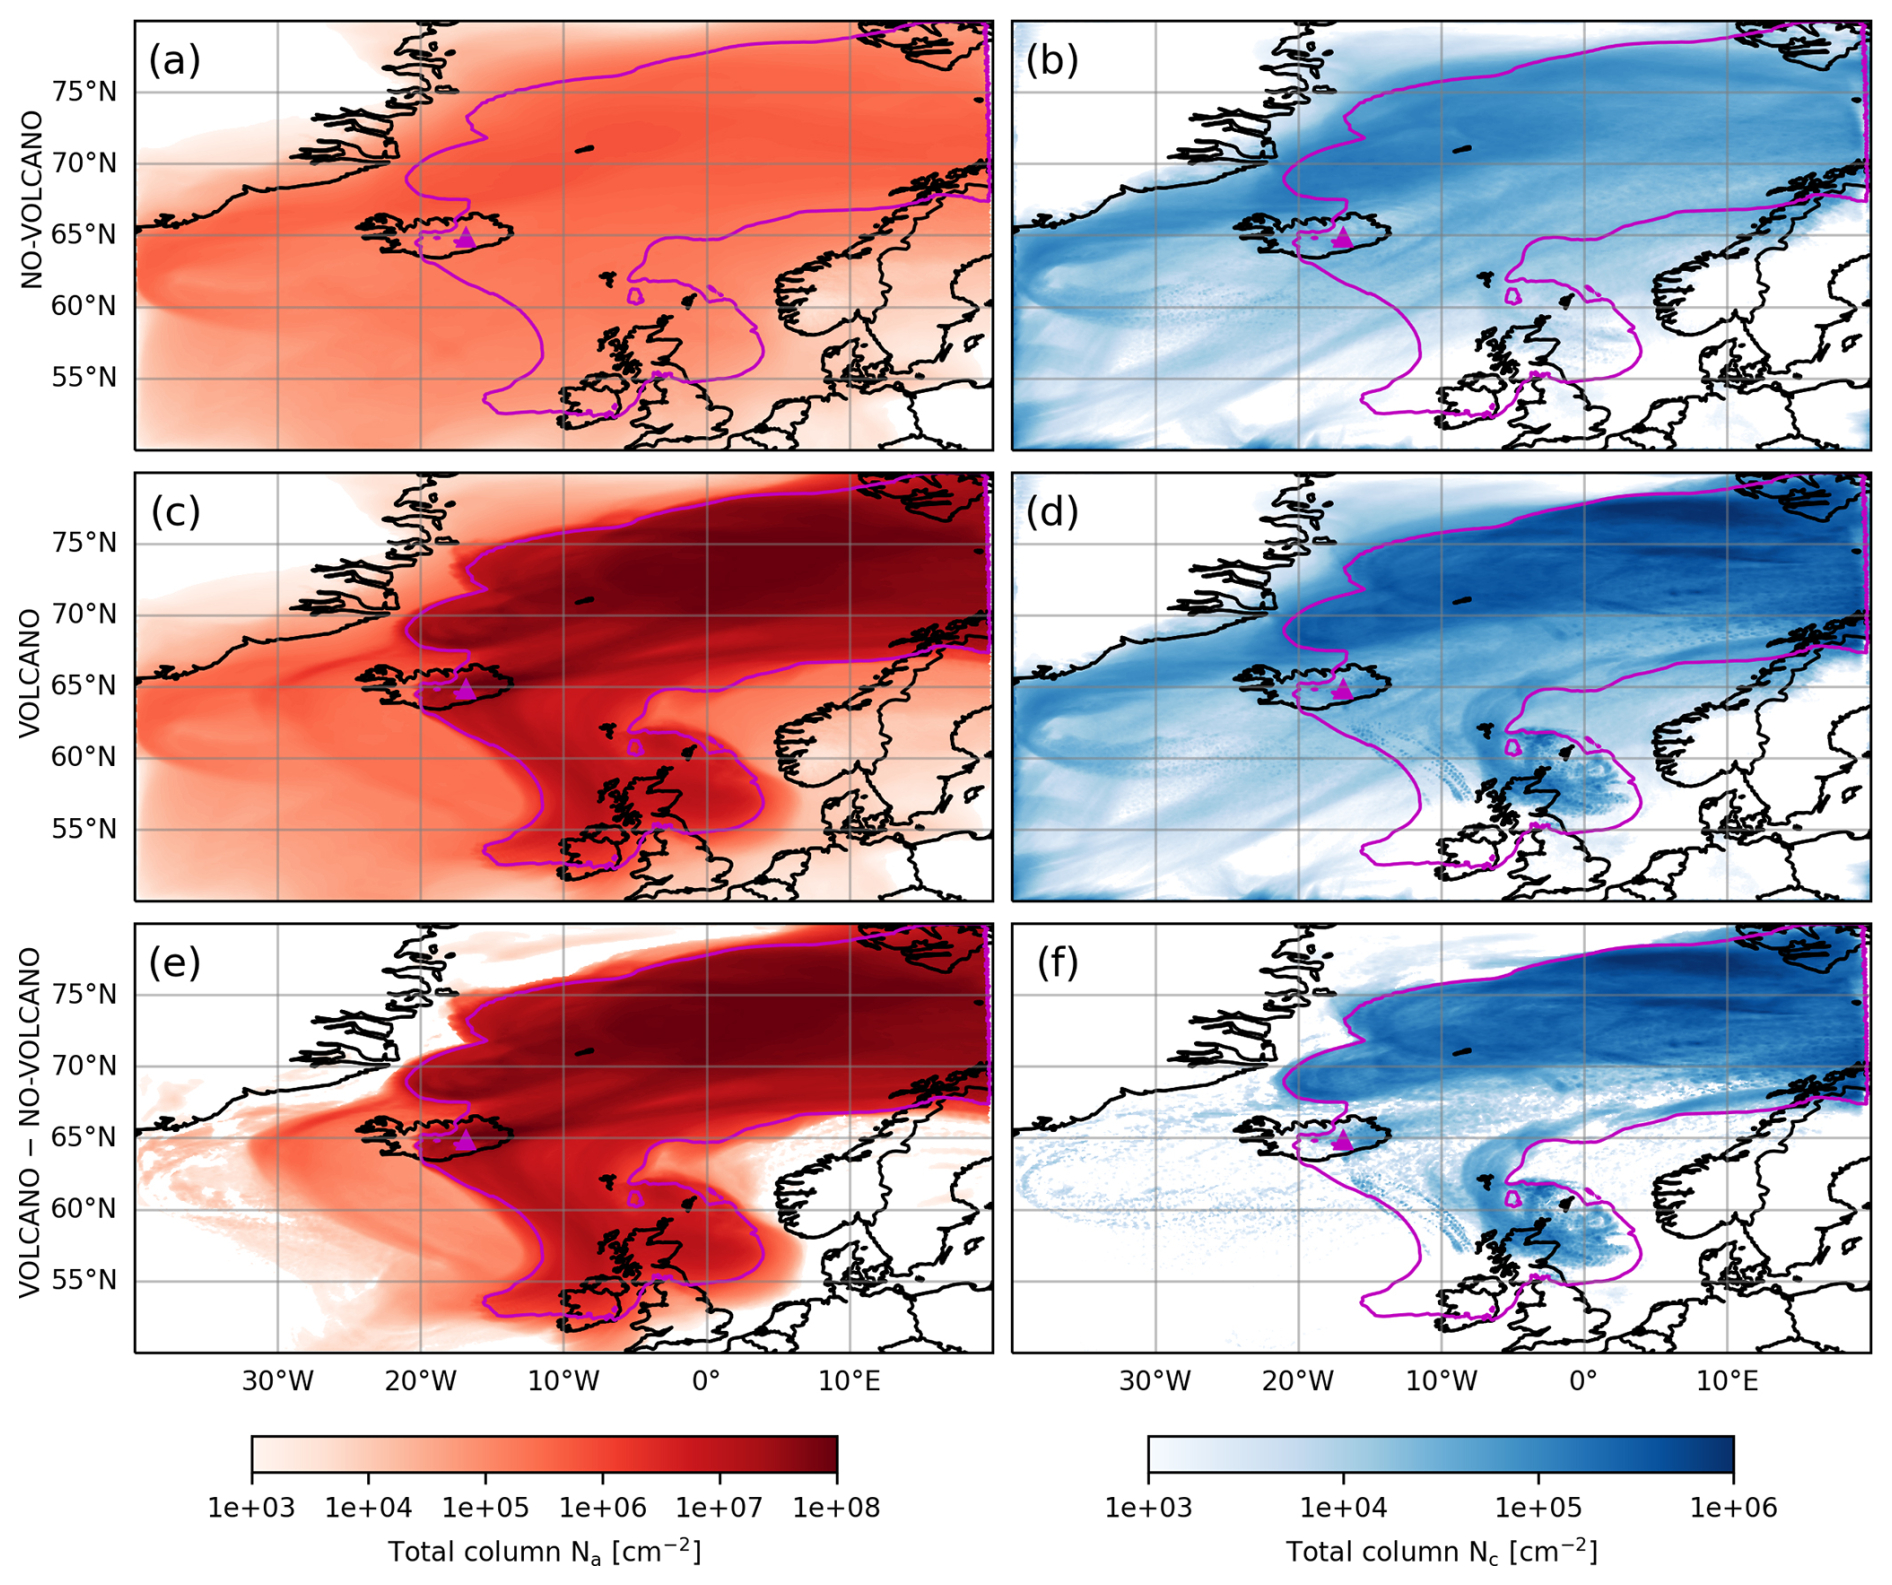
Figure 2Horizontal distributions of total aerosol number concentration (Na) and cloud droplet number concentration (Nc) for the NO-VOLCANO (a, b) and VOLCANO (c, d) simulations for Holuhraun, along with their differences (e, f). Both variables are integrated vertically and averaged over simulation time. The purple contours indicate the time-averaged, vertically integrated sulfate mass of 10−12 kg cm−2, which is used to define the boundary between regions inside and outside the volcanic plume.
Figure 3 shows the spatiotemporal averages of the number concentrations and mass mixing ratios of liquid hydrometeors, as well as the autoconversion and accretion rates inside and outside of the plume in the VOLCANO and NO-VOLCANO simulations. These profiles demonstrate the combined impact of volcanic aerosols and meteorological conditions on cloud microphysics. Comparing values inside the plume reveals significant differences between the VOLCANO and NO-VOLCANO simulations. However, values outside the plume remain largely unchanged. These results suggest that the changes observed within the plume are driven by volcanic aerosols. The differences between the inside and outside of the plume within the same simulation, however, are due to varying meteorological conditions and aerosol concentrations. The vertical profile of Nc in Fig. 3a supports the findings in Fig. 2f, which demonstrate that higher aerosol number concentrations result in greater cloud droplet number concentrations. Figure 3a shows that Nc is approximately six times higher inside the plume in the VOLCANO simulation than in the same region in the NO-VOLCANO simulation. It also indicates that the maximum value of Nc is shifted to higher levels in the VOLCANO simulation. Notable differences in the VOLCANO simulation are revealed by comparing Nc inside and outside the plume. By contrast, the NO-VOLCANO simulation shows only a modest difference in Nc across these regions. Nevertheless, even without volcanic emissions, Nc is higher inside the plume area, possibly due to the enhanced presence of sea salt aerosols in those regions or to meteorological factors like differences in humidity and stability (not shown). An analysis of the cloud water mixing ratio (qc) reveals that it increases by a factor of two within the plume in the VOLCANO simulation compared to the NO-VOLCANO simulation. In both cases, qc values are higher inside the plume than outside. Although qc is not directly influenced by the aerosol number concentration (Na), it is indirectly affected through aerosol impacts on cloud microphysical processes. As shown in Fig. 3c and f, our results demonstrate that the VOLCANO simulation shows a reduction in autoconversion and accretion processes compared to the NO-VOLCANO simulation. In the VOLCANO simulation, cloud droplets are smaller because available water vapor is distributed among more cloud condensation nuclei. As a result, these droplets have smaller collision cross sections and lower fall velocities, making them less likely to collide and grow. This reduction of autoconversion and accretion ultimately leads to reduced raindrop formation in the VOLCANO simulation, as shown in Fig. 3b. In the VOLCANO simulation, the conversion of cloud droplets to raindrops decreases, resulting in more cloud water remaining. This leads to a higher cloud water mass (qc) and a lower rainwater (qr) mass in the VOLCANO simulation compared to the NO-VOLCANO simulation as shown in Fig. 3d and e.
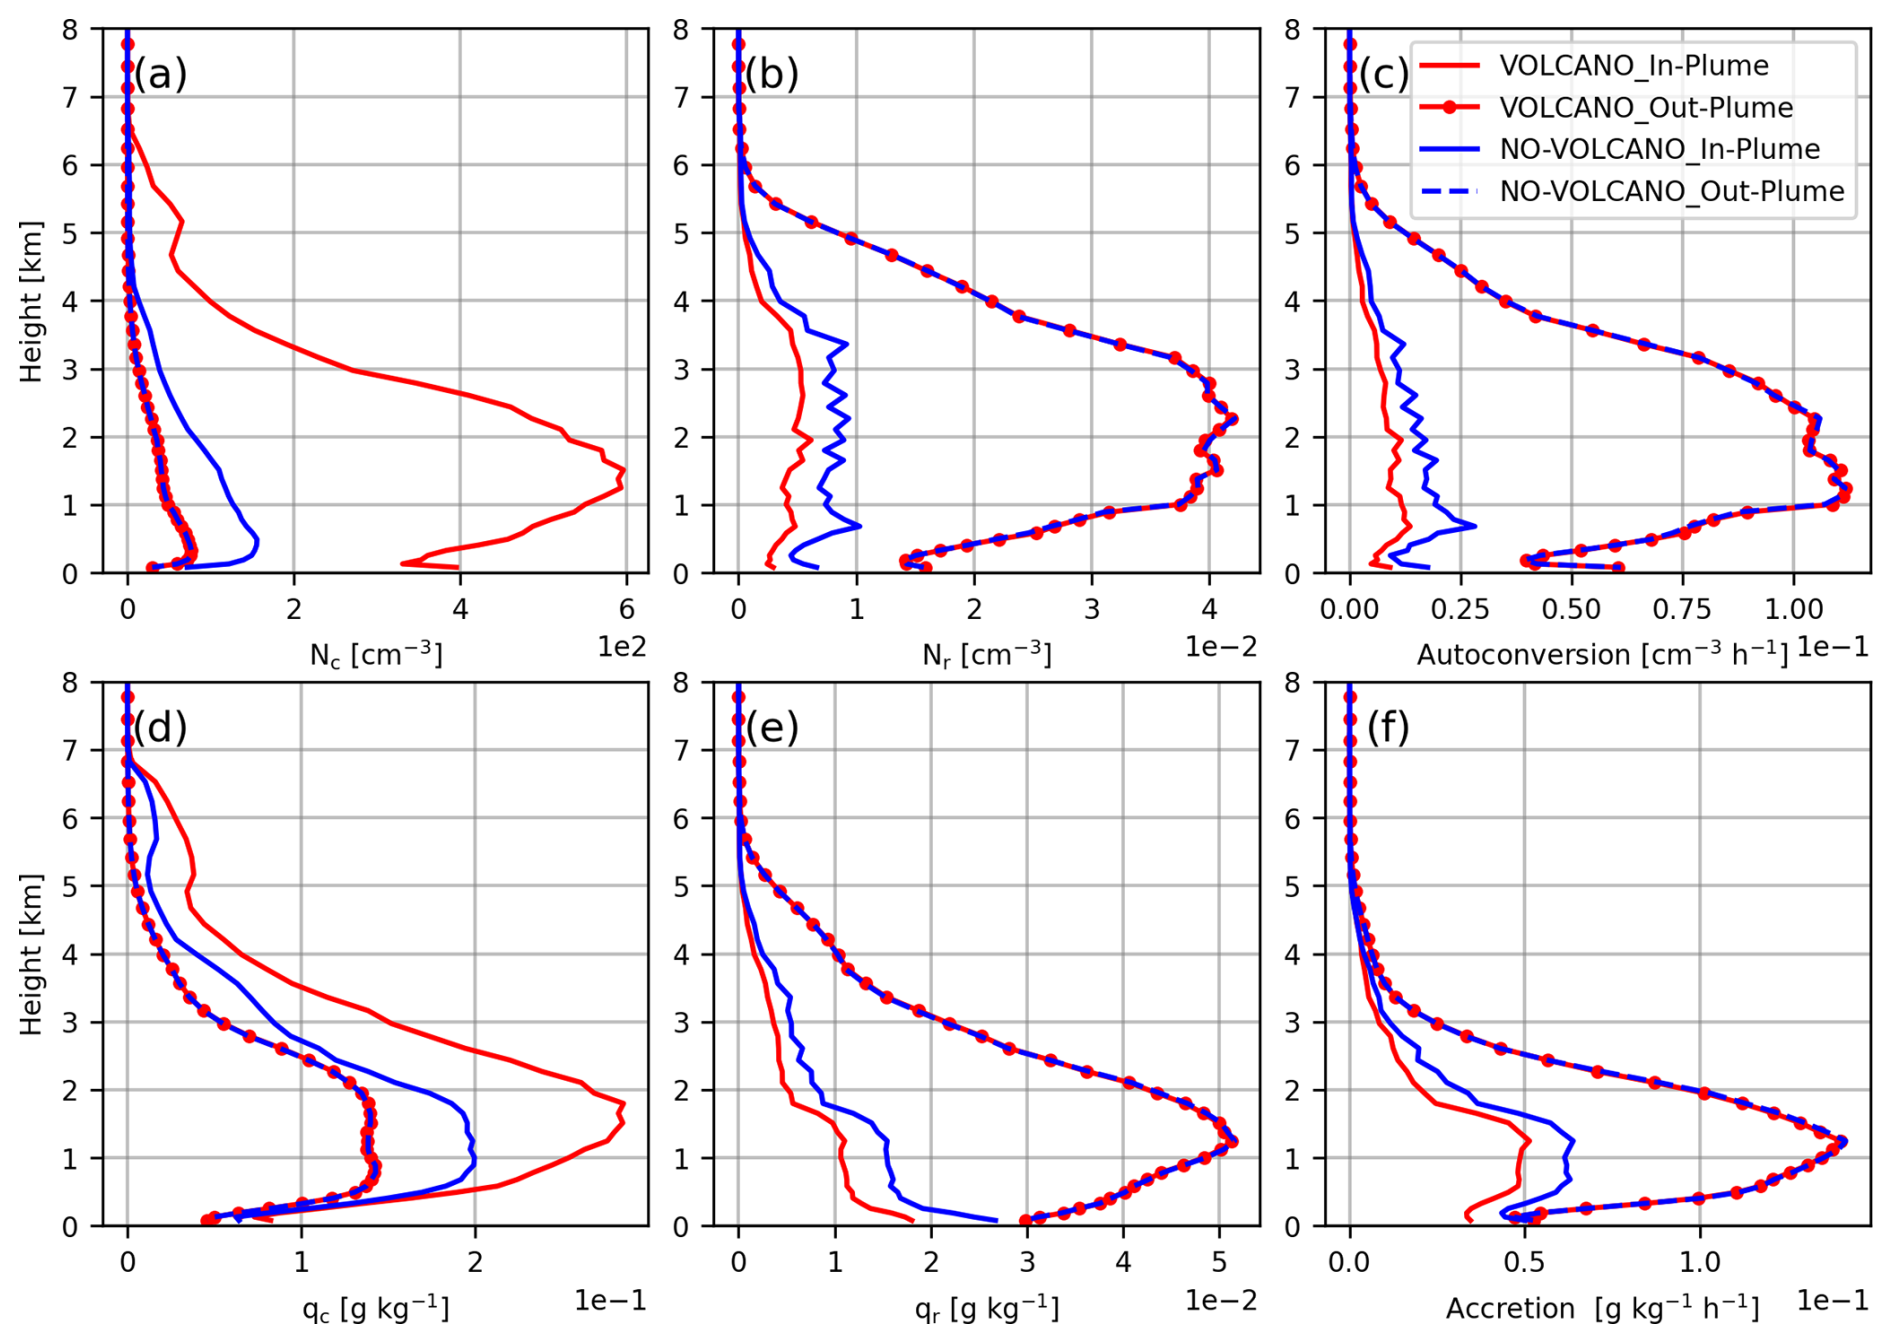
Figure 3Spatiotemporally averaged profiles – calculated over cloudy pixels from 00:00 UTC on 1 September 2014, to 00:00 UTC on 7 September – of the number concentration of cloud water (Nc, a) and cloud rain (Nr, b), the autoconversion rate (c), the mass mixing ratio of cloud water (qc, d) and cloud rain (qr, e), and the accretion rate (f) for the VOLCANO (red) and NO-VOLCANO (blue) simulations for Holuhraun.
In addition to the effects of volcanic aerosols on cloud hydrometeors, our results reveal clear differences in the behavior of cloud and rain water inside and outside the plume. While Nc and qc are higher inside the plume – even in the absence of volcanic aerosols (NO-VOLCANO simulation) – both Nr and qr are significantly higher outside the plume. This indicates that the conversion of cloud droplets into raindrops is more efficient outside the plume, consistent with the higher autoconversion and accretion rates observed there (Fig. 3c and f). The efficiency of these processes depends on the mass concentration of the cloud and raindrops, as well as the mean particle size, which is defined as the mass divided by the number of droplets. Our results show that outside the plume, where cloud droplet numbers are relatively low but droplet sizes are large, autoconversion and accretion remain active in both VOLCANO and NO-VOLCANO simulations. By contrast, inside the plume, where cloud droplets are more numerous but smaller, these processes are suppressed. Consequently, raindrop formation is enhanced outside the plume compared to inside (Fig. 3b).
4.1.2 Mixed–phase clouds
The Holuhraun eruption did not emit ash particles. As a result, ice crystals formed primarily through the homogeneous freezing of cloud droplets and liquid aerosols (sulfate particles), along with the heterogeneous freezing driven by background INPs. Our results indicate that the contribution of heterogeneous freezing was negligible, and that homogeneous freezing of sulfate aerosols had only a limited effect on ice formation. As shown in Fig. A3, the mass mixing ratio and number concentration of ice particles differ only slightly between the VOLCANO and NO-VOLCANO simulations. However, further analysis revealed that mixed–phase cloud processes are influenced by variations in volcanic aerosols (Fig. 4). Since frozen hydrometeors show only slight changes in the VOLCANO simulation compared to the NO-VOLCANO simulation, the changes in mixed–phase clouds can be attributed to changes in liquid hydrometeors.
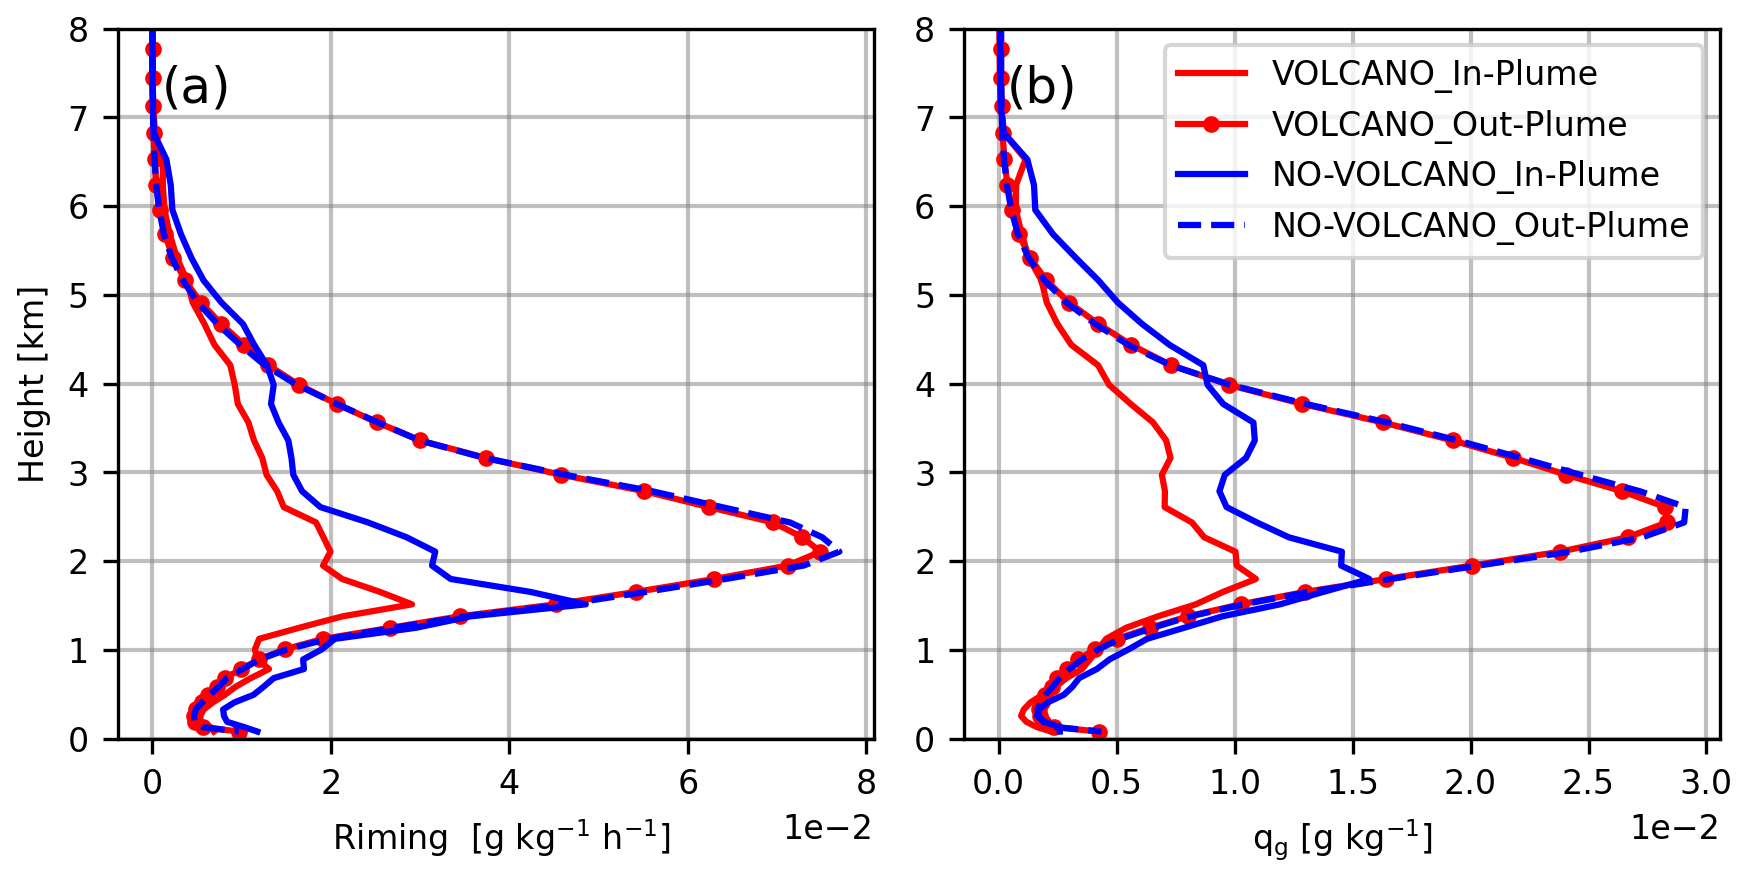
Figure 4Similar to Fig. 3, but for the rate of riming (a) and the mass mixing ratio of graupel (b).
To study the development of microphysical processes in mixed-phase clouds, we examined the total riming rate – the process by which supercooled droplets collide with ice or snow particles – and the formation of graupel, which forms through riming. The efficiency of collisions between liquid and frozen hydrometeors depends strongly on droplet size; larger droplets rime more efficiently than smaller ones. Figure 4 shows the vertical profiles of the riming rate and graupel mass mixing ratio (qg). As shown, the riming rate and qg are approximately 1.5 to 2 times lower in the VOLCANO simulation than in the NO-VOLCANO simulation. These results align with previous studies (e.g., Borys et al., 2000). In addition to riming, graupel can also form from the freezing of raindrops. Our analysis (not shown) revealed that this process occurs more frequently inside the plume because outside the plume raindrops are smaller and freeze less. Nevertheless, our results indicate that raindrops freezing contribute much less to graupel formation than riming does (not shown). A comparison of the results inside and outside the plume revealed that the mass of graupel, as well as the riming process, is greater outside the plume. These results are consistent with our previous findings regarding the behavior of hydrometeors and processes in warm clouds (Fig. 3). As previously mentioned, frozen hydrometeors do not change with volcanic aerosol loading. However, they are more abundant outside the plume (Fig. A3). Therefore, because the hydrometeors involved in riming and graupel formation are more abundant outside the plume, both riming and graupel production are also enhanced outside the plume.
The reduction of the riming process means that more liquid droplets remain in the mixed–phase cloud in the VOLCANO simulation compared to the NO-VOLCANO simulation. This was confirmed by analyzing the binary liquid fraction in mixed–phase clouds. Following the method of Han et al. (2023), we calculated the liquid cloud pixel fractions. A cloudy pixel was classified as a liquid pixel if its liquid mass fraction exceeded 0.5; otherwise, it was classified as an ice pixel. The liquid cloud pixel fraction was calculated as the ratio of the number of liquid cloud pixels to the sum of all cloudy pixels. As can be seen in Fig. 5, liquid cloud pixel fractions are more abundant in the VOLCANO simulation than in the NO-VOLCANO simulation, and they are more abundant inside the plume than outside. This is in line with the riming rate results and indicates that, compared to NO-VOLCANO, more liquid water remained in the mixed phase in VOLCANO and did not rime.
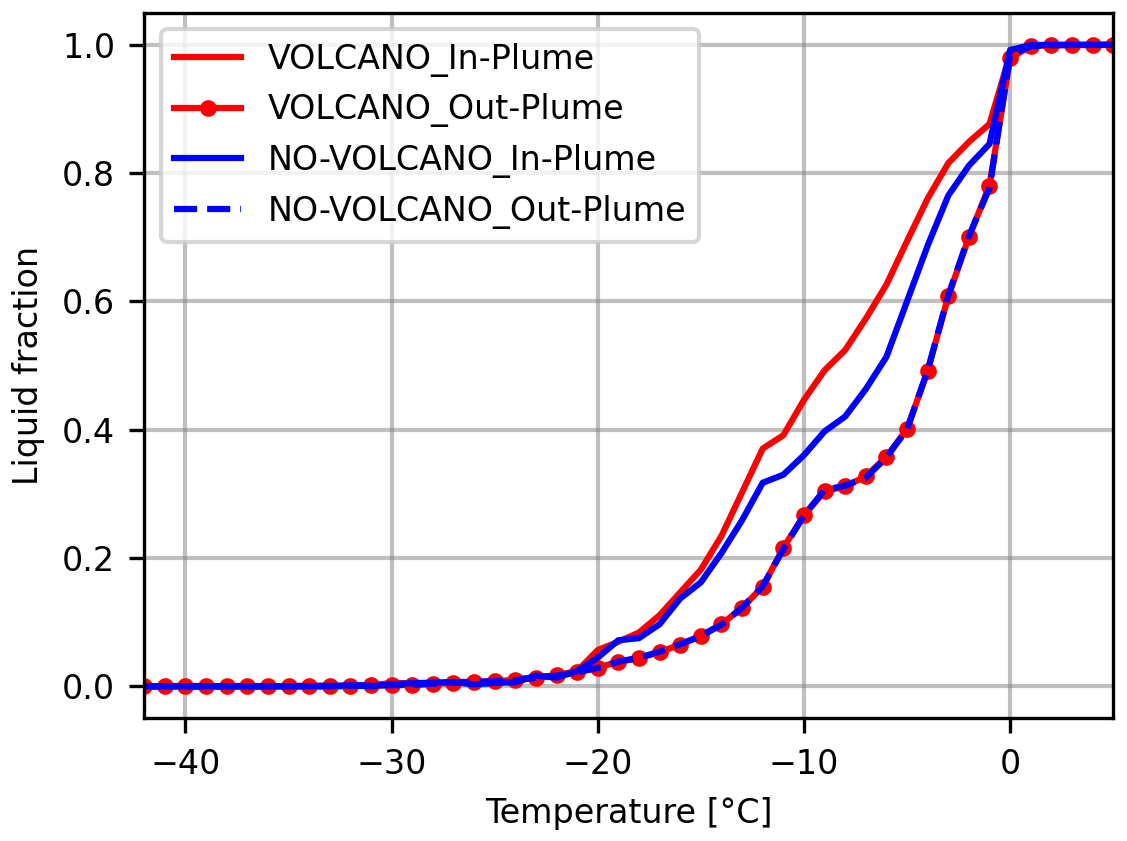
Figure 5Liquid cloud pixel fraction as a function of temperature in the VOLCANO and NO-VOLCANO simulations for Holuhraun.
4.1.3 Statistical test
Our results show differences in the processes and hydrometeors in the warm and mixed phase clouds in the VOLCANO and NO-VOLCANO simulations. We used the Mann-Whitney U test (Mann and Whitney, 1947) to calculate the p-value. Based on this approach, relative differences are considered significant if the p-value is below 0.05. Due to the large number of grid points, the data were first averaged spatially over the vertical and horizontal dimensions, with the analysis restricted to cloudy grid points within the plume region. This produced time series of domain-averaged values, with one sample per time step. The Mann–Whitney U test was then applied to these time series. Additionally, the direction of change was assessed by calculating the relative difference between their mean values. Figure 6 shows the resulting relative differences, with colors indicating the sign of the change and p-values below 0.05 highlighted by black frames around the boxes, for the mass mixing ratios and number concentrations of all hydrometeors over six days of simulation. The relative differences indicate that Nc, qc, and qs are larger in the VOLCANO simulations (red boxes), whereas Nr, qr, Ng, and qg are larger in the NO-VOLCANO simulations (blue boxes). These results are consistent with the findings shown in Figs. 3 and 4. On the first day, significant differences were only observed for cloud droplet number concentration (Nc), indicating an early aerosol impact on this variable. As the volcanic plume evolves, statistically significant differences emerge for cloud water (both Nc and qc), cloud rain (Nr and qr), and graupel (Ng and qg) between the VOLCANO and NO-VOLCANO simulations. Conversely, no statistically significant changes were found for cloud ice (Ni and qi) and snow (Ns and qs), suggesting these hydrometeors are less sensitive to volcanic aerosol perturbations under the simulated conditions.
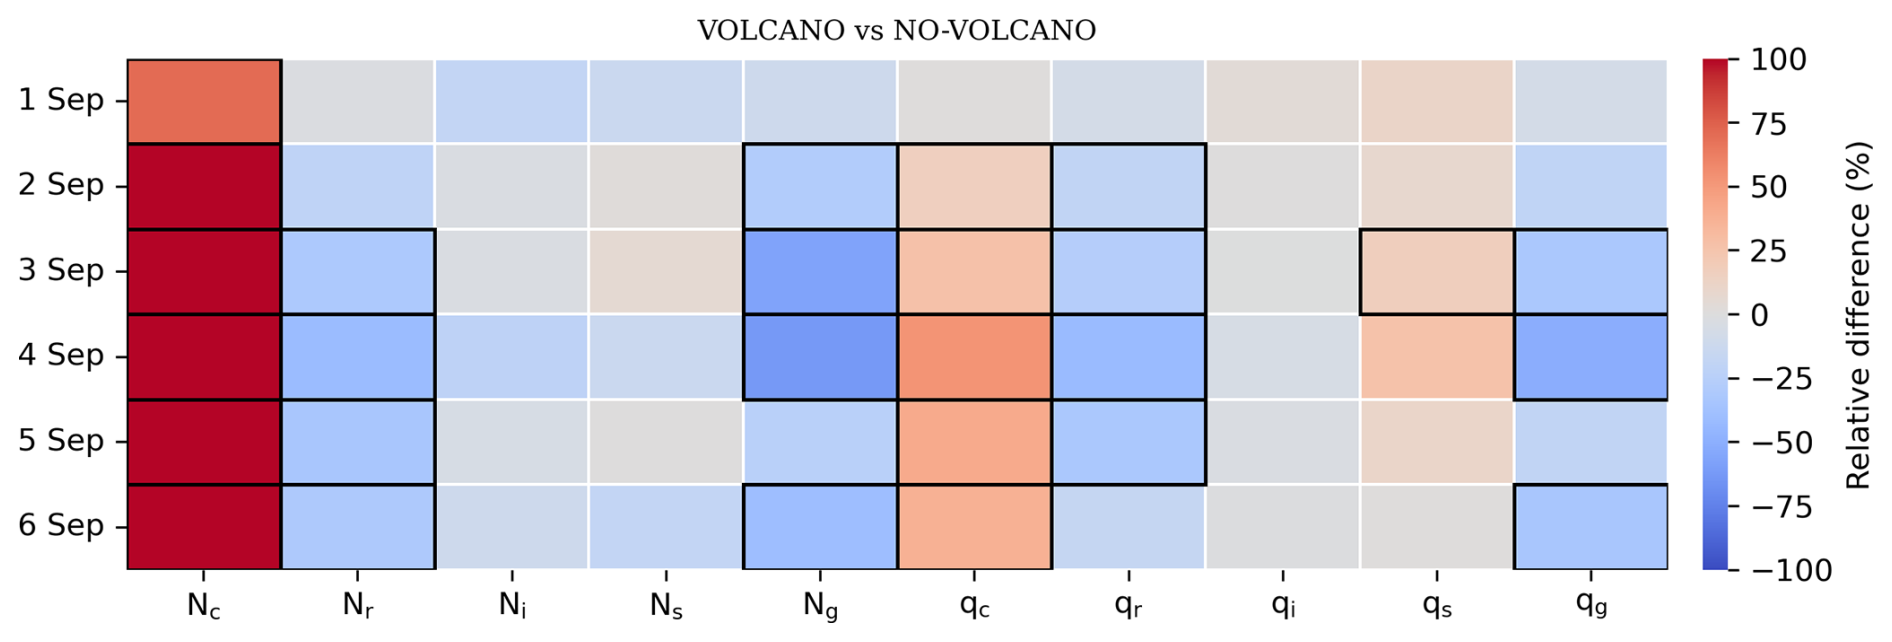
Figure 6Relative differences (VOLCANO minus NO-VOLCANO divided by NO-VOLCANO) and statistical significance of daily changes between the VOLCANO and NO-VOLCANO simulations for Holuhraun inside the plume. Colors indicate the relative difference, while black boxes denote statistically significant differences (p<0.05) in cloud hydrometeors for each day (y axis).
4.2 La Soufrière
As described in Sect. 2, simulating this eruption provided us with the opportunity to assess the ice-related processes. Similar to the simulations of the Holuhraun eruption, we examined the effect of volcanic aerosols on clouds inside and outside the plume. However, cloudy pixels are defined as areas where the combined mass of cloud water and ice exceeds 10−6 kg kg−1, based on the work of Dedekind et al. (2021). As this eruption ejected both SO2 and ash, the total mass of sulfate and ash was used to calculate the threshold between the inside and outside of the plume. Accordingly, the inside of the plume is defined as the areas with a total mass greater than 10−11 kg kg−1, and all other areas are considered outside of the plume. Figure 7 shows the total mass mixing ratios of cloud water (qc) and cloud ice (qi) on 11 April at 23:00 UTC at an altitude of 15 000 m. The purple contour in the figure indicates the boundary between inside and outside of the plume. The La Soufrière volcano is ∼150 km west of Barbados (Bruckert et al., 2023). The Barbados Cloud Observatory (BCO) has been operating since 1 April 2010 to advance the understanding of clouds, circulation, and climate sensitivity at the edge of the intertropical convergence zone (Stevens et al., 2016). Stevens et al. (2016) noted that north-easterly trade winds usually prevail in this region; however, at the time of the eruption, Barbados was located downwind of the volcano (Bruckert et al., 2023).
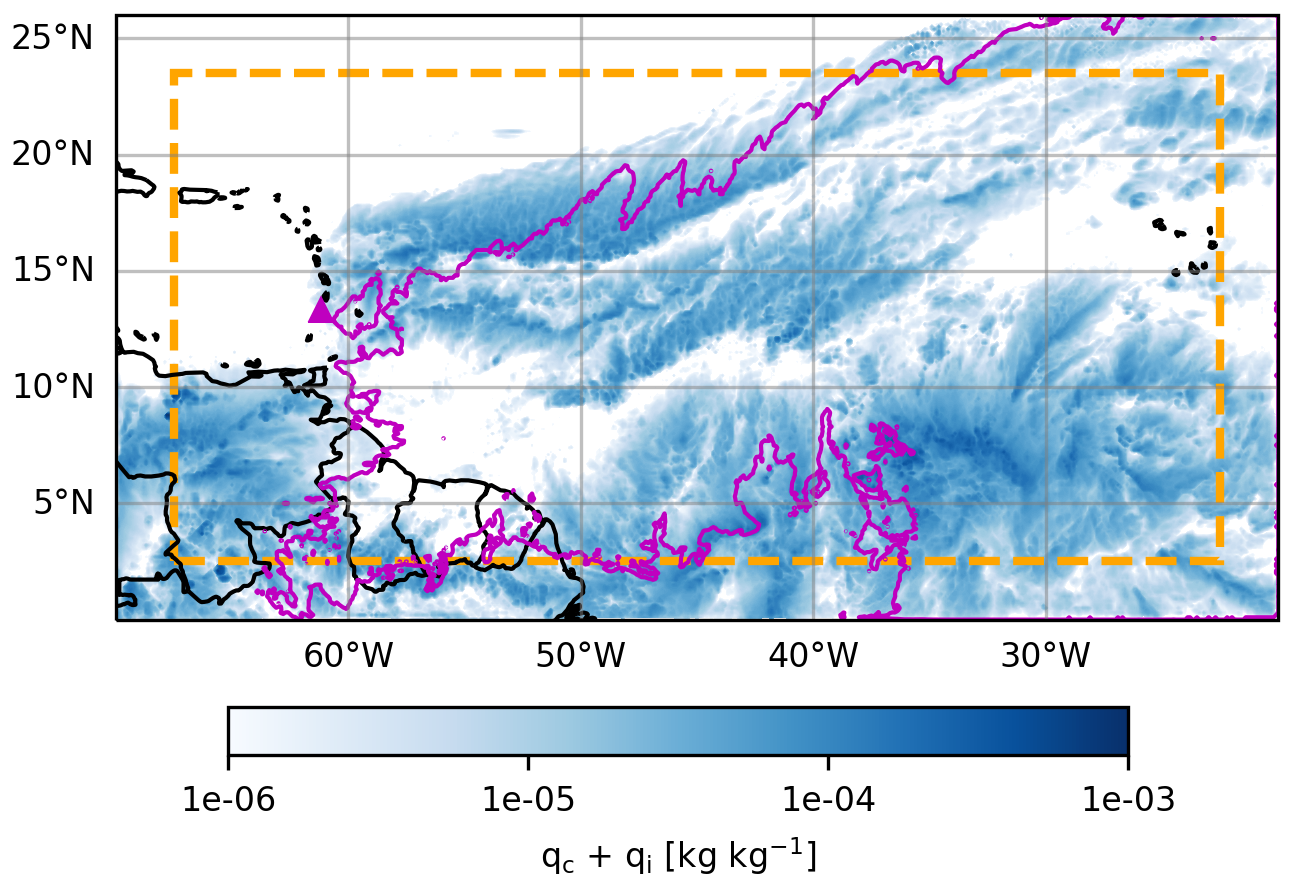
Figure 7Horizontal distribution of mass mixing ratio of cloud water (qc) and cloud ice (qi) on 11 April 2021 at 23:00 UTC, at an altitude of 15 000 m, the level of maximum aerosol content. The cloud area is indicated by the blue spectrum, and the purple contour shows the sulfate plus ash mass equal to 10−11 kg kg−1, which defines the boundary between the regions inside and outside of the volcanic plume. Areas outside the orange box are excluded from the analysis, corresponding to approximately 278 km in the meridional (north–south) direction and 270 km in the zonal (east–west) direction (on average). The magenta triangle marks the location of the La Soufrière volcano.
4.2.1 Warm and mixed–phase clouds
Since we had already investigated the effects of volcanic aerosols on warm cloud processes by analyzing the results of the Holuhraun eruption, here we were interested in investigating the activation of mixed-mode aerosols as CCN in addition to soluble mode particles (i.e., comparing VOLCANO and VOLCANO-MIXED rather than comparing the results of VOLCANO and NO-VOLCANO simulations). However, our results show only a slight changes in the number concentration of cloud droplets between VOLCANO and VOLCANO-MIXED (not shown). In general, we found that volcanic aerosols from the La Soufrière eruption had limited impact on warm and mixed-phase clouds. One possible reason for this is the plume height. Horváth et al. (2022) stated that most of the plumes either spread near the tropopause at 16–17 km altitude or penetrated the stratosphere at 18–20 km altitude. This causes the volcanic aerosols to be more dominant where there is less water vapor than at lower altitudes, where warm and mixed–phase processes occur. Additionally, investigating the distribution of mass mixing ratios and number concentrations of cloud hydrometeors inside and outside the plume in these four simulations revealed that ice clouds, rather than warm and mixed-phase clouds, were the dominant cloud type in the simulation domain and throughout the simulation period. Figure 8 shows the distributions of ice and snow; however, the results for cloud droplets, raindrops, and graupel are not shown. The distributions of ice are relatively symmetric, with close proximity between the mean and median values and minimal skewness. In contrast, the distributions of cloud water, rain, graupel (not shown) and snow exhibit pronounced skewness, characterized by a large difference between their mean and median values. These results suggest that warm and mixed–phase clouds with higher concentrations of cloud droplets, raindrops, graupel and snow were less frequent in the simulation domain, while grid points with very low values (near zero) were dominant, indicating that these clouds rarely covered the sky during the simulation. Conversely, the distribution of ice, with close median and mean values, shows that ice clouds are more evenly and widely distributed across the domain. This is consistent with the dominance of ice clouds throughout the simulation.
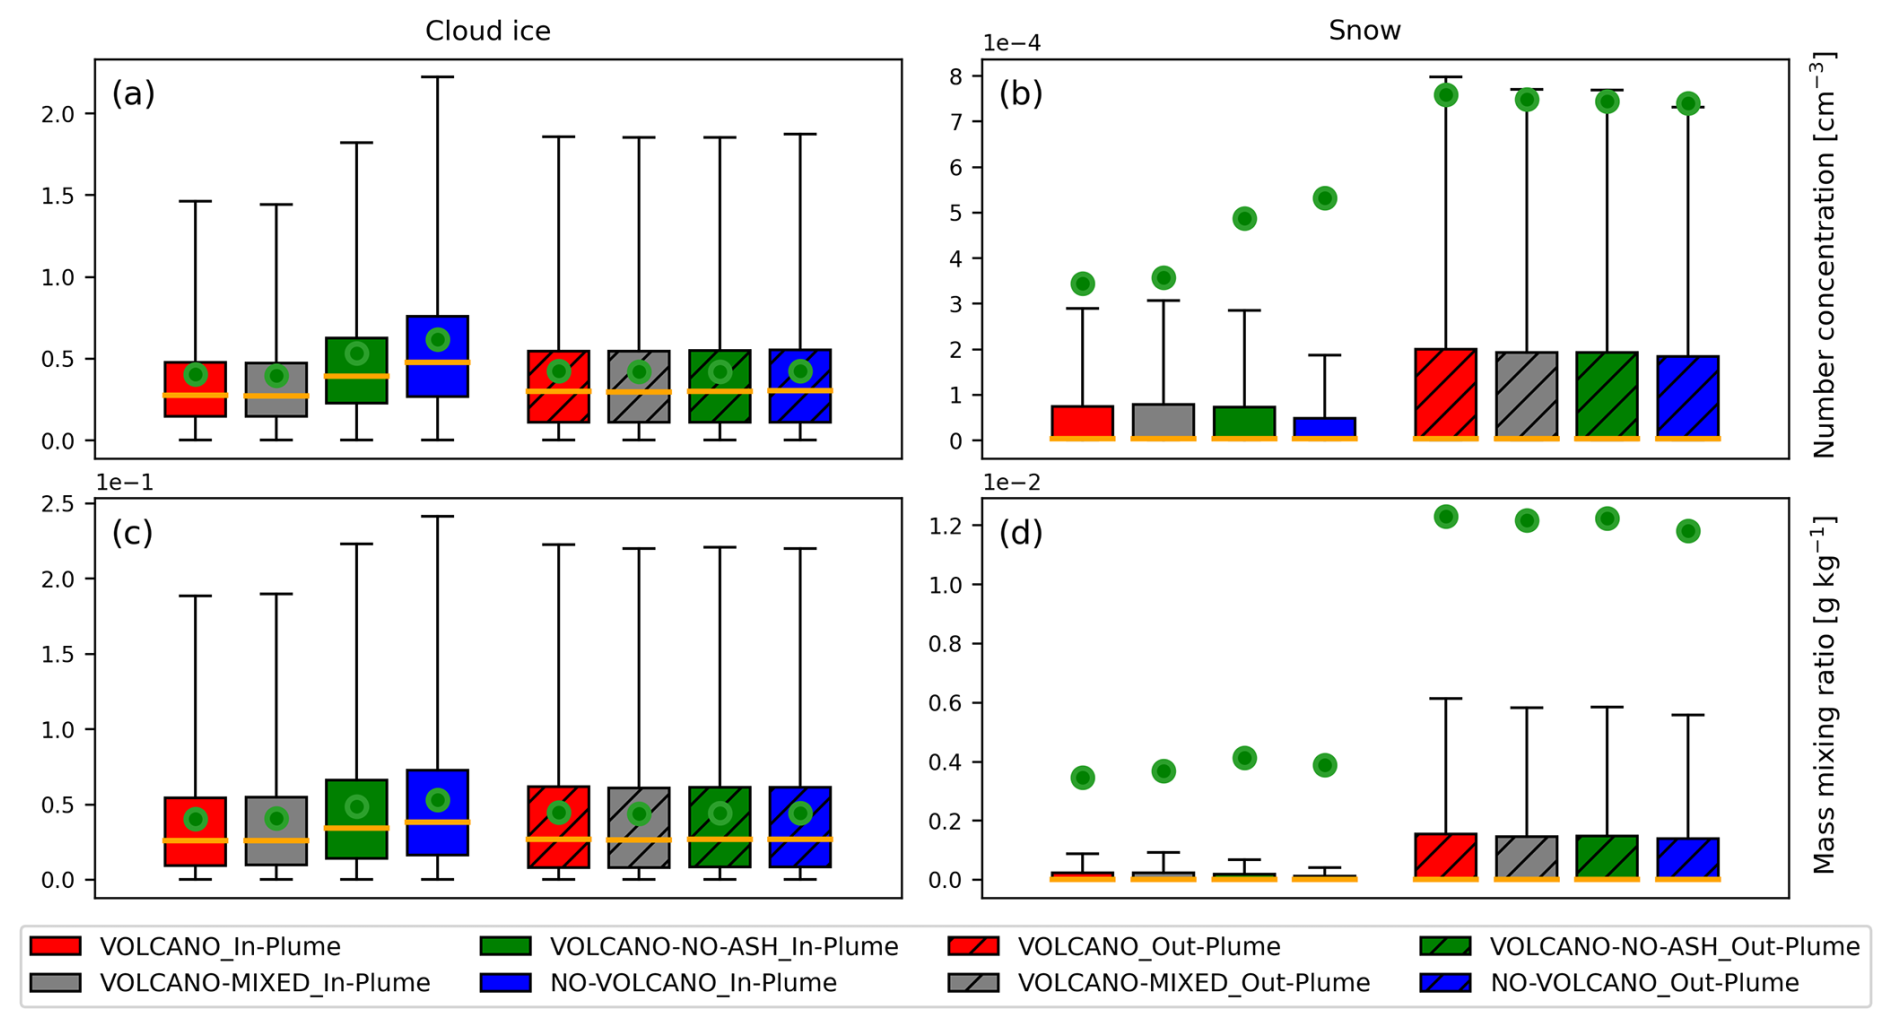
Figure 8Distribution of the number concentration (a, b) and the mass mixing ratio (c, d) of cloud ice (a, c) and snow (b, d) inside and outside (hatched box) the plume in four simulations for La Soufrière. The orange horizontal lines indicate the median of each distribution and the green dots show the mean. Each box spans the interquartile range (Q1 to Q3), and whiskers extend to three times the interquartile range (3 IQR).
Analyzing the liquid fractions as a function of temperature confirms the claim that ice clouds dominated the simulation domain during the simulation period. Using a similar approach to that described for defining cloud water and ice pixels in the Holuhraun simulations, we identified these pixels in the four La Soufrière simulations and plotted the liquid fraction against temperature, as shown in Fig. 9. Since the VOLCANO simulation includes two types of volcanic aerosols, it was compared with others to determine if changes in aerosol concentrations and CCN activation settings impact the redistribution of liquid and ice pixels. First, the results of the VOLCANO and NO-VOLCANO simulations (Fig. 9a) were examined. Different from the Holuhraun case, no notable changes were observed between the results of these simulations inside the plume, and the results were close inside and outside the plume for both simulations. This indicates that neither the emission loading of aerosols nor the meteorological conditions impact the redistribution of the frequency of clouds and ice in mixed–phase clouds. Similar results were found when investigating the results of VOLCANO and VOLCANO-NO-ASH (Fig. 9b) and VOLCANO and VOLCANO-MIXED (Fig. 9c). These results confirm that mixed–phase processes are unaffected by volcanic aerosols and show that ice pixels dominate. For example, at a temperature of −7 °C, the liquid fraction is 0.2, whereas it was 0.6 in the Holuhraun case at the same temperature. This again confirms that ice clouds dominated during these simulations.
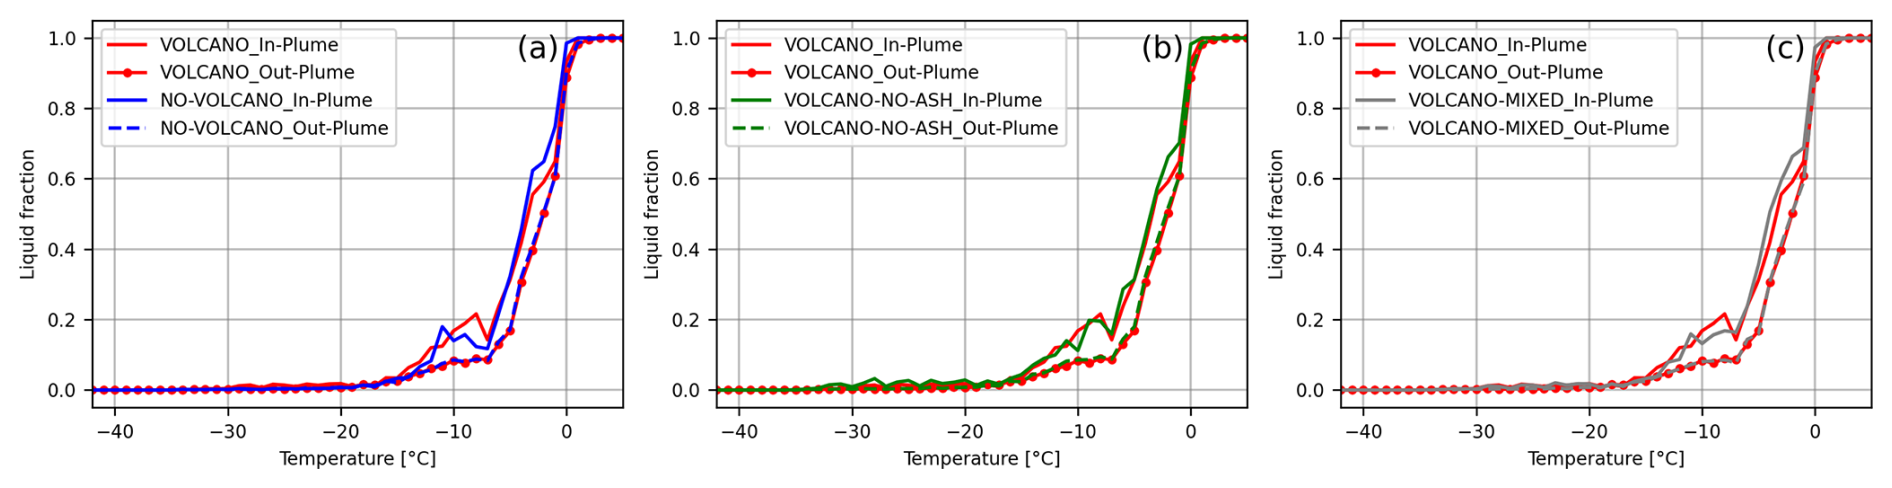
Figure 9Liquid cloud pixel fraction as a function of temperature in the VOLCANO and NO-VOLCANO simulations (a), in the VOLCANO and VOLCANO-NO-ASH simulations (b), and the VOLCANO and VOLCANO-MIXED simulations (c) for La Soufrière. The plotted data is for the entire simulation time.
4.2.2 Cold clouds
Figure 8 shows that the VOLCANO-MIXED simulation did not affect the mass mixing ratio or number concentration of ice and snow compared to the VOLCANO simulation. Therefore, we excluded the results of the VOLCANO-MIXED simulation from the analysis in this section.
To analyze the effects of volcanic ash on heterogeneous ice nucleation and the redistribution of available water vapor, we examined the spatiotemporal profiles of ice nucleation-related variables in the ART simulations for the VOLCANO, NO-VOLCANO, and VOLCANO-NO-ASH scenarios. Figure 10 illustrates these variables within the plume. Figure 10a shows the vertical profile of ash particle number concentration. Although the VOLCANO-NO-ASH and NO-VOLCANO simulations do not consider volcanic ash, small predefined background values are considered. Since these values are much lower (1×10⁶ m−3) compared to the volcanic ash concentrations in the VOLCANO simulation (1.5×10⁸ m−3), they appear negligible or close to zero.
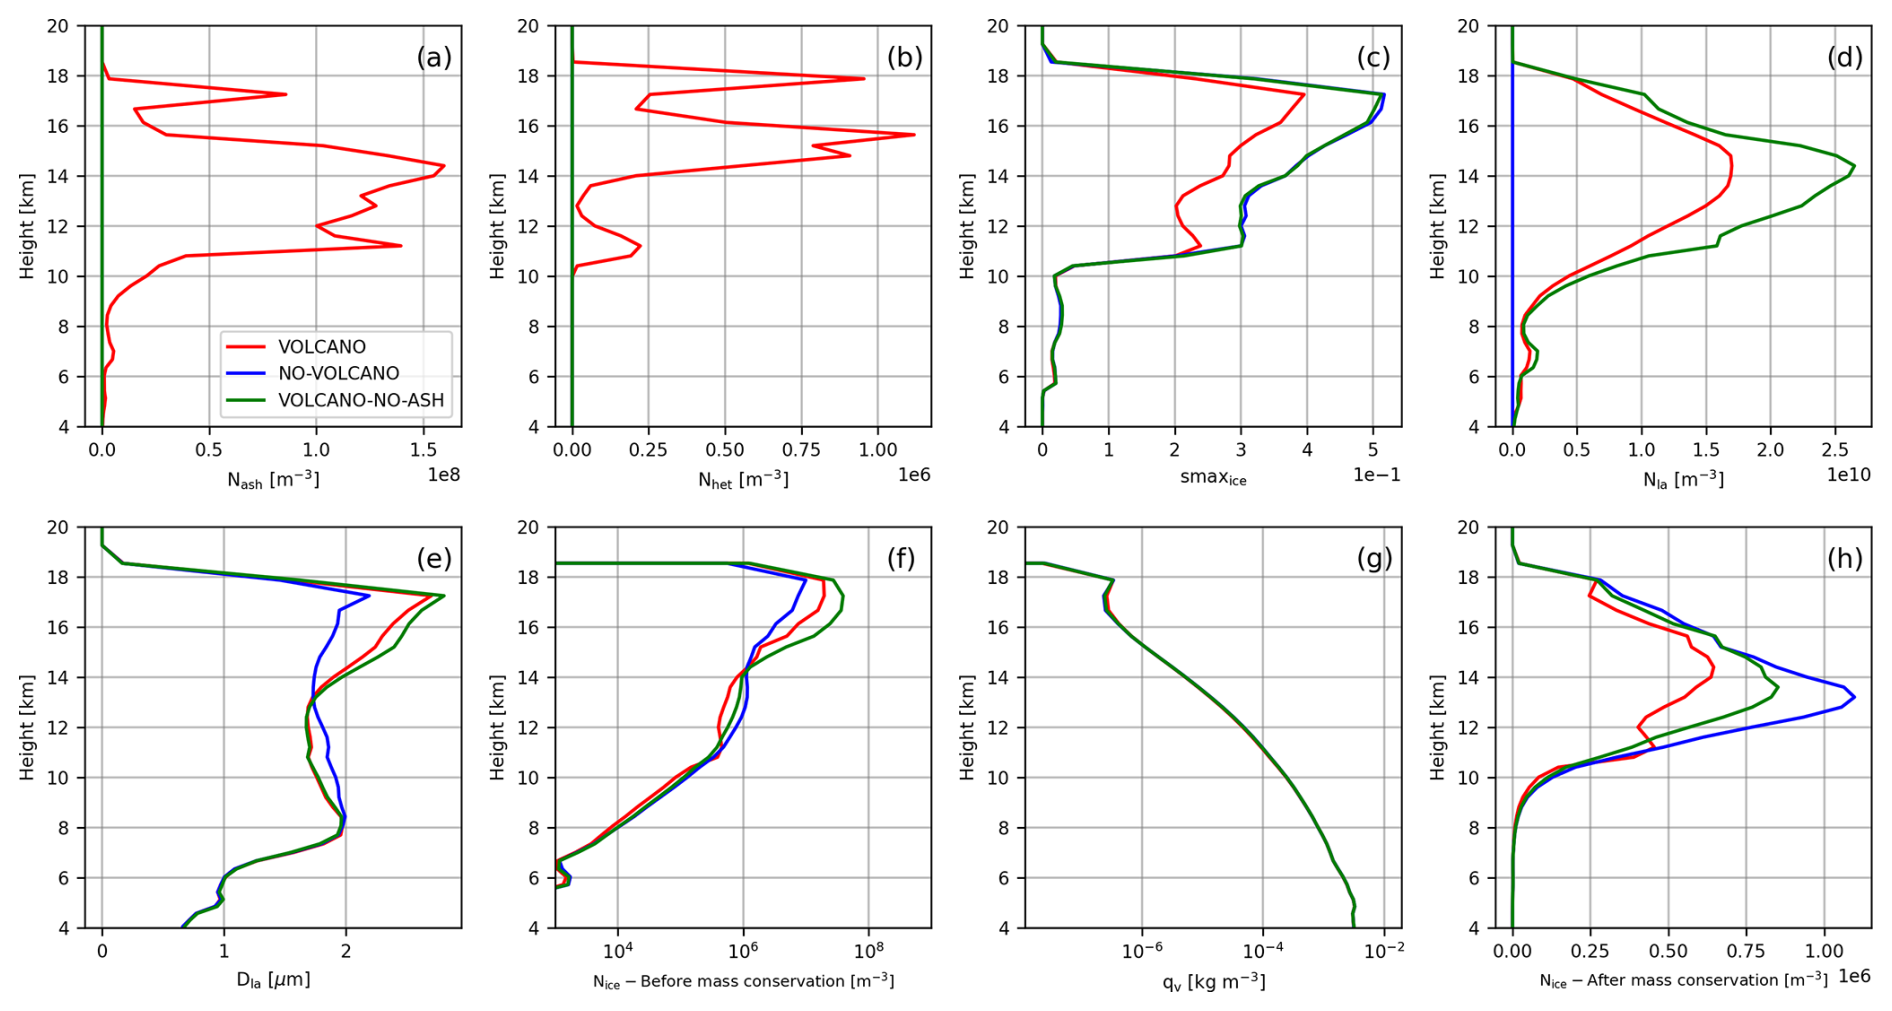
Figure 10Spatiotemporally averaged profiles – calculated from 12:00 UTC on 9 April 2021 to 23:00 UTC on 13 April – of the number concentration of ash particles (a), the number concentration of heterogeneously formed ice crystals (b), maximum supersaturation over ice (c), the number concentration of sulfate (liquid aerosols) (d), the diameter of sulfate particles (e), the number concentration of produced ice crystals before applying the mass conservation check (f), specific humidity (g), and number concentration of produced ice crystals after applying the mass conservation check (h) in the VOLCANO simulation (red), VOLCANO-NO-ASH simulation (green), and NO-VOLCANO simulation (blue) for La Soufrière. The results shown here are for inside the plume. Nice shows the number concentration of ice crystals produced directly after the ice nucleation scheme.
Figure 10b shows the concentration of ice crystals formed heterogeneously. As can be seen, there appear to be no such crystals in the VOLCANO-NO-ASH and NO-VOLCANO simulations because the ash concentration is low in these simulations. However, the VOLCANO simulation shows three peaks: one between 10 and 12 km, and two between 14 and 18 km. Our analysis showed that supersaturation with respect to water is greater than 1 between 10 and 12 km. Therefore, we can conclude that the ice crystals formed at this altitude are the result of immersion freezing, while those formed at higher altitudes are the result of deposition nucleation.
Figure 10c illustrates the vertical profile of Smaxice in the three simulations. We observed a reduction in Smaxice at the altitude at which ice crystals form heterogeneously. When ash particles are activated as INPs, they consume water vapor, reducing the maximum supersaturation with respect to ice. The depletion of water vapor through INP activation redistributes the available water vapor between homogeneously and heterogeneously frozen crystals, thereby affecting the total number of ice crystals. Aqueous sulfate droplets require high supersaturation with respect to ice in order to freeze homogeneously. This is because the droplets must dilute to increase water activity and overcome the energy barrier of the phase transition from liquid to ice. Without sufficient water vapor, the droplets may lose moisture to the surrounding air, becoming highly concentrated and preventing homogeneous ice nucleation. Our results show that, when activated as INPs, ash particles reduce the available water vapor and lower the supersaturation over ice. Consequently, homogeneous freezing occurs less frequently in the VOLCANO simulation, resulting in a smaller total number of ice crystals than in scenarios without ash activation.
In addition to sufficient water vapor, the concentration of liquid aerosol particles is an important factor in homogeneous ice nucleation. Figure 10d shows the vertical profile of sulfate particle number concentration. As can be seen, sulfate particles are more abundant in the VOLCANO-NO-ASH simulation than in the VOLCANO simulation. This is due to coagulation processes, whereby ash and sulfate particles stick together. The result is particles that are categorized as insoluble modes or forms of internally mixed aerosols, which occur when the 5 % mass threshold of soluble coatings on insoluble particles is exceeded. Consequently, despite having identical SO2 source strengths, the number of soluble particles (i.e., sulfate aerosols) differs between the two simulations. Since the concentration of liquid aerosols is lower in the VOLCANO simulation, the number of ice crystals formed through homogeneous ice nucleation is reduced relative to the VOLCANO-NO-ASH simulation. In the NO-VOLCANO simulation, sulfate concentrations are much lower than in the other two cases because only small predefined background values were applied.
Figure 10e shows the diameter of liquid aerosols in the three simulations. Below an altitude of 13 km, sulfate particles are larger in the NO-VOLCANO simulation. At higher altitudes, however, sulfate particles are larger in the VOLCANO and VOLCANO-NO-ASH simulations than in the NO-VOLCANO simulation. This affects the total number of ice crystals, as shown in Fig. 10f.
Figure 10f illustrates the total number of ice crystals formed through a combination of homogeneous and heterogeneous ice nucleation. Taking into account the activation of ash particles as INPs, the resulting depletion of water vapor, and the varying concentrations and sizes of liquid aerosols – all of which play a significant role in the competition between homogeneous and heterogeneous nucleation – we ultimately found that the total number of ice crystals formed in VOLCANO is lower than in VOLCANO-NO-ASH and NO-VOLCANO at altitudes below 14 km. For instance, at 13 km, the ice crystal number concentrations are approximately 5×10⁵ m−3 in VOLCANO, 7.5×10⁵ m−3 in VOLCANO-NO-ASH, and 1×10⁶ m−3 in NO-VOLCANO. However, at altitudes above 14 km, the VOLCANO simulation produces more ice crystals than NO-VOLCANO but fewer than VOLCANO-NO-ASH. For example, at 17 km, the concentrations are approximately 1×10⁷ m−3 in NO-VOLCANO, 2.8×10⁷ m−3 in VOLCANO, and 6×10⁷ m−3 in VOLCANO-NO-ASH. At altitudes between 10 and 12 km, there is a local maximum in the profile of the VOLCANO simulation that was previously observed in Fig. 10b. This small peak indicates immersion freezing. As even the reduction of Smaxice cannot diminish its effect, at these altitudes, the VOLCANO simulation has a slightly larger number concentration of ice crystals than the other experiments. Since the values in this figure are widely dispersed, Fig. 10f employs a logarithmic scale.
Figure 10g illustrates specific humidity (qv) which is used as a mass conservation check in the ICON-ART model. After a check for a water mass conservation to ensure that the newly nucleated particles predicted by the ice nucleation scheme after Barahona and Nenes (2009b) are consistent with the actually available water vapor, the number of ice crystals formed in the upper troposphere above 14 km is reduced to the values shown in Fig. 10h.
Ultimately, considering homogeneous and heterogeneous ice nucleation, as well as mass conservation, Fig. 10h shows the total number of ice crystals produced in the ART model in the three simulations. As can be seen, the large number of ice crystals at altitudes above 14 km disappeared after applying the mass conservation check, and the difference between the simulation results is clearer at lower altitudes. According to the results shown in Fig. 10h, the total number of ice crystals is lower in the VOLCANO simulation, in which ash particles act as INPs, than in the VOLCANO-NO-ASH simulation, in which volcanic ash is not considered. However, the total number of ice crystals in these two simulations is lower than in the NO-VOLCANO simulation due to the presence of smaller liquid aerosols in those simulations compared to the NO-VOLCANO simulation.
Figure 11 shows the number concentration and mass mixing ratio of ice crystals simulated with ICON-ART. After ice crystals form both through homogeneous and heterogeneous nucleation (see Fig. 10h) and through rain or cloud droplet freezing, they grow (or shrink) through the deposition of water vapor and subsequently undergo transport by sedimentation, advection and diffusion. The vapor deposition directly influences the mass mixing ratio of the ice crystals. Although the simulations show a notable difference in ice number concentration, the difference in mass mixing ratio between the VOLCANO-NO-ASH and NO-VOLCANO simulations is minimal. This can be attributed to the effect of the deposition rate on ice crystal growth. In the VOLCANO simulation, ash particles act as INPs. They consume available water vapor and reduces the deposition rate. This limits the growth – and thus the mass mixing ratio – of ice crystals. Consequently, the deposition rate is higher in the former two cases. The small difference in the mass mixing ratio between the VOLCANO-NO-ASH and NO-VOLCANO simulations may be due to the difference in size of the liquid aerosols, which are larger in the NO-VOLCANO simulation. This promotes more efficient freezing, resulting in a greater total mass conversion to ice.
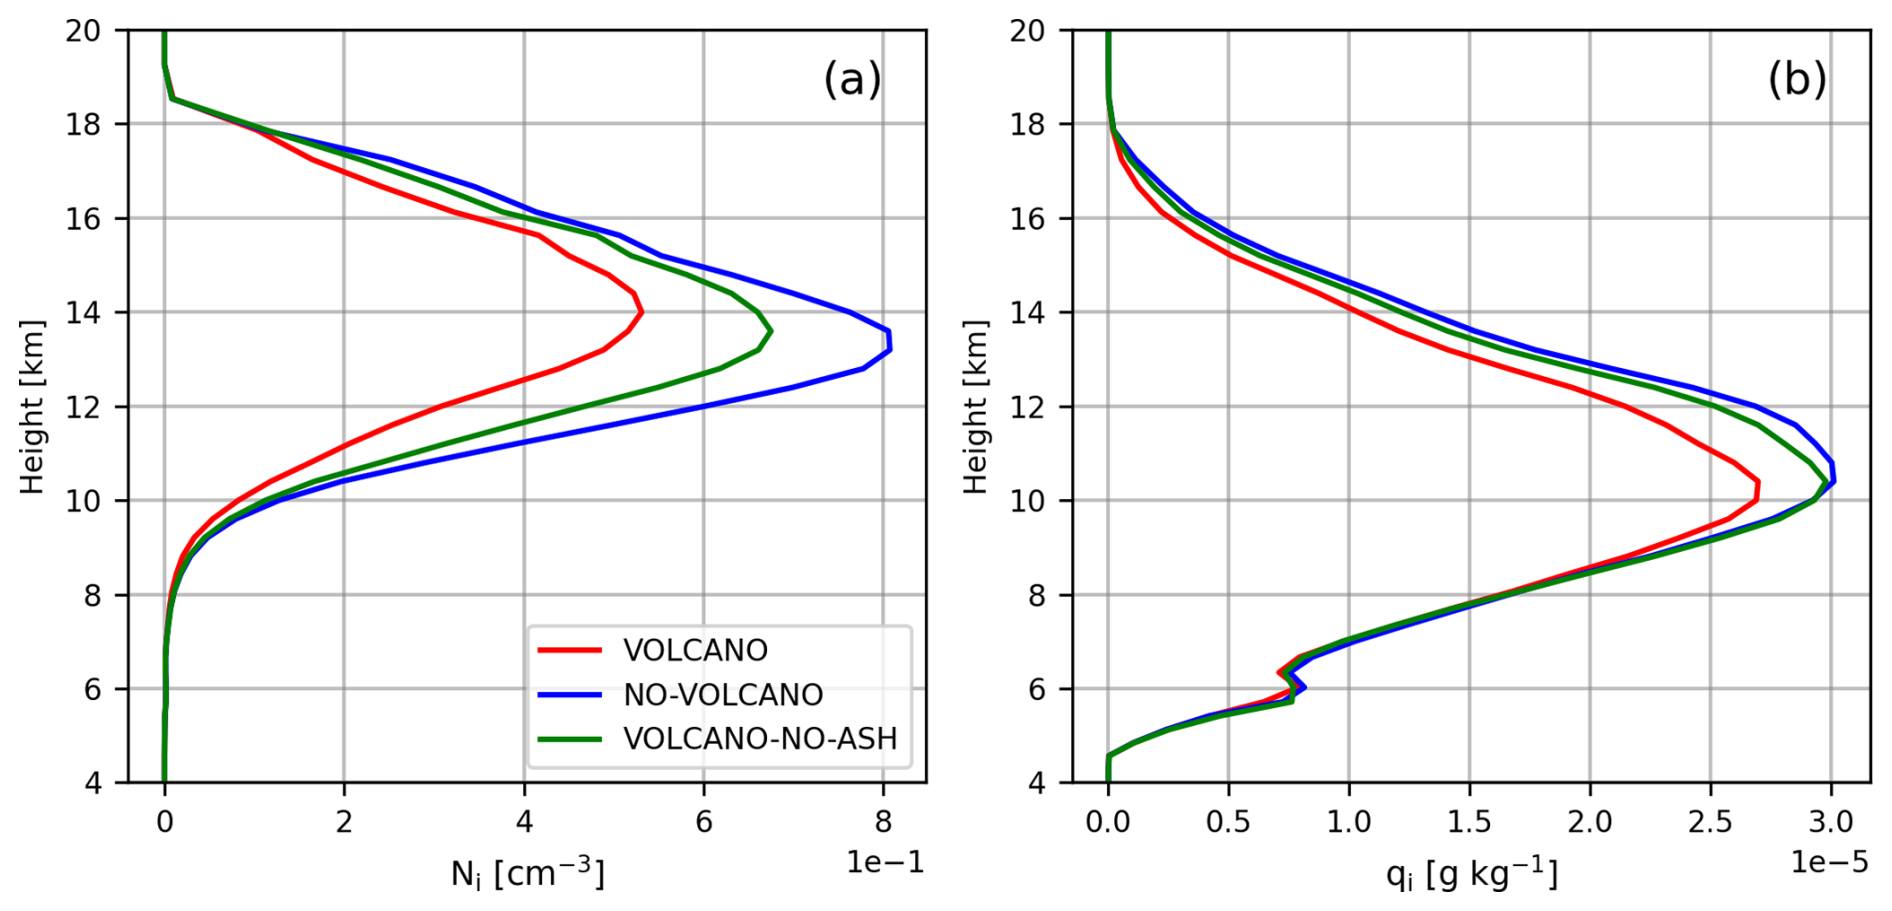
Figure 11Spatiotemporally averaged profiles – calculated from 12:00 UTC on 9 April 2021 to 23:00 UTC on 13 April – of the number concentration (a) and mass mixing ratio (b) of ice particles in the VOLCANO (red), VOLCANO-NO-ASH simulation (green), and NO-VOLCANO simulation (blue) for La Soufrière. The results shown here are for inside the plume. Ni represents the resulting ice crystal number concentration after all relevant microphysical and transport processes have been applied.
Snow particles form through the aggregation of ice crystals. Figure 12 illustrates the number concentration and mass mixing ratio of snow particles, as well as the number and mass aggregation rates in the simulations. The plots in the top row show the number (a) and mass (b) aggregation rates. As expected, the VOLCANO simulation has the fewest aggregated ice crystals, corresponding to the smaller quantity of ice crystals present in that scenario. Consequently, the lowest snow number concentration was observed in the VOLCANO simulation. In our simulations, the number concentration of snow particles behaves similarly to the number concentration of ice particles. This shows that more ice particles lead to more aggregation and, consequently, more snow particles. However, the mass mixing ratio of snow remains largely unchanged among the simulations. Since there are fewer snow particles in the VOLCANO simulation than in the other two simulations and the mass does not change significantly, the snow particles must be larger in the VOLCANO simulation.
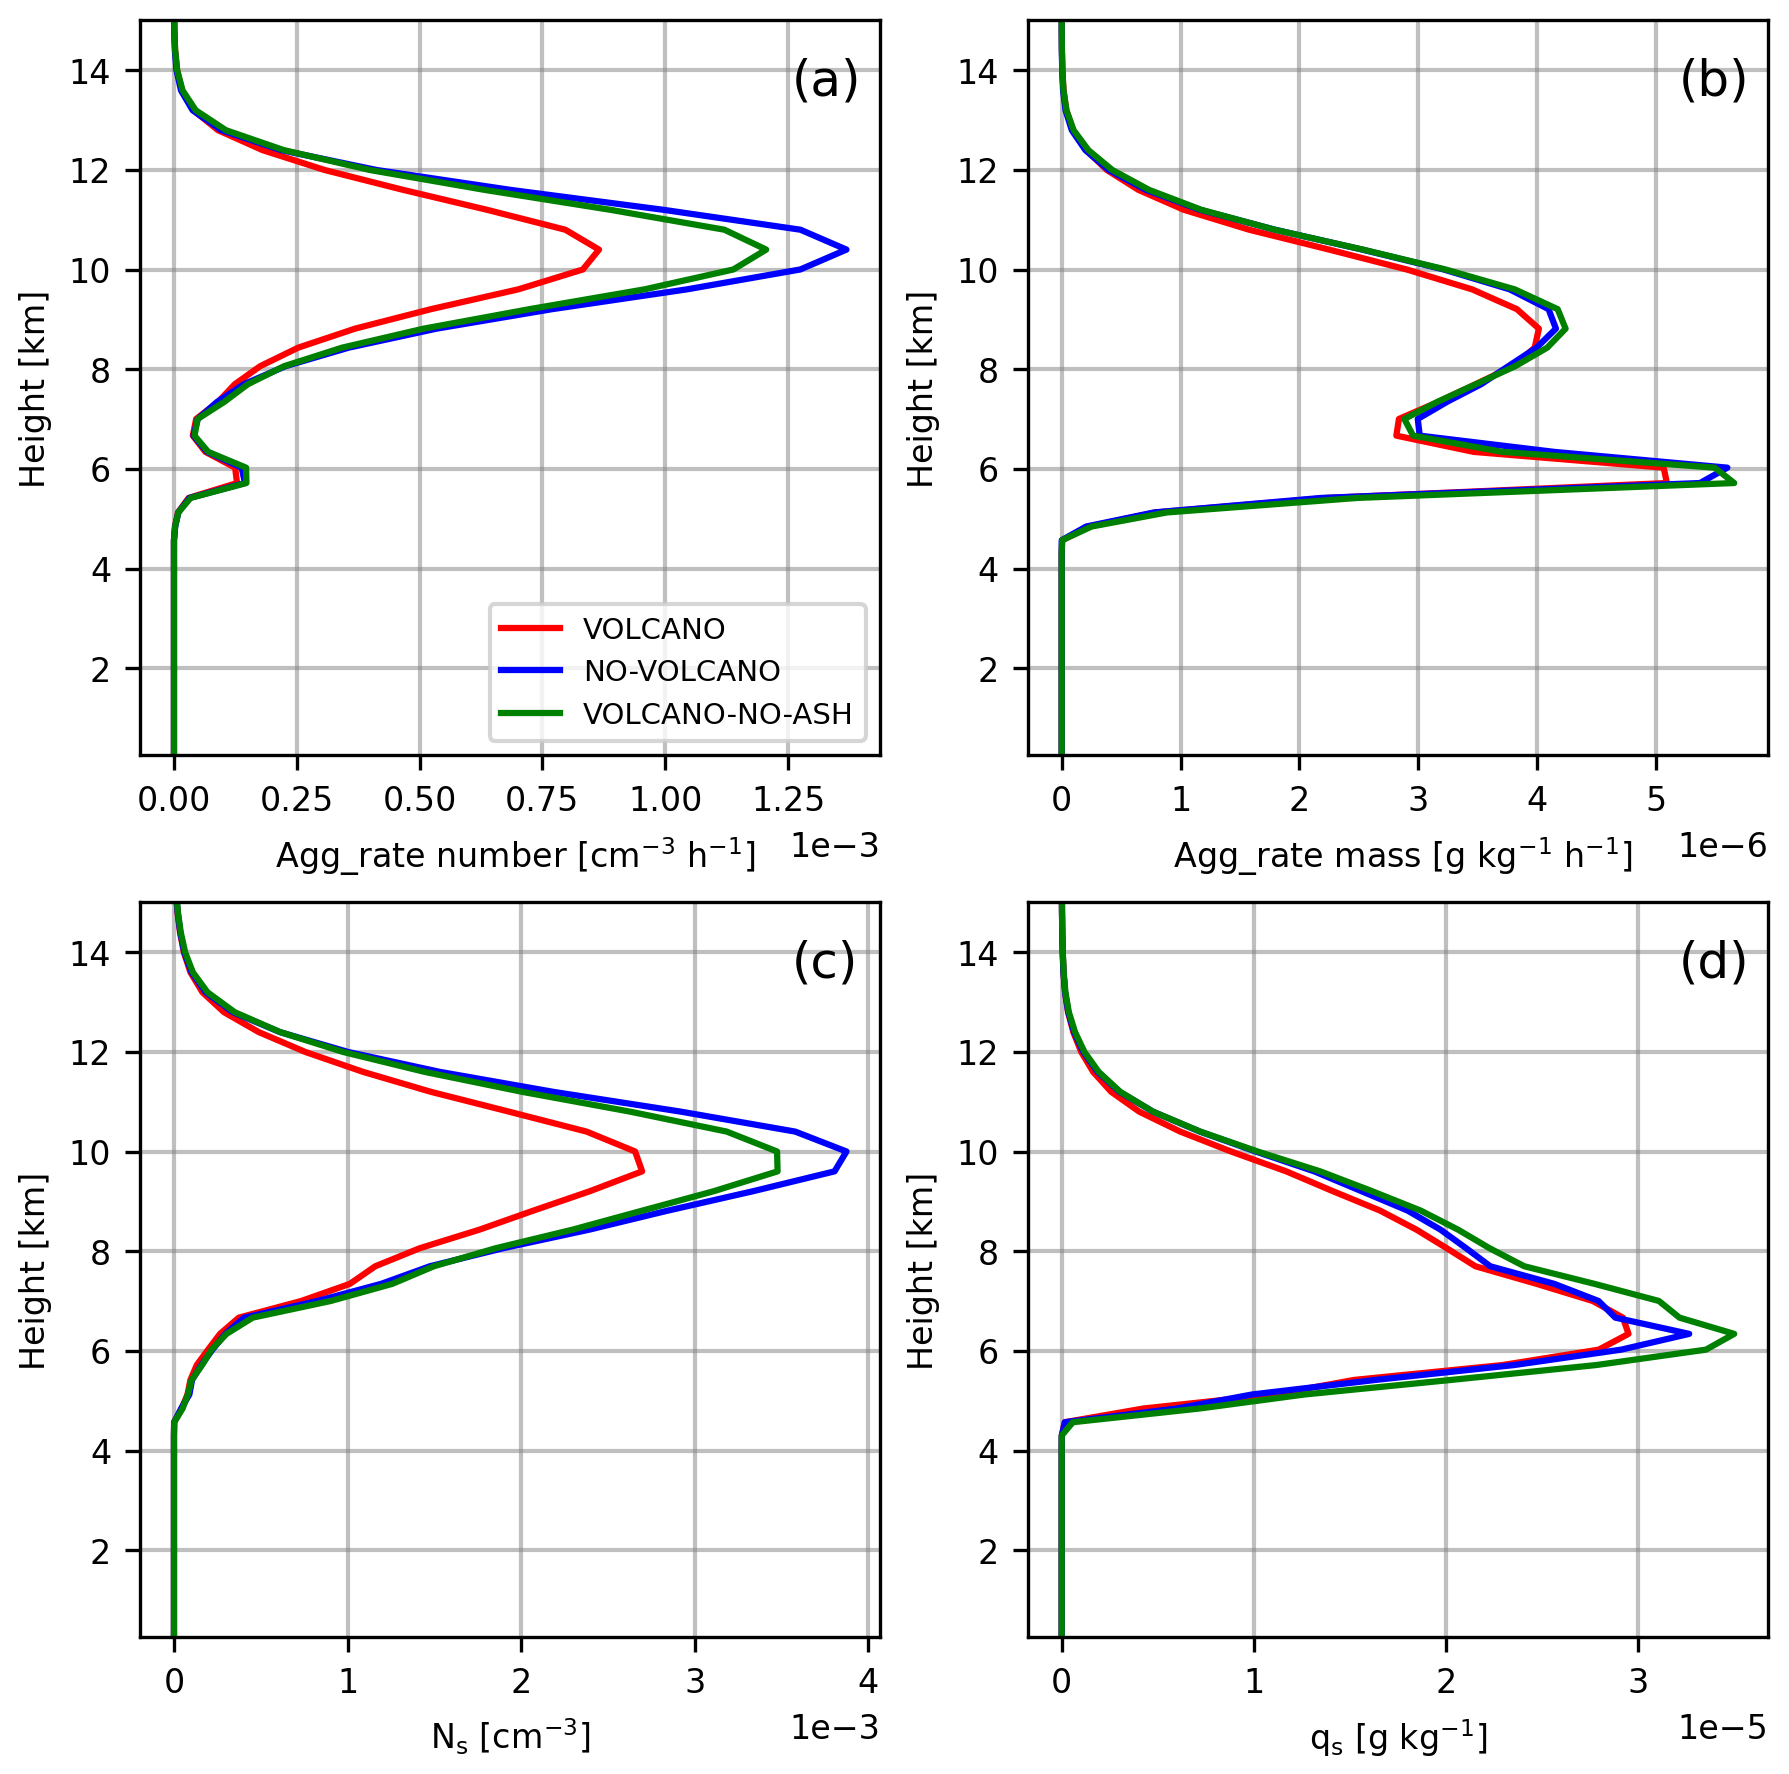
Figure 12Spatiotemporally averaged profiles – calculated from 12:00 UTC on 9 April 2021 to 23:00 UTC on 13 April – of the rate of aggregation number (a) and mass (b) as well as the number concentration (c) and mass mixing ratio (d) of snow particles in the VOLCANO (red), VOLCANO-NO-ASH simulation (green), and NO-VOLCANO simulation (blue) for La Soufrière. The results shown here are for inside the plume.
4.2.3 Statistical test
As in the case of Holuhraun, we used the Mann-Whitney U test to calculate p-values and evaluate the statistical significance of the differences in hydrometeor properties across the simulations. Additionally, the direction of changes were assessed by calculating the relative difference between their mean values. Four simulations were conducted for the La Soufrière eruption. As previously discussed, we observed no notable differences between the VOLCANO and VOLCANO-MIXED simulations. The calculated p-values confirmed this observation, indicating no statistically significant differences between these two cases. Figure 13 shows the resulting relative differences, with colors indicating the sign of the change and p-values below 0.05 highlighted by black frames around the boxes, for the mass mixing ratio and number concentration of all hydrometeors over the four-day simulation period. Since no significant differences were found between the VOLCANO and VOLCANO-MIXED simulations, their respective p-values were excluded from the figure. The figure shows the comparison between VOLCANO and NO-VOLCANO (top panel) and VOLCANO and VOLCANO-NO-ASH (bottom panel). In the VOLCANO simulation, the presence of sulfate particles results in a higher concentration of cloud droplets compared to NO-VOLCANO. As the top panel of Fig. 13 shows, the difference in the number of cloud droplets between the two simulations is statistically significant for the last three days of the simulation. However, the cloud droplet mass mixing ratio shows a significant change on the last two days. An examination of the cloud vertical profiles (not shown) revealed scattered clouds at lower atmospheric levels. There are no significant differences in the number concentration or mass mixing ratio of rain between these two simulations, indicating that the warm rain process is largely unaffected by changes in aerosol number concentration. Although the number of cloud droplets increases in the VOLCANO simulation, the mass remains relatively unchanged because there is no substantial conversion of cloud water into rainwater – the water remains within the cloud category. Examining all two plots and making pairwise comparisons reveals no significant changes in the mass mixing ratio or number concentration of graupel, which may be due to the absence of mixed–phase clouds during the simulations. However, the results indicate that volcanic aerosols significantly affect the number and mass of ice particles in all simulations. Figure 11 illustrates that ash and sulfate both affect the number concentration and mass mixing ratio of ice. P-values demonstrate that the differences between the simulations are significant. We also observed a significant difference in snow number concentration. However, the snow mass mixing ratio behaved differently, and no notable differences were observed between the simulations.
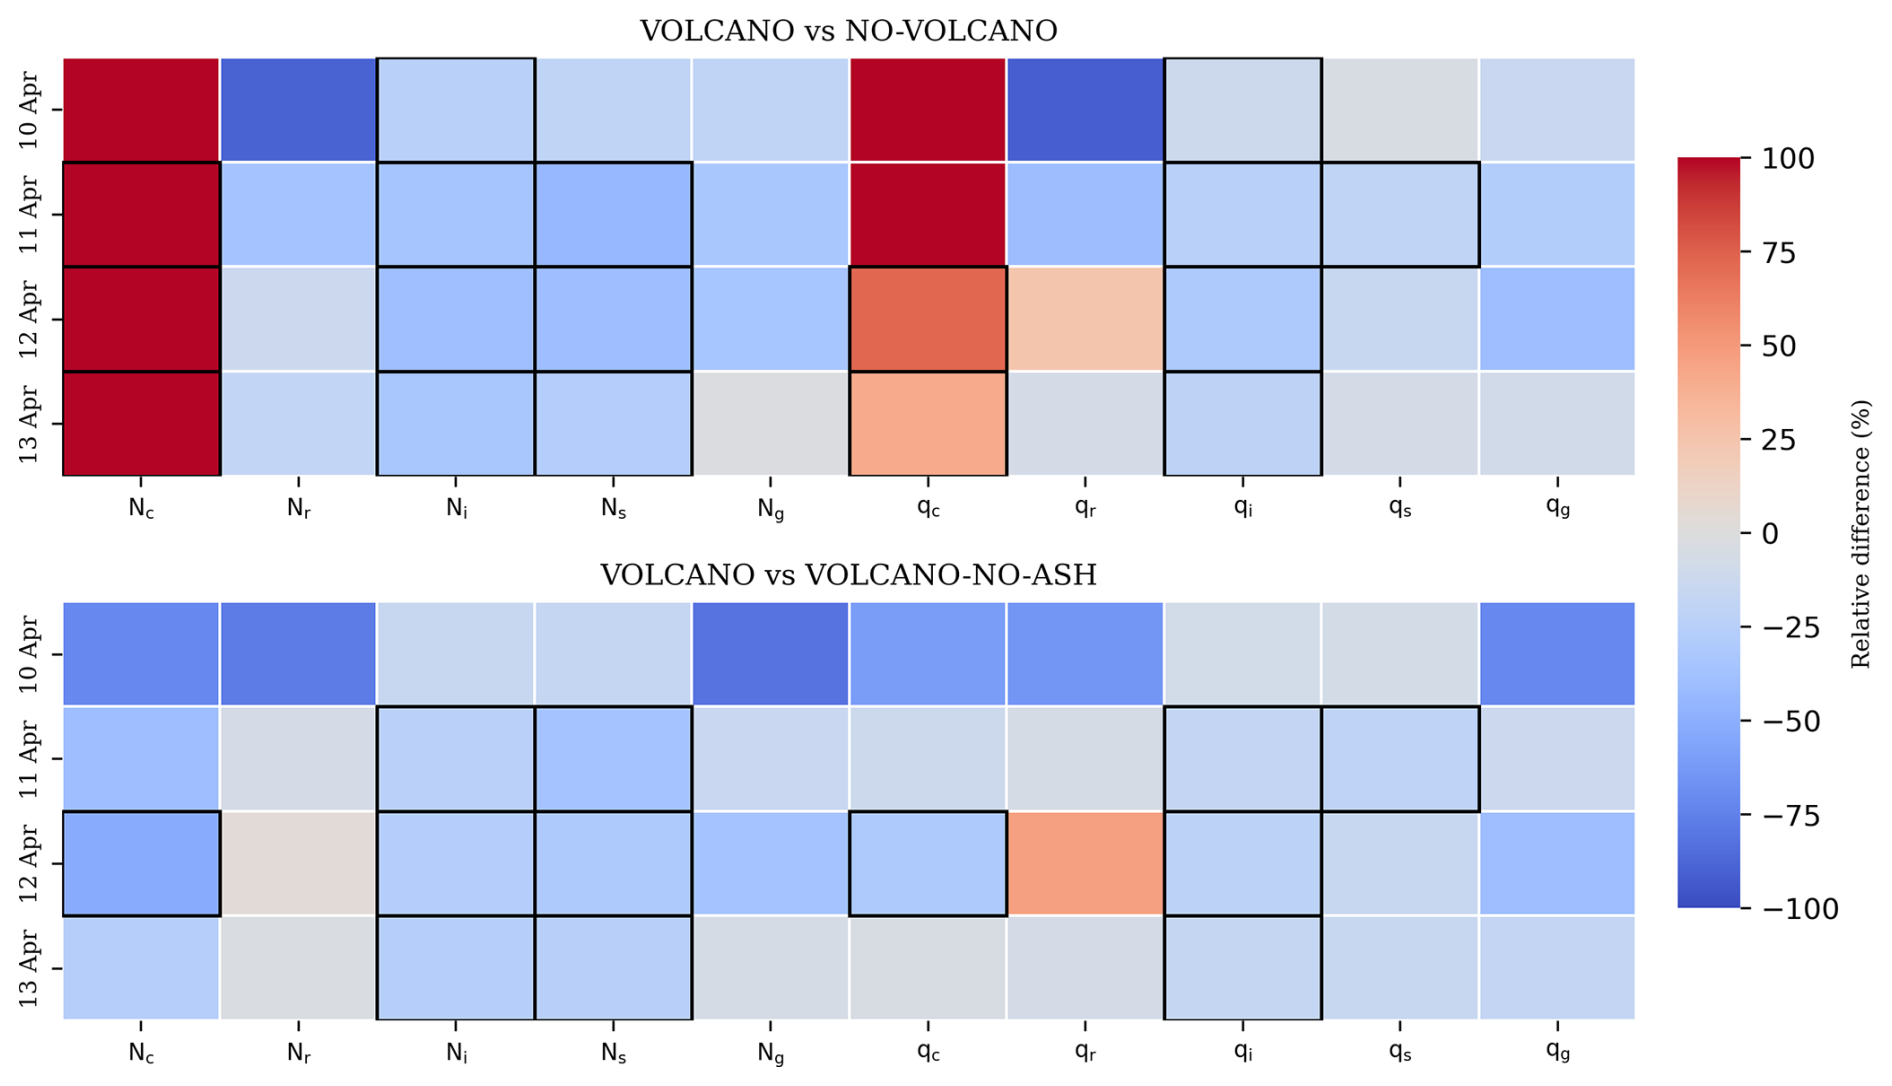
Figure 13Relative difference and statistical significance of daily changes in VOLCANO and NO-VOLCANO simulations (top) and VOLCANO and VOLCANO-NO-ASH simulations for La Soufrière inside the plume. Colors indicate the relative difference, while black boxes denote statistically significant differences (p<0.05) in cloud hydrometeors for each day (y axis).
This study investigated the effect of volcanic aerosols on clouds. To accomplish this, we simulated two volcanic eruptions that differed in location and emitted substances with the ICON-ART model. The proposed main causal chains for the aerosol-cloud interactions in these simulations are summarized in Fig. 14.
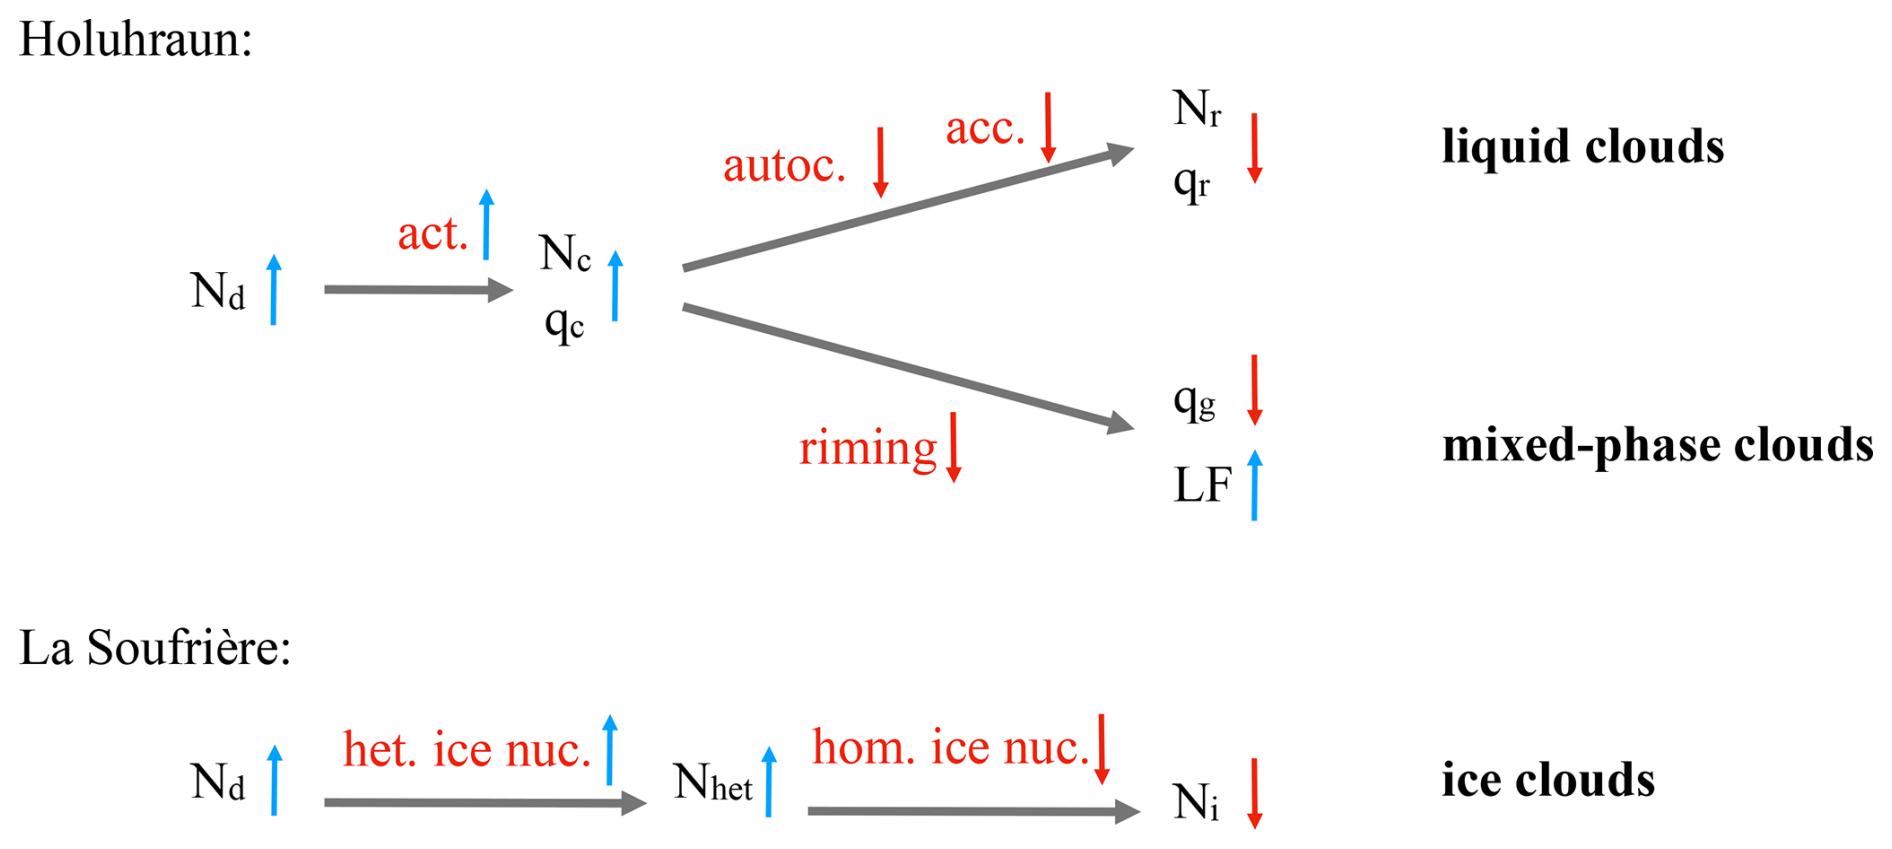
Figure 14Schematic of the main causal chains identified for aerosol-cloud interactions in the Holuhraun and La Soufrière simulations. LF stands for liquid fraction.
The first case we simulated was the first 6 d of the September 2014 Holuhraun eruption. This volcanic eruption emitted a large quantity of SO2 into the atmosphere, but carried very little volcanic ash. We performed two simulations: one with volcanic emissions (VOLCANO) and one without (NO-VOLCANO). The CCN activation scheme had to be tuned because preliminary simulation results showed a strong difference in cloud droplet number concentration compared to MODIS retrievals. In particular, we adjusted the model to account for the isotropy of turbulence rather than assuming that all turbulent energy was confined to vertical motion. This reduced the standard deviation of the vertical velocity used in calculating the PDF of vertical velocity for CCN activation. These modifications reduced the discrepancy between the simulation results and observations. Analysis of the results of the simulations in cloudy pixels, as well as inside and outside the plume, showed that there were no notable differences between the VOLCANO and NO-VOLCANO simulations outside of the plume because the meteorological conditions and aerosol distributions were similar. Meanwhile, inside the plume, the number concentration of cloud droplets significantly increased in the VOLCANO simulation. Conversely, processes dependent on cloud droplet size, such as autoconversion and accretion, were reduced. This, in turn, reduced the number concentration and mass mixing ratio of raindrops. We observed no notable effects of volcanic aerosols on cloud ice and snow. However, our results showed that the mass mixing ratio and number concentration of graupel decreased in the VOLCANO simulation. Since the cloud droplets are smaller in the VOLCANO simulation, they are less likely to collide with ice crystals, resulting in a lower riming rate and thus less graupel production. Outside the plume, there are fewer but larger cloud droplets. This increases the collision and coalescence processes, enhancing raindrop formation. The Mann-Whitney U test revealed that the differences observed between VOLCANO and NO-VOLCANO are statistically significant.
The second case we simulated was the 2021 eruption of La Soufrière. Unlike the Holuhraun eruption, this one was explosive. In addition to SO2, it emitted a large quantity of ash particles. First, the competition between heterogeneous and homogeneous ice nucleation was investigated by comparing a sulfate-only scenario, in which only homogeneous freezing occurs, to a scenario in which ash particles act as INPs and sulfate particles freeze homogeneously at low temperatures. To evaluate this, we ran three simulations. The first is the VOLCANO simulation with both ash and SO2 emission, the second simulation is termed VOLCANO-NO-ASH with the same SO2 source strength but zero ash emissions, and a NO-VOLCANO simulation with zero source strength for both ash and SO2. Second, to evaluate the impact of internally mixed sulfate-ash aerosols acting as CCN on clouds, an additional simulation called VOLCANO-MIXED was run. This simulation is identical to the VOLCANO simulation, except it allows mixed-mode aerosols to act as CCN. Comparing the results of VOLCANO and VOLCANO-MIXED shows no notable effect of activating mixed-mode aerosols as CCN on cloud hydrometeors. Further analysis showed that ice clouds dominated during our simulations. Thus, the lack of notable effects of mixed-mode aerosols on clouds may be due to the absence of warm and mixed–phase clouds during the simulation period and over the simulation domain. To investigate the ice phase processes, we compared the results of VOLCANO, VOLCANO-MIXED, and NO-VOLCANO simulations. Heterogeneous ice nucleation occurs first because it happens at warmer temperatures. The ash particles in the VOLCANO simulation act as INPs and form ice crystals, depleting the water vapor. Our results showed that maximum supersaturation over ice decreased in the VOLCANO simulations. This can affect homogeneous ice nucleation because sulfate particles need high supersaturations to overcome the energy barrier of phase transition. Our results showed that the total number of ice crystals decreased in the VOLCANO simulation due to the inhibition of homogeneous ice nucleation. Additionally, the number and size of liquid aerosols are important for homogeneous ice nucleation. Our results showed that the total number of ice crystals was higher in the NO-VOLCANO simulation, in which the sulfate particles were larger, than in the VOLCANO-NO-ASH simulation, which had a similar supersaturation over ice. We also found significant differences in the number of snow particles, with fewer snow particles in VOLCANO than in VOLCANO-NO-ASH than in NO-VOLCANO. Snow number concentrations follow the behaviour of the aggregation rate. However, we did not observe a significant difference in the mass mixing ratio of snow in these simulations. The Mann-Whitney U test showed that the differences we observed in the number concentrations of cloud droplets, ice, and snow were significant, but we did not see this for the mass of variables.
In this study, we used numerical simulations to extend the understanding of volcanic aerosol effects on cloud microphysical properties and hydrometeors, which have previously been investigated primarily in warm clouds (e.g., Malavelle et al., 2017; Haghighatnasab et al., 2022). Here, we examined their influence on warm, ice, and mixed-phase clouds. Our results indicate that the effects of volcanic plumes on clouds are highly case-specific, depending on the prevailing weather system (see also Peace et al., 2024) as well as on the cloud type over the studied region and the plume height. For instance, in the Holuhraun case we found a significant impact of volcanic aerosols on warm and mixed-phase clouds, whereas in the La Soufrière case, despite the large SO2 emissions, no significant effect on rain or graupel was observed. This lack of impact can likely be attributed to the absence of warm and mixed-phase clouds during the simulation period. For ice clouds, our results show a reduction in ice concentration in the presence of the volcanic ash, consistent with previous studies (e.g., Lin et al., 2025). However, this contrasts with Breen et al. (2021), who reported increased ice crystal concentrations at cirrus levels when ash particles were included in the ice nucleation process. Overall, these findings suggest that the effects of volcanic aerosols on clouds are not generalizable but instead strongly case-dependent.
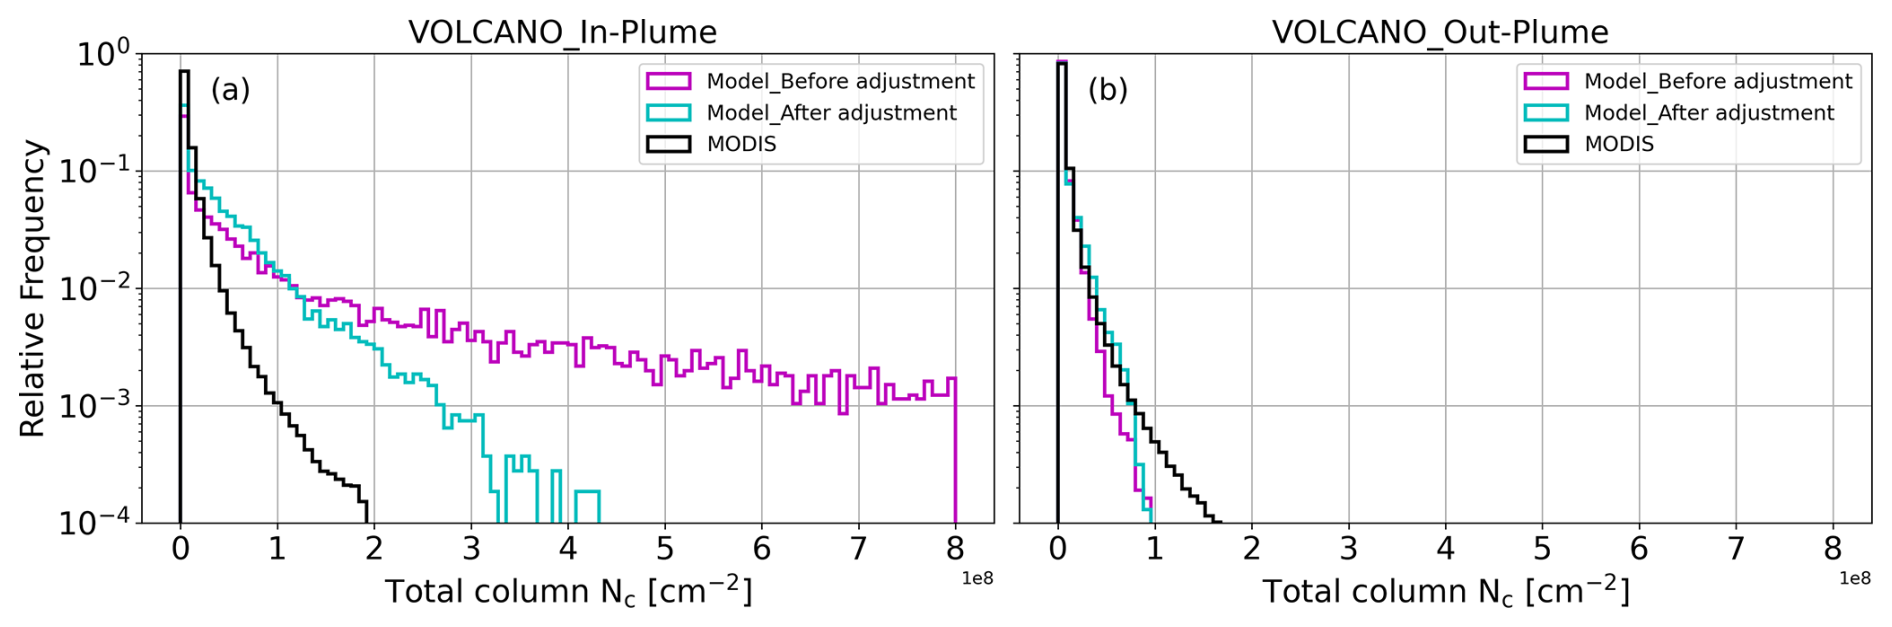
Figure A1Relative frequency of total column Nc inside (a) and outside (b) the plume in the VOLCANO simulation before adjustment (magenta), after adjustment (cyan) and MODIS data (black). The SO2>1 DU criterion is used for the observations, while the kg kg−1 threshold is used for the simulations to define the boundary between the inside and outside of the plume.
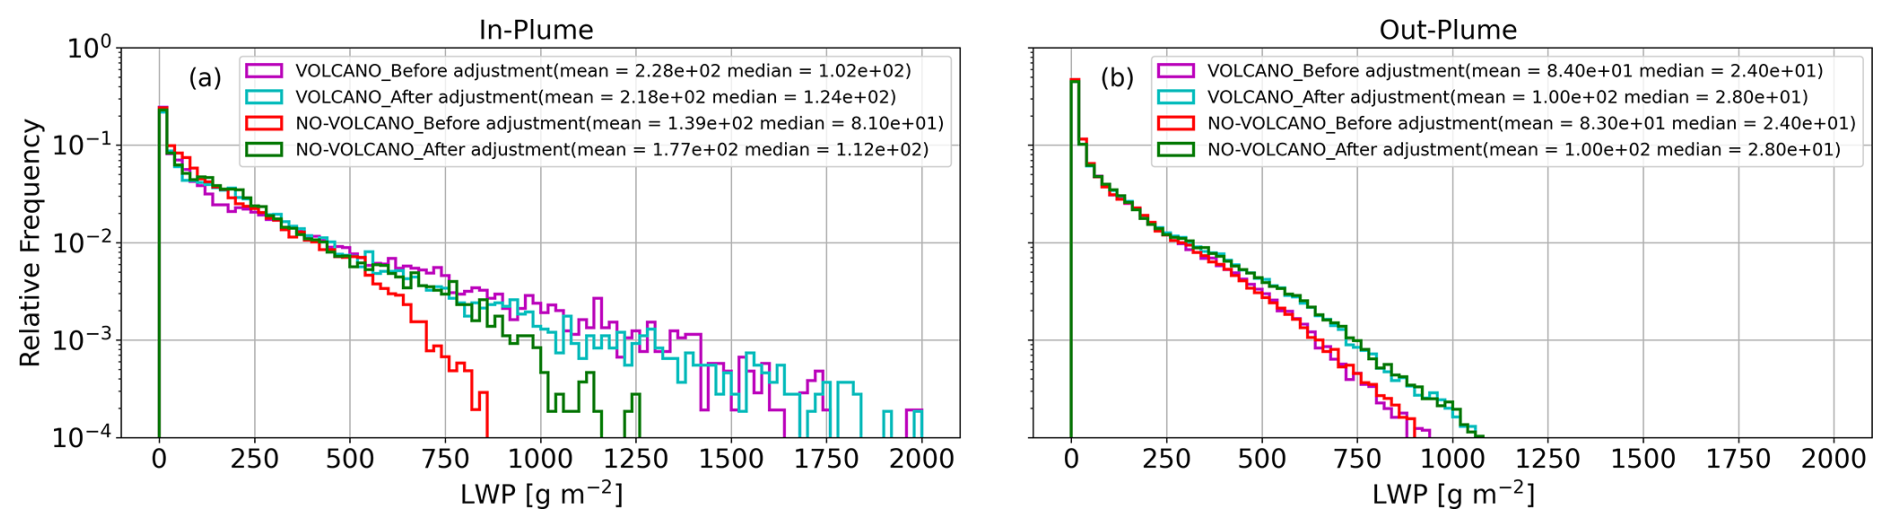
Figure A2Relative frequency of LWP inside (a) and outside (b) the plume in the VOLCANO and NO-VOLCANO simulation before and after adjustment. For each case, the mean and median are shown in the figure legend. For the simulations, the threshold of kg kg−1 is used to define the boundary between the inside and outside of the plume.
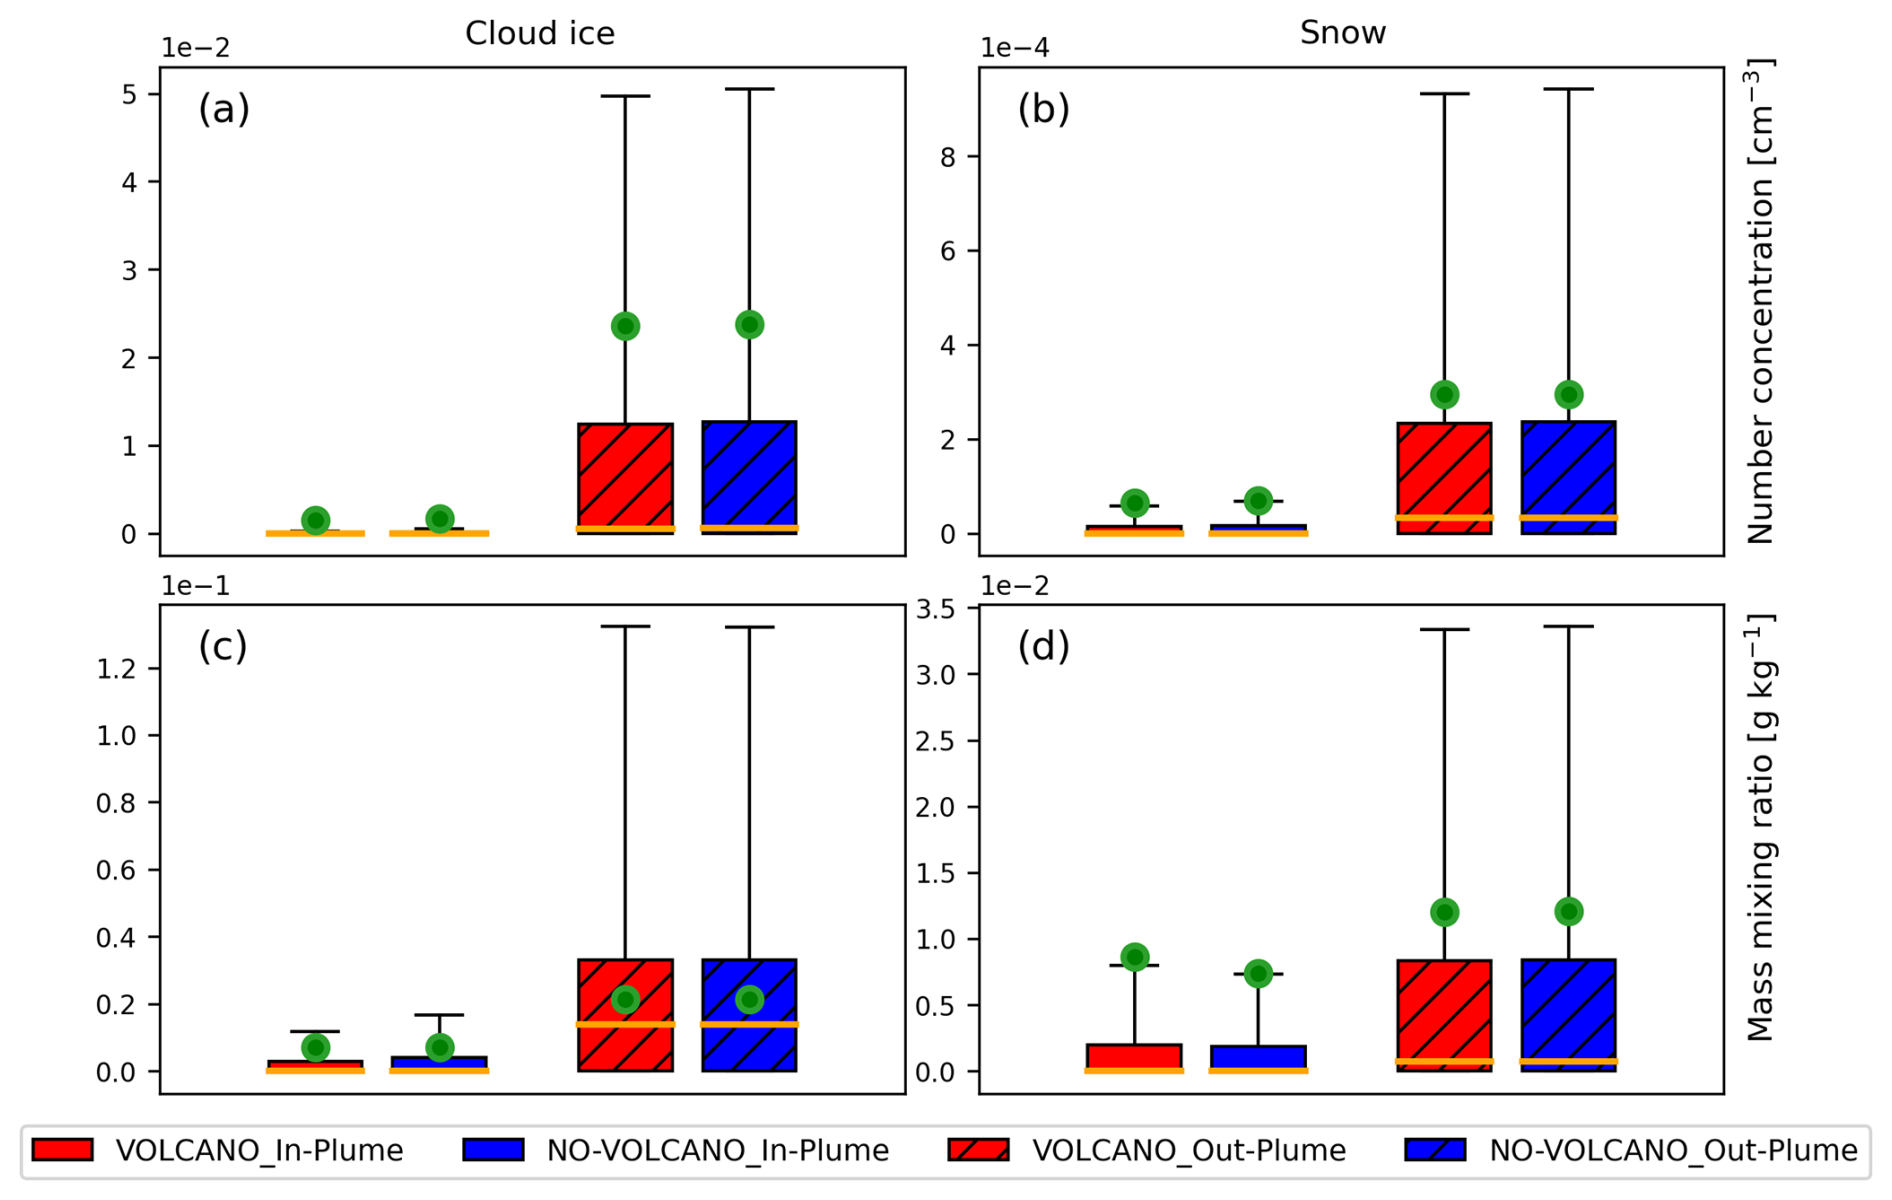
Figure A3Distribution of the number concentration (a, b) and the mass mixing ratio (c, d) of cloud ice (a, c) and snow (b, d) inside and outside (hatched box) the plume in two simulations for Holuhraun. The orange horizontal lines indicate the median of each distribution and the green dots show the mean. Each box spans the interquartile range (Q1 to Q3), and whiskers extend to three times the interquartile range (3 IQR).
The ICON and ART models are openly available at https://doi.org/10.35089/wdcc/iconrelease2025.04 (ICON partnership, 2025). Certain model components used in this work, which are not open-source conform, can be provided upon reasonable request to the corresponding author. The ICON model outputs are stored at the German Climate Computing Center (Deutsches Klimarechenzentrum, DKRZ) and are available upon request to the corresponding author. The MODIS data were downloaded from the Atmosphere Archive & Distribution System (LAADS) Distributed Active Archive Center (DAAC), located in the Goddard Space Flight Center in Greenbelt, Maryland (https://doi.org/10.5067/MODIS/MYD06_L2.061, Platnick et al., 2015).
FZ and CH conducted this study. JB and GAH provided the simulation setup of the La Soufrière eruption. All authors contributed to adjusting the model. FZ performed the data analysis and created the figures. All co-authors discussed and interpreted the results. FZ wrote the manuscript with advice from the other authors.
The contact author has declared that none of the authors has any competing interests.
Publisher's note: Copernicus Publications remains neutral with regard to jurisdictional claims made in the text, published maps, institutional affiliations, or any other geographical representation in this paper. The authors bear the ultimate responsibility for providing appropriate place names. Views expressed in the text are those of the authors and do not necessarily reflect the views of the publisher.
This work used resources of the Deutsches Klimarechenzentrum (DKRZ) granted by its Scientific Steering Committee (WLA) under project IDs 1093 and 1163. We acknowledge the valuable collaboration with the colleagues in the VolImpact research unit, especially those in the VolCloud project at Leipzig University: Johannes Quaas and Mahnoosh Haghighatnasab. We would also like to thank Heike Vogel, Christian Barthlott, Sven Werchner, and Cunbo Han for helpful discussions. ChatGPT was used to assist the editing the language of parts of the manuscript. All content was subsequently reviewed and edited by the authors, who take full responsibility for the final version of the manuscript.
This research has been funded by the Deutsche Forschungsgemeinschaft (DFG) as part of the Research Unit VolImpact (FOR2820, DFG Grant 398006378, subprojects VolCloud (HO 4612/3-1, HO 4612/3-2) and VolPlume (HO 5275/4-1, HO 5275/4-2)) and the European Research Council (ERC) under the European Union’s Horizon 2020 Research and Innovation program (grant agreement no. 714062; ERC Starting Grant “C2Phase”).
The article processing charges for this open-access publication were covered by the Karlsruhe Institute of Technology (KIT).
This paper was edited by Toshihiko Takemura and reviewed by two anonymous referees.
Albrecht, B. A.: Aerosols, cloud microphysics, and fractional cloudiness, Science, 245, https://doi.org/10.1126/science.245.4923.1227, 1989. a
Andreae, M. O., Rosenfeld, D., Artaxo, P., Costa, A. A., Frank, G. P., Longo, K. M., and Silva-Dias, M. A.: Smoking Rain Clouds over the Amazon, Science, 303, https://doi.org/10.1126/science.1092779, 2004. a
Arason, Þ., Bjornsson, H., Petersen, G. N., Jónasdóttir, E. B., and Oddsson, B.: Plume height during the 2014–2015 Holuhraun volcanic eruption, in: EGU General Assembly Conference Abstracts, 11498, https://meetingorganizer.copernicus.org/EGU2015/EGU2015-11498.pdf (last access: 7 July 2026), 2015. a
Bangert, M. J.: Interaction of aerosol, clouds, and radiation on the regional scale, PhD thesis, Karlsruhe, Karlsruher Institut für Technologie (KIT), 2012, https://doi.org/10.5445/IR/1000028911, 2012. a, b, c
Barahona, D. and Nenes, A.: Parameterization of cirrus cloud formation in large-scale models: Homogeneous nucleation, J. Geophys. Res.-Atmos., 113, https://doi.org/10.1029/2007JD009355, 2008. a
Barahona, D. and Nenes, A.: Parameterizing the competition between homogeneous and heterogeneous freezing in cirrus cloud formation – monodisperse ice nuclei, Atmos. Chem. Phys., 9, 369–381, https://doi.org/10.5194/acp-9-369-2009, 2009a. a
Barahona, D. and Nenes, A.: Parameterizing the competition between homogeneous and heterogeneous freezing in ice cloud formation – polydisperse ice nuclei, Atmos. Chem. Phys., 9, 5933–5948, https://doi.org/10.5194/acp-9-5933-2009, 2009b. a, b, c
Barahona, D., West, R. E. L., Stier, P., Romakkaniemi, S., Kokkola, H., and Nenes, A.: Comprehensively accounting for the effect of giant CCN in cloud activation parameterizations, Atmos. Chem. Phys., 10, 2467–2473, https://doi.org/10.5194/acp-10-2467-2010, 2010. a
Borys, R. D., Lowenthal, D. H., and Mitchell, D. L.: The relationships among cloud microphysics, chemistry, and precipitation rate in cold mountain clouds, Atmos. Environ., 34, 2593–2602, https://doi.org/10.1016/S1352-2310(99)00492-6, 2000. a
Breen, K. H., Barahona, D., Yuan, T., Bian, H., and James, S. C.: Effect of volcanic emissions on clouds during the 2008 and 2018 Kilauea degassing events, Atmos. Chem. Phys., 21, 7749–7771, https://doi.org/10.5194/acp-21-7749-2021, 2021. a
Bruckert, J., Hirsch, L., Horváth, Kahn, R. A., Kölling, T., Muser, L. O., Timmreck, C., Vogel, H., Wallis, S., and Hoshyaripour, G. A.: Dispersion and Aging of Volcanic Aerosols After the La Soufrière Eruption in April 2021, J. Geophys. Res.-Atmos., 128, https://doi.org/10.1029/2022JD037694, 2023. a, b, c, d, e
Carboni, E., Mather, T. A., Schmidt, A., Grainger, R. G., Pfeffer, M. A., Ialongo, I., and Theys, N.: Satellite-derived sulfur dioxide (SO2) emissions from the 2014–2015 Holuhraun eruption (Iceland), Atmos. Chem. Phys., 19, 4851–4862, https://doi.org/10.5194/acp-19-4851-2019, 2019. a, b
Dedekind, Z., Lauber, A., Ferrachat, S., and Lohmann, U.: Sensitivity of precipitation formation to secondary ice production in winter orographic mixed-phase clouds, Atmos. Chem. Phys., 21, 15115–15134, https://doi.org/10.5194/acp-21-15115-2021, 2021. a
Donner, L. J., O'Brien, T. A., Rieger, D., Vogel, B., and Cooke, W. F.: Are atmospheric updrafts a key to unlocking climate forcing and sensitivity?, Atmos. Chem. Phys., 16, 12983–12992, https://doi.org/10.5194/acp-16-12983-2016, 2016. a
Durant, A. J., Bonadonna, C., and Horwell, C. J.: Atmospheric and environmental impacts of volcanic particulates, Elements, 6, 235–240, https://doi.org/10.2113/gselements.6.4.235, 2010. a
Fountoukis, C. and Nenes, A.: Continued development of a cloud droplet formation parameterization for global climate models, J. Geophys. Res.-Atmos., 110, https://doi.org/10.1029/2004JD005591, 2005. a
Gasch, P., Rieger, D., Walter, C., Khain, P., Levi, Y., Knippertz, P., and Vogel, B.: Revealing the meteorological drivers of the September 2015 severe dust event in the Eastern Mediterranean, Atmos. Chem. Phys., 17, 13573–13604, https://doi.org/10.5194/acp-17-13573-2017, 2017. a
Gruber, S., Blahak, U., Haenel, F., Kottmeier, C., Leisner, T., Muskatel, H., Storelvmo, T., and Vogel, B.: A process study on thinning of Arctic winter cirrus clouds with high-resolution ICON-ART simulations, J. Geophys. Res.-Atmos., 124, 5860–5888, 2019. a
Haghighatnasab, M., Kretzschmar, J., Block, K., and Quaas, J.: Impact of Holuhraun volcano aerosols on clouds in cloud-system-resolving simulations, Atmos. Chem. Phys., 22, 8457–8472, https://doi.org/10.5194/acp-22-8457-2022, 2022. a, b, c
Han, C., Hoose, C., Stengel, M., Coopman, Q., and Barrett, A.: Sensitivity of cloud-phase distribution to cloud microphysics and thermodynamics in simulated deep convective clouds and SEVIRI retrievals, Atmos. Chem. Phys., 23, 14077–14095, https://doi.org/10.5194/acp-23-14077-2023, 2023. a, b
Hande, L. B. and Hoose, C.: Partitioning the primary ice formation modes in large eddy simulations of mixed-phase clouds, Atmos. Chem. Phys., 17, 14105–14118, https://doi.org/10.5194/acp-17-14105-2017, 2017. a
Hoose, C. and Möhler, O.: Heterogeneous ice nucleation on atmospheric aerosols: a review of results from laboratory experiments, Atmos. Chem. Phys., 12, 9817–9854, https://doi.org/10.5194/acp-12-9817-2012, 2012. a
Horváth, Á., Carr, J. L., Wu, D. L., Bruckert, J., Hoshyaripour, G. A., and Buehler, S. A.: Measurement report: Plume heights of the April 2021 La Soufrière eruptions from GOES-17 side views and GOES-16–MODIS stereo views, Atmos. Chem. Phys., 22, 12311–12330, https://doi.org/10.5194/acp-22-12311-2022, 2022. a, b
Hoshyaripour, G. A., Baer, A., Bierbauer, S., Bruckert, J., Brunner, D., Förstner, J., Hamzehloo, A., Hanft, V., Keller, C., Klose, M., Kumar, P., Ludwig, P., Metzner, E., Muth, L., Pauling, A., Porz, N., Ramezani Ziarani, M., Reddmann, T., Reißig, L., Ruhnke, R., Satitkovitchai, K., Seifert, A., Sinnhuber, M., Steiner, M., Versick, S., Vogel, H., Weimer, M., Werchner, S., and Hoose, C.: The atmospheric composition component of the ICON modeling framework: ICON-ART version 2025.10, Geosci. Model Dev., 19, 1645–1681, https://doi.org/10.5194/gmd-19-1645-2026, 2026. a, b
ICON partnership (DWD; MPI-M; DKRZ; KIT; C2SM): ICON release 2025.04, World Data Center for Climate (WDCC) at DKRZ [code], https://doi.org/10.35089/wdcc/iconrelease2025.04, 2025. a
Ilyinskaya, E., Schmidt, A., Mather, T. A., Pope, F. D., Witham, C., Baxter, P., Jóhannsson, T., Pfeffer, M., Barsotti, S., Singh, A., Sanderson, P., Bergsson, B., Kilbride, B. M., Donovan, A., Peters, N., Oppenheimer, C., and Edmonds, M.: Understanding the environmental impacts of large fissure eruptions: Aerosol and gas emissions from the 2014–2015 Holuhraun eruption (Iceland), Earth Planet. Sc. Lett., 472, https://doi.org/10.1016/j.epsl.2017.05.025, 2017. a
Kolzenburg, S., Giordano, D., Thordarson, T., Höskuldsson, A., and Dingwell, D. B.: The rheological evolution of the 2014/2015 eruption at Holuhraun, central Iceland, B. Volcanol., 79, 1–16, https://doi.org/10.1007/s00445-017-1128-6, 2017. a
Koop, T., Luo, B., Tsias, A., and Peter, T.: Water activity as the determinant for homogeneous ice nucleation in aqueous solutions, Nature, 406, 611–614, 2000. a
Korolev, A., McFarquhar, G., Field, P. R., Franklin, C., Lawson, P., Wang, Z., Williams, E., Abel, S. J., Axisa, D., Borrmann, S., Crosier, J., Fugal, J., Krämer, M., Lohmann, U., Schlenczek, O., Schnaiter, M., and Wendisch, M.: Mixed-Phase Clouds: Progress and Challenges, Meteor. Mon., 58, https://doi.org/10.1175/amsmonographs-d-17-0001.1, 2017. a
Lin, L., Liu, X., Zhao, X., Shan, Y., Ke, Z., Lyu, K., and Bowman, K. P.: Ice nucleation by volcanic ash greatly alters cirrus cloud properties, Science Advances, 11, eads0572, https://doi.org/10.1126/sciadv.ads0572, 2025. a, b
Lohmann, U., Lüönd, F., and Mahrt, F.: An introduction to clouds: From the microscale to climate, Cambridge University Press, ISBN: 9781139087513, https://doi.org/10.1017/CBO9781139087513, 2016. a, b, c, d
Malavelle, F. F., Haywood, J. M., Jones, A., Gettelman, A., Clarisse, L., Bauduin, S., Allan, R. P., Karset, I. H. H., Kristjánsson, J. E., Oreopoulos, L., Cho, N., Lee, D., Bellouin, N., Boucher, O., Grosvenor, D. P., Carslaw, K. S., Dhomse, S., Mann, G. W., Schmidt, A., Coe, H., Hartley, M. E., Dalvi, M., Hill, A. A., Johnson, B. T., Johnson, C. E., Knight, J. R., O'Connor, F. M., Stier, P., Myhre, G., Platnick, S., Stephens, G. L., Takahashi, H., and Thordarson, T.: Strong constraints on aerosol-cloud interactions from volcanic eruptions, Nature, 546, https://doi.org/10.1038/nature22974, 2017. a, b, c
Mann, H. B. and Whitney, D. R.: On a test of whether one of two random variables is stochastically larger than the other, Ann. Math. Stat., 50–60, https://doi.org/10.1214/aoms/1177730491, 1947. a
Mårtensson, E., Nilsson, E., de Leeuw, G., Cohen, L., and Hansson, H.-C.: Laboratory simulations and parameterization of the primary marine aerosol production, J. Geophys. Res.-Atmos., 108, https://doi.org/10.1029/2002JD002263, 2003. a
Monahan, E., Spiel, D., and Davidson, K.: A model of marine aerosol generation via whitecaps and wave disruption, in: Oceanic whitecaps: And their role in air-sea exchange processes, Springer, 167–174, https://doi.org/10.1007/978-94-009-4668-2_16, 1986. a
Morales, R. and Nenes, A.: Characteristic updrafts for computing distribution-averaged cloud droplet number and stratocumulus cloud properties, J. Geophys. Res.-Atmos., 115, https://doi.org/10.1029/2009JD013233, 2010. a
Muser, L. O., Hoshyaripour, G. A., Bruckert, J., Horváth, Á., Malinina, E., Wallis, S., Prata, F. J., Rozanov, A., von Savigny, C., Vogel, H., and Vogel, B.: Particle aging and aerosol–radiation interaction affect volcanic plume dispersion: evidence from the Raikoke 2019 eruption, Atmos. Chem. Phys., 20, 15015–15036, https://doi.org/10.5194/acp-20-15015-2020, 2020. a
Nenes, A. and Seinfeld, J. H.: Parameterization of cloud droplet formation in global climate models, J. Geophys. Res.-Atmos., 108, https://doi.org/10.1029/2002jd002911, 2003. a
Paukert, M. and Hoose, C.: Modeling immersion freezing with aerosol-dependent prognostic ice nuclei in Arctic mixed-phase clouds, J. Geophys. Res., 119, https://doi.org/10.1002/2014JD021917, 2014. a
Paukert, M., Hoose, C., and Simmel, M.: Redistribution of ice nuclei between cloud and rain droplets: Parameterization and application to deep convective clouds, J. Adv. Model. Earth Sy., 9, https://doi.org/10.1002/2016MS000841, 2017. a
Peace, A. H., Chen, Y., Jordan, G., Partridge, D. G., Malavelle, F., Duncan, E., and Haywood, J. M.: In-plume and out-of-plume analysis of aerosol–cloud interactions derived from the 2014–2015 Holuhraun volcanic eruption, Atmos. Chem. Phys., 24, 9533–9553, https://doi.org/10.5194/acp-24-9533-2024, 2024. a, b
Peng, Y., Lohmann, U., and Leaitch, W. R.: Importance of vertical velocity variations in the cloud droplet nucleation process of marine stratus clouds, J. Geophys. Res.-Atmos., 110, https://doi.org/10.1029/2004JD004922, 2005. a
Platnick, S., Ackerman, S. A., King, M. D., Meyer, K., Menzel, W. P., Holz, R. E., Baum, B. A., and Yang, P.: MODIS Atmosphere L2 Cloud Product (06_L2), NASA MODIS Adaptive Processing System, Goddard Space Flight Center, USA [data set], https://doi.org/10.5067/MODIS/MYD06_L2.061, 2015. a
Pruppacher, H. and Klett, J.: Microphysics of Clouds and Precipitation, Taylor & Francis, https://doi.org/10.1080/02786829808965531, 1997. a, b
Rieger, D., Bangert, M., Bischoff-Gauss, I., Förstner, J., Lundgren, K., Reinert, D., Schröter, J., Vogel, H., Zängl, G., Ruhnke, R., and Vogel, B.: ICON–ART 1.0 – a new online-coupled model system from the global to regional scale, Geosci. Model Dev., 8, 1659–1676, https://doi.org/10.5194/gmd-8-1659-2015, 2015. a
Rieger, D., Steiner, A., Bachmann, V., Gasch, P., Förstner, J., Deetz, K., Vogel, B., and Vogel, H.: Impact of the 4 April 2014 Saharan dust outbreak on the photovoltaic power generation in Germany, Atmos. Chem. Phys., 17, 13391–13415, https://doi.org/10.5194/acp-17-13391-2017, 2017. a
Rosenfeld, D., Lohmann, U., Raga, G. B., O'Dowd, C. D., Kulmala, M., Fuzzi, S., Reissell, A., and Andreae, M. O.: Flood or drought: How do aerosols affect precipitation?, Science, 321, 1309–1313, https://doi.org/10.1126/science.1160606, 2008. a
Schmidt, A., Leadbetter, S., Theys, N., Carboni, E., Witham, C. S., Stevenson, J. A., Birch, C. E., Thordarson, T., Turnock, S., Barsotti, S., Delaney, L., Feng, W., Grainger, R. G., Hort, M. C., Höskuldsson, Á., Ialongo, I., Ilyinskaya, E., Jóhannsson, T., Kenny, P., Mather, T. A., Richards, N. A., and Shepherd, J.: Satellite detection, long-range transport, and air quality impacts of volcanic sulfur dioxide from the 2014–2015 flood lava eruption at Bárðarbunga (Iceland), J. Geophys. Res., 120, https://doi.org/10.1002/2015JD023638, 2015. a, b, c, d
Schmincke, H.-U.: Volcanism, vol. 28, Springer Science & Business Media, ISBN: 3-540-43650-2, 2004. a
Seifert, A. and Beheng, K. D.: A two-moment cloud microphysics parameterization for mixed-phase clouds. Part 1: Model description, Meteorol. Atmos. Phys., 92, https://doi.org/10.1007/s00703-005-0112-4, 2006. a
Seifert, A., Bachmann, V., Filipitsch, F., Förstner, J., Grams, C. M., Hoshyaripour, G. A., Quinting, J., Rohde, A., Vogel, H., Wagner, A., and Vogel, B.: Aerosol–cloud–radiation interaction during Saharan dust episodes: the dusty cirrus puzzle, Atmos. Chem. Phys., 23, 6409–6430, https://doi.org/10.5194/acp-23-6409-2023, 2023. a
Seinfeld, J. H. and Pandis, S. N.: From air pollution to climate change, vol. 1326, John Wiley & Sons, ISBN-13: 978-0-471-72017-1 (hardcover); ISBN-13: 978-0-471-72018-8 (paperback), 1998. a
Smith, M. and Harrison, N.: The sea spray generation function, J. Aerosol Sci., 29, S189–S190, 1998. a
Steinke, I., Möhler, O., Kiselev, A., Niemand, M., Saathoff, H., Schnaiter, M., Skrotzki, J., Hoose, C., and Leisner, T.: Ice nucleation properties of fine ash particles from the Eyjafjallajökull eruption in April 2010, Atmos. Chem. Phys., 11, 12945–12958, https://doi.org/10.5194/acp-11-12945-2011, 2011. a, b
Stevens, B., Farrell, D., Hirsch, L., Jansen, F., Nuijens, L., Serikov, I., Brügmann, B., Forde, M., Linne, H., Lonitz, K., and Prospero, J. M.: The Barbados Cloud Observatory: Anchoring investigations of clouds and circulation on the edge of the ITCZ, B. Am. Meteorol. Soc., 97, 787–801, 2016. a, b
Storelvmo, T., Kristjánsson, J. E., Ghan, S. J., Kirkevåg, A., Seland, Ø., and Iversen, T.: Predicting cloud droplet number concentration in Community Atmosphere Model (CAM)-Oslo, J. Geophys. Res.-Atmos., 111, https://doi.org/10.1029/2005JD006300, 2006. a
Tao, W. K., Chen, J. P., Li, Z., Wang, C., and Zhang, C.: Impact of aerosols on convective clouds and precipitation, Rev. Geophys., 50, https://doi.org/10.1029/2011RG000369, 2012. a
Timmreck, C.: Modeling the climatic effects of large explosive volcanic eruptions, WIRes Clim. Change, 3, https://doi.org/10.1002/wcc.192, 2012. a, b
Twomey, S.: Pollution and the planetary albedo, Atmos. Environ. (1967), 8, https://doi.org/10.1016/0004-6981(74)90004-3, 1974. a
Ullrich, R., Hoose, C., Möhler, O., Niemand, M., Wagner, R., Höhler, K., Hiranuma, N., Saathoff, H., and Leisner, T.: A new ice nucleation active site parameterization for desert dust and soot, J. Atmos. Sci., 74, https://doi.org/10.1175/JAS-D-16-0074.1, 2017. a, b, c
von Savigny, C., Timmreck, C., Buehler, S. A., Burrows, J. P., Giorgetta, M., Hegerl, G., Horvath, A., Hoshyaripour, G. A., Hoose, C., Quaas, J., Malinina, E., Rozanov, A., Schmidt, H., Thomason, L., Toohey, M., and Vogel, B.: The research unit volimpact: Revisiting the volcanic impact on atmosphere and climate – preparations for the next big volcanic eruption, Meteorol. Z., 29, https://doi.org/10.1127/metz/2019/0999, 2020. a
Weimer, M., Schröter, J., Eckstein, J., Deetz, K., Neumaier, M., Fischbeck, G., Hu, L., Millet, D. B., Rieger, D., Vogel, H., Vogel, B., Reddmann, T., Kirner, O., Ruhnke, R., and Braesicke, P.: An emission module for ICON-ART 2.0: implementation and simulations of acetone, Geosci. Model Dev., 10, 2471–2494, https://doi.org/10.5194/gmd-10-2471-2017, 2017. a
Werchner, S., Gute, E., Hoose, C., Kottmeier, C., Pauling, A., Vogel, H., and Vogel, B.: When do subpollen particles become relevant for ice nucleation processes in clouds?, J. Geophys. Res.-Atmos., 127, e2021JD036340, https://doi.org/10.1029/2021JD036340, 2022. a
Zängl, G., Reinert, D., Rípodas, P., and Baldauf, M.: The ICON (ICOsahedral Non-hydrostatic) modelling framework of DWD and MPI-M: Description of the non-hydrostatic dynamical core, Q. J. Roy. Meteor. Soc., 141, https://doi.org/10.1002/qj.2378, 2015. a
Zhao, J., Ma, X., Quaas, J., and Jia, H.: Exploring aerosol–cloud interactions in liquid-phase clouds over eastern China and its adjacent ocean using the WRF-Chem–SBM model, Atmos. Chem. Phys., 24, 9101–9118, https://doi.org/10.5194/acp-24-9101-2024, 2024. a