
the Creative Commons Attribution 4.0 License.
the Creative Commons Attribution 4.0 License.
 | 08 Jul 2026
Mesoscale modulation of marine boundary layer water vapor isotopologues during EUREC4A
Sebastian A. Los
Shallow cumulus clouds in trade-wind regions remain an important source of uncertainty in climate projections, with competing interpretations of how mesoscale circulations influence boundary layer moisture. We analyze water vapor isotopologue measurements from the EUREC4A campaign to quantify the mesoscale modulation of marine boundary layer humidity and isotopic composition. Surface δD measurements from R/V Meteor show a strong sensitivity to mesoscale vertical velocity relative to humidity. Regression analyses show that mesoscale ascent partially offsets entrainment-driven isotopic depletion: approximately 0.7 mm s−1 of upward motion is required to counteract the isotopic effect of 1 mm s−1 of entrainment. The strongest correlations between vertical velocity and both δD (r≈0.52) and mixing ratio (r≈0.39) occur within ±200 m of the subcloud layer top. A steady-state flux-form mixed-layer model shows that modest below-cloud rain evaporation can reproduce the observed asymmetric response by adding both vapor mass and isotopic mass with an isotopic composition distinct from the ambient subcloud layer. In the model, an ascent-dependent drizzle source rotates the fitted δD contours relative to humidity, whereas a no-rain control collapses this separation. These results support below-cloud rain evaporation as a physically consistent mechanism through which mesoscale circulations can reorganize moisture pathways without producing commensurate changes in total water vapor.
- Article
(4434 KB) - Full-text XML
- BibTeX
- EndNote


Shallow cumulus clouds in the trade-wind regions are ubiquitous and exert a cooling influence on the climate, but their response to warming remains uncertain (Bony and Dufresne, 2005). These low clouds have long been recognized as a leading source of spread in climate model projections of global warming (Sherwood et al., 2014). Many climate models predict a positive trade cumulus cloud feedback governed by reductions in cloud fraction near cloud base. In particular, higher-sensitivity models tend to produce more efficient entrainment of dry air from aloft, which depletes low-level humidity and erodes cloud cover (Sherwood et al., 2014). This hypothesized mixing–desiccation mechanism posits that vigorous shallow convective mixing dries the lower troposphere and dissipates clouds, thereby amplifying surface warming as a positive low-cloud feedback.
Recent observations, however, challenge this picture. In early 2020, the EUREC4A field campaign (Elucidating the Role of Clouds–Circulation Coupling in Climate) was conducted near Barbados with a network of research aircraft, ships, and ground stations to study trade-wind cumulus and their environment (Bony et al., 2017; Stevens et al., 2021). Analyses of EUREC4A data revealed shallow mesoscale circulations on scales of roughly 100–200 km that organize convection and concentrate moisture in the trades (George et al., 2023). Consistent with this, periods of stronger mesoscale ascent did not lead to a drier subcloud layer (SCL) or reduced cloudiness, contrary to the mixing–desiccation expectation (Vogel et al., 2022). Instead, the observations suggest that mesoscale cloud–circulation coupling can maintain humidity, implying that factors beyond one-dimensional entrainment, such as horizontal convergence and large-scale vertical motion, significantly influence low-level moisture and cloud cover. Nevertheless, disentangling the contributions of these processes, for example separating the effects of shallow convective detrainment from those of large-scale subsidence, remains challenging with conventional measurements alone. Standard thermodynamic observations cannot easily attribute moisture variability to specific physical processes, leaving an important gap in process-level understanding of the trade cumulus regime.
Stable water isotopologues offer a way to fill this gap. The ratios of heavy to light water isotopologues in vapor, such as HO/HO or HDO/H2O, commonly reported as δ18O and δD, are sensitive to the cumulative phase-change history of an air mass (Galewsky et al., 2016). Condensation and rainout preferentially remove heavy isotopes, so air that has undergone extensive convective uplift and precipitation is left isotopically depleted in heavy molecules relative to ocean water. In contrast, vapor added by ocean evaporation is comparatively enriched, and below-cloud evaporation of falling hydrometeors can return isotopically distinct condensate-derived water to the subcloud layer (Tremoy et al., 2014; Graf et al., 2019). Thus, water vapor isotopic measurements can serve as tracers of moisture origin and transport. They enable us to distinguish among surface evaporation, entrainment, and rain-evaporation contributions that may have similar effects on total humidity but different effects on isotopic composition. Past studies have demonstrated that isotopic variations can be used to identify moisture sources and quantify mixing between atmospheric layers, processes that are largely indistinguishable in bulk humidity alone (Risi et al., 2020; Galewsky et al., 2016).
EUREC4A included a coordinated initiative (EUREC4A-iso) to deploy an extensive network of water vapor isotope analyzers across multiple platforms (Bailey et al., 2023). Seven laser-based instruments, sampling at up to 0.5 Hz, were operated on two research aircraft, three ships, and at the Barbados Cloud Observatory during the campaign. This data set provides the high-resolution, multi-platform coverage needed to close regional moisture budgets and evaluate model simulations of moist processes. Here, we use the EUREC4A water vapor isotopic measurements from the R/V Meteor to bridge the gap between documented mesoscale circulation effects and their impacts on the marine boundary layer moisture budget. Specifically, we use the stable isotope signatures to test how entrainment, mesoscale ascent, and below-cloud rain evaporation jointly shape lower-tropospheric moisture in the trade-wind regime.
EUREC4A comprised about 5 weeks of measurements in the downstream winter trades of the North Atlantic, eastward and southeastward of Barbados. The campaign deployed an extensive observational network to characterize processes operating across scales from micrometers to hundreds of kilometers. The measurements included 2500 atmospheric soundings to quantify mesoscale and larger-scale atmospheric properties, approximately 400 flight hours by four research aircraft, operations from four research vessels, and continuous observations from a ground-based cloud observatory. Additional platforms included autonomous systems that collected nearly 10 000 upper-ocean profiles, continuous atmospheric boundary layer measurements, air-sea interface observations, water vapor isotopologue measurements across multiple platforms, coordinated satellite observations, and support from high-resolution numerical weather and climate models.
2.1 Upper Air Data
The dropsonde measurements were conducted using two research aircraft: the High Altitude and Long Range Research Aircraft (HALO) (Konow et al., 2021) and the NOAA WP-3D Orion (P-3) (Pincus et al., 2021). The primary scientific motivation for these measurements was to characterize the area-averaged kinematic environment of trade-wind cumulus cloud fields and to quantify area-averaged vertical motion in the marine boundary layer. The cornerstone of the measurement strategy was the EUREC4A-circle (Fig. 1), a standardized circular flight pattern designed to enable accurate estimates of properties including divergence, vorticity, and vertical velocity. This approach, adapted from Lenschow et al. (1999, 2007) and Bony and Stevens (2019), exploits the assumption that atmospheric variations at the mesoscale can be approximated as linear in horizontal space over the scale of a single aircraft circle.
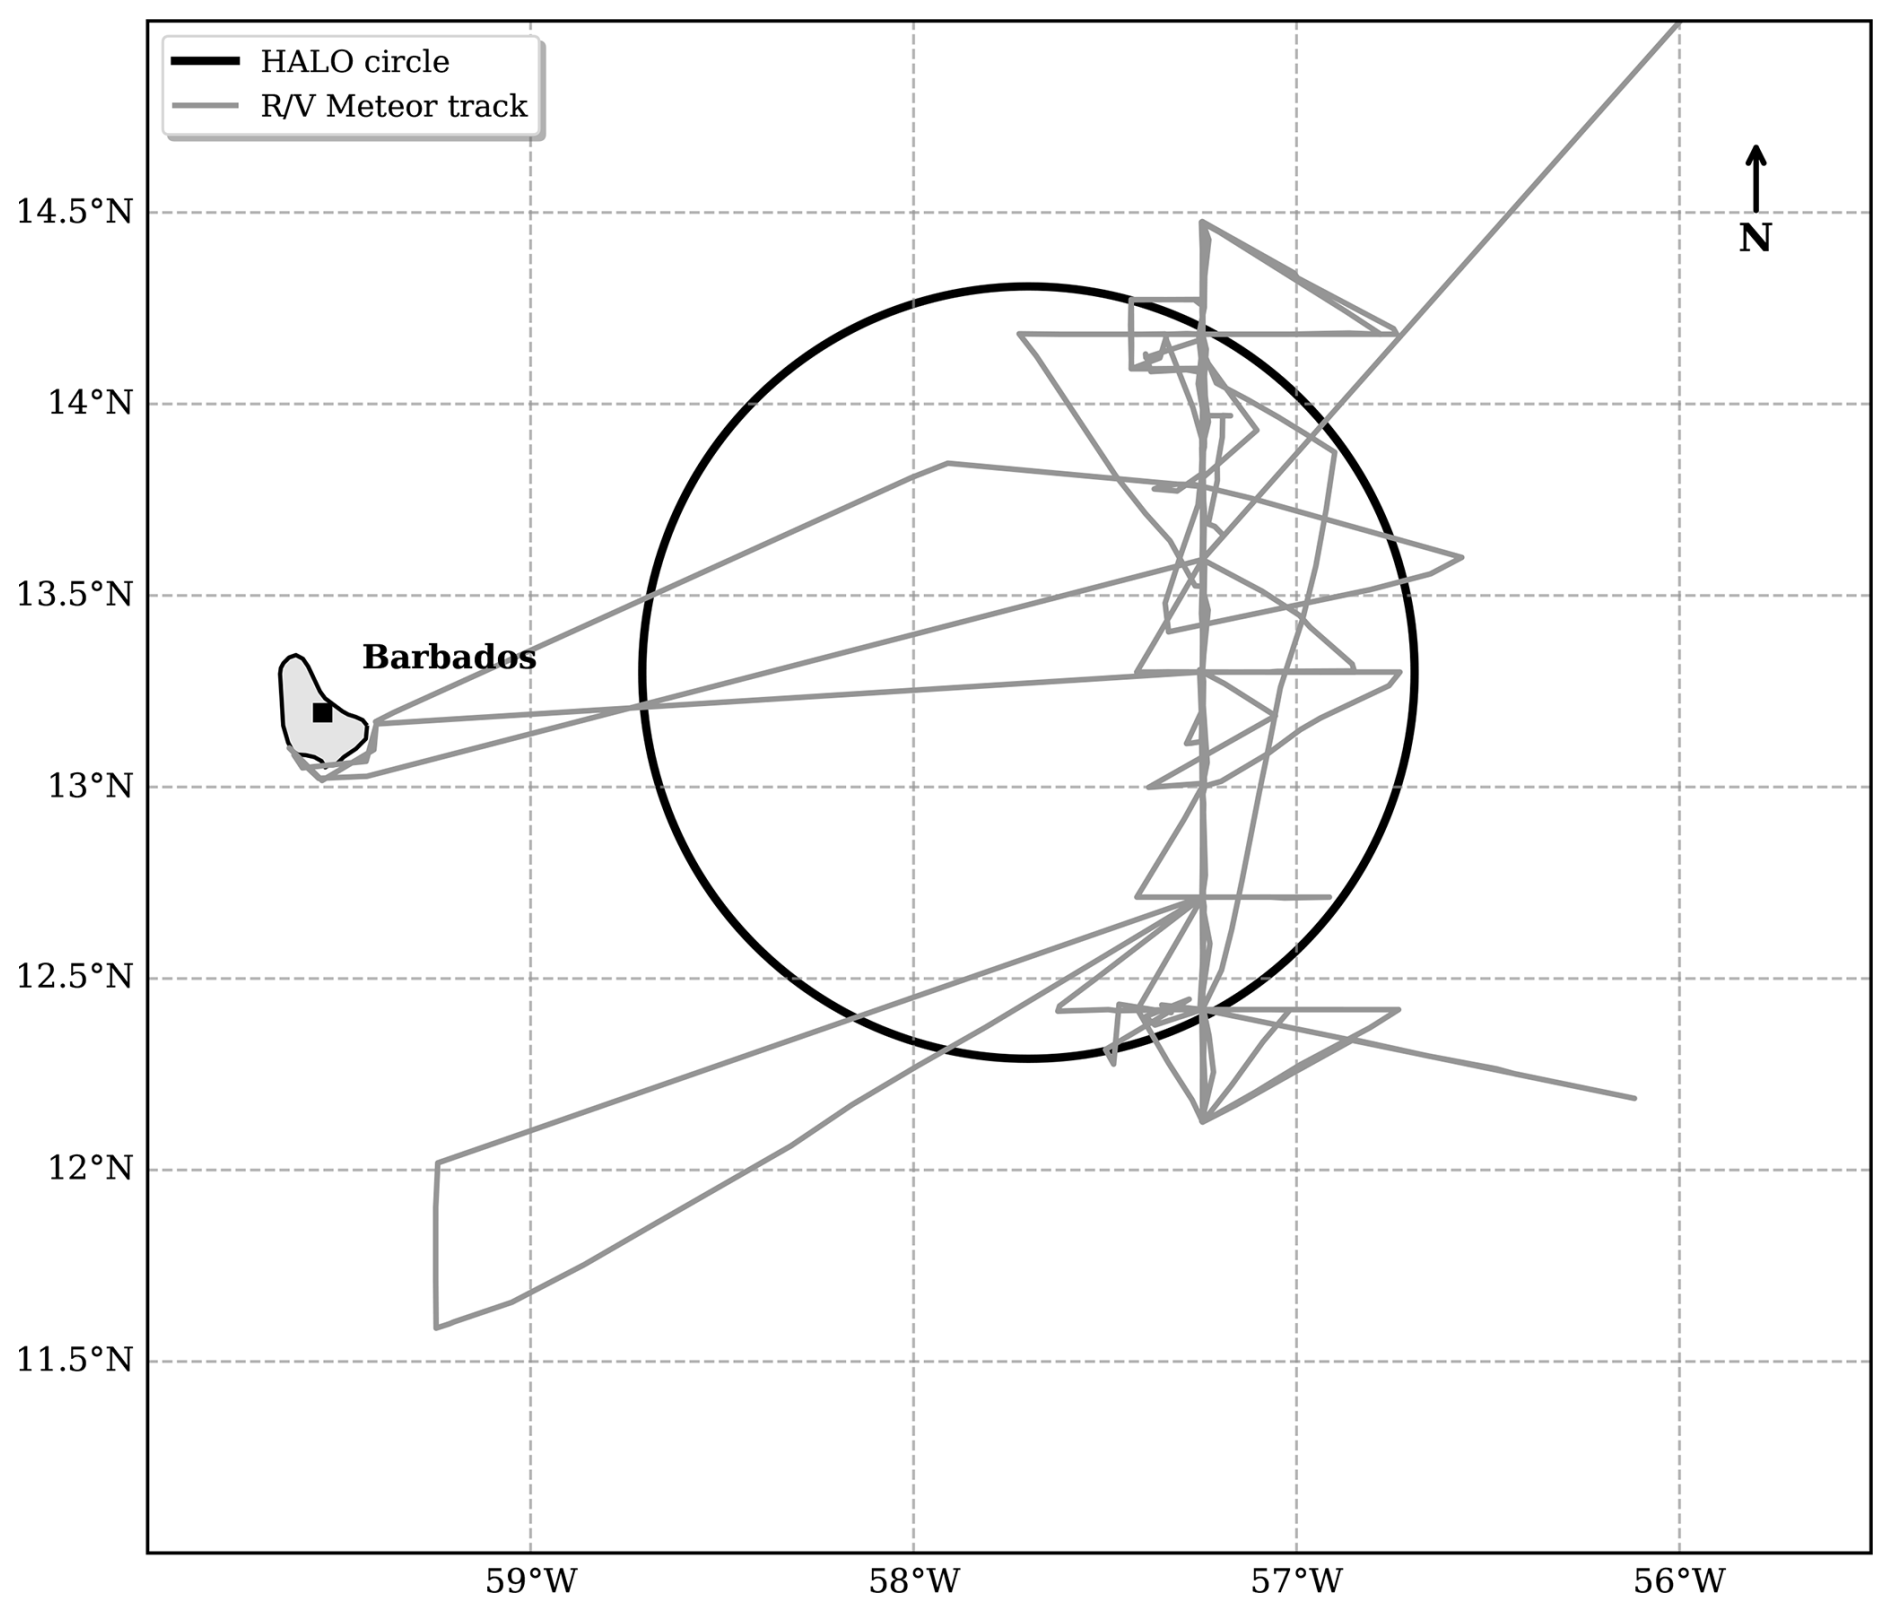
Figure 1Map of the EUREC4A study area showing a representative EUREC4A circle pattern and the R/V Meteor ship track. The circle (black) represents one of the 222 km diameter flight patterns used for dropsonde deployment to measure mesoscale circulation. The ship track (gray) shows the path of R/V Meteor during the January–February 2020 field campaign.
The EUREC4A-circle was centered at 13.30° N, 57.72° W with a diameter of approximately 222 km. Each circle flight pattern deployed 12 dropsondes at regular intervals around the circumference, with launches separated by approximately 5 min corresponding to the aircraft's 60 min circuit time. This systematic sampling enables estimation of horizontal gradients through regression analysis, from which mesoscale circulation properties can be derived.
A total of 85 EUREC4A-circles were flown during the campaign (71 by HALO and 14 by the P-3), providing unbiased sampling across meteorological conditions. All flights operated from Bridgetown, Barbados, with HALO operating at altitudes between 10.0–10.5 km, while the P-3 typically flew at lower altitudes near 7.5 km as part of the ATOMIC component of the campaign (Pincus et al., 2021). A total of 1215 Vaisala RD-41 dropsondes were launched (895 from HALO and 320 from the P-3), each containing pressure, temperature, and humidity sensors sampling at 2 Hz, along with GPS receivers providing wind measurements at 4 Hz. The measurements are archived in the JOANNE dataset (George et al., 2021), from which we use the Level 4 circle-averaged products containing mesoscale diagnostics derived through regression analysis of the 12-sonde circle patterns. These products include horizontal gradients of atmospheric variables and derived quantities such as divergence, vorticity, horizontal divergence of wind velocity, and vertical velocity, with associated uncertainty estimates from the regression fitting.
The subcloud layer height h used here was first presented in Vogel et al. (2022) and is determined using a temperature-based threshold method (Albright et al., 2022). Specifically, h is defined as the height where the virtual potential temperature θv first exceeds its density-weighted mean value (computed from 100 m up to h) by a fixed threshold ϵ=0.2 K (Vogel et al., 2022). This approach follows established methodology for identifying the top of the well-mixed subcloud layer (Touzé-Peiffer et al., 2022). The method accounts for the finite thickness of the transition layer separating the mixed layer from the cloud layer above (Albright et al., 2022). This transition layer, approximately 150 m thick, complicates the application of classical mixed-layer theory which assumes an infinitesimally thin inversion.
The entrainment rate E is computed using a modified flux-jump model (Albright et al., 2022; Vogel et al., 2022) that extends the classical approach of Lilly (1968) and Stull (1976). Within that diagnostic framework, E quantifies the exchange implied by small-scale mixing at the subcloud layer top and contributes to the tendency for h to deepen. This approach differs from the zero-order jump models that assume instantaneous transitions (Lilly, 1968) by accounting for the finite depth of the entrainment zone, providing a more realistic representation of the actual atmospheric structure observed during EUREC4A. Note that throughout this study, E refers only to entrainment from the cloudy layer (CL) into the subcloud layer (SCL). It does not include exchange between the CL and the free troposphere (FT). When E is used as an observational predictor or as a forcing coordinate in the synthetic mixed-layer model, it should be interpreted as a diagnosed cloud–subcloud exchange velocity rather than as a standalone prognostic equation for h. Negative diagnosed values indicate periods of interface descent or weak detrainment, not physically negative turbulent entrainment. None of the n=56 complete matched cases used in the regressions below has negative E; the minimum matched value is 6.9 mm s−1. Across the matched circles, the average entrainment rate is , and the average subcloud layer height is .
2.2 Isotopic and Surface Data
Water vapor isotope measurements aboard the R/V Meteor were obtained using a Picarro L2130-i cavity ring-down spectrometer (CRDS) operating at 1 Hz resolution from 18 January to 22 February 2020. The analyzer was housed in the Air-Chemistry Laboratory at ∼ 20.3 m above sea level, sampling ambient air through a 5 m long, 4.6 mm ID PTFE inlet line heated to 45 °C and insulated with polyethylene foam. The inlet was housed in a downward-facing funnel to minimize contamination from rainwater and sea spray, and included a 0.2 µm PTFE aerosol filter. Flow was controlled by the CRDS system at approximately 0.03 slpm, resulting in a time delay of >2 min from intake to analyzer. Daily calibration checks were performed using four liquid water standards spanning δ18O values from −20.97 ‰ to −2.79 ‰ and δD values from −158.13 ‰ to −13.12 ‰, delivered in gas phase using a Picarro Standards Delivery Module. Prior to normalization, isotopic observations were corrected for small humidity-dependent biases of up to 0.24 ‰ in δ18O and 0.36 ‰ in δD. Total uncertainties were estimated at 0.29 ‰ for δ18O and 1.24 ‰ for δD by summing in quadrature the uncertainties associated with liquid standards, humidity-dependence correction, calibration measurement precision, and temporal drift over the campaign. Further details on the isotopic data collection program can be found in Bailey et al. (2023).
For the circle-based analysis, the shipboard Picarro observations were matched to the JOANNE Level 4 circle products by averaging quality-controlled δD and H2O measurements within a 2 h window centered on each circle time and within the fitted circle footprint. Of the 85 JOANNE Level 4 circles, 57 had matched ship-based isotope and humidity observations; requiring valid matched entrainment (E) and vertical velocity (W) estimates removes one additional circle, yielding the n=56 complete cases used in the regressions below.
Near-surface relative humidity data were obtained from temperature and dew point measurements made at 29 m above the sea surface on the Meteor's mast. SST was measured at 2.3 m depth with matching port and starboard sensors.
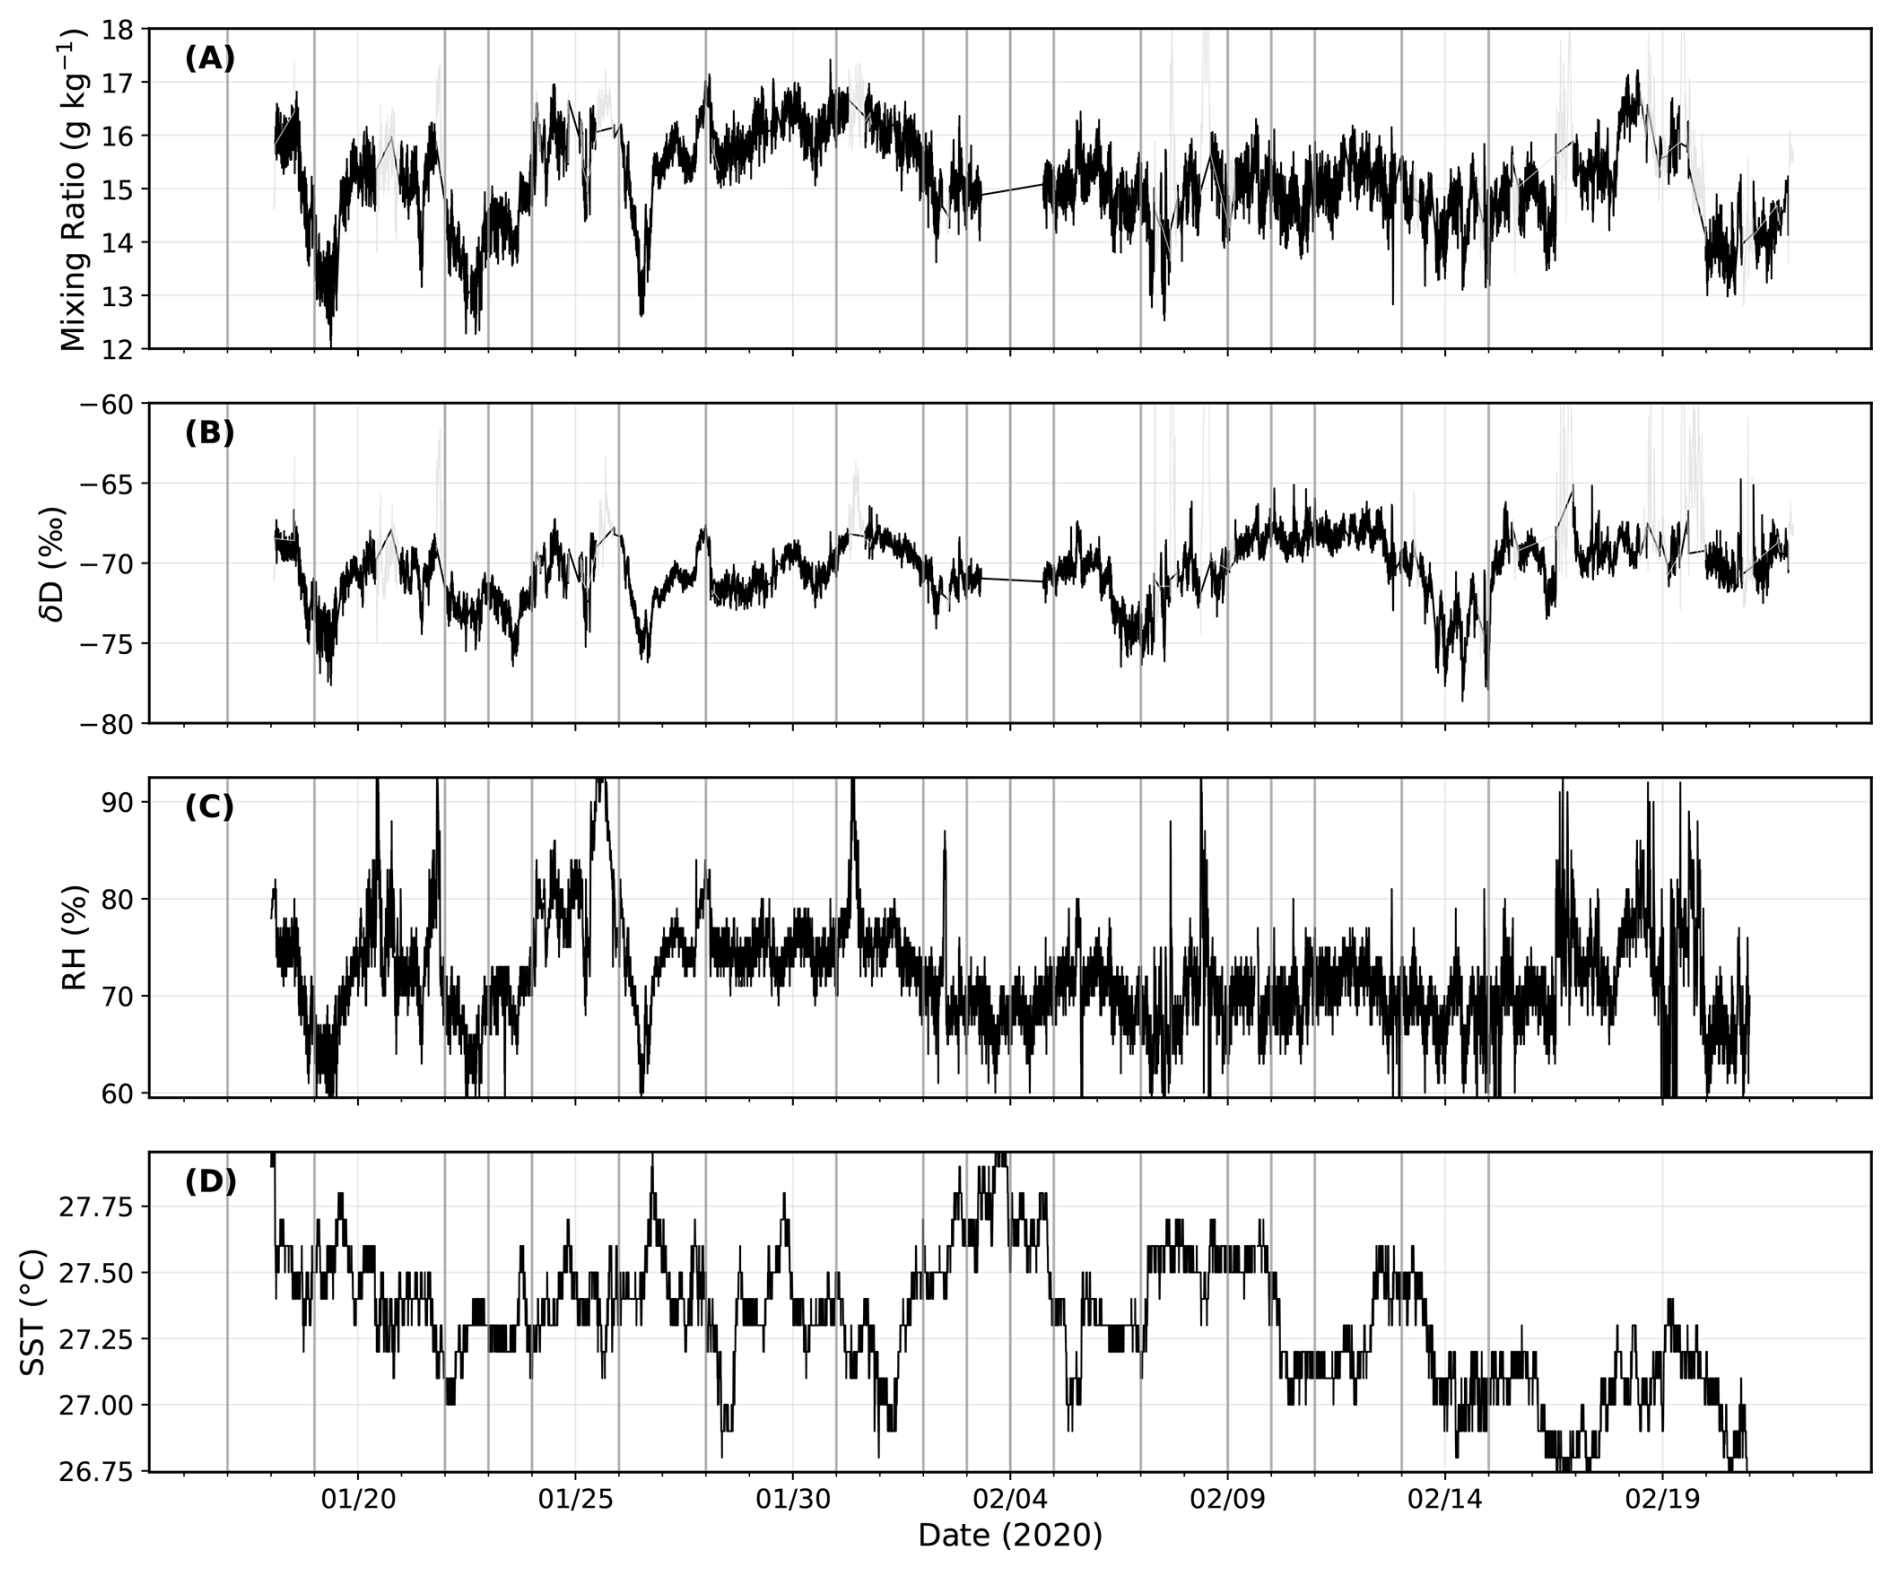
Figure 2Time series of surface measurements from R/V Meteor during EUREC4A, 18 January–22 February 2020. (A) Water vapor mixing ratio from Picarro L2130-i cavity ring-down spectrometer at 1 min resolution. (B) Deuterium isotope ratio (δD) from the same instrument. (C) Relative humidity from shipboard meteorological sensors. (D) Sea surface temperature. Black lines indicate quality-controlled data; pale gray points show measurements flagged during quality control. Gray vertical lines mark days with HALO/P3 aircraft circle flights from the JOANNE dropsonde dataset.
Figure 2 presents the full time series of surface water vapor measurements, relative humidity (RH), and sea surface temperature (SST) measured from the R/V Meteor during EUREC4A. The dataset exhibits relatively low variability across all measured parameters, reflecting the stable trade wind conditions that characterized the campaign period. Water vapor mixing ratios varied with a standard deviation of 0.832 g kg−1 around a mean of 15.1 g kg−1, while δD showed a standard deviation of 1.94 ‰ around a mean of −70.6 ‰. Surface meteorological variability was also limited, with relative humidity varying by 4.6 % around a mean of 71.6 % and sea surface temperatures showing little variation (standard deviation 0.23 °C) around 27.3 °C. The measurement uncertainty for 2 h averaged isotope data (1.24 ‰ for δD) represents approximately 65 % of the observed natural variability, limiting our ability to detect weak atmospheric signals. Consequently, our analysis focuses on the strongest and most robust correlations that exceed this measurement noise threshold.
Figure 3 shows (a) entrainment rate E (light blue) and vertical velocity W from roughly 100–125 m below the top of the SCL (dark blue), both in mm s−1; (b) surface δD in ‰; and (c) water vapor mixing ratio in g kg−1. Each point represents a 2 h average centered on a HALO/P3 circle time. The time series shows coherent variability across all of these parameters. Periods of enhanced entrainment (positive E values) consistently coincide with more negative δD and lower mixing ratio, as seen most clearly around 26 January. Conversely, periods of weak entrainment or stronger mesoscale ascent (negative E, positive W) correspond to less negative δD and higher mixing ratios, evident around 24 January and 1 February. Entrainment brings dry, isotopically depleted air from above the SCL into the surface layer, reducing humidity and driving δD toward more negative values (and overwhelming any potential increase in surface evaporation due to associated winds). Periods of reduced entrainment or mesoscale upward motion allow the boundary layer to maintain higher humidity and preserve the enriched isotopic signatures characteristic of ocean evaporation.
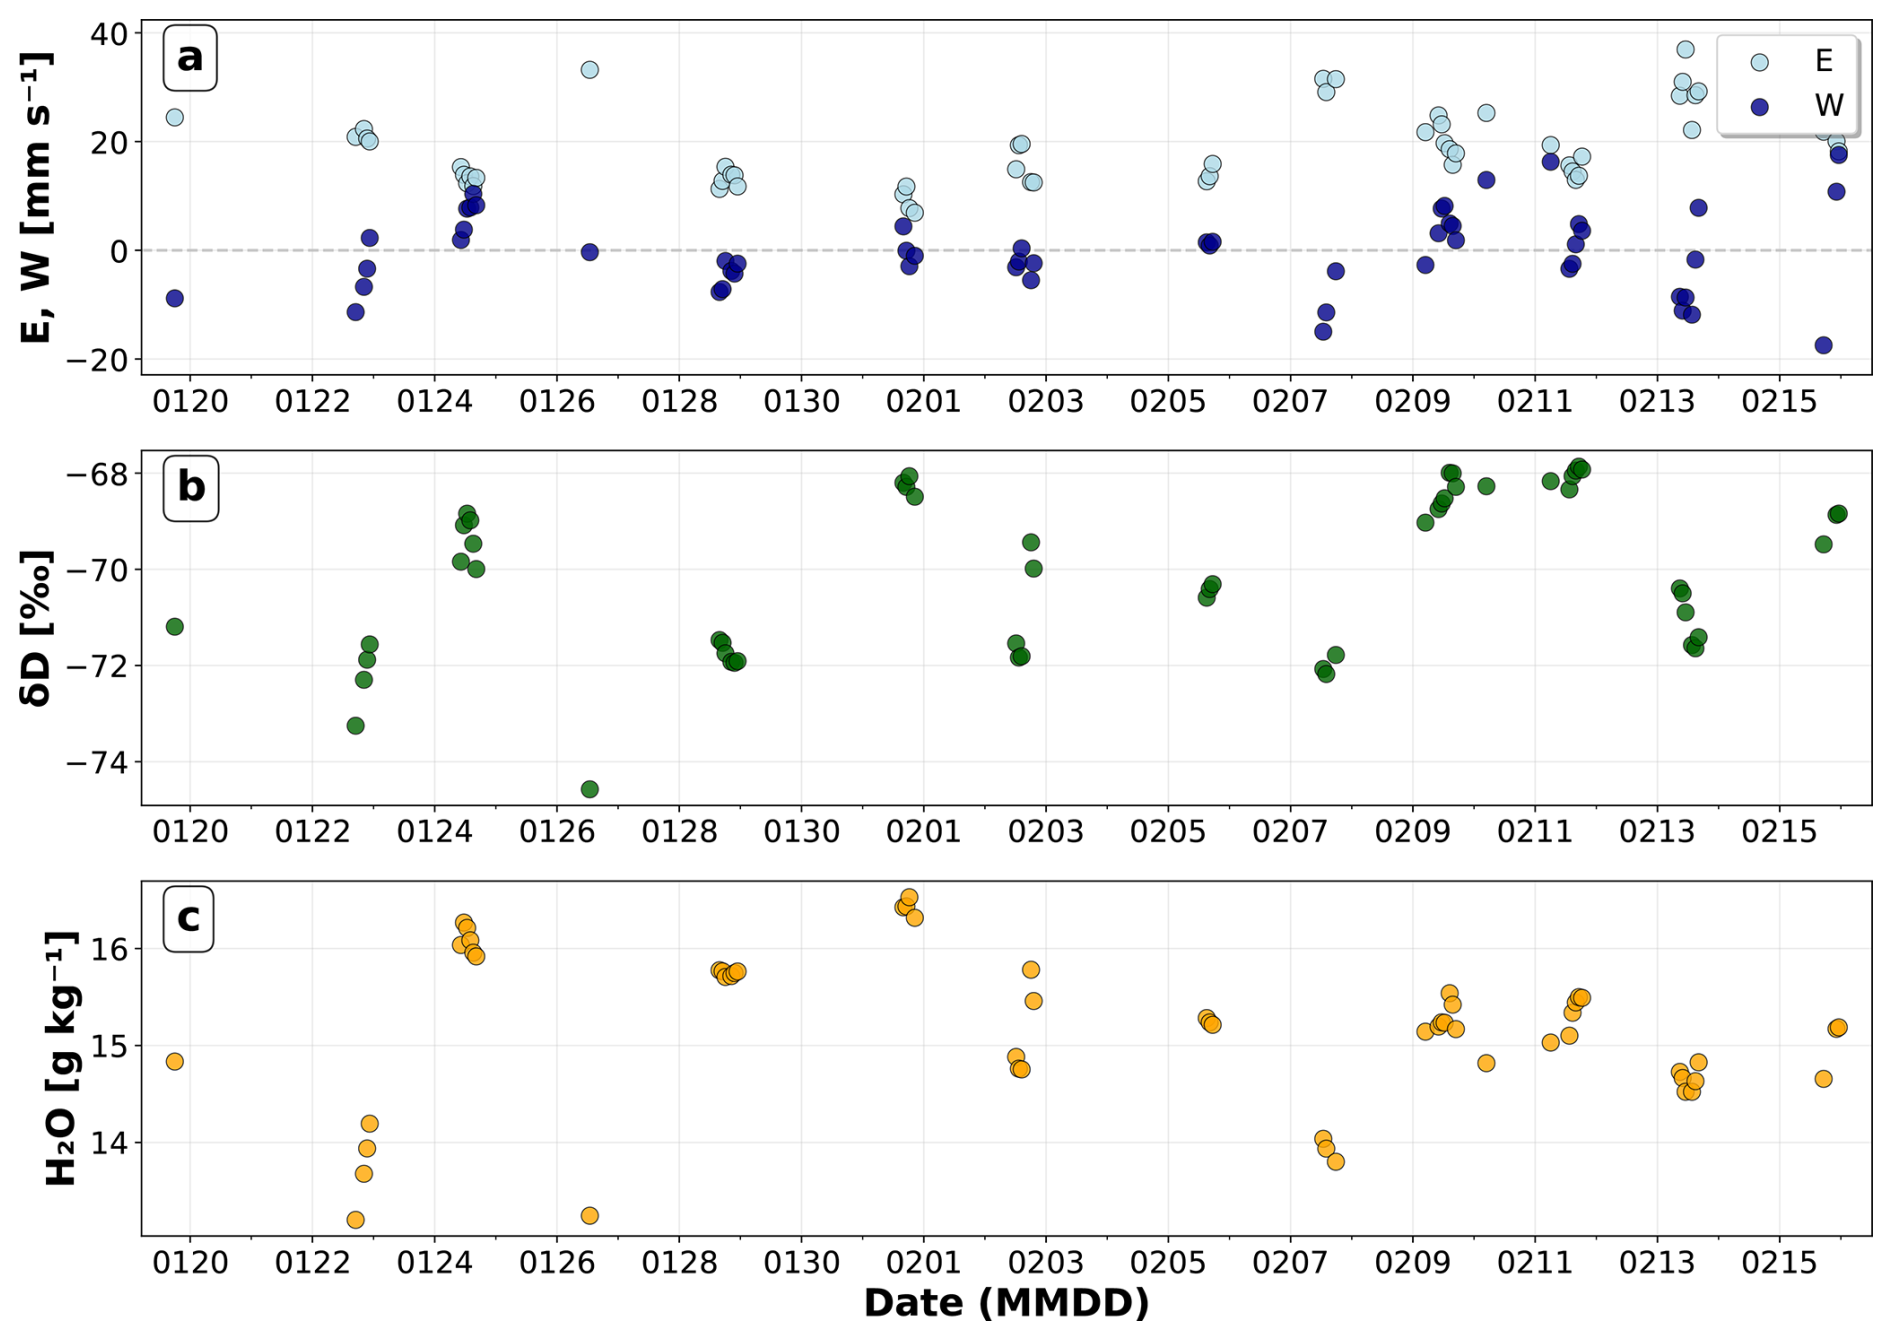
Figure 3Time series of atmospheric variables during the EUREC4A campaign. (a) Entrainment rate E (light blue) and mesoscale vertical velocity W from roughly 100–125 m below the top of the SCL (dark blue) in mm s−1, showing the competing effects of cloud-subcloud entrainment and mesoscale vertical motion. The dashed gray line indicates zero. (b) Surface boundary layer δD in ‰, measured by the ship-based Picarro analyzer with an inlet at ∼ 20.3 m above sea level. (c) Water vapor mixing ratio H2O in g kg−1 from matched HALO/P3-Picarro observations at the same inlet height. All data points represent 2 h averaged values spatially matched within HALO/P3 flight circles. The time axis shows dates in MMDD format during January–February 2020. Data demonstrate the temporal evolution of entrainment-convection competition and its effects on boundary layer moisture and isotope signatures.
Figure 4 shows the vertical correlation structure between dropsonde-derived vertical velocity and surface isotopic composition (δD) and mixing ratio as a function of altitude relative to the top of the subcloud layer. Both δD (solid line) and mixing ratio (dashed line) exhibit their strongest correlations just below this boundary. The isotopic signal shows peak correlation (r≈0.52) about 100–125 m below the top of the SCL, while humidity correlations reach maximum strength (r≈0.39) about 100 m lower within the SCL.
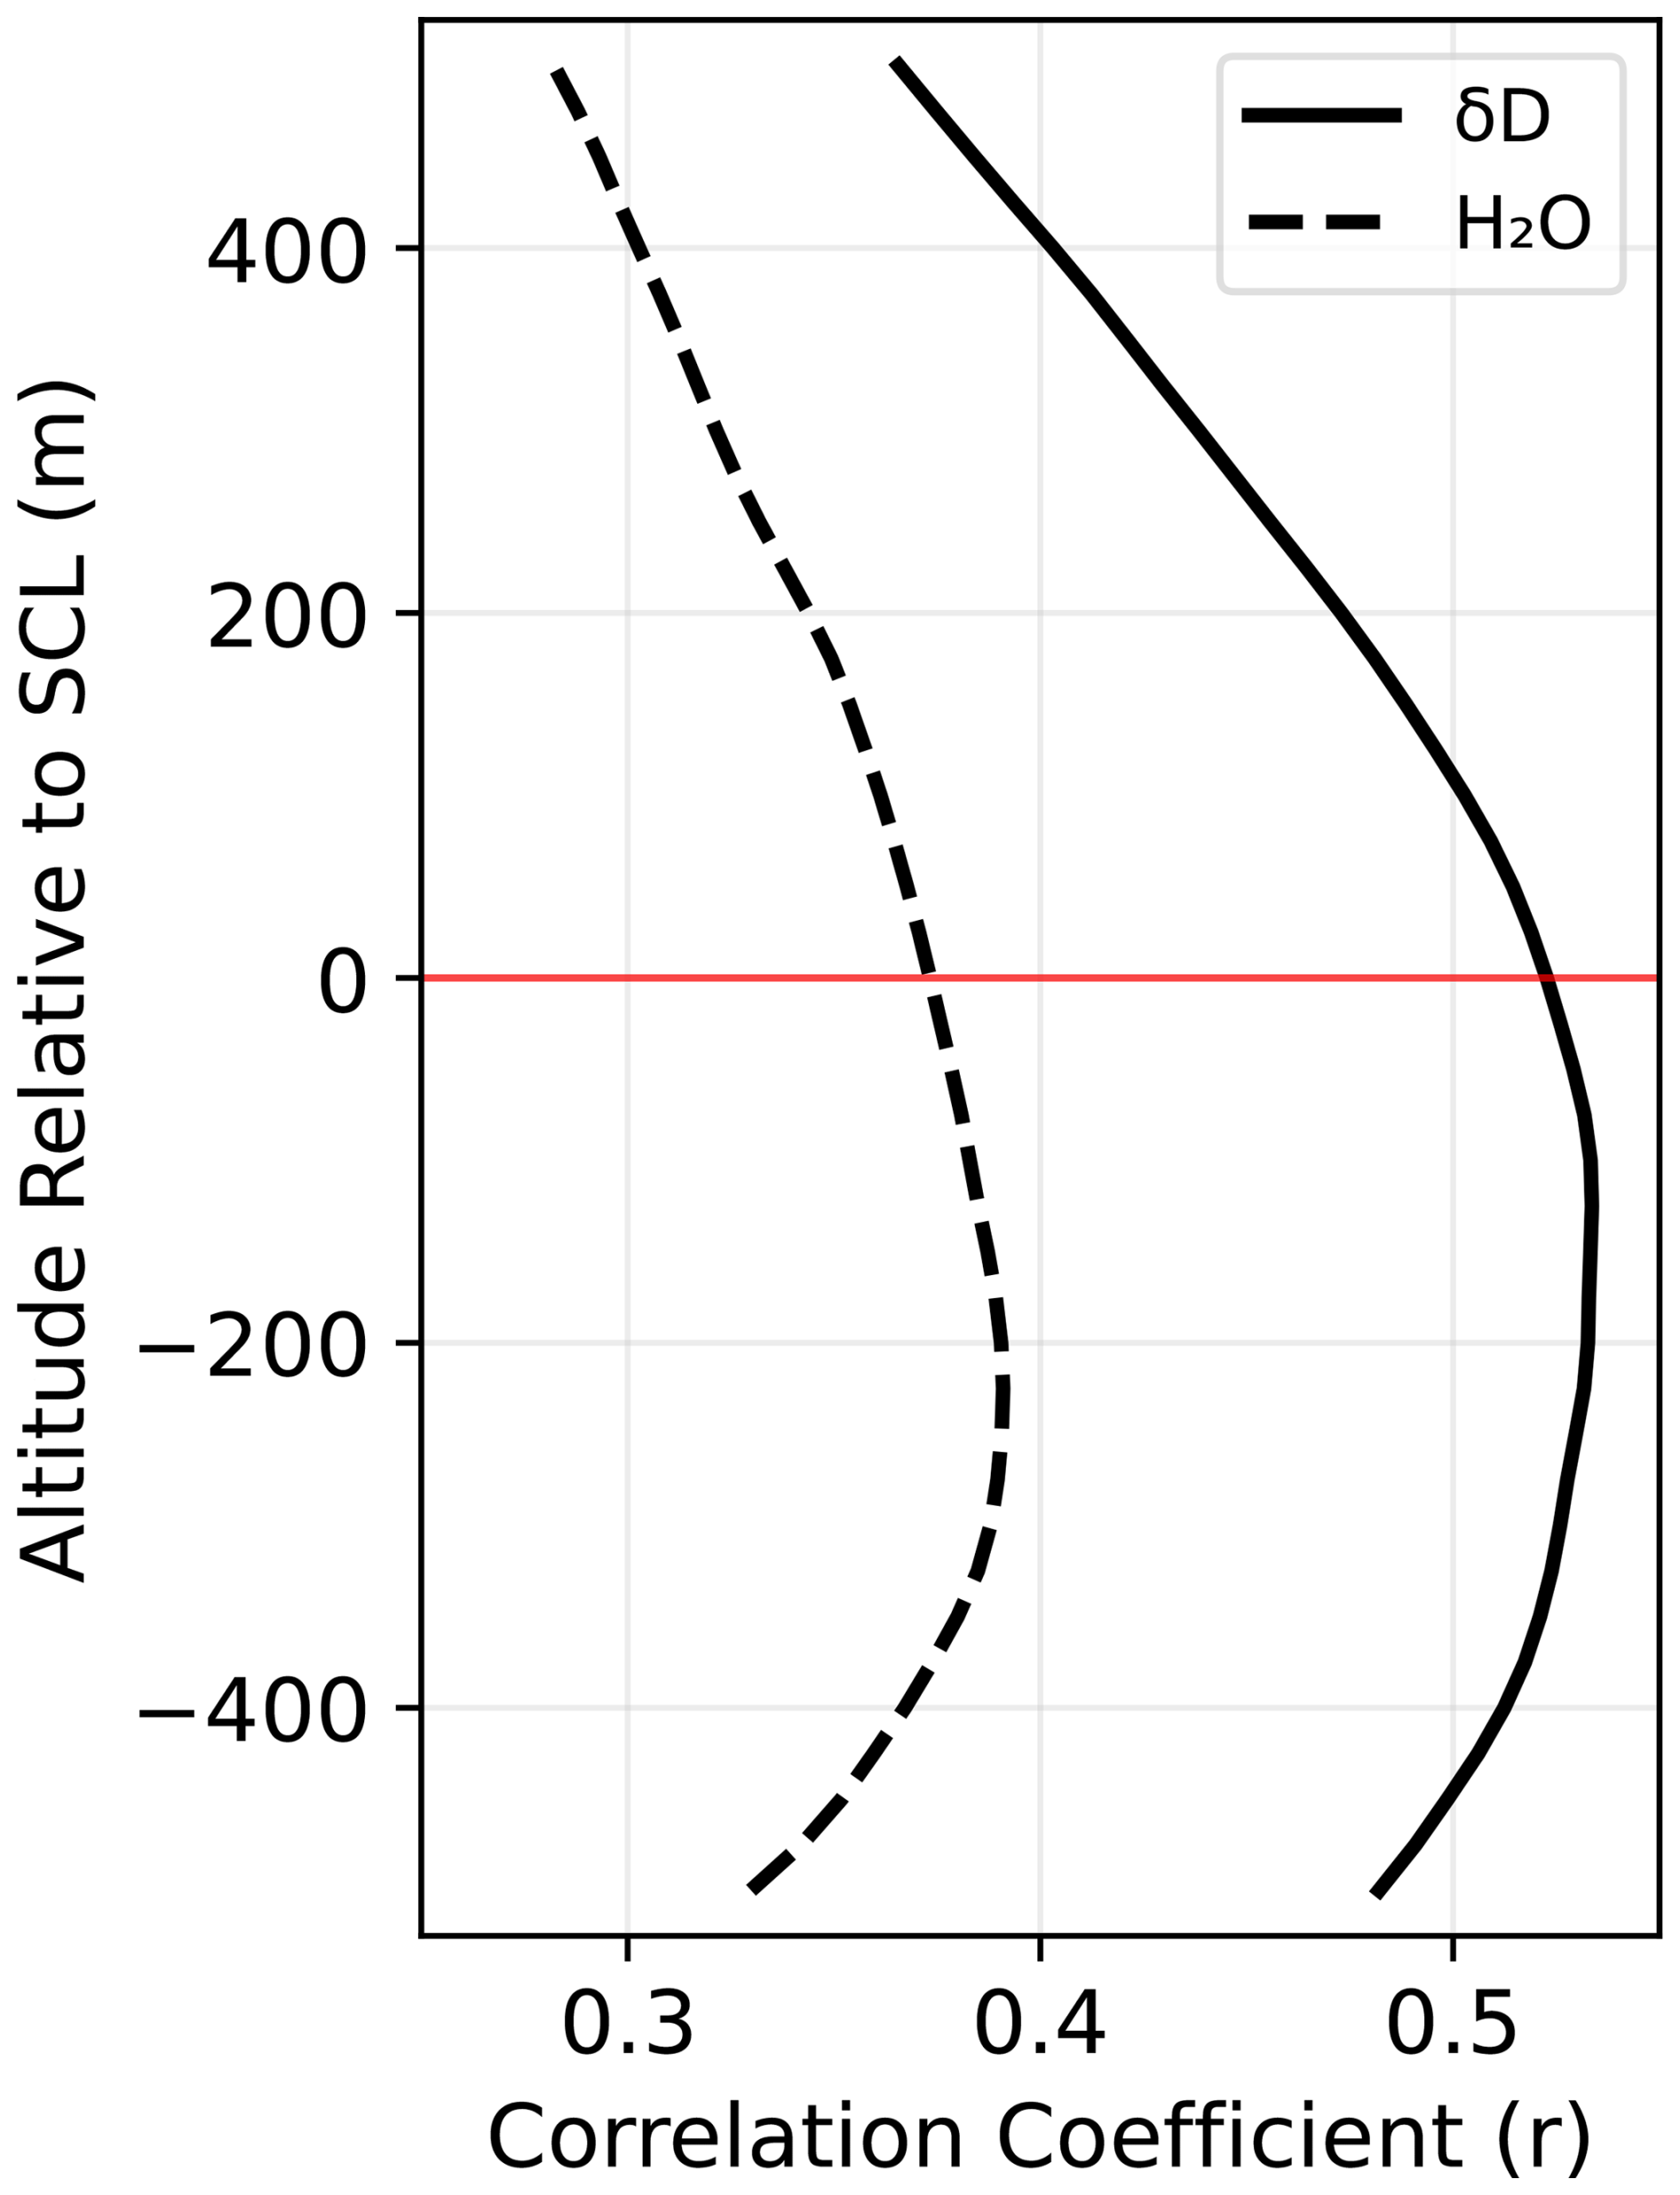
Figure 4Vertical velocity correlation profiles with isotopic composition and humidity near subcloud layer height. Correlation coefficients between vertical velocity (W) and water vapor δD (solid black line) and water vapor mixing ratio (dashed black line) are shown as functions of altitude relative to the top of the subcloud layer (SCL, red horizontal line at 0 m). The analysis spans ± 500 m around the top of the SCL, which is defined as the height where virtual potential temperature first exceeds its density-weighted mean from 100 m by 0.2 K. Both variables show peak correlations within the subcloud layer, with δD exhibiting stronger coupling to vertical motion than humidity.
This structure is further illustrated in Figure 5, which shows the relationship between vertical velocity W (x-axis) and entrainment rate E (y-axis), with points colored by surface δD and sized according to water vapor mixing ratio. The scatter plot reveals a systematic organization of boundary layer states across the E–W parameter space. Points in the upper-left quadrant (negative W, high E) correspond to conditions of strong entrainment combined with mesoscale downdrafts and are characterized by more negative δD values and lower mixing ratios. Points toward the lower right (positive W, low E) indicate periods of weaker entrainment and mesoscale ascent, which are associated with less negative δD values and modestly higher humidity.
A linear regression across all matched circles (n=56) yields
with a statistically significant negative slope (p=0.044, 95 % confidence interval ), indicating that entrainment and vertical velocity are weakly but systematically anticorrelated. Although this relationship exhibits substantial scatter, it demonstrates that E and W are not independent but instead span a continuum of boundary layer mixing states.
Consistent with this organization, the δD color gradient transitions from more depleted values under high-E, negative-W conditions toward more enriched values under low-E, positive-W conditions. Marker sizes increase along this same trajectory, indicating that periods of reduced entrainment and mesoscale ascent coincide with isotopic enrichment and enhanced humidity.
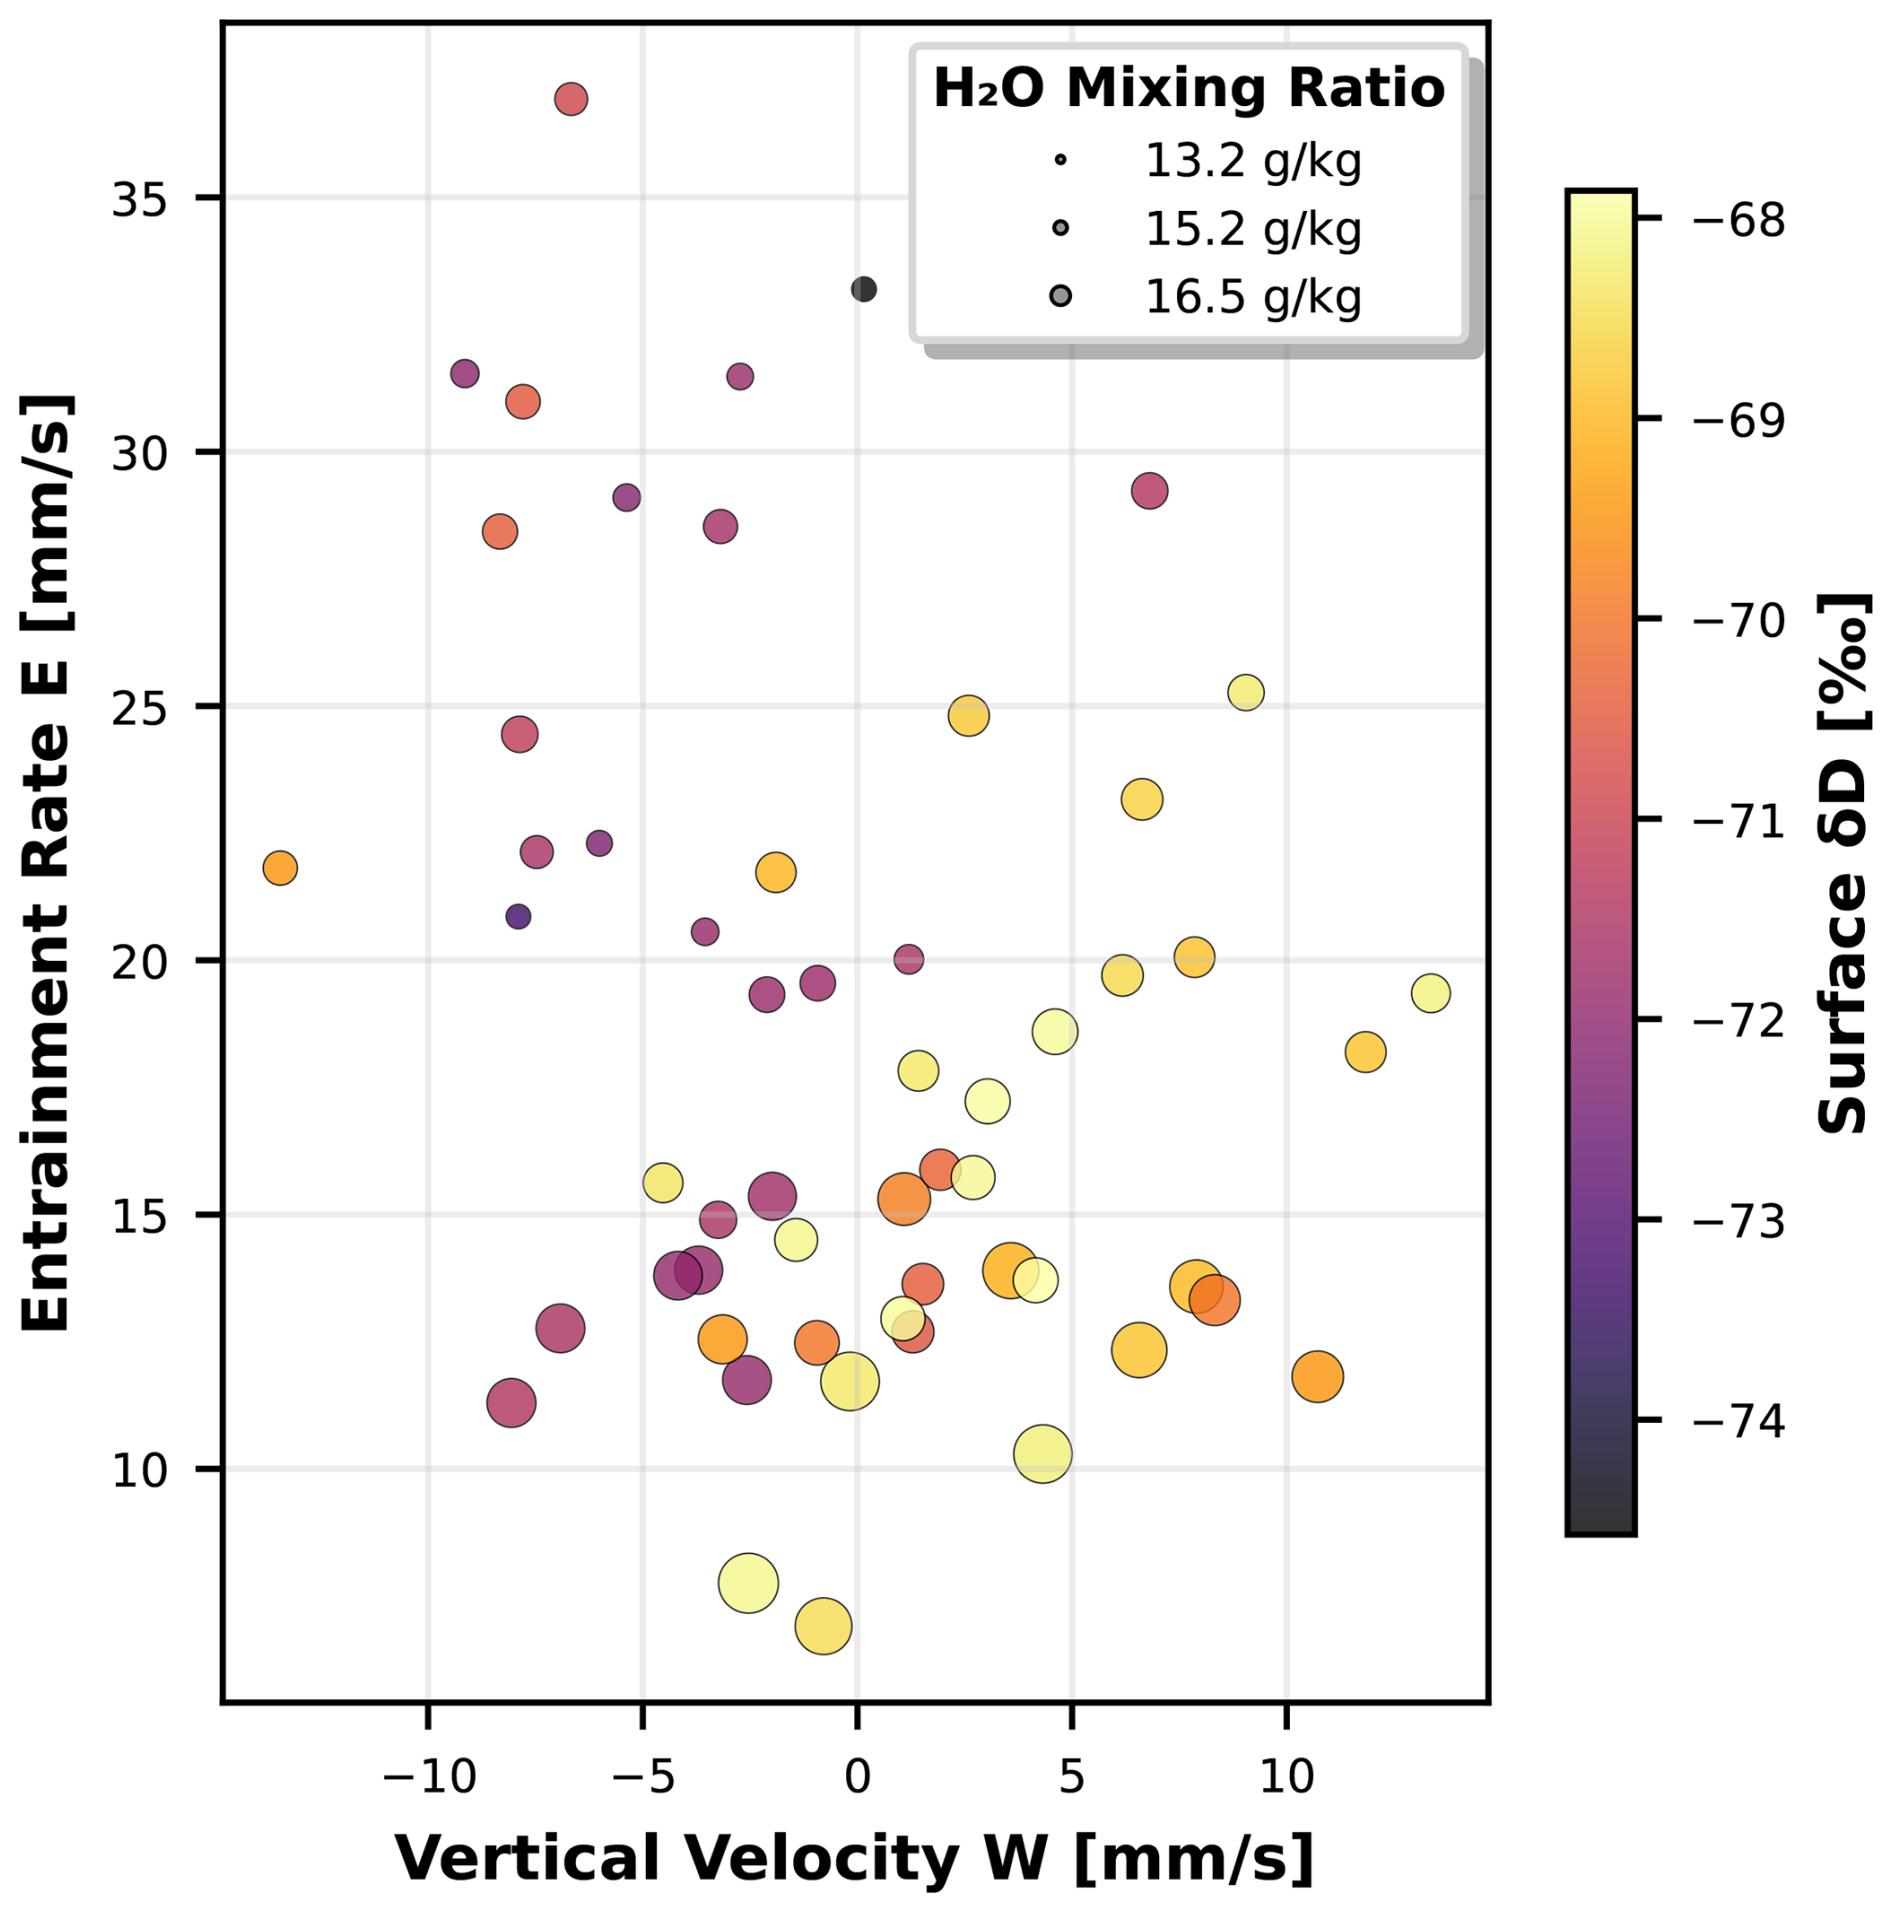
Figure 5Relationships between vertical velocity (W), entrainment rate (E), water vapor mixing ratio, and water vapor δD during EUREC4A. Scatter plot shows W extracted at the empirically selected absolute altitude of maximum δD–W correlation from Fig. 4 (567.7 m above the sea surface) versus entrainment rate E, with circle size proportional to water vapor mixing ratio (H2O) and color representing surface δD. Data points represent individual dropsonde circles matched with ship-based isotope measurements.
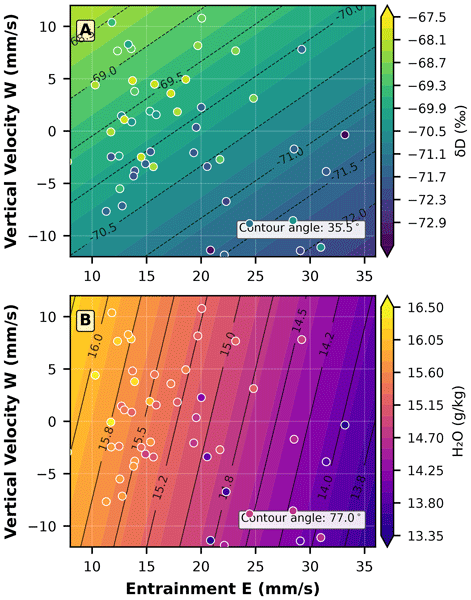
A more quantitative understanding of these relations is illustrated in Figs. 6 and 7. Figure 6 shows the joint dependence of isotopic composition and humidity on both entrainment and vertical velocity. Panel (A) shows δD values across the E–W parameter space, with contour lines representing predictions from a joint linear regression model that includes both E and W as predictors. The isotopic field exhibits a systematic gradient from depleted values (δD ) at high entrainment rates and negative vertical velocities to enriched values (δD ) at low entrainment and positive vertical velocities. Panel (B) shows the corresponding humidity field, where water vapor mixing ratios decrease from approximately 16.5 g kg−1 at low E and high W to 13.5 g kg−1 at high E and low W. To quantify these relationships, we performed a joint multilinear regression for both variables. The regression for δD yields (R2=0.357), where both predictors are statistically significant at the 5 % level (p≈0.013 for E and p≈0.00027 for W), with a residual mean absolute error (MAE) of 1.15 ‰ and an RMSE of 1.33 ‰. For specific humidity, the regression yields (R2=0.633), with coefficients that are also significant ( for E and p≈0.040 for W) and a residual MAE of 0.365 g kg−1 and RMSE of 0.472 g kg−1. These results quantify the “diagonal” structure seen in the parameter space, demonstrating that both predictors are statistically significant, with a moderate fit for δD and a stronger fit for H2O. The orientation of the contours in both panels further confirms that δD is more sensitive to W than the total mixing ratio, which is more sensitive to entrainment. For clarity, throughout this paper we define contour angle as the angle of the fitted contour line measured counterclockwise from the +E axis. Under this convention, the observational fitted contour angles are 35.5° for δD and 77.0° for humidity, giving an observational contour separation of 41.5°.
In interpreting these results, we note that E and W are not independent predictors; in our dataset, they exhibit a modest negative correlation (). However, the joint multilinear regression framework used here specifically accounts for this covariance. The reported MLR coefficients represent partial slopes, quantifying the independent impact of each variable while holding the other constant. Consequently, the distinct point-estimate sensitivities observed for δD and humidity are not simply artifacts of the correlation between entrainment and vertical motion, although the magnitude of the resulting counteraction-efficiency contrast remains uncertainty-limited.
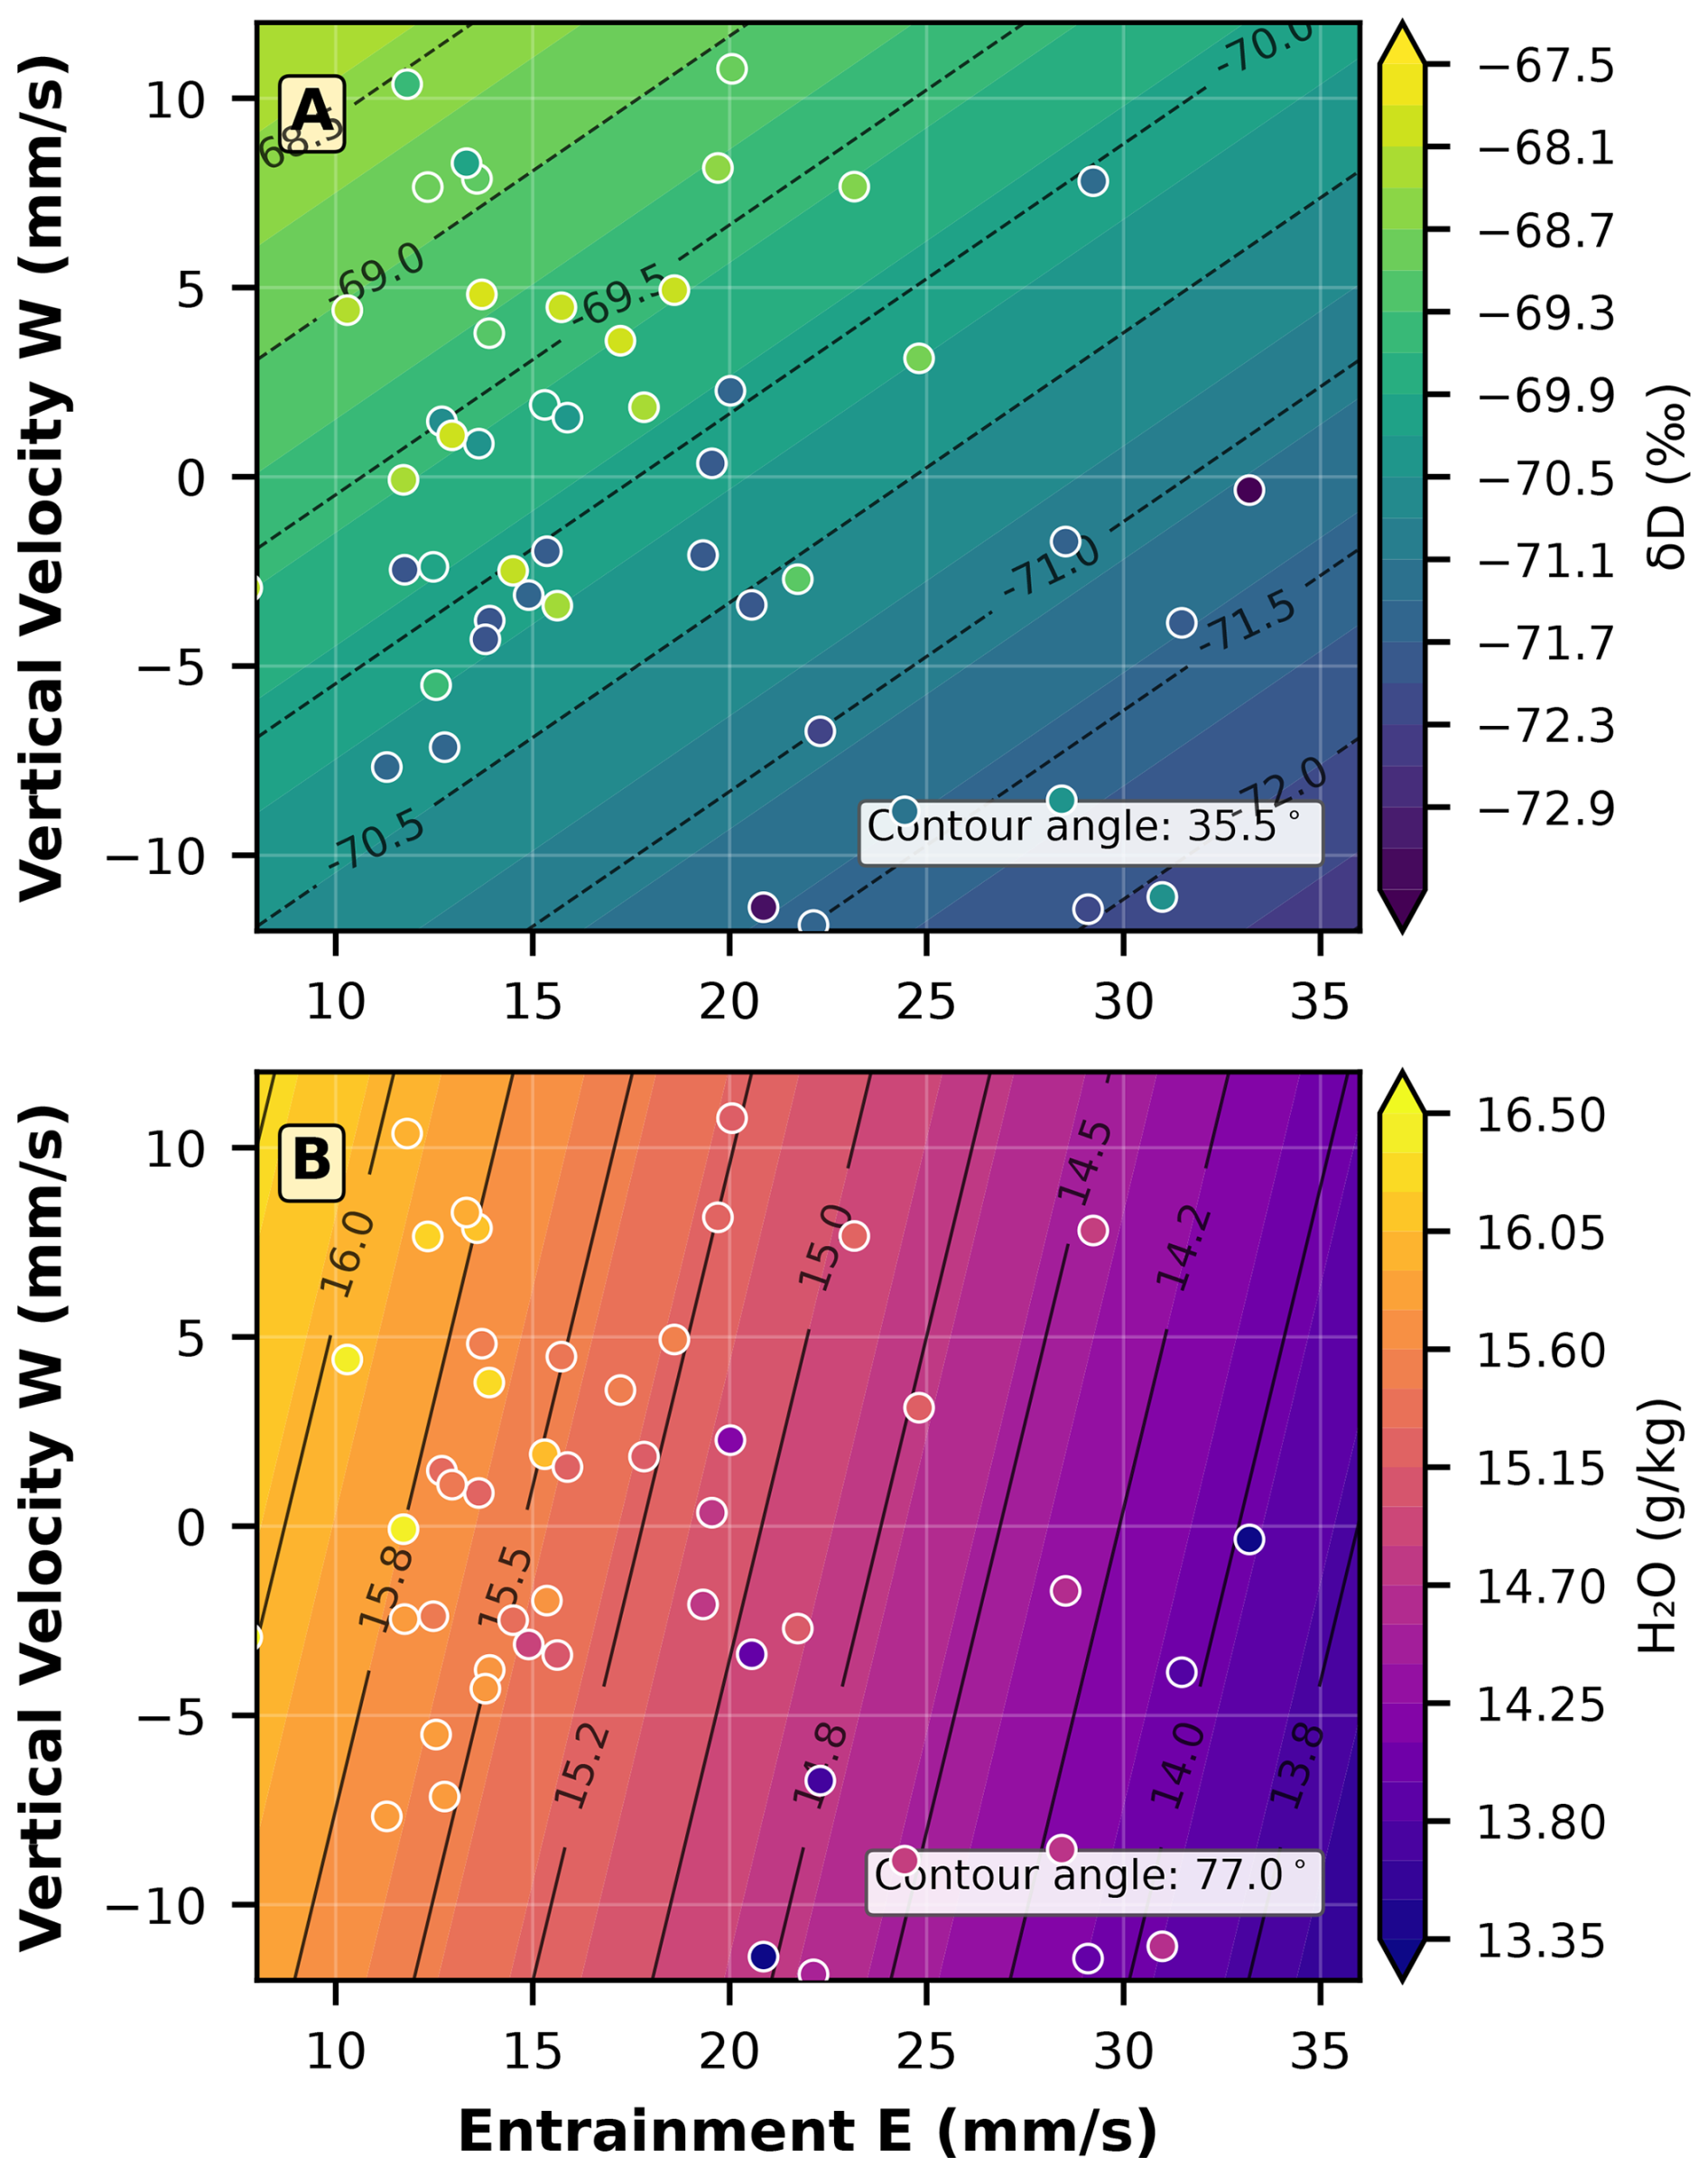
Figure 6Joint entrainment-vertical velocity dependencies in isotopic composition and humidity fields. (A) Contour plot showing water vapor δD as a function of entrainment rate E and vertical velocity W, with observations overlaid as colored points. Contour lines represent predictions from the joint E–W regression model. (B) Water vapor mixing ratio (H2O) dependencies on the same E–W parameter space, using a different color scheme to distinguish variables.
Figure 7 further quantifies the counteraction effect of mesoscale vertical velocity (W) on entrainment (E) through residual analysis. This approach first removes the linear effect of entrainment alone, then examines how vertical velocity correlates with the remaining variance. Using the full dataset (n=56), the fully standardized regression coefficients for δD are and . For humidity, the fully standardized coefficients are and . These coefficients are obtained from the joint regression and do not assume independence between E and W.
The δD residuals (Panel A) exhibit a strong positive correlation with W (r=0.464), indicating that upward motion systematically counteracts entrainment-driven isotopic depletion. We define a counteraction efficiency metric as the ratio of the absolute values of the standardized regression coefficients,
which quantifies the relative statistical influence of mesoscale ascent and entrainment in units of standard deviations. For δD, this yields ηδD≈1.5, whereas for humidity the corresponding point estimate is much smaller, ηq≈0.25. Because η is itself a ratio of two estimated coefficients, its uncertainty is broader and more asymmetric than the uncertainties on the individual slopes; the bootstrap 95 % confidence interval for ηδD spans roughly 0.50–12.86. Thus, the data do not precisely constrain the numerical value of ηδD, rule out values below unity, or exclude the possibility that the apparent difference between the δD and humidity counteraction efficiencies is smaller than implied by the point estimates. We therefore interpret the efficiency contrast as suggestive rather than statistically resolved.
Because this metric is based on standardized coefficients, it does not represent cancellation in physical units (mm s−1), but instead compares the sensitivity of each variable to variability in the two predictors. Physical cancellation in mm s−1 can instead be assessed using the unstandardized regression slopes. From the fitted relationship
we find that approximately 0.7 mm s−1 of mesoscale ascent is required to offset the isotopic impact of 1 mm s−1 of entrainment. For humidity, the corresponding unstandardized slopes imply that approximately 4.4 mm s−1 of mesoscale ascent would be required to offset the drying associated with 1 mm s−1 of entrainment.
The point estimates of counteraction efficiency suggest that mesoscale processes exert a stronger relative influence on isotopic variability than entrainment alone, whereas the lower point estimate for humidity implies a weaker role of vertical motion in setting boundary-layer water vapor concentrations. Although these relationships exceed the noise threshold identified earlier, measurement uncertainty constitutes a large fraction of the observed δD variance. As a result, the precise values of the regression slopes and efficiencies should be interpreted cautiously, and the data do not rule out a smaller or statistically indistinct difference between the isotopic and humidity counteraction efficiencies.
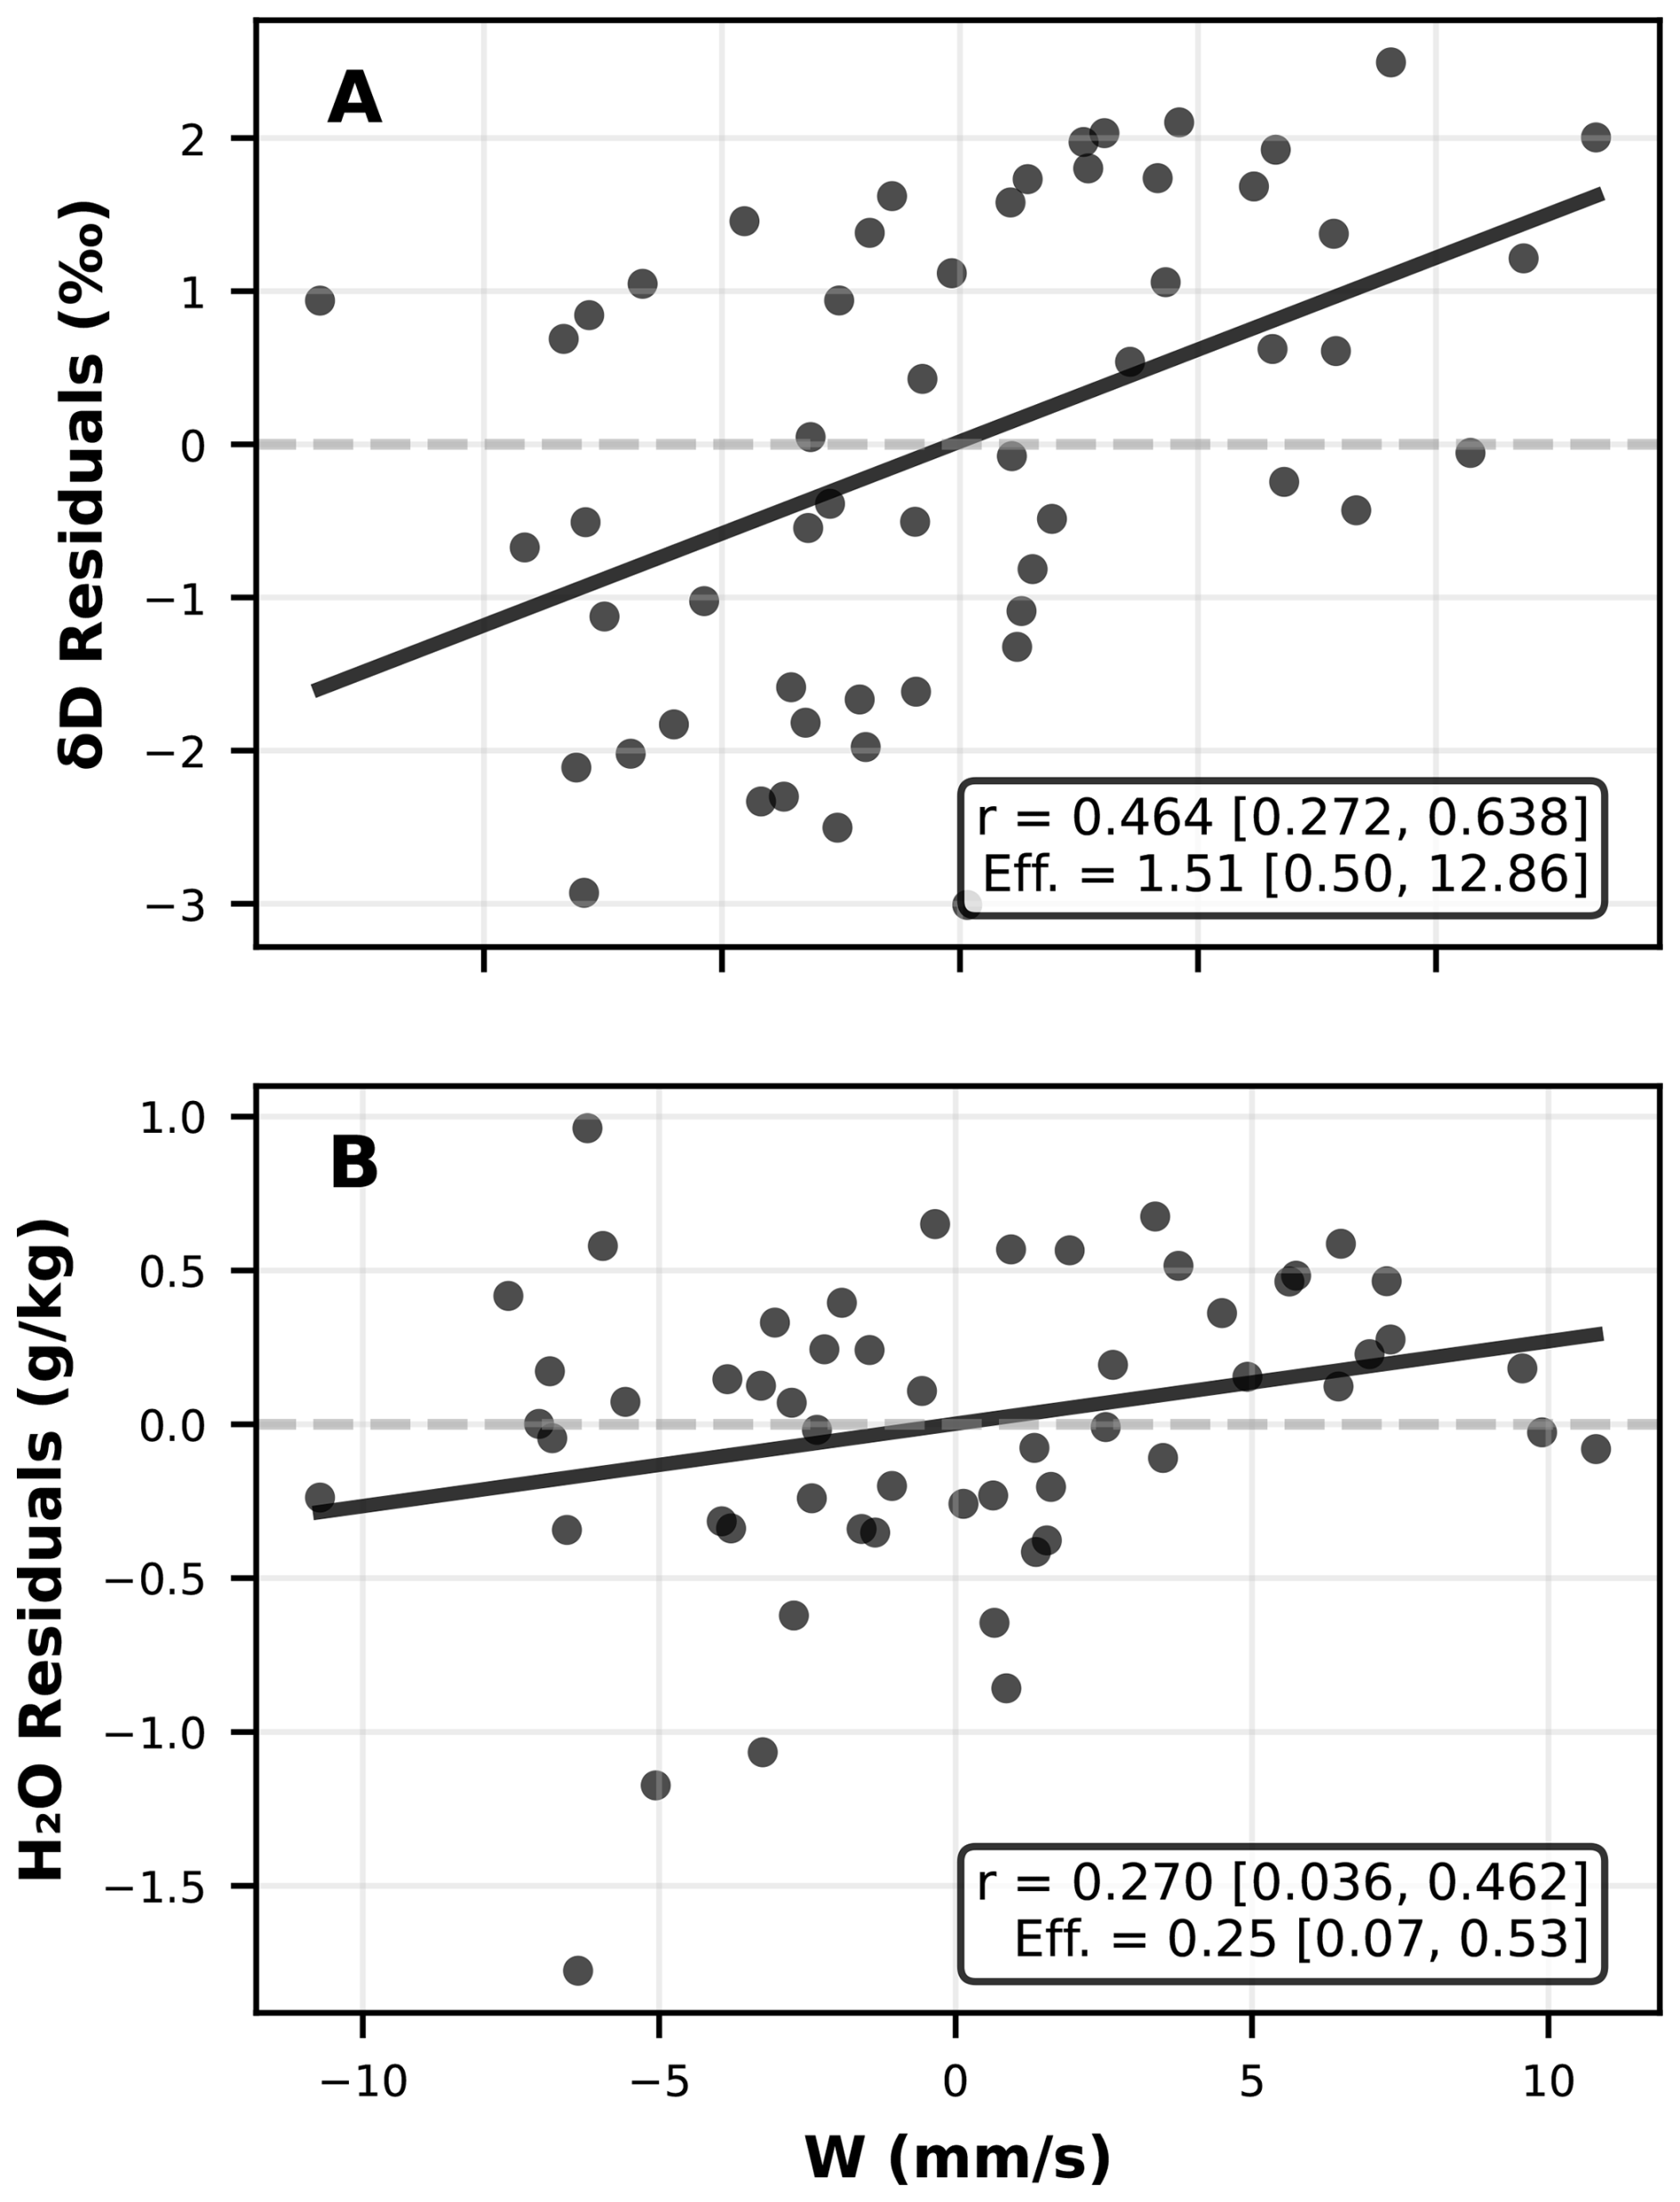
Figure 7Residual analysis of vertical velocity counteraction effects on isotopic composition and humidity. (A) δD residuals after removing entrainment-only effects plotted against vertical velocity W at optimal altitude. Points show individual HALO/P3 circle observations, with the regression line indicating the pure counteraction effect of W. The correlation coefficient (r) and counteraction efficiency (Eff.) quantify how effectively vertical motion counteracts entrainment-driven isotopic depletion. (B) Water vapor mixing ratio (H2O) residuals after removing entrainment-only effects plotted against vertical velocity W.
These results show that mesoscale circulations significantly modulate the entrainment-driven changes in boundary layer humidity and composition, consistent with the findings of Vogel et al. (2022) and George et al. (2023). The isotopic measurements provide quantitative constraints on the relative importance of these competing processes, with mesoscale vertical motions capable of fully offsetting or even reversing entrainment effects on boundary-layer δD.
The observational analysis above establishes that δD responds more strongly than humidity to mesoscale vertical velocity, but it does not identify the physical mechanism responsible for this asymmetry. Warm rain and cold-pool signatures are common in the trade-wind regime, and EUREC4A observations document precipitation and cold-pool influences on the subcloud layer (Touzé-Peiffer et al., 2022; Radtke et al., 2022). Previous observational and modeling studies have established that below-cloud evaporation is an important term in tropical water-isotope budgets, because falling droplets can return condensate-derived heavy isotopes to unsaturated subcloud air (Tremoy et al., 2014; Graf et al., 2019; Risi et al., 2020). Crucially, rain evaporation adds moisture and isotopic mass simultaneously, but the isotopic ratio of the evaporated vapor differs from that of the ambient subcloud vapor due to fractionation during partial evaporation. If the rain-evaporation moisture flux is modest relative to the full subcloud moisture budget, this process can strongly affect δD while producing only a weak humidity response.
To test this hypothesis, we developed a prognostic control-volume model that resolves the competing fluxes governing subcloud layer humidity and isotopic composition. The model treats the subcloud layer as a well-mixed slab of prescribed depth h and air density ρ that exchanges mass and isotopic mass with three reservoirs: the ocean surface, the overlying cloudy layer, and a rain evaporation source whose strength depends on mesoscale vertical velocity. All fluxes enter both the moisture and isotopic budgets explicitly; there is no term that modifies isotopic composition without a corresponding mass flux.
4.1 Conserved-variable framework
The model advances two prognostic variables: the column water-vapor inventory Q=ρhq and the column heavy-isotopologue vapor inventory MD=ρhqR, where q is the specific humidity and is the isotopic ratio. These inventories represent the mass stored in the well-mixed subcloud control volume per unit horizontal area. The budget equations are
where the three flux terms on the right-hand side represent surface evaporation, entrainment from the cloudy layer, and rain evaporation, respectively. In the synthetic equilibrium experiments presented here, h is held fixed, so E is interpreted as the cross-interface exchange velocity across this prescribed control volume rather than as a prognostic deepening rate for h. The specific humidity and isotopic ratio are recovered diagnostically as and . Isotopic ratios are reported in standard delta notation, , where .
By formulating the budgets in terms of Q and MD rather than q and R directly, the model avoids the nonlinear coupling and potential numerical inconsistencies that arise when isotopic ratio equations are solved independently of the mass budget. This conserved-variable approach ensures that the isotopic budget is strictly consistent with the mass budget at every timestep.
4.2 Surface evaporation
The surface moisture flux is parameterized using bulk aerodynamic theory:
where CE is the bulk transfer coefficient, U is the surface wind speed, and qsat is the saturation specific humidity at sea surface temperature and surface pressure. The corresponding isotopic flux follows the Craig–Gordon formulation (Craig and Gordon, 1965):
where Roc is the isotopic ratio of ocean surface water, αeq is the temperature-dependent equilibrium fractionation factor (Majoube, 1971), and αk is the kinetic fractionation factor associated with diffusive transport through the interfacial sublayer (Merlivat and Jouzel, 1979).
This formulation deserves brief comment. The classical Craig–Gordon model expresses the isotopic ratio of the evaporating vapor as a function of relative humidity , with a (1−H) factor in the denominator that produces a singularity as H→1. However, when the evaporative isotopic flux is written as the product of the mass flux Fsurf and the evaporating vapor's isotopic ratio, the (1−H) factors cancel exactly between the mass flux and the Craig–Gordon expression. Equation (7) implements this cancelled form directly, ensuring that the isotopic flux remains well-defined and proportional to Fsurf across all humidity conditions.
4.3 Entrainment
Entrainment from the cloudy layer into the subcloud layer is parameterized as
where E is the entrainment velocity (m s−1), and qCL and RCL are the specific humidity and isotopic ratio of the cloudy layer, respectively. Because qCL<q in the trades, entrainment acts as a moisture sink and, because the cloudy layer is isotopically depleted relative to the subcloud layer (RCL<R), it simultaneously depletes δD. The isotopic flux is written in terms of the conserved quantity qR rather than R alone, maintaining strict consistency with the mass budget.
4.4 Rain evaporation
The rain evaporation term is the additional process tested as a mechanism for the observed asymmetry. As raindrops formed by condensation in the cloud layer fall through the unsaturated subcloud layer, they partially evaporate. This process adds both mass and isotopic mass to the subcloud vapor, but the isotopic ratio of the evaporated vapor differs from that of the ambient vapor because of fractionation during partial evaporation.
The rain evaporation mass flux is
where Pcb is a reference cloud-base precipitation-rate scale (kg m−2 s−1), χ is the fraction of the falling rain mass that evaporates before reaching the surface, and f(W) is a rain activity function that modulates the effective precipitation input with mesoscale vertical velocity W. Equivalently, the effective mean cloud-base precipitation input is . The corresponding isotopic flux is
where Rev is the isotopic ratio of the vapor produced by rain evaporation.
The rain activity function f(W) represents the dependence of precipitation activity on mesoscale vertical velocity. Mesoscale ascent is associated with cloud organization and cloudier, moister mesoscale states (George et al., 2023; Vogel et al., 2022), so we use W as a coordinate for the precipitation flux that can drive below-cloud evaporation. We parameterize this dependence as a logistic function,
where Wwidth controls the sharpness of the transition between suppressed and active precipitation regimes. This function varies smoothly from near zero for strong subsidence to near unity for strong ascent, with the midpoint at W=0. The specific functional form is a modeling choice rather than a universal precipitation law, but assigning larger effective precipitation input during mesoscale ascent is physically motivated by the observed cloud–circulation coupling during EUREC4A (George et al., 2023; Vogel et al., 2022).
4.5 Below-cloud isotopic fractionation
The isotopic ratio of the vapor released by partial rain evaporation, Rev, is computed using the below-cloud evaporation model of Stewart (1975). This model tracks the evolution of a raindrop's isotopic composition as it falls through unsaturated air, accounting for both equilibrium fractionation at the drop surface and kinetic fractionation during diffusive transport of vapor away from the drop.
The raindrop is assumed to form at cloud base by equilibrium condensation from cloud-layer vapor, giving an initial liquid isotopic ratio , where αeq(Tcb) is the equilibrium fractionation factor at cloud-base temperature. Here and in the surface-flux formulation above, αeq denotes the liquid-to-vapor equilibrium fractionation factor, so αeq>1. Because liquid is enriched relative to vapor in equilibrium, : the raindrop starts with a higher isotopic ratio than the cloud-layer vapor from which it formed.
As the drop partially evaporates, the isotopic ratio of the remaining liquid evolves according to (Stewart, 1975):
where is the fraction of the original drop mass that survives to the surface, R is the ambient vapor isotopic ratio, and γ and β are functions of the equilibrium fractionation factor αeq, the molecular diffusivity ratio , the kinetic exponent n, and the ambient relative humidity H:
The isotopic ratio of the total vapor released by evaporation is then obtained by mass balance over the evaporated fraction:
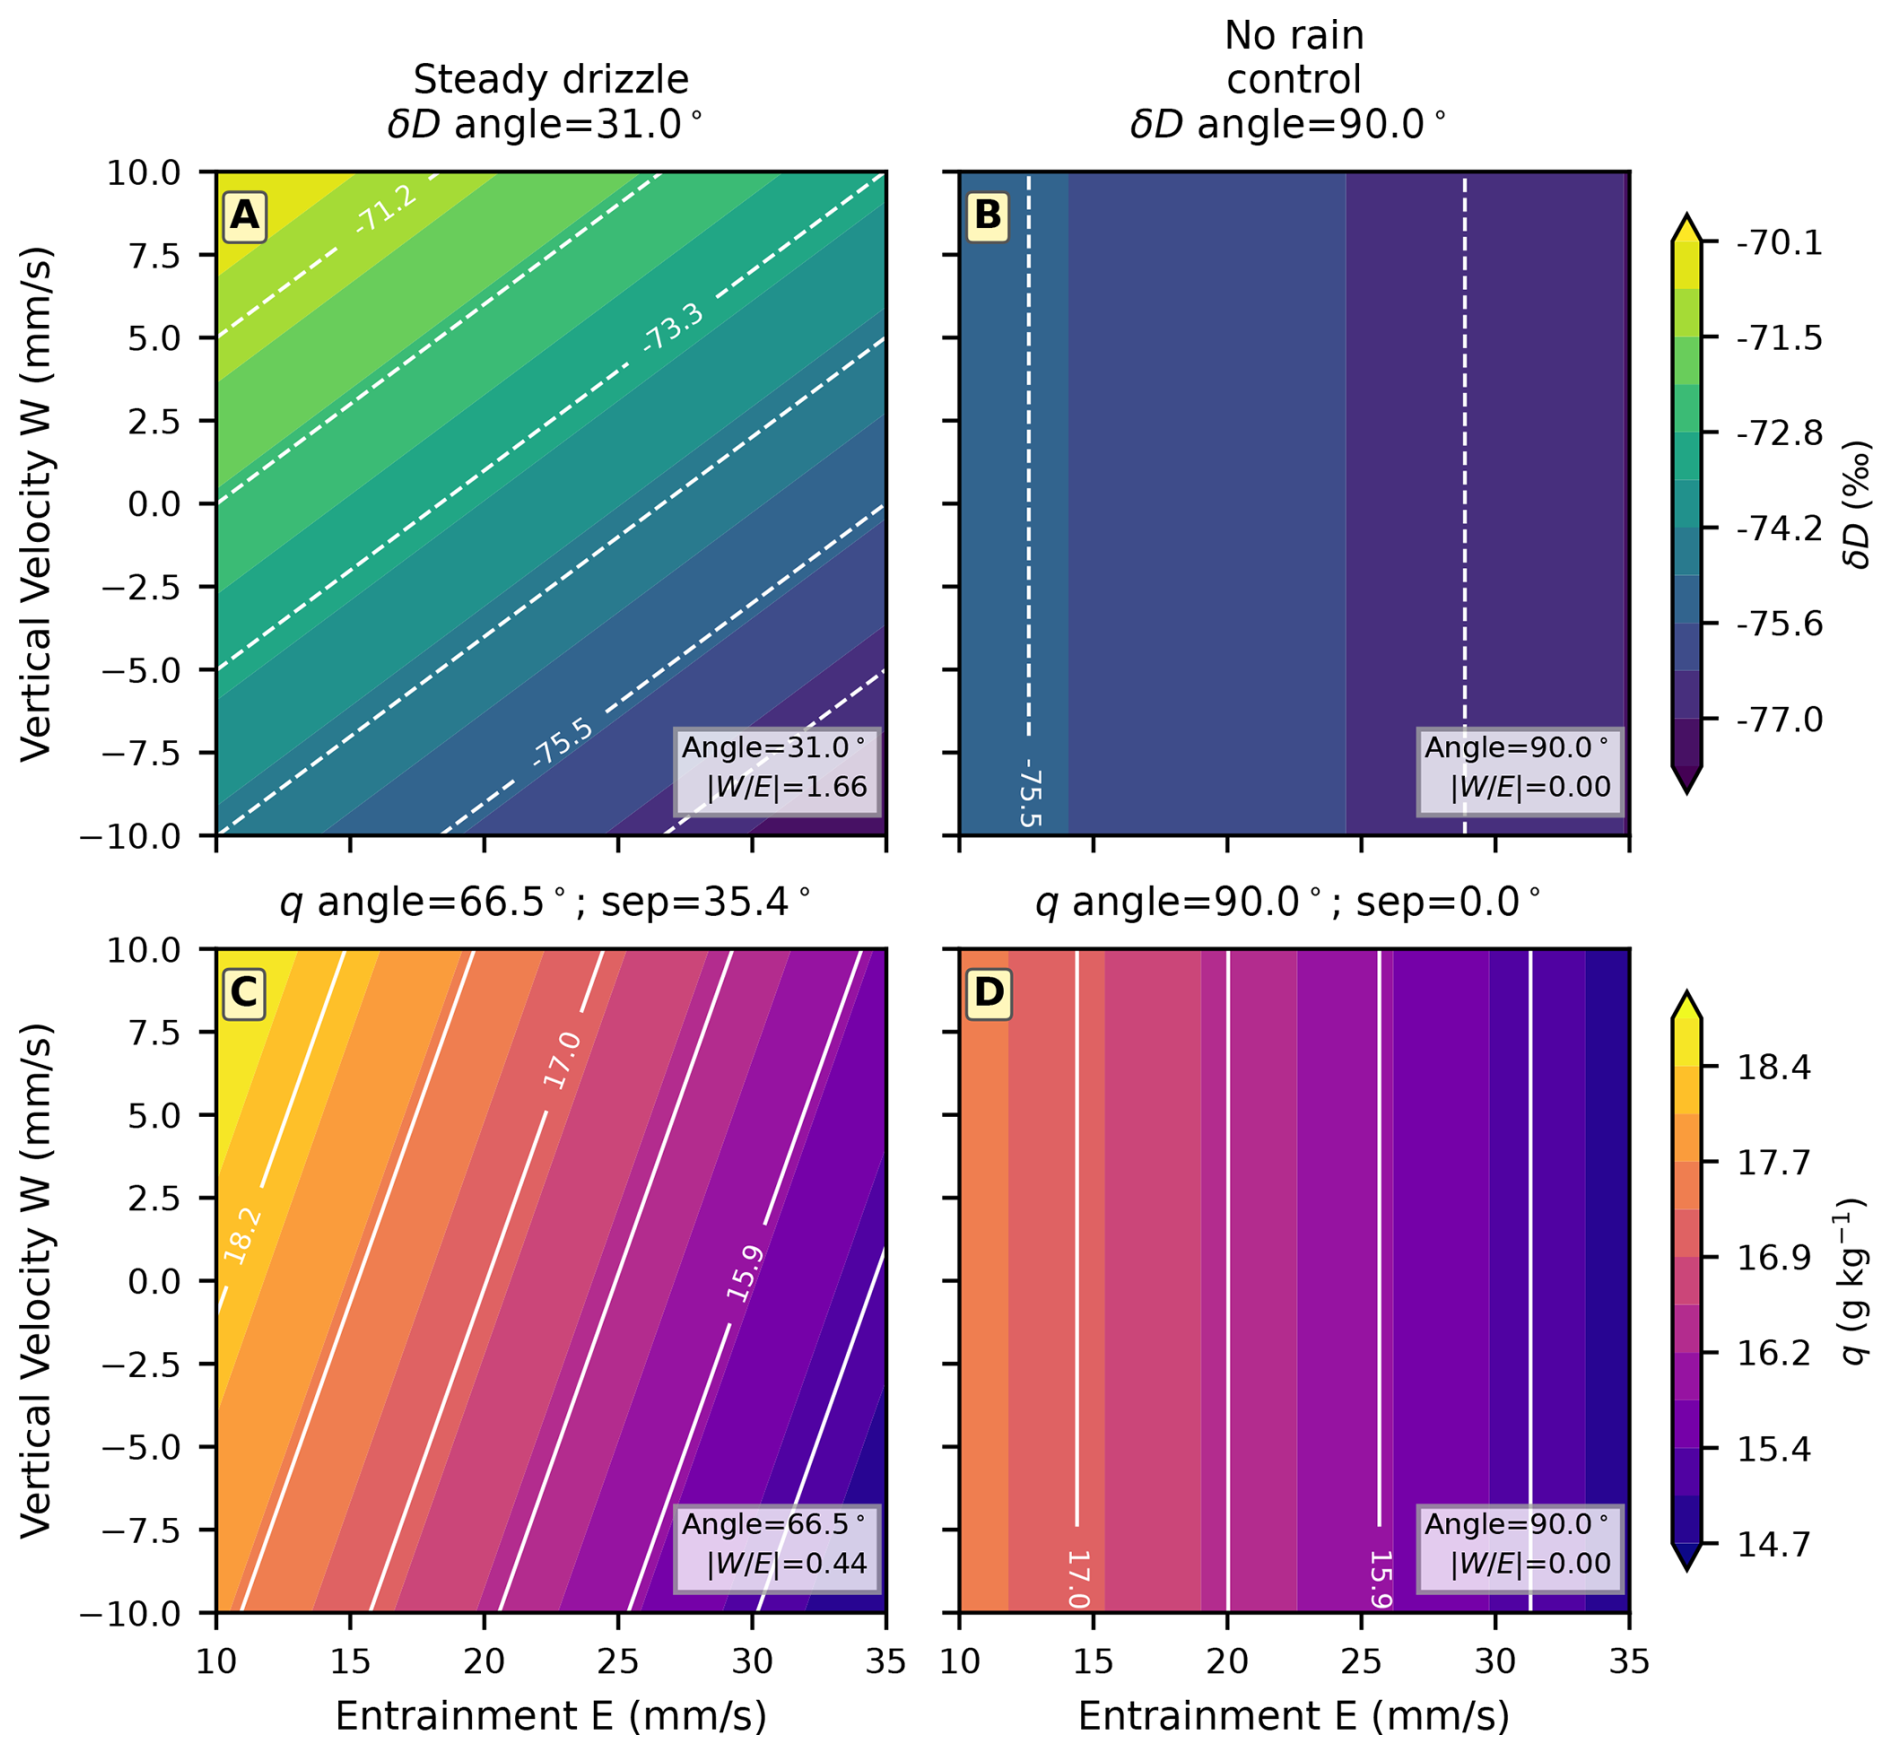
Figure 8Modeled equilibrium structure across the entrainment–vertical velocity (E–W) parameter space. Panels (A) and (B) show fitted-plane δD fields for the steady-drizzle case and the no-rain control, respectively. Panels (C) and (D) show the corresponding fitted-plane humidity fields. White lines show contours of the fitted planes. In the drizzle case, δD contours rotate strongly toward W sensitivity while q remains more E-dominated; in the no-rain control, both fields collapse to nearly E-only structure.
This formulation captures the leading-order isotope mass balance associated with below-cloud evaporation. For the conditions typical of the EUREC4A subcloud layer (H≈0.7, Tcb≈18 °C, χ≈0.8), the evaporated vapor is isotopically enriched relative to the ambient subcloud vapor. With the baseline parameters, the cloud-base liquid has ‰ and the mass-weighted evaporated vapor has ‰, about 60 ‰ enriched relative to the ambient subcloud vapor. The enrichment arises because the raindrop starts with a high isotopic ratio (set by equilibrium condensation from cloud-layer vapor) and, during partial evaporation, preferentially loses light molecules. The vapor released is therefore enriched relative to both the cloud-layer vapor from which the drop formed and the ambient subcloud vapor into which it evaporates. This enrichment provides a mechanism for the asymmetric response: rain evaporation during mesoscale ascent adds vapor that is isotopically distinct from the ambient subcloud air, strongly modifying δD, while the mass of moisture added by rain evaporation is small relative to the total subcloud moisture budget, producing only a modest change in q.
4.6 Model integration and equilibrium structure
The model is integrated forward in time with a 20 s timestep from specified initial conditions until a quasi-steady state is reached (typically 60 h of integration, with results averaged over the final 24 h). For a given pair of forcing values (E,W), the model evolves toward an equilibrium in which the surface evaporation, entrainment, and rain evaporation fluxes balance. We compute the equilibrium state across a grid spanning the observed range of entrainment rates (E=10–35 mm s−1) and vertical velocities ( to +10 mm s−1).
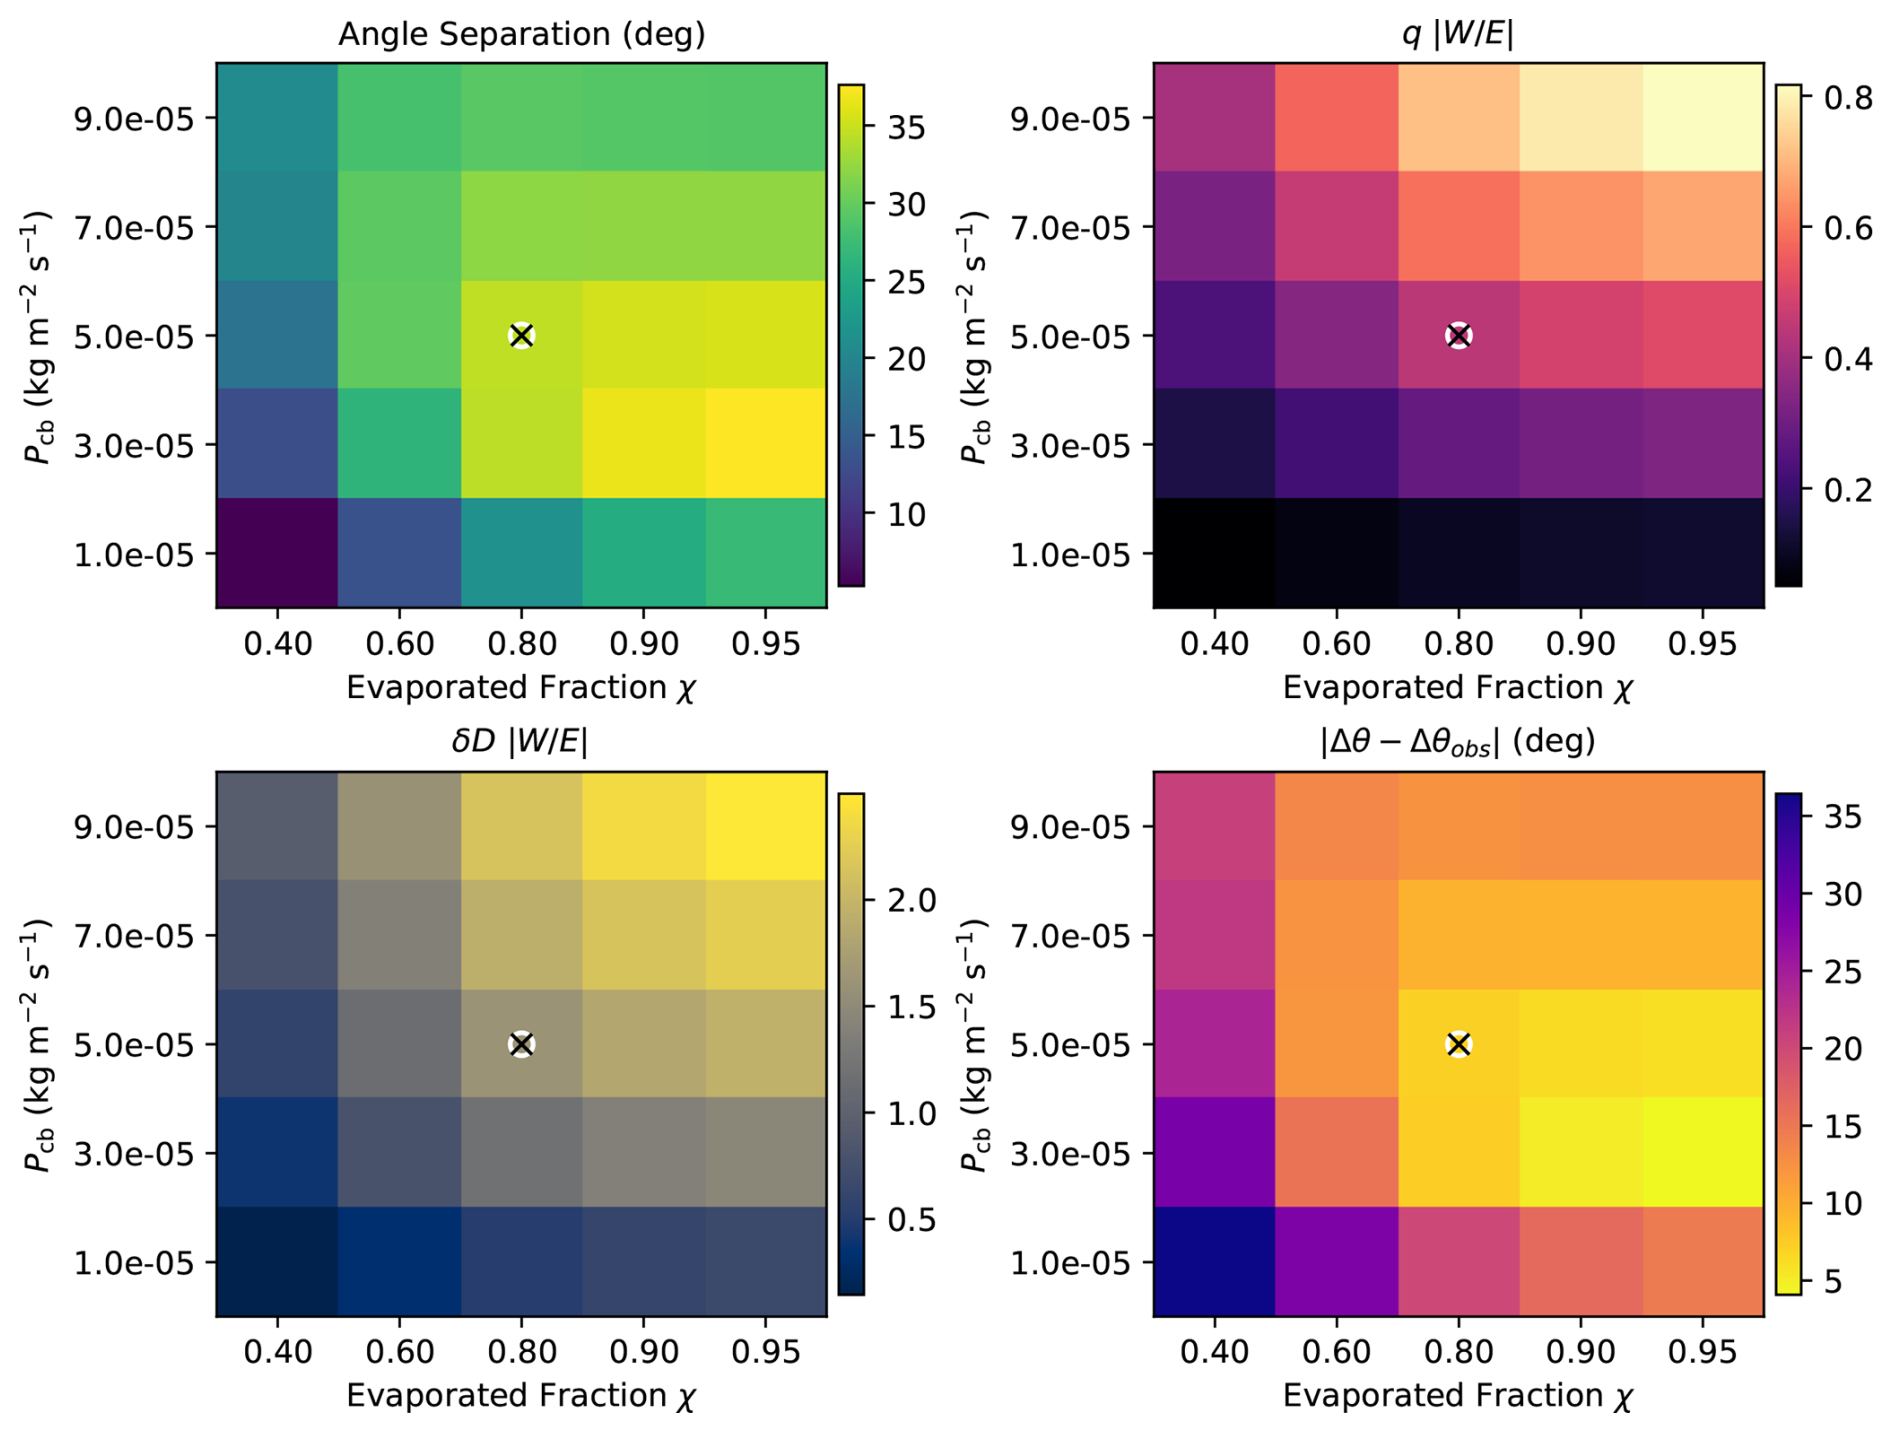
Figure 9Targeted sensitivity of the steady-drizzle model to the reference cloud-base precipitation-rate scale Pcb and evaporated rain fraction χ at fixed Wwidth=4 mm s−1. Panels show the modeled contour separation between δD and q, the corresponding W-to-E sensitivity ratios for humidity and δD, and the misfit relative to the observed contour separation. The marker denotes the baseline drizzle configuration used in the main text.
We represent below-cloud rain evaporation as a steady drizzle source whose effective mean input is modulated by f(W). This mean-flux representation is appropriate for diagnosing the equilibrium response: the question is not the detailed timing of rain events, but whether a W-dependent source of fractionated rain evaporation can rotate the δD contours relative to the humidity contours. The model does not include a separate direct vertical-advection term proportional to W; instead, W is used as a forcing coordinate for the rain-activity pathway being tested. We therefore compare the drizzle case with a no-rain control in which .
Figure 8 shows the resulting equilibrium structure. Using the same contour-angle convention as in Fig. 6, the drizzle case yields fitted δD contours with an angle of 31.0° in the E–W plane, whereas the fitted q contours have an angle of 66.5°, giving a contour separation of 35.4°. Equivalently, the ratio of the fitted W and E sensitivities is much larger for isotopic composition () than for humidity (). Thus, rain evaporation produces a state in which δD is strongly modulated by mesoscale vertical velocity while q remains primarily controlled by entrainment. In the no-rain control, both variables have nearly vertical fitted contours and zero W sensitivity, so the contour separation collapses. The modeled separation is somewhat smaller than the observational separation of 41.5°, but the two are close enough to support the same qualitative interpretation. This comparison shows that below-cloud rain evaporation is a process that can generate the non-parallel q–δD structure.
4.7 Parameter values
The model parameters are summarized in Table 1. Environmental conditions are set to campaign-mean values: SST =27.3 °C, surface pressure p=1013.25 hPa, subcloud layer depth h=700 m, and surface wind speed U=8 m s−1. The bulk transfer coefficient is a standard value for open-ocean conditions. Equilibrium fractionation follows Majoube (1971). For the surface Craig–Gordon flux, kinetic fractionation uses with . For the Stewart below-cloud evaporation calculation, we use the deuterium diffusivity ratio and n=0.58 (Merlivat and Jouzel, 1979; Stewart, 1975).
The cloudy-layer end member is specified as qCL=13.0 g kg−1 and ‰, consistent with the mean dropsonde profiles. The cloud-base temperature is set to Tcb=18 °C, and the ocean isotopic ratio to δDoc=0 ‰.
The rain evaporation parameters – reference cloud-base precipitation-rate scale kg m−2 s−1, evaporated fraction χ=0.8, and logistic width Wwidth=4 mm s−1 – are free parameters, not independently fitted observations. We choose them to represent weak trade-cumulus drizzle: the precipitation-rate scale is consistent with observed trade-cumulus rain rates (Radtke et al., 2022), and the high evaporated fraction reflects the shallow cloud base and warm subcloud conditions, in which much of the falling precipitation can evaporate before reaching the surface. The fixed evaporated fraction is a bulk simplification; the model does not resolve drop-size distributions, ventilation, or vertical variations in relative humidity and temperature along the fall path.
Merlivat and Jouzel (1979)Stewart (1975)Stewart (1975)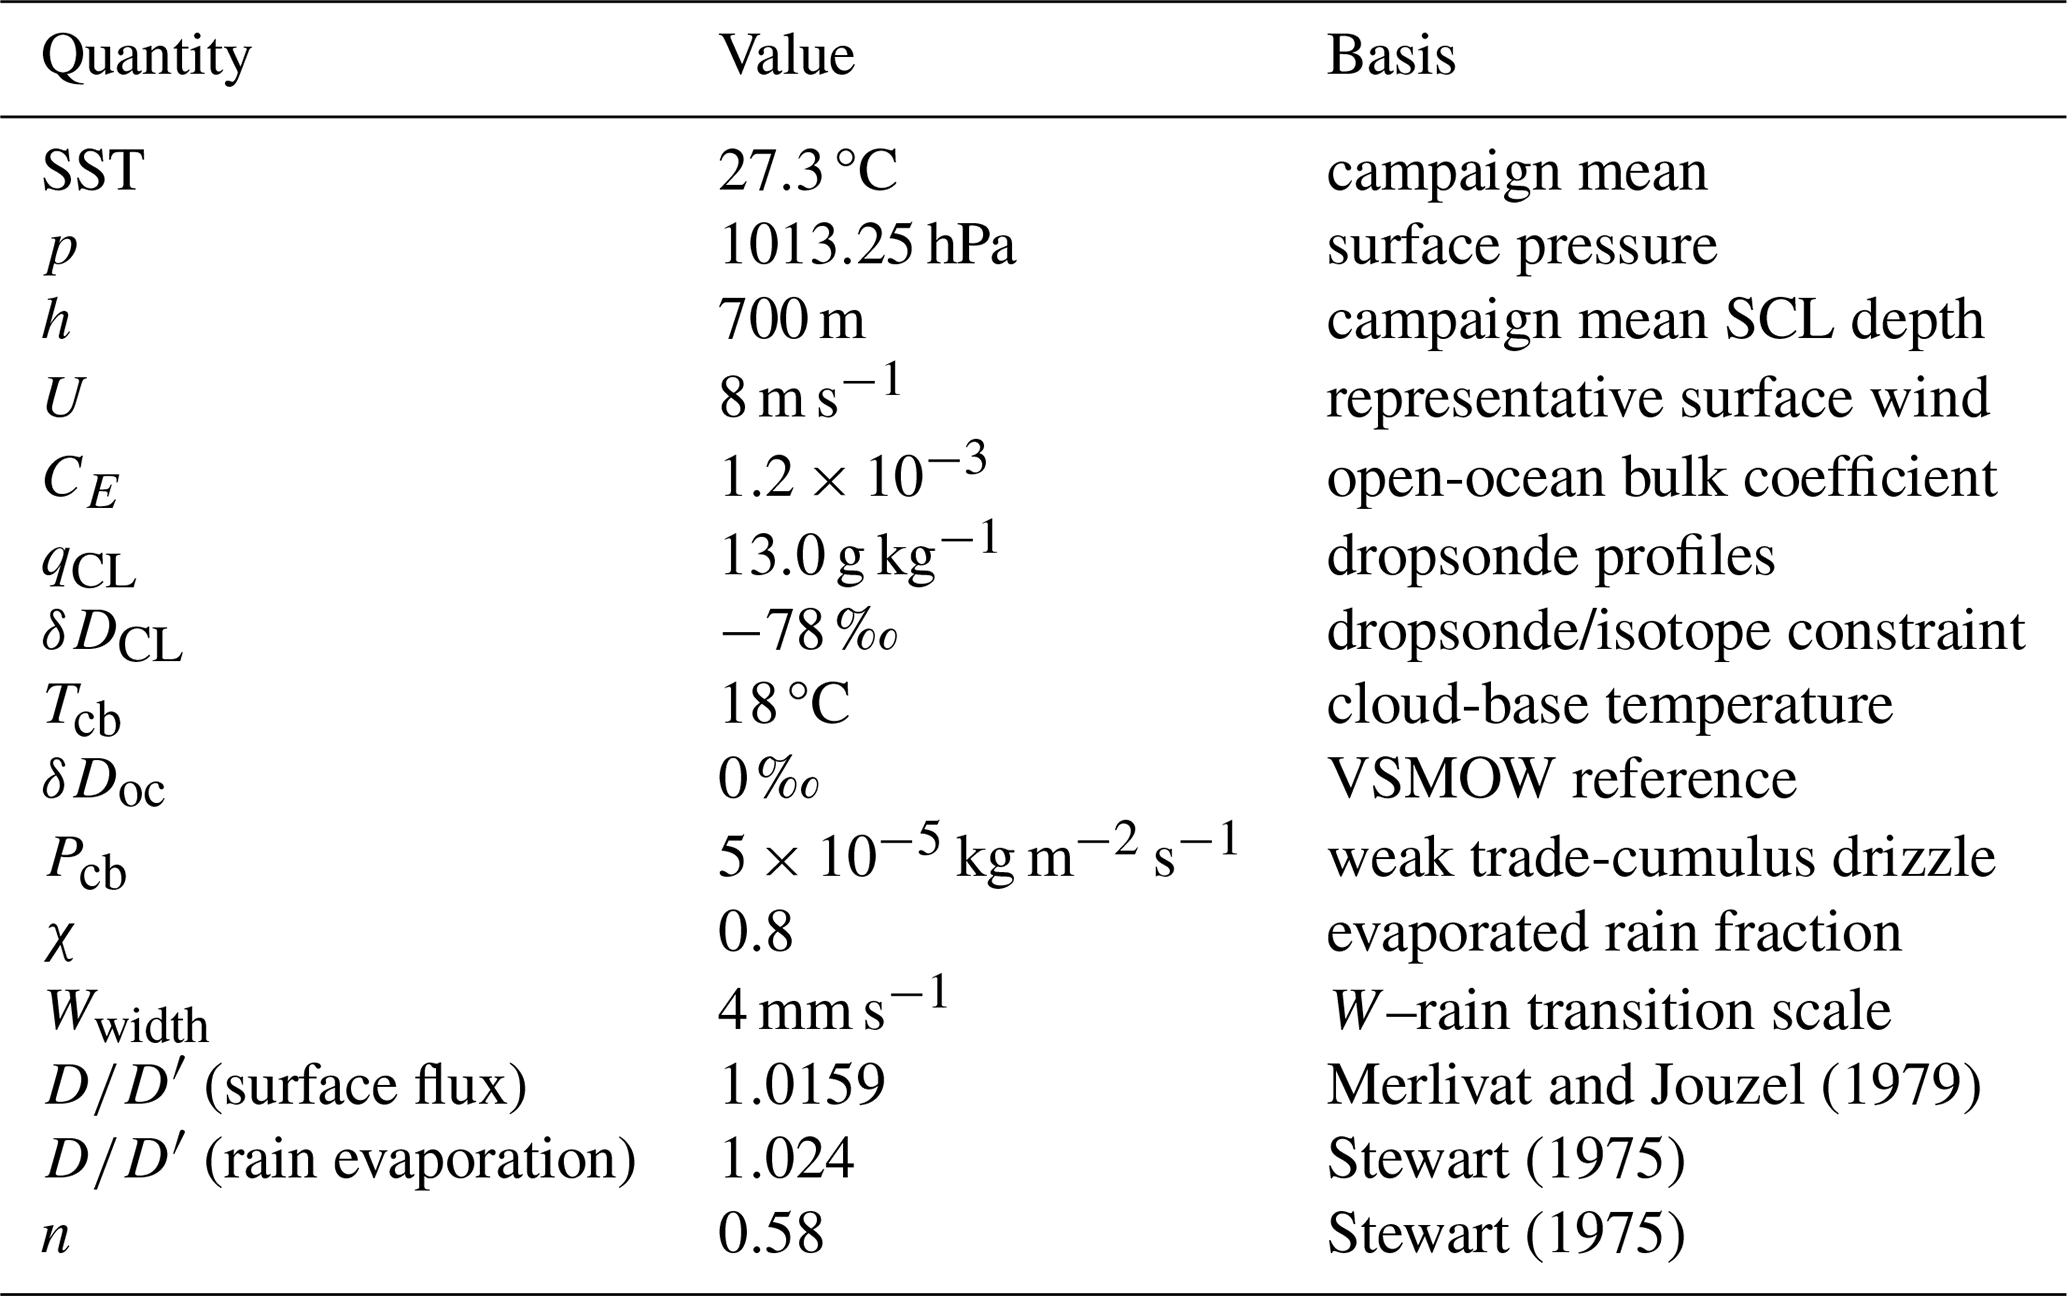
Figure 9 shows a targeted two-parameter sensitivity sweep spanning (Pcb,χ) at fixed Wwidth=4 mm s−1. The baseline configuration used throughout the paper is marked on each panel. The upper-left panel shows the modeled contour separation between δD and q, the upper-right and lower-left panels show the corresponding W-to-E sensitivity ratios for humidity and isotopic composition, and the lower-right panel shows the absolute mismatch between the modeled and observed contour separations. The baseline point lies in the regime where δD is clearly W-sensitive () while humidity remains E-dominated (), and it yields a modeled contour separation close to the observed value. Because Wwidth controls the shape of the prescribed W–rain transition rather than the rain-flux amplitude, we also ran a baseline-only sensitivity check over Wwidth=2–8 mm s−1 (not shown). For Wwidth=2–6 mm s−1, the model retains the qualitative target of W-sensitive δD and E-dominated humidity, with contour separations of approximately 33–36°; a broader transition of 8 mm s−1 weakens the isotope W sensitivity to near unity and reduces the separation to about 30°.
The figure also shows why the parameter choice cannot be increased arbitrarily. Moving toward larger Pcb and χ strengthens the isotopic response further, but it also increases the humidity response to W and reduces the separation between the humidity and isotope contours. In other words, sufficiently strong rain evaporation rotates both fields and degrades the observed q–δD asymmetry. The qualitative model result is therefore robust to moderate parameter perturbations, but it is reproduced only within a moderate-rain regime rather than for arbitrary rain forcing.
Our analysis shows that mesoscale vertical motions in the trade-wind regime modulate the marine boundary layer through a partial counteraction of entrainment-driven drying. Water vapor isotopologues reveal this modulation with greater sensitivity than humidity alone, yielding an asymmetric response: δD varies more strongly with mesoscale vertical velocity than does the total mixing ratio. The revised mixed-layer model demonstrates one physically consistent mechanism for this asymmetry: below-cloud rain evaporation adds both vapor mass and isotopic mass, but for weak drizzle the added mass is small relative to the full moisture budget while the isotopic composition of the evaporated vapor is distinct from the ambient subcloud vapor.
5.1 Model interpretation and constraints
Figure 8 provides the mechanistic closure for the observational regressions in Fig. 6. In the drizzle case, the model produces fitted δD contours that are much more W-sensitive than the fitted humidity contours: , compared with for humidity. This nearly fourfold contrast is the key quantitative result of the model. It shows that mesoscale ascent can strongly modify isotopic composition through W-dependent rain evaporation while leaving the total water vapor field primarily controlled by entrainment.
The no-rain control is equally important, but it should be interpreted within the structure of this process test. When , both q and δD have nearly vertical fitted contours and zero W sensitivity because the model does not include direct W-driven vertical advection of the subcloud-layer budget. Surface evaporation plus cloudy-layer entrainment therefore does not produce the observed non-parallel q–δD structure by itself in this model. Adding a third source term associated with below-cloud rain evaporation provides one physically plausible route to this structure. This does not mean that rain evaporation dominates the moisture budget; rather, the successful drizzle case occupies the regime in which rain evaporation is large enough to rotate the isotope contours but small enough that humidity remains E-dominated.
This balance also constrains the interpretation. In sensitivity tests with much stronger precipitation forcing, the rain evaporation mass flux becomes large enough that q also rotates toward W sensitivity, and the q–δD contour separation collapses. The observed asymmetry is therefore not reproduced by arbitrary rain addition; it requires moderate below-cloud evaporation whose isotope effect is large relative to its net moisture effect. The model should consequently be viewed as an equilibrium process test rather than a unique retrieval of rain rate, rain intermittency, or microphysical parameters.
5.2 Connection to mesoscale overturning circulations and mixing–desiccation processes
These findings provide observational and mechanistic context for the shallow mesoscale overturning circulations (SMOCs) identified by George et al. (2023) and the counteraction mechanism proposed by Vogel et al. (2022). Vogel et al. (2022) demonstrated that mesoscale vertical motions counteract entrainment-driven drying, refuting the mixing–desiccation hypothesis of Sherwood et al. (2014) by showing that stronger mixing does not necessarily lead to cloud-base desiccation. George et al. (2023) provided direct observational evidence of SMOCs, documenting robust divergence dipoles between the subcloud and cloud layers and showing that convergence branches reduce entrainment efficiency and amplify moisture variance near cloud base.
Our analysis extends these studies by localizing the coupling mechanisms in the vertical. The strongest correlations between vertical velocity and both δD and humidity occur just below the subcloud layer top, identifying where mesoscale circulations most directly influence near-surface composition. This height range is consistent with the layer where mesoscale vertical motion, cloud-base exchange, and evaporation of shallow precipitation are expected to interact most strongly. One plausible interpretation is that the ∼ 100 m offset of the δD correlation maximum below the SCL top marks the layer where mesoscale vertical motion samples condensate-derived vapor recently released by shallow precipitation evaporation near cloud base. We cannot separate this effect from the vertical structure of W alone with the present observations, but the combined observational and model evidence points to a three-flux balance among surface evaporation, cloudy-layer entrainment, and below-cloud rain evaporation. The resulting isotopic contrast between ascending and descending branches exceeds the corresponding humidity contrast.
5.3 Why isotopes respond more strongly than humidity
The pronounced isotopic sensitivity arises because δD responds to moisture source and phase-change history, whereas humidity is constrained by the total mass balance. Entrainment brings relatively dry, isotopically depleted cloudy-layer air into the subcloud layer. Surface evaporation supplies comparatively enriched vapor from the ocean. Below-cloud rain evaporation supplies a third contribution: condensate-derived vapor whose isotopic ratio reflects cloud-layer condensation followed by partial evaporation in unsaturated subcloud air. Mesoscale ascent can change the relative importance of these three fluxes in a way that strongly affects isotopic composition but only weakly alters total water vapor.
This asymmetry is evident in the joint entrainment–vertical velocity (E–W) space, where δD exhibits a strong diagonal organization analogous to the SMOC moisture anomaly structure described by George et al. (2023), but with larger amplitude. While both δD and humidity respond to entrainment, mesoscale ascent produces large isotopic enrichment with only modest moistening. Isotopic tracers therefore expose compensation mechanisms that remain largely hidden in humidity alone.
5.4 Relation to existing isotope frameworks
Our results extend existing theoretical and observational frameworks for marine boundary layer isotopic composition. The MBL-mix framework of Benetti et al. (2018) successfully interprets isotopic variability through surface evaporation and mixing with isotopically depleted air aloft. Our analysis indicates that active mesoscale periods include an additional rain-evaporation pathway, so the subcloud-layer isotope budget cannot always be reduced to a two-endmember balance between ocean evaporation and dry air aloft.
Similarly, the asymmetric isotopic response we document is consistent with the processes outlined by Galewsky et al. (2022), who showed that water vapor isotopologues provide sensitivity to boundary layer mixing and decoupling processes in stratocumulus regimes that is not evident from humidity alone. Our EUREC4A observations demonstrate that this sensitivity extends to the trade cumulus regime and is expressed through mesoscale overturning circulations rather than solely through boundary layer decoupling. The vertical localization observed here provides a mechanistic link between surface isotopic signatures and mesoscale circulation patterns that transport locally evaporated but differentially processed vapor within the boundary layer.
Our findings also complement the analysis of Risi et al. (2020), who emphasized the role of local mixing processes in controlling tropical surface-vapor isotopic variability. The EUREC4A results indicate that active mesoscale periods cannot be represented as a simple two-endmember mixture between ocean evaporation and dry air aloft. A third, rain-evaporation source provides a physically plausible contribution because it changes isotopic composition without producing a proportional humidity anomaly.
5.5 Broader implications and limitations
The strong isotopic sensitivity to mesoscale vertical motion provides an observational constraint on boundary layer coupling that is not available from humidity alone. Large-eddy simulations have shown that shallow-cumulus organization can be coupled to mesoscale aggregation of moisture and convection (Bretherton and Blossey, 2017), and EUREC4A observations show that observed moisture variance is strongly expressed near cloud base (George et al., 2023). Our isotopic observations demonstrate that mesoscale dynamics also leave a clear imprint on near-surface composition, indicating that δD is a sensitive tracer of mesoscale–surface coupling even when humidity anomalies are muted.
While our analysis focuses on mesoscale circulations, cold pools and precipitation also influence boundary layer structure during EUREC4A (Touzé-Peiffer et al., 2022; Radtke et al., 2022). The strongest isotopic–vertical velocity correlations occur near 500–600 m, generally above the shallowest layers most strongly affected by cold-pool outflows. This suggests that the isotopic signal primarily reflects deeper mesoscale overturning and cloud-base exchange rather than only near-surface cold-pool dynamics, though future work explicitly incorporating cold-pool diagnostics and rain-rate observations would help further separate these influences. The synthetic equilibrium model is evaluated over E=10–35 mm s−1, so it is intended to diagnose the positive-entrainment regime that dominates the observational comparison, not the negative-E cases interpreted above as interface lowering or weak detrainment.
The W–rain relationship used in the model should not be interpreted as universal. It is likely to depend on cloud organization, aerosol conditions, precipitation efficiency, subcloud relative humidity, and the depth over which falling drops evaporate. These dependencies could change the strength of the isotope response in other trade-wind regimes or other forms of shallow convection. Likewise, the 60 h model integrations diagnose the equilibrium response to slowly varying forcing rather than the transient response to any individual 2 h observational sample. Because W enters the model only through the rain-activity function, the model cannot separate W-dependent precipitation effects from any direct vertical-advection effect of mesoscale motion on the SCL moisture budget. The more general result is that water isotopologues provide a sensitive constraint on whether mesoscale circulation changes moisture pathways mainly through entrainment, surface evaporation, rain evaporation, direct vertical advection, or some combination of these processes.
Overall, our results show that the marine boundary layer isotopic composition emerges from the combined effects of surface evaporation, entrainment mixing, below-cloud rain evaporation, and mesoscale circulation modulation. These processes are not independent: mesoscale vertical motion changes the relative strength of each moisture pathway without producing proportional changes in humidity. This asymmetric response highlights the value of isotopic measurements as probes of mesoscale dynamics and provides a framework for incorporating isotope constraints into representations of shallow convection and cloud feedbacks.
The goal of this study was to quantify how mesoscale vertical motions modulate marine boundary layer moisture and isotopic composition in the trade-wind regime, and to test interpretations of the mixing–desiccation hypothesis using water vapor isotopologue observations from EUREC4A.
Our main findings are as follows:
-
Water vapor δD and mixing ratio exhibit distinct sensitivities to mesoscale circulation. While humidity variability is primarily controlled by entrainment, δD is more strongly modulated by mesoscale vertical velocity, demonstrating that isotopic composition encodes mesoscale dynamics more clearly than humidity alone.
-
Using standardized regression coefficients, we find that mesoscale vertical velocity has a larger point-estimate counteraction efficiency for δD (ηδD≈1.5) than for humidity (ηq≈0.25). However, because these efficiencies are ratios of estimated coefficients and the confidence interval for ηδD is broad, the data do not tightly constrain the magnitude of this contrast or rule out a smaller, statistically indistinct difference. We therefore interpret the efficiency contrast as suggestive rather than precisely resolved.
-
The strongest correlations between vertical velocity and both δD (r≈0.52) and mixing ratio (r≈0.39) occur within approximately ± 200 m of the subcloud layer top, identifying the vertical region where mesoscale circulations most directly influence near-surface composition.
-
Periods of enhanced entrainment are consistently associated with more negative δD values and lower mixing ratios, whereas periods of mesoscale ascent correspond to less negative δD and modest moistening. Together, these relationships reveal a systematic organization of boundary layer states across entrainment–vertical velocity space, consistent with shallow mesoscale overturning circulations.
-
A steady-state, flux-form mixed-layer model with explicit below-cloud rain evaporation reproduces the observed asymmetric responses of δD and humidity. The drizzle case produces strong W sensitivity in δD while leaving humidity primarily E-dominated, whereas the no-rain control collapses the contour separation. This comparison identifies moderate, W-dependent rain evaporation as a mechanism that can provide closure for the observed counteraction between entrainment and mesoscale ascent.
Although the natural variability of δD during the campaign is modest and quantitative sensitivities should therefore be interpreted cautiously, the convergence of observational diagnostics and model behavior supports a robust qualitative conclusion: water vapor isotopologues provide a sensitive tracer of mesoscale circulations in the trade-wind boundary layer that is not accessible from humidity measurements alone. These results refine interpretations of the mixing–desiccation hypothesis by showing that mesoscale vertical motions reorganize moisture pathways through a combination of entrainment, surface evaporation, and below-cloud rain evaporation without producing commensurate changes in total water vapor, underscoring the value of isotopic constraints for understanding boundary layer dynamics and cloud–circulation coupling.
EUREC4A water vapor isotope data from R/V Meteor are available from Galewsky and Los (2020) via AERIS at https://doi.org/10.25326/83. HALO/P3 dropsonde data from the JOANNE dataset are available from George (2021) via AERIS at https://doi.org/10.25326/221. The broader EUREC4A-iso data collection is available from Bailey et al. (2022) via AERIS at https://doi.org/10.25326/418.
JG conceived the study, analyzed the data, developed the mixed-layer model, and wrote the manuscript. SL processed the isotopic data and contributed to the analysis. Both authors contributed to the interpretation and editing of the manuscript.
The contact author has declared that none of the authors has any competing interests.
Publisher's note: Copernicus Publications remains neutral with regard to jurisdictional claims made in the text, published maps, institutional affiliations, or any other geographical representation in this paper. The authors bear the ultimate responsibility for providing appropriate place names. Views expressed in the text are those of the authors and do not necessarily reflect the views of the publisher.
The authors used artificial intelligence (ChatGPT, OpenAI, 2025) to assist with coding the mixed-layer model and with drafting some initial text. All code, results, and manuscript content were thoroughly checked, validated, and revised by the authors, who take full responsibility for the accuracy and interpretation of the work. We acknowledge the EUREC4A campaign organizers and participants, particularly the crew of R/V Meteor and the HALO and P3 aircraft operations team. We thank the German Research Foundation (DFG) for support of the EUREC4A campaign under grant 264907654.
This research has been supported by the Directorate for Geosciences (grant no. AGS-1853353).
This paper was edited by Kara Lamb and reviewed by Camille Risi and one anonymous referee.
Albright, A. L., Bony, S., Stevens, B., and Vogel, R.: Observed subcloud-layer moisture and heat budgets in the trades, J. Atmos. Sci., 79, 2363–2385, https://doi.org/10.1175/JAS-D-21-0337.1, 2022. a, b, c
Bailey, A., Aemisegger, F., Villiger, L., Los, S. A., Reverdin, G., Quinones Melendez, E., Diekmann, C. J., Galewsky, J., Noone, D., Schneider, A., and Schneider, M.: EUREC4A-iso: Full collection of isotopic measurements in water vapor, precipitation, and seawater during EUREC4A, AERIS, https://doi.org/10.25326/418, 2022. a
Bailey, A., Aemisegger, F., Villiger, L., Los, S. A., Reverdin, G., Quiñones Meléndez, E., Acquistapace, C., Baranowski, D. B., Böck, T., Bony, S., Bordsdorff, T., Coffman, D., de Szoeke, S. P., Diekmann, C. J., Dütsch, M., Ertl, B., Galewsky, J., Henze, D., Makuch, P., Noone, D., Quinn, P. K., Rösch, M., Schneider, A., Schneider, M., Speich, S., Stevens, B., and Thompson, E. J.: Isotopic measurements in water vapor, precipitation, and seawater during EUREC4A, Earth Syst. Sci. Data, 15, 465–495, https://doi.org/10.5194/essd-15-465-2023, 2023. a, b
Benetti, M., Aloisi, G., Reverdin, G., Risi, C., and Seze, G.: Importance of boundary layer mixing for the isotopic composition of surface vapor over the subtropical North Atlantic Ocean, J. Geophys. Res.-Atmos., 120, 2190-2209, https://doi.org/10.1002/2014JD021947, 2015. a
Bony, S. and Dufresne, J.-L.: Marine boundary layer clouds at the heart of tropical cloud feedback uncertainties in climate models, Geophys. Res. Lett., 32, L20806, https://doi.org/10.1029/2005GL023851, 2005. a
Bony, S. and Stevens, B.: Measuring area-averaged vertical motions with dropsondes, J. Atmos. Sci., 76, 767–783, https://doi.org/10.1175/JAS-D-18-0141.1, 2019. a
Bony, S., Stevens, B., Ament, F., Albright, A., Acquistapace, C., Aemisegger, F., Farrell, D., Galewsky, J., Giez, A., Lenschow, D., Nuijens, L., Rauber, R., Röttenbacher, J., Schnitt, S., Schulz, H., Vial, J., Winker, D., and Zhang, L.: EUREC4A: A field campaign to elucidate the couplings between clouds, convection and circulation, Surv. Geophys., 38, 1529–1568, https://doi.org/10.1007/s10712-017-9428-0, 2017. a
Bretherton, C. S. and Blossey, P. N.: Understanding Mesoscale Aggregation of Shallow Cumulus Convection Using Large-Eddy Simulation, J. Adv. Model. Earth Sy., 9, 2798–2821, https://doi.org/10.1002/2017MS000981, 2017. a
Craig, H. and Gordon, L. I.: Deuterium and oxygen-18 variations in the ocean and the marine atmosphere, in: Stable Isotopes in Oceanographic Studies and Paleotemperatures, edited by: Tongiorgi, E., Consiglio Nazionale delle Ricerche, Laboratorio di Geologia Nucleare, Pisa, Italy, 9–130, 1965. a
Galewsky, J. and Los, S. A.: M161 Continuous In-situ Water Vapor Isotopic Composition, AERIS [data set], https://doi.org/10.25326/83, 2020. a
Galewsky, J., Steen-Larsen, H. C., Field, R. D., Worden, J., Risi, C., and Schneider, M.: Stable isotopes in atmospheric water vapor and applications to the hydrologic cycle, Rev. Geophys., 54, 809–865, https://doi.org/10.1002/2015RG000512, 2016. a, b
Galewsky, J., Jensen, M. P., and Delp, J.: Marine Boundary Layer Decoupling and the Stable Isotopic Composition of Water Vapor, J. Geophys. Res.-Atmos., 127, e2021JD035470, https://doi.org/10.1029/2021JD035470, 2022. a
George, G.: JOANNE: Joint dropsonde Observations of the Atmosphere in tropical North atlaNtic meso-scale Environments, AERIS [data set], https://doi.org/10.25326/221, 2021. a
George, G., Stevens, B., Bony, S., Pincus, R., Fairall, C., Schulz, H., Kölling, T., Kalen, Q. T., Klingebiel, M., Konow, H., Lundry, A., Prange, M., and Radtke, J.: JOANNE: Joint dropsonde Observations of the Atmosphere in tropical North atlaNtic meso-scale Environments, Earth Syst. Sci. Data, 13, 5253–5272, https://doi.org/10.5194/essd-13-5253-2021, 2021. a
George, G., Stevens, B., Bony, S., Vogel, R., and Naumann, A. K.: Widespread shallow mesoscale circulations observed in the trades, Nat. Geosci., 16, 584–589, https://doi.org/10.1038/s41561-023-01215-1, 2023. a, b, c, d, e, f, g, h
Graf, P., Wernli, H., Pfahl, S., and Sodemann, H.: A new interpretative framework for below-cloud effects on stable water isotopes in vapour and rain, Atmos. Chem. Phys., 19, 747–765, https://doi.org/10.5194/acp-19-747-2019, 2019. a, b
Konow, H., Ewald, F., George, G., Jacob, M., Klingebiel, M., Kölling, T., Luebke, A. E., Mieslinger, T., Pörtge, V., Radtke, J., Schäfer, M., Schulz, H., Vogel, R., Wirth, M., Bony, S., Crewell, S., Ehrlich, A., Forster, L., Giez, A., Gödde, F., Groß, S., Gutleben, M., Hagen, M., Hirsch, L., Jansen, F., Lang, T., Mayer, B., Mech, M., Prange, M., Schnitt, S., Vial, J., Walbröl, A., Wendisch, M., Wolf, K., Zinner, T., Zöger, M., Ament, F., and Stevens, B.: EUREC4A's HALO, Earth Syst. Sci. Data, 13, 5545–5563, https://doi.org/10.5194/essd-13-5545-2021, 2021. a
Lenschow, D. H., Krummel, P. B., and Siems, S. T.: Measuring Entrainment, Divergence, and Vorticity on the Mesoscale from Aircraft, J. Atmos. Ocean. Technol., 16, 1384–1400, https://doi.org/10.1175/1520-0426(1999)016<1384:MEDAVO>2.0.CO;2, 1999. a
Lenschow, D. H., Savic-Jovcic, V., and Stevens, B.: Divergence and vorticity from aircraft air motion measurements, J. Atmos. Ocean. Technol., 24, 2062–2072, https://doi.org/10.1175/2007JTECHA940.1, 2007. a
Lilly, D. K.: Models of cloud-topped mixed layers under a strong inversion, Q. J. Roy. Meteor. Soc., 94, 292–309, https://doi.org/10.1002/qj.49709440106, 1968. a, b
Majoube, M.: Fractionnement en oxygène 18 et en deutérium entre l'eau et sa vapeur, J. Chim. Phys., 68, 1423–1436, https://doi.org/10.1051/jcp/1971681423, 1971. a, b
Merlivat, L. and Jouzel, J.: Global climatic interpretation of the deuterium-oxygen 18 relationship for precipitation, J. Geophys. Res.-Oceans, 84, 5029–5033, https://doi.org/10.1029/JC084iC08p05029, 1979. a, b, c
Pincus, R., Fairall, C. W., Bailey, A., Chen, H., Chuang, P. Y., de Boer, G., Feingold, G., Henze, D., Kalen, Q. T., Kazil, J., Leandro, M., Lundry, A., Moran, K., Naeher, D. A., Noone, D., Patel, A. J., Pezoa, S., PopStefanija, I., Thompson, E. J., Warnecke, J., and Zuidema, P.: Observations from the NOAA P-3 aircraft during ATOMIC, Earth Syst. Sci. Data, 13, 3281–3296, https://doi.org/10.5194/essd-13-3281-2021, 2021. a, b
Radtke, J., Naumann, A. K., Hagen, M., and Ament, F.: The relationship between precipitation and its spatial pattern in the trades observed during EUREC4A, Q. J. Roy. Meteor. Soci., 148, 1913–1928, https://doi.org/10.1002/qj.4284, 2022. a, b, c
Risi, C., Muller, C., and Blossey, P. N.: What Controls the Water Vapor Isotopic Composition Near the Surface of Tropical Oceans? Results from an Analytical Model Constrained by Large-Eddy Simulations, J. Adv. Model. Earth Sy., 12, e2020MS002106, https://doi.org/10.1029/2020MS002106, 2020. a, b, c
Sherwood, S. C., Bony, S., and Dufresne, J.-L.: Spread in model climate sensitivity traced to atmospheric convective mixing, Nature, 505, 37–42, https://doi.org/10.1038/nature12829, 2014. a, b, c
Stevens, B., Bony, S., Farrell, D., Ament, F., Blyth, A., Fairall, C., Karstensen, J., Quinn, P. K., Speich, S., Acquistapace, C., Aemisegger, F., Albright, A. L., Bellenger, H., Bodenschatz, E., Caesar, K.-A., Chewitt-Lucas, R., de Boer, G., Delanoë, J., Denby, L., Ewald, F., Fildier, B., Forde, M., George, G., Gross, S., Hagen, M., Hausold, A., Heywood, K. J., Hirsch, L., Jacob, M., Jansen, F., Kinne, S., Klocke, D., Kölling, T., Konow, H., Lothon, M., Mohr, W., Naumann, A. K., Nuijens, L., Olivier, L., Pincus, R., Pöhlker, M., Reverdin, G., Roberts, G., Schnitt, S., Schulz, H., Siebesma, A. P., Stephan, C. C., Sullivan, P., Touzé-Peiffer, L., Vial, J., Vogel, R., Zuidema, P., Alexander, N., Alves, L., Arixi, S., Asmath, H., Bagheri, G., Baier, K., Bailey, A., Baranowski, D., Baron, A., Barrau, S., Barrett, P. A., Batier, F., Behrendt, A., Bendinger, A., Beucher, F., Bigorre, S., Blades, E., Blossey, P., Bock, O., Böing, S., Bosser, P., Bourras, D., Bouruet-Aubertot, P., Bower, K., Branellec, P., Branger, H., Brennek, M., Brewer, A., Brilouet , P.-E., Brügmann, B., Buehler, S. A., Burke, E., Burton, R., Calmer, R., Canonici, J.-C., Carton, X., Cato Jr., G., Charles, J. A., Chazette, P., Chen, Y., Chilinski, M. T., Choularton, T., Chuang, P., Clarke, S., Coe, H., Cornet, C., Coutris, P., Couvreux, F., Crewell, S., Cronin, T., Cui, Z., Cuypers, Y., Daley, A., Damerell, G. M., Dauhut, T., Deneke, H., Desbios, J.-P., Dörner, S., Donner, S., Douet, V., Drushka, K., Dütsch, M., Ehrlich, A., Emanuel, K., Emmanouilidis, A., Etienne, J.-C., Etienne-Leblanc, S., Faure, G., Feingold, G., Ferrero, L., Fix, A., Flamant, C., Flatau, P. J., Foltz, G. R., Forster, L., Furtuna, I., Gadian, A., Galewsky, J., Gallagher, M., Gallimore, P., Gaston, C., Gentemann, C., Geyskens, N., Giez, A., Gollop, J., Gouirand, I., Gourbeyre, C., de Graaf, D., de Groot, G. E., Grosz, R., Güttler, J., Gutleben, M., Hall, K., Harris, G., Helfer, K. C., Henze, D., Herbert, C., Holanda, B., Ibanez-Landeta, A., Intrieri, J., Iyer, S., Julien, F., Kalesse, H., Kazil, J., Kellman, A., Kidane, A. T., Kirchner, U., Klingebiel, M., Körner, M., Kremper, L. A., Kretzschmar, J., Krüger, O., Kumala, W., Kurz, A., L'Hégaret, P., Labaste, M., Lachlan-Cope, T., Laing, A., Landschützer, P., Lang, T., Lange, D., Lange, I., Laplace, C., Lavik, G., Laxenaire, R., Le Bihan, C., Leandro, M., Lefevre, N., Lena, M., Lenschow, D., Li, Q., Lloyd, G., Los, S., Losi, N., Lovell, O., Luneau, C., Makuch, P., Malinowski, S., Manta, G., Marinou, E., Marsden, N., Masson, S., Maury, N., Mayer, B., Mayers-Als, M., Mazel, C., McGeary, W., McWilliams, J. C., Mech, M., Mehlmann, M., Meroni, A. N., Mieslinger, T., Minikin, A., Minnett, P., Möller, G., Morfa Avalos, Y., Muller, C., Musat, I., Napoli, A., Neuberger, A., Noisel, C., Noone, D., Nordsiek, F., Nowak, J. L., Oswald, L., Parker, D. J., Peck, C., Person, R., Philippi, M., Plueddemann, A., Pöhlker, C., Pörtge, V., Pöschl, U., Pologne, L., Posyniak, M., Prange, M., Quiñones Meléndez, E., Radtke, J., Ramage, K., Reimann, J., Renault, L., Reus, K., Reyes, A., Ribbe, J., Ringel, M., Ritschel, M., Rocha, C. B., Rochetin, N., Röttenbacher, J., Rollo, C., Royer, H., Sadoulet, P., Saffin, L., Sandiford, S., Sandu, I., Schäfer, M., Schemann, V., Schirmacher, I., Schlenczek, O., Schmidt, J., Schröder, M., Schwarzenboeck, A., Sealy, A., Senff, C. J., Serikov, I., Shohan, S., Siddle, E., Smirnov, A., Späth, F., Spooner, B., Stolla, M. K., Szkółka, W., de Szoeke, S. P., Tarot, S., Tetoni, E., Thompson, E., Thomson, J., Tomassini, L., Totems, J., Ubele, A. A., Villiger, L., von Arx, J., Wagner, T., Walther, A., Webber, B., Wendisch, M., Whitehall, S., Wiltshire, A., Wing, A. A., Wirth, M., Wiskandt, J., Wolf, K., Worbes, L., Wright, E., Wulfmeyer, V., Young, S., Zhang, C., Zhang, D., Ziemen, F., Zinner, T., and Zöger, M.: EUREC4A, Earth Syst. Sci. Data, 13, 4067–4119, https://doi.org/10.5194/essd-13-4067-2021, 2021. a
Stewart, M. K.: Stable isotope fractionation due to evaporation and isotopic exchange of falling waterdrops: Applications to atmospheric processes and evaporation of lakes, J. Geophys. Res., 80, 1133–1146, https://doi.org/10.1029/JC080i009p01133, 1975. a, b, c, d, e
Stull, R. B.: The energetics of entrainment across a density interface, J. Atmos. Sci., 33, 1260–1267, https://doi.org/10.1175/1520-0469(1976)033<1260:TEOEAD>2.0.CO;2, 1976. a
Touzé-Peiffer, L., Vogel, R., and Rochetin, N.: Cold pools observed during EUREC4A: detection and characterization from atmospheric soundings, J. Appl. Meteorol. Clim., 61, 593–610, https://doi.org/10.1175/JAMC-D-21-0048.1, 2022. a, b, c
Tremoy, G., Vimeux, F., Soumana, I., Souley, I., Risi, C., Cattani, O., Favreau, G., and Oï, M.: Clustering mesoscale convective systems with laser-based water vapor δ18O monitoring in Niamey (Niger), J. Geophys. Res.-Atmos., 119, 5079–5103, https://doi.org/10.1002/2013JD020968, 2014. a, b
Vogel, R., Albright, A. L., Vial, J., George, G., Stevens, B., and Bony, S.: Strong cloud–circulation coupling explains weak trade cumulus feedback, Nature, 612, 696–700, https://doi.org/10.1038/s41586-022-05364-y, 2022. a, b, c, d, e, f, g, h, i