
the Creative Commons Attribution 4.0 License.
the Creative Commons Attribution 4.0 License.
 | 06 Jul 2026
Temperature and radiative responses to anthropogenic aerosols over the Mediterranean Basin based on CMIP6 Earth system models
Alkiviadis Kalisoras
Prodromos Zanis
Aristeidis K. Georgoulias
Dimitris Akritidis
Robert J. Allen
Vaishali Naik
Here, we assess the amplification of near-surface warming in the Mediterranean (MED) resulting from global anthropogenic aerosol (AA) reductions, based on simulations from CMIP6 Earth system models (ESMs). The effective radiative forcing (ERF) and near-surface temperature (TAS) exhibit decreasing trends until around 1980 followed by increasing trends, driven by air pollution control policies. The annual mean ERF at the top-of-atmosphere over the MED changes by between the peak AA period (1970–1979) and the near-present period (2005–2014). During this interval, the annual mean TAS increases by 0.67±0.37 °C. Overall, the multi-model ensemble shows a robust amplification of warming over the MED on annual scale resulting from global AA reductions from 1970–1979 to 2005–2014, in good agreement with observational datasets over land. The model simulations indicate that AAs are responsible for 49 % (39 %) of the annual (summer) warming between the two periods. In the winter, ESMs produce an overestimated warming of 1.19 °C, with AAs contributing 60 % to this warming. Finally, we show that circulation changes caused by AA reductions can play an additional role in the redistribution of regional temperature changes apart from the radiative effects per se. Our results reveal a strong link between the recent acceleration of MED warming and global AA decreases, which unmask additional greenhouse gas-driven warming. This study highlights the sensitivity of the MED to recent global AA emission changes and the need for climate policies that couple air quality improvements with rapid greenhouse gas mitigation.
- Article
(16373 KB) - Full-text XML
-
Supplement
(9791 KB) - BibTeX
- EndNote


The Mediterranean Basin (MED) region is considered a hotspot of climate change (Cos et al., 2022; Lionello and Scarascia, 2018) that has experienced enhanced warming since the late 20th century, particularly during the summer (Doblas-Reyes et al., 2021; Gutiérrez et al., 2021). This trend cannot be fully explained by internal climate variability alone and can be attributed to external anthropogenic forcing (Allen et al., 2006; Hodnebrog et al., 2024; Rashid, 2021). The decrease of anthropogenic aerosols (AAs) over Europe, driven by European air pollution control policies (Turnock et al., 2016), has been linked to temperature increases in the Euro-Mediterranean region (Boé et al., 2020; Dong et al., 2017; Glantz et al., 2022; Nabat et al., 2014, 2025; Urdiales-Flores et al., 2023; Zanis et al., 2012). However, other parts of the world such as North America (primarily the U.S. with the Clean Air Act) have also reduced their AA emissions, which could also influence the European climate (Elkins et al., 2025; Yang et al., 2020). Global concentrations of AAs in the atmosphere have decreased since around the 1980s, as suggested by changes in aerosol optical depth (AOD) over Europe and Eastern North America (Cherian and Quaas, 2020; Gulev et al., 2021; Klimont et al., 2013; Wei et al., 2019). Sulfate atmospheric loads have largely reduced during the last decades (Aas et al., 2019; Gulev et al., 2021), with subsequent radiative changes (Kalisoras et al., 2024; Myhre et al., 2017a; Szopa et al., 2021).
Global AA decrease has caused changes in the Earth's radiative budget, which are expressed in terms of the effective radiative forcing (ERF) (Forster et al., 2021; Hansen et al., 2005; Sherwood et al., 2015). According to the Intergovernmental Panel on Climate Change (IPCC) Sixth Assessment Report (AR6) WGI (Forster et al., 2021; Gulev et al., 2021; Szopa et al., 2021), the ERF caused by AAs at the top-of-atmosphere (TOA) was negative throughout the industrial period over Europe, with a shift by the late 1970s–early 1980s towards less negative values and a weakening of the negative ERF in the first decades of the 21st century. Parallel to ERF weakening, an increase in shortwave radiation reaching the surface, a phenomenon referred to as the “brightening effect” (Wild, 2009, 2012), has been observed over Europe and the MED (Alexandri et al., 2017; Galanaki et al., 2021; MedECC, 2020; Nabat et al., 2014; Sanchez-Lorenzo et al., 2015; Wild, 2012). Arguably this can be attributed to reductions in sulfate aerosols (Allen et al., 2013; Nabat et al., 2014), which scatter incoming solar shortwave radiation and interact with clouds (Bellouin et al., 2020; Kasoar et al., 2016; Myhre et al., 2013).
A number of recent studies used observational datasets, reanalysis products, and global and regional climate models (GCMs and RCMs, respectively) to examine the enhanced surface warming and increase in temperature extremes over the Euro-Mediterranean region due to reductions in global AAs, which earlier had masked the continuous warming from greenhouse gases until around the 1980s (Boé et al., 2020; Cos et al., 2022; Dong et al., 2017; Drugé et al., 2021; Feng and Qian, 2024; Glantz et al., 2022; Hodnebrog et al., 2024; Nabat et al., 2014, 2025; Navarro et al., 2017; Samset et al., 2018; Tian et al., 2020; Urdiales-Flores et al., 2023). Decreases in AAs caused radiative imbalances over Europe and a shift from dimming to brightening, which was linked to increased warming at the surface (Folini and Wild, 2011; Glantz et al., 2022; Hodnebrog et al., 2024; Nabat et al., 2014, 2025; Sanchez-Lorenzo et al., 2015). Dong et al. (2017) showed that near-surface temperature and temperature extremes have increased since the 1990s in Western Europe during the summer, with AAs playing a key factor. Glantz et al. (2022) found an increase of about 1 °C attributed to AA decreases between the months April and September during the period 1979–2020 over Central and Eastern Europe. According to Nabat et al. (2025), each 0.1 reduction in AOD over Central Europe led to a 0.3 °C rise in near-surface temperature. In an earlier study, Nabat et al. (2014) showed that AA changes explain 81±16 % of the brightening and 23±5 % of the surface warming simulated for the period 1980–2012 over the European region based on reanalysis-driven coupled regional climate model. Turnock et al. (2016) estimated a mean surface temperature increase of around 0.45±0.11 °C over Europe between 1970 and 2010 from European AA reduction measures. Urdiales-Flores et al. (2023) carried out an attribution analysis to understand the drivers of accelerated warming since the 1980s over the MED (based on observations, the median trend for 1981–2020 exceeded 0.4 °C per decade). They calculated a surface warming of 0.10 °C per decade over the MED for the period 1981–2020 attributed to AOD reductions, while they attributed 0.18 °C per decade to radiative forcing from well-mixed greenhouse gases and 0.03 °C per decade to soil moisture decrease. Boé et al. (2020) investigated summer temperature changes over Europe using global and regional climate models, and assessed the influence of AAs in surface warming with sensitivity experiments (also discussed in Boé, 2016). Yang et al. (2020) examined the trends of AAs over Europe during 1980–2018 and found a warming of 2.0 W m−2 in Europe due to local decreases in sulfate loading, with 12 % attributed to changes in non-European emissions. However, circulation changes attributed to reduced AA emissions also play an important role in near-surface temperature changes over Europe (Delworth et al., 2022; Dong and Sutton, 2021; Nabat et al., 2020; Zanis, 2009).
Despite the plethora of studies investigating aerosol-driven changes over the Euro-Mediterranean region, there still remain several knowledge gaps: (a) how do global climate models simulate the Mediterranean response to global anthropogenic aerosol emission changes on basin-wide scale, (b) how do changes in aerosol optical depth, the radiative budget, and atmospheric circulation translate to horizontal and vertical temperature changes over the Mediterranean, (c) how well do climate models perform when simulating the observed land temperature amplification on annual and seasonal scales?
This study aims to highlight the sensitivity of the Mediterranean region to global emission changes of anthropogenic aerosols by building on existing knowledge. We address the aforementioned knowledge gaps using high-complexity, state-of-the-art Earth system models (ESMs) endorsed by the sixth phase of the Coupled Model Intercomparison Project (CMIP6) (Eyring et al., 2016) to investigate temperature changes over the Mediterranean Basin in terms of radiative and circulation changes throughout the historical period, focusing on two periods of interest: the decade that AAs peak over Europe (1970–1979) and the near-present decade (2005–2014). To our knowledge, this is the first study that calculates changes in TOA and surface radiative fluxes to quantify fast and transient (i.e., a mixture of fast and incomplete slow responses from coupled-ocean simulations) radiative responses resulting from global changes in AA emissions and tries to connect them with changes in temperature both at the surface and throughout the troposphere on annual and seasonal scales. Furthermore, AA-induced changes to atmospheric circulation are examined in an effort to explain temperature changes not related to AA radiative effects. Finally, observational datasets are used to evaluate the temperature changes over the MED simulated by ESMs on both annual and seasonal scales. The rest of the paper is structured as follows. Details about the CMIP6 ESMs and simulations used, along with a description of our methodology, are given in Sect. 2. Our results are discussed in Sect. 3, while in Sect. 4 the main conclusions of our work are summarized.
2.1 Data description
In this work, historical simulations from eight ESMs were used (Table 1), which were performed within the framework of the Aerosol Chemistry Model Intercomparison Project (AerChemMIP; Collins et al., 2017) and supported by CMIP6 (Eyring et al., 2016). Anthropogenic emissions of aerosols as well as precursors of aerosols and ozone (excluding methane) used by climate models are taken from van Marle et al. (2017) and Hoesly et al. (2018), while each model uses its own natural aerosol (e.g., dust and sea salt) emissions. All models include both aerosol indirect effects (i.e., the cloud albedo effect and the cloud lifetime effect) (Albrecht, 1989; Twomey, 1974, 1977), except for CNRM-ESM2-1 which only represents the cloud albedo effect (and hence is lacking a cloud lifetime effect). Additionally, MRI-ESM2-0 and NorESM2-LM parameterize aerosol effect on ice clouds, thus impacting the LW ERF (e.g., Smith et al., 2020; Zelinka et al., 2023). A short description of each ESM is given in the Appendix.
Table 1Information on model resolution (horizontal and vertical), variant label, and references for each ESM used in this study. Each experiment (see Table 2) has a
variant label raibpcfd, where a is the realization index, b is the initialization index, c is the physics index, and d is the forcing index.
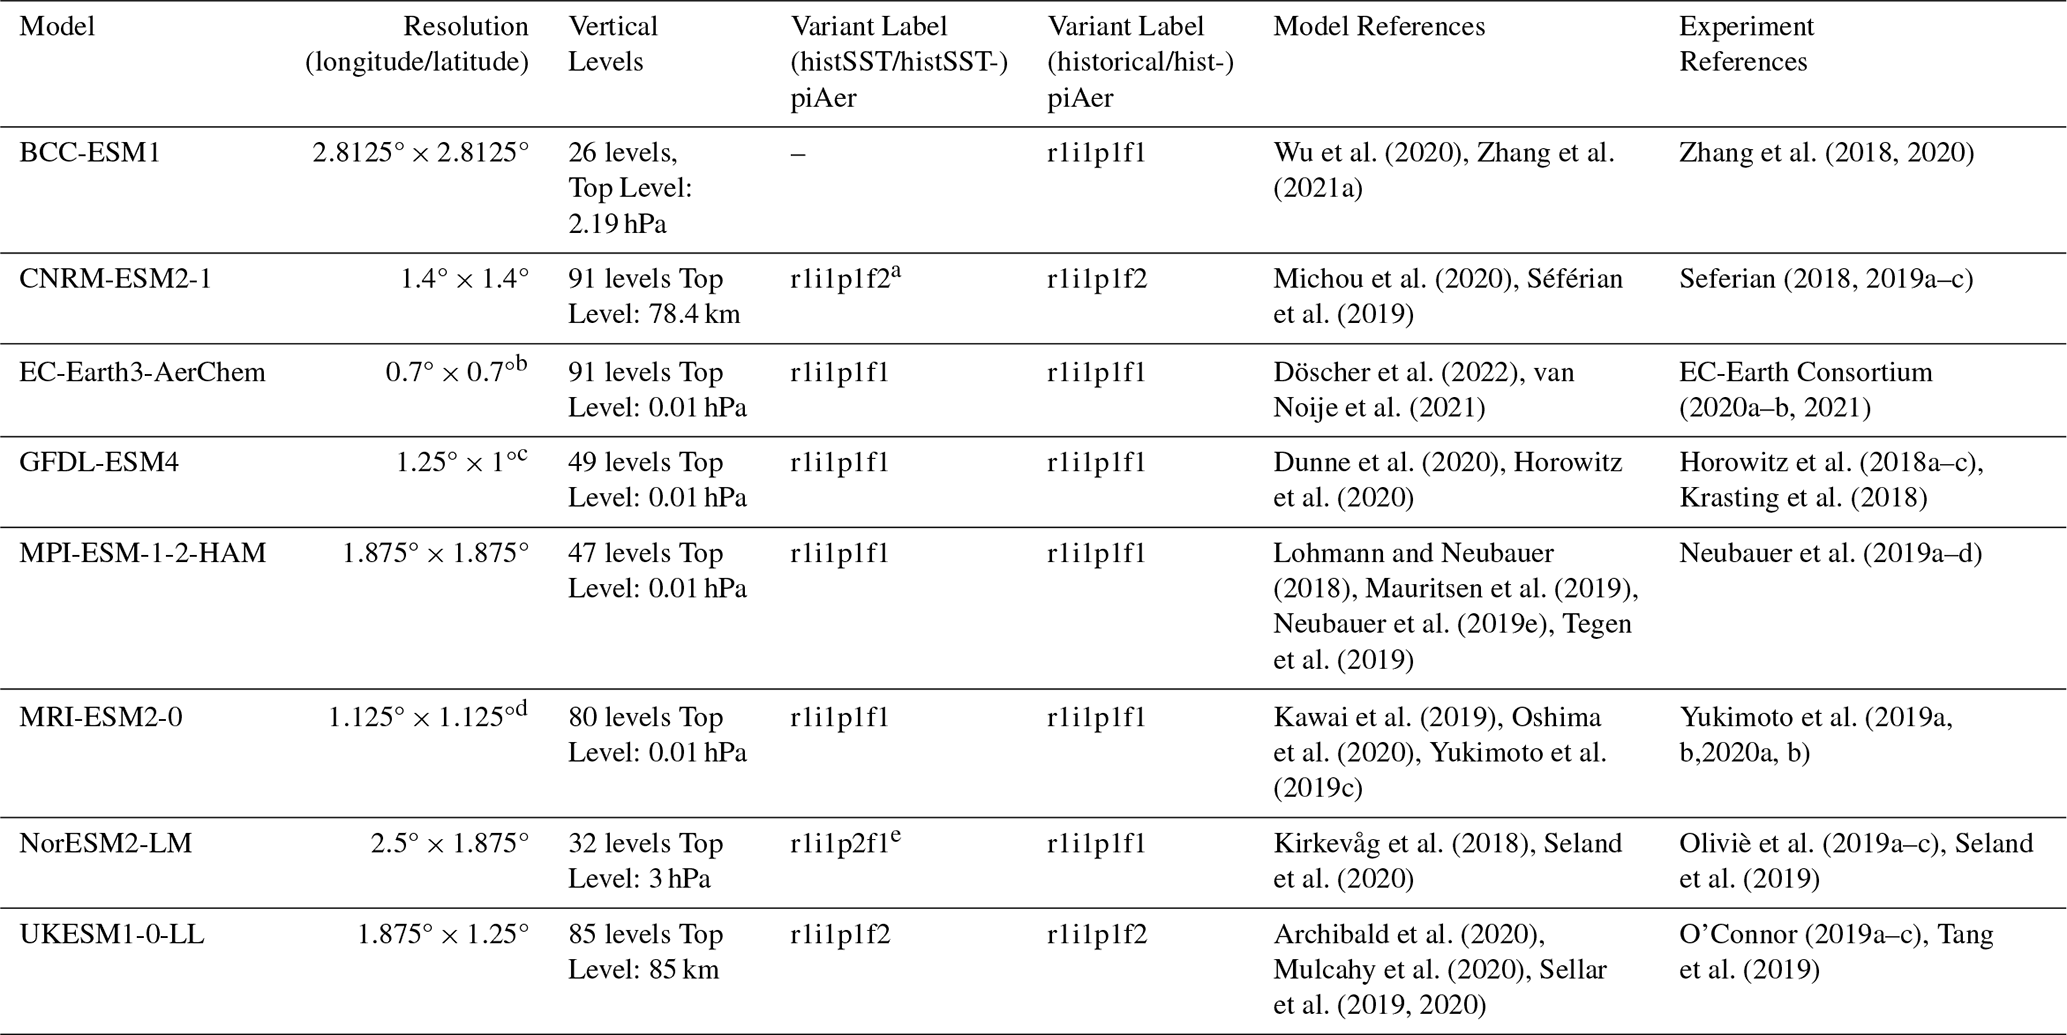
a The hist-piAer simulation is identical to the hist-piNTCF simulation as CNRM-ESM2-1 has no tropospheric chemistry, and therefore no ozone precursors, which means that the two configurations (hist-piAer and hist-piNTCF) are identical.b The 0.7°×0.7° is approximate for the TL255 grid of IFS. Aerosols and atmospheric chemistry are simulated with the Tracer Model version 5 (TM5) with horizontal resolution 3°×2° (lon × lat), with 34 levels in the vertical and a model top at about 0.1 hPa.c GFDL-ESM4 uses a cubed-sphere grid with ∼100 km resolution (1o nominal horizontal resolution). Results are regridded to a 1.25°×1° (lon × lat) grid for analysis.d The 1.125°×1.125° is approximate for the MRI-AGCM3.5. Aerosols are simulated with the Model of Aerosol Species in the Global Atmosphere mark-2 revision 4-climate (MASINGAR mk-2r4c) with horizontal resolution 1.875°×1.875° (lon × lat), 80 vertical levels and a model top at 0.01 hPa.e The distinction between p1 and p2 exists only for prescribed-SST simulations. These versions differ slightly in the treatment of the fluxes of energy, moisture, and momentum at the surface between the ocean and the atmosphere. The treatment of these fluxes in the p2 prescribed-SST simulations is closest to the fully-coupled (including active ocean) simulations. The p1 prescribed-SST simulations have a slightly different formulation of these fluxes (the flux calculation here corresponds more with the standard flux calculation in CESM2). Hence, the p2 version is closest related to the fully-coupled simulation (Dirk Olivié, personal communication, 2023).
Within the framework of CMIP6 and AerChemMIP ESMs performed two sets of transient historical experiments for the period between 1850 and 2014 (Table 2). The first set includes the CMIP6 historical (Eyring et al., 2016) and hist-piAer coupled-ocean experiments, and the second set includes the histSST and histSST-piAer experiments with prescribed sea surface temperatures (SSTs) and sea ice (Collins et al., 2017). The historical experiment branches from the piControl experiment and is forced by time-evolving, externally imposed anthropogenic and natural forcings that are based on observations, such as solar variability, volcanic aerosols, and changes in land use and greenhouse gas and aerosol emissions or concentrations. The histSST experiment shares the same forcings as the historical and SSTs and sea ice are prescribed to the monthly mean time-evolving values from the corresponding historical simulation of each model. Including evolving SSTs, rather than using a fixed repeating climatology throughout the simulation, means that the underlying climate state in histSST is consistent with the historical experiment. The hist-piAer and histSST-piAer experiments are identical to historical and histSST, respectively, but they use fixed pre-industrial anthropogenic aerosol and aerosol precursor emissions corresponding to the year 1850, while all other forcings remain the same.
Table 2List of transient historical simulations covering the historical period (1850–2014) used in this work. The histSST and histSST-piAer experiments use prescribed SSTs and sea ice, whereas in the historical and hist-piAer experiments SSTs are allowed to evolve. The year indicates that the emissions or concentrations are fixed to that year, while “Hist” means that the concentrations or emissions evolve as for the historical experiment (more information in Collins et al., 2017; Eyring et al., 2016).

To evaluate the near-surface air temperature evolution in CMIP6 coupled-ocean experiments, three gridded observational datasets (Schneider et al., 2013) were employed: (a) the Berkeley Earth (https://berkeleyearth.org/data/, last access: 13 June 2025) dataset (Rohde and Hausfather, 2020), which provides high-resolution (1°×1°) monthly global land-ocean temperature data starting from the year 1850, (b) the Climatic Research Unit of the University of East Anglia (https://crudata.uea.ac.uk/cru/data/hrg/, last access: 13 June 2025) gridded Time Series (CRU TS v4.08) (Harris et al., 2020), which offers a high-resolution (0.5°×0.5°) monthly grid of land-based observations going back to 1901, and (c) the University of Delaware land temperature monthly gridded data (v4.01) at high resolution (0.5°×0.5°) beginning in 1900 and provided by the National Oceanic and Atmospheric Administration (NOAA) Physical Sciences Laboratory (PSL), Boulder, Colorado, USA, from their website (https://psl.noaa.gov, last access: 13 June 2025). The CRU TS and University of Delaware datasets contained absolute temperature values (in °C). The Berkley Earth dataset contained temperature anomalies relative to the 1951–1980 baseline climatology, which were converted to absolute temperature values (in °C).
2.2 Calculation methodology
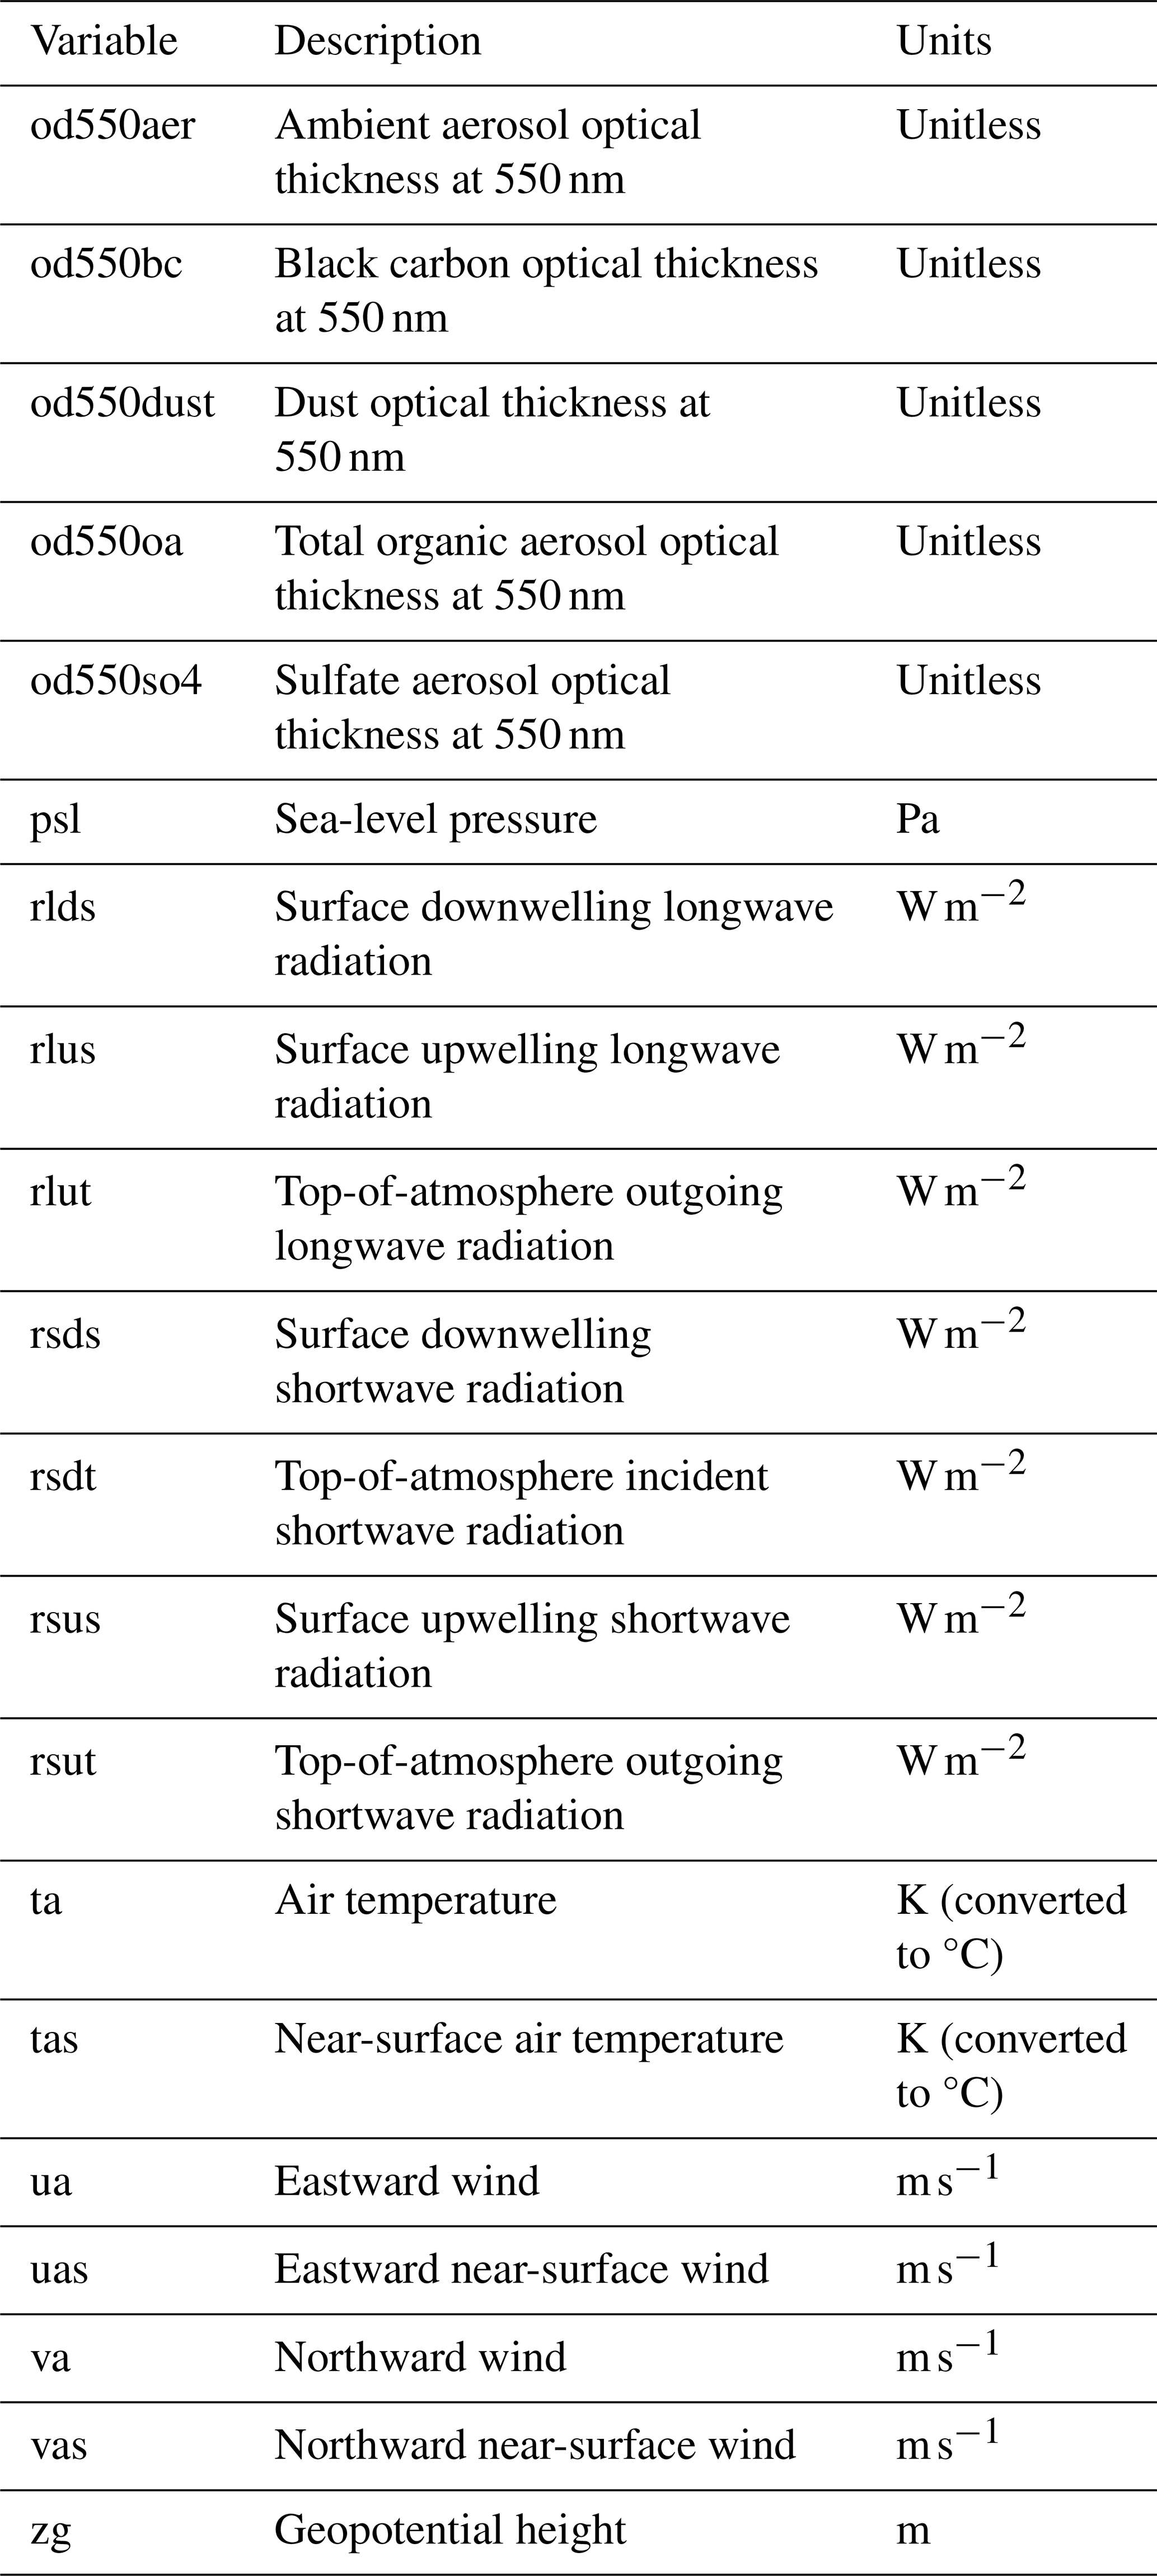
In this work, monthly outputs from the ESM simulations were used (summarized in Table 3). All data were first regridded to a common spatial grid (2.8125°×2.8125°) by applying bilinear interpolation. The effects of changes in global anthropogenic emissions of aerosols on AOD, near-surface air temperature (TAS), and circulation (sea level pressure, geopotential height, and winds) were calculated by subtracting hist-piAer from the historical simulation (i.e., the coupled experiments).
The transient aerosol ERF was calculated over the historical period using experiments with prescribed SSTs and sea ice. By fixing SSTs and sea ice, all other parts of the system are allowed to respond until reaching steady state (Hansen et al., 2005; Sherwood et al., 2015). While not technically an ERF (since SSTs and sea ice are evolving), the impact of transient SSTs and sea ice on ERF is regarded to be small (Collins et al., 2017; Forster et al., 2016). Here, ERF was estimated at the top-of-atmosphere (ERFTOA) and at the surface (ERFSURF) following Forster et al. (2016). ERFTOA was calculated as the difference between the incoming and outgoing radiative fluxes at the top-of-atmosphere (Eq. 1), while ERFSURF as the difference between the surface downwelling and upwelling radiative fluxes (Eq. 2):
where FTOA and FSURF are the net (downward minus upward) radiative fluxes at the top-of-atmosphere and at the surface, respectively, and Δ denotes the difference between the perturbation and the control experiment (histSST minus histSST-piAer).
Supplementarily with ERF, we calculated the AA-induced change in net radiative fluxes at the top-of-atmosphere and the surface (denoted as and , respectively) using the same equations as above and by taking the difference between historical and hist-piAer this time. While ERF depicts the radiative perturbation caused by AAs after accounting for rapid adjustments and fast climate responses (since SSTs and sea ice are prescribed), the net radiative flux differences calculated from the coupled-ocean experiments ( and ) quantify a quasi–radiative forcing caused by AAs, accounting for a mixture of fast and incomplete slow responses (due to climate feedbacks and ocean heat uptake) under the evolving transient historical conditions. Hence, the temperature differences from the coupled-ocean experiments represent transient climate responses being far from an equilibrium state (in which the initial radiative aerosol perturbation will be fully absorbed by the climate system response), since the ocean does not have enough time to fully equilibrate to the evolving historical forcings.
The statistical significance of each ESM's results was tested at the 95 % confidence level using a two-tailed t-test. The robustness of the multi-model ensemble results was estimated using a comprehensive method based on statistical significance and the agreement between ESMs on the sign of change. In cases where at least 80 % (i.e., at least 6 out of 8) of the ESMs show statistically significant change and at least 80 % of the ESMs agree with the multi-model mean on the sign of change, then these results are considered robust. If less than 80 % (i.e., 5 or less out of 8) of the ESMs show not statistically significant change or less than 80 % of the models do not agree with the multi-model mean on the sign of change, then they are characterized as non-robust or conflicting, respectively.
Here, we give emphasis on inter-model variability, and the robustness of the multi-model ensemble results was estimated using a comprehensive method based on statistical significance and the agreement between ESMs on the sign of change. This is a common approach of quantifying uncertainty, and particularly inter-model uncertainty (e.g., Liu et al., 2018; Myhre et al., 2017b; Samset et al., 2018; Szopa et al., 2021). Calculating the multi-model ensemble mean reduces internal model variability, as the averaging suppresses the random/internal component of each individual model (since internal variability is largely uncorrelated across the different models) and enhances the common forced signal. It should be stressed that, although the multi-model mean dampens internal variability, there is still need of further analysis using long-term ensemble of piControl experiments (or ensemble spread) for each model to evaluate whether the remaining signal is statistically distinguishable from noise (Collins et al., 2017). The accurate assessment of individual model uncertainty related to model internal variability would require initial condition large ensemble members from single models (Jones et al., 2024; Parsons et al., 2020).
To study the effects caused by global AA reduction, two periods were selected: (a) 1970–1979, which corresponds to the peak aerosol decade over Europe, and (b) 2005–2014 as the last decade available in CMIP6 historical simulations which represents the near-present. When examining a single period (1970–1979 or 2005–2014), changes reflect the effect of AAs relative to the pre-industrial period, whereas the difference between the two periods (2005–2014 minus 1970–1979) represents the effects of AA decreases since around 1980. In the next section, the multi-model ensemble results are presented for the study region (10° W–40° E, 30–45° N). Area-weighted mean values refer to the multi-model means unless stated otherwise.
3.1 Temporal evolution of AOD and radiative changes
AA concentrations peaked in the late 1970s to early 1980s in Europe and the MED. Consequently, AOD change reached a maximum during that period (Fig. 1, left column). The AOD maximum is larger in magnitude during the boreal summer (JJA) than the winter (DJF).
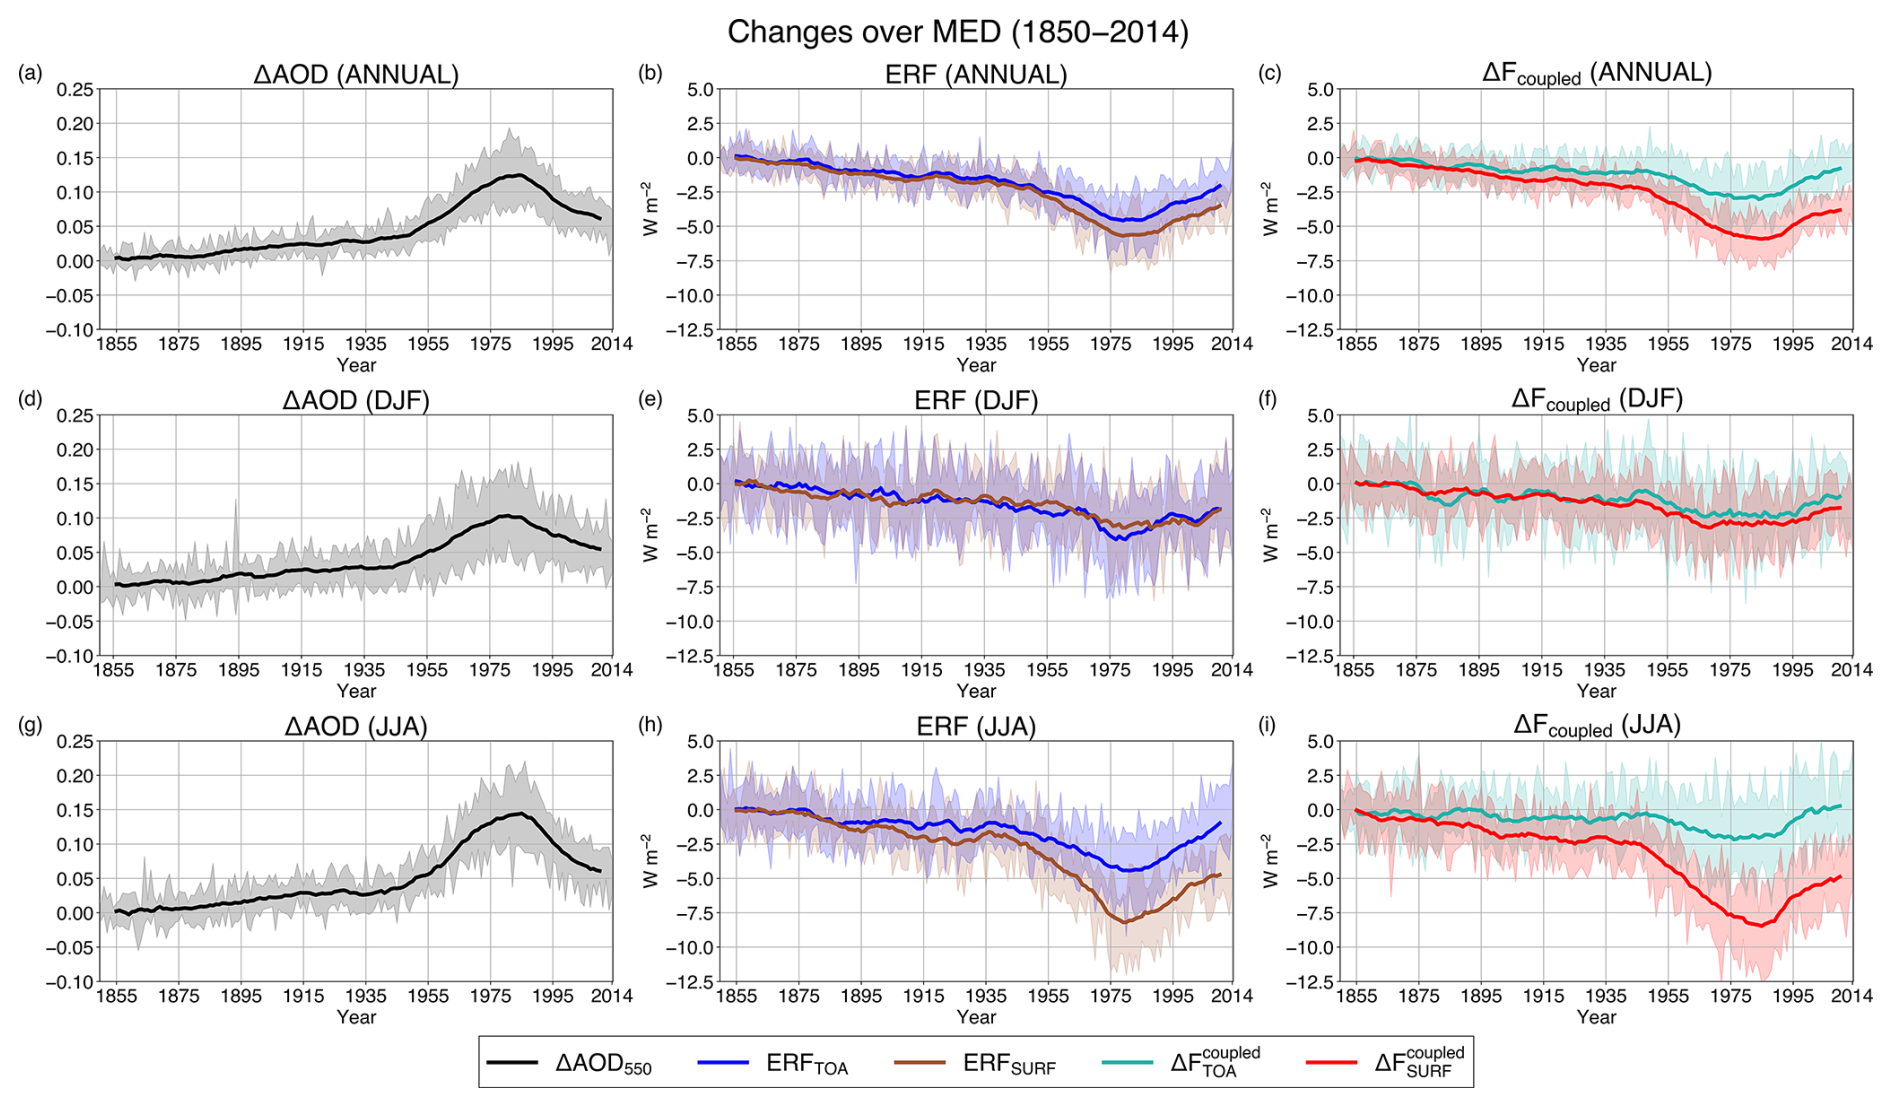
Figure 1Timeseries of the AA-induced evolution of aerosol optical depth (ΔAOD; left column), effective radiative forcing (ERF; middle column), and radiative flux change (ΔFcoupled; right column) over the Mediterranean region (10° W–40° E, 30–45° N) for the historical period (1850–2014) on an annual scale (top row) and in boreal winter (DJF; middle row) and summer (JJA; bottom row). Changes in AOD and ΔFcoupled were calculated from the difference historical minus hist-piAer, whereas ERF from the difference histSST minus histSST-piAer. The lines represent the 10 year moving average, while shading expresses the inter-model variability (one standard deviation).
Likewise, the transient annual mean ERF both at TOA and the surface attained its most negative values during the late 1970s to early 1980s, dominated by the evolution of ERF in JJA (Fig. 1, middle column). In DJF both ERFs (ERFTOA and ERFSURF) are weaker in magnitude than in JJA resulting from less incoming radiation. In the winter ERFSURF becomes weaker than ERFTOA during 1975–1985, which is not the case for the summer or annual ERFs. Inter-model variability is large in DJF, with values reaching up to around during the negative peak.
In a similar manner, the annual mean ΔFcoupled both at TOA and the surface show a trend towards more negative values until around the mid-1980s followed by a reverse positive trend afterwards (Fig. 1, right column). The annual mean is weaker in magnitude than ERFTOA as the climate system has partly adjusted to the AA-induced radiative perturbation through ongoing slow responses and changes in land and ocean temperatures. A weakening in magnitude can be seen towards the end of the historical period, driven by the evolution of their shortwave (SW) rather than their longwave (LW) component (not shown). and show smaller changes throughout the historical period during the winter than during the summer. In JJA, attains its most negative values in the late 1970s – early 1980s, while exhibits the most negative peak in the mid-1980s, slightly later than ERFSURF. Overall, the SW component practically drives the negative ΔFcoupled and its temporal evolution. This can be explained by the evolution of the AOD of sulfate aerosols over the MED (Fig. S1 in the Supplement), which is the dominant AA type and closely follows the trend of total AOD (Fig. 1). Changes in the AOD of other types of AAs are nearly an order of magnitude smaller than those of sulfates, while dust aerosols show little to no change (see also Haugvaldstad et al., 2025). This reveals that sulfates are the main driver of AOD change, consequently affecting ERF and ΔFcoupled. However, interactions between aerosols and clouds could also play a role in the simulated radiative changes at TOA.
The temporal evolution of the above quantities is in line with previous studies suggesting that reductions in (mainly sulfate) AOD led to increased SW radiation reaching the surface (enhanced brightening effect) over the Euro-Mediterranean region since the 1980s (e.g., Glantz et al., 2022; Nabat et al., 2014, 2025; Sanchez-Lorenzo et al., 2015). Global reductions in sulfate emissions have a significant effect over Europe and cause a positive radiative forcing, which is linked to surface warming, in agreement with the findings of Yang et al. (2020).
3.2 Spatial pattern of AOD changes
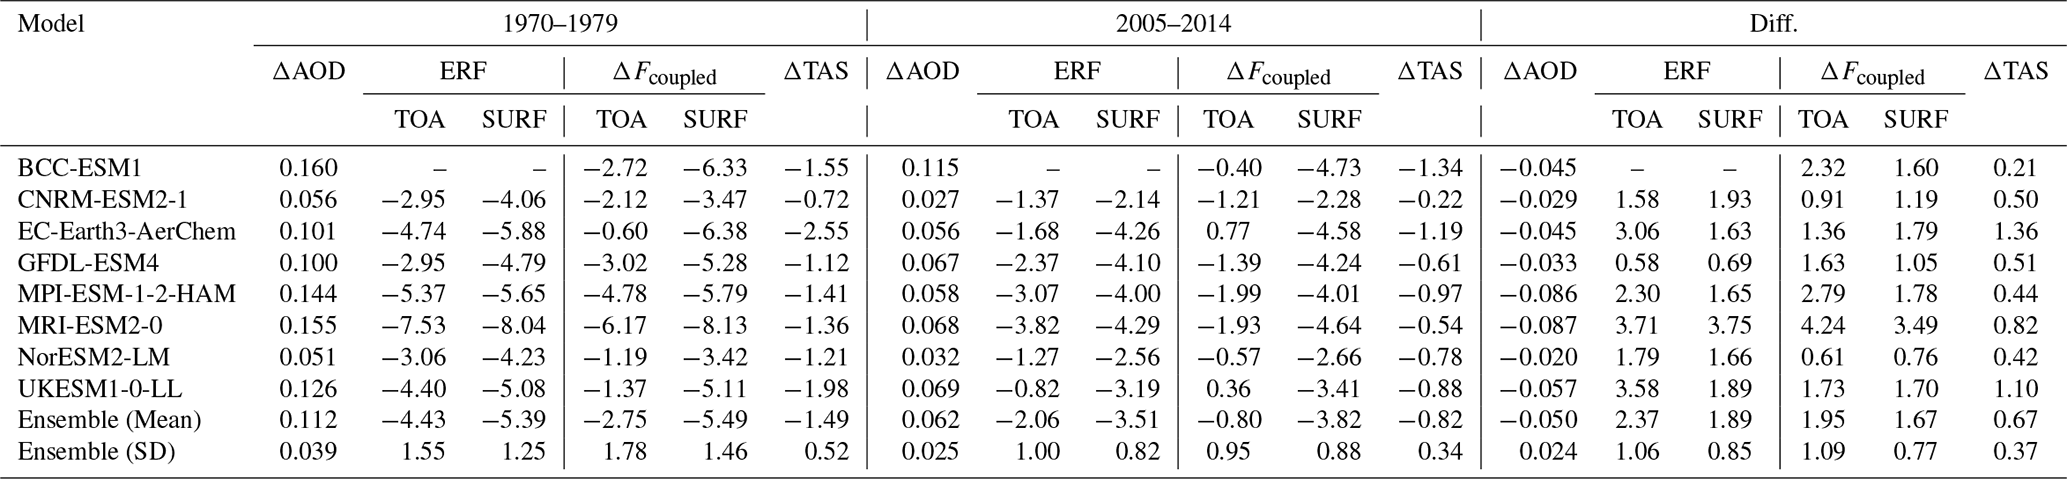
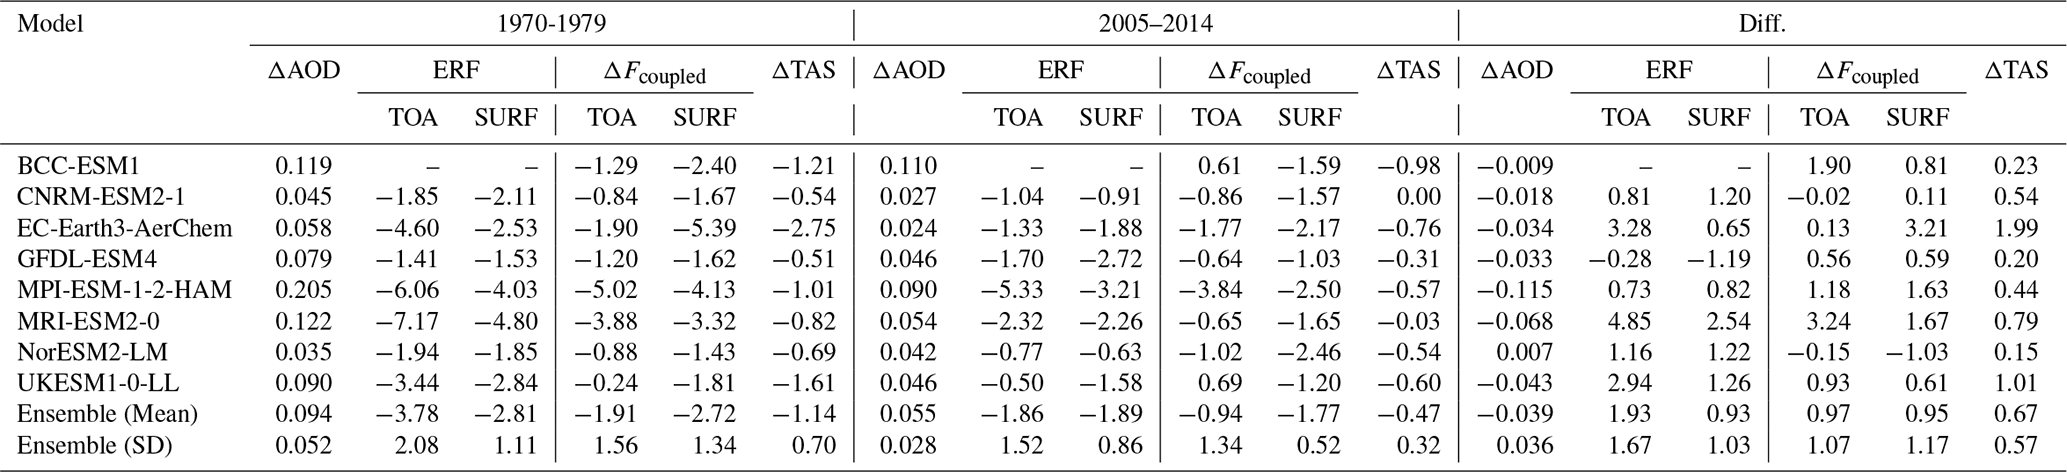
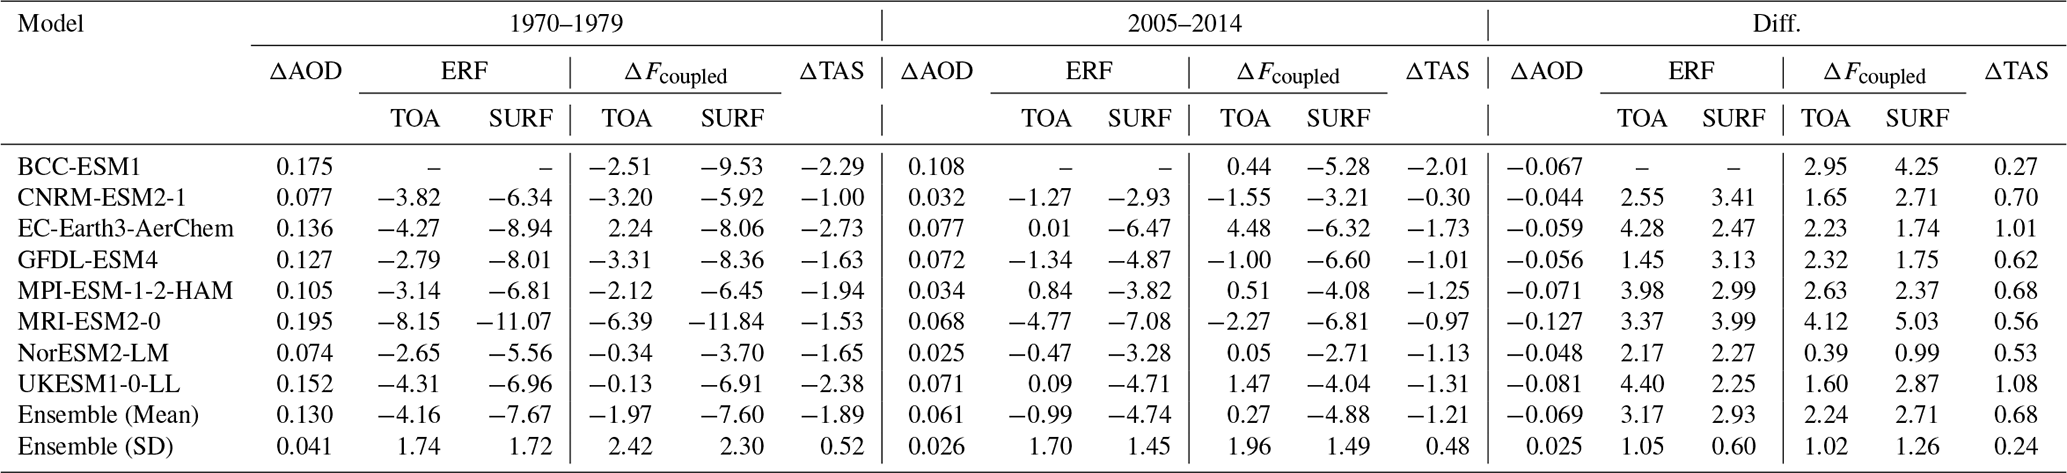
High emissions of AAs and their precursors in the period 1970–1979 over Europe have led to an increase in AOD mainly in Central Europe and its surrounding regions relative to the pre-industrial period, thus increasing AOD in the northern parts of the MED (Fig. 2). The annual mean AOD change due to AAs during 1970–1979 over the MED is 0.11±0.04 (inter-model variability; 1 standard deviation), with changes being slightly larger (smaller) in magnitude in JJA (DJF). Changes in AA emissions and concentrations have led to reductions in AOD in 2005–2014 (with respect to 1970–1979) in Central European regions and consequently in the MED of annually, with the largest AOD reductions shown in JJA (). Spatially, Southeastern Europe (Balkan Peninsula) shows the largest annual and seasonal AOD changes between the periods 1970–1979 and 2005–2014 within the MED region. These results are in line with the findings of Aas et al. (2019) and Cherian and Quaas (2020) over the Euro-Mediterranean region. Our multi-model results are robust for most of the MED (except the southern and western parts) on both annual and seasonal scales. The MPI-ESM-1-2-HAM and MRI-ESM2-0 models show the largest AOD change between the two periods (−0.086 and −0.087, respectively; Table 4), with the former exhibiting the largest change in DJF (−0.115; Table 5) and the latter in JJA (−0.127; Table 6).
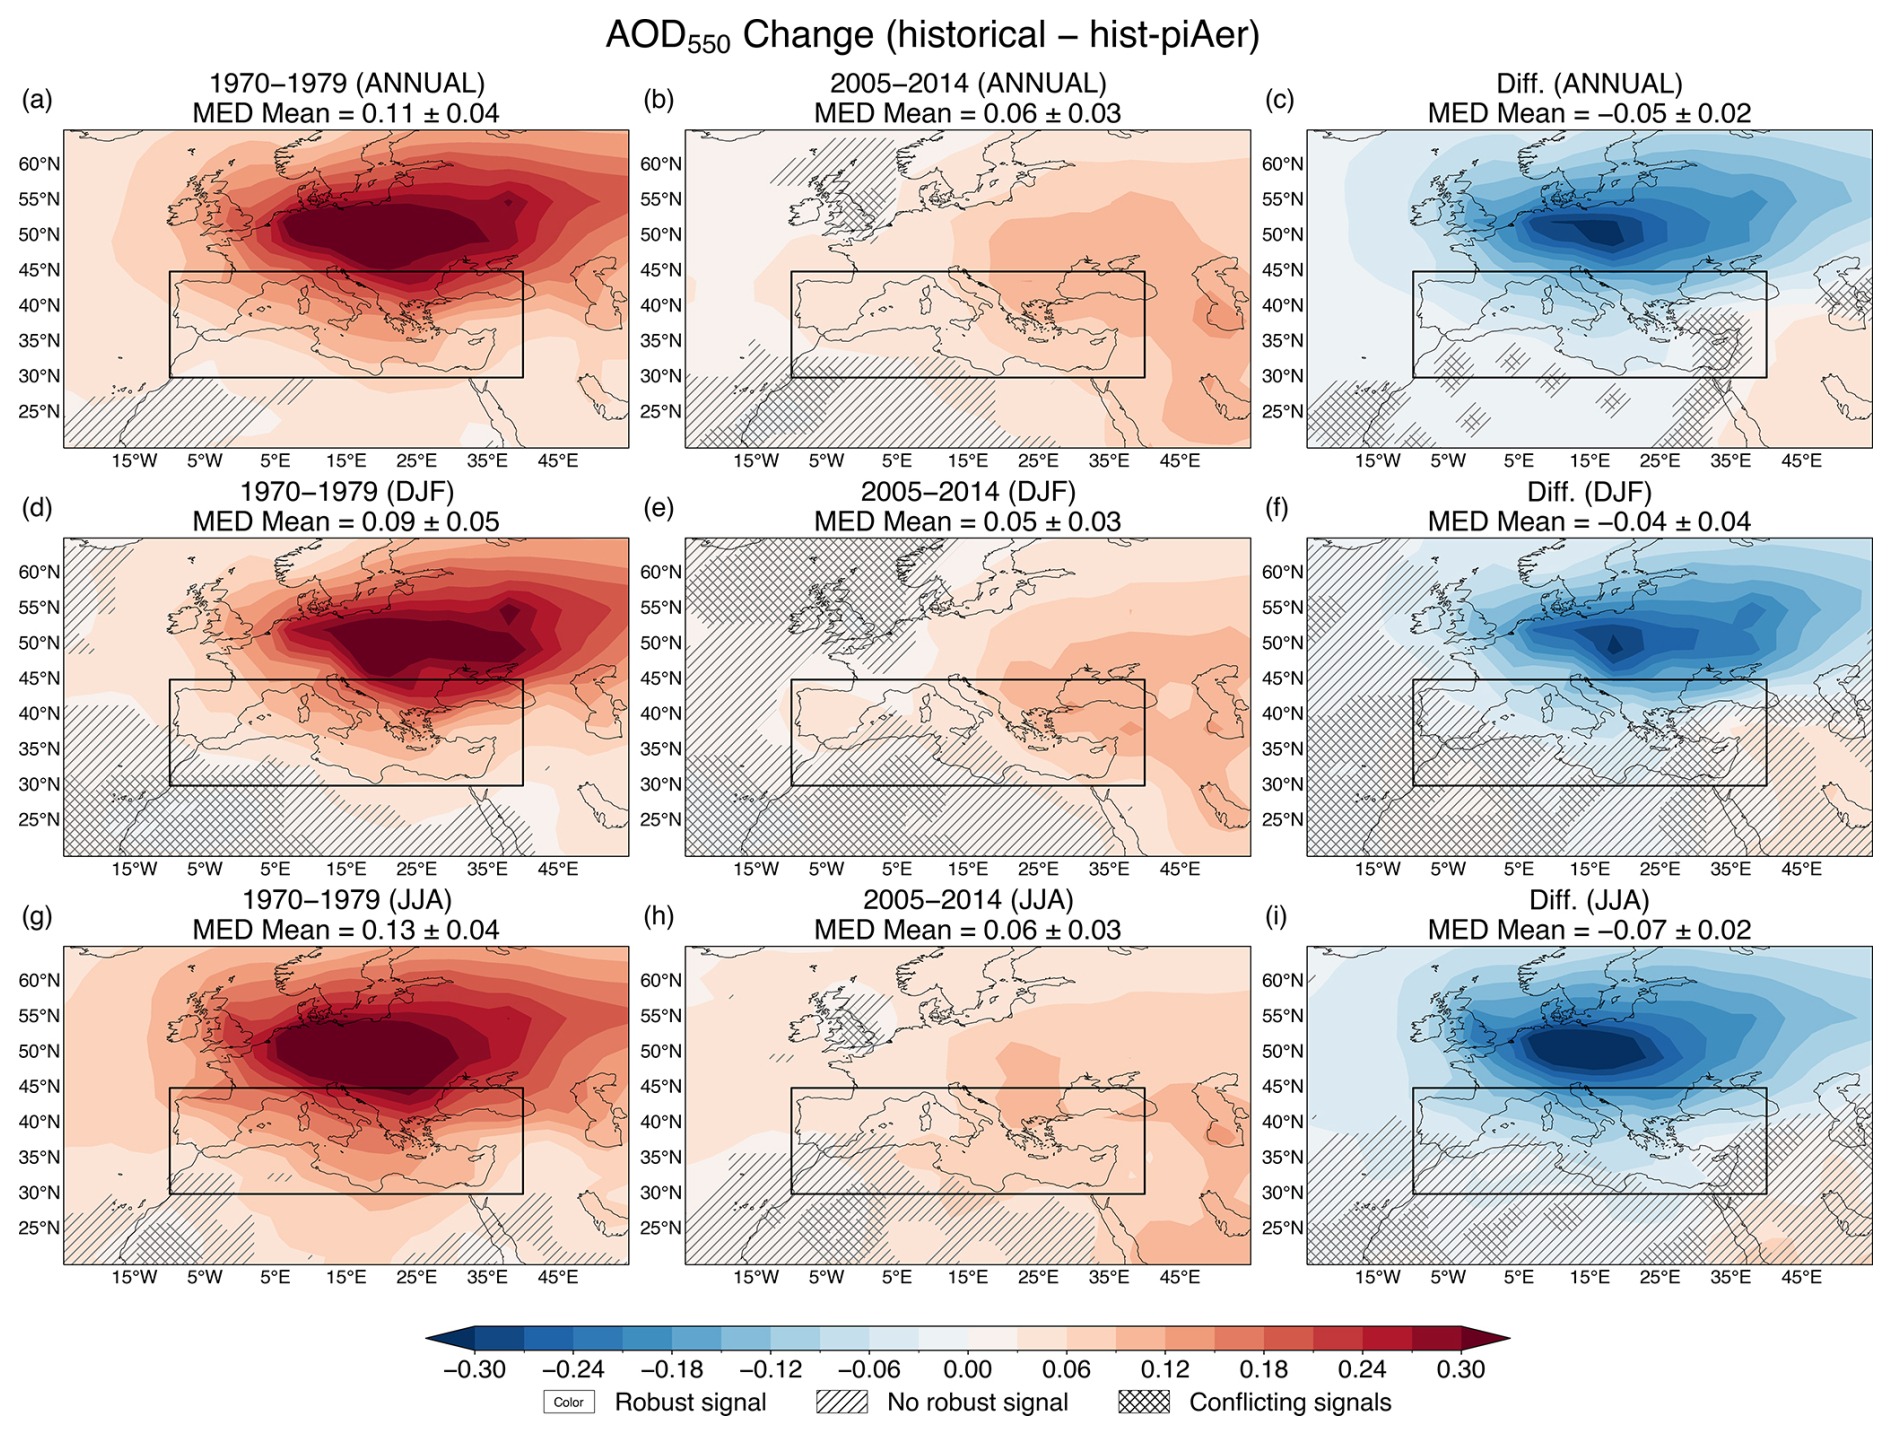
Figure 2Changes in AOD due to anthropogenic aerosols over the Mediterranean (calculated from the difference historical minus hist-piAer). Spatial patterns are presented for the periods 1970–1979 (left column), 2005–2014 (middle column) and their difference (2005–2014 minus 1970–1979; right column) on an annual scale (top row) and in boreal winter (DJF; middle row) and summer (JJA; bottom row). The multi-model ensemble means over the Mediterranean region (shown as a box) are shown along with the inter-model variability (one standard deviation) at the top of each panel. Colored areas without markings indicate robust changes, while hatched () and cross-hatched (×) areas indicate non-robust changes and conflicting signals, respectively.
Table 4Annual mean values of AOD change (ΔAOD; unitless), ERF at TOA and at the surface (in W m−2), ΔFcoupled at TOA and at the surface (in W m−2), and near-surface air temperature change (ΔTAS; in °C) over the Mediterranean for the periods 1970–1979, 2005–2014 and their difference (2005–2014 minus 1970–1979). Values are presented for each model, along with the multi-model ensemble mean and the inter-model variability (one standard deviation; SD).
3.3 Spatial pattern of ERF changes
ERFTOA spatial patterns are presented in Fig. 3, while ERFSURF spatial patterns are illustrated in Fig. S2 in the Supplement. AAs exert a negative ERFTOA over Central Europe in 1970–1979 relative to the pre-industrial period on annual scale (Fig. 3). ERFTOA greatly increases in magnitude in JJA and spreads mainly over the eastern and partly over the western and northern parts of Europe. However, it weakens in DJF and relocates over the MED. During the summer the largely negative ERFTOA over regions north of the MED is offset by the positive ERFTOA over the Sahara Desert, leading to a multi-model mean ERFTOA of over the MED. This is slightly weaker than the annual mean of . ERFSURF exhibits a spatial pattern that is very similar to ERFTOA, but it is stronger (i.e., more negative) due to the more negative ERFSURF over Africa (Fig. S2). Unlike ERFTOA, ERFSURF in JJA is larger in magnitude than the annual mean ERFSURF.
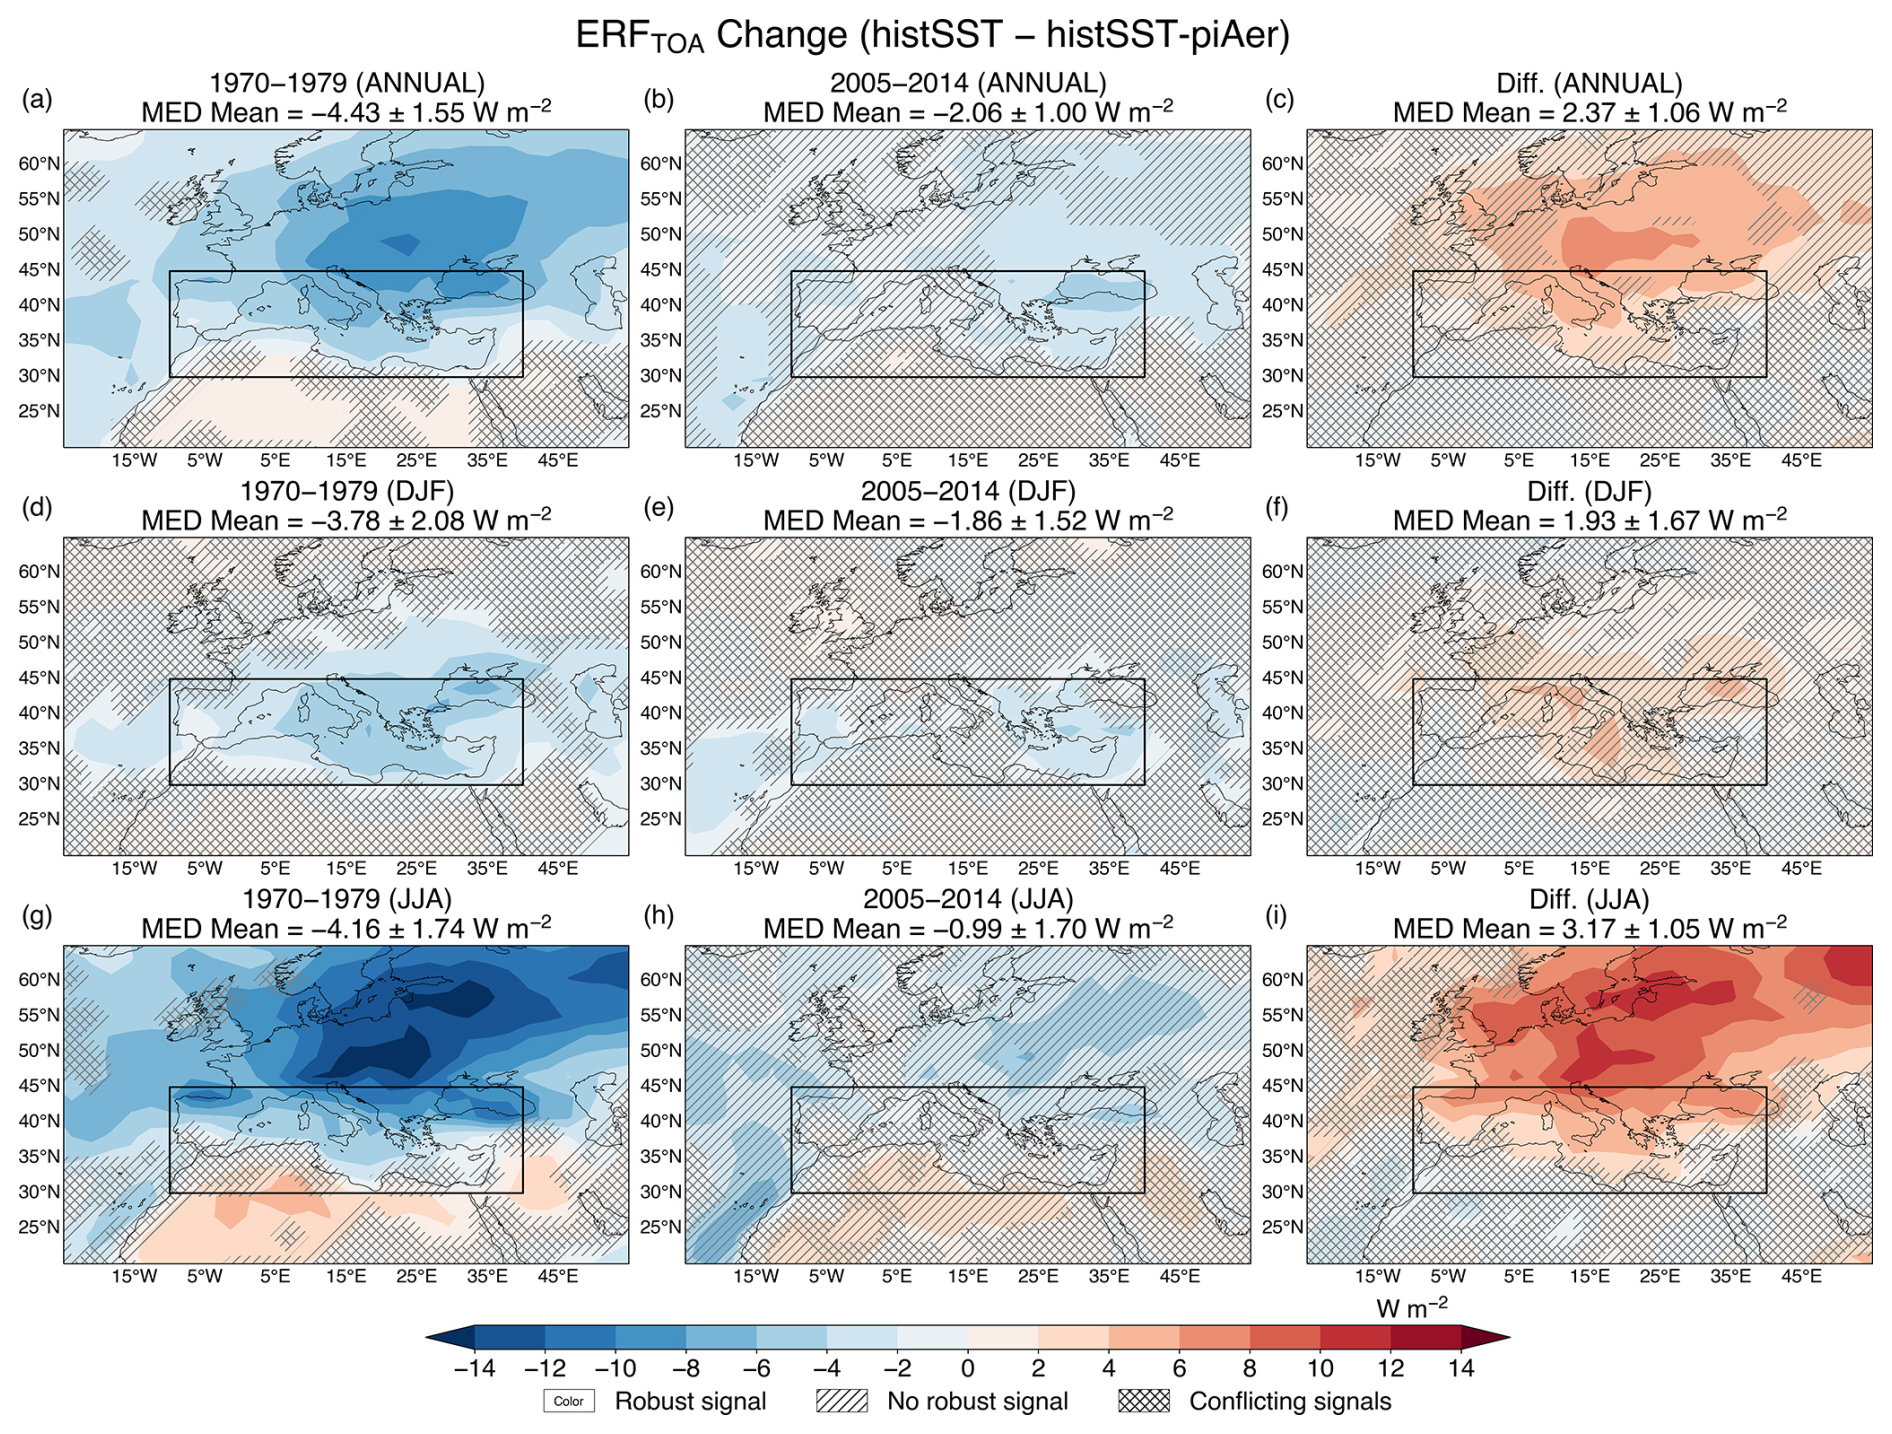
Figure 3ERFTOA due to anthropogenic aerosols over the Mediterranean (calculated from the difference histSST minus histSST-piAer). Spatial patterns are presented for the periods 1970–1979 (left column), 2005–2014 (middle column) and their difference (2005–2014 minus 1970–1979; right column) on an annual scale (top row) and in boreal winter (DJF; middle row) and summer (JJA; bottom row). The multi-model ensemble means over the Mediterranean region (shown as a box) are shown along with the inter-model variability (one standard deviation) at the top of each panel. Colored areas without markings indicate robust changes, while hatched () and cross-hatched (×) areas indicate non-robust changes and conflicting signals, respectively.
The weakening of the forcing due to AA reduction leads to a smaller annual mean ERFTOA of over MED in 2005–2014. ERFTOA becomes even smaller in JJA () because of the weaker radiative forcing gradient between Central Europe and Northern Africa. However, the multi-model results are robust only over the Eastern MED on an annual and winter scales. The large inter-model variability in the summer during the period 2005–2014 stems from MRI-ESM2-0 (Table 4), which simulates a strongly negative ERFTOA (). The MRI-ESM2-0 model produces the most negative ERFTOA and ERFSURF over the MED in all cases except in the winter of 2005–2014, where MPI-ESM-1-2-HAM takes the lead in both ERFs (Table 5).
In general, the ensemble differences of ERFTOA and ERFSURF between the periods 2005–2014 and 1970–1979 indicate that all ESMs point towards an ERF weakening (less negative ERF) that is more prominent in JJA. The summer ERF change dominates the spatial pattern of the annual mean change in ERF (mind that the differences in DJF are weaker and non-robust). The annual and summer ERF weakening is confined to the European part of the MED, where the multi-model results are robust. The largest changes in ERFTOA and ERFSURF between the two examined periods are seen for EC-Earth3-AerChem, MPI-ESM-1-2-HAM, MRI-ESM2-0, and UKESM1-0-LL, which differ in magnitude depending on the season. Our results regarding ERFTOA over the MED are in agreement with the findings of studies examining regional ERFs (e.g., Kalisoras et al., 2024; Szopa et al., 2021).
3.4 Spatial pattern of ΔFcoupled changes
Changes in the spatial pattern of are shown in Fig. 4, while the respective changes in the spatial distribution of are presented in Fig. S3 in the Supplement. Overall, the spatial pattern of is nearly identical to that of ERFTOA but weaker in magnitude. The annual mean in 1970–1979 is over the MED and is largest over Central and Eastern Europe (Fig. 4). As in the case of ERFTOA, the annual spatial pattern of in the period 1970–1979 is dominated by its respective summer pattern. The negative in JJA is spread over the European part of the MED region and has a multi-model mean value of over the MED. On the other hand, over the southern and southeastern parts of MED, becomes positive (albeit not statistically significant), with a magnitude greater than the respective ERFTOA magnitude over the same areas. In the winter of 1970–1979, is generally weaker () and robust only over the Balkan Peninsula. After global AA emission reductions, the annual mean increases by but remains negative. Similarly to ERFTOA, the largest increases are seen over Central Europe. In the winter, there is a non-robust increase in over the MED, mainly due to increases over its northern parts. Conversely, the summer undergoes a significant increase and becomes positive in 2005–2014 (). Although there are conflicting signals on the summer mean in 2005–2014, all ESMs simulate a trend towards more positive values in the transition from 1970–1979 to 2005–2014.
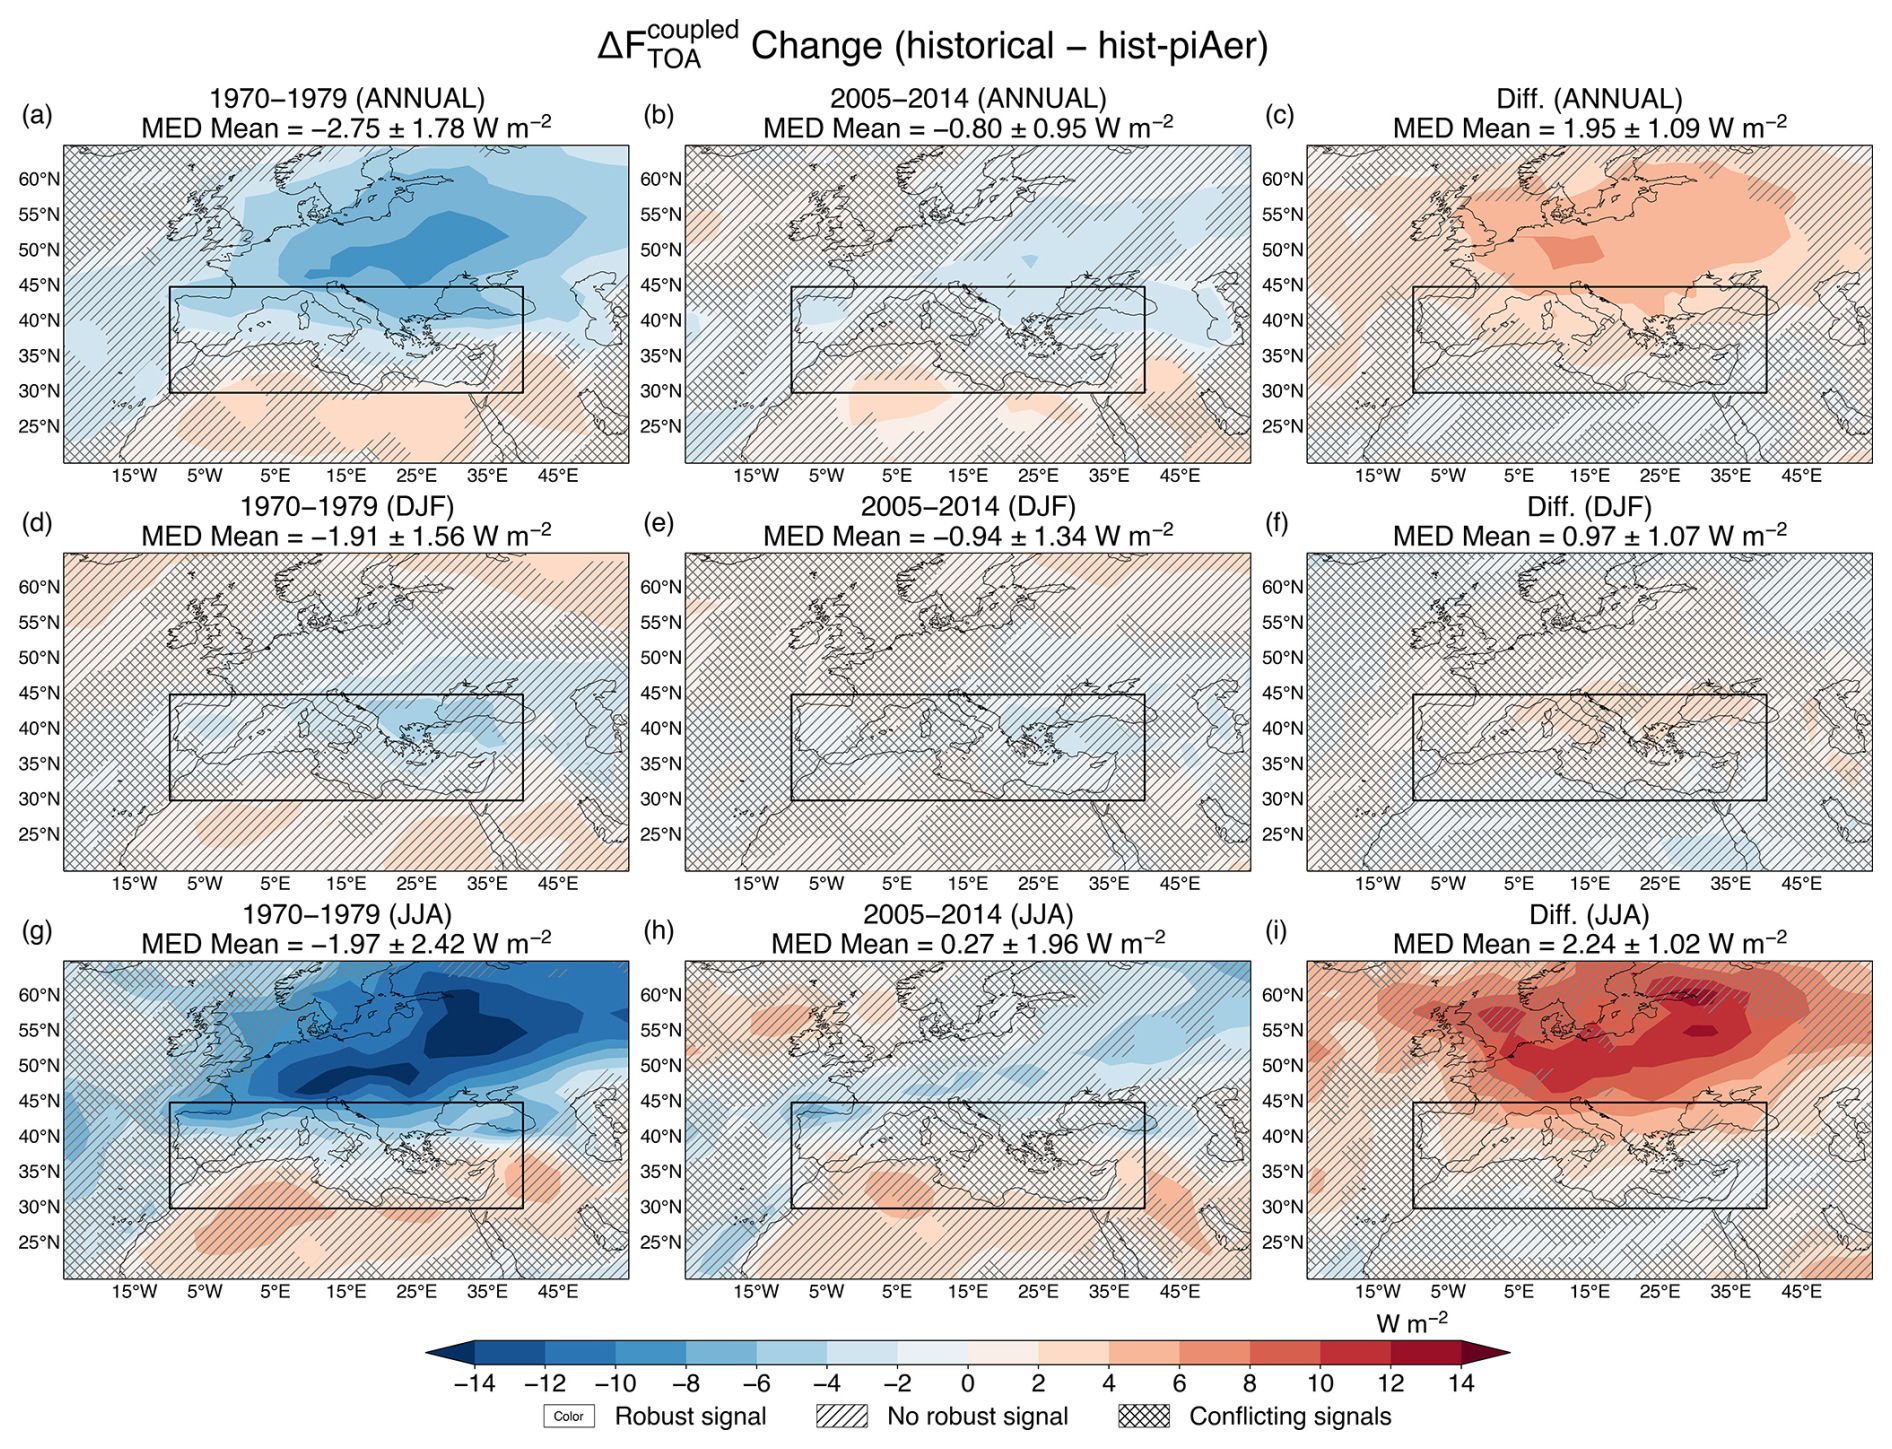
Figure 4ΔFcoupled at TOA due to anthropogenic aerosols over the Mediterranean (calculated from the difference historical minus hist-piAer). Spatial patterns are presented for the periods 1970–1979 (left column), 2005–2014 (middle column) and their difference (2005–2014 minus 1970–1979; right column) on an annual scale (top row) and in boreal winter (DJF; middle row) and summer (JJA; bottom row). The multi-model ensemble means over the Mediterranean region (shown as a box) are shown along with the inter-model variability (one standard deviation) at the top of each panel. Colored areas without markings indicate robust changes, while hatched () and cross-hatched (×) areas indicate non-robust changes and conflicting signals, respectively.
The spatial distribution of (Fig. S3) resembles that of ERFSURF (Fig. S2) but, unlike the above, their annual and seasonal means over the MED are of similar magnitude. A notable paradox is the seasonal change of after the decrease in global AA emissions (Fig. S3; right column). The DJF shows a small but robust increase (), especially over continental Europe. This winter increase is not robust over such a large area for the rest of the metrics of radiative flux change (ERFTOA, ERFSURF, ). On the other hand, the change in the JJA is larger in magnitude () than in DJF, but it is not a robust feature among ESMs.
After examination of the SW and LW components of ΔFcoupled at TOA and the surface (not shown), it becomes clear that the SW component drives the pattern and evolution of ΔFcoupled (indicating SW radiative loss at TOA and the surface), while the LW component partly masks the ΔFcoupled change. The dominance of SW aerosol forcing is consistent with earlier studies emphasizing the role of aerosols in shaping the radiative balance over the Euro-Mediterranean region (e.g., Boé et al., 2020; Glantz et al., 2022; Nabat et al., 2014). The LW and are positive during both periods on annual and seasonal scales (Tables S1–S3 in the Supplement). This indicates LW radiative energy gain at TOA and the surface, but both weaken after the AA reduction. It should be noted that the annual spatial pattern is driven by the JJA pattern in both cases (SW and LW). After the AA decrease, changes in SW and LW ΔFcoupled are generally more prominent over Central and Eastern Europe on annual and summer scales.
3.5 Temporal evolution of temperature changes – CMIP6 vs. Observations
The evolution of TAS in the MED region throughout the historical period imposed by AAs (Fig. 5) follows the evolution of transient ERF and ΔFcoupled. The annual mean TAS exhibits a negative peak in the late 1970s to early 1980s, which is stronger in JJA compared to DJF and shows an increasing trend towards more positive values by the end of the historical period.
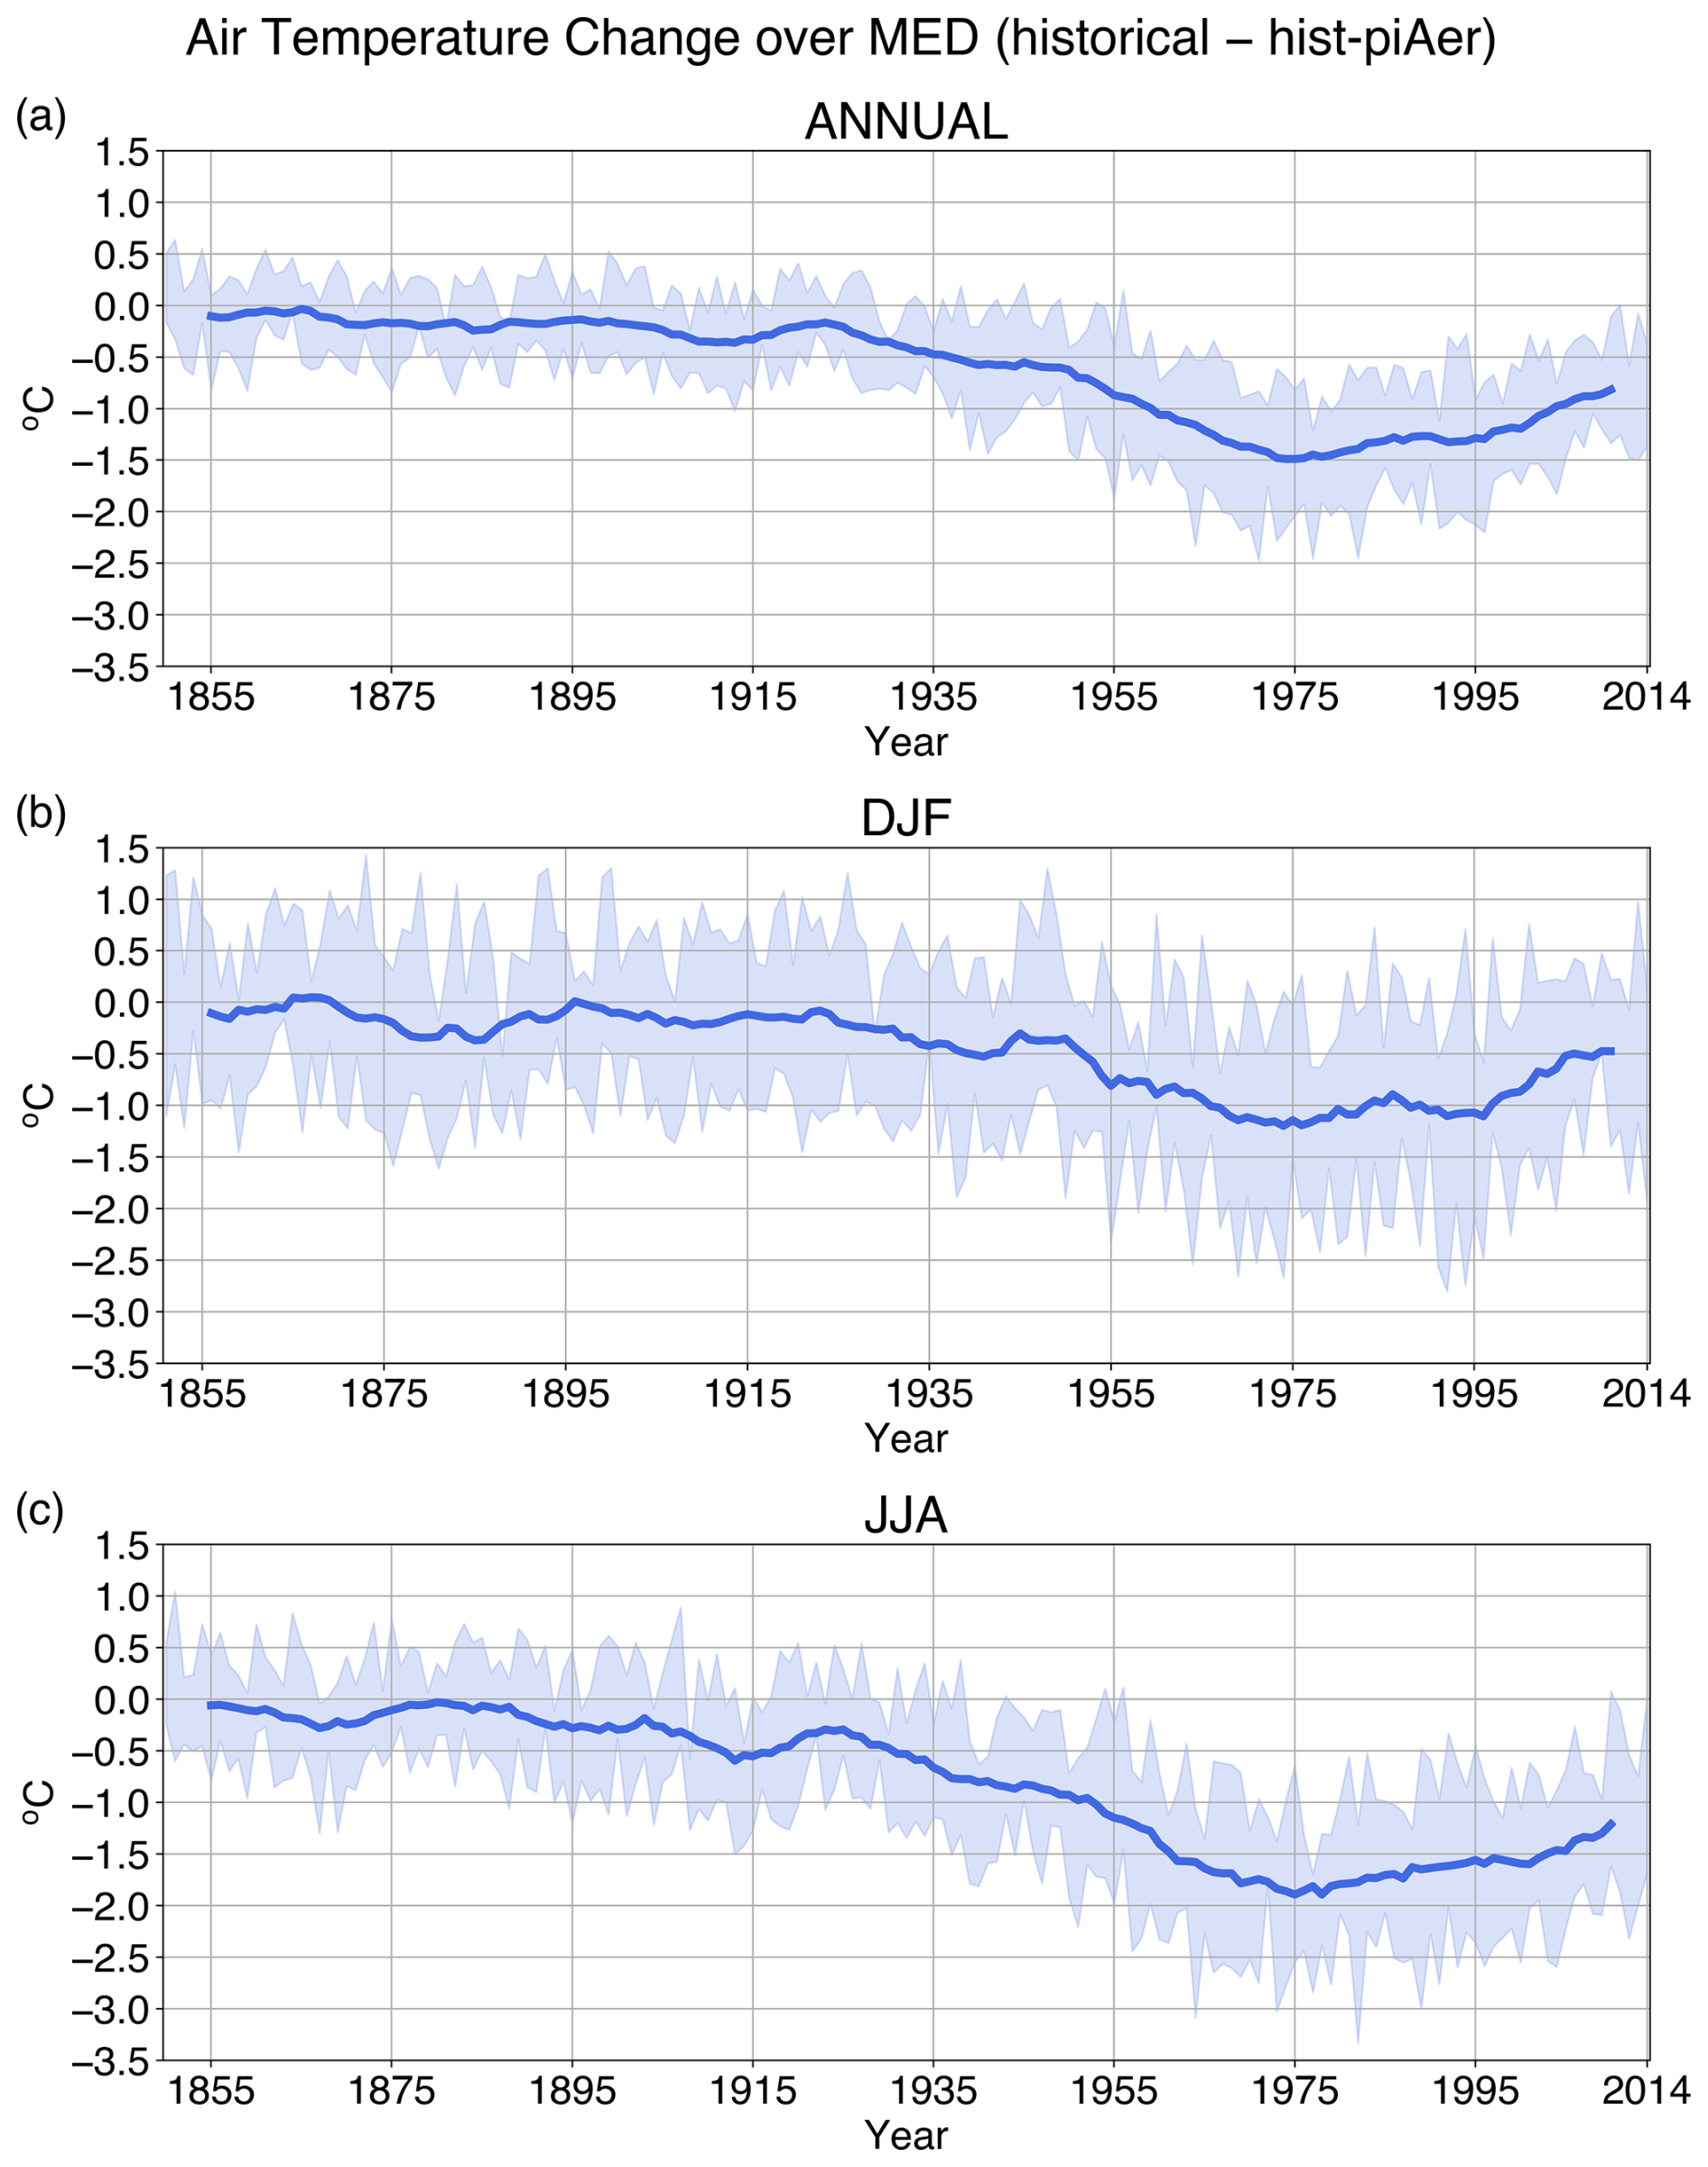
Figure 5Timeseries of the AA-induced near-surface air temperature (TAS) evolution over the Mediterranean region (10° W–40° E, 30–45° N) for the historical period (1850–2014) on an annual scale (top row) and in boreal winter (DJF; middle row) and summer (JJA; bottom row). TAS changes were calculated from the difference historical minus hist-piAer. The lines represent the 10 year moving average, while shading indicates the inter-model variability expressed as one standard deviation.
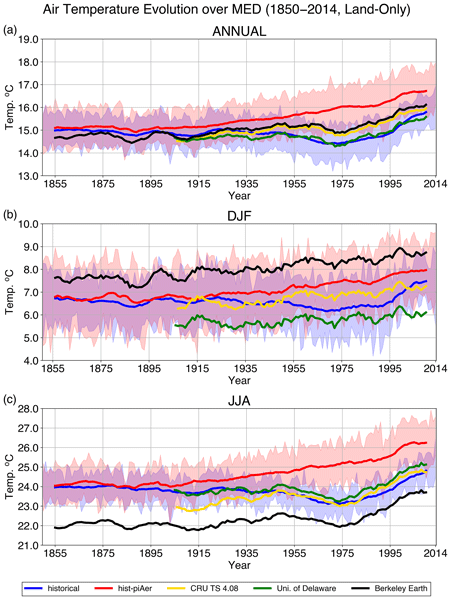
To gain confidence in the AA-induced TAS changes presented in Fig. 5, the ability of CMIP6 ESMs to capture the historical trends of TAS in the MED is examined. The TAS evolution over land from the historical simulation is compared to those from three gridded observational datasets (Fig. 6). On annual and summer scales, observations and the historical simulation agree on the evolution of land TAS in MED, with a cooling trend after the 1940s that peaks in the mid-1970s, followed by a warming trend afterwards. The absolute temperature levels in historical simulation are in good agreement with the University of Delaware and CRU TS datasets, especially in JJA, whereas there is a distinct warm bias in JJA and cold bias in DJF with respect to the Berkley Earth dataset.
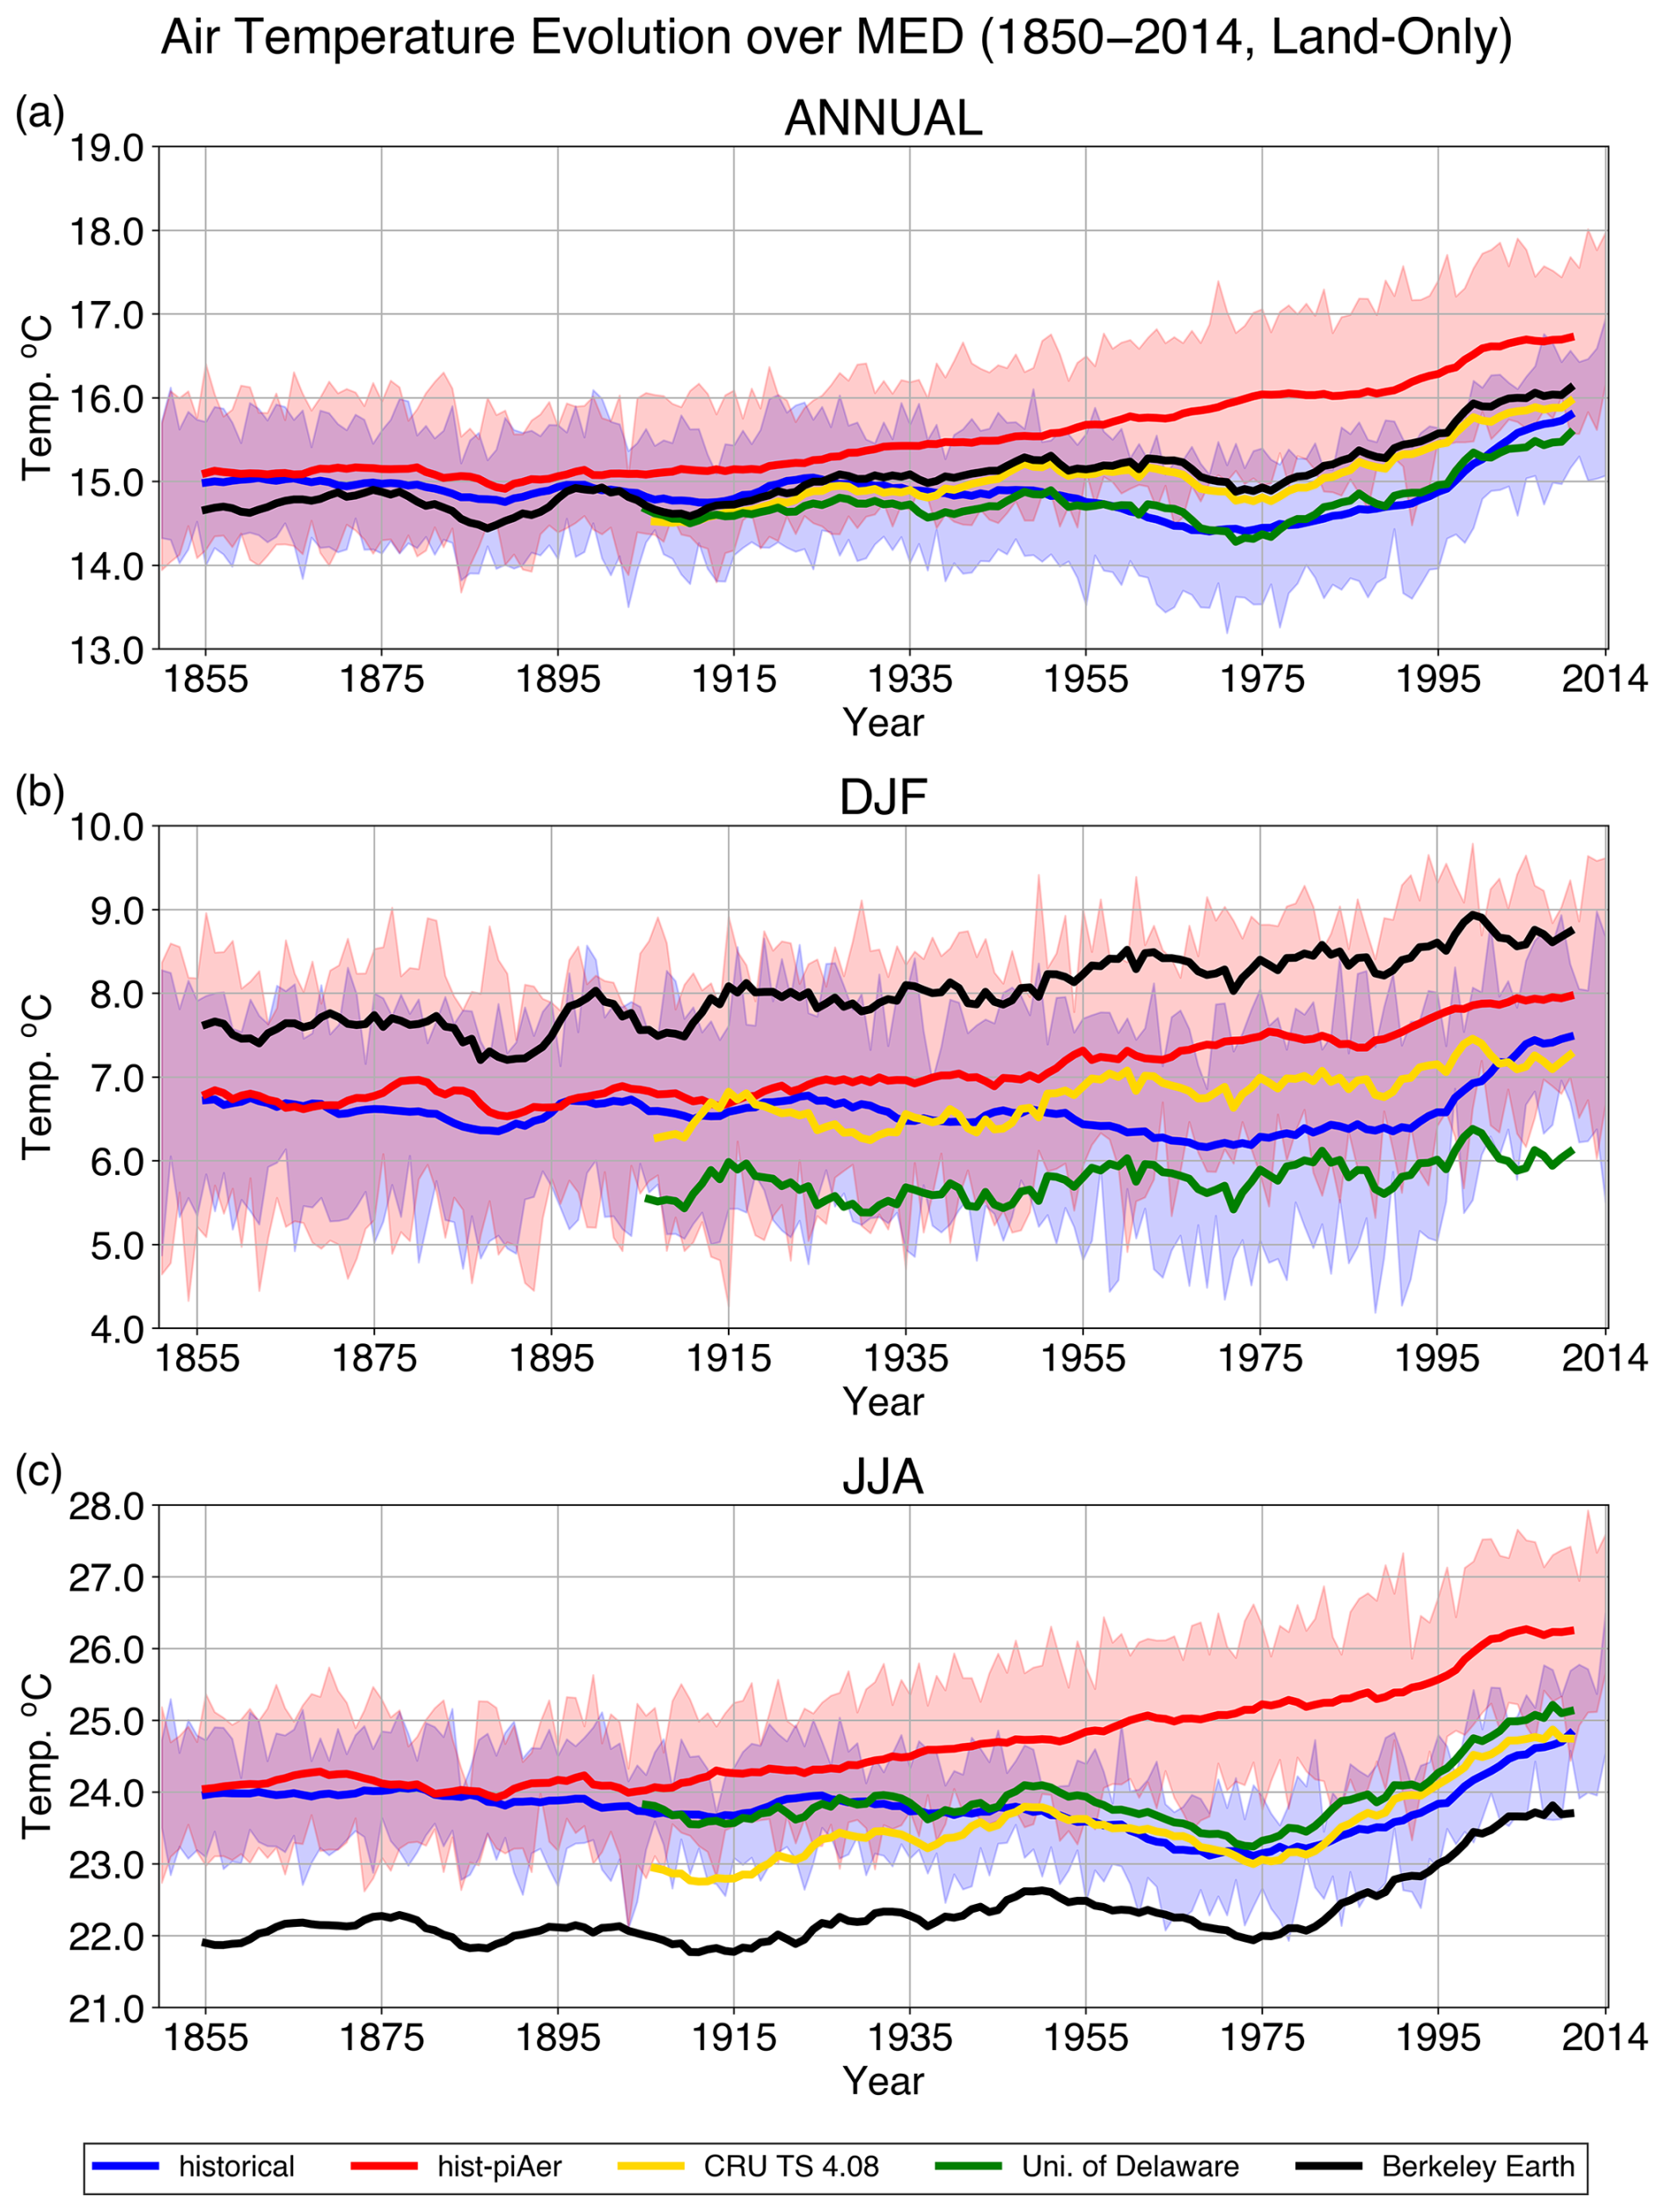
Figure 6Timeseries of land TAS evolution over the Mediterranean region (10° W–40° E, 30–45° N) for the historical period (1850–2014) as captured by CMIP6 ESMs and observations on an annual scale (top row) and in boreal winter (DJF; middle row) and summer (JJA; bottom row). The lines represent 10 year moving averages. In the cases of the CMIP6 experiments, shading indicates the inter-model variability expressed as one standard deviation.
On an annual scale over land, the three observational datasets show a warming ranging from 1.14–1.20 °C between the periods 2005–2014 and 1970–1979. The ensemble from the historical simulations indicates a relatively similar warming of 1.34 °C with a small overestimation in the range of 12 %–18 % (Table 7). The ensemble from the hist-piAer simulations shows a smaller warming of 0.68 °C, thus indicating that AA reductions contribute roughly 0.66 °C (49 %) to the warming in transient historical simulations between 2005–2014 and 1970–1979.
Table 7Annual and seasonal means for near-surface air temperature (TAS; in °C) over the Mediterranean region for the periods 1970–1979, 2005–2014 and their difference (2005–2014 minus 1970–1979). Values are presented for the three observational datasets and the multi-model ensembles for the CMIP6 historical and hist-piAer experiments. Only gridpoints over land were considered here.
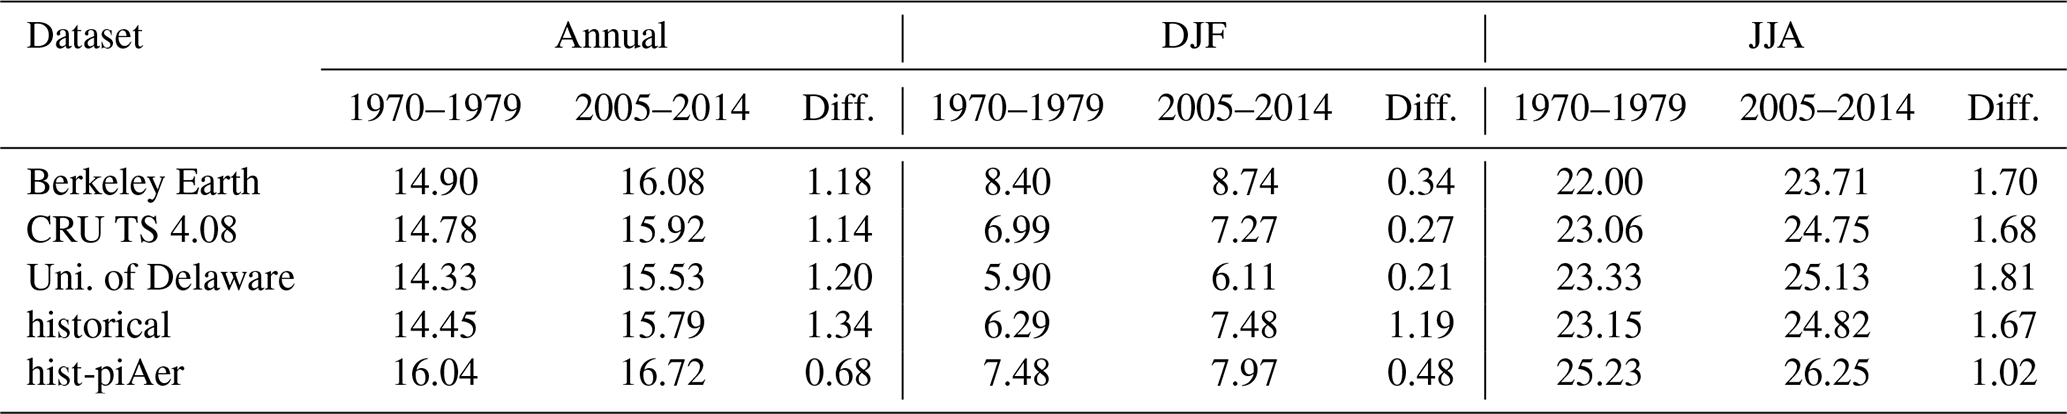
In the summer, the three observational datasets show a stronger land warming in the range of 1.68–1.81 °C between 2005–2014 and 1970–1979, and the ensemble from the historical simulations indicates a similar warming of 1.67 °C with a slight underestimation in the range of 1 %–8 %. The ensemble from the hist-piAer simulations shows a smaller warming of 1.02 °C, which indicates that reductions in AAs contribute roughly 0.65 °C (39 %) to the warming in CMIP6 historical simulations between the periods 2005–2014 and 1970–1979.
In the winter, air temperature over land evolves differently in the historical simulation compared to observations. While ESMs exhibit a similar, yet weaker cooling–warming pattern which is also seen in JJA, observational datasets show a general temperature increase since the 1970s. For example, in DJF over land, the three observational datasets show a slight warming in the range of 0.21–0.34 °C between 2005–2014 and 1970–1979. However, the ensemble from the historical simulations indicates an overestimated warming of 1.19 °C, with hist-piAer simulations revealing that AA decrease contributes roughly 0.71 °C (60 %) to this warming.
CMIP6 models produce a distinct cooling during the period 1960–1990 in DJF followed by an excessive warming trend from around 1995 onwards, which can arguably be attributed to aerosol concentration biases in the ESMs (Zhang et al., 2021b). In addition, the relatively weaker radiative effects from AAs in DJF than in JJA as well as atmospheric circulation, which is generally more disturbed in DJF than in JJA in the midlatitudes (Akritidis et al., 2021), influence the differences in DJF land temperature evolution between ESMs and observations. It has to be highlighted here that all three observational datasets used here show significant discrepancies between each other in representing the seasonal land TAS evolution, especially in DJF. In some cases, these discrepancies are larger between the observational datasets than between the observational data and the CMIP6 historical ensemble.
3.6 Spatial pattern of horizontal and vertical temperature changes based on CMIP6
Changes in the spatial pattern of TAS due to AAs as simulated by CMIP6 models are presented in Fig. 7. AAs cause a surface cooling relative to the pre-industrial era, which is most intense during 1970–1979 with an annual mean of over the MED. The central and eastern parts of Europe experience the largest TAS decrease on both annual and seasonal scales. The surface cooling in the MED for the period 1970–1979 is more enhanced in the summer () than in the winter (). The same applies to both Europe and Northern Africa, a feature that is robust among ESMs. After AA emission reduction, towards the period 2005–2014, mainly Central Europe and the Eastern MED undergo a surface warming both annually and seasonally (as can be noted in Fig. 7 from the difference between the periods 2005–2014 and 1970–1979). Specifically, in the MED the mean increase in TAS is of the same magnitude (around 0.7 °C) on an annual scale and during the winter and summer months. However, the annual change is robust in most of the MED, in agreement with the findings of Urdiales-Flores et al. (2023), whereas in DJF it is not statistically significant (despite the agreement on the sign of change between ESMs). In JJA, the robust results are confined in the Eastern MED, which is highlighted as a hotspot of summer warming due to AA reduction in all ESMs used in this work. The largest surface warming from 1970–1979 to 2005–2014 is produced by the EC-Earth3-AerChem and the UKESM1-0-LL models on both annual and seasonal scales, while the smallest by the BCC-ESM1 model.
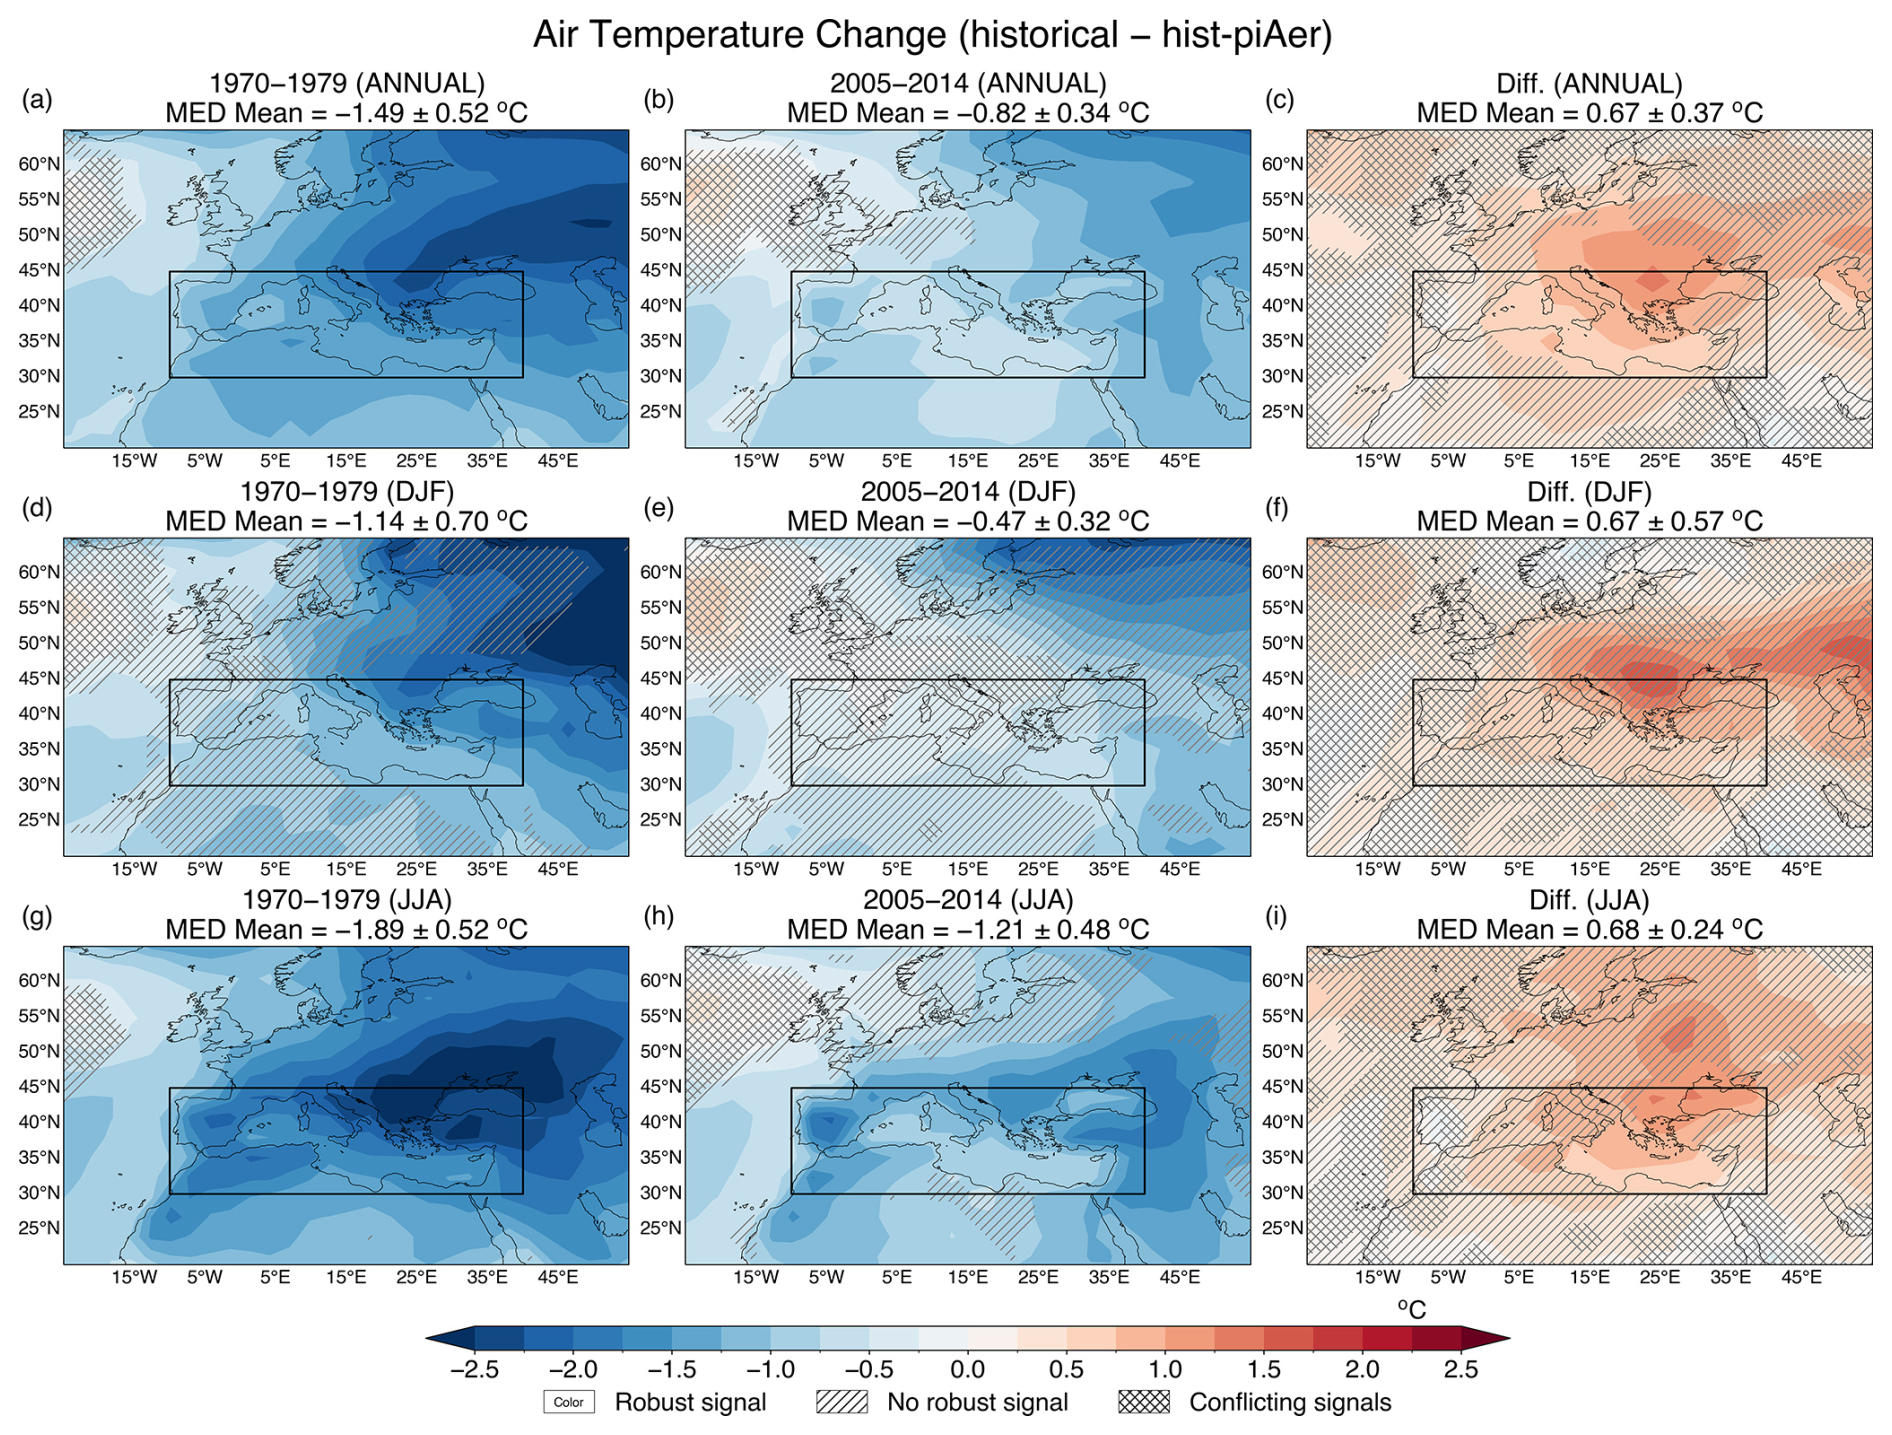
Figure 7Changes in TAS due to anthropogenic aerosols over the Mediterranean (calculated from the difference historical minus hist-piAer). Spatial patterns are presented for the periods 1970–1979 (left column), 2005–2014 (middle column) and their difference (2005–2014 minus 1970–1979; right column) on an annual scale (top row) and in boreal winter (DJF; middle row) and summer (JJA; bottom row). The multi-model ensemble means over the Mediterranean region (shown as a box) are shown along with the inter-model variability (one standard deviation) at the top of each panel. Colored areas without markings indicate robust changes, while hatched ( and cross-hatched (×) areas indicate non-robust changes and conflicting signals, respectively.
The magnitude and seasonal asymmetry of the warming simulated by CMIP6 ESMs are consistent with previous observational and modeling studies reporting accelerated warming over the Euro-Mediterranean region following the decline of anthropogenic aerosol emissions, particularly during summer months (e.g., Dong et al., 2017; Nabat et al., 2014; Urdiales-Flores et al., 2023).
The warming caused by the decrease in AA emissions and concentrations is also apparent at higher levels in the troposphere. In Fig. 8 (9) the zonal (meridional) temperature means from the surface to 50 mb are presented considering only the MED longitudes (latitudes). The warming extends up to 200 hPa over the MED region (defined by the vertical dashed lines) as part of the Northern Hemisphere (NH) extratropical warming from 1970–1979 to 2005–2014 (Fig. 8). In the summer, the temperature increase affects a larger part of the NH troposphere, reaching up to 90° N, whereas it is more geographically confined in the winter. The epicenter of the annual mean warming is located at the MED longitudes, with an exception in JJA, during which the warming extends to around 60° E (Fig. 9). The magnitude of the warming decreases with height, except in the case of the NH midlatitudes in DJF (Fig. 8f).
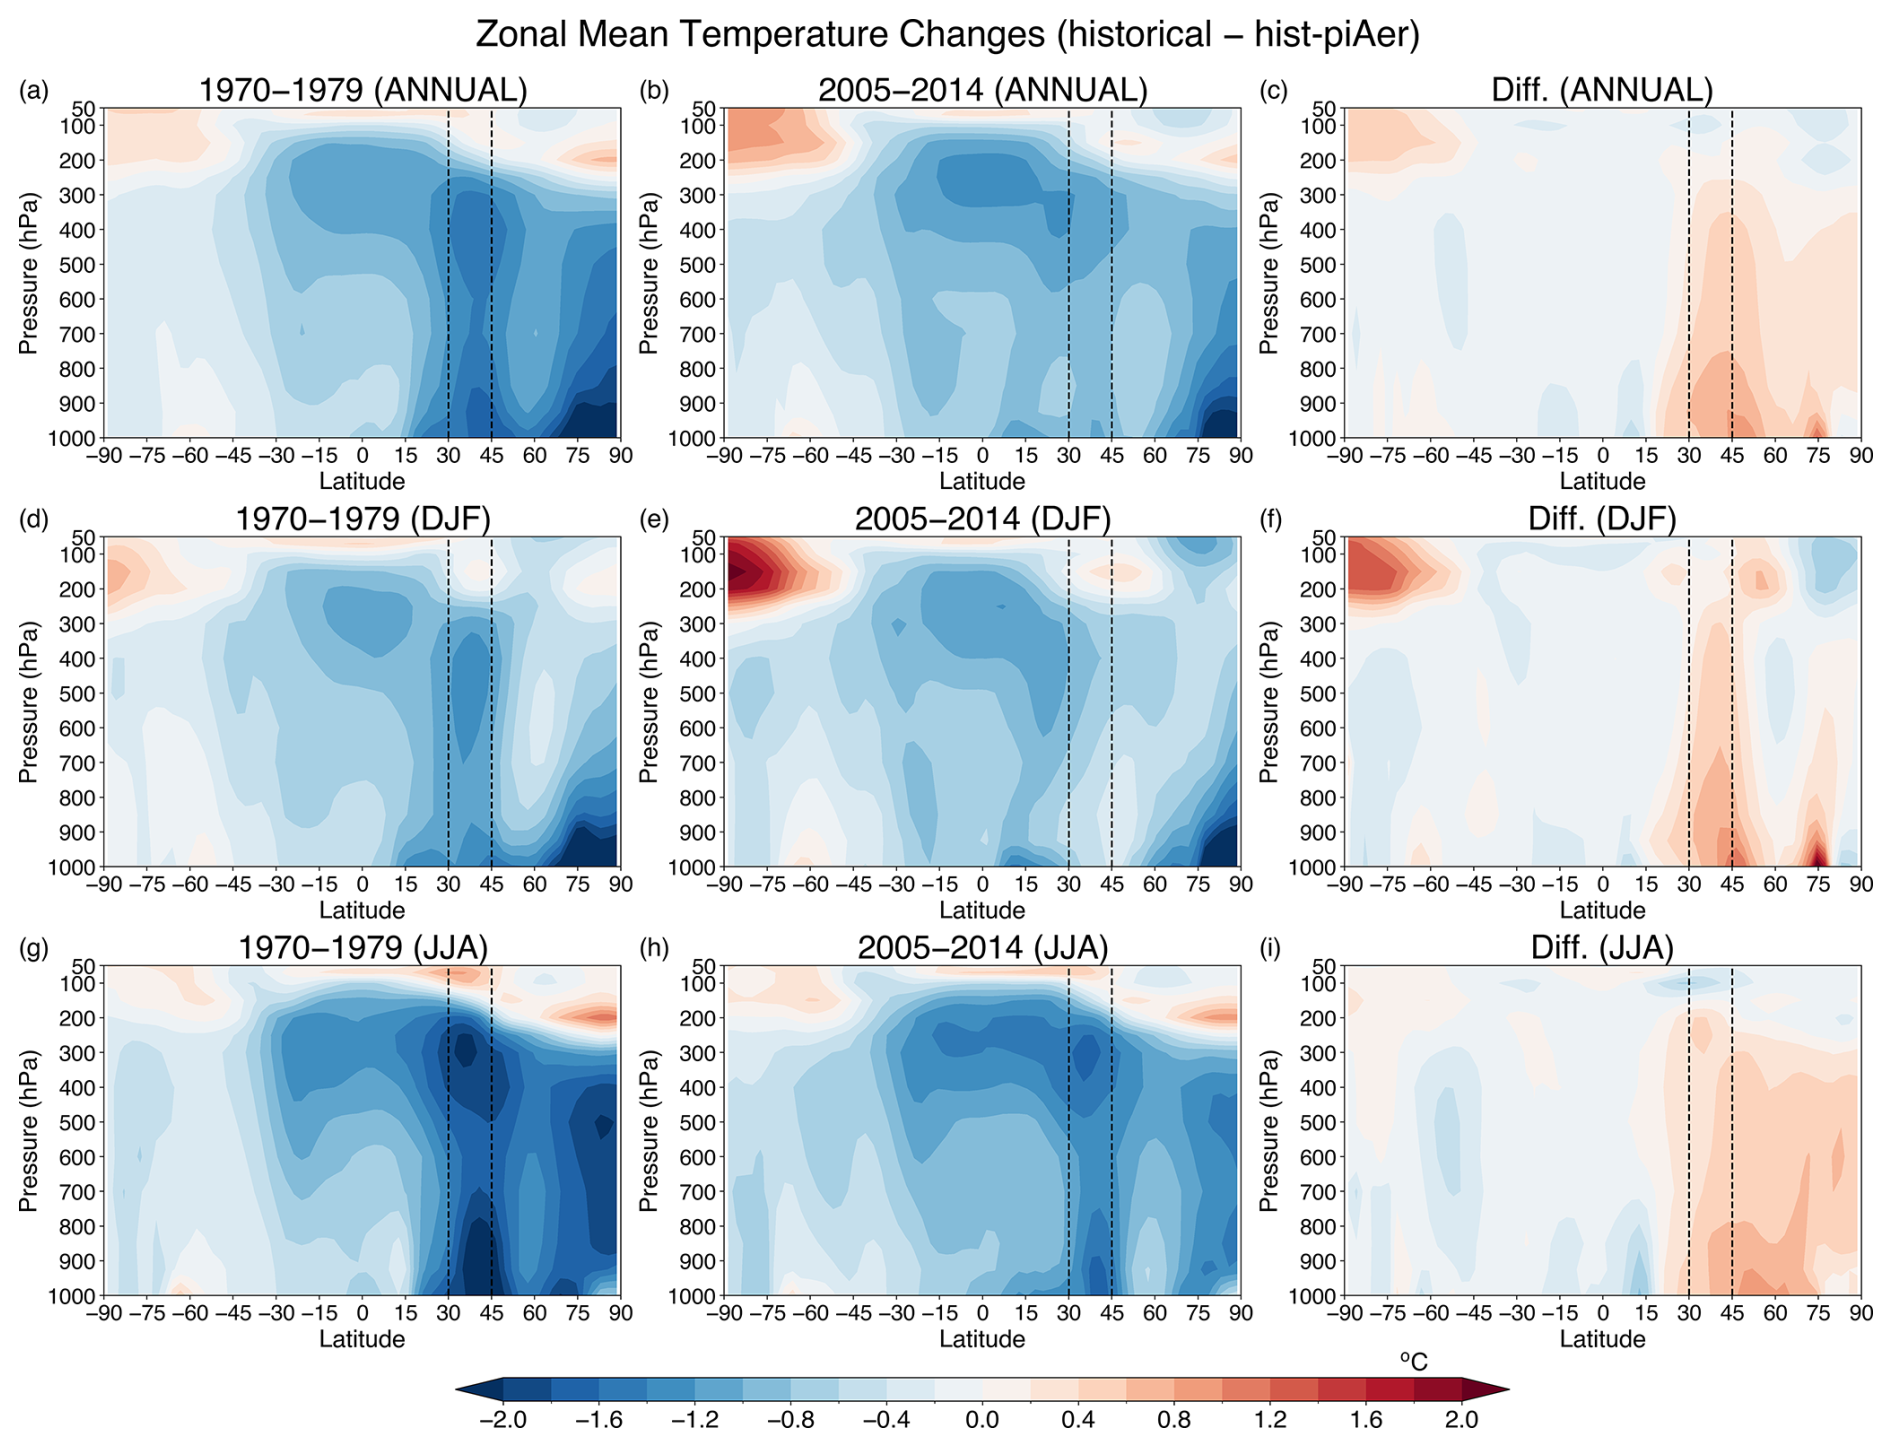
Figure 8Changes in zonal mean temperature due to AAs (calculated from the difference historical minus hist-piAer) for the MED longitudes (10° W–40° E). Cross sections (pressure level over latitude) are presented for the periods 1970–1979 (left column), 2005–2014 (middle column) and their difference (2005–2014 minus 1970–1979; right column) on an annual scale (top row) and in boreal winter (DJF; middle row) and summer (JJA; bottom row). Dashed vertical lines indicate the latitudinal boundaries of the MED region.
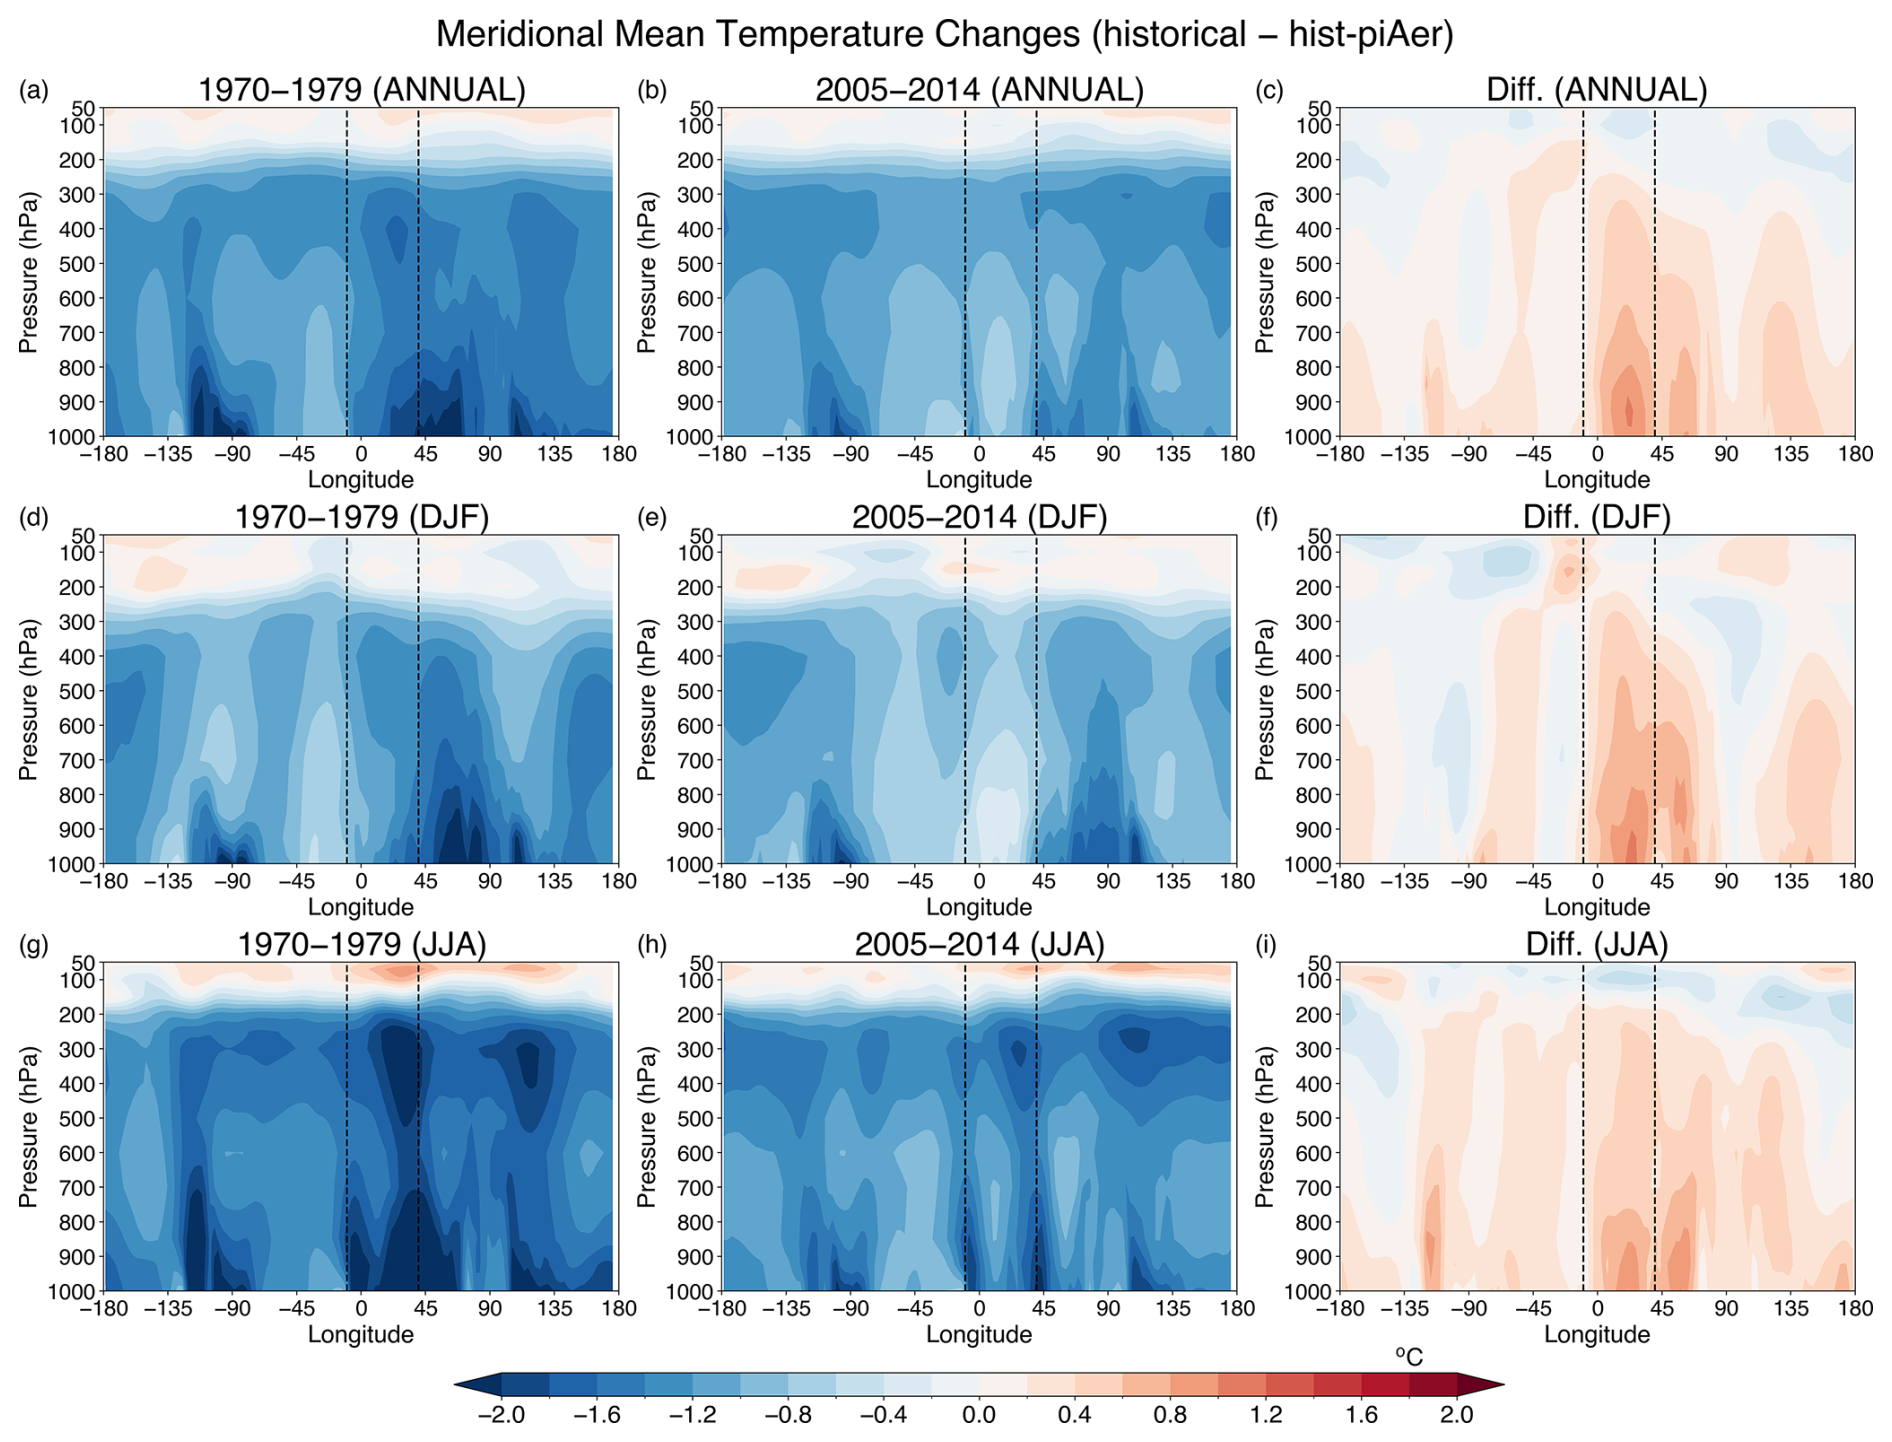
Figure 9Changes in meridional mean temperature due to AAs (calculated from the difference historical minus hist-piAer) for the MED latitudes (30–45° N). Cross sections (pressure level over longitude) are presented for the periods 1970–1979 (left column), 2005–2014 (middle column) and their difference (2005–2014 minus 1970–1979; right column) on an annual scale (top row) and in boreal winter (DJF; middle row) and summer (JJA; bottom row). Dashed vertical lines indicate the longitudinal boundaries of the MED region.
3.7 Spatial pattern of circulation changes
Based on the results presented above, AA-induced TAS spatial changes cannot be fully explained by radiative changes alone. ERFTOA and changes between the periods 1970–1979 and 2005–2014 are not always spatially collocated with the respective TAS changes in the Euro-Mediterranean region (20–65° N, 25° W–55° E). This can be shown by calculating their spatial correlation coefficients on an annual scale (0.65 and 0.55, respectively), in DJF (0.52 and 0.49, respectively), and in JJA (0.69 and 0.60, respectively). This reveals that apart from the radiative effects and aerosol–cloud interactions (Kalisoras et al., 2024), atmospheric circulation changes induced by AAs may modify horizontal and vertical heat transport, thus playing an additional role in the redistribution of TAS changes.
To examine the thermal transfer through atmospheric circulation due to AAs, circulation changes at 850 hPa and sea-level pressure (SLP) relative to the pre-industrial period and due to decreases in AAs after around 1980 are shown in Fig. 10 and Fig. S4 in the Supplement, respectively.
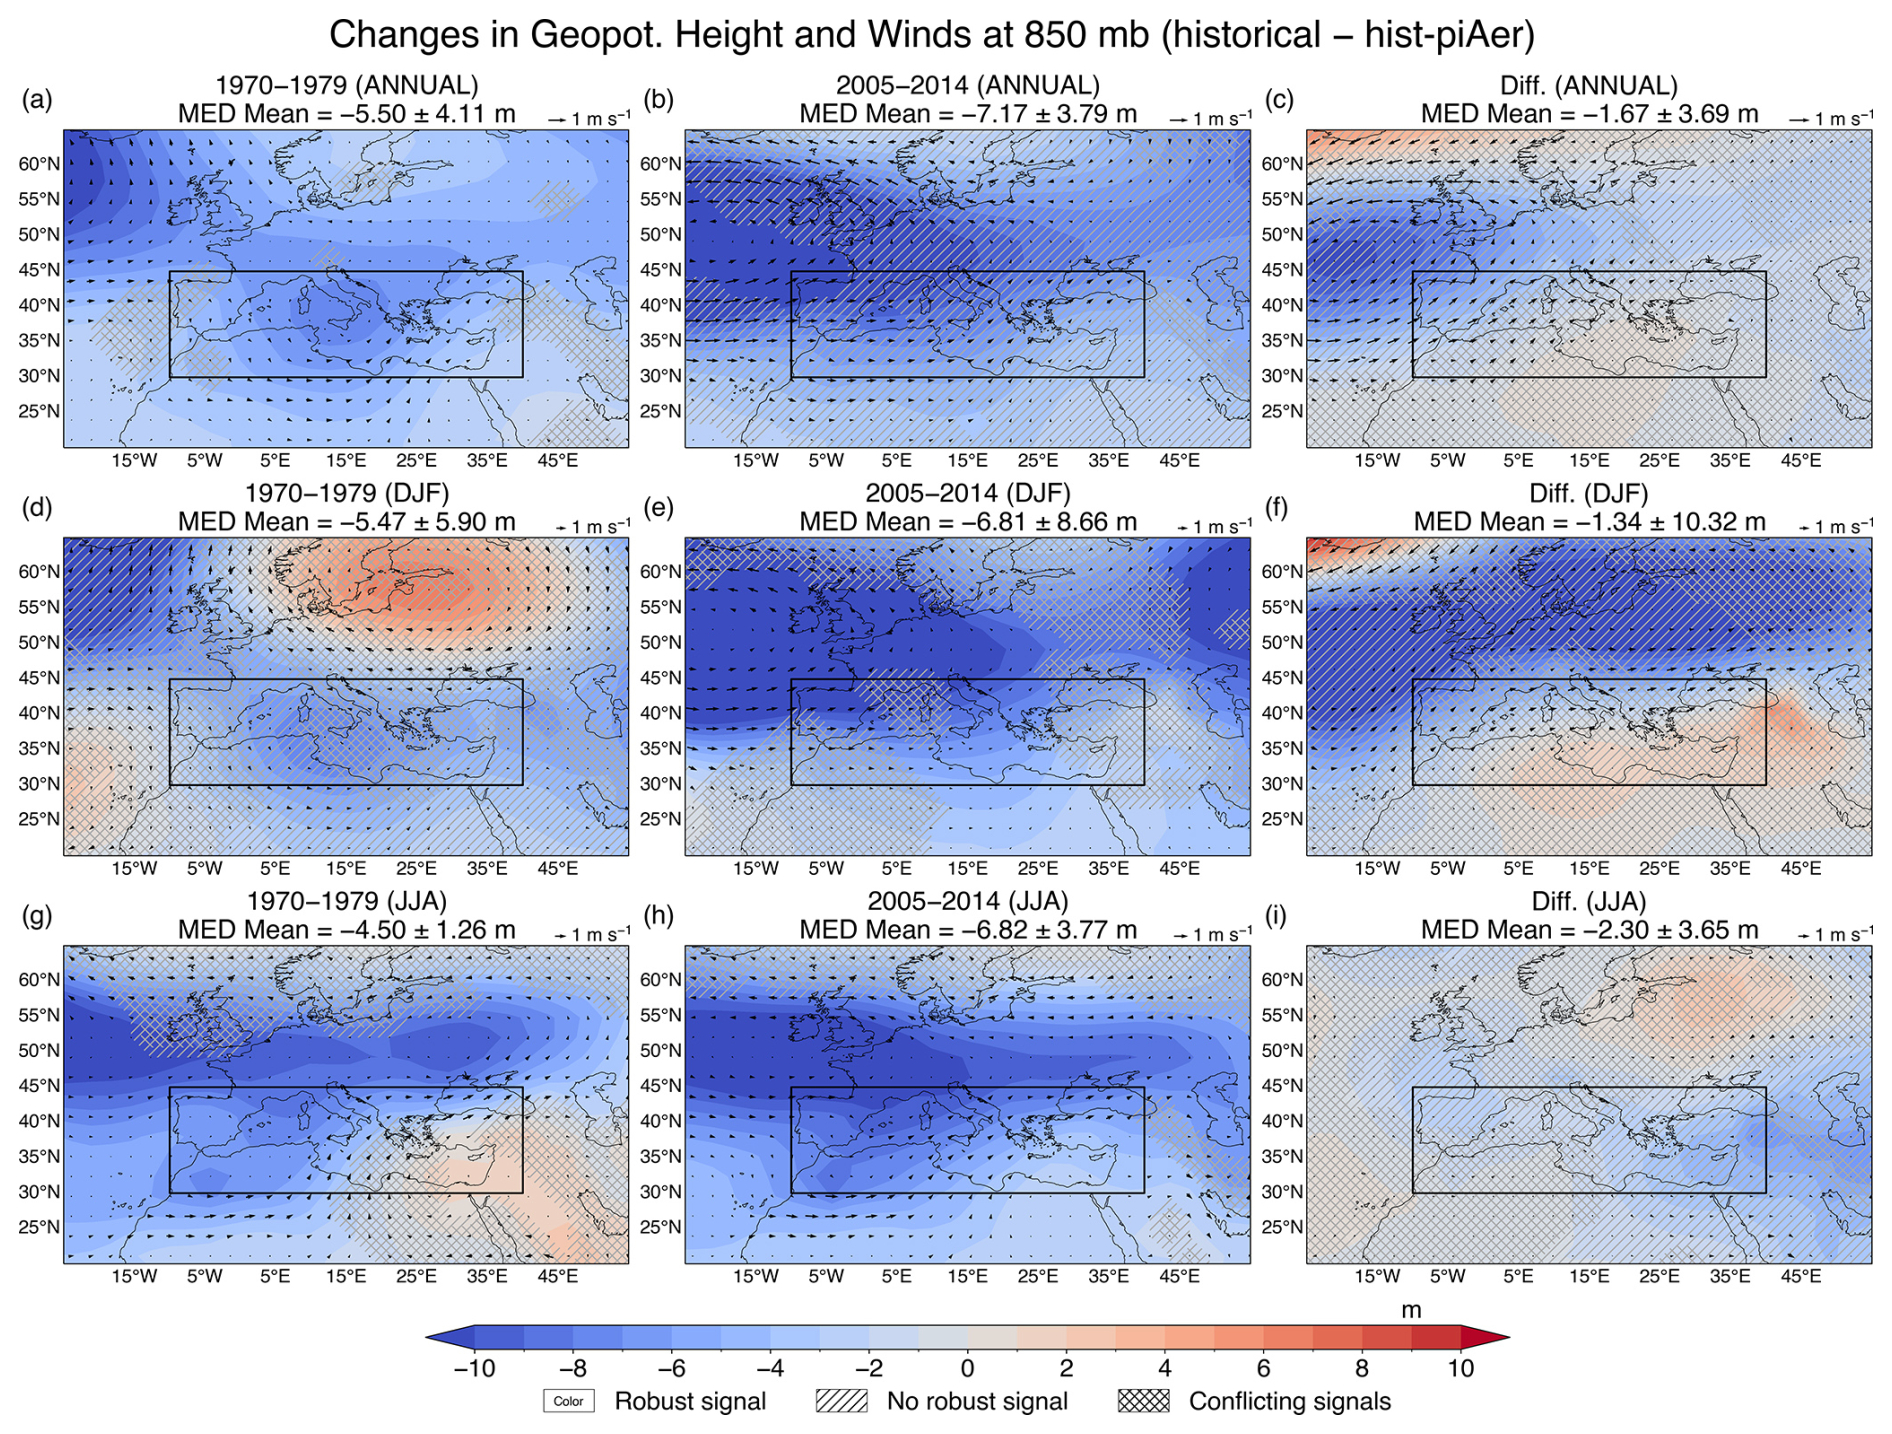
Figure 10Changes in geopotential height and winds at 850 hPa due to anthropogenic aerosols over the Mediterranean (calculated from the difference historical minus hist-piAer). Spatial patterns are presented for the periods 1970–1979 (left column), 2005–2014 (middle column) and their difference (2005–2014 minus 1970–1979; right column) on an annual scale (top row) and in boreal winter (DJF; middle row) and summer (JJA; bottom row). The multi-model ensemble means over the Mediterranean region (shown as a box) are shown along with the inter-model variability (one standard deviation) at the top of each panel. Colored areas without markings indicate robust changes, while hatched () and cross-hatched (×) areas indicate non-robust changes and conflicting signals, respectively.
On an annual scale, AA reduction (Figs. 10c and S4c) causes a cyclonic anomaly over the North Atlantic and Western Europe, which extends towards the central and eastern parts of Europe. This atmospheric circulation anomaly at 850 hPa and SLP is responsible for an enhancement of the westerly/southwesterly flow over the MED latitudes, along with an inflow from the northwestern parts of Africa towards Southern Europe. This indicates a warm advection anomaly which could contribute to the annual local TAS maximum over Southeastern Europe and Eastern MED.
During the winter, an anticyclonic anomaly (relative to the pre-industrial era) over Scandinavia in 1970–1979 (Fig. 10d), which could induce a cold advection anomaly towards Central and Southeastern Europe, strongly weakens or even disappears in the period 2005–2014 (Fig. 10e; also seen in Fig. S4e). Consequently, after the decrease in AAs from 1970–1979 to 2005–2014, a cyclonic anomaly extending from the North Atlantic to Eastern/Northeastern Europe (Figs. 10f and S4f) intensifies the westerly/southwesterly flow over the European midlatitudes (as well as the European part of the MED) and could possibly contribute to the warming pattern over Central and Eastern Europe, along with the warming due to radiative effects.
On the other hand, in JJA there are cyclonic anomalies (relative to the pre-industrial period) caused by AAs that extend from the North Atlantic to Northwestern Africa and Southeastern Europe during both 1970–1979 and 2005–2014. These anomalies could impose a southerly warm advection over the Eastern MED that may partly mask the radiative cooling effect of AAs in the region for both periods (Fig. 10g and h, respectively). The circulation anomalies, resulting from the difference between 2005–2014 and 1970–1979 following the reduction of AAs, are generally weak (Fig. 10i). It could be mentioned that the emergence of a non-robust cyclonic anomaly over the Eastern MED and the Middle East (Figs. 10i and S4i) may contribute to the summer warming amplification over the Eastern MED possibly through a weakening of the Etesian wind system (Dafka et al., 2016) and a warm advection anomaly from Northeastern Africa. However, it should be noted that ESMs show large differences when simulating circulation changes attributed to AA reduction, as the large inter-model variability and the lack of statistical significance suggest.
This work quantifies the contribution of global AA emission changes to recent Mediterranean warming based on simulations from eight CMIP6 ESMs including historical and hist-piAer coupled-ocean experiments, as well as histSST and histSST-piAer experiments with prescribed SSTs and sea ice. Reductions in AA emissions due to air pollution control policies cause a decrease in AOD over the MED which is mainly driven by the sulfate emissions decrease. The negative peaks in ERF and ΔFcoupled (either at TOA or surface) coincide with the positive AOD peak around the 1980s over the Euro-Mediterranean region, and afterwards a positive trend follows until the second decade of the 21st century, especially on annual scale and JJA. The AA-induced changes in ERF and ΔFcoupled for the peak aerosol period (1970–1979) and the near-present period (2005–2014), are robust over the northern half of the MED and are largest at the surface than at TOA on annual scale and JJA. The JJA patterns of ERF and ΔFcoupled dominate their respective annual spatial patterns in all cases. Changes in the spatial patterns of ERF and ΔFcoupled are dominated by their SW component on both annual and seasonal scales. The midlatitudes of Europe undergo the largest and most robust change in , with JJA changes playing a pivotal role in the changes seen on an annual scale. The AA-induced changes in are smaller in magnitude than ERFTOA. This can arguably be attributed to the partial adjustment of the climate system through fast and incomplete slow responses after changes in land and ocean surface temperatures.
The evolution of AA-induced TAS changes is similar to that of ERF and ΔFcoupled, with a decreasing trend until approximately 1980 followed by an increasing trend toward the near present, which is strongest during JJA and robust over the central and eastern parts of the MED. The AA-induced temperature changes represent transient climate responses (fast and incomplete slow responses) under evolving historical conditions, which are far from being in an equilibrium state because the ocean does not have enough time to fully equilibrate to the evolving historical forcings.
On annual scale as well as during JJA, observations and the multi-model ensemble agree on the evolution of land TAS in MED, with a cooling trend after the 1940s that peaked in the mid-1970s and a warming trend afterwards. Thus, CMIP6 models are capable of capturing the enhanced MED surface warming due to AA reductions and generally agree on the temperature range with observations. From the peak aerosol period 1970–1979 towards the recent decade 2005–2014, the ensemble of CMIP6 simulations indicate a warming of 1.34 °C over land in the MED region on an annual scale and 1.67 °C during JJA, in relatively good agreement with three observational datasets. The model simulations also indicate that AA reductions between the two decades contribute to this warming roughly by 0.66 °C (49 %) on an annual scale and 0.65 °C (39 %) in JJA. In DJF, there are differences between ESMs and observations with regard to the temperature evolution. While ESMs exhibit a weak cooling–warming pattern before and after the early 1980s, observational datasets show a general monotonic temperature increase. Furthermore, the ensemble of the historical model simulations indicates strongly overestimated warming for DJF (from 1970–1979 towards the recent decade 2005–2014) in comparison to the observational datasets. This could arguably be attributed to overestimated aerosol concentrations in ESMs responsible for the excessive cooling during the period 1960–1990 as well as the different climate model responses to the relatively weaker AA radiative effects and more disturbed midlatitude atmospheric circulation conditions in DJF than in JJA. A warming due to AA decrease is also apparent at higher levels in the troposphere over the MED region, up to around 200 hPa.
ERFTOA and changes (from 1970–1979 towards the recent decade 2005–2014) are not always spatially collocated with the respective TAS changes in the Euro-Mediterranean region, indicating that apart from the radiative effects and aerosol–cloud interactions, atmospheric circulation changes induced by AAs may modify horizontal and vertical heat transport, thus playing an additional role in the redistribution of regional TAS changes and being an important factor in the MED warming.
Cyclonic anomalies are induced by the AA decrease both at sea-level and at 850 hPa on an annual scale and during DJF. These anomalies extend from the North Atlantic to Central and Eastern Europe and could be responsible for warm advection from Northern Africa. During JJA, there is a southerly warm advection towards Southeastern Europe from the northern parts of Africa, which may slightly mitigate the radiative cooling from AAs relative to the pre-industrial era. When AAs are decreased, JJA cyclonic anomalies emerge over the Eastern MED that could contribute to the amplification of the warming over the Eastern MED and Southeastern Europe through weakening of the Etesian wind system and warm advection anomaly from Northeastern Africa. Nevertheless, ESMs show large differences when simulating circulation changes attributed to AA reduction, as revealed by the large inter-model variability and the lack of statistical significance.
Overall, our results demonstrate that recent past acceleration of Mediterranean warming is strongly linked to global aerosol reductions, which have unmasked additional greenhouse gas–driven warming. However, due to the complex nature of aerosol–radiation–cloud interactions resolved in ESMs, which affect the amount of radiation reaching the surface and being trapped within the atmosphere, the robust quantification of AAs contribution in the MED surface warming demands further work, especially when considering the lack of model agreement regarding AA-induced changes in atmospheric circulation that impact heat transfer and temperature anomalies. The design of the AerChemMIP historical experiments used here does not allow attribution of regional AA emission changes to the MED climate. Furthermore, climate model parameterizations limit their ability to simulate certain climate feedbacks, sometimes resulting in large discrepancies between different ESMs.
In this section, the eight CMIP6 ESMs used in this work are described, focusing on their atmospheric general circulation and atmospheric chemistry models.
The Beijing Climate Center Earth System Model version 1 (BCC-ESM1) (Wu et al., 2020; Zhang et al., 2021a) uses the BCC Atmospheric General Model version 3 (BCC-AGCM3-Chem) (Wu et al., 2019) with interactive atmospheric chemistry. The 63 out of 66 chemical species considered in BCC-AGCM3-Chem are the same as those in the “standard version” of the Model for Ozone and Related chemical Tracers version 2 (MOZART2) (Horowitz et al., 2003). Sulfates are considered as prognostic and their treatment follows the Community Atmosphere Model (CAM) version 4 interactive atmospheric chemistry scheme (CAM4-chem) (Lamarque et al., 2012). Two types of organic and black carbon are treated in BCC-AGCM3-Chem, one water-insoluble and one water-soluble tracer. Sea salt and dust aerosols are classified into four size bins each. The mass mixing ratios of bulk aerosols are treated as prognostic variables following the NCAR Community Atmosphere Model (CAM3) (Collins et al., 2004), directly affecting the radiative transfer in the atmosphere. BCC-AGCM3-Chem uses prognostic aerosol masses to estimate the liquid cloud droplet number concentration and considers indirect effects of aerosols (Wu et al., 2019).
The CNRM-ESM2-1 model (Michou et al., 2020; Séférian et al., 2019) developed by CNRM-CERFACS incorporates the Reactive Processes Ruling the Ozone Budget in the Stratosphere Version 2 (REPRO-BUS-C_v2) atmospheric chemistry scheme for 63 chemistry species, in which chemical evolution is calculated only above the 560 hPa level (Michou et al., 2011; Morgenstern et al., 2017). Below that level, the concentrations of certain species are relaxed either toward the yearly evolving global mean abundances (Meinshausen et al., 2017) and for other species toward the 560 hPa value. The Tropospheric Aerosols for ClimaTe In CNRM (TACTIC_v2) interactive tropospheric aerosol scheme has been adapted for use in CNRM-ESM2-1 (Michou et al., 2015), which implements a sectional representation of sea-salt and desert dust aerosols (3 bins each), black carbon and organic matter (2 bins each to distinguish hydrophilic and hydrophobic particles), and sulfates (1 bin). Sulfate precursors evolve in sulfate aerosols with dependence on latitude. These 12 species of tropospheric aerosols are considered as prognostic variables and are affected by transport, dry deposition, and sub-cloud and in-cloud scavenging (Séférian et al., 2019). The cloud droplet number concentration is determined on the concentrations of sea salt, sulfate aerosols, and organic matter as in Menon et al. (2002), thus representing only the cloud albedo effect.
The EC-Earth3-AerChem model (van Noije et al., 2021) is an extended version of EC-Earth3 (Döscher et al., 2022) with an added component to simulate tropospheric aerosols, methane, ozone, and atmospheric chemistry. It uses the McRad radiation package to treat the radiative transfer in clouds (Morcrette et al., 2008). Cloud droplet formation is described by the Abdul-Razzak and Ghan (2000) aerosol activation scheme. Atmospheric chemistry and aerosols are simulated with the Tracer Model version 5 release 3.0 (TM5-mp 3.0), which includes sulfate, black carbon, organic aerosols, mineral dust, and sea salt described by the modal aerosol microphysical scheme M7 (Vignati et al., 2004). Four water-soluble modes (nucleation, Aitken, accumulation, and coarse) and three insoluble modes (Aitken, accumulation, and coarse) are considered in M7, with a lognormal size distribution that has a fixed geometric standard deviation describing each mode. M7 describes the evolution of the total mass and total particle number of each species for each mode, and explains water uptake, new particle formation, and aging through coalescence and condensation (Vignati et al., 2004).
The GFDL-ESM4 model (Dunne et al., 2020; Horowitz et al., 2020) consists of the Geophysical Fluid Dynamics Laboratory (GFDL) Atmosphere Model version 4.1 (AM4.1), which includes an interactive tropospheric and stratospheric gas-phase and aerosol chemistry scheme. It is similar to its previous version (AM4.0) (Zhao et al., 2018a, b), but with some updates: it treats nitrate and ammonium aerosols explicitly, the aging of black and organic carbon aerosols from hydrophobic to hydrophilic forms depends on the calculated concentrations of hydroxyl radical (Liu et al., 2011), and the oxidation of sulfur dioxide and dimethyl sulfide to produce sulfate aerosols is driven by the gas-phase oxidant concentrations and cloud pH simulated by the online chemistry scheme (Paulot et al., 2016). The AM4.1 has an online representation of gas-phase tropospheric and stratospheric chemistry (Horowitz et al., 2020). Aerosols are represented as bulk concentrations of nitrate, ammonium, sulfate, and hydrophilic and hydrophobic black and organic carbon particles, plus five bins each for sea salt and mineral dust aerosols. Sulfate and hydrophilic black carbon aerosols are regarded as being internally mixed by the radiation code (Larry W. Horowitz, personal communication, 2024).
The MPI-ESM-1-2-HAM model consists of the Max Planck Institute for Meteorology Earth System Model (MPI-ESM1.2), which uses the atmospheric general circulation model ECHAM6.3 (Mauritsen et al., 2019), coupled with the Hamburg Aerosol Model version 2.3 (HAM2.3) (Tegen et al., 2019). The ECHAM6.3-HAM2.3 (Lohmann and Neubauer, 2018; Mauritsen et al., 2019; Neubauer et al., 2019e; Tegen et al., 2019) uses a two-moment cloud microphysics scheme to examine aerosol–cloud interactions and to improve cloud simulation (Lohmann and Neubauer, 2018). Aerosol–cloud interactions are simulated in liquid, mixed-phase, and ice clouds (Neubauer et al., 2019e). In ECHAM6.3 the radiative effects of anthropogenic aerosols in the radiation calculation are treated using the MACv2-SP parameterization (Fiedler et al., 2017; Stevens et al., 2017). The aerosol microphysics module HAM (Stier et al., 2005; Zhang et al., 2012) calculates the evolution of aerosol particles considering the black and organic carbon, sulfate, sea salt, and mineral dust. In its default version, HAM simulates the aerosol size spectrum using the M7 (Vignati et al., 2004) scheme (Tegen et al., 2019). The updated version (HAM2.3) uses the scheme by Abdul-Razzak and Ghan (2000) for aerosol activation, along with other modifications for aerosol–cloud interactions, and updated emissions of aerosols and aerosol precursors from anthropogenic and natural sources (Neubauer et al., 2019e; Tegen et al., 2019).
The MRI-ESM2.0 model (Kawai et al., 2019; Oshima et al., 2020; Yukimoto et al., 2019c) consists of the atmospheric general circulation model with land processes MRI-AGCM3.5, coupled with the MRI Chemistry Climate Model version 2.1 (MRI-CCM2.1) atmospheric chemistry model, and the Model of Aerosol Species in the Global Atmosphere mark-2 revision 4-climate (MASINGAR mk-2r4c) aerosol model (Kawai et al., 2019; Yukimoto et al., 2019c). The MRI-CCM2.1 model simulates the evolution and distribution of ozone and other trace gases in the troposphere and middle atmosphere (Yukimoto et al., 2019c). The MASINGAR mk-2r4c model treats physical and chemical processes of atmospheric aerosols and includes black and organic carbon, non-sea-salt sulfate, mineral dust, sea salt, and aerosol precursor gases. Sea salt and mineral dust size distributions are divided into 10 discrete bins, whereas lognormal size distributions represent the sizes of the other aerosols (Oshima et al., 2020). External mixing is assumed for all aerosol species in this model, except for the radiation process in MRI-AGCM3.5, in which hydrophilic BC is assumed to be internally mixed with sulfate (Oshima et al., 2020; Yukimoto et al., 2019c). The conversion rate of hydrophobic to hydrophilic black carbon is based on the Oshima and Koike (2013) parameterization and depends on the rate at which condensable materials cover hydrophobic black carbon (Oshima et al., 2020). The aerosol activation into cloud droplets is based on the Abdul-Razzak et al. (1998), Abdul-Razzak and Ghan (2000), and Takemura et al. (2005) parameterizations.
The NorESM2-LM model (Seland et al., 2020) is the “low-resolution” version of the Norwegian Earth System Model version 2 (NorESM2), which is based on the Community Earth System Model (CESM2.1) (Danabasoglu et al., 2020) but with several modifications. NorESM2 employs the CAM6-Nor atmosphere model, which uses modified (compared to CESM2.1) parameterization schemes for aerosols and aerosol–radiation–cloud interactions (Kirkevåg et al., 2013, 2018), and the OsloAero6 atmospheric aerosol module (Kirkevåg et al., 2018), which describes the formation and evolution of sulfates, black carbon, organic matter, mineral dust, sea salt, and secondary organic aerosols. The major difference between OsloAero6 and other aerosol modules is the division of tracers into “background” and “process” tracers. The “background” tracers are mainly primary emitted particles that form lognormal modes and contribute to the aerosol number concentration. The “process” tracers change the chemical composition and shape of the initially lognormal background modes (Kirkevåg et al., 2018).
The UKESM1 model (Mulcahy et al., 2020; Sellar et al., 2019, 2020), with HadGEM3-GC3.1 (Kuhlbrodt et al., 2018; Williams et al., 2018) as its physical core, uses the UK Chemistry and Aerosol (UKCA) interactive stratosphere–troposphere chemistry scheme (UKCA StratTrop) (Archibald et al., 2020) and the GLOMAP microphysical aerosol scheme (Mann et al., 2010, 2012). The UKCA StratTrop model employs 84 chemical species and represents the chemistry of 81 of these (oxygen, nitrogen, and carbon dioxide are not treated as chemically active species) (Archibald et al., 2020). GLOMAP is a two-moment modal aerosol microphysics scheme which treats the evolution, the sources and sinks of sulfates, black carbon, organic matter, and sea salt across five lognormal size modes. Five aerosol size modes are represented in GLOMAP (nucleation, soluble Aitken, insoluble Aitken, accumulation, and coarse). Mineral dust, on the other hand, is simulated independently using the CLASSIC dust scheme (Bellouin et al., 2011) and can be regarded to be externally mixed with the GLOMAP aerosols (Mulcahy et al., 2020).
All data from the Earth system models used in this paper are available on the Earth System Grid Federation website and can be downloaded from there (https://esgf-node.llnl.gov/search/cmip6/, last access: 31 March 2025, ESGF, 2023). The Berkeley Earth dataset was downloaded from https://berkeleyearth.org/data/ (last access: 13 June 2025). Data for CRU TS v4.08 are available at https://data.ceda.ac.uk/badc/cru/data/cru_ts/cru_ts_4.08/data (last access: 13 June 2025). The University of Delaware dataset was retrieved from https://psl.noaa.gov/data/gridded/data.UDel_AirT_Precip.html (last access: 13 June 2025).
The supplement related to this article is available online at https://doi.org/10.5194/acp-26-9413-2026-supplement.
AK and PZ conceptualized this study. AK, PZ, AKG, and DA designed the analysis. AK performed the formal analysis, produced the figures, and prepared the original draft. All authors contributed to the revision and editing of the paper.
The contact author has declared that none of the authors has any competing interests.
Publisher's note: Copernicus Publications remains neutral with regard to jurisdictional claims made in the text, published maps, institutional affiliations, or any other geographical representation in this paper. The authors bear the ultimate responsibility for providing appropriate place names. Views expressed in the text are those of the authors and do not necessarily reflect the views of the publisher.
The authors acknowledge the World Climate Research Program, which promoted and coordinated CMIP6 through its Working Group on Coupled Modelling. The authors thank the climate modelling groups (listed in Table 1) for producing and making available their model output, the Earth System Grid Federation (ESGF) for archiving the data and providing access, and the multiple funding agencies who support CMIP6 and ESGF. The authors also acknowledge the NSF NCAR Climate Data Guide project for providing information and links to the observation datasets, the NOAA PSL, Boulder, Colorado, USA for providing the University of Delaware Terrestrial Temperature data and Kenji Matsuura for providing guidance, Dr. Kevin Cowtan and the Berkley Earth team for providing their global temperature data. The results presented in this study have been produced using the Aristotle University of Thessaloniki (AUTH) high-performance computing infrastructure and resources (https://hpc.it.auth.gr/, last access: 13 June 2025). The authors would like to thank the two reviewers for their useful comments and constructive criticism.
Alkiviadis Kalisoras, Dimitris Akritidis, and Prodromos Zanis acknowledge support from the REINFORCE (improvements in the simulation of aerosol-climate linkages in earth system models: from global to Regional scalEs) research project; the research project is implemented in the framework of H.F.R.I call “Basic research Financing (Horizontal support of all Sciences)” under the National Recovery and Resilience Plan “Greece 2.0” funded by the European Union – NextGenerationEU (H.F.R.I. Project Number: 15155). Aristeidis K. Georgoulias was partly supported by the EMME-CARE project, which received funding from the European Union's Horizon 2020 Research and Innovation Programme under grant agreement no. 856612, as well as matching co-funding by the Government of the Republic of Cyprus.
This paper was edited by N'Datchoh Evelyne Touré and reviewed by I. Pérez and one anonymous referee.
Aas, W., Mortier, A., Bowersox, V., Cherian, R., Faluvegi, G., Fagerli, H., Hand, J., Klimont, Z., Galy-Lacaux, C., Lehmann, C. M. B., Myhre, C. L., Myhre, G., Olivié, D., Sato, K., Quaas, J., Rao, P. S. P., Schulz, M., Shindell, D., Skeie, R. B., Stein, A., Takemura, T., Tsyro, S., Vet, R., and Xu, X.: Global and regional trends of atmospheric sulfur, Sci. Rep.-UK, 9, 953, https://doi.org/10.1038/s41598-018-37304-0, 2019.
Abdul-Razzak, H. and Ghan, S. J.: A parameterization of aerosol activation: 2. Multiple aerosol types, J. Geophys. Res.-Atmos., 105, 6837–6844, https://doi.org/10.1029/1999JD901161, 2000.
Abdul-Razzak, H., Ghan, S. J., and Rivera-Carpio, C.: A parameterization of aerosol activation: 1. Single aerosol type, J. Geophys. Res.-Atmos., 103, 6123–6131, https://doi.org/10.1029/97JD03735, 1998.
Akritidis, D., Pozzer, A., Flemming, J., Inness, A., and Zanis, P.: A Global Climatology of Tropopause Folds in CAMS and MERRA-2 Reanalyses, J. Geophys. Res.-Atmos., 126, e2020JD034115, https://doi.org/10.1029/2020JD034115, 2021.
Albrecht, B. A.: Aerosols, Cloud Microphysics, and Fractional Cloudiness, Science, 245, 1227–1230, https://doi.org/10.1126/science.245.4923.1227, 1989.
Alexandri, G., Georgoulias, A. K., Meleti, C., Balis, D., Kourtidis, K. A., Sanchez-Lorenzo, A., Trentmann, J., and Zanis, P.: A high resolution satellite view of surface solar radiation over the climatically sensitive region of Eastern Mediterranean, Atmos. Res., 188, 107–121, https://doi.org/10.1016/j.atmosres.2016.12.015, 2017.
Allen, M. R., Gillett, N. P., Kettleborough, J. A., Hegerl, G., Schnur, R., Stott, P. A., Boer, G., Covey, C., Delworth, T. L., Jones, G. S., Mitchell, J. F. B., and Barnett, T. P.: Quantifying anthropogenic influence on recent near-surface temperature change, Surv. Geophys., 27, 491–544, https://doi.org/10.1007/s10712-006-9011-6, 2006.
Allen, R. J., Norris, J. R., and Wild, M.: Evaluation of multidecadal variability in CMIP5 surface solar radiation and inferred underestimation of aerosol direct effects over Europe, China, Japan, and India, J. Geophys. Res.-Atmos., 118, 6311–6336, https://doi.org/10.1002/jgrd.50426, 2013.
Archibald, A. T., O'Connor, F. M., Abraham, N. L., Archer-Nicholls, S., Chipperfield, M. P., Dalvi, M., Folberth, G. A., Dennison, F., Dhomse, S. S., Griffiths, P. T., Hardacre, C., Hewitt, A. J., Hill, R. S., Johnson, C. E., Keeble, J., Köhler, M. O., Morgenstern, O., Mulcahy, J. P., Ordóñez, C., Pope, R. J., Rumbold, S. T., Russo, M. R., Savage, N. H., Sellar, A., Stringer, M., Turnock, S. T., Wild, O., and Zeng, G.: Description and evaluation of the UKCA stratosphere–troposphere chemistry scheme (StratTrop vn 1.0) implemented in UKESM1, Geosci. Model Dev., 13, 1223–1266, https://doi.org/10.5194/gmd-13-1223-2020, 2020.
Bellouin, N., Rae, J., Jones, A., Johnson, C., Haywood, J., and Boucher, O.: Aerosol forcing in the Climate Model Intercomparison Project (CMIP5) simulations by HadGEM2-ES and the role of ammonium nitrate, J. Geophys. Res.-Atmos., 116, https://doi.org/10.1029/2011JD016074, 2011.
Bellouin, N., Quaas, J., Gryspeerdt, E., Kinne, S., Stier, P., Watson-Parris, D., Boucher, O., Carslaw, K. S., Christensen, M., Daniau, A. - L., Dufresne, J. - L., Feingold, G., Fiedler, S., Forster, P., Gettelman, A., Haywood, J. M., Lohmann, U., Malavelle, F., Mauritsen, T., McCoy, D. T., Myhre, G., Mülmenstädt, J., Neubauer, D., Possner, A., Rugenstein, M., Sato, Y., Schulz, M., Schwartz, S. E., Sourdeval, O., Storelvmo, T., Toll, V., Winker, D., and Stevens, B.: Bounding Global Aerosol Radiative Forcing of Climate Change, Rev. Geophys., 58, https://doi.org/10.1029/2019RG000660, 2020.
Boé, J.: Modulation of the summer hydrological cycle evolution over western Europe by anthropogenic aerosols and soil–atmosphere interactions, Geophys. Res. Lett., 43, 7678–7685, https://doi.org/10.1002/2016GL069394, 2016.
Boé, J., Somot, S., Corre, L., and Nabat, P.: Large discrepancies in summer climate change over Europe as projected by global and regional climate models: causes and consequences, Clim. Dynam., 54, 2981–3002, https://doi.org/10.1007/s00382-020-05153-1, 2020.
Cherian, R. and Quaas, J.: Trends in AOD, Clouds, and Cloud Radiative Effects in Satellite Data and CMIP5 and CMIP6 Model Simulations Over Aerosol Source Regions, Geophys. Res. Lett., 47, https://doi.org/10.1029/2020GL087132, 2020.
Collins, W., Rasch, P. J., Boville, B. A., McCaa, J., Williamson, D., Kiehl, J., Briegleb, B. P., Bitz, C. M., Lin, S. J., Zhang, M., and Dai, Y.: Description of the NCAR Community Atmosphere Model (CAM 3.0), University Corporation for Atmospheric Research, https://doi.org/10.5065/D63N21CH, 2004.
Collins, W. J., Lamarque, J.-F., Schulz, M., Boucher, O., Eyring, V., Hegglin, M. I., Maycock, A., Myhre, G., Prather, M., Shindell, D., and Smith, S. J.: AerChemMIP: quantifying the effects of chemistry and aerosols in CMIP6, Geosci. Model Dev., 10, 585–607, https://doi.org/10.5194/gmd-10-585-2017, 2017.
Cos, J., Doblas-Reyes, F., Jury, M., Marcos, R., Bretonnière, P.-A., and Samsó, M.: The Mediterranean climate change hotspot in the CMIP5 and CMIP6 projections, Earth Syst. Dynam., 13, 321–340, https://doi.org/10.5194/esd-13-321-2022, 2022.
Dafka, S., Xoplaki, E., Toreti, A., Zanis, P., Tyrlis, E., Zerefos, C., and Luterbacher, J.: The Etesians: from observations to reanalysis, Clim. Dynam., 47, 1569–1585, https://doi.org/10.1007/s00382-015-2920-7, 2016.
Danabasoglu, G., Lamarque, J.-F., Bacmeister, J., Bailey, D. A., DuVivier, A. K., Edwards, J., Emmons, L. K., Fasullo, J., Garcia, R., Gettelman, A., Hannay, C., Holland, M. M., Large, W. G., Lauritzen, P. H., Lawrence, D. M., Lenaerts, J. T. M., Lindsay, K., Lipscomb, W. H., Mills, M. J., Neale, R., Oleson, K. W., Otto-Bliesner, B., Phillips, A. S., Sacks, W., Tilmes, S., van Kampenhout, L., Vertenstein, M., Bertini, A., Dennis, J., Deser, C., Fischer, C., Fox-Kemper, B., Kay, J. E., Kinnison, D., Kushner, P. J., Larson, V. E., Long, M. C., Mickelson, S., Moore, J. K., Nienhouse, E., Polvani, L., Rasch, P. J., and Strand, W. G.: The Community Earth System Model Version 2 (CESM2), J. Adv. Model. Earth Sy., 12, e2019MS001916, https://doi.org/10.1029/2019MS001916, 2020.
Delworth, T. L., Cooke, W. F., Naik, V., Paynter, D., and Zhang, L.: A weakened AMOC may prolong greenhouse gas–induced Mediterranean drying even with significant and rapid climate change mitigation, P. Natl. Acad. Sci. USA, 119, e2116655119, https://doi.org/10.1073/pnas.2116655119, 2022.
Doblas-Reyes, F. J., Sörensson, A. A., Almazroui, M., Dosio, A., Gutowski, W. J., Haarsma, R., Hamdi, R., Hewitson, B., Kwon, W.-T., Lamptey, B. L., Maraun, D., Stephenson, T. S., Takayabu, I., Terray, L., Turner, A., and Zuo, Z.: Linking global to regional climate change, in: Climate Change 2021: The Physical Science Basis. Contribution of Working Group I to the Sixth Assessment Report of the Intergovernmental Panel on Climate Change, edited by: Masson-Delmotte, V., Zhai, P., Pirani, A., Connors, S. L., Péan, C., Berger, S., Caud, N., Chen, Y., Goldfarb, L., Gomis, M. I., Huang, M., Leitzell, K., Lonnoy, E., Matthews, J. B. R., Maycock, T. K., Waterfield, T., Yelekçi, Ö., Yu, R., and Zhou, B., Cambridge University Press, Cambridge, United Kingdom and New York, NY, USA, 1363–1512, https://doi.org/10.1017/9781009157896.012, 2021.
Dong, B. and Sutton, R. T.: Recent Trends in Summer Atmospheric Circulation in the North Atlantic/European Region: Is There a Role for Anthropogenic Aerosols?, J. Climate, 34, 6777–6795, https://doi.org/10.1175/JCLI-D-20-0665.1, 2021.
Dong, B., Sutton, R. T., and Shaffrey, L.: Understanding the rapid summer warming and changes in temperature extremes since the mid-1990s over Western Europe, Clim. Dynam., 48, 1537–1554, https://doi.org/10.1007/s00382-016-3158-8, 2017.
Döscher, R., Acosta, M., Alessandri, A., Anthoni, P., Arsouze, T., Bergman, T., Bernardello, R., Boussetta, S., Caron, L.-P., Carver, G., Castrillo, M., Catalano, F., Cvijanovic, I., Davini, P., Dekker, E., Doblas-Reyes, F. J., Docquier, D., Echevarria, P., Fladrich, U., Fuentes-Franco, R., Gröger, M., v. Hardenberg, J., Hieronymus, J., Karami, M. P., Keskinen, J.-P., Koenigk, T., Makkonen, R., Massonnet, F., Ménégoz, M., Miller, P. A., Moreno-Chamarro, E., Nieradzik, L., van Noije, T., Nolan, P., O'Donnell, D., Ollinaho, P., van den Oord, G., Ortega, P., Prims, O. T., Ramos, A., Reerink, T., Rousset, C., Ruprich-Robert, Y., Le Sager, P., Schmith, T., Schrödner, R., Serva, F., Sicardi, V., Sloth Madsen, M., Smith, B., Tian, T., Tourigny, E., Uotila, P., Vancoppenolle, M., Wang, S., Wårlind, D., Willén, U., Wyser, K., Yang, S., Yepes-Arbós, X., and Zhang, Q.: The EC-Earth3 Earth system model for the Coupled Model Intercomparison Project 6, Geosci. Model Dev., 15, 2973–3020, https://doi.org/10.5194/gmd-15-2973-2022, 2022.
Drugé, T., Nabat, P., Mallet, M., and Somot, S.: Future evolution of aerosols and implications for climate change in the Euro-Mediterranean region using the CNRM-ALADIN63 regional climate model, Atmos. Chem. Phys., 21, 7639–7669, https://doi.org/10.5194/acp-21-7639-2021, 2021.
Dunne, J. P., Horowitz, L. W., Adcroft, A. J., Ginoux, P., Held, I. M., John, J. G., Krasting, J. P., Malyshev, S., Naik, V., Paulot, F., Shevliakova, E., Stock, C. A., Zadeh, N., Balaji, V., Blanton, C., Dunne, K. A., Dupuis, C., Durachta, J., Dussin, R., Gauthier, P. P. G., Griffies, S. M., Guo, H., Hallberg, R. W., Harrison, M., He, J., Hurlin, W., McHugh, C., Menzel, R., Milly, P. C. D., Nikonov, S., Paynter, D. J., Ploshay, J., Radhakrishnan, A., Rand, K., Reichl, B. G., Robinson, T., Schwarzkopf, D. M., Sentman, L. T., Underwood, S., Vahlenkamp, H., Winton, M., Wittenberg, A. T., Wyman, B., Zeng, Y., and Zhao, M.: The GFDL Earth System Model Version 4.1 (GFDL-ESM 4.1): Overall Coupled Model Description and Simulation Characteristics, J. Adv. Model. Earth Sy., 12, e2019MS002015, https://doi.org/10.1029/2019MS002015, 2020.
EC-Earth Consortium: EC-Earth-Consortium EC-Earth3-AerChem model output prepared for CMIP6 AerChemMIP hist-piAer, https://doi.org/10.22033/ESGF/CMIP6.4689, 2020a.
EC-Earth Consortium: EC-Earth-Consortium EC-Earth3-AerChem model output prepared for CMIP6 CMIP, https://doi.org/10.22033/ESGF/CMIP6.639, 2020b.
EC-Earth Consortium: EC-Earth-Consortium EC-Earth3-AerChem model output prepared for CMIP6 CMIP historical, https://doi.org/10.22033/ESGF/CMIP6.4701, 2020c.
EC-Earth Consortium: EC-Earth-Consortium EC-Earth3-AerChem model output prepared for CMIP6 AerChemMIP histSST-piAer, https://doi.org/10.22033/ESGF/CMIP6.4695, 2021.
Elkins, S., Fiore, A. M., Correa, G. P., Lamarque, J.-F., Smith, S. J., Naik, V., and Xu, Y.: Detecting tropospheric composition and climate responses to US air pollution controls in the context of internally-arising variability, npj Clean Air, 1, 17, https://doi.org/10.1038/s44407-025-00016-7, 2025.
Eyring, V., Bony, S., Meehl, G. A., Senior, C. A., Stevens, B., Stouffer, R. J., and Taylor, K. E.: Overview of the Coupled Model Intercomparison Project Phase 6 (CMIP6) experimental design and organization, Geosci. Model Dev., 9, 1937–1958, https://doi.org/10.5194/gmd-9-1937-2016, 2016.
Feng, X.-F. and Qian, C.: Detection, attribution and projection of changes in the extreme temperature range in the Northern Hemisphere, Advances in Climate Change Research, 15, 989–1002, https://doi.org/10.1016/j.accre.2024.10.006, 2024.
Fiedler, S., Stevens, B., and Mauritsen, T.: On the sensitivity of anthropogenic aerosol forcing to model-internal variability and parameterizing a Twomey effect, J. Adv. Model. Earth Sy., 9, 1325–1341, https://doi.org/10.1002/2017MS000932, 2017.
Folini, D. and Wild, M.: Aerosol emissions and dimming/brightening in Europe: Sensitivity studies with ECHAM5-HAM, J. Geophys. Res.-Atmos., 116, https://doi.org/10.1029/2011JD016227, 2011.
Forster, P., Storelvmo, T., Armour, K., Collins, W., Dufresne, J.-L., Frame, D., Lunt, D. J., Mauritsen, T., Palmer, M. D., Watanabe, M., Wild, M., and Zhang, X.: The Earth's energy budget, climate feedbacks, and climate sensitivity, in: Climate Change 2021: The Physical Science Basis. Contribution of Working Group I to the Sixth Assessment Report of the Intergovernmental Panel on Climate Change, edited by: Masson-Delmotte, V., Zhai, P., Pirani, A., Connors, S. L., Péan, C., Berger, S., Caud, N., Chen, Y., Goldfarb, L., Gomis, M. I., Huang, M., Leitzell, K., Lonnoy, E., Matthews, J. B. R., Maycock, T. K., Waterfield, T., Yelekçi, Ö., Yu, R., and Zhou, B., Cambridge University Press, Cambridge, United Kingdom and New York, NY, USA, 923–1054, https://doi.org/10.1017/9781009157896.009, 2021.
Forster, P. M., Richardson, T., Maycock, A. C., Smith, C. J., Samset, B. H., Myhre, G., Andrews, T., Pincus, R., and Schulz, M.: Recommendations for diagnosing effective radiative forcing from climate models for CMIP6, J. Geophys. Res.-Atmos., 121, 12460-12475, https://doi.org/10.1002/2016JD025320, 2016.
Galanaki, E., Emmanouil, G., Lagouvardos, K., and Kotroni, V.: Long-Term Patterns and Trends of Shortwave Global Irradiance over the Euro-Mediterranean Region, Atmosphere, 12, 1431, https://doi.org/10.3390/atmos12111431, 2021.
Glantz, P., Fawole, O. G., Ström, J., Wild, M., and Noone, K. J.: Unmasking the Effects of Aerosols on Greenhouse Warming Over Europe, J. Geophys. Res.-Atmos., 127, e2021JD035889, https://doi.org/10.1029/2021JD035889, 2022.
Gulev, S. K., Thorne, P. W., Ahn, J., Dentener, F. J., Domingues, C. M., Gerland, S., Gong, D., Kaufman, D. S., Nnamchi, H. C., Quaas, J., Rivera, J. A., Sathyendranath, S., Smith, S. L., Trewin, B., von Shuckmann, K., and Vose, R. S.: Changing state of the climate system, in: Climate Change 2021: The Physical Science Basis. Contribution of Working Group I to the Sixth Assessment Report of the Intergovernmental Panel on Climate Change, edited by: Masson-Delmotte, V., Zhai, P., Pirani, A., Connors, S. L., Péan, C., Berger, S., Caud, N., Chen, Y., Goldfarb, L., Gomis, M. I., Huang, M., Leitzell, K., Lonnoy, E., Matthews, J. B. R., Maycock, T. K., Waterfield, T., Yelekçi, Ö., Yu, R., and Zhou, B., Cambridge University Press, Cambridge, United Kingdom and New York, NY, USA, 287–422, https://doi.org/10.1017/9781009157896.004, 2021.
Gutiérrez, J. M., Jones, R. G., Narisma, G. T., Muniz Alves, L., Amjad, M., Gorodetskaya, I. V., Grose, M., Klutse, N. A. B., Krakovska, S., Li, J., Martínez-Castro, D., Mearns, L. O., Mernild, S. H., Ngo-Duc, T., van den Hurk, B., and Yoon, J.-H.: Atlas, in: Climate Change 2021: The Physical Science Basis. Contribution of Working Group I to the Sixth Assessment Report of the Intergovernmental Panel on Climate Change, edited by: Masson-Delmotte, V., Zhai, P., Pirani, A., Connors, S. L., Péan, C., Berger, S., Caud, N., Chen, Y., Goldfarb, L., Gomis, M. I., Huang, M., Leitzell, K., Lonnoy, E., Matthews, J. B. R., Maycock, T. K., Waterfield, T., Yelekçi, Ö., Yu, R., and Zhou, B., Cambridge University Press, Cambridge, United Kingdom and New York, NY, USA, 1927–2058, https://doi.org/10.1017/9781009157896.021, 2021.
Hansen, J., Sato, M., Ruedy, R., Nazarenko, L., Lacis, A., Schmidt, G. A., Russell, G., Aleinov, I., Bauer, M., Bauer, S., Bell, N., Cairns, B., Canuto, V., Chandler, M., Cheng, Y., Del Genio, A., Faluvegi, G., Fleming, E., Friend, A., Hall, T., Jackman, C., Kelley, M., Kiang, N., Koch, D., Lean, J., Lerner, J., Lo, K., Menon, S., Miller, R., Minnis, P., Novakov, T., Oinas, V., Perlwitz, Ja., Perlwitz, Ju., Rind, D., Romanou, A., Shindell, D., Stone, P., Sun, S., Tausnev, N., Thresher, D., Wielicki, B., Wong, T., Yao, M., and Zhang, S.: Efficacy of climate forcings, J. Geophys. Res.-Atmos., 110, https://doi.org/10.1029/2005JD005776, 2005.
Harris, I., Osborn, T. J., Jones, P., and Lister, D.: Version 4 of the CRU TS monthly high-resolution gridded multivariate climate dataset, Sci. Data, 7, 109, https://doi.org/10.1038/s41597-020-0453-3, 2020.
Haugvaldstad, O. W., Olivié, D., Storelvmo, T., and Schulz, M.: Dust radiative forcing in CMIP6 Earth System models: insights from the AerChemMIP piClim-2xdust experiment, Atmos. Chem. Phys., 25, 13199–13219, https://doi.org/10.5194/acp-25-13199-2025, 2025.
Hodnebrog, Ø., Myhre, G., Jouan, C., Andrews, T., Forster, P. M., Jia, H., Loeb, N. G., Olivié, D. J. L., Paynter, D., Quaas, J., Raghuraman, S. P., and Schulz, M.: Recent reductions in aerosol emissions have increased Earth's energy imbalance, Commun Earth Environ, 5, 1–9, https://doi.org/10.1038/s43247-024-01324-8, 2024.
Hoesly, R. M., Smith, S. J., Feng, L., Klimont, Z., Janssens-Maenhout, G., Pitkanen, T., Seibert, J. J., Vu, L., Andres, R. J., Bolt, R. M., Bond, T. C., Dawidowski, L., Kholod, N., Kurokawa, J.-I., Li, M., Liu, L., Lu, Z., Moura, M. C. P., O'Rourke, P. R., and Zhang, Q.: Historical (1750–2014) anthropogenic emissions of reactive gases and aerosols from the Community Emissions Data System (CEDS), Geosci. Model Dev., 11, 369–408, https://doi.org/10.5194/gmd-11-369-2018, 2018.
Horowitz, L. W., Walters, S., Mauzerall, D. L., Emmons, L. K., Rasch, P. J., Granier, C., Tie, X., Lamarque, J.-F., Schultz, M. G., Tyndall, G. S., Orlando, J. J., and Brasseur, G. P.: A global simulation of tropospheric ozone and related tracers: Description and evaluation of MOZART, version 2, J. Geophys. Res.-Atmos., 108, https://doi.org/10.1029/2002JD002853, 2003.
Horowitz, L. W., Naik, V., Sentman, L., Paulot, F., Blanton, C., McHugh, C., Radhakrishnan, A., Rand, K., Vahlenkamp, H., Zadeh, N. T., Wilson, C., Ginoux, P., He, J., John, J. G., Lin, M., Paynter, D. J., Ploshay, J., Zhang, A., and Zeng, Y.: NOAA-GFDL GFDL-ESM4 model output prepared for CMIP6 AerChemMIP hist-piAer, https://doi.org/10.22033/ESGF/CMIP6.8577, 2018a.
Horowitz, L. W., Naik, V., Sentman, L., Paulot, F., Blanton, C., McHugh, C., Radhakrishnan, A., Rand, K., Vahlenkamp, H., Zadeh, N. T., Wilson, C., Ginoux, P., He, J., John, J. G., Lin, M., Paynter, D. J., Ploshay, J., Zhang, A., and Zeng, Y.: NOAA-GFDL GFDL-ESM4 model output prepared for CMIP6 AerChemMIP histSST, https://doi.org/10.22033/ESGF/CMIP6.8586, 2018b.
Horowitz, L. W., Naik, V., Sentman, L., Paulot, F., Blanton, C., McHugh, C., Radhakrishnan, A., Rand, K., Vahlenkamp, H., Zadeh, N. T., Wilson, C., Ginoux, P., He, J., John, J. G., Lin, M., Paynter, D. J., Ploshay, J., Zhang, A., and Zeng, Y.: NOAA-GFDL GFDL-ESM4 model output prepared for CMIP6 AerChemMIP histSST-piAer, https://doi.org/10.22033/ESGF/CMIP6.8588, 2018c.
Horowitz, L. W., Naik, V., Paulot, F., Ginoux, P. A., Dunne, J. P., Mao, J., Schnell, J., Chen, X., He, J., John, J. G., Lin, M., Lin, P., Malyshev, S., Paynter, D., Shevliakova, E., and Zhao, M.: The GFDL Global Atmospheric Chemistry-Climate Model AM4.1: Model Description and Simulation Characteristics, J. Adv. Model. Earth Sy., 12, e2019MS002032, https://doi.org/10.1029/2019MS002032, 2020.
Jones, G. S., Andrews, M. B., Andrews, T., Blockley, E., Ciavarella, A., Christidis, N., Cotterill, D. F., Lott, F. C., Ridley, J., and Stott, P. A.: The HadGEM3-GC3.1 Contribution to the CMIP6 Detection and Attribution Model Intercomparison Project, J. Adv. Model. Earth Sy., 16, e2023MS004135, https://doi.org/10.1029/2023MS004135, 2024.
Kalisoras, A., Georgoulias, A. K., Akritidis, D., Allen, R. J., Naik, V., Kuo, C., Szopa, S., Nabat, P., Olivié, D., van Noije, T., Le Sager, P., Neubauer, D., Oshima, N., Mulcahy, J., Horowitz, L. W., and Zanis, P.: Decomposing the effective radiative forcing of anthropogenic aerosols based on CMIP6 Earth system models, Atmos. Chem. Phys., 24, 7837–7872, https://doi.org/10.5194/acp-24-7837-2024, 2024.
Kasoar, M., Voulgarakis, A., Lamarque, J.-F., Shindell, D. T., Bellouin, N., Collins, W. J., Faluvegi, G., and Tsigaridis, K.: Regional and global temperature response to anthropogenic SO2 emissions from China in three climate models, Atmos. Chem. Phys., 16, 9785–9804, https://doi.org/10.5194/acp-16-9785-2016, 2016.
Kawai, H., Yukimoto, S., Koshiro, T., Oshima, N., Tanaka, T., Yoshimura, H., and Nagasawa, R.: Significant improvement of cloud representation in the global climate model MRI-ESM2, Geosci. Model Dev., 12, 2875–2897, https://doi.org/10.5194/gmd-12-2875-2019, 2019.
Kirkevåg, A., Iversen, T., Seland, Ø., Hoose, C., Kristjánsson, J. E., Struthers, H., Ekman, A. M. L., Ghan, S., Griesfeller, J., Nilsson, E. D., and Schulz, M.: Aerosol–climate interactions in the Norwegian Earth System Model – NorESM1-M, Geosci. Model Dev., 6, 207–244, https://doi.org/10.5194/gmd-6-207-2013, 2013.
Kirkevåg, A., Grini, A., Olivié, D., Seland, Ø., Alterskjær, K., Hummel, M., Karset, I. H. H., Lewinschal, A., Liu, X., Makkonen, R., Bethke, I., Griesfeller, J., Schulz, M., and Iversen, T.: A production-tagged aerosol module for Earth system models, OsloAero5.3 – extensions and updates for CAM5.3-Oslo, Geosci. Model Dev., 11, 3945–3982, https://doi.org/10.5194/gmd-11-3945-2018, 2018.
Klimont, Z., Smith, S. J., and Cofala, J.: The last decade of global anthropogenic sulfur dioxide: 2000–2011 emissions, Environ. Res. Lett., 8, 014003, https://doi.org/10.1088/1748-9326/8/1/014003, 2013.
Krasting, J. P., John, J. G., Blanton, C., McHugh, C., Nikonov, S., Radhakrishnan, A., Rand, K., Zadeh, N. T., Balaji, V., Durachta, J., Dupuis, C., Menzel, R., Robinson, T., Underwood, S., Vahlenkamp, H., Dunne, K. A., Gauthier, P. P., Ginoux, P., Griffies, S. M., Hallberg, R., Harrison, M., Hurlin, W., Malyshev, S., Naik, V., Paulot, F., Paynter, D. J., Ploshay, J., Reichl, B. G., Schwarzkopf, D. M., Seman, C. J., Silvers, L., Wyman, B., Zeng, Y., Adcroft, A., Dunne, J. P., Dussin, R., Guo, H., He, J., Held, I. M., Horowitz, L. W., Lin, P., Milly, P. C. D., Shevliakova, E., Stock, C., Winton, M., Wittenberg, A. T., Xie, Y., and Zhao, M.: NOAA-GFDL GFDL-ESM4 model output prepared for CMIP6 CMIP historical, https://doi.org/10.22033/ESGF/CMIP6.8597, 2018.
Kuhlbrodt, T., Jones, C. G., Sellar, A., Storkey, D., Blockley, E., Stringer, M., Hill, R., Graham, T., Ridley, J., Blaker, A., Calvert, D., Copsey, D., Ellis, R., Hewitt, H., Hyder, P., Ineson, S., Mulcahy, J., Siahaan, A., and Walton, J.: The Low-Resolution Version of HadGEM3 GC3.1: Development and Evaluation for Global Climate, J. Adv. Model. Earth Sy., 10, 2865–2888, https://doi.org/10.1029/2018MS001370, 2018.
Lamarque, J.-F., Emmons, L. K., Hess, P. G., Kinnison, D. E., Tilmes, S., Vitt, F., Heald, C. L., Holland, E. A., Lauritzen, P. H., Neu, J., Orlando, J. J., Rasch, P. J., and Tyndall, G. K.: CAM-chem: description and evaluation of interactive atmospheric chemistry in the Community Earth System Model, Geosci. Model Dev., 5, 369–411, https://doi.org/10.5194/gmd-5-369-2012, 2012.
Lionello, P. and Scarascia, L.: The relation between climate change in the Mediterranean region and global warming, Reg. Environ. Change, 18, 1481–1493, https://doi.org/10.1007/s10113-018-1290-1, 2018.
Liu, J., Fan, S., Horowitz, L. W., and Levy II, H.: Evaluation of factors controlling long-range transport of black carbon to the Arctic, J. Geophys. Res.-Atmos., 116, https://doi.org/10.1029/2010JD015145, 2011.
Liu, L., Shawki, D., Voulgarakis, A., Kasoar, M., Samset, B. H., Myhre, G., Forster, P. M., Hodnebrog, Ø., Sillmann, J., Aalbergsjø, S. G., Boucher, O., Faluvegi, G., Iversen, T., Kirkevåg, A., Lamarque, J.-F., Olivié, D., Richardson, T., Shindell, D., and Takemura, T.: A PDRMIP Multimodel Study on the Impacts of Regional Aerosol Forcings on Global and Regional Precipitation, J. Climate, 31, 4429–4447, https://doi.org/10.1175/JCLI-D-17-0439.1, 2018.
Lohmann, U. and Neubauer, D.: The importance of mixed-phase and ice clouds for climate sensitivity in the global aerosol–climate model ECHAM6-HAM2, Atmos. Chem. Phys., 18, 8807–8828, https://doi.org/10.5194/acp-18-8807-2018, 2018.
Mann, G. W., Carslaw, K. S., Spracklen, D. V., Ridley, D. A., Manktelow, P. T., Chipperfield, M. P., Pickering, S. J., and Johnson, C. E.: Description and evaluation of GLOMAP-mode: a modal global aerosol microphysics model for the UKCA composition-climate model, Geosci. Model Dev., 3, 519–551, https://doi.org/10.5194/gmd-3-519-2010, 2010.
Mann, G. W., Carslaw, K. S., Ridley, D. A., Spracklen, D. V., Pringle, K. J., Merikanto, J., Korhonen, H., Schwarz, J. P., Lee, L. A., Manktelow, P. T., Woodhouse, M. T., Schmidt, A., Breider, T. J., Emmerson, K. M., Reddington, C. L., Chipperfield, M. P., and Pickering, S. J.: Intercomparison of modal and sectional aerosol microphysics representations within the same 3-D global chemical transport model, Atmos. Chem. Phys., 12, 4449–4476, https://doi.org/10.5194/acp-12-4449-2012, 2012.
Mauritsen, T., Bader, J., Becker, T., Behrens, J., Bittner, M., Brokopf, R., Brovkin, V., Claussen, M., Crueger, T., Esch, M., Fast, I., Fiedler, S., Fläschner, D., Gayler, V., Giorgetta, M., Goll, D. S., Haak, H., Hagemann, S., Hedemann, C., Hohenegger, C., Ilyina, T., Jahns, T., Jimenéz-de-la-Cuesta, D., Jungclaus, J., Kleinen, T., Kloster, S., Kracher, D., Kinne, S., Kleberg, D., Lasslop, G., Kornblueh, L., Marotzke, J., Matei, D., Meraner, K., Mikolajewicz, U., Modali, K., Möbis, B., Müller, W. A., Nabel, J. E. M. S., Nam, C. C. W., Notz, D., Nyawira, S.-S., Paulsen, H., Peters, K., Pincus, R., Pohlmann, H., Pongratz, J., Popp, M., Raddatz, T. J., Rast, S., Redler, R., Reick, C. H., Rohrschneider, T., Schemann, V., Schmidt, H., Schnur, R., Schulzweida, U., Six, K. D., Stein, L., Stemmler, I., Stevens, B., von Storch, J.-S., Tian, F., Voigt, A., Vrese, P., Wieners, K.-H., Wilkenskjeld, S., Winkler, A., and Roeckner, E.: Developments in the MPI-M Earth System Model version 1.2 (MPI-ESM1.2) and Its Response to Increasing CO2, J. Adv. Model. Earth Sy., 11, 998–1038, https://doi.org/10.1029/2018MS001400, 2019.
MedECC: Climate and Environmental Change in the Mediterranean Basin – Current Situation and Risks for the Future. First Mediterranean Assessment Report, edited by: Cramer, W., Guiot, J., and Marini, K., Union for the Mediterranean, Plan Bleu, UNEP/MAP, Marseille, France, 632 pp., https://doi.org/10.5281/zenodo.4768833, 2020.
Meinshausen, M., Vogel, E., Nauels, A., Lorbacher, K., Meinshausen, N., Etheridge, D. M., Fraser, P. J., Montzka, S. A., Rayner, P. J., Trudinger, C. M., Krummel, P. B., Beyerle, U., Canadell, J. G., Daniel, J. S., Enting, I. G., Law, R. M., Lunder, C. R., O'Doherty, S., Prinn, R. G., Reimann, S., Rubino, M., Velders, G. J. M., Vollmer, M. K., Wang, R. H. J., and Weiss, R.: Historical greenhouse gas concentrations for climate modelling (CMIP6), Geosci. Model Dev., 10, 2057–2116, https://doi.org/10.5194/gmd-10-2057-2017, 2017.
Menon, S., Genio, A. D. D., Koch, D., and Tselioudis, G.: GCM Simulations of the Aerosol Indirect Effect: Sensitivity to Cloud Parameterization and Aerosol Burden, 2002.
Michou, M., Saint-Martin, D., Teyssèdre, H., Alias, A., Karcher, F., Olivié, D., Voldoire, A., Josse, B., Peuch, V.-H., Clark, H., Lee, J. N., and Chéroux, F.: A new version of the CNRM Chemistry-Climate Model, CNRM-CCM: description and improvements from the CCMVal-2 simulations, Geosci. Model Dev., 4, 873–900, https://doi.org/10.5194/gmd-4-873-2011, 2011.
Michou, M., Nabat, P., and Saint-Martin, D.: Development and basic evaluation of a prognostic aerosol scheme (v1) in the CNRM Climate Model CNRM-CM6, Geosci. Model Dev., 8, 501–531, https://doi.org/10.5194/gmd-8-501-2015, 2015.
Michou, M., Nabat, P., Saint-Martin, D., Bock, J., Decharme, B., Mallet, M., Roehrig, R., Séférian, R., Sénési, S., and Voldoire, A.: Present-Day and Historical Aerosol and Ozone Characteristics in CNRM CMIP6 Simulations, J. Adv. Model. Earth Syst., 12, https://doi.org/10.1029/2019MS001816, 2020.
Morcrette, J.-J., Barker, H. W., Cole, J. N. S., Iacono, M. J., and Pincus, R.: Impact of a New Radiation Package, McRad, in the ECMWF Integrated Forecasting System, Mon. Weather Rev., 136, 4773–4798, https://doi.org/10.1175/2008MWR2363.1, 2008.
Morgenstern, O., Hegglin, M. I., Rozanov, E., O'Connor, F. M., Abraham, N. L., Akiyoshi, H., Archibald, A. T., Bekki, S., Butchart, N., Chipperfield, M. P., Deushi, M., Dhomse, S. S., Garcia, R. R., Hardiman, S. C., Horowitz, L. W., Jöckel, P., Josse, B., Kinnison, D., Lin, M., Mancini, E., Manyin, M. E., Marchand, M., Marécal, V., Michou, M., Oman, L. D., Pitari, G., Plummer, D. A., Revell, L. E., Saint-Martin, D., Schofield, R., Stenke, A., Stone, K., Sudo, K., Tanaka, T. Y., Tilmes, S., Yamashita, Y., Yoshida, K., and Zeng, G.: Review of the global models used within phase 1 of the Chemistry–Climate Model Initiative (CCMI), Geosci. Model Dev., 10, 639–671, https://doi.org/10.5194/gmd-10-639-2017, 2017.
Mulcahy, J. P., Johnson, C., Jones, C. G., Povey, A. C., Scott, C. E., Sellar, A., Turnock, S. T., Woodhouse, M. T., Abraham, N. L., Andrews, M. B., Bellouin, N., Browse, J., Carslaw, K. S., Dalvi, M., Folberth, G. A., Glover, M., Grosvenor, D. P., Hardacre, C., Hill, R., Johnson, B., Jones, A., Kipling, Z., Mann, G., Mollard, J., O'Connor, F. M., Palmiéri, J., Reddington, C., Rumbold, S. T., Richardson, M., Schutgens, N. A. J., Stier, P., Stringer, M., Tang, Y., Walton, J., Woodward, S., and Yool, A.: Description and evaluation of aerosol in UKESM1 and HadGEM3-GC3.1 CMIP6 historical simulations, Geosci. Model Dev., 13, 6383–6423, https://doi.org/10.5194/gmd-13-6383-2020, 2020.
Myhre, G., Shindell, D., Bréon, F.-M., Collins, W., Fuglestvedt, J., Huang, J., Koch, D., Lamarque, J.-F., Lee, D., Mendoza, B., Nakajima, T., Robock, A., Stephens, G., Takemura, T., and Zhang, H.: Anthropogenic and Natural Radiative Forcing, in: Climate Change 2013 – The Physical Science Basis: Working Group I Contribution to the Fifth Assessment Report of the Intergovernmental Panel on Climate Change, edited by: Stocker, T. F., Qin, D., Plattner, G.-K., Tignor, M., Allen, S. K., Boschung, J., Nauels, A., Xia, Y., Bex, V., and Midgley, P. M., Cambridge University Press, Cambridge, United Kingdom and New York, NY, USA, 659–740, https://doi.org/10.1017/CBO9781107415324.018, 2013.
Myhre, G., Aas, W., Cherian, R., Collins, W., Faluvegi, G., Flanner, M., Forster, P., Hodnebrog, Ø., Klimont, Z., Lund, M. T., Mülmenstädt, J., Lund Myhre, C., Olivié, D., Prather, M., Quaas, J., Samset, B. H., Schnell, J. L., Schulz, M., Shindell, D., Skeie, R. B., Takemura, T., and Tsyro, S.: Multi-model simulations of aerosol and ozone radiative forcing due to anthropogenic emission changes during the period 1990–2015, Atmos. Chem. Phys., 17, 2709–2720, https://doi.org/10.5194/acp-17-2709-2017, 2017a.
Myhre, G., Forster, P. M., Samset, B. H., Hodnebrog, Ø., Sillmann, J., Aalbergsjø, S. G., Andrews, T., Boucher, O., Faluvegi, G., Fläschner, D., Iversen, T., Kasoar, M., Kharin, V., Kirkevåg, A., Lamarque, J.-F., Olivié, D., Richardson, T. B., Shindell, D., Shine, K. P., Stjern, C. W., Takemura, T., Voulgarakis, A., and Zwiers, F.: PDRMIP: A Precipitation Driver and Response Model Intercomparison Project – Protocol and Preliminary Results, Bulletin of the American Meteorological Society, 98, 1185–1198, https://doi.org/10.1175/BAMS-D-16-0019.1, 2017b.
Nabat, P., Somot, S., Mallet, M., Sanchez-Lorenzo, A., and Wild, M.: Contribution of anthropogenic sulfate aerosols to the changing Euro-Mediterranean climate since 1980, Geophys. Res. Lett., 41, 5605–5611, https://doi.org/10.1002/2014GL060798, 2014.
Nabat, P., Somot, S., Cassou, C., Mallet, M., Michou, M., Bouniol, D., Decharme, B., Drugé, T., Roehrig, R., and Saint-Martin, D.: Modulation of radiative aerosols effects by atmospheric circulation over the Euro-Mediterranean region, Atmos. Chem. Phys., 20, 8315–8349, https://doi.org/10.5194/acp-20-8315-2020, 2020.
Nabat, P., Somot, S., Boé, J., Corre, L., Katragkou, E., Li, S., Mallet, M., van Meijgaard, E., Pavlidis, V., Pietikäinen, J.-P., Sørland, S., and Solmon, F.: Multi-Model Assessment of the Role of Anthropogenic Aerosols in Summertime Climate Change in Europe, Geophys. Res. Lett., 52, e2024GL112474, https://doi.org/10.1029/2024GL112474, 2025.
Navarro, J. C. A., Ekman, A. M. L., Pausata, F. S. R., Lewinschal, A., Varma, V., Seland, Ø., Gauss, M., Iversen, T., Kirkevåg, A., Riipinen, I., and Hansson, H. C.: Future Response of Temperature and Precipitation to Reduced Aerosol Emissions as Compared with Increased Greenhouse Gas Concentrations, https://doi.org/10.1175/JCLI-D-16-0466.1, 2017.
Neubauer, D., Ferrachat, S., Siegenthaler-Le Drian, C., Stoll, J., Folini, D. S., Tegen, I., Wieners, K.-H., Mauritsen, T., Stemmler, I., Barthel, S., Bey, I., Daskalakis, N., Heinold, B., Kokkola, H., Partridge, D., Rast, S., Schmidt, H., Schutgens, N., Stanelle, T., Stier, P., Watson-Parris, D., and Lohmann, U.: HAMMOZ-Consortium MPI-ESM1.2-HAM model output prepared for CMIP6 AerChemMIP hist-piAer, https://doi.org/10.22033/ESGF/CMIP6.5007, 2019a.
Neubauer, D., Ferrachat, S., Siegenthaler-Le Drian, C., Stoll, J., Folini, D. S., Tegen, I., Wieners, K.-H., Mauritsen, T., Stemmler, I., Barthel, S., Bey, I., Daskalakis, N., Heinold, B., Kokkola, H., Partridge, D., Rast, S., Schmidt, H., Schutgens, N., Stanelle, T., Stier, P., Watson-Parris, D., and Lohmann, U.: HAMMOZ-Consortium MPI-ESM1.2-HAM model output prepared for CMIP6 AerChemMIP histSST, https://doi.org/10.22033/ESGF/CMIP6.5009, 2019b.
Neubauer, D., Ferrachat, S., Siegenthaler-Le Drian, C., Stoll, J., Folini, D. S., Tegen, I., Wieners, K.-H., Mauritsen, T., Stemmler, I., Barthel, S., Bey, I., Daskalakis, N., Heinold, B., Kokkola, H., Partridge, D., Rast, S., Schmidt, H., Schutgens, N., Stanelle, T., Stier, P., Watson-Parris, D., and Lohmann, U.: HAMMOZ-Consortium MPI-ESM1.2-HAM model output prepared for CMIP6 AerChemMIP histSST-piAer, https://doi.org/10.22033/ESGF/CMIP6.5011, 2019c.
Neubauer, D., Ferrachat, S., Siegenthaler-Le Drian, C., Stoll, J., Folini, D. S., Tegen, I., Wieners, K.-H., Mauritsen, T., Stemmler, I., Barthel, S., Bey, I., Daskalakis, N., Heinold, B., Kokkola, H., Partridge, D., Rast, S., Schmidt, H., Schutgens, N., Stanelle, T., Stier, P., Watson-Parris, D., and Lohmann, U.: HAMMOZ-Consortium MPI-ESM1.2-HAM model output prepared for CMIP6 CMIP historical, https://doi.org/10.22033/ESGF/CMIP6.5016, 2019d.
Neubauer, D., Ferrachat, S., Siegenthaler-Le Drian, C., Stier, P., Partridge, D. G., Tegen, I., Bey, I., Stanelle, T., Kokkola, H., and Lohmann, U.: The global aerosol–climate model ECHAM6.3–HAM2.3 – Part 2: Cloud evaluation, aerosol radiative forcing, and climate sensitivity, Geosci. Model Dev., 12, 3609–3639, https://doi.org/10.5194/gmd-12-3609-2019, 2019e.
O'Connor, F.: MOHC UKESM1.0-LL model output prepared for CMIP6 AerChemMIP hist-piAer, https://doi.org/10.22033/ESGF/CMIP6.6062, 2019a.
O'Connor, F.: MOHC UKESM1.0-LL model output prepared for CMIP6 AerChemMIP histSST, https://doi.org/10.22033/ESGF/CMIP6.6077, 2019b.
O'Connor, F.: MOHC UKESM1.0-LL model output prepared for CMIP6 AerChemMIP histSST-piAer, https://doi.org/10.22033/ESGF/CMIP6.6085, 2019c.
Oliviè, D. J. L., Bentsen, M., Seland, Ø., Toniazzo, T., Gjermundsen, A., Graff, L. S., Debernard, J. B., Gupta, A. K., He, Y., Kirkevåg, A., Schwinger, J., Tjiputra, J., Aas, K. S., Bethke, I., Fan, Y., Griesfeller, J., Grini, A., Guo, C., Ilicak, M., Karset, I. H. H., Landgren, O. A., Liakka, J., Moseid, K. O., Nummelin, A., Spensberger, C., Tang, H., Zhang, Z., Heinze, C., Iversen, T., and Schulz, M.: NCC NorESM2-LM model output prepared for CMIP6 AerChemMIP hist-piAer, https://doi.org/10.22033/ESGF/CMIP6.7984, 2019a.
Oliviè, D. J. L., Bentsen, M., Seland, Ø., Toniazzo, T., Gjermundsen, A., Graff, L. S., Debernard, J. B., Gupta, A. K., He, Y., Kirkevåg, A., Schwinger, J., Tjiputra, J., Aas, K. S., Bethke, I., Fan, Y., Griesfeller, J., Grini, A., Guo, C., Ilicak, M., Karset, I. H. H., Landgren, O. A., Liakka, J., Moseid, K. O., Nummelin, A., Spensberger, C., Tang, H., Zhang, Z., Heinze, C., Iversen, T., and Schulz, M.: NCC NorESM2-LM model output prepared for CMIP6 AerChemMIP histSST, https://doi.org/10.22033/ESGF/CMIP6.8007, 2019b.
Oliviè, D. J. L., Bentsen, M., Seland, Ø., Toniazzo, T., Gjermundsen, A., Graff, L. S., Debernard, J. B., Gupta, A. K., He, Y., Kirkevåg, A., Schwinger, J., Tjiputra, J., Aas, K. S., Bethke, I., Fan, Y., Griesfeller, J., Grini, A., Guo, C., Ilicak, M., Karset, I. H. H., Landgren, O. A., Liakka, J., Moseid, K. O., Nummelin, A., Spensberger, C., Tang, H., Zhang, Z., Heinze, C., Iversen, T., and Schulz, M.: NCC NorESM2-LM model output prepared for CMIP6 AerChemMIP histSST-piAer, https://doi.org/10.22033/ESGF/CMIP6.8015, 2019c.
Oshima, N. and Koike, M.: Development of a parameterization of black carbon aging for use in general circulation models, Geosci. Model Dev., 6, 263–282, https://doi.org/10.5194/gmd-6-263-2013, 2013.
Oshima, N., Yukimoto, S., Deushi, M., Koshiro, T., Kawai, H., Tanaka, T. Y., and Yoshida, K.: Global and Arctic effective radiative forcing of anthropogenic gases and aerosols in MRI-ESM2.0, Prog. Earth Planet Sci., 7, 38, https://doi.org/10.1186/s40645-020-00348-w, 2020.
Parsons, L. A., Brennan, M. K., Wills, R. C. J., and Proistosescu, C.: Magnitudes and Spatial Patterns of Interdecadal Temperature Variability in CMIP6, Geophys. Res. Lett., 47, e2019GL086588, https://doi.org/10.1029/2019GL086588, 2020.
Paulot, F., Ginoux, P., Cooke, W. F., Donner, L. J., Fan, S., Lin, M.-Y., Mao, J., Naik, V., and Horowitz, L. W.: Sensitivity of nitrate aerosols to ammonia emissions and to nitrate chemistry: implications for present and future nitrate optical depth, Atmos. Chem. Phys., 16, 1459–1477, https://doi.org/10.5194/acp-16-1459-2016, 2016.
Rashid, H. A.: Diverse Responses of Global-Mean Surface Temperature to External Forcings and Internal Climate Variability in Observations and CMIP6 Models, Geophys. Res. Lett., 48, e2021GL093194, https://doi.org/10.1029/2021GL093194, 2021.
Rohde, R. A. and Hausfather, Z.: The Berkeley Earth Land/Ocean Temperature Record, Earth Syst. Sci. Data, 12, 3469–3479, https://doi.org/10.5194/essd-12-3469-2020, 2020.
Samset, B. H., Sand, M., Smith, C. J., Bauer, S. E., Forster, P. M., Fuglestvedt, J. S., Osprey, S., and Schleussner, C.-F.: Climate Impacts From a Removal of Anthropogenic Aerosol Emissions, Geophys. Res. Lett., 45, 1020–1029, https://doi.org/10.1002/2017GL076079, 2018.
Sanchez-Lorenzo, A., Wild, M., Brunetti, M., Guijarro, J. A., Hakuba, M. Z., Calbó, J., Mystakidis, S., and Bartok, B.: Reassessment and update of long-term trends in downward surface shortwave radiation over Europe (1939–2012), J. Geophys. Res.-Atmos., 120, 9555–9569, https://doi.org/10.1002/2015JD023321, 2015.
Schneider, D. P., Deser, C., Fasullo, J., and Trenberth, K. E.: Climate Data Guide Spurs Discovery and Understanding, Eos T. Am. Geophys. Un., 94, 121–122, https://doi.org/10.1002/2013EO130001, 2013.
Seferian, R.: CNRM-CERFACS CNRM-ESM2-1 model output prepared for CMIP6 CMIP historical, https://doi.org/10.22033/ESGF/CMIP6.4068, 2018.
Seferian, R.: CNRM-CERFACS CNRM-ESM2-1 model output prepared for CMIP6 AerChemMIP hist-piNTCF, https://doi.org/10.22033/ESGF/CMIP6.4051, 2019a.
Seferian, R.: CNRM-CERFACS CNRM-ESM2-1 model output prepared for CMIP6 AerChemMIP histSST, https://doi.org/10.22033/ESGF/CMIP6.4059, 2019b.
Seferian, R.: CNRM-CERFACS CNRM-ESM2-1 model output prepared for CMIP6 AerChemMIP histSST-piNTCF, https://doi.org/10.22033/ESGF/CMIP6.4064, 2019c.
Séférian, R., Nabat, P., Michou, M., Saint-Martin, D., Voldoire, A., Colin, J., Decharme, B., Delire, C., Berthet, S., Chevallier, M., Sénési, S., Franchisteguy, L., Vial, J., Mallet, M., Joetzjer, E., Geoffroy, O., Guérémy, J.-F., Moine, M.-P., Msadek, R., Ribes, A., Rocher, M., Roehrig, R., Salas-y-Mélia, D., Sanchez, E., Terray, L., Valcke, S., Waldman, R., Aumont, O., Bopp, L., Deshayes, J., Éthé, C., and Madec, G.: Evaluation of CNRM Earth System Model, CNRM-ESM2-1: Role of Earth System Processes in Present-Day and Future Climate, J. Adv. Model. Earth Sy., 11, 4182–4227, https://doi.org/10.1029/2019MS001791, 2019.
Seland, Ø., Bentsen, M., Oliviè, D. J. L., Toniazzo, T., Gjermundsen, A., Graff, L. S., Debernard, J. B., Gupta, A. K., He, Y., Kirkevåg, A., Schwinger, J., Tjiputra, J., Aas, K. S., Bethke, I., Fan, Y., Griesfeller, J., Grini, A., Guo, C., Ilicak, M., Karset, I. H. H., Landgren, O. A., Liakka, J., Moseid, K. O., Nummelin, A., Spensberger, C., Tang, H., Zhang, Z., Heinze, C., Iversen, T., and Schulz, M.: NCC NorESM2-LM model output prepared for CMIP6 CMIP historical, https://doi.org/10.22033/ESGF/CMIP6.8036, 2019.
Seland, Ø., Bentsen, M., Olivié, D., Toniazzo, T., Gjermundsen, A., Graff, L. S., Debernard, J. B., Gupta, A. K., He, Y.-C., Kirkevåg, A., Schwinger, J., Tjiputra, J., Aas, K. S., Bethke, I., Fan, Y., Griesfeller, J., Grini, A., Guo, C., Ilicak, M., Karset, I. H. H., Landgren, O., Liakka, J., Moseid, K. O., Nummelin, A., Spensberger, C., Tang, H., Zhang, Z., Heinze, C., Iversen, T., and Schulz, M.: Overview of the Norwegian Earth System Model (NorESM2) and key climate response of CMIP6 DECK, historical, and scenario simulations, Geosci. Model Dev., 13, 6165–6200, https://doi.org/10.5194/gmd-13-6165-2020, 2020.
Sellar, A. A., Jones, C. G., Mulcahy, J. P., Tang, Y., Yool, A., Wiltshire, A., O'Connor, F. M., Stringer, M., Hill, R., Palmieri, J., Woodward, S., de Mora, L., Kuhlbrodt, T., Rumbold, S. T., Kelley, D. I., Ellis, R., Johnson, C. E., Walton, J., Abraham, N. L., Andrews, M. B., Andrews, T., Archibald, A. T., Berthou, S., Burke, E., Blockley, E., Carslaw, K., Dalvi, M., Edwards, J., Folberth, G. A., Gedney, N., Griffiths, P. T., Harper, A. B., Hendry, M. A., Hewitt, A. J., Johnson, B., Jones, A., Jones, C. D., Keeble, J., Liddicoat, S., Morgenstern, O., Parker, R. J., Predoi, V., Robertson, E., Siahaan, A., Smith, R. S., Swaminathan, R., Woodhouse, M. T., Zeng, G., and Zerroukat, M.: UKESM1: Description and Evaluation of the U. K. Earth System Model, J. Adv. Model. Earth Sy., 11, 4513–4558, https://doi.org/10.1029/2019MS001739, 2019.
Sellar, A. A., Walton, J., Jones, C. G., Wood, R., Abraham, N. L., Andrejczuk, M., Andrews, M. B., Andrews, T., Archibald, A. T., de Mora, L., Dyson, H., Elkington, M., Ellis, R., Florek, P., Good, P., Gohar, L., Haddad, S., Hardiman, S. C., Hogan, E., Iwi, A., Jones, C. D., Johnson, B., Kelley, D. I., Kettleborough, J., Knight, J. R., Köhler, M. O., Kuhlbrodt, T., Liddicoat, S., Linova-Pavlova, I., Mizielinski, M. S., Morgenstern, O., Mulcahy, J., Neininger, E., O'Connor, F. M., Petrie, R., Ridley, J., Rioual, J.-C., Roberts, M., Robertson, E., Rumbold, S., Seddon, J., Shepherd, H., Shim, S., Stephens, A., Teixiera, J. C., Tang, Y., Williams, J., Wiltshire, A., and Griffiths, P. T.: Implementation of U. K. Earth System Models for CMIP6, J. Adv. Model. Earth Sy., 12, e2019MS001946, https://doi.org/10.1029/2019MS001946, 2020.
Sherwood, S. C., Bony, S., Boucher, O., Bretherton, C., Forster, P. M., Gregory, J. M., and Stevens, B.: Adjustments in the Forcing-Feedback Framework for Understanding Climate Change, B. Am. Meteorol. Soc., 96, 217–228, https://doi.org/10.1175/BAMS-D-13-00167.1, 2015.
Smith, C. J., Kramer, R. J., Myhre, G., Alterskjær, K., Collins, W., Sima, A., Boucher, O., Dufresne, J.-L., Nabat, P., Michou, M., Yukimoto, S., Cole, J., Paynter, D., Shiogama, H., O'Connor, F. M., Robertson, E., Wiltshire, A., Andrews, T., Hannay, C., Miller, R., Nazarenko, L., Kirkevåg, A., Olivié, D., Fiedler, S., Lewinschal, A., Mackallah, C., Dix, M., Pincus, R., and Forster, P. M.: Effective radiative forcing and adjustments in CMIP6 models, Atmos. Chem. Phys., 20, 9591–9618, https://doi.org/10.5194/acp-20-9591-2020, 2020.
Stevens, B., Fiedler, S., Kinne, S., Peters, K., Rast, S., Müsse, J., Smith, S. J., and Mauritsen, T.: MACv2-SP: a parameterization of anthropogenic aerosol optical properties and an associated Twomey effect for use in CMIP6, Geosci. Model Dev., 10, 433–452, https://doi.org/10.5194/gmd-10-433-2017, 2017.
Stier, P., Feichter, J., Kinne, S., Kloster, S., Vignati, E., Wilson, J., Ganzeveld, L., Tegen, I., Werner, M., Balkanski, Y., Schulz, M., Boucher, O., Minikin, A., and Petzold, A.: The aerosol-climate model ECHAM5-HAM, Atmos. Chem. Phys., 5, 1125–1156, https://doi.org/10.5194/acp-5-1125-2005, 2005.
Szopa, S., Naik, V., Adhikary, B., Artaxo Netto, P. E., Berntsen, T., Collins, W. D., Fuzzi, S., Gallardo, L., Kiendler-Scharr, A., Klimont, Z., Liao, H., Unger, N., and Zanis, P.: Short-lived climate forcers, in: Climate Change 2021: The Physical Science Basis. Contribution of Working Group I to the Sixth Assessment Report of the Intergovernmental Panel on Climate Change, edited by: Masson-Delmotte, V., Zhai, P., Pirani, A., Connors, S. L., Péan, C., Berger, S., Caud, N., Chen, Y., Goldfarb, L., Gomis, M. I., Huang, M., Leitzell, K., Lonnoy, E., Matthews, J. B. R., Maycock, T. K., Waterfield, T., Yelekçi, Ö., Yu, R., and Zhou, B., Cambridge University Press, Cambridge, United Kingdom and New York, NY, USA, 817–922, https://doi.org/10.1017/9781009157896.008, 2021.
Takemura, T., Nozawa, T., Emori, S., Nakajima, T. Y., and Nakajima, T.: Simulation of climate response to aerosol direct and indirect effects with aerosol transport-radiation model, J. Geophys. Res.-Atmos., 110, https://doi.org/10.1029/2004JD005029, 2005.
Tang, Y., Rumbold, S., Ellis, R., Kelley, D., Mulcahy, J., Sellar, A., Walton, J., and Jones, C.: MOHC UKESM1.0-LL model output prepared for CMIP6 CMIP historical, https://doi.org/10.22033/ESGF/CMIP6.6113, 2019.
Tegen, I., Neubauer, D., Ferrachat, S., Siegenthaler-Le Drian, C., Bey, I., Schutgens, N., Stier, P., Watson-Parris, D., Stanelle, T., Schmidt, H., Rast, S., Kokkola, H., Schultz, M., Schroeder, S., Daskalakis, N., Barthel, S., Heinold, B., and Lohmann, U.: The global aerosol–climate model ECHAM6.3–HAM2.3 – Part 1: Aerosol evaluation, Geosci. Model Dev., 12, 1643–1677, https://doi.org/10.5194/gmd-12-1643-2019, 2019.
Tian, F., Dong, B., Robson, J., Sutton, R., and Wilcox, L.: Processes shaping the spatial pattern and seasonality of the surface air temperature response to anthropogenic forcing, Clim. Dynam., 54, 3959–3975, https://doi.org/10.1007/s00382-020-05211-8, 2020.
Turnock, S. T., Butt, E. W., Richardson, T. B., Mann, G. W., Reddington, C. L., Forster, P. M., Haywood, J., Crippa, M., Janssens-Maenhout, G., Johnson, C. E., Bellouin, N., Carslaw, K. S., and Spracklen, D. V.: The impact of European legislative and technology measures to reduce air pollutants on air quality, human health and climate, Environ. Res. Lett., 11, 024010, https://doi.org/10.1088/1748-9326/11/2/024010, 2016.
Twomey, S.: Pollution and the planetary albedo, Atmos. Environ. (1967), 8, 1251–1256, https://doi.org/10.1016/0004-6981(74)90004-3, 1974.
Twomey, S.: The Influence of Pollution on the Shortwave Albedo of Clouds, J. Atmos. Sci., 34, 1149–1152, https://doi.org/10.1175/1520-0469(1977)034%253C1149:TIOPOT%253E2.0.CO;2, 1977.
Urdiales-Flores, D., Zittis, G., Hadjinicolaou, P., Osipov, S., Klingmüller, K., Mihalopoulos, N., Kanakidou, M., Economou, T., and Lelieveld, J.: Drivers of accelerated warming in Mediterranean climate-type regions, npj Clim. Atmos. Sci., 6, 1–9, https://doi.org/10.1038/s41612-023-00423-1, 2023.
van Marle, M. J. E., Kloster, S., Magi, B. I., Marlon, J. R., Daniau, A.-L., Field, R. D., Arneth, A., Forrest, M., Hantson, S., Kehrwald, N. M., Knorr, W., Lasslop, G., Li, F., Mangeon, S., Yue, C., Kaiser, J. W., and van der Werf, G. R.: Historic global biomass burning emissions for CMIP6 (BB4CMIP) based on merging satellite observations with proxies and fire models (1750–2015), Geosci. Model Dev., 10, 3329–3357, https://doi.org/10.5194/gmd-10-3329-2017, 2017.
van Noije, T., Bergman, T., Le Sager, P., O'Donnell, D., Makkonen, R., Gonçalves-Ageitos, M., Döscher, R., Fladrich, U., von Hardenberg, J., Keskinen, J.-P., Korhonen, H., Laakso, A., Myriokefalitakis, S., Ollinaho, P., Pérez García-Pando, C., Reerink, T., Schrödner, R., Wyser, K., and Yang, S.: EC-Earth3-AerChem: a global climate model with interactive aerosols and atmospheric chemistry participating in CMIP6, Geosci. Model Dev., 14, 5637–5668, https://doi.org/10.5194/gmd-14-5637-2021, 2021.
Vignati, E., Wilson, J., and Stier, P.: M7: An efficient size-resolved aerosol microphysics module for large-scale aerosol transport models, J. Geophys. Res.-Atmos., 109, https://doi.org/10.1029/2003JD004485, 2004.
Wei, J., Peng, Y., Mahmood, R., Sun, L., and Guo, J.: Intercomparison in spatial distributions and temporal trends derived from multi-source satellite aerosol products, Atmos. Chem. Phys., 19, 7183–7207, https://doi.org/10.5194/acp-19-7183-2019, 2019.
Wild, M.: Global dimming and brightening: A review, J. Geophys. Res.-Atmos., 114, https://doi.org/10.1029/2008JD011470, 2009.
Wild, M.: Enlightening Global Dimming and Brightening, B. Am. Meteorol. Soc., 93, 27–37, https://doi.org/10.1175/BAMS-D-11-00074.1, 2012.
Williams, K. D., Copsey, D., Blockley, E. W., Bodas-Salcedo, A., Calvert, D., Comer, R., Davis, P., Graham, T., Hewitt, H. T., Hill, R., Hyder, P., Ineson, S., Johns, T. C., Keen, A. B., Lee, R. W., Megann, A., Milton, S. F., Rae, J. G. L., Roberts, M. J., Scaife, A. A., Schiemann, R., Storkey, D., Thorpe, L., Watterson, I. G., Walters, D. N., West, A., Wood, R. A., Woollings, T., and Xavier, P. K.: The Met Office Global Coupled Model 3.0 and 3.1 (GC3.0 and GC3.1) Configurations, J. Adv. Model. Earth Sy., 10, 357–380, https://doi.org/10.1002/2017MS001115, 2018.
Wu, T., Lu, Y., Fang, Y., Xin, X., Li, L., Li, W., Jie, W., Zhang, J., Liu, Y., Zhang, L., Zhang, F., Zhang, Y., Wu, F., Li, J., Chu, M., Wang, Z., Shi, X., Liu, X., Wei, M., Huang, A., Zhang, Y., and Liu, X.: The Beijing Climate Center Climate System Model (BCC-CSM): the main progress from CMIP5 to CMIP6 , Geosci. Model Dev., 12, 1573–1600, https://doi.org/10.5194/gmd-12-1573-2019, 2019.
Wu, T., Zhang, F., Zhang, J., Jie, W., Zhang, Y., Wu, F., Li, L., Yan, J., Liu, X., Lu, X., Tan, H., Zhang, L., Wang, J., and Hu, A.: Beijing Climate Center Earth System Model version 1 (BCC-ESM1): model description and evaluation of aerosol simulations, Geosci. Model Dev., 13, 977–1005, https://doi.org/10.5194/gmd-13-977-2020, 2020.
Yang, Y., Lou, S., Wang, H., Wang, P., and Liao, H.: Trends and source apportionment of aerosols in Europe during 1980–2018, Atmos. Chem. Phys., 20, 2579–2590, https://doi.org/10.5194/acp-20-2579-2020, 2020.
Yukimoto, S., Koshiro, T., Kawai, H., Oshima, N., Yoshida, K., Urakawa, S., Tsujino, H., Deushi, M., Tanaka, T., Hosaka, M., Yoshimura, H., Shindo, E., Mizuta, R., Ishii, M., Obata, A., and Adachi, Y.: MRI MRI-ESM2.0 model output prepared for CMIP6 AerChemMIP histSST, https://doi.org/10.22033/ESGF/CMIP6.6835, 2019a.
Yukimoto, S., Koshiro, T., Kawai, H., Oshima, N., Yoshida, K., Urakawa, S., Tsujino, H., Deushi, M., Tanaka, T., Hosaka, M., Yoshimura, H., Shindo, E., Mizuta, R., Ishii, M., Obata, A., and Adachi, Y.: MRI MRI-ESM2.0 model output prepared for CMIP6 CMIP historical, https://doi.org/10.22033/ESGF/CMIP6.6842, 2019b.
Yukimoto, S., Kawai, H., Koshiro, T., Oshima, N., Yoshida, K., Urakawa, S., Tsujino, H., Deushi, M., Tanaka, T., Hosaka, M., Yabu, S., Yoshimura, H., Shindo, E., Mizuta, R., Obata, A., Adachi, Y., and Ishii, M.: The Meteorological Research Institute Earth System Model Version 2.0, MRI-ESM2.0: Description and Basic Evaluation of the Physical Component, J. Meteorol. Soc. Jpn., Ser. II, 97, 931–965, https://doi.org/10.2151/jmsj.2019-051, 2019c.
Yukimoto, S., Koshiro, T., Kawai, H., Oshima, N., Yoshida, K., Urakawa, S., Tsujino, H., Deushi, M., Tanaka, T., Hosaka, M., Yoshimura, H., Shindo, E., Mizuta, R., Ishii, M., Obata, A., and Adachi, Y.: MRI MRI-ESM2.0 model output prepared for CMIP6 AerChemMIP hist-piAer, https://doi.org/10.22033/ESGF/CMIP6.6826, 2020a.
Yukimoto, S., Koshiro, T., Kawai, H., Oshima, N., Yoshida, K., Urakawa, S., Tsujino, H., Deushi, M., Tanaka, T., Hosaka, M., Yoshimura, H., Shindo, E., Mizuta, R., Ishii, M., Obata, A., and Adachi, Y.: MRI MRI-ESM2.0 model output prepared for CMIP6 AerChemMIP histSST-piAer, https://doi.org/10.22033/ESGF/CMIP6.6837, 2020b.
Zanis, P.: A study on the direct effect of anthropogenic aerosols on near surface air temperature over Southeastern Europe during summer 2000 based on regional climate modeling, Ann. Geophys., 27, 3977–3988, https://doi.org/10.5194/angeo-27-3977-2009, 2009.
Zanis, P., Ntogras, C., Zakey, A., Pytharoulis, I., and Karacostas, T.: Regional climate feedback of anthropogenic aerosols over Europe using RegCM3, Clim. Res., 52, 267–278, https://doi.org/10.3354/cr01070, 2012.
Zelinka, M. D., Smith, C. J., Qin, Y., and Taylor, K. E.: Comparison of methods to estimate aerosol effective radiative forcings in climate models, Atmos. Chem. Phys., 23, 8879–8898, https://doi.org/10.5194/acp-23-8879-2023, 2023.
Zhang, J., Wu, T., Shi, X., Zhang, F., Li, J., Chu, M., Liu, Q., Yan, J., Ma, Q., and Wei, M.: BCC BCC-ESM1 model output prepared for CMIP6 CMIP historical, https://doi.org/10.22033/ESGF/CMIP6.2949, 2018.
Zhang, J., Wu, T., Shi, X., Zhang, F., Li, J., Chu, M., Liu, Q., Yan, J., Ma, Q., and Wei, M.: BCC BCC-ESM1 model output prepared for CMIP6 AerChemMIP hist-piAer, https://doi.org/10.22033/ESGF/CMIP6.2931, 2020.
Zhang, J., Wu, T., Zhang, F., Furtado, K., Xin, X., Shi, X., Li, J., Chu, M., Zhang, L., Liu, Q., Yan, J., Wei, M., and Ma, Q.: BCC-ESM1 Model Datasets for the CMIP6 Aerosol Chemistry Model Intercomparison Project (AerChemMIP), Adv. Atmos. Sci., 38, 317–328, https://doi.org/10.1007/s00376-020-0151-2, 2021a.
Zhang, J., Furtado, K., Turnock, S. T., Mulcahy, J. P., Wilcox, L. J., Booth, B. B., Sexton, D., Wu, T., Zhang, F., and Liu, Q.: The role of anthropogenic aerosols in the anomalous cooling from 1960 to 1990 in the CMIP6 Earth system models, Atmos. Chem. Phys., 21, 18609–18627, https://doi.org/10.5194/acp-21-18609-2021, 2021b.
Zhang, K., O'Donnell, D., Kazil, J., Stier, P., Kinne, S., Lohmann, U., Ferrachat, S., Croft, B., Quaas, J., Wan, H., Rast, S., and Feichter, J.: The global aerosol-climate model ECHAM-HAM, version 2: sensitivity to improvements in process representations, Atmos. Chem. Phys., 12, 8911–8949, https://doi.org/10.5194/acp-12-8911-2012, 2012.
Zhao, M., Golaz, J.-C., Held, I. M., Guo, H., Balaji, V., Benson, R., Chen, J.-H., Chen, X., Donner, L. J., Dunne, J. P., Dunne, K., Durachta, J., Fan, S.-M., Freidenreich, S. M., Garner, S. T., Ginoux, P., Harris, L. M., Horowitz, L. W., Krasting, J. P., Langenhorst, A. R., Liang, Z., Lin, P., Lin, S.-J., Malyshev, S. L., Mason, E., Milly, P. C. D., Ming, Y., Naik, V., Paulot, F., Paynter, D., Phillipps, P., Radhakrishnan, A., Ramaswamy, V., Robinson, T., Schwarzkopf, D., Seman, C. J., Shevliakova, E., Shen, Z., Shin, H., Silvers, L. G., Wilson, J. R., Winton, M., Wittenberg, A. T., Wyman, B., and Xiang, B.: The GFDL Global Atmosphere and Land Model AM4.0/LM4.0: 1. Simulation Characteristics With Prescribed SSTs, J. Adv. Model. Earth Sy., 10, 691–734, https://doi.org/10.1002/2017MS001208, 2018a.
Zhao, M., Golaz, J.-C., Held, I. M., Guo, H., Balaji, V., Benson, R., Chen, J.-H., Chen, X., Donner, L. J., Dunne, J. P., Dunne, K., Durachta, J., Fan, S.-M., Freidenreich, S. M., Garner, S. T., Ginoux, P., Harris, L. M., Horowitz, L. W., Krasting, J. P., Langenhorst, A. R., Liang, Z., Lin, P., Lin, S.-J., Malyshev, S. L., Mason, E., Milly, P. C. D., Ming, Y., Naik, V., Paulot, F., Paynter, D., Phillipps, P., Radhakrishnan, A., Ramaswamy, V., Robinson, T., Schwarzkopf, D., Seman, C. J., Shevliakova, E., Shen, Z., Shin, H., Silvers, L. G., Wilson, J. R., Winton, M., Wittenberg, A. T., Wyman, B., and Xiang, B.: The GFDL Global Atmosphere and Land Model AM4.0/LM4.0: 2. Model Description, Sensitivity Studies, and Tuning Strategies, J. Adv. Model. Earth Sy., 10, 735–769, https://doi.org/10.1002/2017MS001209, 2018b.