the Creative Commons Attribution 4.0 License.
the Creative Commons Attribution 4.0 License.
 | 03 Jul 2026
Susceptibility of marine warm clouds to aerosols in different monsoon periods over the South China Sea
Hailing Jia
Yong Han
Understanding the susceptibility of warm clouds to aerosol loading, quantified by the aerosol–cloud interactions (ACI) index, is essential for assessing ACI and their climate impacts. Previous studies have demonstrated that this susceptibility is strongly modulated by environmental conditions. The South China Sea (SCS), influenced alternately by the southwest and northeast monsoons, provides a unique natural laboratory for examining ACI under contrasting thermodynamic and moisture conditions. Using long-term satellite observations and reanalysis data, we investigate ACI in non-raining warm liquid clouds over the SCS across three monsoon phases: the southwest monsoon wet (SWMW), northeast monsoon wet (NEMW), and northeast monsoon dry (NEMD) periods. The robust Twomey effect is observed across all periods. Shallow stratocumulus clouds show no significant differences in ACI across periods, whereas deeper cumulus clouds exhibit the strongest ACI during NEMD, with no clear separation between SWMW and NEMW. The enhanced ACI during NEMD is consistent with the relatively dry and stable lower-tropospheric environment (LTS), where stable conditions may enhance ACI through aerosol accumulation, while moist environments are likely to weaken it via enhanced condensational and coalescence growth. However, these differences likely reflect co-varying environmental conditions across monsoon periods rather than a single dominant controlling factor. Limitations of the aerosol index (AI) as a marine cloud condensation nuclei (CCN) proxy and satellite retrieval biases may affect these conclusions. These findings suggest that, within a monsoon-organized framework, the interplay among aerosols, humidity, and stability is associated with marine warm-cloud microphysics, providing observational constraints for climate model representation of ACI.
- Article
(7688 KB) - Full-text XML
- BibTeX
- EndNote


Aerosol–cloud interactions (ACI) play a crucial role in regulating Earth's radiative balance and hydrological cycle by altering cloud microphysical and macrophysical properties (Bellouin et al., 2020; Jia et al., 2021; Rosenfeld et al., 2019; Stier et al., 2024; Wang et al., 2024c; Zhao et al., 2024). Numerous studies have demonstrated that ACI are strongly modulated by environmental conditions, such as lower-tropospheric stability (Chen et al., 2014; Wang et al., 2014), relative humidity (Douglas and L'Ecuyer, 2019), precipitable water vapor (Qiu et al., 2017; Yuan et al., 2008; Zheng et al., 2022), vertical velocity (Jia et al., 2022; Su et al., 2010), wind shear (Fan et al., 2009; Kim et al., 2003), and the vertical overlap between aerosol and cloud layers (Costantino and Bréon, 2013). However, over the South China Sea (SCS), a region strongly influenced by pronounced monsoon circulation, the observational evidence of how ACI respond to variations in thermodynamic and moisture conditions remains limited.
The SCS, one of the world's largest marginal seas, provides a unique natural laboratory for investigating ACI under the alternating influence of two opposing monsoon systems. The SCS experiences a pronounced seasonal reversal of wind regimes, characterized by a warm, moist southwest monsoon during boreal summer and a cool, dry northeast monsoon during boreal winter (Wang et al., 2009). During the southwest monsoon period, the marine boundary layer over the northern SCS becomes unstable, with enhanced air–sea temperature differences and surface turbulent heat fluxes that intensify vertical mixing and deepen the boundary layer while reducing wind shear (Peng et al., 2016). Rainfall during this period is primarily governed by warm-cloud microphysical processes and vapor convergence-driven condensation (Wang et al., 2007). In contrast, during the northeast monsoon period, cold surges associated with the East Asian winter monsoon substantially modify the SCS boundary-layer structure by enhancing surface turbulent fluxes, deepening the mixed layer, and strengthening the inversion that promotes extensive low-cloud development (Wang et al., 2024a). The SCS is also a region that is simultaneously affected by various types of aerosols from industrial emissions, shipping activities, and biomass burning. It has been shown that those aerosols substantially modify the microphysical structure of marine boundary layer clouds over the SCS by increasing small droplet concentrations and suppressing midsize droplets near cloud base (Miller et al., 2023). Recent shipborne observations further reveal that aerosol sources over the SCS exhibit distinct seasonal contrasts, being dominated by continental outflow from mainland Southeast Asia during the southwest monsoon and by pollution plumes transported from continental China during the northeast monsoon (Ou et al., 2025). Yet, how these contrasting aerosol and meteorological regimes modulate ACI, particularly for warm non-raining clouds, remains poorly quantified.
Quantifying ACI is essential for constraining their climatic impacts. According to the Sixth Assessment Report of the Intergovernmental Panel on Climate Change (Douville et al., 2023), the effective radiative forcing associated with ACI (ERFaci) is estimated to be −0.84 W m−2 globally, with a wide 5 %–95 % confidence range from −1.45 to −0.25 W m−2, dominating the overall uncertainty in total aerosol effective radiative forcing, which ranges between −1.7 and −0.4 W m−2. ERFaci may be further decomposed into two components: the instantaneous radiative forcing due to ACI, also known as the Twomey effect (RFaci; Twomey, 1977, 1974), and rapid adjustments (Ackerman et al., 2004; Albrecht, 1989; Bellouin et al., 2020). To quantify the cloud response to aerosol perturbations, Feingold et al. (2001) proposed the ACI index (ACIr and ACI), which has since become a widely used metric for evaluating the strength of the Twomey effect in both satellite and in-situ studies, defined as:
where r and Nd denote the cloud effective radius and droplet number concentration, respectively, and α is an aerosol proxy (e.g., AOD, AI, or NCCN). In this study, AI is employed as the aerosol proxy in the calculation of ACI. ACI is more recently also referred to as the Nd susceptibility to aerosols (Ma et al., 2018a, b).
Although many studies have examined the environmental modulation of ACI over both oceanic and continental regions (Fan et al., 2016; Jia et al., 2019, 2022; Jia and Quaas, 2023; Seinfeld et al., 2016; Sorooshian et al., 2019; Wall et al., 2022; Wang et al., 2024d), such processes remain poorly constrained over the SCS. The pronounced seasonal reversal of monsoon circulation in this region creates highly contrasting thermodynamic and moisture conditions, along with differing aerosol regimes, which together exert distinct influences on cloud microphysics and modulate the ACI processes. Therefore, this study aims to provide a comprehensive assessment of ACI in non-raining warm clouds over the SCS under different monsoon regimes. Long-term multi-satellite and reanalysis datasets from July 2002 to February 2020 are integrated to characterize variations in aerosol, cloud, and environmental properties across the southwest monsoon wet (SWMW), northeast monsoon wet (NEMW), and northeast monsoon dry (NEMD) phases, and to quantitatively evaluate the corresponding ACI responses. Particular attention is given to understanding how variations in water vapor availability and lower-tropospheric stability (LTS) influence the sensitivity of cloud microphysical responses to aerosol perturbations.
The paper is organized as follows. Section 2 describes the datasets and methods used in this study. The main findings and related discussions are presented in Sect. 3. Section 4 summarizes the key findings and conclusions.
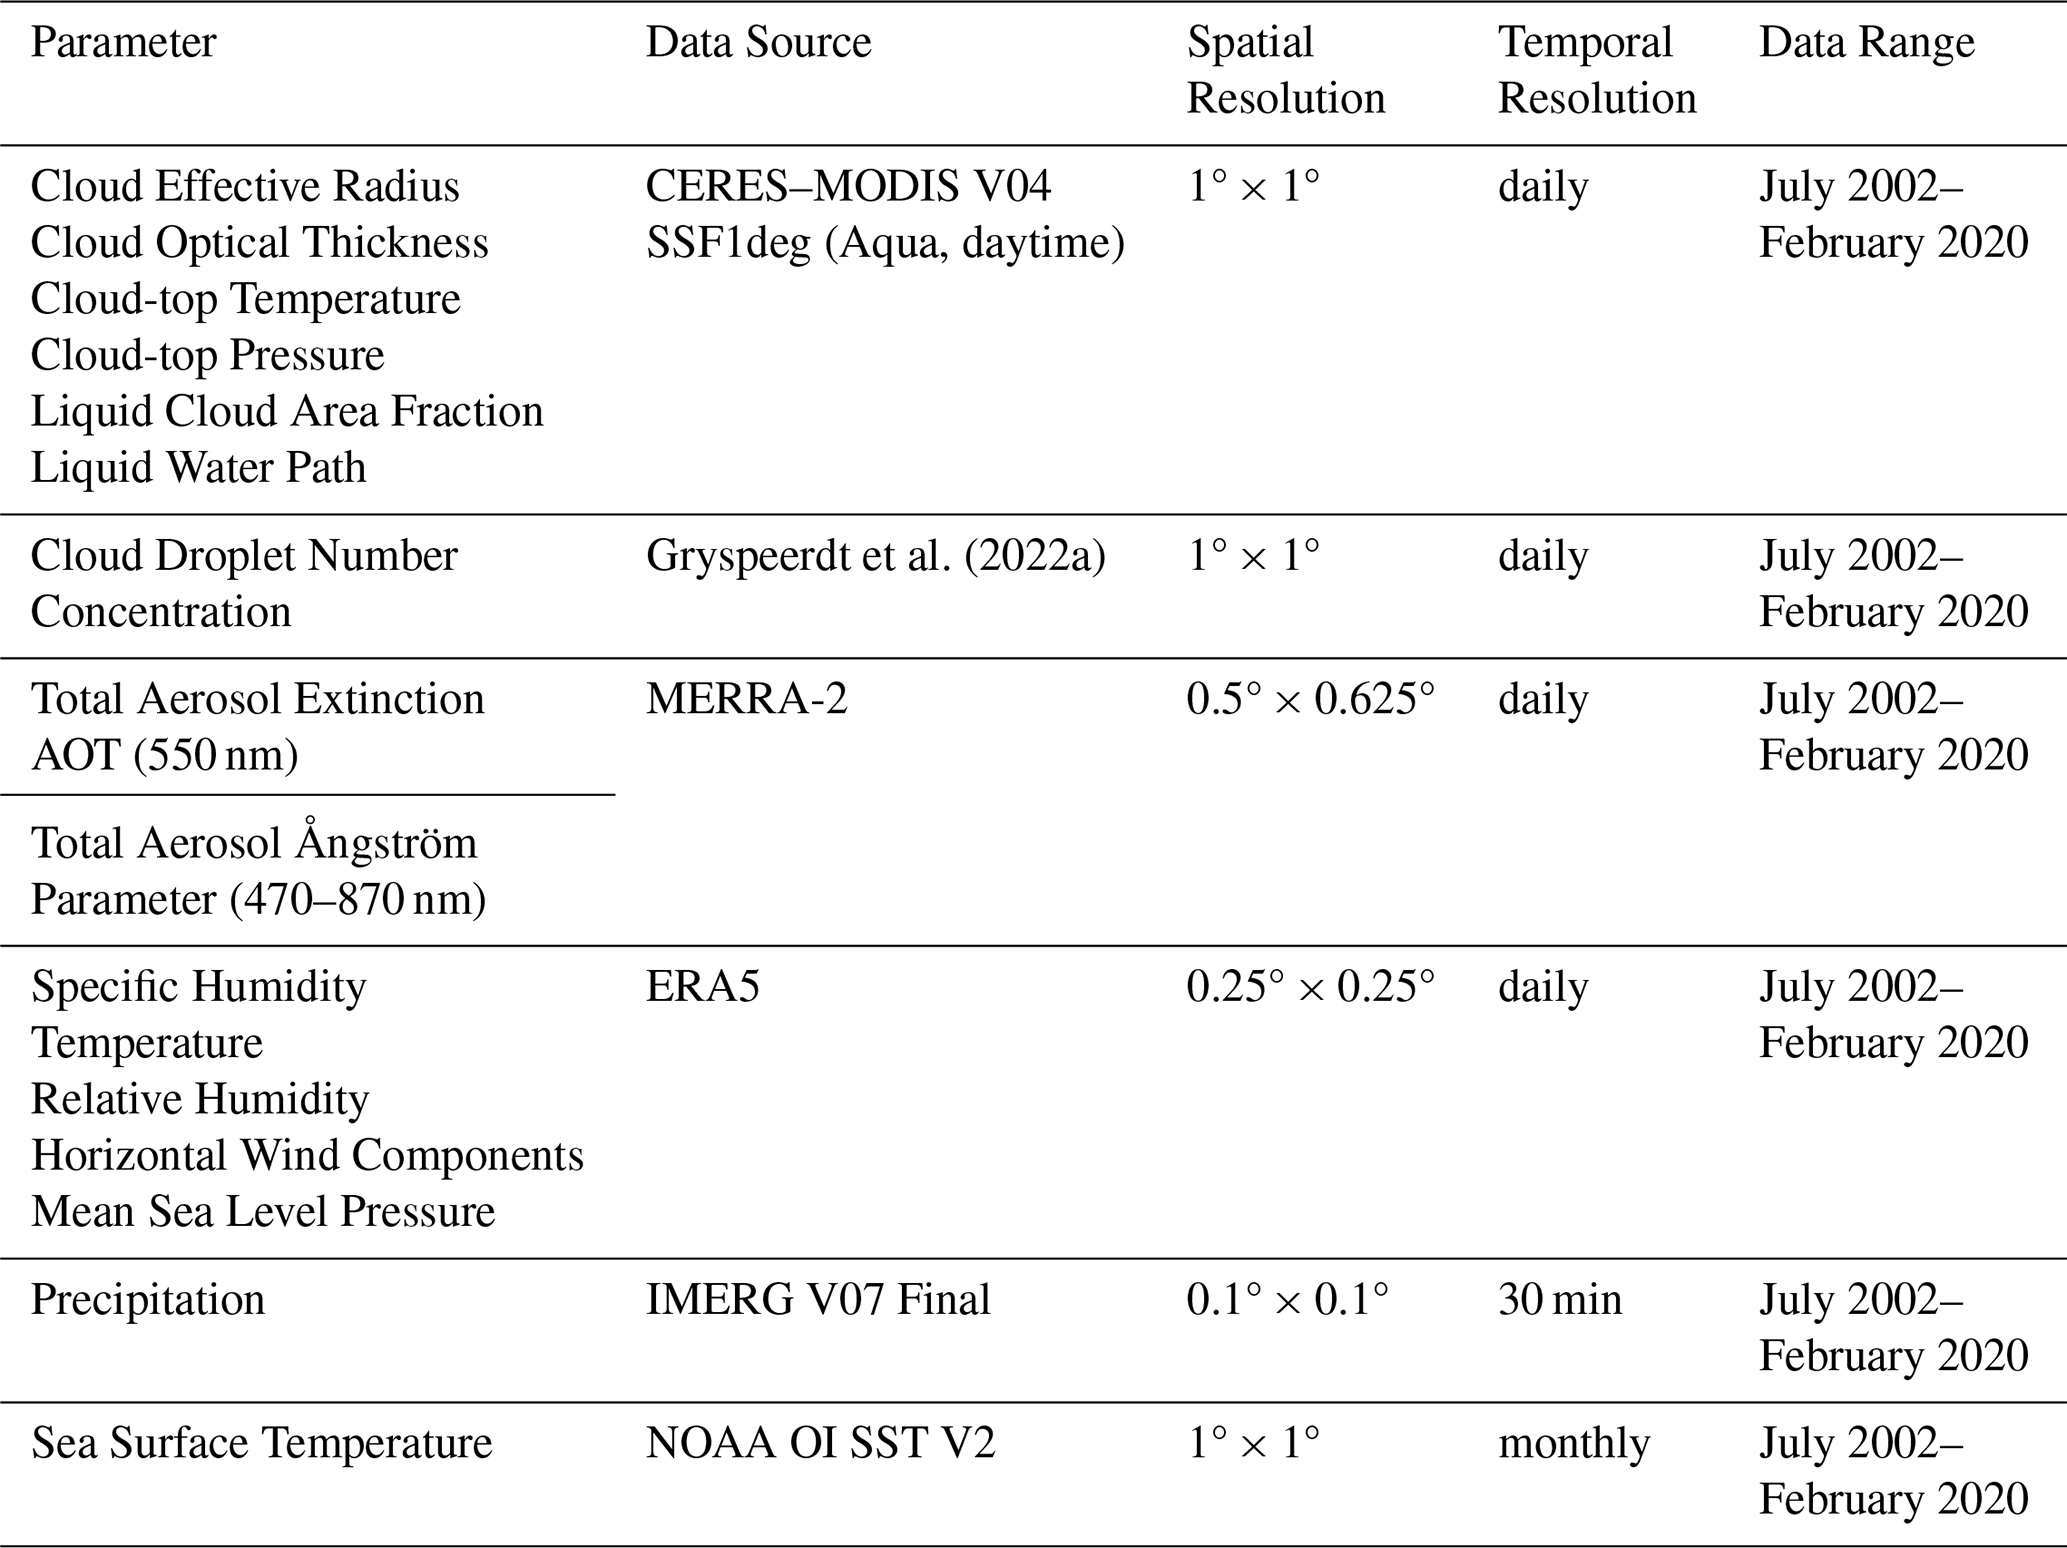
This study employs long-term, multi-source datasets to investigate ACI over the SCS. An overview of the datasets used in this study is provided in Table 1. The cloud properties are derived from the Clouds and the Earth's Radiant Energy System (CERES)–Moderate Resolution Imaging Spectroradiometer (MODIS) Edition 4 Level-3 product (SSF1deg, Aqua, daytime). Cloud droplet number concentration (Nd) data are obtained from a community-standard gridded dataset provided by Gryspeerdt et al. (2022a). Aerosol optical properties are obtained from the Modern-Era Retrospective analysis for Research and Applications, Version 2 (MERRA-2). Meteorological fields are taken from the European Centre for Medium-Range Weather Forecasts (ECMWF) fifth-generation reanalysis (ERA5). Precipitation data are provided by the Integrated Multi-satellite Retrievals for GPM (IMERG) Version 7 Final Run, and sea surface temperature (SST) data are obtained from the National Oceanic and Atmospheric Administration (NOAA) Optimum Interpolation (OI) SST, version 2. The definitions of the monsoon regimes and the analyzes of large-scale circulation, aerosol, and cloud properties are conducted at their native spatial resolutions. For aerosol–cloud collocation, AOD, AI, and ERA5 meteorological fields used in the calculation of ACI and environmental stratification are regridded to a common 1° × 1° grid using bilinear interpolation with the Climate Data Operators (CDO, remapbil).
2.1 Study Area
The SCS is one of the world's largest marginal seas, characterized by complex air–sea interactions and a pronounced seasonal reversal of wind systems (Wang et al., 2009). This region is strongly influenced by the Asian monsoon circulation, exhibiting distinct southwest and northeast monsoon regimes that profoundly modulate its thermodynamic and dynamic environments (Zheng et al., 2025). These alternating monsoon circulations govern the regional aerosol loading (Ou et al., 2025), boundary-layer structure (Chen et al., 2025; Peng et al., 2016; Wang et al., 2024a), and cloud microphysical processes (Miller et al., 2023; Wang et al., 2024b), making the SCS an ideal natural laboratory for investigating ACI under contrasting meteorological conditions. In this study, the analysis domain (blue polygon in Fig. 1) encompasses the entire SCS, including both coastal and open-ocean areas, to capture the spatial variability of aerosol, cloud, and environmental parameters. The red box in Fig. 1 delineates the subregion (3–22° N, 110–120° E) used for defining the monsoon regimes following Wang et al. (2004).
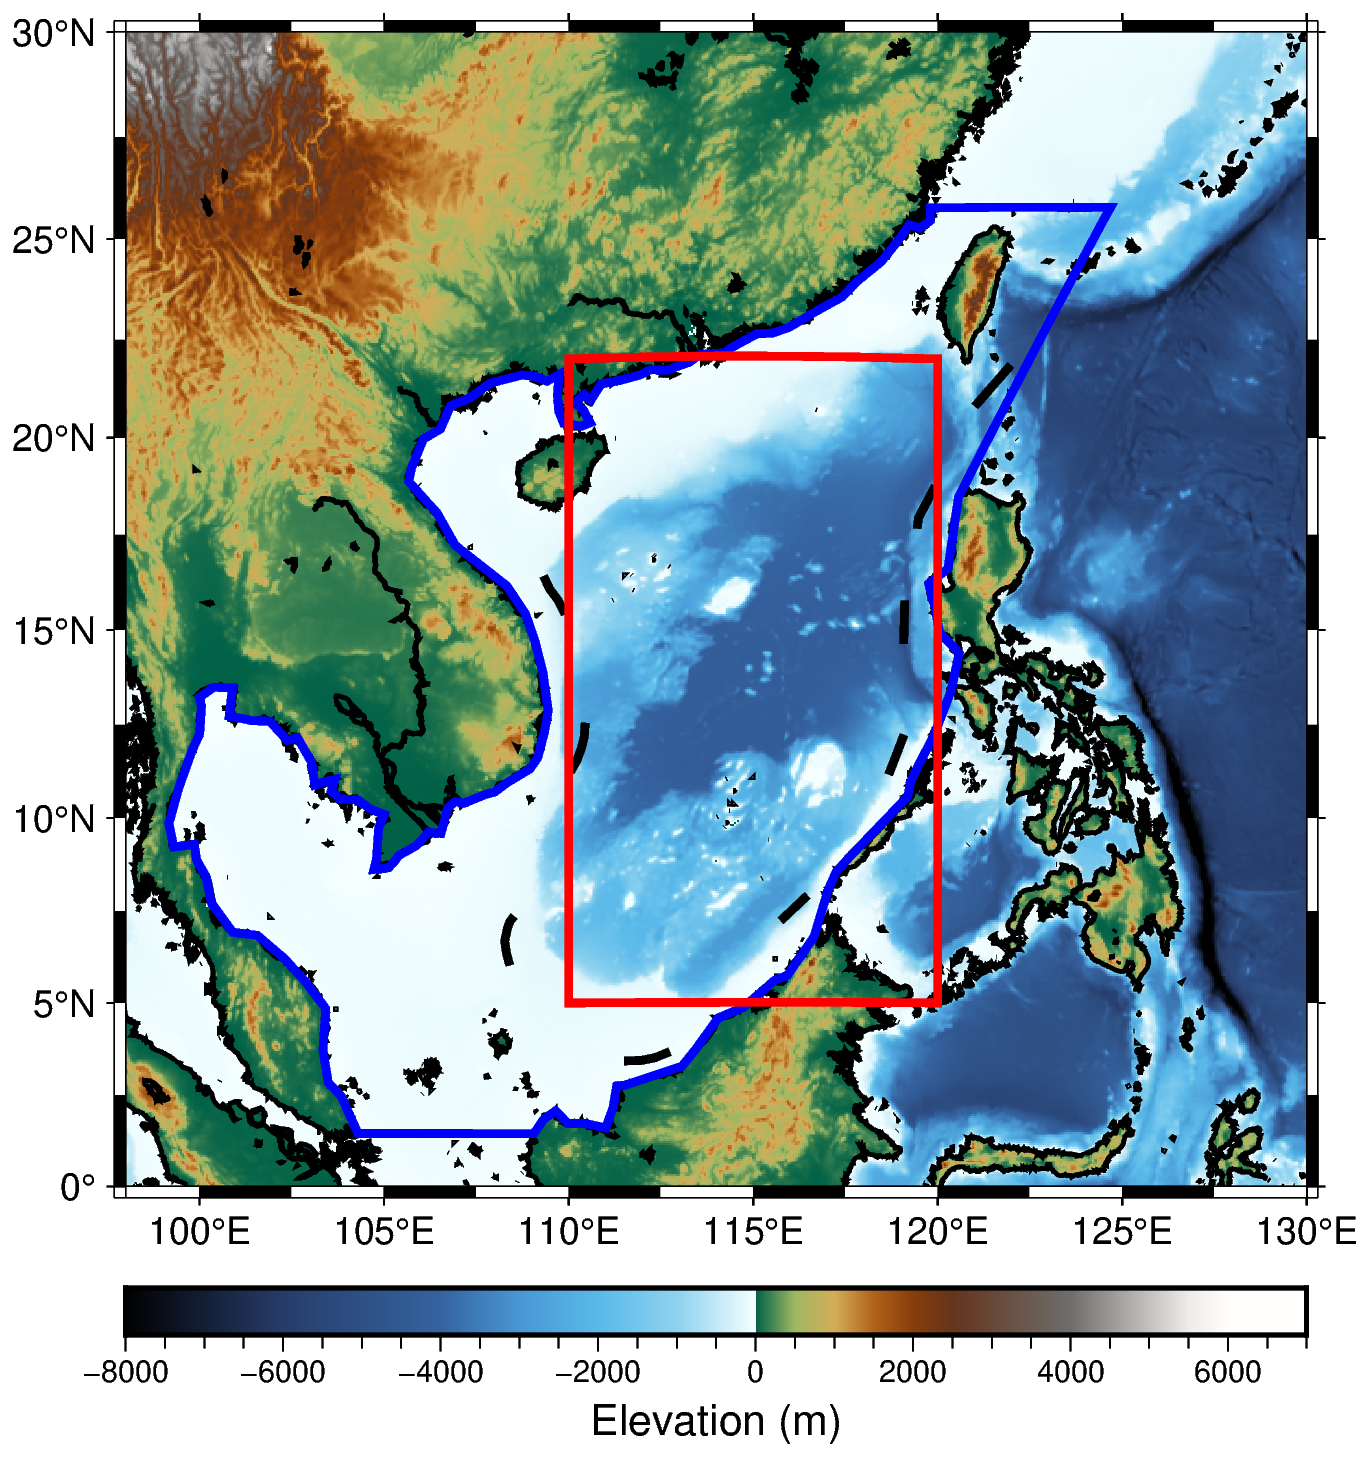
Figure 1Study region and monsoon classification over the South China Sea. The blue polygon indicates the study domain, while the red box marks the region used for defining the monsoon regimes.
2.2 Cloud Remote Sensing Products
Cloud retrievals used in this study are derived from the Moderate Resolution Imaging Spectroradiometer (MODIS) aboard the Aqua satellite, which has an equatorial crossing time of approximately 13:30 local time (LT). The MODIS cloud products analyzed are obtained from the Clouds and the Earth's Radiant Energy System (CERES) MODIS (CERES–MODIS hereafter) Edition 4 (Minnis et al., 2011a, 2021) Single Scanner Footprint (SSF) daily products (Level 3, 1° × 1° grid resolution), which provide physically consistent cloud and radiative properties based on synergistic MODIS and CERES observations. The CERES–MODIS cloud retrievals have been extensively validated (Minnis et al., 2011b; Yost et al., 2021) and have been widely employed in studies of ACI (Jia et al., 2021; Painemal, 2018). CERES–MODIS Edition 4 SSF cloud parameters utilized here include cloud optical depth (τ), cloud effective radius (CER), cloud-top temperature (CTT), cloud-top pressure (CTP), liquid cloud area fraction (LCAF), and liquid water path (LWP). CER is retrieved from the 3.7 µm channel, which is less affected by retrieval biases than its 2.1 and 1.6 µm counterparts (Grosvenor et al., 2018).
Nd used in this study is obtained from the community-standard gridded dataset of Gryspeerdt et al. (2022a), which provides 1° × 1° Level-3 Nd products derived from pixel-level MODIS Collection 6.1 retrievals. In this dataset, Nd is first estimated at the native MODIS pixel scale using retrieved cloud optical thickness and cloud effective radius, and then aggregated to a common grid using established sampling strategies to ensure robustness and consistency. The Nd retrievals are based on the adiabatic cloud assumption and are subject to strict quality control procedures, including screening for optically thin clouds, large solar zenith angle and viewing zenith angle conditions, sub-pixel heterogeneity, and potential retrieval contamination. Only single-layer liquid cloud scenes are retained. This dataset has been evaluated against observations and is widely used in aerosol–cloud interaction studies (e.g., Jia et al., 2024; Wall et al., 2023). In this study, we use the Nd_G18_37 product from this community-standard dataset.
2.3 Aerosol Optical Properties
Aerosol properties used in this study are obtained from the Modern-Era Retrospective Analysis for Research and Applications, Version 2 (MERRA-2; Gelaro et al., 2017), which assimilates a wide range of satellite observations to provide a physically consistent representation of global aerosol distributions. The MERRA-2 aerosol dataset used here includes the total aerosol extinction (AOD, 550 nm) and the total aerosol Ångström parameter (AE, 470–870 nm), with a spatial resolution of 0.5° × 0.625° and a temporal resolution of 1 h. To ensure spatiotemporal consistency with the CERES–MODIS cloud products, the MERRA-2 aerosol fields at 14:00 local solar time (LST), closest to the Aqua overpass (∼ 13:30 LST), were regridded to a 1° × 1° grid. AOD represents the column-integrated aerosol extinction, whereas AE characterizes the wavelength dependence of AOD and is commonly used as an indicator of aerosol particle size. A higher AE generally indicates dominance of fine-mode aerosols, while a lower AE suggests coarse-mode particles. The aerosol index (AI) is defined as the product of AOD and AE:
AI, in comparison to AOD, is considered a better parameter for representing aerosols in ACI studies, because it incorporates information on aerosol particle size, which is critical for cloud droplet activation and microphysical properties (Ma et al., 2018b; Nakajima et al., 2001). Therefore, AI is employed in this study as the aerosol proxy in the calculation of ACI.
2.4 Atmospheric Parameters of Weather Fields
Atmospheric fields were obtained from the fifth-generation ECMWF reanalysis (ERA5; Hersbach et al., 2020). ERA5 assimilates a comprehensive suite of ground-based and satellite observations through a state-of-the-art four-dimensional variational data assimilation system, offering physically consistent and dynamically balanced representations of the atmosphere. The dataset used here includes three-dimensional fields of specific humidity and horizontal wind components (U and V) at all standard pressure levels, temperature at 1000 and 700 hPa, and mean sea level pressure. The daily mean specific humidity and wind speed at 850 hPa were used to distinguish the three periods over the SCS (Wang et al., 2004). Wind and humidity fields at all pressure levels were analyzed to characterize the large-scale atmospheric circulation and vertical moisture structure during these periods. The 1000 hPa specific humidity was employed as a proxy for the ambient water vapor available to warm clouds (Dadashazar et al., 2020). Temperatures at 1000 and 700 hPa were used to compute the LTS, which quantifies the thermodynamic stability of the lower atmosphere (Klein and Hartmann, 1993), as follows:
where θ700 hPa and θ1000 hPa denote the potential temperatures at 700 and 1000 hPa, respectively, P00 is the standard reference pressure (typically 1000 hPa), P is the pressure at a given level, R is the gas constant for dry air, and Cp is the specific heat capacity of dry air at constant pressure. To ensure spatiotemporal consistency with the aerosol and cloud parameters, both the 1000 hPa specific humidity and LTS at 14:00 LST were regridded to a 1° × 1° grid. Sea surface temperature (SST) was obtained from the National Oceanic and Atmospheric Administration (NOAA) Optimum Interpolation SST, version 2 (OI SST v2, Reynolds et al., 2002), which incorporates both in-situ and satellite observations and provides monthly fields at 1° × 1° resolution.
2.5 Precipitation Data
Precipitation data were obtained from the Integrated Multi-satellite Retrievals for GPM (IMERG) Version 07 Final Run. IMERG is the flagship precipitation product of the Global Precipitation Measurement (GPM) mission, a collaborative effort between NASA and JAXA (Huffman et al., 2023). The IMERG algorithm calibrates, merges, and interpolates precipitation estimates from the constellation of Low Earth Orbit (LEO) passive microwave (PMW) radiometers onboard GPM satellites. These estimates are subsequently integrated with geostationary satellite infrared observations, particularly in regions with sparse PMW coverage, to produce a global precipitation product with 0.1° spatial and 30 min temporal resolutions (Huffman et al., 2020; Watters et al., 2021). IMERG precipitation data, owing to its global coverage and high spatiotemporal resolution, have been widely adopted by the research community (Dezfuli et al., 2017; Durden, 2024; Hayden et al., 2023; Tan et al., 2019a; Watters et al., 2021; Watters and Battaglia, 2019; Zhang and Wang, 2024; Zhu et al., 2024). Consequently, IMERG V07 Final Run PrecipitationCal, the gauge-calibrated multi-satellite product, is used here to determine whether precipitation occurred within each CERES–MODIS grid cell.
2.6 Data Quality Control
To minimize the influence of satellite retrieval biases when investigating ACI, a rigorous quality-control procedure was applied to the CERES–MODIS cloud dataset following the method of Saponaro et al. (2017). The selection criteria were as follows:
-
Only liquid-phase warm clouds were retained, identified by a cloud-phase flag of “liquid” and CTT > 273 K.
-
To reduce the impact of large-scale cloud-macrophysical variability and highlight microphysical processes, only clouds with CTP between 650 and 950 hPa were selected.
-
Thin clouds with τ < 5 were excluded to minimize retrieval uncertainty.
-
A threshold of < 0.2 mm h−1 was adopted to identify IMERG non-raining cases, following Tan et al. (2019b). The IMERG precipitation data were first collocated onto CERES–MODIS 1° × 1° grid cells. A grid cell was then classified as non-raining when all IMERG sub-pixels within the 13:00–13:30 and 13:30–14:00 LT intervals recorded precipitation rates below 0.2 mm h−1, as illustrated in Fig. 2.
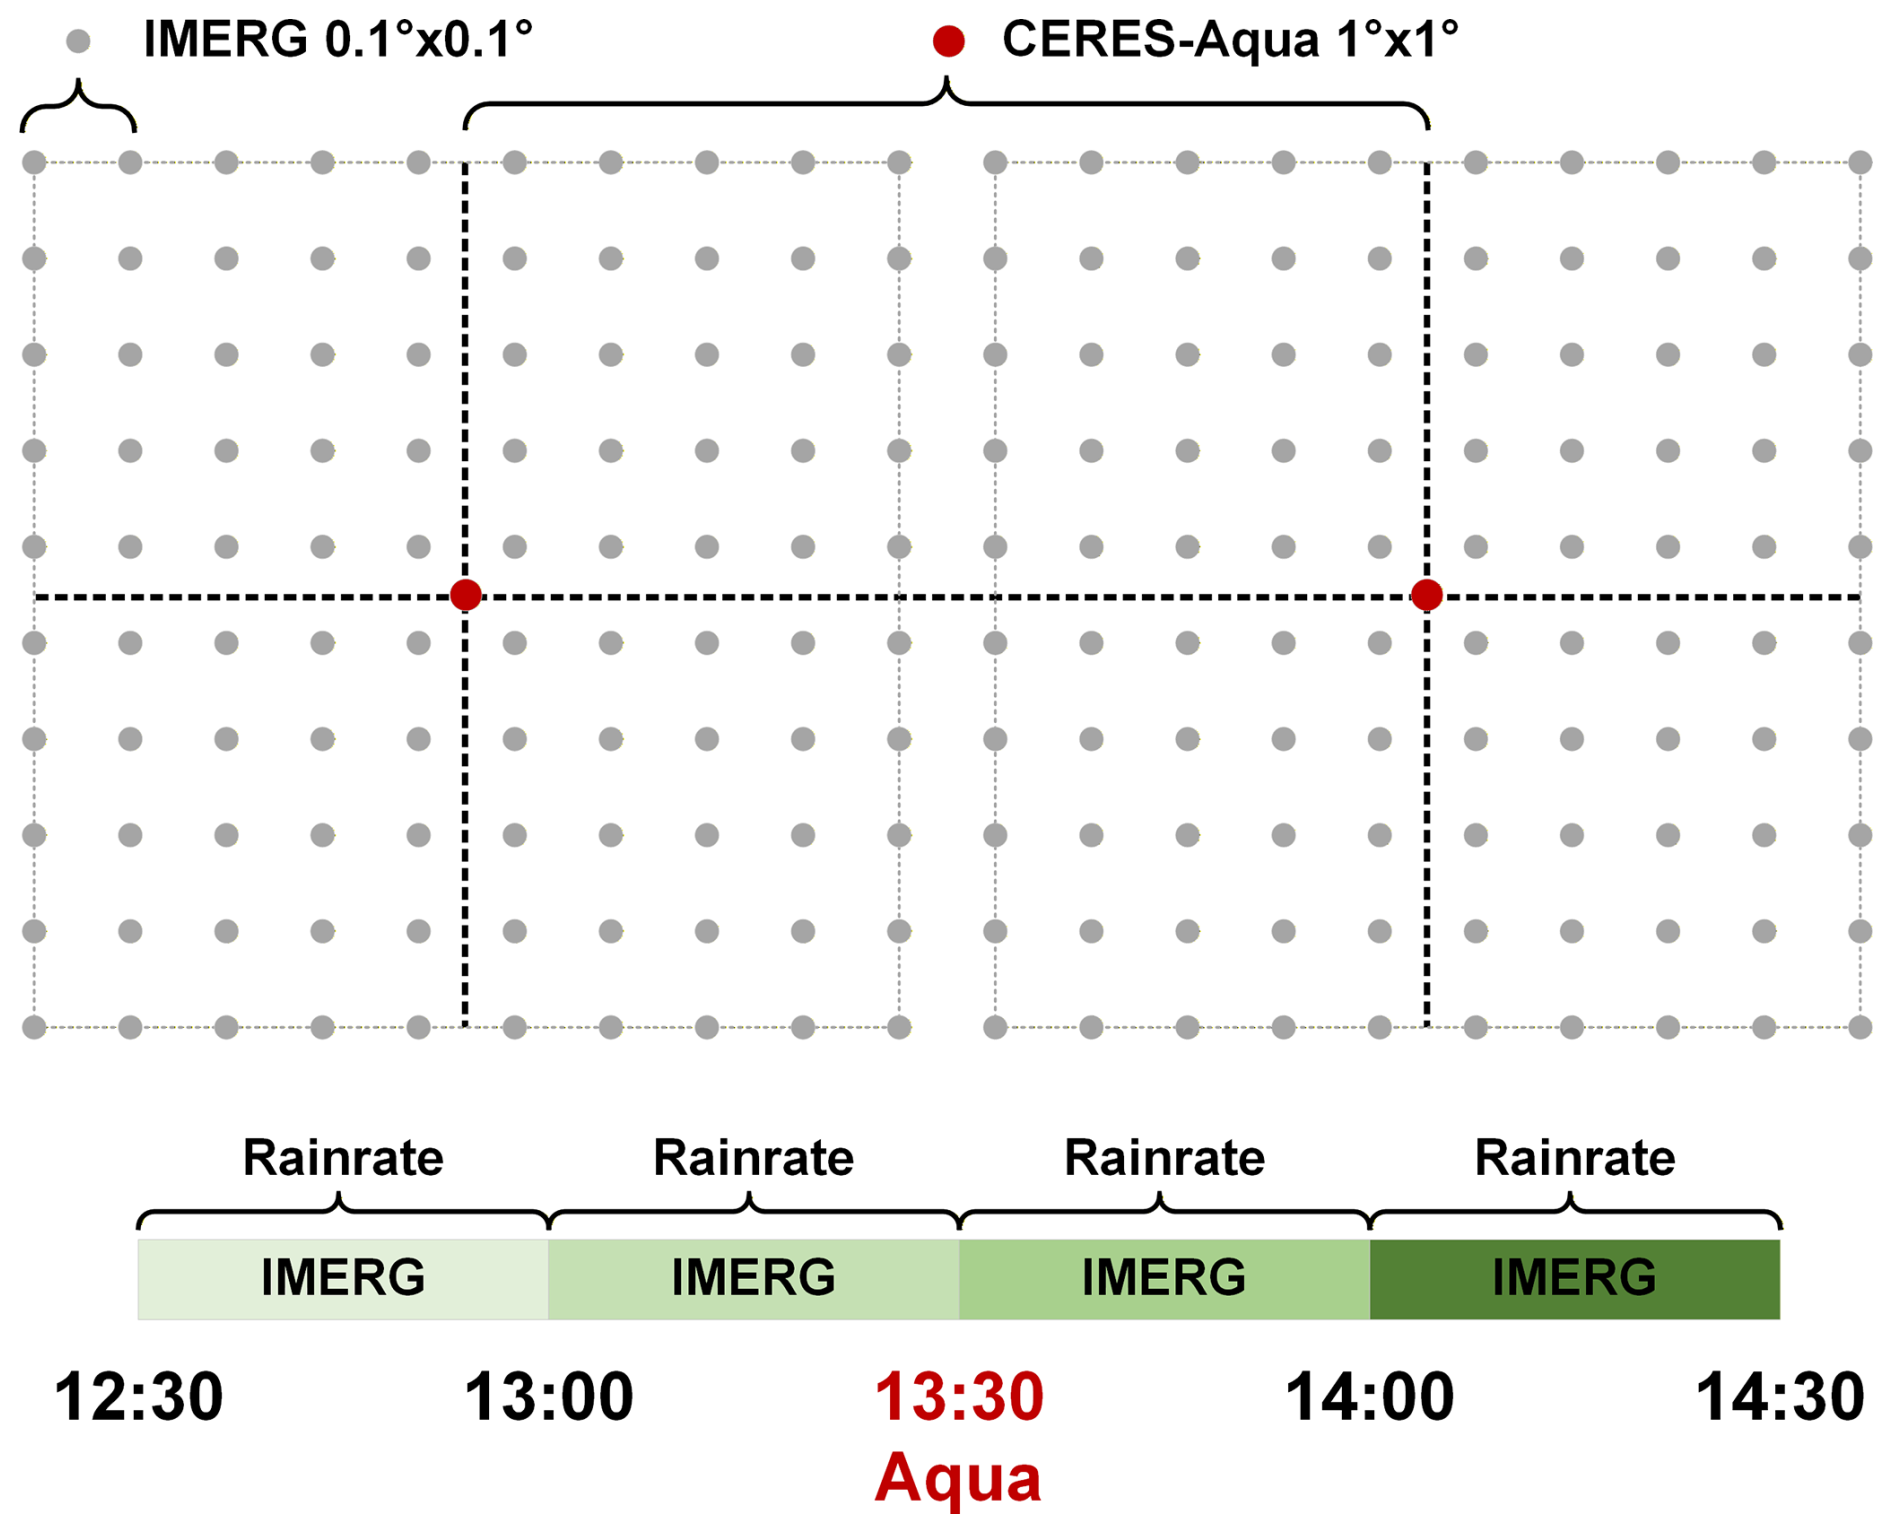
Figure 2Schematic illustration of the procedure used to identify non-raining CERES–MODIS grid cells based on IMERG V07 Final Run PrecipitationCal.
3.1 Definition of Monsoon Periods over the South China Sea
ACI are strongly modulated by environmental factors such as humidity, vertical wind velocity, and atmospheric stability (Zhu et al., 2022). Therefore, considering the prevailing atmospheric conditions is crucial when examining their variability. The atmospheric environment over the SCS exhibits distinct characteristics under the influence of the southwest monsoon and the northeast monsoon. A distinctive feature of the SCS summer monsoon is its nearly simultaneous onset across a broad latitudinal range (3–22° N) (Wang et al., 2004). On top of the previous studies that defined monsoon periods over the SCS based on wind direction (Wang et al., 2004, 2009), we further incorporated precipitation and specific humidity within this 3–22° N band (the red box in Fig. 1) to classify the study periods into three regimes: the southwest monsoon wet period (SWMW), the northeast monsoon dry period (NEMD), and the northeast monsoon wet period (NEMW). As shown in Fig. 3, the SCS is dominated by the southwest monsoon from May to August, during which specific humidity reaches its maximum and precipitation is strongest. From October to December, the northeast monsoon prevails, accompanied by relatively high specific humidity and intense precipitation. During January to March, the SCS remains under the influence of the northeast monsoon, but specific humidity is at its lowest and precipitation is minimal, representing a dry period. Accordingly, we defined May–August as SWMW, October–December as NEMW, and January–March as NEMD. These three periods not only reflect significant differences in atmospheric circulation and moisture conditions, along with aerosol regimes over the SCS, but also provide distinct environmental backgrounds for ACI, which may influence their characteristics and intensity.
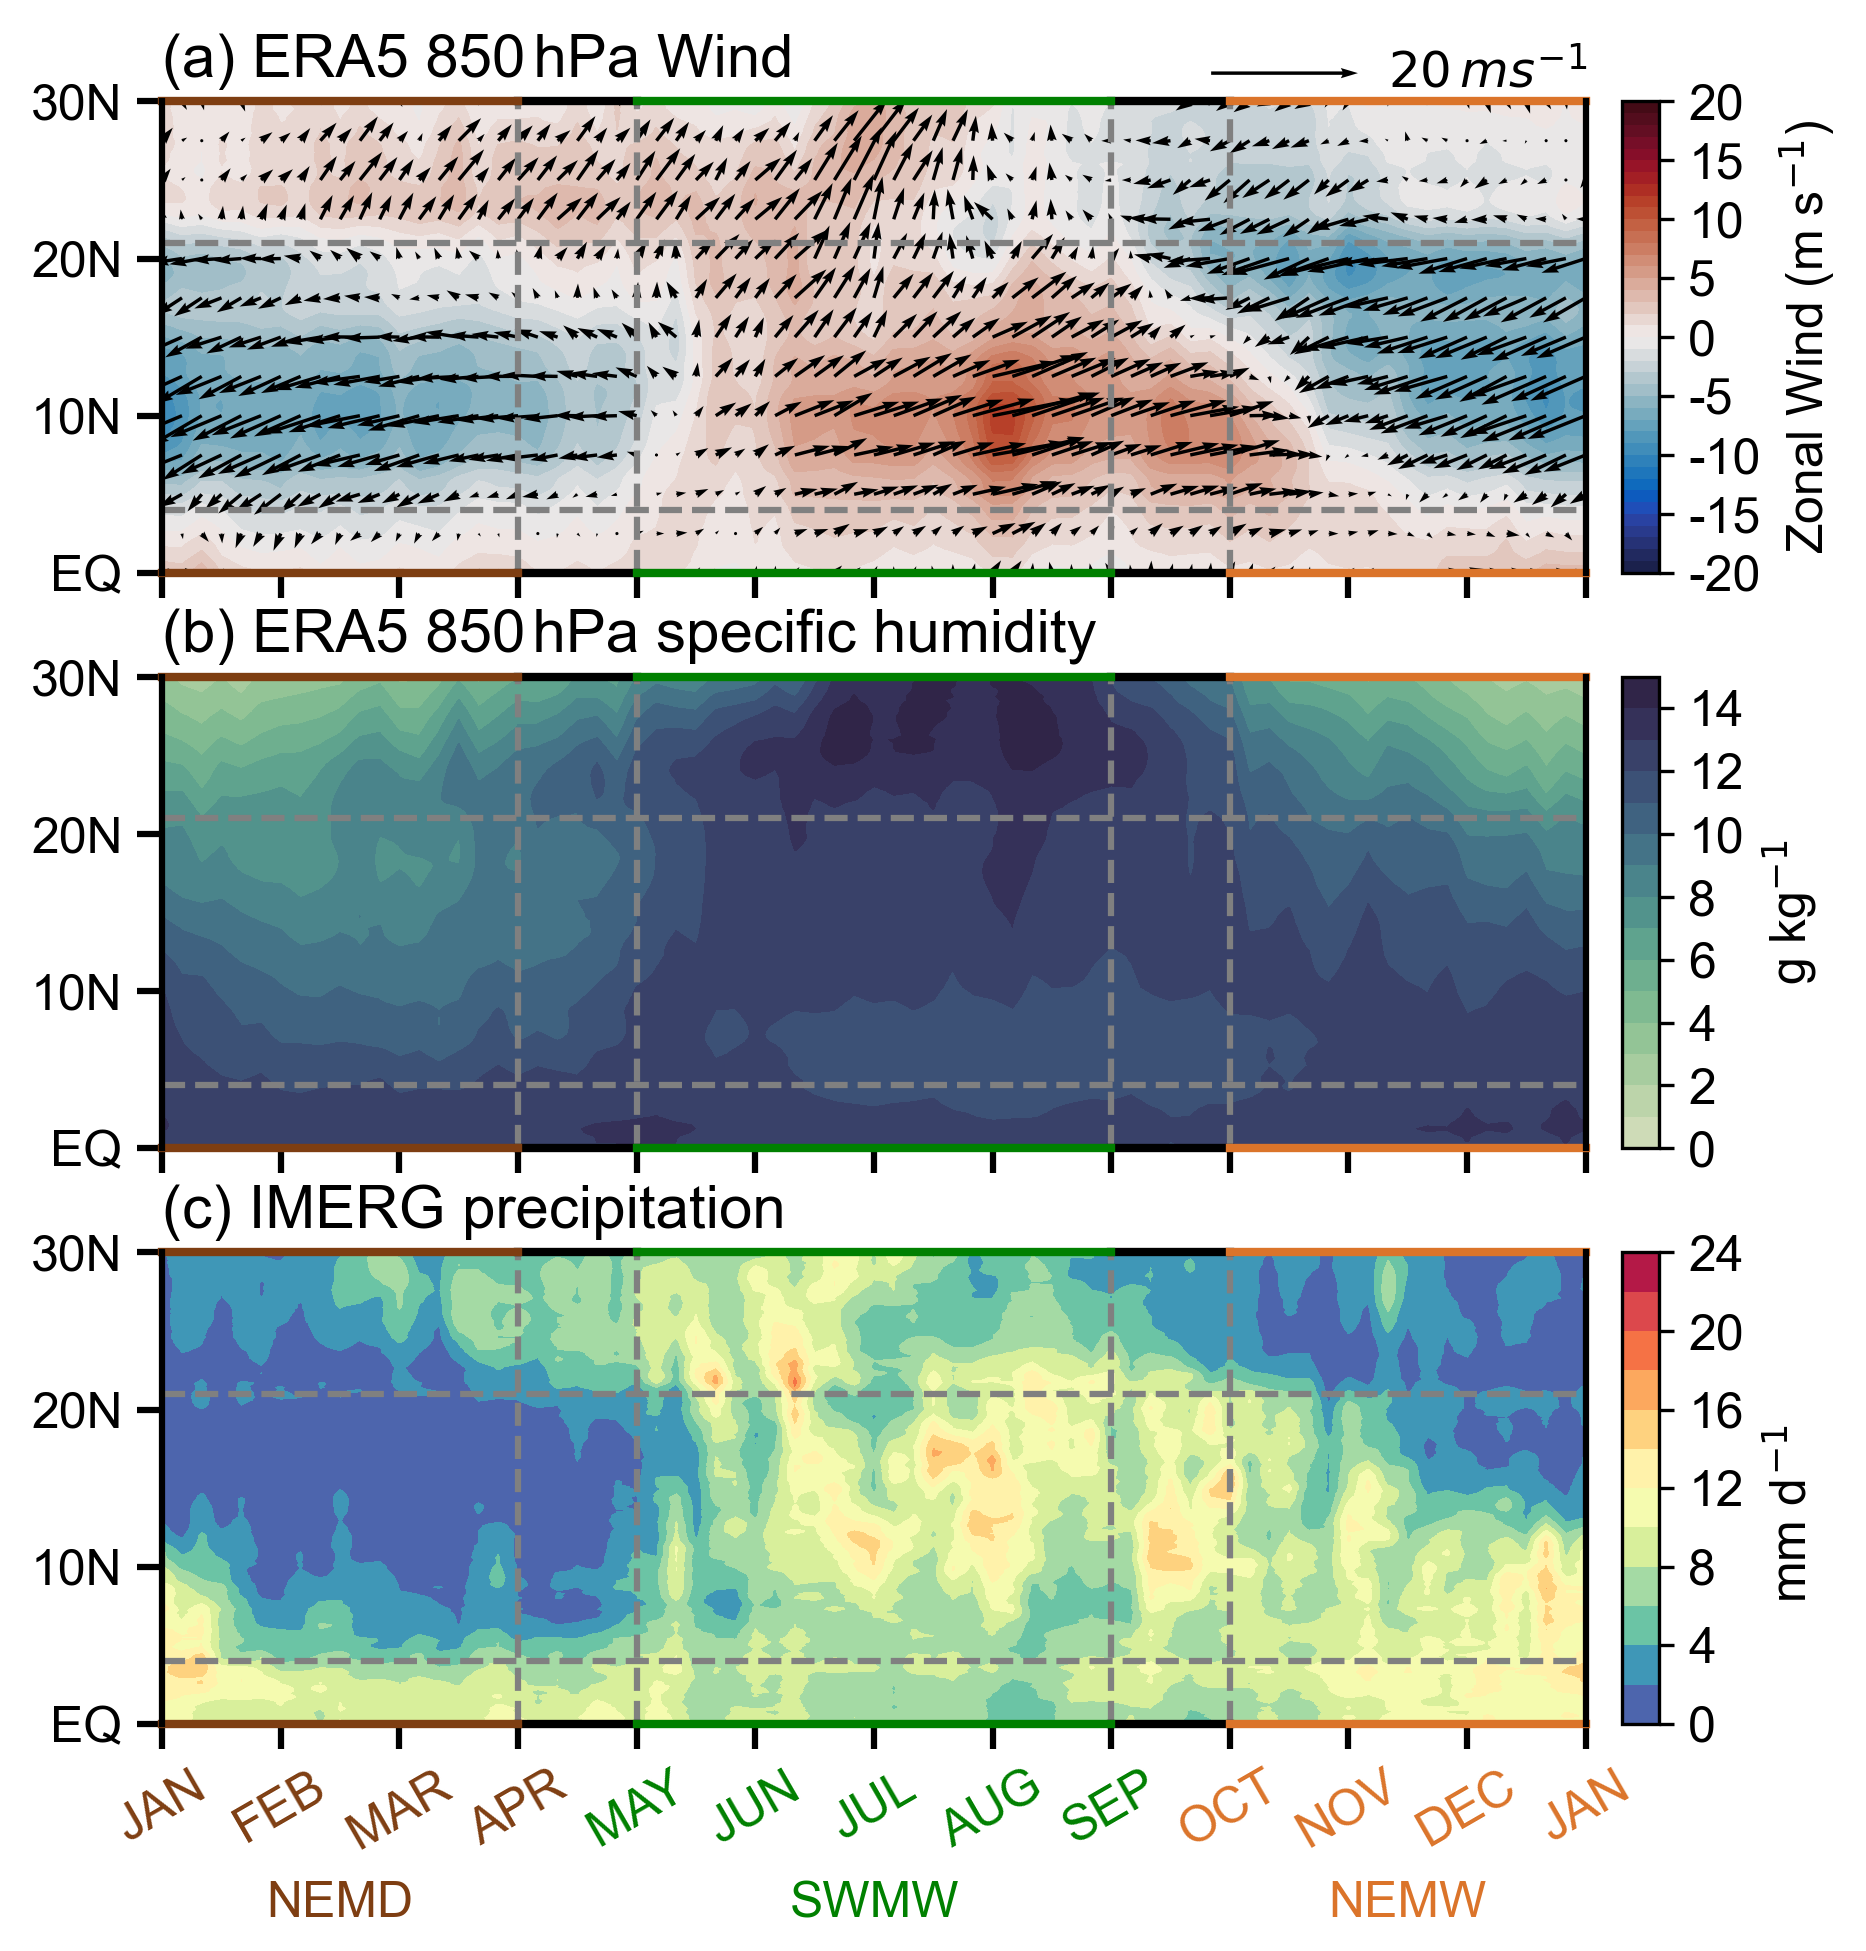
Figure 3Time–latitude distribution of the (a) ERA5 climatological pentad mean 850 hPa zonal wind (July 2002–February 2020) and (b) ERA5 pentad mean 850 hPa specific humidity (July 2002–February 2020) and (c) IMERG pentad mean precipitation (July 2002–February 2020). The data are averaged over the longitude bands between 110 and 120° E across the SCS. The arrows in panel (a) indicates 850 hPa horizontal winds.
3.2 Atmospheric conditions and Aerosol–Cloud properties during the Three Periods
3.2.1 Atmospheric Circulation and Sea Surface Temperature
The Hadley circulation over the SCS is modulated by the Asian monsoon system and the seasonal variation of solar radiation. Figure 4a shows that during the SWMW period, the SCS is dominated by ascending motion, which is associated with the presence of the Intertropical Convergence Zone (ITCZ) over the region. During the NEMW period, the Hadley circulation shifts southward and the subtropical high is established over the northern SCS (Fig. 4e). As a result, subsidence dominates the northern part of the region, whereas ascending motion occurs over the equatorial southern part (Fig. 4b). During the NEMD period, as the Hadley circulation continues to shift southward, the subtropical high dominates the SCS (Fig. 4f), leading to prevailing subsidence over the region (Fig. 4c). As shown in Fig. 4a–c, the water vapor content over the SCS gradually decreases from the SWMW period to the NEMW period and further to the NEMD period. During the SWMW period, the winds over the SCS are predominantly westerly. In contrast, during both the NEMW and NEMD periods, the winds are mainly easterly. Additionally, a westerly jet is present at upper levels over the northern SCS. These features show that the SCS exhibits distinct vertical circulation, moisture, and wind patterns under different monsoon conditions.
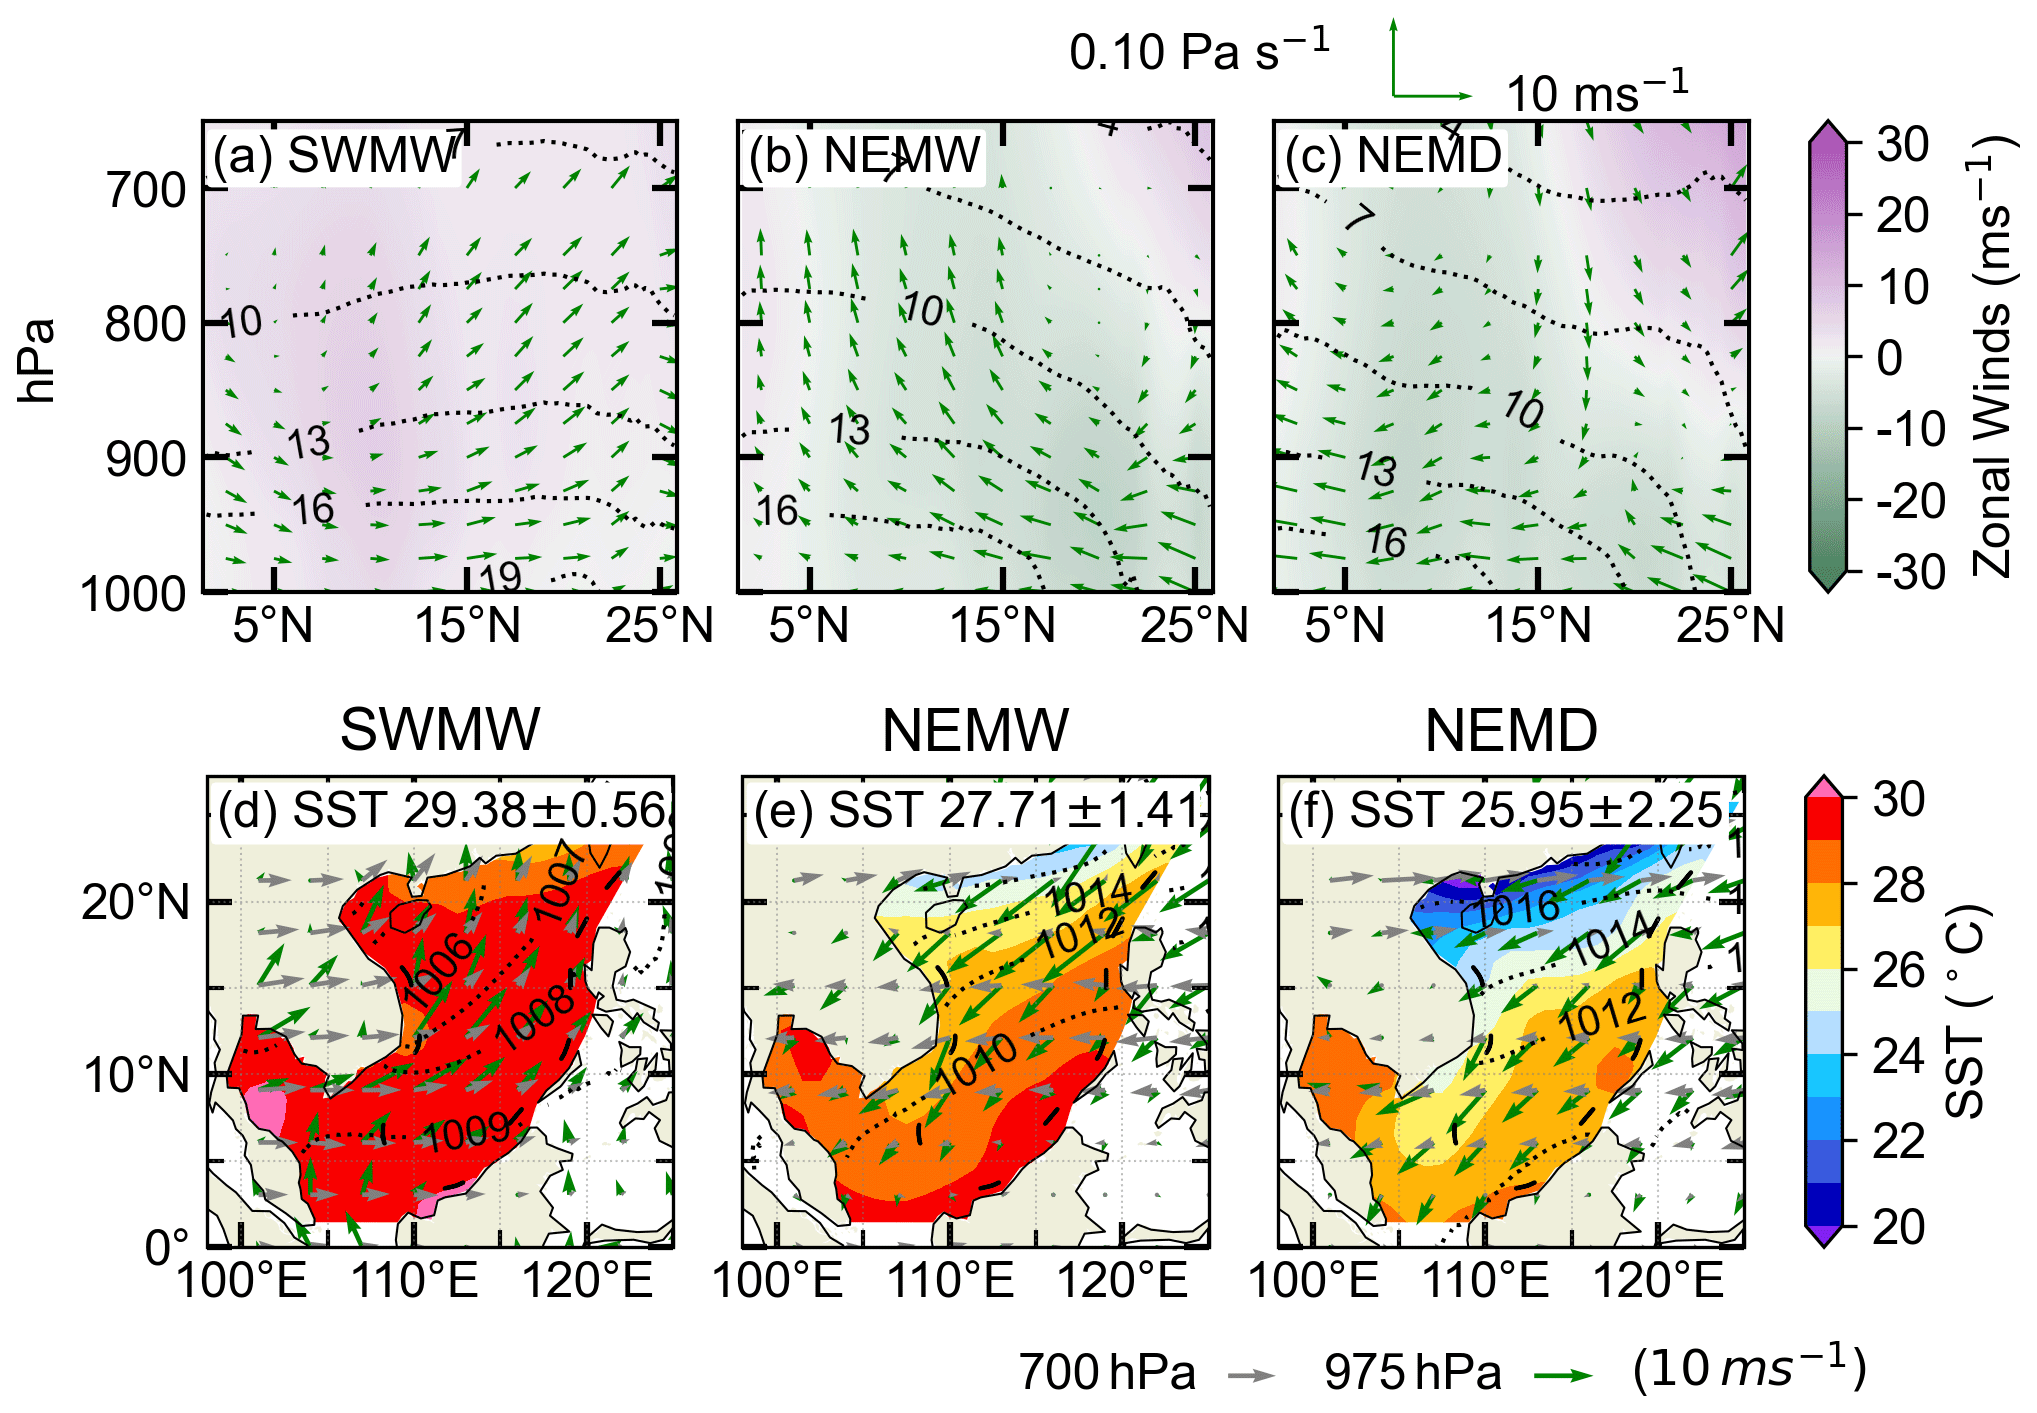
Figure 4Zonally averaged cross section of the atmospheric circulation from ERA5 (July 2002–February 2020) for the domain bounded between 110 and 120° E during (a) the southwest monsoon wet period, (b) the northeast monsoon wet period, and (c) the northeast monsoon dry period. Meridional and pressure velocity are denoted by arrows (↑ indicates upward motion), whereas colors indicate the zonal wind component. Black contour is specific humidity. Panels (d)–(f) show the corresponding overview of meteorological conditions and SST over the SCS region. Color shades represent SST from OISST (July 2002–February 2020), black contour is sea level pressure from ERA5 (July 2002–February 2020), and arrows are near-surface wind speed at 975 hPa (green) and that at 700 hPa (gray) from ERA5 (July 2002–February 2020).
The SCS exhibits contrasting large-scale circulation patterns between the southwest and northeast monsoon periods, as shown in Fig. 4d–f. During the SWMW period, the SCS is influenced by tropical and equatorial maritime air masses, with prevailing southwesterlies over the region (Martin and Howland, 1982), whereas during the northeast monsoon, winter airflows originating from Siberia and the Mongolian Plateau result in prevailing northeasterlies (Liu et al., 2024). These opposite prevailing wind directions play a crucial role in modulating the transport pathways of continental pollutants into the SCS. Specifically, air masses originating from the Indochinese Peninsula and surrounding Southeast Asian land regions are the primary sources of pollutants transported into the SCS (Miller et al., 2023; Ou et al., 2025; Sun et al., 2023; Zhang et al., 2019), whereas during the northeast monsoon, continental emissions from China may be carried southward into the region (Xiao et al., 2017; Yuan et al., 2024; Zheng et al., 2023).
Figure 4d–f show that the area-averaged SST over the SCS is highest during the SWMW period (29.38 ± 0.56 °C), lower during the NEMW period (27.71 ± 1.41 °C), and lowest during the NEMD period (25.95 ± 2.25 °C), with variations consistent with those of specific humidity. During the southwest monsoon, the SST gradient across the SCS is relatively small, whereas during the northeast monsoon, SST decreases with increasing latitude (Wu et al., 2020), and a cold water band forms along the coastal region near mainland China (Chen and Hu, 2023). Higher SST promotes strong latent and sensible heat fluxes, which in turn enhance the atmospheric moisture content over the region (Lee and Park, 2022; Zhang et al., 1995). Consequently, SST and atmospheric moisture exhibit consistent variations across the three periods. In addition, during the northeast monsoon, both the SST (Fig. 4e–f) and atmospheric moisture (Fig. 4b–c) decrease with increasing latitude, showing similar latitudinal gradients.
3.2.2 Aerosol and Cloud Properties
The area-averaged aerosol values over the SCS exhibit clear differences among the three periods (Fig. 5). The lowest values occur during the SWMW period, with AOD = 0.17 ± 0.04 and AI = 0.16 ± 0.06. Higher values are observed during the NEMW period, with AOD = 0.23 ± 0.08 and AI = 0.20 ± 0.13, whereas the NEMD period shows the highest values, with AOD = 0.27 ± 0.14 and AI = 0.30 ± 0.23, indicating different aerosol sources. Significant differences in aerosol distribution are also observed between the southwest and northeast periods. During the southwest period, higher aerosol values are found in the northern SCS near mainland China and in the southwestern SCS near Malaysia. During the northeast period, aerosol values exhibit a pronounced gradient, forming a coastal band that decreases with increasing distance from the shoreline (Tu et al., 2021). Compared with AOD, AI incorporates aerosol size information and is therefore considered a more suitable proxy for cloud condensation nuclei in studies of ACI (Nakajima et al., 2001). Over the northern SCS near mainland China, AI values are larger than AOD, indicating that aerosols in this region are dominated by fine particles. In contrast, in the central SCS, farther from the continent, AI values are smaller than AOD, suggesting that aerosols there are primarily coarse particles from natural sources.
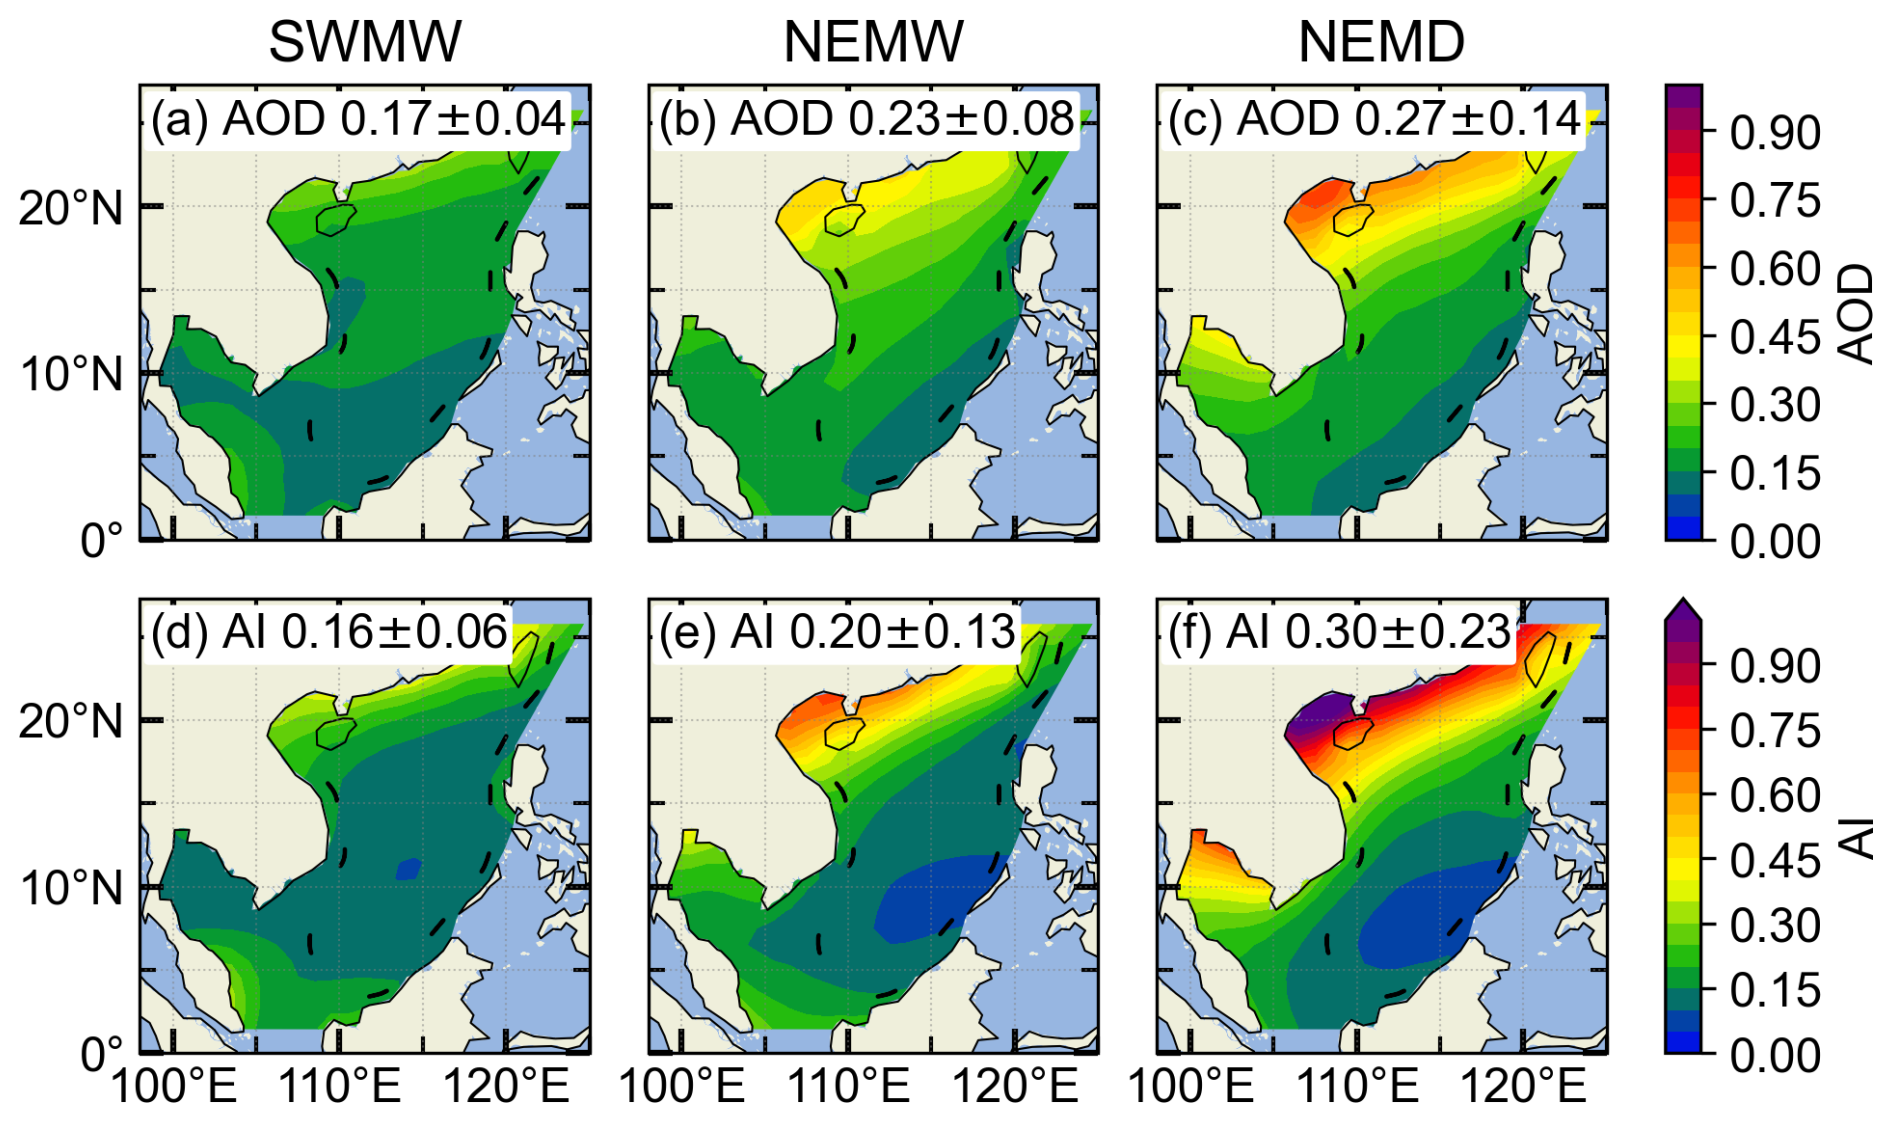
Figure 5Spatial distributions of MERRA-2 AOD (July 2002–February 2020) over the South China Sea, averaged over different periods: (a) the southwest monsoon wet period, (b) the northeast monsoon wet period, and (c) the northeast monsoon dry period. (d–f) Corresponding AI (July 2002–February 2020) averaged over the same periods.
Figure 6 shows the variations in macrophysical and microphysical properties of warm clouds over the SCS during the three monsoon periods. During the SWMW period, the area-averaged warm-cloud fraction over the SCS is the lowest (44.95 ± 16.51 %), whereas comparable higher values are observed during the NEMW (77.21 ± 13.23 %) and NEMD (80.27 ± 11.68 %) periods. Although the SCS experiences the highest water vapor content during the SWMW period, the presence of strong updrafts enhances cloud development (Fig. 4a), leading to the lowest fraction of warm clouds and an increased occurrence of mixed-phase and ice clouds. During the northeast monsoon, the advection of dry and cold continental air over the SCS likely suppresses convective activity, maintaining a higher fraction of warm clouds in the region. Additionally, during the northeast monsoon, the fraction of warm clouds is highest in the northern SCS, whereas lower values are observed in the southern region near the equator, likely due to stronger convective activity in the equatorial area.
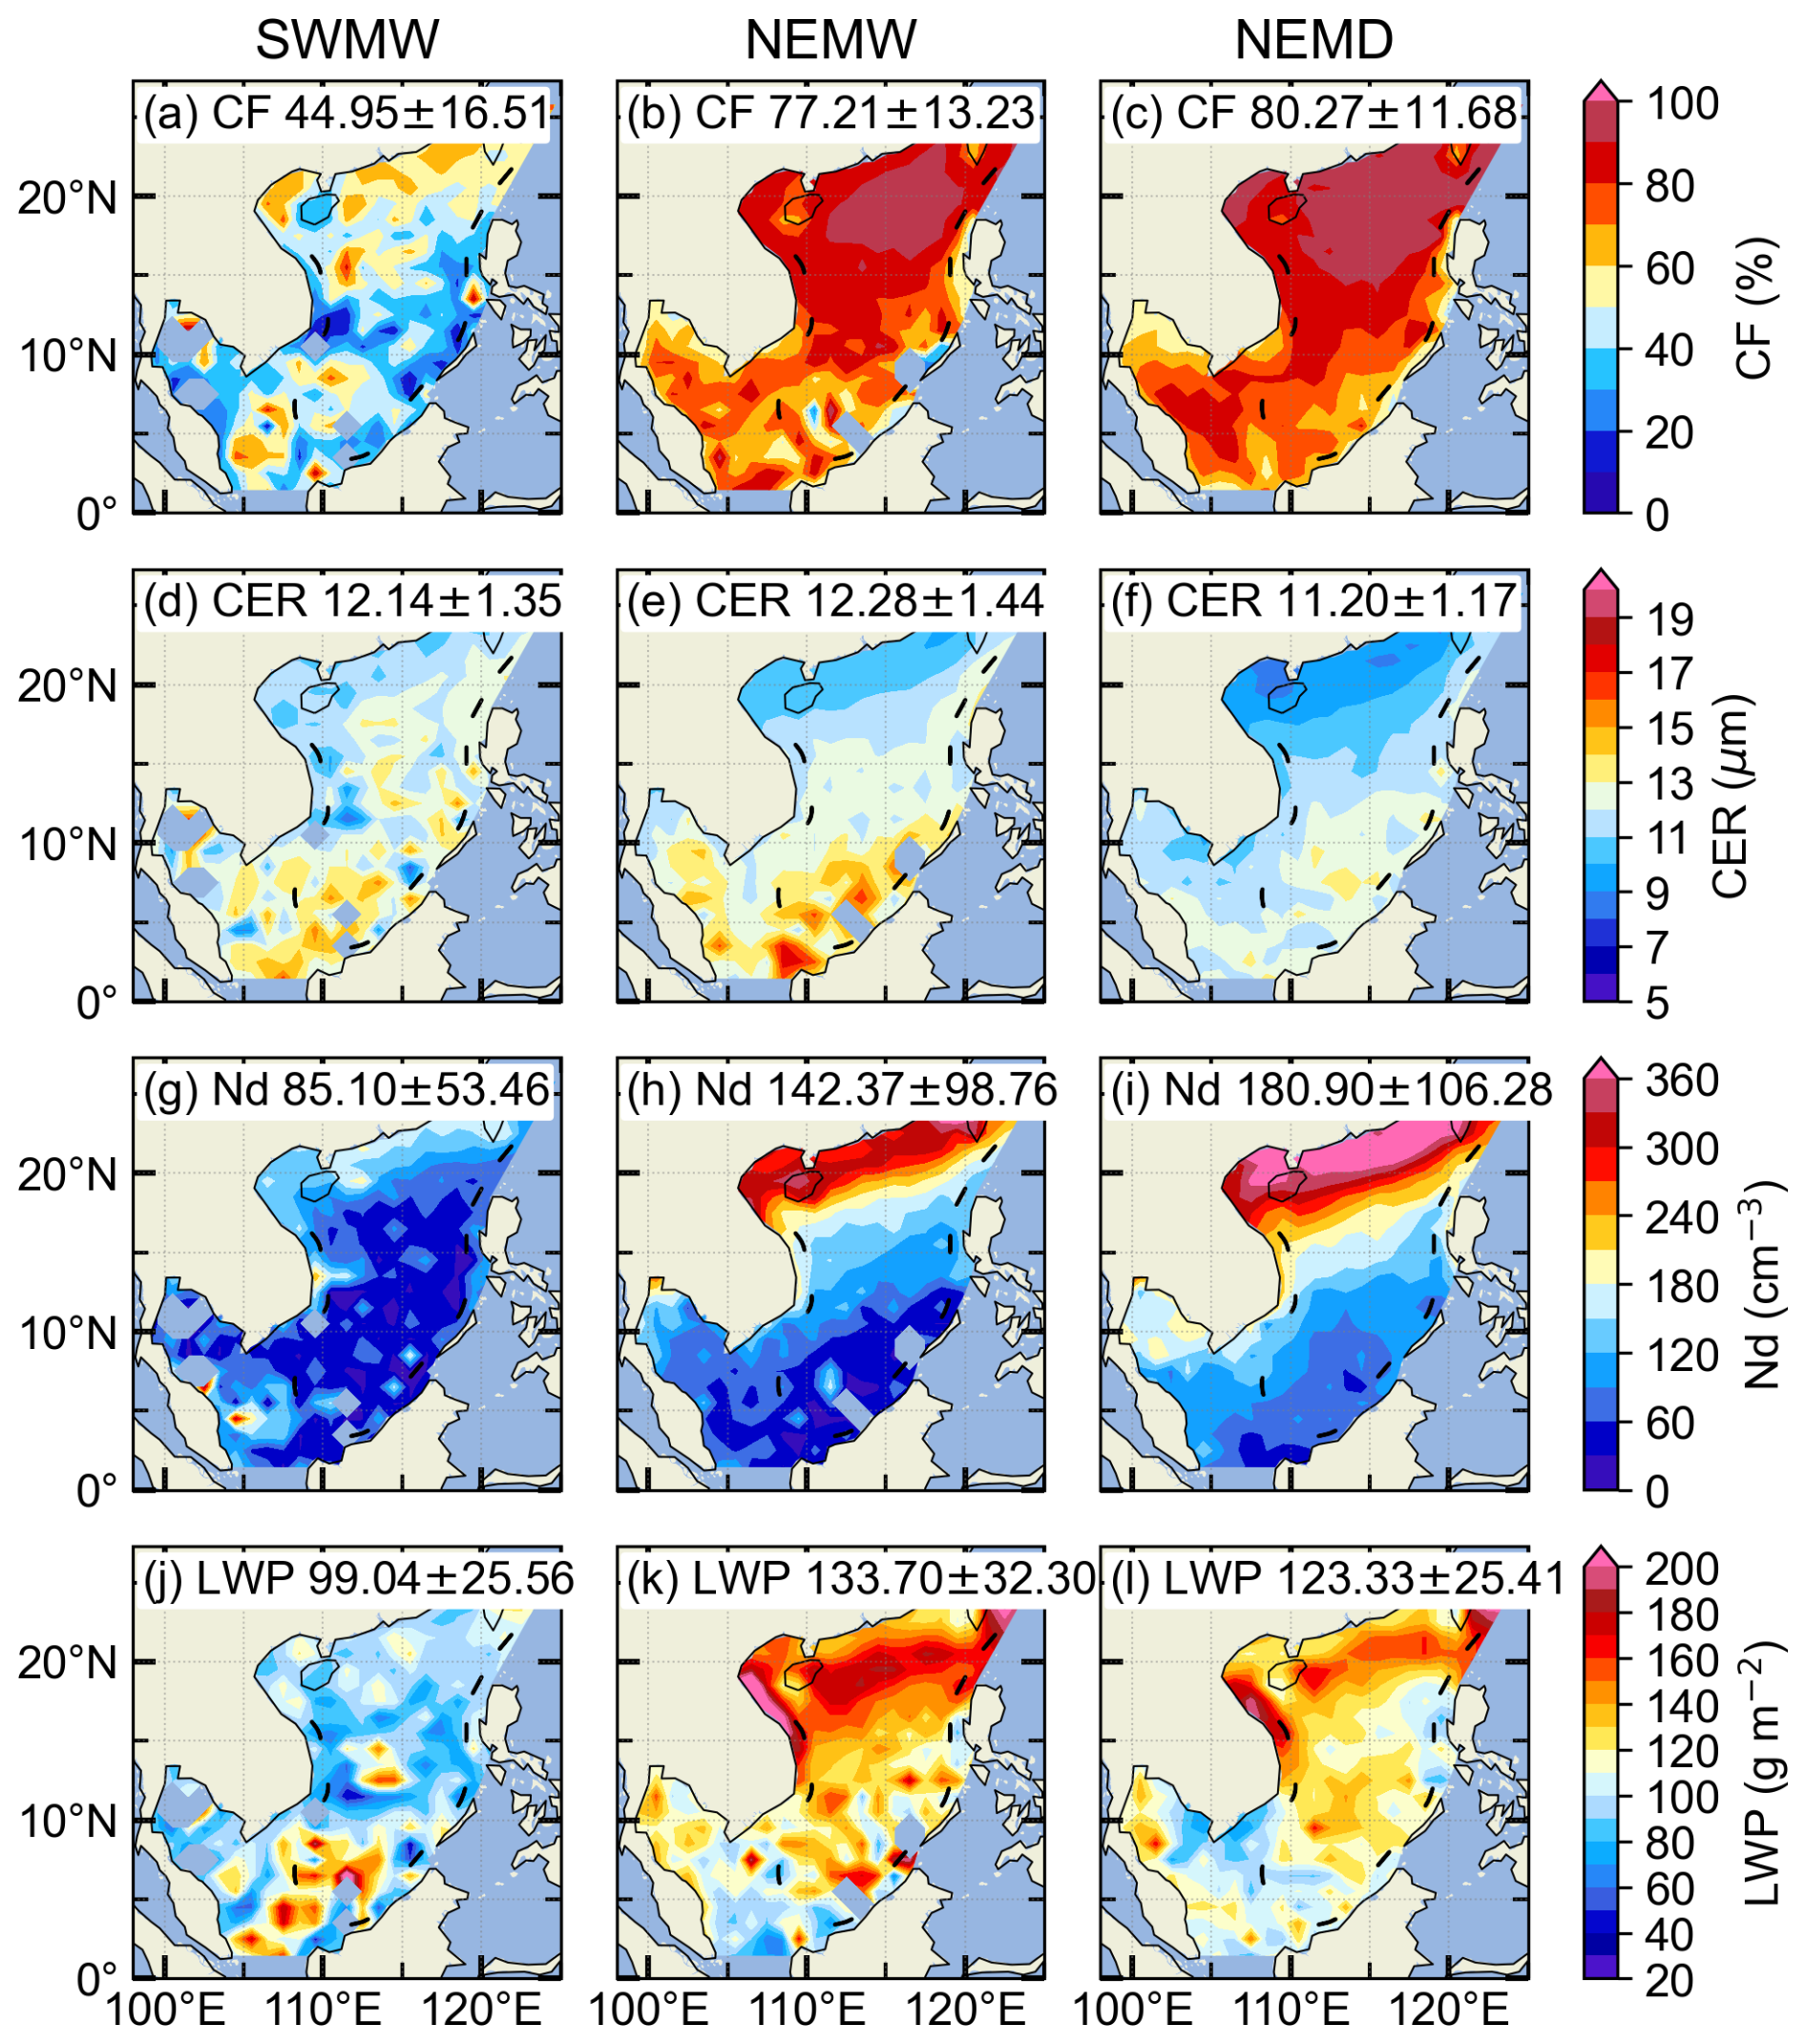
Figure 6Spatial distributions of warm-cloud (a–c) cloud fraction, (d–f) cloud droplet effective radius, (g–i) cloud droplet number concentration, and (j–l) liquid water path over the South China Sea during the southwest monsoon (first column), the northeast monsoon wet period (second column), and the northeast monsoon dry period (third column).
The area-averaged warm-cloud droplet effective radius over the SCS is similar across the three monsoon periods, with values of 12.14 ± 1.35 µm during the SWMW period, 12.28 ± 1.54 µm during the NEMW period, and 11.20 ± 1.17 µm during the NEMD period (Fig. 6d–f). In terms of the spatial distribution of warm-cloud droplet effective radius, droplets near the equatorial region tend to be larger than those in other areas, likely due to more pronounced droplet collision and coalescence driven by precipitation, which increases droplet size.
The area-averaged warm-cloud droplet number concentration over the SCS exhibits distinct differences among the three periods. The lowest mean value occurs during the SWMW period (85.10 ± 53.46 cm−3), followed by a higher value during the NEMW period (142.37 ± 98.76 cm−3), and the highest value during the NEMD period (180.90 ± 106.28 cm−3) (Fig. 6g–i). The highest cloud droplet number concentration is observed in the northern SCS adjacent to the Chinese mainland, showing a strong spatial correspondence with aerosol distribution. Aerosol concentrations are also largest in this region (Fig. 5), consistent with the Twomey effect, whereby enhanced aerosol loading increases cloud droplet number concentration. In the southern SCS near the equator, cloud droplet number concentration is relatively low, which may be attributed to lower aerosol concentrations and/or stronger convective activity that promotes droplet growth and reduces droplet number.
The area-averaged warm-cloud LWP over the SCS is lowest during the SWMW period (99.04 ± 25.56 g m−2), highest during the NEMW period (133.70 ± 32.30 g m−2), and intermediate during the NEMD period (123.21 ± 25.41 g m−2) (Fig. 6j–l). During the northeast monsoon, the highest LWP values are observed in the northern SCS adjacent to the Chinese mainland. This may be attributed to more polluted environments, where the second indirect aerosol effect suppresses precipitation, thereby leading to an increase in LWP (Albrecht, 1989). It is noteworthy that the LWP in the northern SCS is higher during the NEMW period than during the NEMD period, which may be associated with sedimentation-entrainment feedback (Ackerman et al., 2004) and/or evaporation-entrainment feedbacks (Dagan et al., 2017; Wang et al., 2003). Compared with the NEMW period, the NEMD period is characterized by higher cloud droplet number concentrations and smaller CER in this region (Fig. 6e, f, h, i). These two feedbacks describe how increased droplet number concentrations and reduced droplet sizes can enhance cloud-top entrainment and evaporation, ultimately leading to a reduction in LWP (Gryspeerdt et al., 2019). Additionally, under drier conditions above cloud tops during the NEMD period, the sedimentation-entrainment feedback may be further amplified, resulting in a stronger reduction in LWP (Gryspeerdt et al., 2019; Sato et al., 2018). During the SWMW, LWP is also relatively high in the southern SCS near the equator (Fig. 6j). In this region, CER is larger and Nd is lower (Fig. 6d, g), likely due to stronger updrafts near the equator, which enhance the vertical development of warm clouds and result in higher cloud water content.
Qualitatively, the consistency in zonal gradients of aerosol and cloud properties across all three monsoon regimes clearly reflects the theoretical ACI signal: aerosols increase Nd while reducing droplet size, which in turn lowers precipitation probability and thereby increases LWP and CF. Quantitatively, however, ACI intensities vary depending on the meteorological background (to be discussed in detail in the following section).
3.3 The Twomey Effect across the Three Periods
Twomey (1977) proposed that atmospheric aerosol particles can act as cloud condensation nuclei, such that an increase in aerosol loading leads to a higher cloud droplet number concentration. Under a nearly constant liquid water content, this results in smaller cloud droplet effective radius. To examine the Twomey effect during the three periods, the 25th and 75th percentiles of the AI were used to define clean (AI < 25th percentile) and polluted (AI > 75th percentile) conditions, respectively. For each condition, two-dimensional probability density distributions were calculated as a function of CER and LWP. The difference in the two-dimensional probability densities between polluted and clean conditions therefore illustrates how CER varies with aerosol loading under quasi-constant LWP. As shown in Fig. 7, CER is mostly smaller than 15 µm, justifying the effectiveness of the filtering of non-raining cases. Under clean conditions, the CER of warm clouds increases with LWP across all three periods. Under polluted conditions, however, CER initially increases with LWP and then tends to level off during the SWMW and NEMW periods. During the NEMD period, CER exhibits an increase followed by a decrease with increasing LWP, and subsequently remains nearly constant. The difference plots between polluted and clean conditions clearly demonstrate that polluted samples are more concentrated toward smaller CER values compared with clean samples in each quasi-constant LWP bin. This consistent shift toward smaller droplet sizes under higher aerosol loading demonstrates a clear manifestation of the Twomey effect during all three periods.
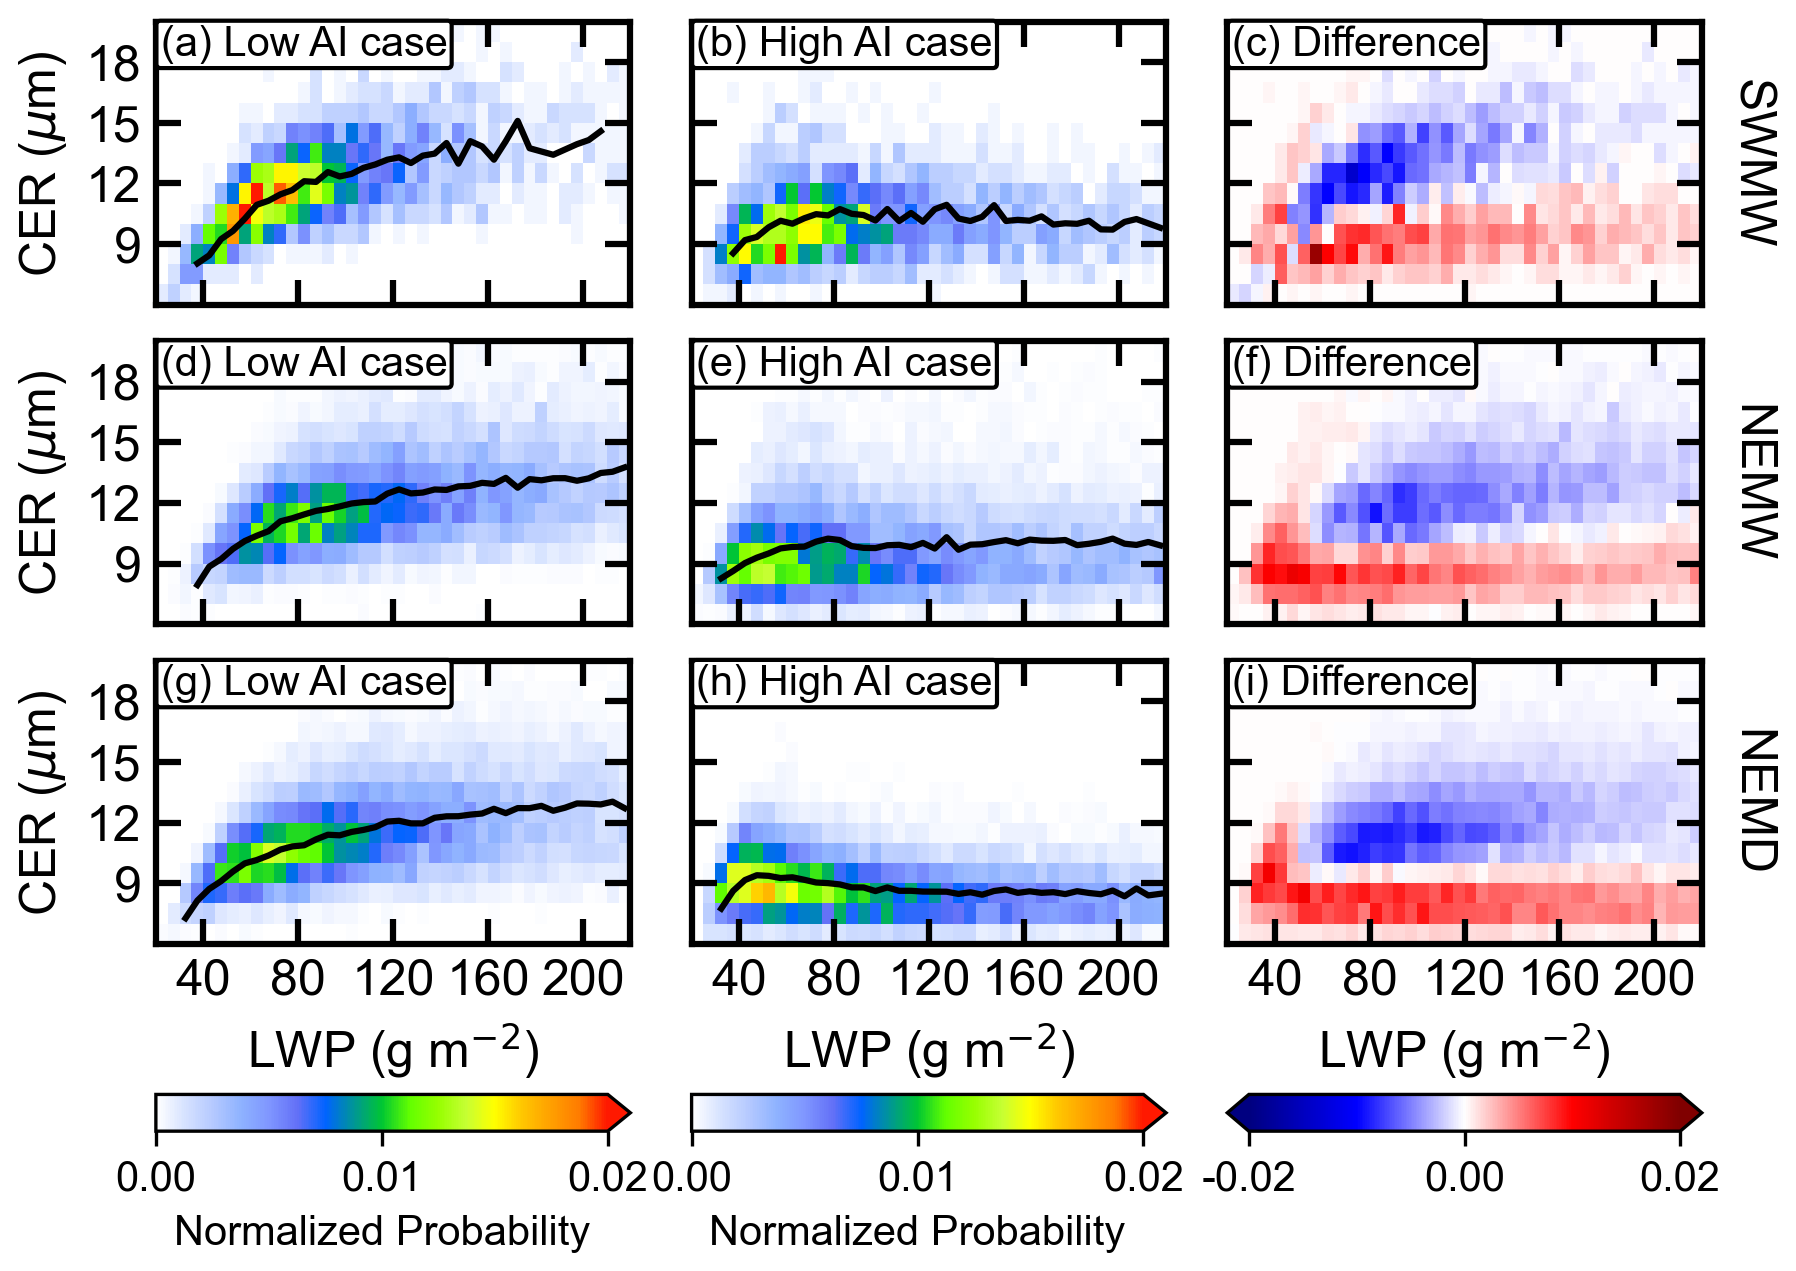
Figure 7Joint probability distributions of liquid water path (LWP) and cloud droplet effective radius (CER) for warm clouds over the South China Sea during the three periods. The first, second, and third rows correspond to the southwest monsoon, the northeast monsoon wet period, and the northeast monsoon dry period, respectively. The first and second columns represent clean and polluted conditions, respectively. The black lines denote the mean CER values within each LWP interval. The third column shows the differences in probability density between polluted and clean conditions.
3.4 Variations of ACI across the Three Periods
As shown in Fig. 6, the warm-cloud fraction during the Southwest Monsoon Wet period is approximately 45 %, while it increases to about 77 % during the Northeast Monsoon Wet period and further to about 80 % during the Northeast Monsoon Dry period. This substantial difference suggests that the warm-cloud populations sampled during different monsoon periods are fundamentally distinct and likely reflect different cloud dynamical regimes. To better distinguish cloud morphological types within each monsoon period and reduce potential regime-mixing effects, we further classified warm clouds over the SCS according to CTP. Specifically, warm clouds were separated into shallow stratocumulus (CTP: 800–950 hPa) and deeper cumulus (CTP: 650–800 hPa) clouds. The ACI index was then quantified separately for these two cloud regimes.
According to the assumption of the Twomey effect (Twomey, 1977), an essential prerequisite for investigating the aerosol indirect effect based on the CER–AI relationship is to keep the LWP constant. Since CER is a function of both LWP and AI, and generally increases with LWP, variations in LWP associated with changes in aerosols can in turn modulate the CER–AI relationship. Therefore, when applying the CER–AI relationship to analyze the first aerosol indirect effect, it is essential to constrain LWP to ensure its constancy. To satisfy this requirement while maintaining sufficient sample sizes, LWP was binned at 10 g m−2 intervals, within which ACIr was examined separately for shallow stratocumulus (Fig. 8a–b) and deeper cumulus clouds (Fig. 8e–f) during the three periods. The results show that for both shallow stratocumulus and deeper cumulus clouds, under both all warm-cloud conditions and non-raining warm-cloud conditions, ACIr is generally weak when LWP < 50 g m−2, and even exhibits the anti-Twomey effect (i.e., an increase in CER with increasing aerosol loading). Clouds in this LWP regime are typically very thin or broken, as well as post-precipitation remnants (McComiskey et al., 2009). A similar phenomenon is observed over the northern Indian Ocean, which may be attributed to the intense competition for available water vapor under high aerosol concentrations, combined with the entrainment of dry air at cloud tops (Jose et al., 2020). When LWP > 50 g m−2, the ACI for all cloud regimes across the three periods are consistent with the Twomey effect. An exception occurs in Fig. 8b and d, where the ACI at LWP = 120 g m−2 during the southwest monsoon is negative. However, this result is not statistically robust due to the limited sample size.
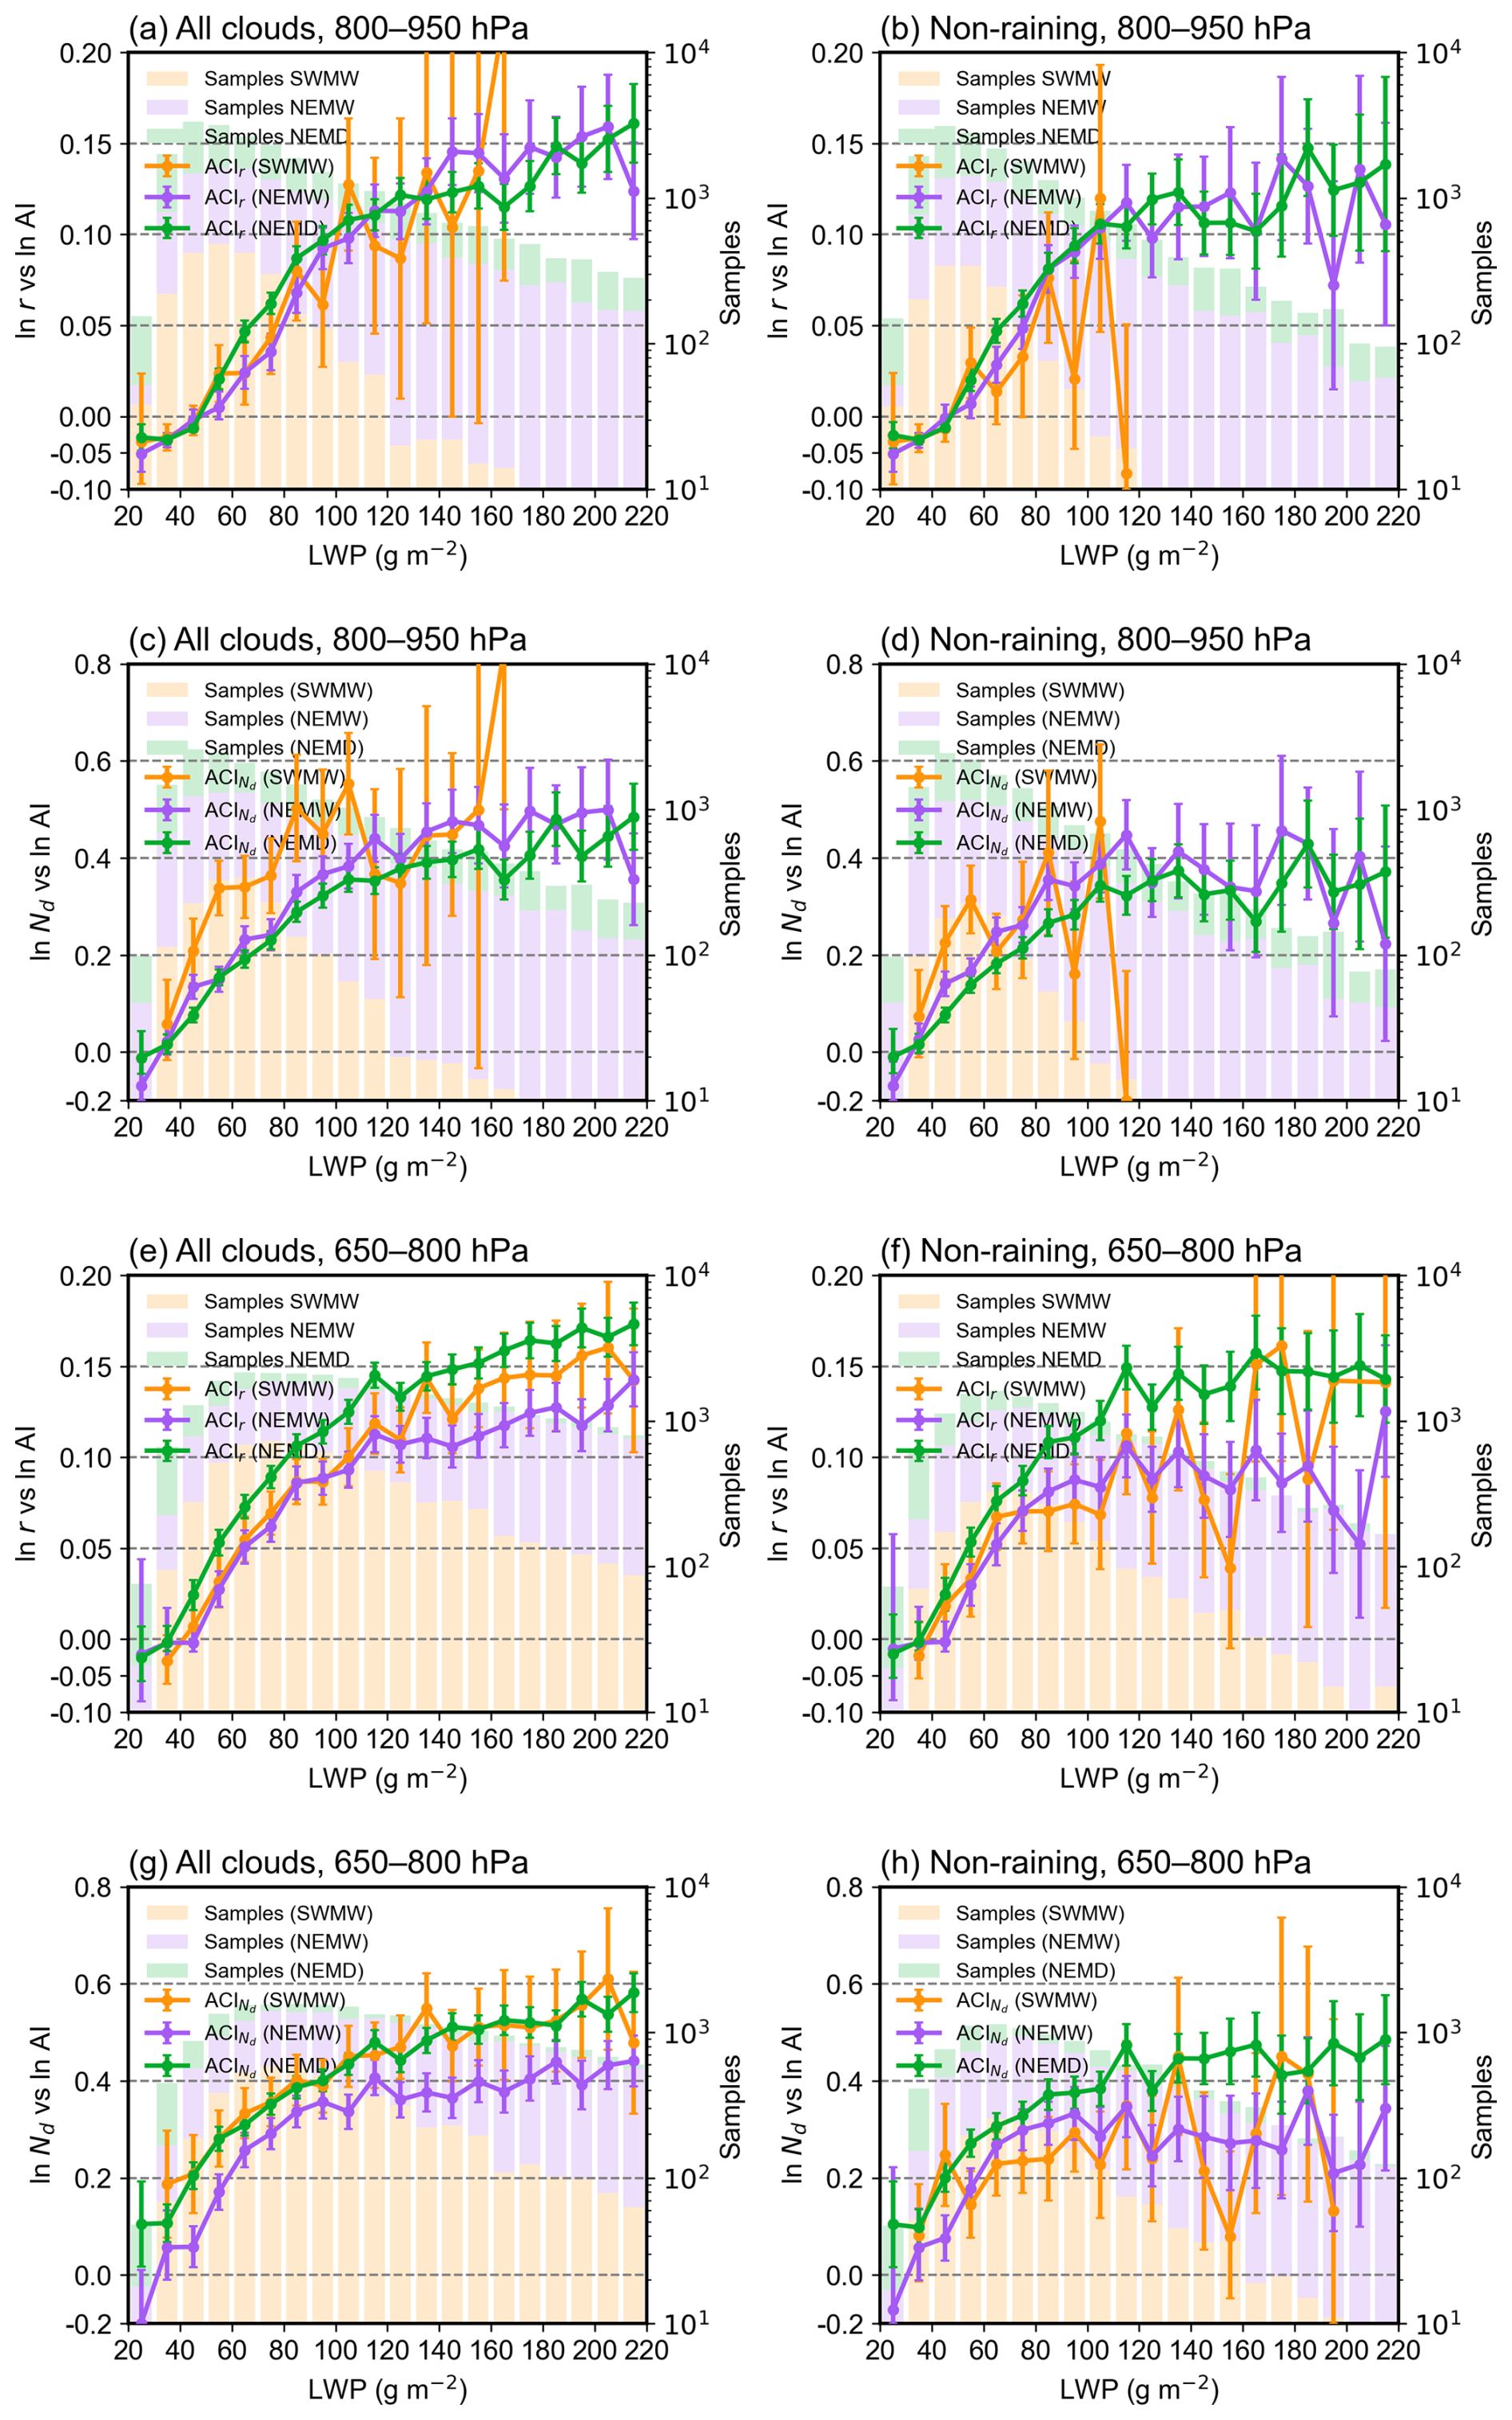
Figure 8Linear regression slopes of ln CER versus ln AI and ln Nd versus ln AI for shallow stratocumulus clouds (CTP = 800–950 hPa; a–d) and deeper cumulus clouds (CTP = 650–800 hPa; e–h) during the three periods. The first and second columns represent all cloud and non-raining cloud conditions, respectively. Green, purple, and yellow lines represent the southwest monsoon, northeast monsoon wet period, and northeast monsoon dry period, respectively. Error bars denote the 95 % confidence intervals of the linear regressions. Colored bars, consistent with the line colors, indicate the total number of samples within each LWP bin for the corresponding periods.
Precipitation formation efficiently reduces cloud droplet number concentration and scavenges aerosols from clouds (Gryspeerdt et al., 2015), introducing a sink of that does not reflect the Twomey effect (Jia et al., 2022). Therefore, when analyzing the aerosol first indirect effect in warm clouds, the influence of precipitation should be separated in order to accurately quantify the sensitivity of CER to aerosols. Figure 8 shows that, for both shallow stratocumulus and deeper cumulus clouds over the SCS, the ACIr values for all warm clouds are consistently larger than those for non-raining warm clouds across all three periods when LWP exceeds approximately 80 g m−2. This indicates that the inclusion of raining samples amplifies ACIr, a phenomenon also identified in the AI/AOD–Nd relationship by Jia et al. (2022) and Painemal et al. (2020). But this amplification is just an artifact governed by the joint impacts of the suppression of precipitation by aerosols and the aerosol removal by precipitation (Jia et al., 2022). Therefore, after removing precipitating clouds from all warm-cloud samples, the ACIr obtained from non-raining warm clouds provides a more realistic representation. Nevertheless, the possibility of undetected light drizzle under high-LWP conditions may introduce additional uncertainty in the derived ACI estimates, despite precipitation screening using IMERG.
Figure 8b shows that, under non-raining warm-cloud conditions with LWP > 50 g m−2, the period-to-period variations in ACIr differ between shallow stratocumulus and deeper cumulus clouds over the SCS. For shallow stratocumulus, ACIr values are broadly comparable across the three periods, with no significant differences (Fig. 8b). In contrast, deeper cumulus clouds exhibit clear differences among the three periods (Fig. 8f), with ACIr generally strongest during the NEMD period, while the NEMW and SWMW periods show comparatively weaker values, with the NEMW period exceeding the SWMW period in some LWP bins. For LWP > 140 g m−2, the ACIr during the southwest monsoon exhibits large fluctuations due to the limited number of samples, even exceeding that of the northeast monsoon. The analysis in Sect. 3.2 reveals substantial differences in atmospheric conditions over the SCS among the three periods. During the SWMW period, atmospheric moisture and sea surface temperatures reach their highest levels, and upward motion dominates over the region, while aerosol concentrations remain relatively low. During the NEMW period, moisture and sea surface temperatures are still relatively high, with upward motion primarily confined to the southern areas near the equator, and aerosol concentrations are elevated due to pollution transported from continental China. In contrast, during the NEMD period, atmospheric moisture and sea surface temperatures are at their lowest, subsidence dominates, and aerosol concentrations reach their maximum. These results suggest that although the large-scale environmental statistics differ substantially among the three monsoon periods, the local thermodynamic conditions favorable for shallow stratocumulus formation may be relatively similar across periods. Such cloud-favorable environments may not be fully resolved by the period-mean large-scale statistics presented here, which could explain the broadly comparable ACIr values for shallow stratocumulus. In contrast, ACIr for deeper cumulus clouds over the SCS generally tends to strengthen under drier and more stable monsoon environments, with the strongest signals occurring during the NEMD period, while no consistent ordering is observed between the NEMW and SWMW periods across different LWP bins. Accordingly, the subsequent analysis focuses on the period-to-period differences of deeper cumulus clouds ACI and its relationship with variations in the monsoon environmental background.
In addition to the radius-based ACIr, we further examined the droplet-number susceptibility (ACI) separately for shallow stratocumulus (Fig. 8c–d) and deeper cumulus clouds (Fig. 8g–h). Consistent with the ACIr results, ACI for shallow stratocumulus remains broadly comparable across the three monsoon periods, with no significant differences. Deeper cumulus clouds exhibit clear period-to-period variations, with the strongest signals occurring during the NEMD period, while comparatively weaker values are observed during the SWMW and NEMW periods. The consistency between ACIr and ACI suggests that the inferred ACI variations are robust to the choice of metric. However, because the two metrics are not independent, their agreement should be interpreted primarily as a consistency check rather than as independent evidence for the underlying physical mechanisms. Nevertheless, the similar inter-period variations exhibited by both metrics motivate a further examination of the environmental factors associated with these ACI differences. Therefore, Sect. 3.5 explores the potential influences of moisture and LTS on deeper cumulus cloud ACI across the three periods.
3.5 Causes of ACI Variations across the Three Periods
The progressive enhancement of ACIr and ACI for deeper cumulus clouds from the SWMW to the NEMD period (Fig. 8) may potentially be influenced by the aerosol hygroscopic swelling artifact. The MERRA-2 AOD used to construct AI is calculated under ambient RH, with the extinction coefficients of sulfate, hydrophilic carbonaceous aerosols, and sea salt explicitly parameterized as functions of RH (Randles et al., 2017). Under humid conditions, aerosol hygroscopic growth can increase AOD, and therefore AI, without a corresponding increase in CCN-active particle number. This may artificially flatten the CER–AI and Nd–AI regression slopes, leading to apparently weaker ACI under moister conditions. Given that the SWMW and NEMW periods are characterized by substantially higher moisture levels than the NEMD period, the weaker ACI observed during these moister periods could partly reflect this hygroscopic swelling artifact rather than intrinsic differences in cloud microphysical sensitivity.
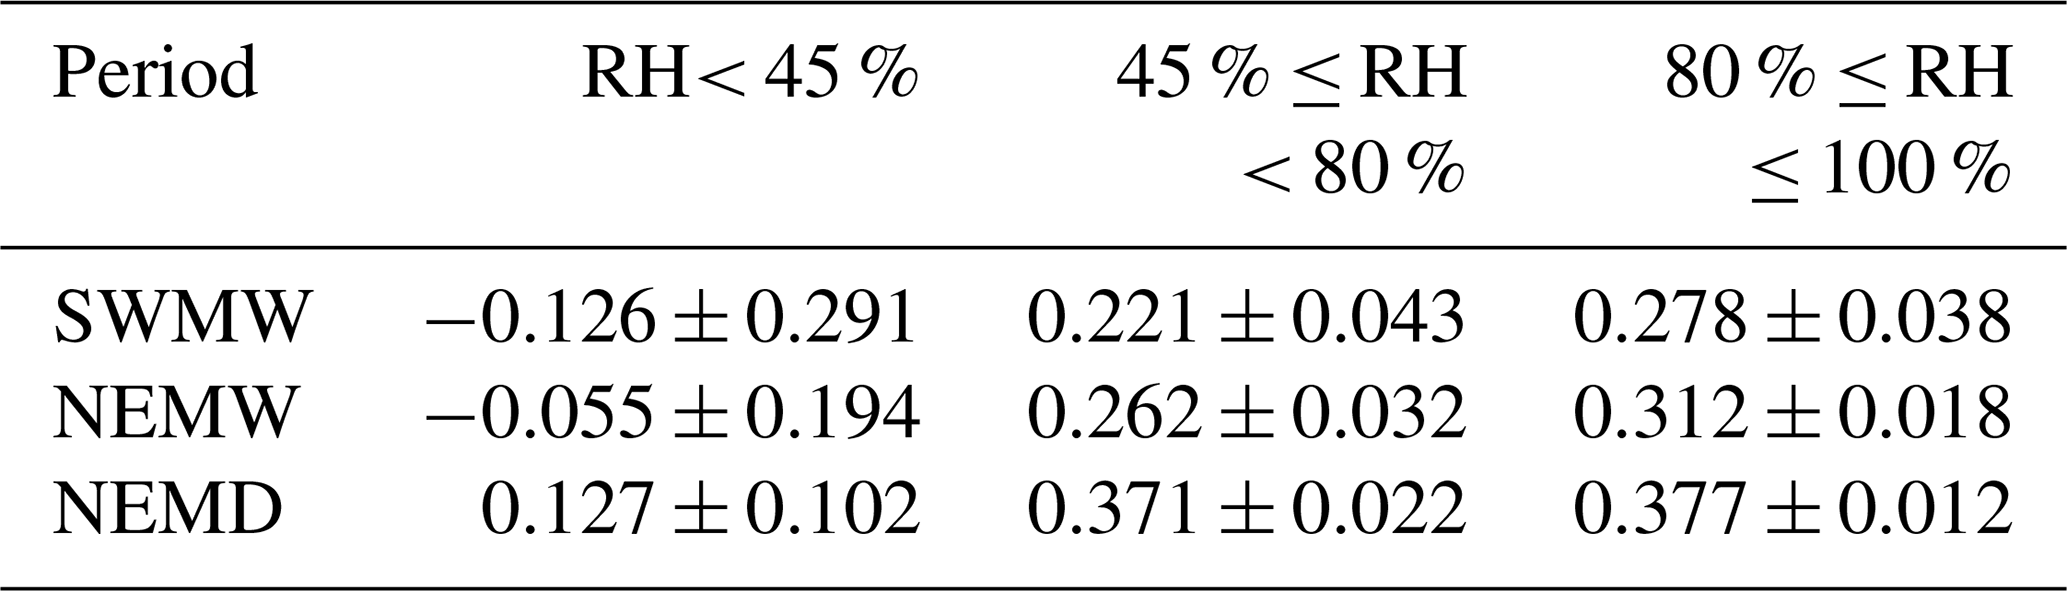
To assess whether the observed period-to-period differences are substantially affected by systematic humidity differences, we further stratified the data from each monsoon period into three RH ranges (0 %–45 %, 45 %–80 %, and 80 %–100 %). Under constrained LWP (50–200 g m−2) and cloud-top pressure (650–800 hPa) conditions, ACI was recalculated separately for each subsample. The RH used in this study is from ERA5 at 950 hPa at 06:00 UTC, representing the ambient environmental humidity within the marine atmospheric boundary layer. Previous studies show that aerosols are predominantly confined below ∼ 3 km in the marine atmosphere over the SCS (Li et al., 2020; Su et al., 2022), with a peak in extinction occurring at approximately ∼ 480 m (Su et al., 2022). Therefore, the 950 hPa RH is adopted as a representative proxy for the ambient humidity governing aerosol hygroscopic growth.
As shown in Table 2, the enhancement from SWMW to NEMW and further to NEMD is evident in the moderate and high RH bins (45 %–80 % and 80 %–100 %), whereas the low RH bin (0 %–45 %) does not exhibit statistically robust differences among the three periods. These results suggest that although AI may be affected by hygroscopic swelling under humid environments, this effect is insufficient to explain the systematic ACI differences among the three monsoon periods. Therefore, aerosol hygroscopic swelling is unlikely to be the dominant cause of the observed period-to-period variability, motivating further examination of the thermodynamic and moisture controls on ACI.
Table 2ACI ± 95 % CI of deeper cumulus clouds under different relative humidity bins during the three periods.
To provide an integrated view of how the ACI of deeper cumulus clouds co-varies with the thermodynamic and moisture background across the three periods, Fig. 9 shows the ACI together with the corresponding q and LTS. Both ACI and the key environmental regulators display a coherent evolution across the three periods. From the SWMW to the NEMW and NEMD, ACI intensifies steadily, in parallel with declining moisture and increasing LTS. Quantitatively, the ACI increases progressively from 0.250 ± 0.027 (95 % confidence interval, 95 % CI) during the SWMW period to 0.286 ± 0.016 during NEMW and further to 0.399 ± 0.029 during NEMD. Meanwhile, q decreases from 12.111 ± 0.540 g kg−1 during SWMW to 11.072 ± 0.931 g kg−1 during NEMW and 9.540 ± 1.120 g kg−1 during NEMD, while the LTS increases from 13.341 ± 0.358 to 14.565 ± 0.875 and 15.343 ± 0.977 K, respectively. (All q and LTS uncertainties represent one standard deviation, SD) These co-varying changes indicate that both q and LTS may regulate the strengthening of ACI across the three periods over the SCS. In the following subsections, we separately examine the roles of q (Sect. 3.5.1) and LTS (Sect. 3.5.2) in regulating ACI.
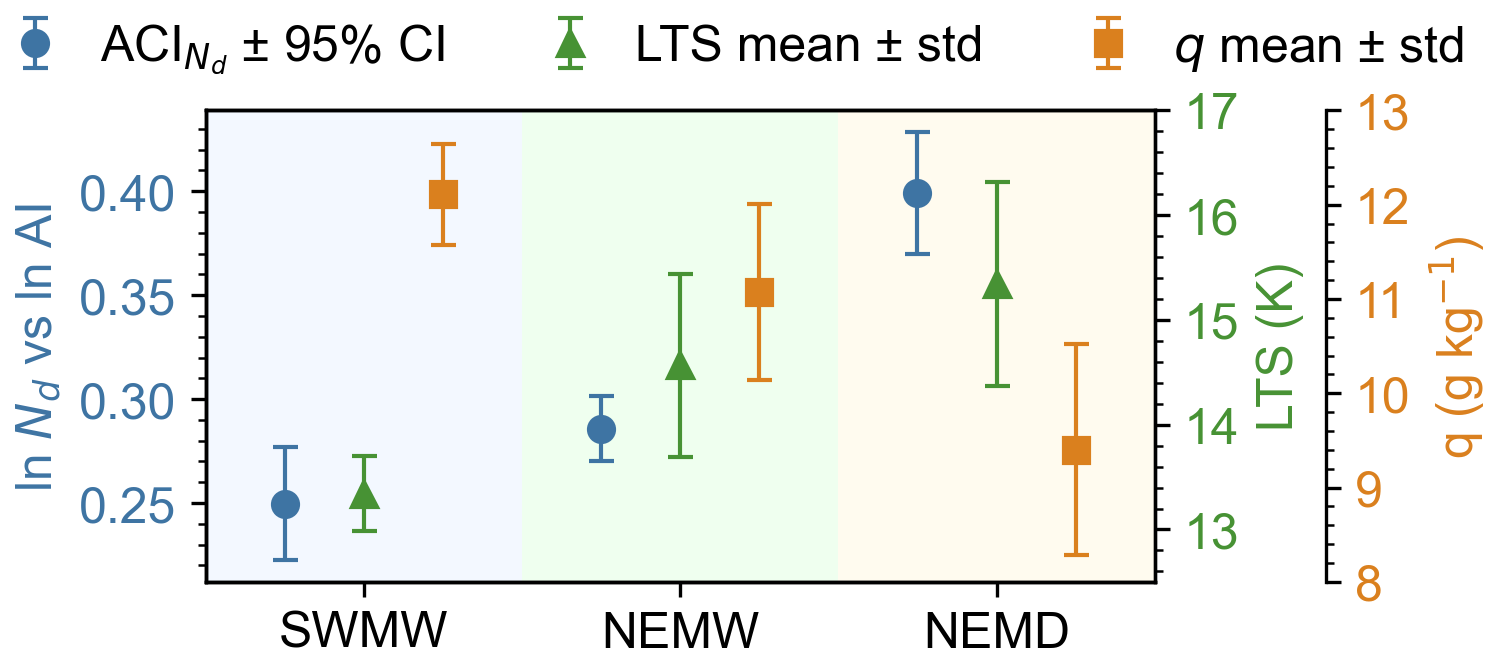
Figure 9ACI, specific humidity (q), and lower-tropospheric stability (LTS) for the three periods over the South China Sea. The 95 % confidence interval (CI) represents the uncertainty derived from the Student's t test, whereas SD denotes the one standard deviation.
3.5.1 Water vapor
Water vapor supply substantially impacts CCN activation, droplet condensational growth, and coalescence, hence altering the cloud droplet size distribution (Feingold et al., 2006; Zheng et al., 2022). Specific humidity at 1000 hPa serves as a proxy for the ambient water vapor available to warm clouds, analogous to the use of near-surface specific humidity as a proxy for marine boundary layer moisture in previous studies (Dadashazar et al., 2020). To investigate the influence of water vapor on ACI in deeper cumulus clouds, specific humidity was averaged within each AI-CER/Nd interval separately for each period (Fig. 10). For each AI interval, CER/Nd was further averaged, and samples were stratified by the 25th and 75th percentiles of specific humidity to represent dry (< 25th percentile) and moist (> 75th percentile) conditions, under which the corresponding mean CER/Nd was calculated. In addition, ACI was derived from all samples and separately for the dry and moist subsets in each period. To satisfy the LWP constraint required for the CER–AI analysis, the influence of water vapor on ACI was examined within LWP intervals of 50–100, 100–150, and 150–200 g m−2. In addition, because the Nd–AI relationship does not require an explicit LWP constraint for ACI calculation, it was examined over the broader LWP range of 50–200 g m−2.
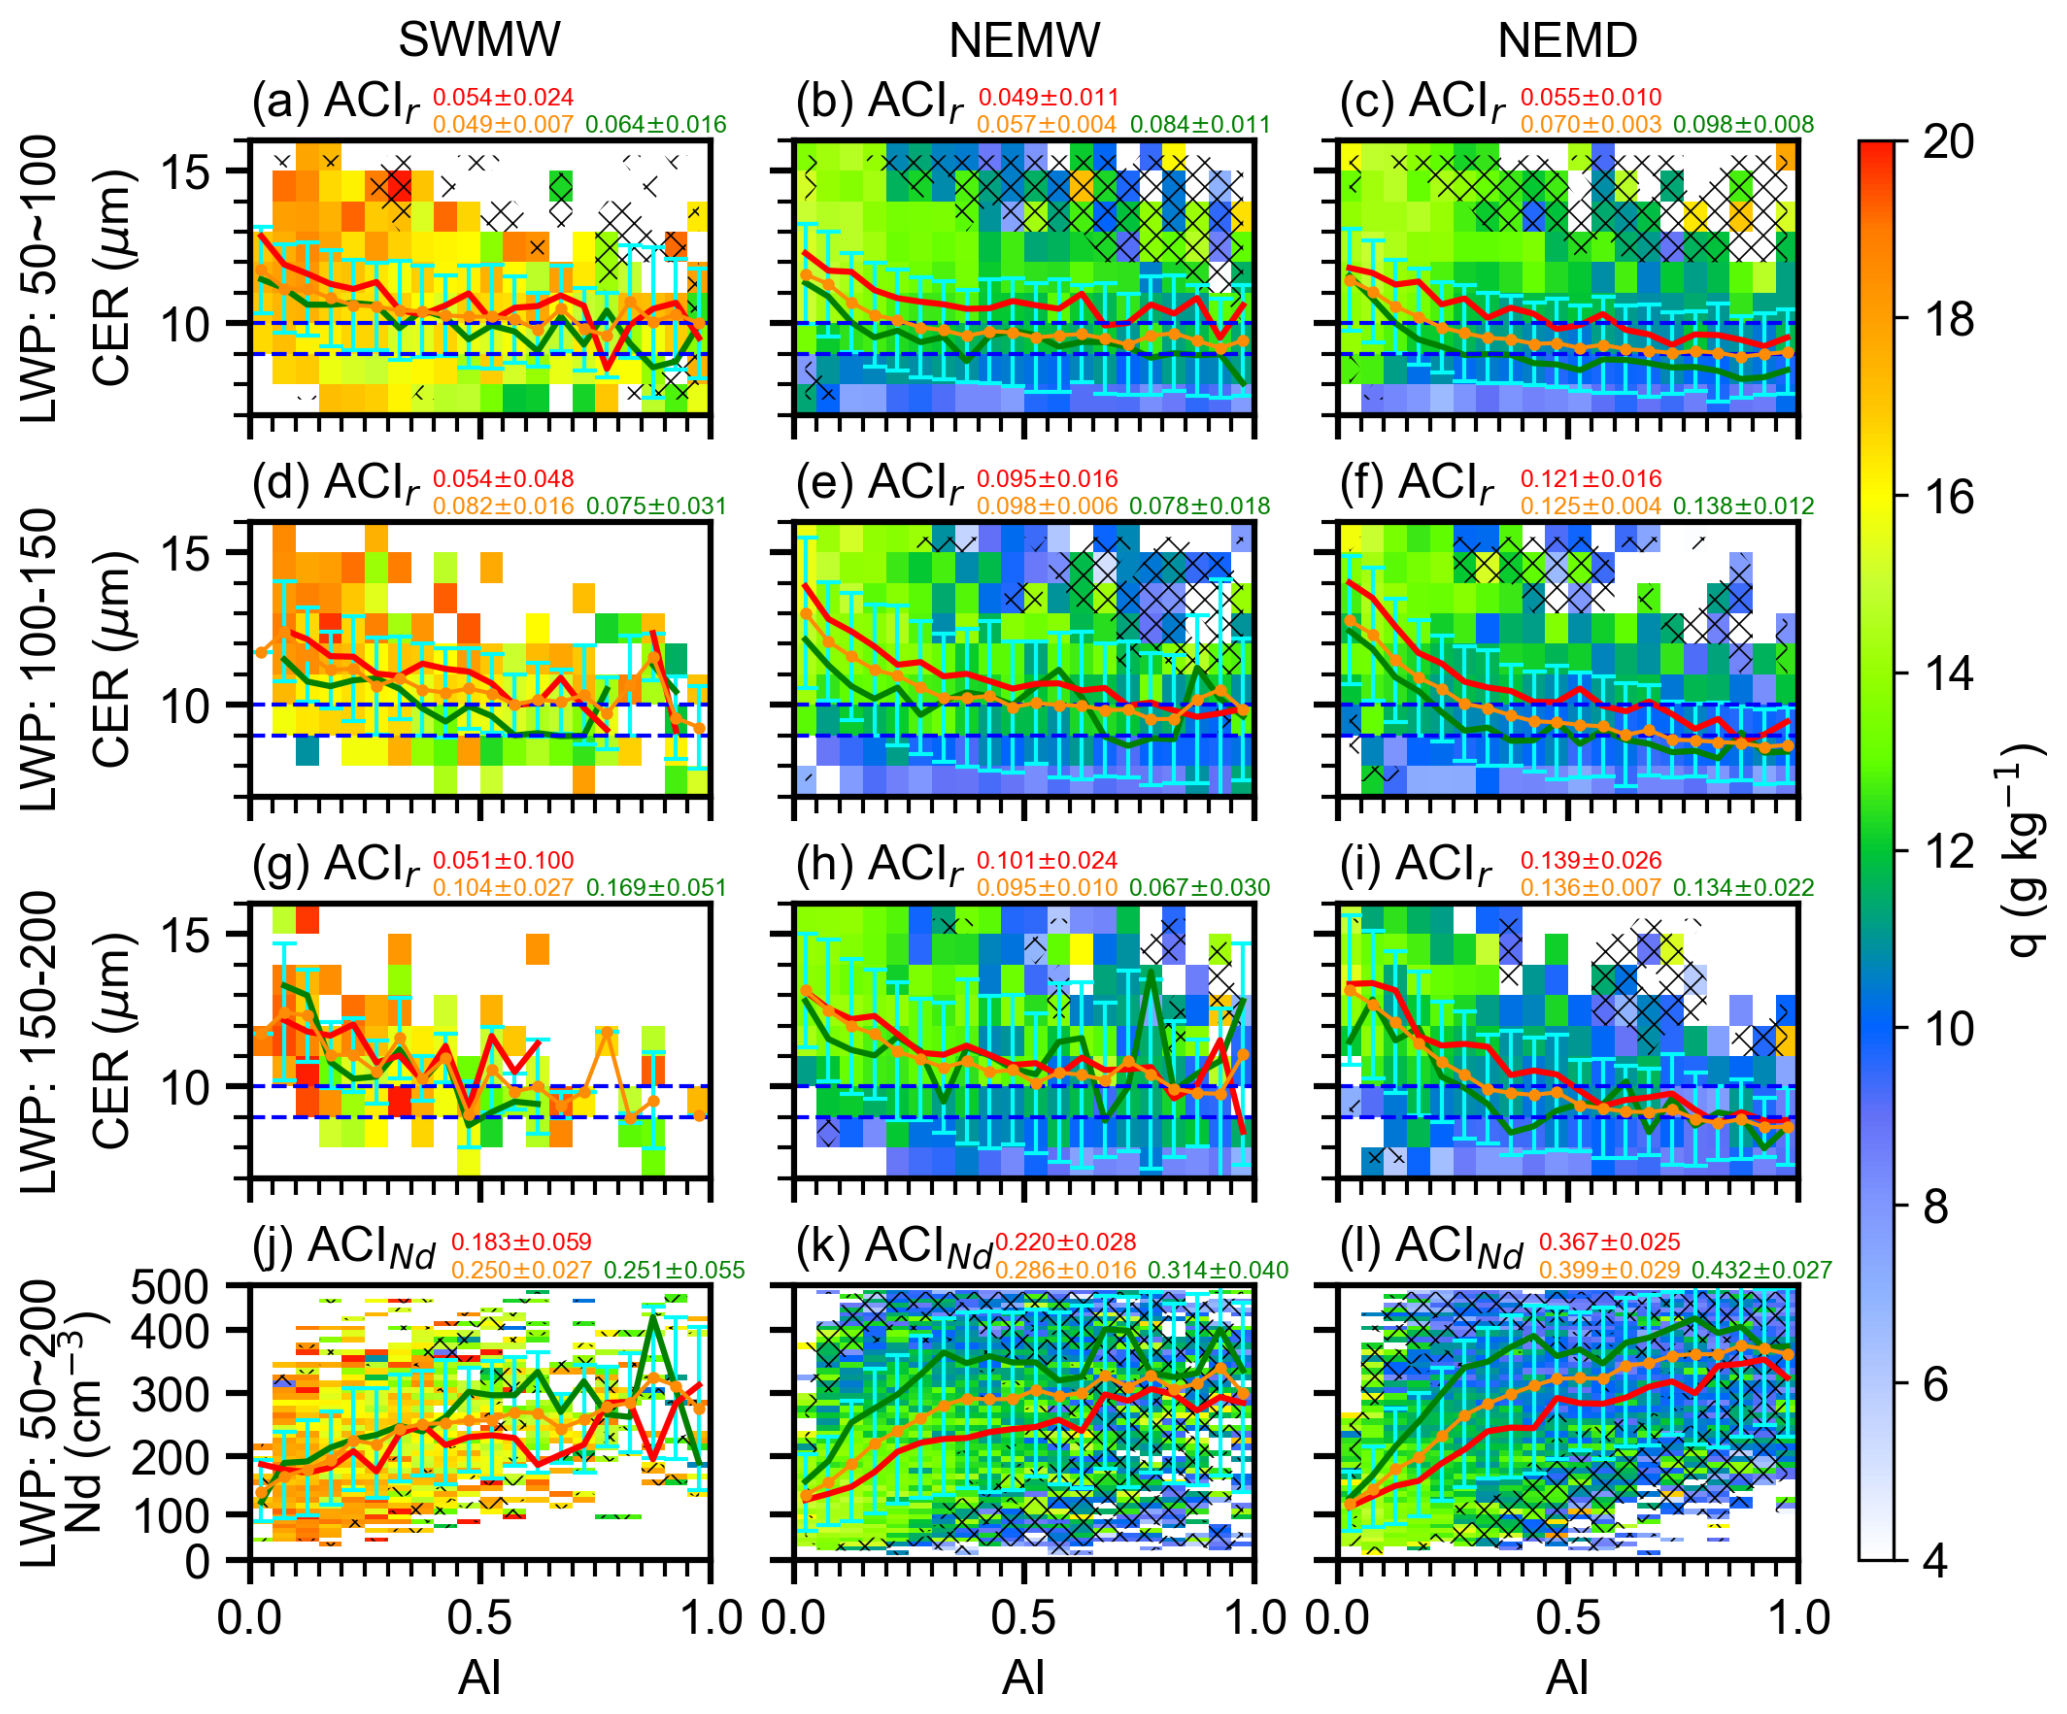
Figure 10Influence of water vapor on ACI in deeper cumulus clouds (CTP: 650–800 hPa) across the three periods. Rows 1–3 show mean specific humidity in CER–AI bins for LWP ranges of 50–100, 100–150, and 150–200 g m−2, respectively; row 4 shows mean specific humidity in Nd-AI bins for LWP 50–200 g m−2. Columns correspond to the southwest monsoon, northeast monsoon wet period, and northeast monsoon dry period. Yellow dashed, red, and green lines denote the mean CER (rows 1–3) or Nd (row 4) in each AI bin for all samples, for moist conditions (specific humidity > 75th percentile), and for dry conditions (specific humidity < 25th percentile), respectively. Error bars indicate the standard deviation of CER (rows 1–3) or Nd (row 4) within each AI bin. Yellow numbers indicate ACI ±95 % uncertainty estimates (according to a Student's t test) for all samples, whereas red and green numbers indicate the corresponding estimates under moist and dry conditions, respectively.
As shown in Fig. 10, higher specific humidity conditions are generally associated with larger CER and lower Nd across the three periods over the SCS. This may suggest that abundant water vapor enhances condensational growth of cloud droplets, and the enlarged droplets are more susceptible to collision-coalescence, which not only reduces Nd but also further increases the CER. By contrast, under limited water vapor availability, the ability of CCN-activated droplets to grow by condensation is substantially constrained. The lack of a sufficient number of larger droplets favors condensation as the predominant growth mechanism, thereby yielding smaller droplet sizes (Zheng et al., 2022).
The response of ACI to environmental water availability exhibits different behaviors. Qiu et al. (2017) analyzed the AI-CER relationship for non-raining warm clouds over the Southern Great Plains and found the anti-Twomey effect under moist conditions. Zheng et al. (2022) investigated non-raining warm clouds over the Eastern North Atlantic and found that sufficient water vapor availability can enhance ACI. Over the SCS, within the LWP range of 50–200 g m−2, ACI is consistently smaller under moist conditions than under dry conditions across all three periods (Fig. 10j–l), suggesting that Nd exhibits weaker sensitivity to aerosol perturbations in moist environments compared to dry environments. Figure 10j–l show that Nd exhibits comparable values between moist and dry conditions at very low aerosol loading. As aerosol concentration increases, however, Nd becomes smaller under moist conditions relative to dry conditions. This pattern may indicate that under ample water vapor availability, increased aerosol loading initially enhances cloud droplet activation, leading to elevated droplet number concentrations. But subsequent collision-coalescence promotes droplet growth while reducing Nd. Consequently, the microphysical adjustments associated with enhanced moisture availability dampen the sensitivity of Nd to aerosol perturbations, manifesting as weaker ACI in the moist regime.
In contrast, the response of ACIr to moisture exhibits a dependence on LWP. At low LWP (50–100 g m−2), ACIr is reduced under moist relative to dry conditions across all periods (Fig. 10a–c). At higher LWP ranges, this reduction appears only in the Southwest Monsoon period within the 100–150 and 150–200 g m−2 bins, and in the Northeast Monsoon Dry period within the 100–150 g m−2 bin (Fig. 10g), while the opposite response is observed in other cases. The LWP is defined as the column-integrated liquid water content within clouds (e.g., existing cloud droplets) (Lee and Penner, 2011). At low LWP, ACIr is weaker under moist conditions (as indicated by 1000 hPa specific humidity) compared to dry conditions (Fig. 10a–c). A possible explanation is that in moist environments, enhanced collision-coalescence processes promote droplet growth, leading to larger CER. In contrast, under drier conditions, limited water vapor availability inhibits droplet growth, resulting in smaller CER. At higher LWP, when the in-cloud liquid water content is abundant, the response of ACIr to environmental water vapor variations becomes less consistent (Fig. 10d–i), suggesting the involvement of additional microphysical or dynamical processes.
Over the SCS, CER and Nd exhibit comparable values across the three periods within the same LWP interval at low AI. As AI increases, noticeable differences develop, with CER decreasing progressively from the SW to the NEMW and further to the NEMD, while Nd increases accordingly (Fig. 10). Consequently, ACI is enhanced stepwise from SW to NEMW and then to NEMD. This stepwise enhancement may be partly attributed to the progressive decrease in environmental water vapor from SW to NEMW and further to NEMD (Fig. 4a–c), particularly evident within the LWP interval of 50–100 g m−2.
3.5.2 Lower Tropospheric Stability
Thermodynamic and dynamic conditions are key factors influencing aerosol vertical transport, aerosol activation processes, and cloud droplet formation. Thermodynamic stability can be quantitatively represented by the lower tropospheric stability (LTS), a measure of temperature inversion strength initially defined for marine stratocumulus clouds (Klein and Hartmann, 1993). This metric has been widely utilized to evaluate atmospheric stability and vertical mixing across both oceanic and continental regions (Jia et al., 2019; Ma et al., 2018b). Higher LTS values represent enhanced lower tropospheric stability, which suppresses vertical mixing and convective initiation. To further examine the influence of thermodynamic conditions on ACI in deeper cumulus clouds, the LTS was analyzed in a manner identical to that used for specific humidity. For each period, samples were stratified by the 25th and 75th percentiles of LTS to represent unstable and stable conditions, respectively, and ACI was computed for each subset (Fig. 11). The analysis was performed within LWP intervals of 50–100, 100–150, and 150–200 g m−2 for the CER–AI relationship, and over 50–200 g m−2 for the Nd-AI relationship. Figure 11 shows that stronger lower tropospheric stability (higher LTS) is associated with smaller CER and higher Nd, as enhanced static stability may suppress convective mixing and vertical moisture transport, thereby limiting droplet growth while favoring higher droplet concentrations.
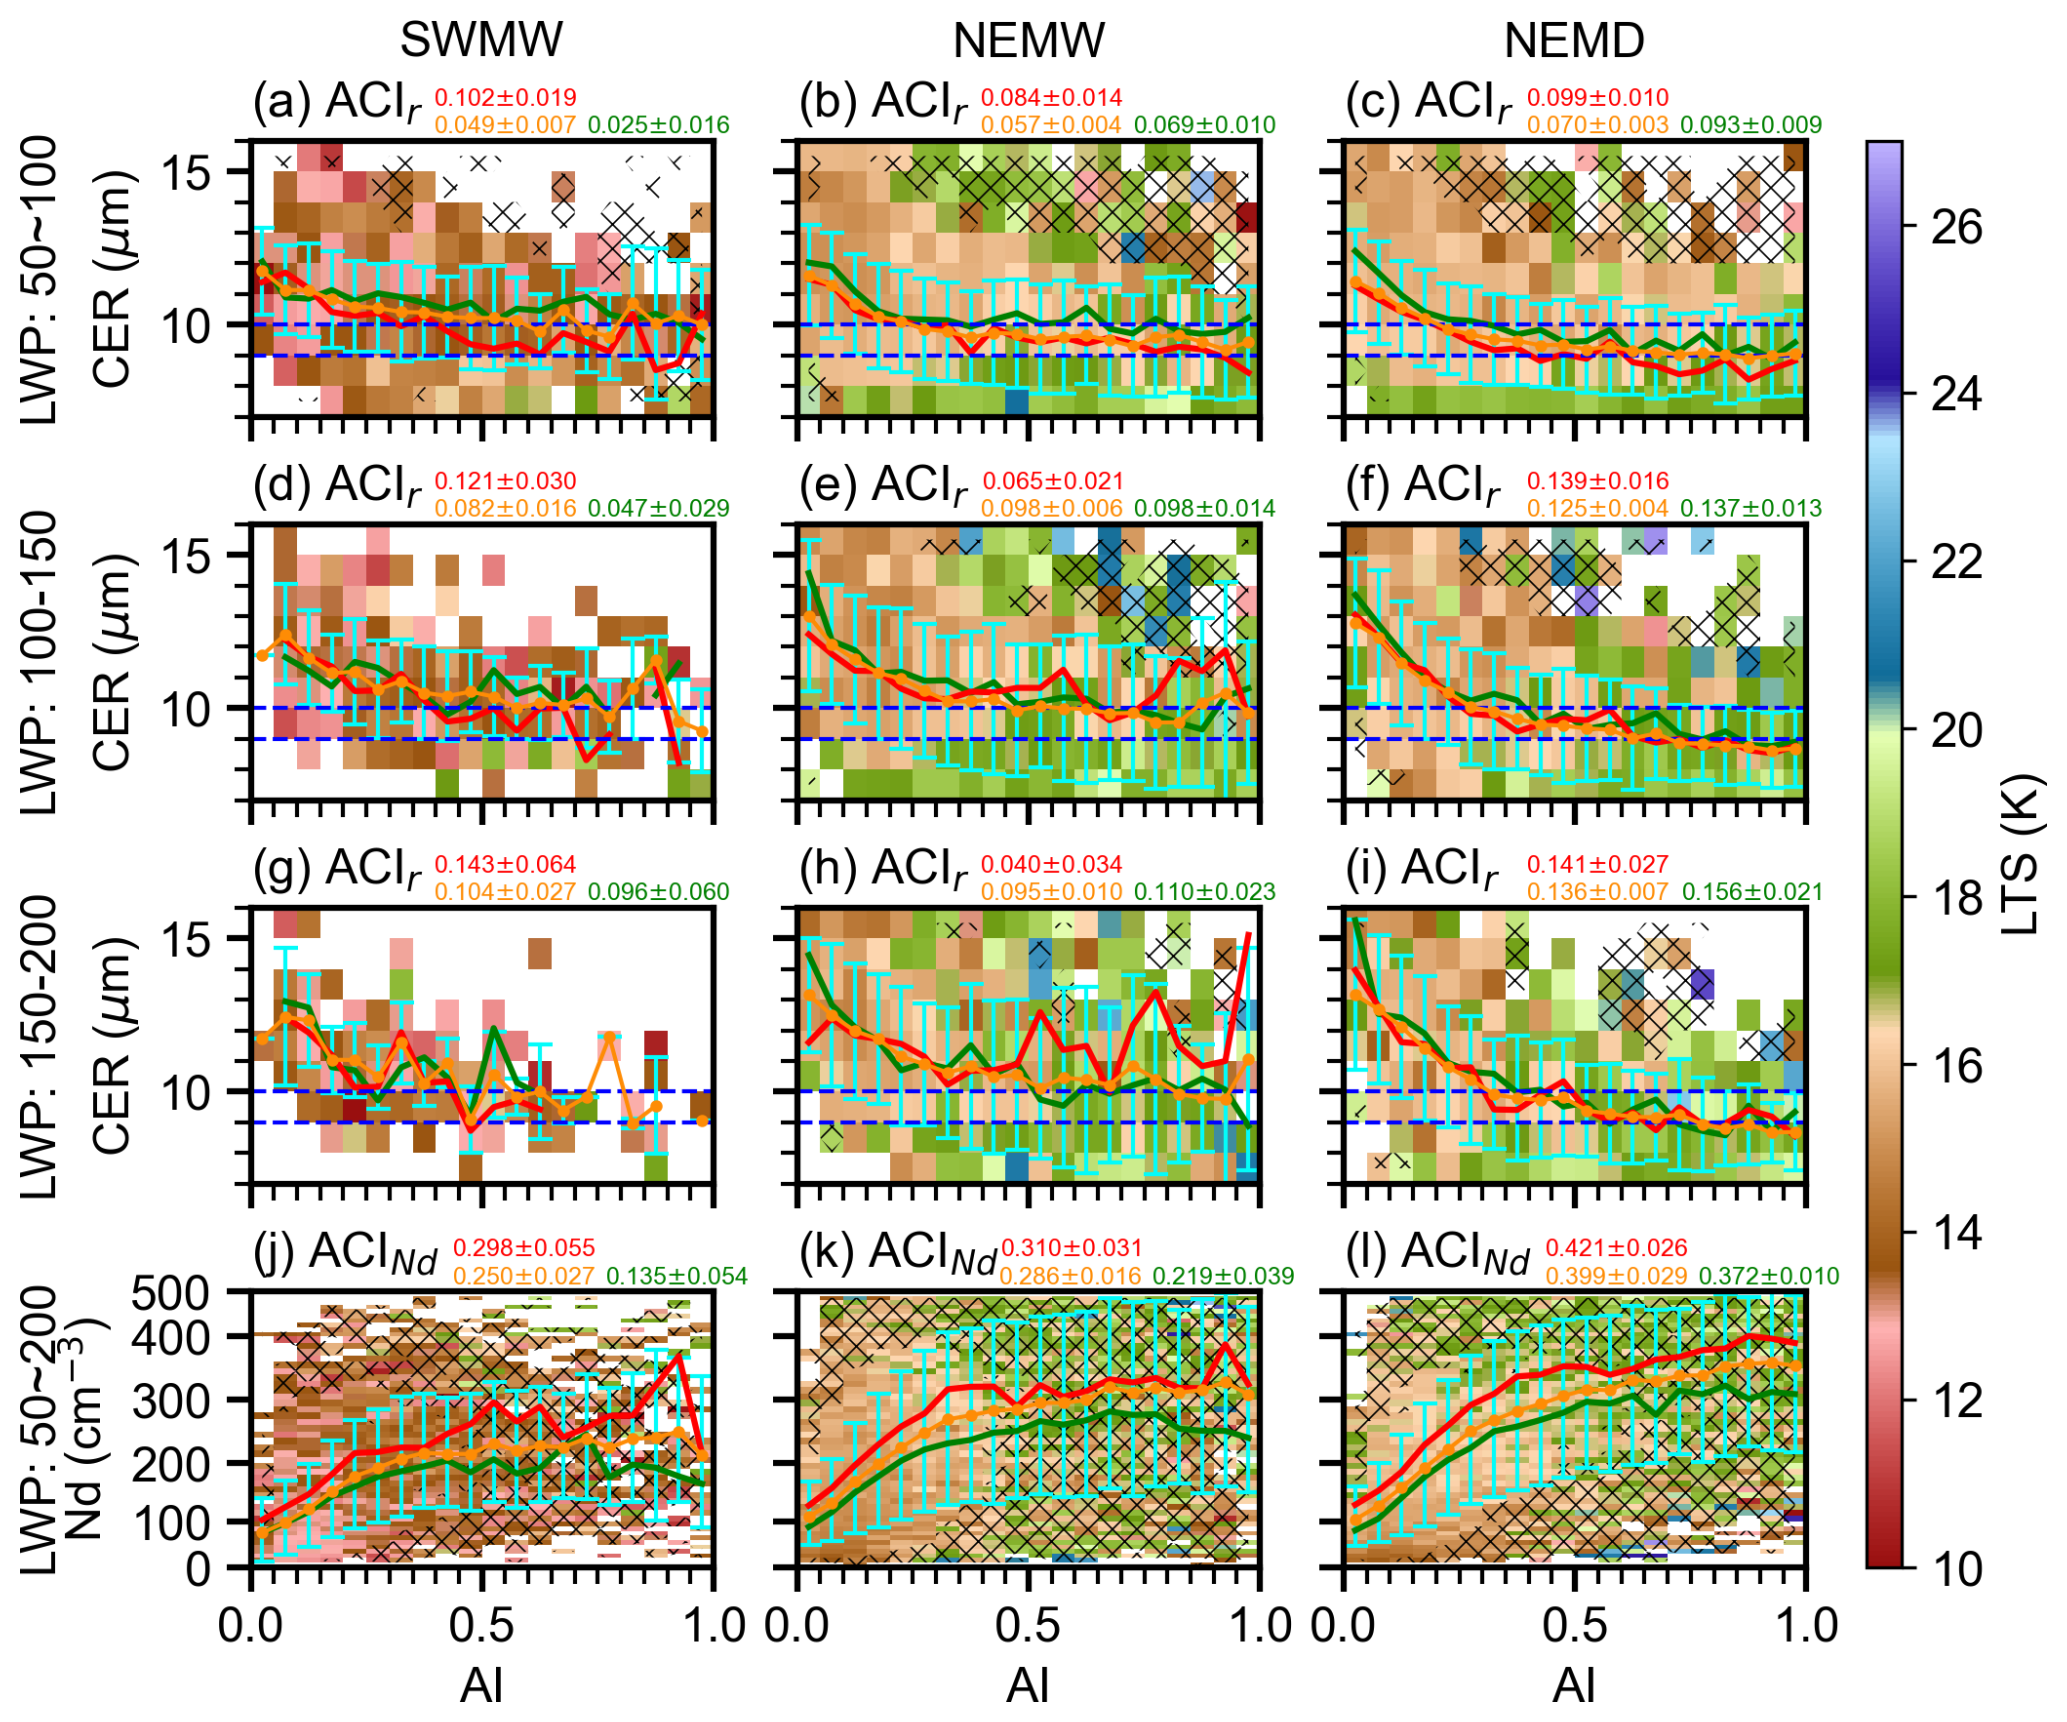
Figure 11Same as Fig. 10, but for lower tropospheric stability. Stable and unstable conditions correspond to the upper (> 75th percentile) and lower (< 25th percentile) quartiles of LTS, respectively. Yellow numbers indicate ACI ±95 % uncertainty estimates (according to a Student's t test) for all samples, whereas red and green numbers indicate the corresponding estimates under stable and unstable conditions, respectively.
In contrast to unstable conditions, stronger ACI is observed under stable conditions characterized by higher LTS values (Fig. 11j–l). This suggests that enhanced LTS may be associated with environmental conditions that influence ACI. Under more stable stratification, reduced vertical mixing may help maintain higher aerosol concentrations and moisture within the boundary layer, which may in turn influence cloud droplet activation and cloud microphysical properties. As a result, higher ACI is observed under stable conditions compared to unstable environments. Over the SCS, LTS is generally weaker during the southwest monsoon than during the northeast monsoon (Fig. 11), which may partly contribute to the observed inter-monsoon differences in ACI. However, given the complexity of concurrent variations in moisture, aerosol loading, and cloud regimes, the specific role of LTS in modulating ACI cannot be isolated.
The response of ACIr to LTS exhibits distinct behaviors across different LWP intervals and periods (Fig. 11a–i). During the southwest monsoon period, ACIr is consistently larger under stable conditions than under unstable conditions across all three LWP ranges, consistent with the ACI results. However, during the northeast monsoon wet period, this enhancement is only evident in the lowest LWP range (50–100 g m−2). In the northeast monsoon dry period, the enhancement under stable conditions is observed in both the 50–100 and 100–150 g m−2 bins. This contrasting behavior (Fig. 11e, h, i) can be further understood from the AI-CER relationships. At low AI values, corresponding to relatively clean conditions, CER is larger under unstable conditions than under stable conditions. As AI increases, indicating more polluted environments, CER under stable and unstable conditions gradually converges, leading to stronger ACIr under unstable conditions. This pattern may indicate that during the northeast monsoon period, when in-cloud water vapor is abundant and aerosol loading is relatively high, cloud microphysical processes become less sensitive to variations in LTS. The inherently strong and weakly variable lower-tropospheric stability during the northeast monsoon may suppress the dynamical influence of further LTS changes on ACI, thereby weakening the LTS dependence of ACIr under moist and polluted conditions.
To investigate how ACI vary under the alternating influence of two opposing monsoon systems over the South China Sea (SCS) and how different environmental conditions modulate these interactions, the study period was divided into three representative phases based on variations in wind direction, precipitation, and specific humidity: the southwest monsoon wet period (SWMW), the northeast monsoon wet period (NEMW), and the northeast monsoon dry period (NEMD). Satellite observations and reanalysis data were used to quantify ACI variability and its environmental controls across different thermodynamic and moisture conditions.
Distinct environmental regimes characterize the three monsoon phases. SWMW is dominated by strong ascent, high SST, and abundant moisture. NEMW features enhanced continental aerosol transport, reduced SST, and increased LTS. NEMD is the driest and most stable regime, with widespread subsidence and favorable conditions for boundary-layer aerosol accumulation.
A pronounced Twomey effect was consistently identified across all three periods, as indicated by smaller CER and higher Nd with increasing aerosol loading under nearly constant LWP. Quantitative estimates of ACIr show that the Twomey effect dominates when LWP ranges from 50 to 200 g m−2, whereas an apparent “anti-Twomey” behavior appears in optically thin clouds (LWP < 50 g m−2), likely associated with strong competition for limited water vapor and entrainment-induced drying. Precipitation tends to amplify the ACI by simultaneously suppressing cloud droplet number concentrations and removing aerosols from the atmosphere. After removing raining samples, the ACI derived from non-raining warm clouds provides a more reliable representation of the first aerosol indirect effect, reducing biases caused by precipitation processes, although some uncertainty may remain due to undetected light precipitation under high-LWP conditions. Across the three periods, shallow stratocumulus clouds (CTP: 800–950 hPa) show limited variability in ACI, while deeper cumulus clouds (CTP: 650–800 hPa) exhibit the strongest ACI during NEMD. In contrast, no clear separation is observed between the SWMW and NEMW periods.
The inter-monsoon differences in deeper cumulus cloud ACI are primarily governed by coupled variations in moisture, atmospheric stability, and aerosol conditions rather than the monsoon phase itself. Stronger ACI in NEMD is consistent with drier and more stable conditions that favor aerosol accumulation, suggesting a possible role of aerosol accumulation in increasing aerosol availability for cloud activation, which may in turn contribute to stronger ACI. In contrast, moist and convectively active environments during SWMW and NEMW likely weaken ACI through enhanced condensational and coalescence growth processes. These results highlight the key role of environmental modulation in shaping the expression of the Twomey effect in marine warm clouds over the SCS.
Uncertainties arise from the use of AI as a proxy for CCN, which does not fully capture coarse-mode sea-salt aerosols, potential biases associated with aerosol hygroscopic growth, and assumptions in Nd retrieval (e.g., constant sub-adiabatic factor). Cloud selection criteria may preferentially retain more homogeneous scenes, potentially underrepresenting broken cumulus clouds, and may be less reliable for deeper trade cumulus and congestus clouds that dominate the 650–800 hPa CTP regime highlighted in this study. Undetected light precipitation may also affect ACI estimates, especially at high LWP. In addition, the present analysis cannot fully disentangle the respective influences of water vapor, thermodynamic stability, cloud regime, and aerosol type and loading, as these factors co-vary systematically with the monsoon phase, which limits attribution of the observed inter-period ACI differences to any single controlling mechanism.
Despite these uncertainties, the results show that deeper cumulus cloud ACI over the SCS are strongly regulated by coupled variations in moisture, stability, and aerosol conditions associated with monsoon transitions. Monsoon phases act not as direct physical drivers but as an organizing framework for environmental variability that shapes cloud microphysical responses. Future work will focus on reducing observational and retrieval uncertainties to improve the quantification of ACI across different monsoon regimes. These findings provide important observational evidence for understanding ACI and offer valuable guidance for improving the representation of ACI in climate and numerical weather prediction models.
Atmospheric fields were obtained from the ERA5 reanalysis datasets produced by the European Centre for Medium-Range Weather Forecasts (ECMWF) via the Copernicus Climate Change Service (C3S) Climate Data Store (CDS). The data are publicly available at https://cds.climate.copernicus.eu/ (last access: 1 June 2025).
Aerosol datasets were obtained from the Modern-Era Retrospective Analysis for Research and Applications Version 2 (MERRA-2), produced by the NASA Goddard Earth Observing System (GEOS) Global Modeling and Assimilation Office (GMAO) and distributed by the Goddard Earth Sciences Data and Information Services Center (GES DISC). The data are publicly available at https://disc.gsfc.nasa.gov/datasets?project=MERRA-2 (last access: 1 June 2025).
Cloud retrievals were obtained from the Clouds and the Earth's Radiant Energy System (CERES)-Moderate Resolution Imaging Spectroradiometer (MODIS) Edition 4 Single Scanner Footprint (SSF) daily Level-3 products (1° × 1° grid), produced by NASA's Langley Research Center (LaRC) and distributed by the Atmospheric Science Data Center (ASDC). The CERES–MODIS data are publicly available through the NASA ASDC archive at https://ceres.larc.nasa.gov/data/#ssf1deg-level-3 (last access: 1 June 2025).
Cloud droplet number concentration data are from Gryspeerdt et al. (2022a) MODIS-based product (1° × 1°), available at https://doi.org/10.5285/864a46cc65054008857ee5bb772a2a2b (Gryspeerdt et al., 2022b).
Sea surface temperature (SST) data were obtained from the National Oceanic and Atmospheric Administration (NOAA) Optimum Interpolation (OI) SST, Version 2, produced by the NOAA Physical Sciences Laboratory. The data are publicly available through the NOAA Physical Sciences Laboratory at https://psl.noaa.gov/data/gridded/data.noaa.oisst.v2.html (last access: 1 June 2025).
IMERG V07 precipitation data used in this study are openly available from the NASA Goddard Earth Sciences Data and Information Services Center (GES DISC) at https://disc.gsfc.nasa.gov/datasets?keywords=gpm%20imerg%2007 (last access: 1 June 2025).
YL analyzed the data and wrote the manuscript. HJ participated in scientific discussions and reviewed and refined the manuscript. YH participated in scientific discussions, and Resources, Project administration, Funding acquisition, Conceptualization, Formal analysis, Methodology, Writing – review & editing.
The contact author has declared that none of the authors has any competing interests.
Publisher's note: Copernicus Publications remains neutral with regard to jurisdictional claims made in the text, published maps, institutional affiliations, or any other geographical representation in this paper. The authors bear the ultimate responsibility for providing appropriate place names. Views expressed in the text are those of the authors and do not necessarily reflect the views of the publisher.
Data and samples were collected onboard of R/V Shiyan 6 implementing the open research cruise NORC2024-07 supported by NSFC Shiptime Sharing Project (project number: 42349907). And we sincerely appreciate the valuable comments provided by the two anonymous reviewers, which significantly enhanced the clarity and robustness of this work.
This work was supported by the National Natural Science Foundation of China (grant nos. 42027804, 41775026, and 41075012). Hailing Jia was support by the project ACIaction (File No. OCENW.M.24.024) financed by the Dutch Research Council (NWO) under the grant https://doi.org/10.61686/OZRJI30024.
This paper was edited by Tom Goren and reviewed by two anonymous referees.
Ackerman, A. S., Kirkpatrick, M. P., Stevens, D. E., and Toon, O. B.: The impact of humidity above stratiform clouds on indirect aerosol climate forcing, Nature, 432, 1014–1017, https://doi.org/10.1038/nature03174, 2004.
Albrecht, B. A.: Aerosols, Cloud Microphysics, and Fractional Cloudiness, Science, 245, 1227–1230, 1989.
Bellouin, N., Quaas, J., Gryspeerdt, E., Kinne, S., Stier, P., Watson-Parris, D., Boucher, O., Carslaw, K. S., Christensen, M., Daniau, A.-L., Dufresne, J.-L., Feingold, G., Fiedler, S., Forster, P., Gettelman, A., Haywood, J. M., Lohmann, U., Malavelle, F., Mauritsen, T., McCoy, D. T., Myhre, G., Mülmenstädt, J., Neubauer, D., Possner, A., Rugenstein, M., Sato, Y., Schulz, M., Schwartz, S. E., Sourdeval, O., Storelvmo, T., Toll, V., Winker, D., and Stevens, B.: Bounding Global Aerosol Radiative Forcing of Climate Change, Rev. Geophys., 58, e2019RG000660, https://doi.org/10.1029/2019RG000660, 2020.
Chen, J. and Hu, Z.: Seasonal variability in spatial patterns of sea surface cold- and warm fronts over the continental shelf of the northern South China Sea, Front. Mar. Sci., 9, https://doi.org/10.3389/fmars.2022.1100772, 2023.
Chen, Y., Luo, T., Sun, G., Zhu, W., Liu, Q., Liu, Y., Jin, X., and Weng, N.: A Comprehensive Ensemble Model for Marine Atmospheric Boundary-Layer Prediction in Meteorologically Sparse and Complex Regions: A Case Study in the South China Sea, Remote Sens., 17, 2046, https://doi.org/10.3390/rs17122046, 2025.
Chen, Y.-C., Christensen, M. W., Stephens, G. L., and Seinfeld, J. H.: Satellite-based estimate of global aerosol–cloud radiative forcing by marine warm clouds, Nat. Geosci., 7, 643–646, https://doi.org/10.1038/ngeo2214, 2014.
Costantino, L. and Bréon, F.-M.: Aerosol indirect effect on warm clouds over South-East Atlantic, from co-located MODIS and CALIPSO observations, Atmos. Chem. Phys., 13, 69–88, https://doi.org/10.5194/acp-13-69-2013, 2013.
Dadashazar, H., Crosbie, E., Majdi, M. S., Panahi, M., Moghaddam, M. A., Behrangi, A., Brunke, M., Zeng, X., Jonsson, H. H., and Sorooshian, A.: Stratocumulus cloud clearings: statistics from satellites, reanalysis models, and airborne measurements, Atmos. Chem. Phys., 20, 4637–4665, https://doi.org/10.5194/acp-20-4637-2020, 2020.
Dagan, G., Koren, I., Altaratz, O., and Heiblum, R. H.: Time-dependent, non-monotonic response of warm convective cloud fields to changes in aerosol loading, Atmos. Chem. Phys., 17, 7435–7444, https://doi.org/10.5194/acp-17-7435-2017, 2017.
Dezfuli, A. K., Ichoku, C. M., Huffman, G. J., Mohr, K. I., Selker, J. S., Van De Giesen, N., Hochreutener, R., and Annor, F. O.: Validation of IMERG Precipitation in Africa, J. Hydrometeorol., 18, 2817–2825, https://doi.org/10.1175/JHM-D-17-0139.1, 2017.
Douglas, A. and L'Ecuyer, T.: Quantifying variations in shortwave aerosol–cloud–radiation interactions using local meteorology and cloud state constraints, Atmos. Chem. Phys., 19, 6251–6268, https://doi.org/10.5194/acp-19-6251-2019, 2019.
Douville, H., Raghavan, K., Renwick, J., Allan, R. P., Arias, P. A., Barlow, M., Cerezo-Mota, R., Cherchi, A., Gan, T. Y., and Gergis, J.: Climate Change 2021 – The Physical Science Basis: Working Group I Contribution to the Sixth Assessment Report of the Intergovernmental Panel on Climate Change, 1st edn., Cambridge University Press, https://doi.org/10.1017/9781009157896, 2023.
Durden, S. L.: Evaluation of IMERG Data over Open Ocean Using Observations of Tropical Cyclones, Remote Sens., 16, 2028, https://doi.org/10.3390/rs16112028, 2024.
Fan, J., Yuan, T., Comstock, J. M., Ghan, S., Khain, A., Leung, L. R., Li, Z., Martins, V. J., and Ovchinnikov, M.: Dominant role by vertical wind shear in regulating aerosol effects on deep convective clouds, J. Geophys. Res.-Atmos., 114, https://doi.org/10.1029/2009JD012352, 2009.
Fan, J., Wang, Y., Rosenfeld, D., and Liu, X.: Review of Aerosol–Cloud Interactions: Mechanisms, Significance, and Challenges, J. Atmos. Sci., 73, 4221–4252, https://doi.org/10.1175/JAS-D-16-0037.1, 2016.
Feingold, G., Remer, L. A., Ramaprasad, J., and Kaufman, Y. J.: Analysis of smoke impact on clouds in Brazilian biomass burning regions: An extension of Twomey's approach, J. Geophys. Res., 106, 22907–22922, https://doi.org/10.1029/2001JD000732, 2001.
Feingold, G., Furrer, R., Pilewskie, P., Remer, L. A., Min, Q., and Jonsson, H.: Aerosol indirect effect studies at Southern Great Plains during the May 2003 Intensive Operations Period, J. Geophys. Res.-Atmos., 111, https://doi.org/10.1029/2004JD005648, 2006.
Gelaro, R., McCarty, W., Suárez, M. J., Todling, R., Molod, A., Takacs, L., Randles, C. A., Darmenov, A., Bosilovich, M. G., Reichle, R., Wargan, K., Coy, L., Cullather, R., Draper, C., Akella, S., Buchard, V., Conaty, A., da Silva, A. M., Gu, W., Kim, G.-K., Koster, R., Lucchesi, R., Merkova, D., Nielsen, J. E., Partyka, G., Pawson, S., Putman, W., Rienecker, M., Schubert, S. D., Sienkiewicz, M., and Zhao, B.: The Modern-Era Retrospective Analysis for Research and Applications, Version 2 (MERRA-2), J. Climate, 30, 5419–5454, https://doi.org/10.1175/JCLI-D-16-0758.1, 2017.
Grosvenor, D. P., Sourdeval, O., Zuidema, P., Ackerman, A., Alexandrov, M. D., Bennartz, R., Boers, R., Cairns, B., Chiu, J. C., Christensen, M., Deneke, H., Diamond, M., Feingold, G., Fridlind, A., Hünerbein, A., Knist, C., Kollias, P., Marshak, A., McCoy, D., Merk, D., Painemal, D., Rausch, J., Rosenfeld, D., Russchenberg, H., Seifert, P., Sinclair, K., Stier, P., van Diedenhoven, B., Wendisch, M., Werner, F., Wood, R., Zhang, Z., and Quaas, J.: Remote Sensing of Droplet Number Concentration in Warm Clouds: A Review of the Current State of Knowledge and Perspectives, Rev. Geophys., 56, 409–453, https://doi.org/10.1029/2017RG000593, 2018.
Gryspeerdt, E., Stier, P., White, B. A., and Kipling, Z.: Wet scavenging limits the detection of aerosol effects on precipitation, Atmos. Chem. Phys., 15, 7557–7570, https://doi.org/10.5194/acp-15-7557-2015, 2015.
Gryspeerdt, E., Goren, T., Sourdeval, O., Quaas, J., Mülmenstädt, J., Dipu, S., Unglaub, C., Gettelman, A., and Christensen, M.: Constraining the aerosol influence on cloud liquid water path, Atmos. Chem. Phys., 19, 5331–5347, https://doi.org/10.5194/acp-19-5331-2019, 2019.
Gryspeerdt, E., McCoy, D. T., Crosbie, E., Moore, R. H., Nott, G. J., Painemal, D., Small-Griswold, J., Sorooshian, A., and Ziemba, L.: The impact of sampling strategy on the cloud droplet number concentration estimated from satellite data, Atmos. Meas. Tech., 15, 3875–3892, https://doi.org/10.5194/amt-15-3875-2022, 2022a.
Gryspeerdt, E., McCoy, D., Crosbie, E., Moore, R. H., Nott, G. J., Painemal, D., Small-Griswold, J., Sorooshian, A., and Ziemba, L.: Cloud droplet number concentration, calculated from the MODIS (Moderate resolution imaging spectroradiometer) cloud optical properties retrieval and gridded using different sampling strategies, NERC EDS Centre for Environmental Data Analysis [data set], https://doi.org/10.5285/864a46cc65054008857ee5bb772a2a2b, 2022b.
Hayden, L. J. M., Tan, J., Bolvin, D. T., and Huffman, G. J.: Variations in the Diurnal Cycle of Precipitation and Its Changes with Distance from Shore over Two Contrasting Regions as Observed by IMERG, ERA5, and Spaceborne Ku Radar, J. Hydrometeorol., 24, 675–689, https://doi.org/10.1175/JHM-D-22-0154.1, 2023.
Hersbach, H., Bell, B., Berrisford, P., Hirahara, S., Horányi, A., Muñoz-Sabater, J., Nicolas, J., Peubey, C., Radu, R., Schepers, D., Simmons, A., Soci, C., Abdalla, S., Abellan, X., Balsamo, G., Bechtold, P., Biavati, G., Bidlot, J., Bonavita, M., De Chiara, G., Dahlgren, P., Dee, D., Diamantakis, M., Dragani, R., Flemming, J., Forbes, R., Fuentes, M., Geer, A., Haimberger, L., Healy, S., Hogan, R. J., Hólm, E., Janisková, M., Keeley, S., Laloyaux, P., Lopez, P., Lupu, C., Radnoti, G., De Rosnay, P., Rozum, I., Vamborg, F., Villaume, S., and Thépaut, J.: The ERA5 global reanalysis, Q. J. Royal. Meteor. Soc., 146, 1999–2049, https://doi.org/10.1002/qj.3803, 2020.
Huffman, G. J., Bolvin, D. T., Braithwaite, D., Hsu, K.-L., Joyce, R. J., Kidd, C., Nelkin, E. J., Sorooshian, S., Stocker, E. F., Tan, J., Wolff, D. B., and Xie, P.: Integrated Multi-satellite Retrievals for the Global Precipitation Measurement (GPM) Mission (IMERG), in: Satellite Precipitation Measurement, vol. 67, edited by: Levizzani, V., Kidd, C., Kirschbaum, D. B., Kummerow, C. D., Nakamura, K., and Turk, F. J., Springer International Publishing, Cham, 343–353, https://doi.org/10.1007/978-3-030-24568-9_19, 2020.
Huffman, G. J., Bolvin, D. T., Braithwaite, D., Hsu, K., Joyce, R., Kidd, C., Nelkin, E., Sorooshian, S., Tan, J., and Xie, P.: NASA Global Precipitation Measurement (GPM) Integrated Multi-Satellite Retrievals for GPM (IMERG) Version 07, Algorithm Theoretical Basis Document (ATBD) Version, 47, https://gpm.nasa.gov/resources/documents/imerg-v07-atbd (last access: 19 September 2025), 2023.
Jia, H. and Quaas, J.: Nonlinearity of the cloud response postpones climate penalty of mitigating air pollution in polluted regions, Nat. Clim. Chang., 13, 943–950, https://doi.org/10.1038/s41558-023-01775-5, 2023.
Jia, H., Ma, X., Quaas, J., Yin, Y., and Qiu, T.: Is positive correlation between cloud droplet effective radius and aerosol optical depth over land due to retrieval artifacts or real physical processes?, Atmos. Chem. Phys., 19, 8879–8896, https://doi.org/10.5194/acp-19-8879-2019, 2019.
Jia, H., Ma, X., Yu, F., and Quaas, J.: Significant underestimation of radiative forcing by aerosol–cloud interactions derived from satellite-based methods, Nat. Commun., 12, 3649, https://doi.org/10.1038/s41467-021-23888-1, 2021.
Jia, H., Quaas, J., Gryspeerdt, E., Böhm, C., and Sourdeval, O.: Addressing the difficulties in quantifying droplet number response to aerosol from satellite observations, Atmos. Chem. Phys., 22, 7353–7372, https://doi.org/10.5194/acp-22-7353-2022, 2022.
Jia, H., Hasekamp, O., and Quaas, J.: Revisiting Aerosol–Cloud Interactions From Weekly Cycles, Geophys. Res. Lett., 51, https://doi.org/10.1029/2024gl108266, 2024.
Jose, S., Nair, V. S., and Babu, S. S.: Anthropogenic emissions from South Asia reverses the aerosol indirect effect over the northern Indian Ocean, Sci. Rep., 10, 18360, https://doi.org/10.1038/s41598-020-74897-x, 2020.
Kim, B.-G., Schwartz, S. E., Miller, M. A., and Min, Q.: Effective radius of cloud droplets by ground-based remote sensing: Relationship to aerosol, J. Geophys. Res.-Atmos., 108, https://doi.org/10.1029/2003JD003721, 2003.
Klein, S. A. and Hartmann, D. L.: The Seasonal Cycle of Low Stratiform Clouds, J. Climate, 6, 1587–1606, https://doi.org/10.1175/1520-0442(1993)006<1587:TSCOLS>2.0.CO;2, 1993.
Lee, S. S. and Penner, J. E.: Dependence of aerosol–cloud interactions in stratocumulus clouds on liquid-water path, Atmos. Environ., 45, 6337–6346, https://doi.org/10.1016/j.atmosenv.2011.08.050, 2011.
Lee, T.-W. and Park, J. E.: Thermodynamic correlations between the sea surface temperature, water vapor content, and cloud fraction, using MODIS data, Theor. Appl. Climatol., 150, 1699–1706, https://doi.org/10.1007/s00704-022-04261-8, 2022.
Li, Y., Wang, B., Lee, S.-Y., Zhang, Z., Wang, Y., and Dong, W.: Micro-Pulse Lidar Cruising Measurements in Northern South China Sea, Remote Sens., 12, https://doi.org/10.3390/rs12101695, 2020.
Liu, J., Yu, J., Lin, C., He, M., Liu, H., Wang, W., and Min, M.: Near-real-time atmospheric and oceanic science products of Himawari-8 and Himawari-9 geostationary satellites over the South China Sea, Earth Syst. Sci. Data, 16, 4949–4969, https://doi.org/10.5194/essd-16-4949-2024, 2024.
Ma, P.-L., Rasch, P. J., Chepfer, H., Winker, D. M., and Ghan, S. J.: Observational constraint on cloud susceptibility weakened by aerosol retrieval limitations, Nat. Commun., 9, 2640, https://doi.org/10.1038/s41467-018-05028-4, 2018a.
Ma, X., Jia, H., Yu, F., and Quaas, J.: Opposite Aerosol Index-Cloud Droplet Effective Radius Correlations Over Major Industrial Regions and Their Adjacent Oceans, Geophys. Res. Lett., 45, 5771–5778, https://doi.org/10.1029/2018GL077562, 2018b.
Martin, D. W. and Howland, M. R.: Rainfall over the Arabian Sea during the onset of the 1979 monsoon, Nature, 300, 628–630, https://doi.org/10.1038/300628a0, 1982.
McComiskey, A., Feingold, G., Frisch, A. S., Turner, D. D., Miller, M. A., Chiu, J. C., Min, Q., and Ogren, J. A.: An assessment of aerosol-cloud interactions in marine stratus clouds based on surface remote sensing, J. Geophys. Res., 114, 2008JD011006, https://doi.org/10.1029/2008JD011006, 2009.
Miller, R. M., Rauber, R. M., Di Girolamo, L., Rilloraza, M., Fu, D., McFarquhar, G. M., Nesbitt, S. W., Ziemba, L. D., Woods, S., and Thornhill, K. L.: Influence of natural and anthropogenic aerosols on cloud base droplet size distributions in clouds over the South China Sea and West Pacific, Atmos. Chem. Phys., 23, 8959–8977, https://doi.org/10.5194/acp-23-8959-2023, 2023.
Minnis, P., Sun-Mack, S., Young, D. F., Heck, P. W., Garber, D. P., Chen, Y., Spangenberg, D. A., Arduini, R. F., Trepte, Q. Z., Smith, W. L., Ayers, J. K., Gibson, S. C., Miller, W. F., Hong, G., Chakrapani, V., Takano, Y., Liou, K.-N., Xie, Y., and Yang, P.: CERES Edition-2 Cloud Property Retrievals Using TRMM VIRS and Terra and Aqua MODIS Data – Part I: Algorithms, IEEE T. Geosci. Remote, 49, 4374–4400, https://doi.org/10.1109/TGRS.2011.2144601, 2011a.
Minnis, P., Sun-Mack, S., Chen, Y., Khaiyer, M. M., Yi, Y., Ayers, J. K., Brown, R. R., Dong, X., Gibson, S. C., Heck, P. W., Lin, B., Nordeen, M. L., Nguyen, L., Palikonda, R., Smith, W. L., Spangenberg, D. A., Trepte, Q. Z., and Xi, B.: CERES Edition-2 Cloud Property Retrievals Using TRMM VIRS and Terra and Aqua MODIS Data – Part II: Examples of Average Results and Comparisons With Other Data, IEEE T. Geosci. Remote, 49, 4401–4430, https://doi.org/10.1109/TGRS.2011.2144602, 2011b.
Minnis, P., Sun-Mack, S., Chen, Y., Chang, F.-L., Yost, C. R., Smith, W. L., Heck, P. W., Arduini, R. F., Bedka, S. T., Yi, Y., Hong, G., Jin, Z., Painemal, D., Palikonda, R., Scarino, B. R., Spangenberg, D. A., Smith, R. A., Trepte, Q. Z., Yang, P., and Xie, Y.: CERES MODIS Cloud Product Retrievals for Edition 4 – Part I: Algorithm Changes, IEEE T. Geosci. Remote, 59, 2744–2780, https://doi.org/10.1109/TGRS.2020.3008866, 2021.
Nakajima, T., Higurashi, A., Kawamoto, K., and Penner, J. E.: A possible correlation between satellite-derived cloud and aerosol microphysical parameters, Geophys. Res. Lett., 28, 1171–1174, https://doi.org/10.1029/2000GL012186, 2001.
Ou, H., Cai, M., Zhang, Y., Ni, X., Liang, B., Sun, Q., Mai, S., Sun, C., Zhou, S., Wang, H., Sun, J., and Zhao, J.: Measurement report: Cloud condensation nuclei (CCN) activity in the South China Sea from shipborne observations during the summer and winter of 2021 – seasonal variation and anthropogenic influence, Atmos. Chem. Phys., 25, 2495–2513, https://doi.org/10.5194/acp-25-2495-2025, 2025.
Painemal, D.: Global estimates of changes in shortwave low-cloud albedo and fluxes due to variations in cloud droplet number concentration derived from CERES-MODIS satellite sensors, Geophys. Res. Lett., 45, 9288–9296, https://doi.org/10.1029/2018GL078880, 2018.
Painemal, D., Chang, F.-L., Ferrare, R., Burton, S., Li, Z., Smith Jr., W. L., Minnis, P., Feng, Y., and Clayton, M.: Reducing uncertainties in satellite estimates of aerosol–cloud interactions over the subtropical ocean by integrating vertically resolved aerosol observations, Atmos. Chem. Phys., 20, 7167–7177, https://doi.org/10.5194/acp-20-7167-2020, 2020.
Peng, S., Zhu, Y., Huang, K., Ding, X., Shi, R., Wu, D., Feng, Y., and Wang, D.: Detecting the structure of marine atmospheric boundary layer over the Northern South China Sea by shipboard GPS sondes, Atmos. Sci. Lett., 17, 564–568, https://doi.org/10.1002/asl.693, 2016.
Qiu, Y., Zhao, C., Guo, J., and Li, J.: 8-Year ground-based observational analysis about the seasonal variation of the aerosol-cloud droplet effective radius relationship at SGP site, Atmos. Environ., 164, 139–146, https://doi.org/10.1016/j.atmosenv.2017.06.002, 2017.
Randles, C. A., da Silva, A. M., Buchard, V., Colarco, P. R., Darmenov, A., Govindaraju, R., Smirnov, A., Holben, B., Ferrare, R., Hair, J., Shinozuka, Y., and Flynn, C. J.: The MERRA-2 Aerosol Reanalysis, 1980 Onward. Part I: System Description and Data Assimilation Evaluation, J. Climate, 30, 6823–6850, https://doi.org/10.1175/JCLI-D-16-0609.1, 2017.
Reynolds, R. W., Rayner, N. A., Smith, T. M., Stokes, D. C., and Wang, W.: An Improved In Situ and Satellite SST Analysis for Climate, J. Climate, 15, 1609–1625, https://doi.org/10.1175/1520-0442(2002)015<1609:AIISAS>2.0.CO;2, 2002.
Rosenfeld, D., Zhu, Y., Wang, M., Zheng, Y., Goren, T., and Yu, S.: Aerosol-driven droplet concentrations dominate coverage and water of oceanic low-level clouds, Science, 363, eaav0566, https://doi.org/10.1126/science.aav0566, 2019.
Saponaro, G., Kolmonen, P., Sogacheva, L., Rodriguez, E., Virtanen, T., and de Leeuw, G.: Estimates of the aerosol indirect effect over the Baltic Sea region derived from 12 years of MODIS observations, Atmos. Chem. Phys., 17, 3133–3143, https://doi.org/10.5194/acp-17-3133-2017, 2017.
Sato, Y., Goto, D., Michibata, T., Suzuki, K., Takemura, T., Tomita, H., and Nakajima, T.: Aerosol effects on cloud water amounts were successfully simulated by a global cloud-system resolving model, Nat. Commun., 9, 985, https://doi.org/10.1038/s41467-018-03379-6, 2018.
Seinfeld, J. H., Bretherton, C., Carslaw, K. S., Coe, H., DeMott, P. J., Dunlea, E. J., Feingold, G., Ghan, S., Guenther, A. B., Kahn, R., Kraucunas, I., Kreidenweis, S. M., Molina, M. J., Nenes, A., Penner, J. E., Prather, K. A., Ramanathan, V., Ramaswamy, V., Rasch, P. J., Ravishankara, A. R., Rosenfeld, D., Stephens, G., and Wood, R.: Improving our fundamental understanding of the role of aerosol-cloud interactions in the climate system, P. Natl. Acad. Sci. USA, 113, 5781–5790, https://doi.org/10.1073/pnas.1514043113, 2016.
Sorooshian, A., Anderson, B., Bauer, S. E., Braun, R. A., Cairns, B., Crosbie, E., Dadashazar, H., Diskin, G., Ferrare, R., Flagan, R. C., Hair, J., Hostetler, C., Jonsson, H. H., Kleb, M. M., Liu, H., MacDonald, A. B., McComiskey, A., Moore, R., Painemal, D., Russell, L. M., Seinfeld, J. H., Shook, M., Smith, W. L., Thornhill, K., Tselioudis, G., Wang, H., Zeng, X., Zhang, B., Ziemba, L., and Zuidema, P.: Aerosol–Cloud–Meteorology Interaction Airborne Field Investigations: Using Lessons Learned from the U.S. West Coast in the Design of ACTIVATE off the U.S. East Coast, B. Am. Meteor. Soc., 100, 1511–1528, https://doi.org/10.1175/BAMS-D-18-0100.1, 2019.
Stier, P., Van Den Heever, S. C., Christensen, M. W., Gryspeerdt, E., Dagan, G., Saleeby, S. M., Bollasina, M., Donner, L., Emanuel, K., Ekman, A. M. L., Feingold, G., Field, P., Forster, P., Haywood, J., Kahn, R., Koren, I., Kummerow, C., L'Ecuyer, T., Lohmann, U., Ming, Y., Myhre, G., Quaas, J., Rosenfeld, D., Samset, B., Seifert, A., Stephens, G., and Tao, W.-K.: Multifaceted aerosol effects on precipitation, Nat. Geosci., 17, 719–732, https://doi.org/10.1038/s41561-024-01482-6, 2024.
Su, W., Loeb, N. G., Xu, K.-M., Schuster, G. L., and Eitzen, Z. A.: An estimate of aerosol indirect effect from satellite measurements with concurrent meteorological analysis, J. Geophys. Res.-Atmos., 115, https://doi.org/10.1029/2010JD013948, 2010.
Su, Y., Han, Y., Luo, H., Zhang, Y., Shao, S., Xie, X., Su, Y., Han, Y., Luo, H., Zhang, Y., Shao, S., and Xie, X.: Physical-Optical Properties of Marine Aerosols over the South China Sea: Shipboard Measurements and MERRA-2 Reanalysis, Remote Sens., 14, https://doi.org/10.3390/rs14102453, 2022.
Sun, Q., Liang, B., Cai, M., Zhang, Y., Ou, H., Ni, X., Sun, X., Han, B., Deng, X., Zhou, S., and Zhao, J.: Cruise observation of the marine atmosphere and ship emissions in South China Sea: Aerosol composition, sources, and the aging process, Environ. Pollut., 316, 120539, https://doi.org/10.1016/j.envpol.2022.120539, 2023.
Tan, J., Huffman, G. J., Bolvin, D. T., and Nelkin, E. J.: Diurnal Cycle of IMERG V06 Precipitation, Geophys. Res. Lett., 46, 13584–13592, https://doi.org/10.1029/2019GL085395, 2019a.
Tan, J., Huffman, G. J., Bolvin, D. T., and Nelkin, E. J.: IMERG V06: Changes to the Morphing Algorithm, J. Atmos. Ocean. Technol., 36, 2471–2482, https://doi.org/10.1175/JTECH-D-19-0114.1, 2019b.
Tu, Q., Zhao, Y., Guo, J., Cheng, C., Shi, L., Yan, Y., and Hao, Z.: Spatial and Temporal Variations of Aerosol Optical Thickness over the China Seas from Himawari-8, Remote Sens., 13, 5082, https://doi.org/10.3390/rs13245082, 2021.
Twomey, S.: Pollution and the planetary albedo, Atmos. Environ., 8, 1251–1256, https://doi.org/10.1016/0004-6981(74)90004-3, 1974.
Twomey, S.: The Influence of Pollution on the Shortwave Albedo of Clouds, J. Atmos. Sci., 34, 1149–1152, https://doi.org/10.1175/1520-0469(1977)034<1149:TIOPOT>2.0.CO;2, 1977.
Wall, C. J., Norris, J. R., Possner, A., McCoy, D. T., McCoy, I. L., and Lutsko, N. J.: Assessing effective radiative forcing from aerosol–cloud interactions over the global ocean, P. Natl. Acad. Sci. USA, 119, e2210481119, https://doi.org/10.1073/pnas.2210481119, 2022.
Wall, C. J., Storelvmo, T., and Possner, A.: Global observations of aerosol indirect effects from marine liquid clouds, Atmos. Chem. Phys., 23, 13125–13141, https://doi.org/10.5194/acp-23-13125-2023, 2023.
Wang, B., LinHo, Zhang, Y., and Lu, M.-M.: Definition of South China Sea Monsoon Onset and Commencement of the East Asia Summer Monsoon, J. Climate, 17, 699–710, https://doi.org/10.1175/2932.1, 2004.
Wang, B., Huang, F., Wu, Z., Yang, J., Fu, X., and Kikuchi, K.: Multi-scale climate variability of the South China Sea monsoon: A review, Dynam. Atmos. Ocean., 47, 15–37, https://doi.org/10.1016/j.dynatmoce.2008.09.004, 2009.
Wang, F., Guo, J., Wu, Y., Zhang, X., Deng, M., Li, X., Zhang, J., and Zhao, J.: Satellite observed aerosol-induced variability in warm cloud properties under different meteorological conditions over eastern China, Atmos. Environ., 84, 122–132, https://doi.org/10.1016/j.atmosenv.2013.11.018, 2014.
Wang, J.-J., Li, X., and Carey, L. D.: Evolution, Structure, Cloud Microphysical, and Surface Rainfall Processes of Monsoon Convection during the South China Sea Monsoon Experiment, J. Atmos. Sci., 64, 360–380, https://doi.org/10.1175/JAS3852.1, 2007.
Wang, K.-Y., Sui, C.-H., Lu, M.-M., and Hong, J.-S.: Cold Surge Impacts on the Structure, Energy Budget, and Turbulence of the South China Sea Boundary Layer, Mon. Weather Rev., 152, 2129–2148, https://doi.org/10.1175/MWR-D-23-0238.1, 2 2024a.
Wang, S., Wang, Q., and Feingold, G.: Turbulence, Condensation, and Liquid Water Transport in Numerically Simulated Nonprecipitating Stratocumulus Clouds, J. Atmos. Sci., 60, 262–278, https://doi.org/10.1175/1520-0469(2003)060<0262:TCALWT>2.0.CO;2, 2003.
Wang, Y., Zhao, P., Xiao, H., and Zhang, P.: Aerosol effects on liquid cloud microphysical properties in south China: Land–ocean contrasts, Atmos. Pollut. Res., 15, 102032, https://doi.org/10.1016/j.apr.2023.102032, 2024b.
Wang, Y., Li, J., Fang, F., Zhang, P., He, J., Pöhlker, M. L., Henning, S., Tang, C., Jia, H., Wang, Y., Jian, B., Shi, J., and Huang, J.: In-situ observations reveal weak hygroscopicity in the Southern Tibetan Plateau: implications for aerosol activation and indirect effects, npj Clim. Atmos. Sci., 7, 77, https://doi.org/10.1038/s41612-024-00629-x, 2024c.
Wang, Y., Jia, H., Zhang, P., Fang, F., Li, J., Zhu, L., Wang, Y., Wang, T., and Li, J.: Sensitivity of cloud microphysics to aerosol is highly associated with cloud water content: Implications for indirect radiative forcing, Atmos. Res., 309, 107552, https://doi.org/10.1016/j.atmosres.2024.107552, 2024d.
Watters, D. and Battaglia, A.: The Summertime Diurnal Cycle of Precipitation Derived from IMERG, Remote Sens., 11, 1781, https://doi.org/10.3390/rs11151781, 2019.
Watters, D., Battaglia, A., and Allan, R. P.: The Diurnal Cycle of Precipitation according to Multiple Decades of Global Satellite Observations, Three CMIP6 Models, and the ECMWF Reanalysis, J. Climate, 34, 5063–5080, https://doi.org/10.1175/JCLI-D-20-0966.1, 2021.
Wu, Z., Jiang, C., Conde, M., Chen, J., and Deng, B.: The long-term spatiotemporal variability of sea surface temperature in the northwest Pacific and China offshore, Ocean Sci., 16, 83–97, https://doi.org/10.5194/os-16-83-2020, 2020.
Xiao, H.-W., Xiao, H.-Y., Luo, L., Shen, C.-Y., Long, A.-M., Chen, L., Long, Z.-H., and Li, D.-N.: Atmospheric aerosol compositions over the South China Sea: temporal variability and source apportionment, Atmos. Chem. Phys., 17, 3199–3214, https://doi.org/10.5194/acp-17-3199-2017, 2017.
Yost, C. R., Minnis, P., Sun-Mack, S., Chen, Y., and Smith, W. L.: CERES MODIS Cloud Product Retrievals for Edition 4 – Part II: Comparisons to CloudSat and CALIPSO, IEEE T. Geosci. Remote, 59, 3695–3724, https://doi.org/10.1109/TGRS.2020.3015155, 2021.
Yuan, C.-S., Chuang, H.-L., Tseng, Y.-L., Li, T.-C., Soong, K.-Y., and Cheng, W.-H.: Long-range transport and source apportionment of marine fine particles in the Taiwan Strait and South China Sea Intersection: Spatiotemporal variations and chemical fingerprints, Atmos. Environ., 339, 120867, https://doi.org/10.1016/j.atmosenv.2024.120867, 2024.
Yuan, T., Li, Z., Zhang, R., and Fan, J.: Increase of cloud droplet size with aerosol optical depth: An observation and modeling study, J. Geophys. Res.-Atmos., 113, https://doi.org/10.1029/2007JD008632, 2008.
Zhang, C., Xu, H., Li, Z., Xie, Y., and Li, D.: Maritime Aerosol Optical and Microphysical Properties in the South China Sea Under Multi-source Influence, Sci. Rep., 9, 17796, https://doi.org/10.1038/s41598-019-54483-6, 2019.
Zhang, G. J., Ramanathan, V., and McPhaden, M. J.: Convection–Evaporation Feedback in the Equatorial Pacific, J. Climate, 8, 3040–3051, https://doi.org/10.1175/1520-0442(1995)008<3040:CEFITE>2.0.CO;2, 1995.
Zhang, Y. and Wang, K.: The Changing Morphology of Global Precipitation Systems during the Last Two Decades, B. Am. Meteorol. Soc., 105, E1861–E1880, https://doi.org/10.1175/BAMS-D-23-0106.1, 2024.
Zhao, C., Sun, Y., Yang, J., Li, J., Zhou, Y., Yang, Y., Fan, H., and Zhao, X.: Observational evidence and mechanisms of aerosol effects on precipitation, Sci. Bull., 69, 1569–1580, https://doi.org/10.1016/j.scib.2024.03.014, 2024.
Zheng, B., Qu, J., Huang, Y., Peng, D., Gu, D., Li, C., and Huang, R.: Evaluating the Seasonal Cycle of the South China Sea Monsoon in CMIP6 Models, J. Meteorol. Res., 39, 322–337, https://doi.org/10.1007/s13351-025-4170-x, 2025.
Zheng, H., Liu, M., Lohmann, R., Li, D., Vojta, S., Katz, S., Wang, W., Ke, H., Wang, C., and Cai, M.: Gaseous polycyclic aromatic hydrocarbons over the South China Sea: Implications for atmospheric transport under monsoon influences, Mar. Pollut. Bull., 191, 114982, https://doi.org/10.1016/j.marpolbul.2023.114982, 2023.
Zheng, X., Xi, B., Dong, X., Wu, P., Logan, T., and Wang, Y.: Environmental effects on aerosol–cloud interaction in non-precipitating marine boundary layer (MBL) clouds over the eastern North Atlantic, Atmos. Chem. Phys., 22, 335–354, https://doi.org/10.5194/acp-22-335-2022, 2022.
Zhu, S., Xiao, Z., Che, H., and Chen, Q.: Impact of aerosols on warm clouds over the Sichuan Basin, China in winter based on the MERRA-2 reanalysis dataset, Atmos. Pollut. Res., 13, 101342, https://doi.org/10.1016/j.apr.2022.101342, 2022.
Zhu, S., Li, Z., Chen, M., Wen, Y., Gao, S., Zhang, J., Wang, J., Nan, Y., Ferraro, S. C., Tsoodle, T. E., and Hong, Y.: How has the latest IMERG V07 improved the precipitation estimates and hydrologic utility over CONUS against IMERG V06?, J. Hydrol., 645, 132257, https://doi.org/10.1016/j.jhydrol.2024.132257, 2024.