the Creative Commons Attribution 4.0 License.
the Creative Commons Attribution 4.0 License.
 | 29 Jun 2026
Ice nucleation activity of mineral dust from Morocco and Iceland in immersion freezing mode and its relationship with mineralogy and particle size
Sebastian Vergara-Palacio
Alexei Kiselev
Franziska Vogel
Adolfo González-Romero
Romy Fösig
Xavier Querol
Corinna Hoose
Nsikanabasi Silas Umo
Ottmar Möhler
Konrad Kandler
Carlos Pérez García-Pando
Martina Klose
Ice nucleation activity (INA) in the mixed-phase cloud (MPC) regime has been extensively studied. Nevertheless, most research has focused on particles smaller than a few micrometers, leaving the INA dependence on mineralogical composition and size poorly characterized for particles larger than ten micrometers in diameter. This gap is important because: (1) large mineral dust particles (LMDPs) can undergo long-range atmospheric transport and reach altitudes where MPCs form; (2) their mineralogical composition may differ from that of smaller particles, affecting the density of ice-active sites; and (3) larger particles are more susceptible to atmospheric aging through coatings by chemical and organic compounds, which can further modify their INA. Here, we used natural soil dust samples collected during field campaigns in Morocco and Iceland, covering particle sizes from fine to super-coarse dust and characterized in terms of mineralogical composition and size. The samples' INA was measured in the AIDA and AIDAm cloud chambers and the INSEKT and IR-DROFA freezing assays in more than 300 experiments. Moroccan samples exhibited INA comparable to that reported for K-feldspar in previous studies, with no dependence on particle size, consistent with the nearly constant K-feldspar fraction across all size bins. In contrast, Icelandic samples showed lower INA than in other studies using samples of similar composition, along with a subtle size dependence linked to the size-varying pyroxene content, which decreased with increasing particle size. Our findings elucidate the role of LMDPs in immersion freezing and their relationship with mineralogy and size for low- and high-latitude dust sources.
- Article
(11901 KB) - Full-text XML
- BibTeX
- EndNote


Mineral dust from dry soil is one of the most abundant aerosol types in terms of mass in the atmosphere (Pan et al., 2024; Kim et al., 2024; Wang et al., 2024). The average global dust emission flux and atmospheric dust load are estimated to be in the range of about 2700–5200 Tg yr−1 and 28–35 Tg, respectively (Klose et al., 2021; Kok et al., 2021). Once the particles are lifted into the troposphere, they can travel thousands of kilometers and have lifetimes of several days to weeks (Mahowald et al., 2005). Additionally, dust interacts with various atmospheric constituents. Chemically active gases may form coatings that alter dust properties (Li and Shao, 2009), while interactions with water vapor and liquid water can promote cloud droplet and ice crystal formation (Sullivan et al., 2009; Kanji et al., 2017), thus modifying both dust aerosol characteristics and cloud properties (Zhu et al., 2023).
The impact of mineral dust on clouds occurs through the formation of cloud droplets and ice crystals, as dust particles act as cloud condensation nuclei (CCN) and ice nucleating particles (INP), respectively. Generally, pure water droplets can exist in the atmosphere well below 0 °C and change their phase to ice if the temperature is below −38 °C under conditions of supersaturation (Pruppacher and Klett, 1978), known as homogeneous freezing. In contrast, ice crystals form at warmer temperatures if water or water vapor molecules come into contact with particles. This phenomenon is called heterogeneous freezing, and the particles that facilitate it are referred to as ice nucleating particles (INP). Particles can act as INP through several pathways, including deposition nucleation, immersion freezing, condensation freezing, and contact freezing (Hoose and Möhler, 2012; Murray et al., 2012). Accurately characterizing INP activity is therefore critical for quantifying cloud properties and their interactions with radiation. However, this remains a significant challenge due to the variety of nucleation pathways and the strong dependence of INP efficiency on particle composition, size, and surface properties, all of which affect the ability of particles to act as INP (Hoose and Möhler, 2012; Atkinson et al., 2013; Harrison et al., 2019).
Dust sources occur across a wide range of latitudes. Low latitude sources are located in tropical and sub-tropical regions and are dominated by deserts, mid latitude sources are located in temperate regions and can be linked to steppe areas, and high-latitude sources are located in polar and cold desert regions primary from glacier outwash and volcanic activity (Ginoux et al., 2012; Bullard et al., 2016; Barr et al., 2023). Northern Africa is the most significant source of mineral dust globally, with its dust being frequently transported over long distances to remote regions. High-latitude dust sources have received increasing attention in recent years and studies show that their contribution to the global dust budget is not negligible (Bullard et al., 2016; Meinander et al., 2022) and that they might play an important role in regional cloud properties.
Many parameterizations have been proposed to estimate INP activity from low- (LLD) and mid-latitude dust (MLD) regions (Atkinson et al., 2013; DeMott et al., 2015; Boose et al., 2016; Ullrich et al., 2017). In contrast, only a few studies have investigated the INP activity of high-latitude dust (HLD) sources. Among these, two have focused on Icelandic dust in condensation (Paramonov et al., 2018) and immersion (Sanchez-Marroquin et al., 2020) freezing modes, finding an ice-nucleating efficiency comparable to that of LLD within the −40 to −30 °C (233–243 K) temperature range.
However, in most studies, the particle size distribution of the aerosol considered was narrow (a few µm) and, in most cases, did not extend to larger sizes (e.g. larger than 10 µm) (Hoose and Möhler, 2012; Hiranuma et al., 2015). Presumably, the reason behind this lack of studies considering broader size distributions was, in part, due to the long-standing understanding that large particles do not travel far from their source, i.e. settle out relatively quickly due to their large size and weight, which limits their interaction with water vapor and other components in the atmosphere. However, there is now ample evidence that mineral dust particles with sizes between 10 and 62.5 µm (super-coarse particles) and even larger than 62.5 µm (giant particles) can undergo long-range atmospheric transport (Adebiyi et al., 2022, and references therein). Nevertheless, the atmospheric implications of large dust particles as INP remain subject to important uncertainties. Despite evidence for long-range transport, coarse and super-coarse particles on average have shorter atmospheric lifetimes than fine dust due to gravitational settling making their number concentration lower than those of fine particles (Adebiyi et al., 2022). Consequently, their contribution to bulk INP concentrations depends strongly on transport distance, removal rates, and their particle ice nucleation efficiency. Apart from the smaller number concentration, the large surface area of super-micron particles is prone to coating with secondary compounds such as organics and sulfates. The effects of these coatings on particles' INA efficiency depend on the nucleation mode and coating material. In immersion freezing mode, coatings can suppress, leave unchanged, or enhance dust INA depending on their composition: studies found that secondary organic aerosol coatings had no significant effect on INAS density (Kanji et al., 2019), sulfuric acid coatings reduced INA with the strongest effect on feldspar (Augustin‐Bauditz et al., 2014), and mineral dust internally mixed with biological material exhibited enhanced INA at warmer temperatures than pure dust (Augustin-Bauditz et al., 2016). These findings demonstrate that aerosol coatings can substantially modify the INA of mineral dust depending on the chemical nature of the coating material. Since these interactions occur at the particle surface, coating effects may become increasingly important for larger particles due to their greater available surface area and potentially more diverse distributions of ice-active sites.
Only a few studies have examined supermicron particles and how their ice nucleation activity depends on particle size. For example, Reicher et al. (2019) investigated mineral dust particles during dust events in the eastern Mediterranean, using different cutoff sizes of up to 5.6 µm. They observed that ice nucleation activity quantified in terms of the ice nucleation active site (INAS) density increased with both particle size and concentration.
In this study, we investigate the relationship between mineral dust particle size and mineralogy to ice nucleation activity (INA). We use natural soil samples collected systematically during field campaigns in two prominent low- and high-latitude dust sources, i.e. Morocco and Iceland. The samples covered particle sizes from fine to super-coarse dust (fine dust: D<2.5 µm, coarse dust: 2.5 µm µm, super coarse dust: 10 µm µm; Adebiyi et al., 2022). To investigate INA of the samples, experiments were carried out in the Aerosol Interaction and Dynamics in the Atmosphere (AIDA) and AIDA mini (AIDAm) cloud chamber, and with the Ice Nucleation Spectrometer of the Karlsruhe Institute of Technology (INSEKT) and IR-DROFA freezing assays. The ice nucleation efficiency is assessed in terms of the ice nucleation active surface site (INAS, ns) density concept, which assumes a deterministic behavior, where the temperature acts as the triggering factor for ice nucleation at specific sites (active sites) on the aerosol surface. Variations in INA are analyzed in relation to dust properties, such as size and mineralogy, and subsequently summarized as parameterizations (Table 4).
This work is structured as follows. Section 2 introduces the field campaigns, the sample collection and processing, outlines the framework of the INA measurement campaign (MICOS), describes the main characteristics of AIDA and INSEKT, and details the calculations used to derive the results presented. In Sect. 3, the results obtained from measurements using the cloud chamber AIDA, and the freezing assays INSEKT and IR-DROFA are presented and discussed with consideration of their size distribution and mineralogical composition. In Sect. 4, we discuss our results and compare them with previous studies. We conclude our study in Sect. 5 and give future perspectives.
2.1 Collection and preparation of natural dust samples from Morocco and Iceland
The mineral dust samples used to investigate dust ice nucleation activity were collected during field campaigns in Morocco (2019) and Iceland (2021). The Morocco campaign was organized by the European Research Council project entitled FRontiers in dust minerAloGical coMposition and its Effects upoN climaTe (FRAGMENT) and the Iceland campaign co-organized between FRAGMENT and the project Iceland as a model for high-latitude dust sources – a combined experimental and modeling approach for characterization of dust emission and transport processes (HiLDA) (e.g. González-Flórez et al., 2023; Panta et al., 2023; González-Romero et al., 2023, 2024; Panta et al., 2025). Soil sampling in Morocco was carried out in September 2019 in the area of L'Bour (29°49′30′′ N, 5°52′25′′ W), a dry lake located in the lower Draâ valley at the edge of the Sahara. The zone consists of a flat surface with a smooth hard crust in which under favorable weather conditions dust was frequently emitted. For a detailed characterization of the area and aerosols, the reader is referred to Panta et al. (2023), and González-Romero et al. (2023). Icelandic soil samples were collected from a terminal lake connected to a nearby glacier (N 64°54′55′′, W 16°46′35′′, 710 m a.s.l.) in the Vatnajökull National Park in August 2021 (Dupont et al., 2024). The area was flat and devoid of substantial roughness elements. Flooding from the nearby glacier regularly supplied fresh sediment to the area. A detailed description of the study site and sediment characteristics is presented in González-Romero et al. (2024) and of the properties of the emitted dust in Panta et al. (2025). For both locations, sampling was done with a metallic shovel (50 cm2 area, and 2 cm depth) in a stratified random sampling approach across 9 equally sized squared strata covering a total area of 100 × 100 m2. After collection, samples were stored in plastic bags and transported to the laboratory where they were dried for 24–48 h at 50 °C. Three samples were collected within each stratum and then combined to three separate representative samples (hence each consisted of one sample per each stratum). Size-segregated samples for injection into AIDA (Sect. 2.2.1) were generated from the collected samples using both sieving and a cascade impactor. The procedure is described in Parra et al. (2014). In short, a cascade impactor (Retsch TYP PI-1) was used, allowing separation into a maximum of seven stages ranging from 0.3 µm to >20 µm in diameter. Approximately 0.2 g of the sample that had been previously sieved through a 63 µm mesh was placed into the initial stage of the impactor, as instructed by the manufacturer. The air flow through the impactor was held constant at 2.4 m3 h−1 with a compressed air pressure of 3–20 bars to disaggregate the particles before entering the impactor. To determine the mass of the sample collected in each stage, each ring of the impactor was weighed before and after the segregation process using a balance (with a precision of 0.0001 g).
Subsequently, the particle size distribution (PSD) was measured using a Malvern Mastersizer 2000 (Malvern Instruments Ltd), which employs the laser diffraction method based on Mie scattering theory (ISO 13320-1). The instrument determines PSDs from the angular distribution of scattered light of an ensemble of particles rather than detecting individual particles; thus, all particles within the laser beam contribute to the measurement signal. The nominal measurable size range is approximately 0.02 to 2000 µm. Ethanol was used as dispersant. The refractive index for the dispersant and particles was 1.360 and 1.520, respectively. The technique yields volume-based particle size distributions, reporting diameters of equivalent spheres assuming a spherical shape. Uncertainties in the retrieved PSD arise from assumptions in the inversion algorithm (e.g., refractive index), particle shape effects, and sample dispersion. Under controlled conditions, the reproducibility of laser diffraction measurements is typically within a few percent (ISO 13320), but variability may be higher for irregular particles such as mineral dust. Furthermore, reproducibility was further assessed through n=2 to 6 replicates per sample. The mean bin-wise coefficient of variation of the surface area distribution, defined according to , where μi and σi are the across-replicate mean and standard deviation of the surface area distribution, respectively, and N is the number of replicated measurements, was below 6 % for 5 of 7 samples, reaching 12 % and 6 % for the Morocco samples (Fig. 3b and c, respectively). This metric captures point-by-point shape variability across the full distribution. These results indicate high repeatability of the Malvern measurements for the analyzed samples. It should be noted that the PSDs derived from Malvern measurements were used to qualitatively compare the PSD obtained from freshly segregated samples with the PSD measured during the MICOS campaign inside the AIDA chamber, rather than being used in any calculation.
Table 1Conditions during the AIDA experiments conducted with Moroccan samples. Id: experiment identifier, Cn,ae: initial (before chamber expansion) total number concentration, dn: mean diameter for the number concentration size distribution, Sae: initial total surface area concentration, d1,s and d2,s mean diameter of the bimodal surface area size distribution, Tstart: temperature at which the first ice formation was observed.
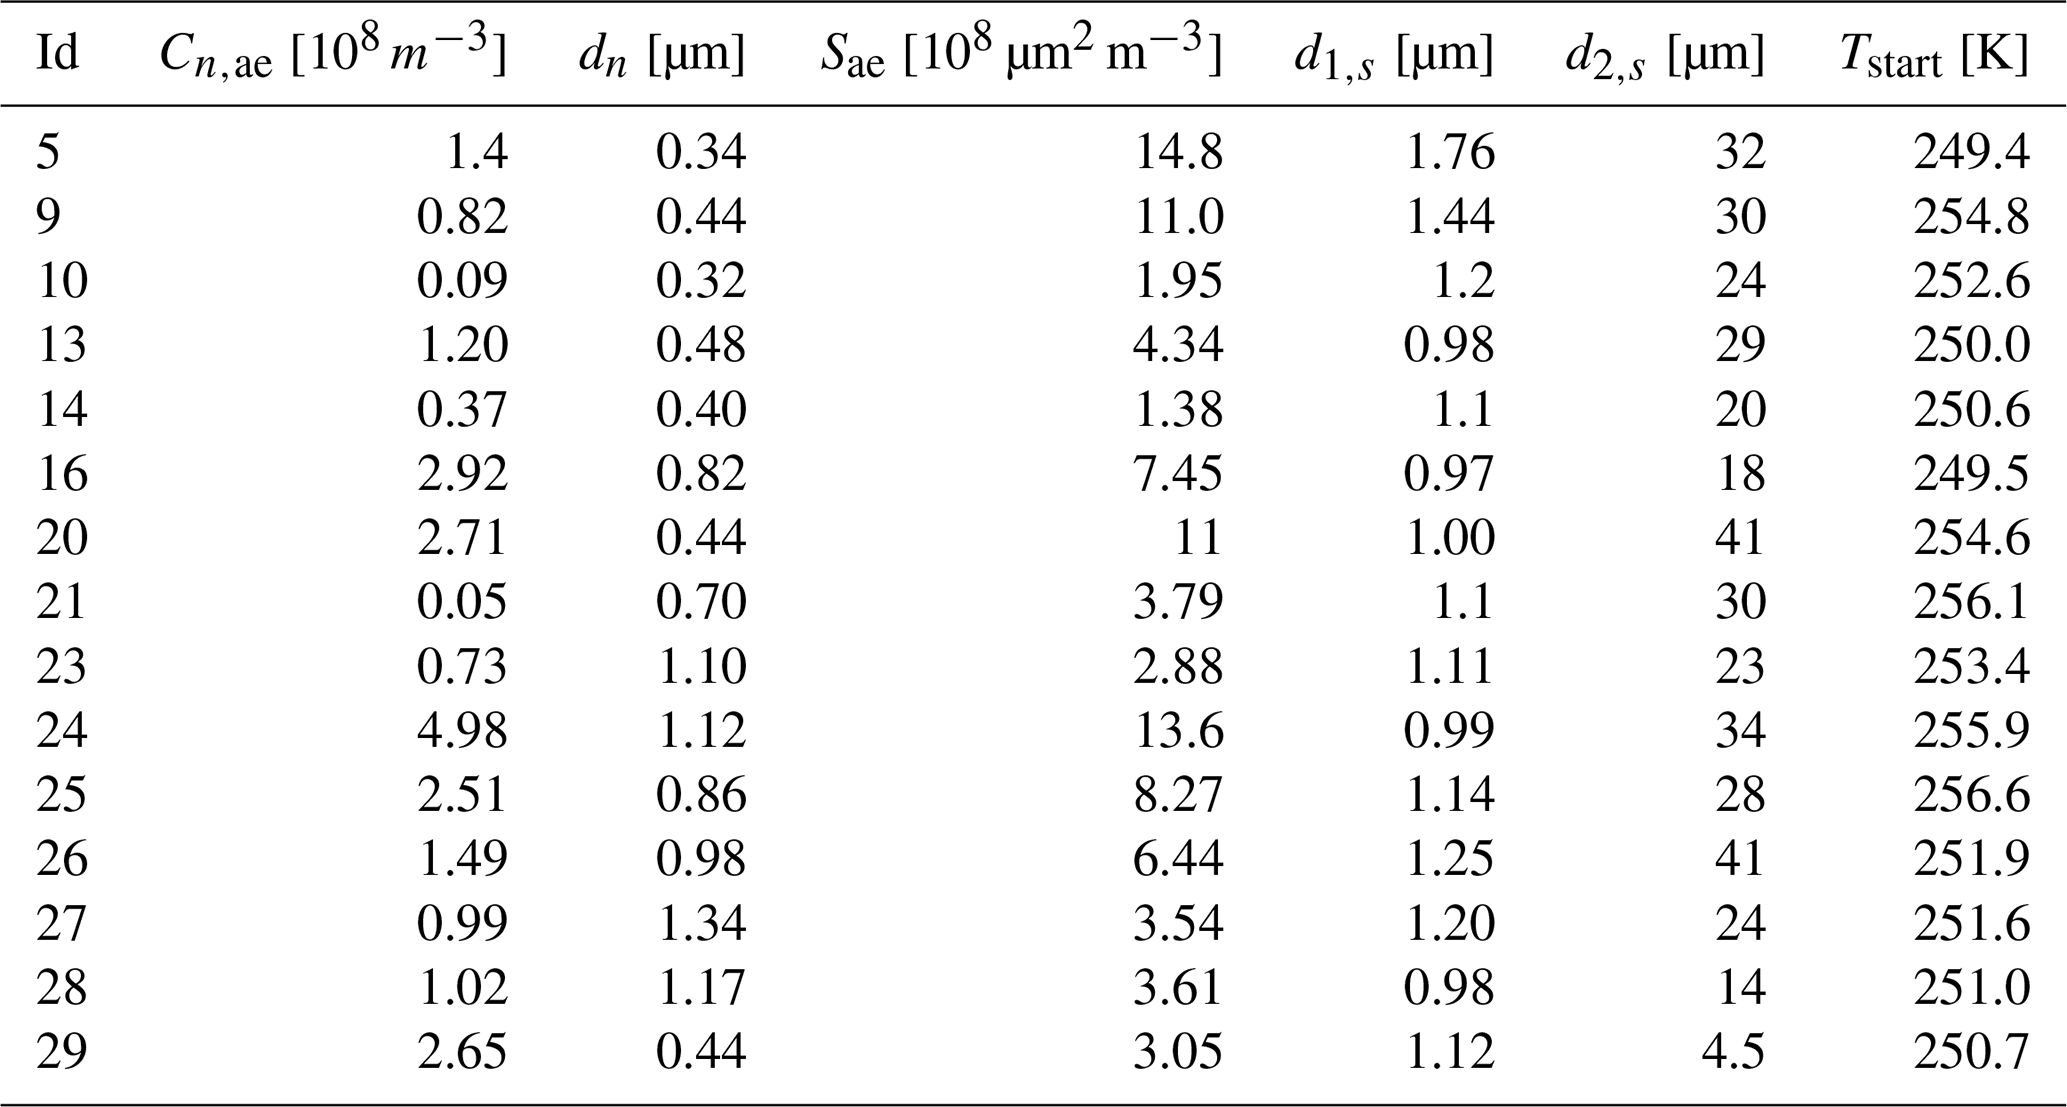
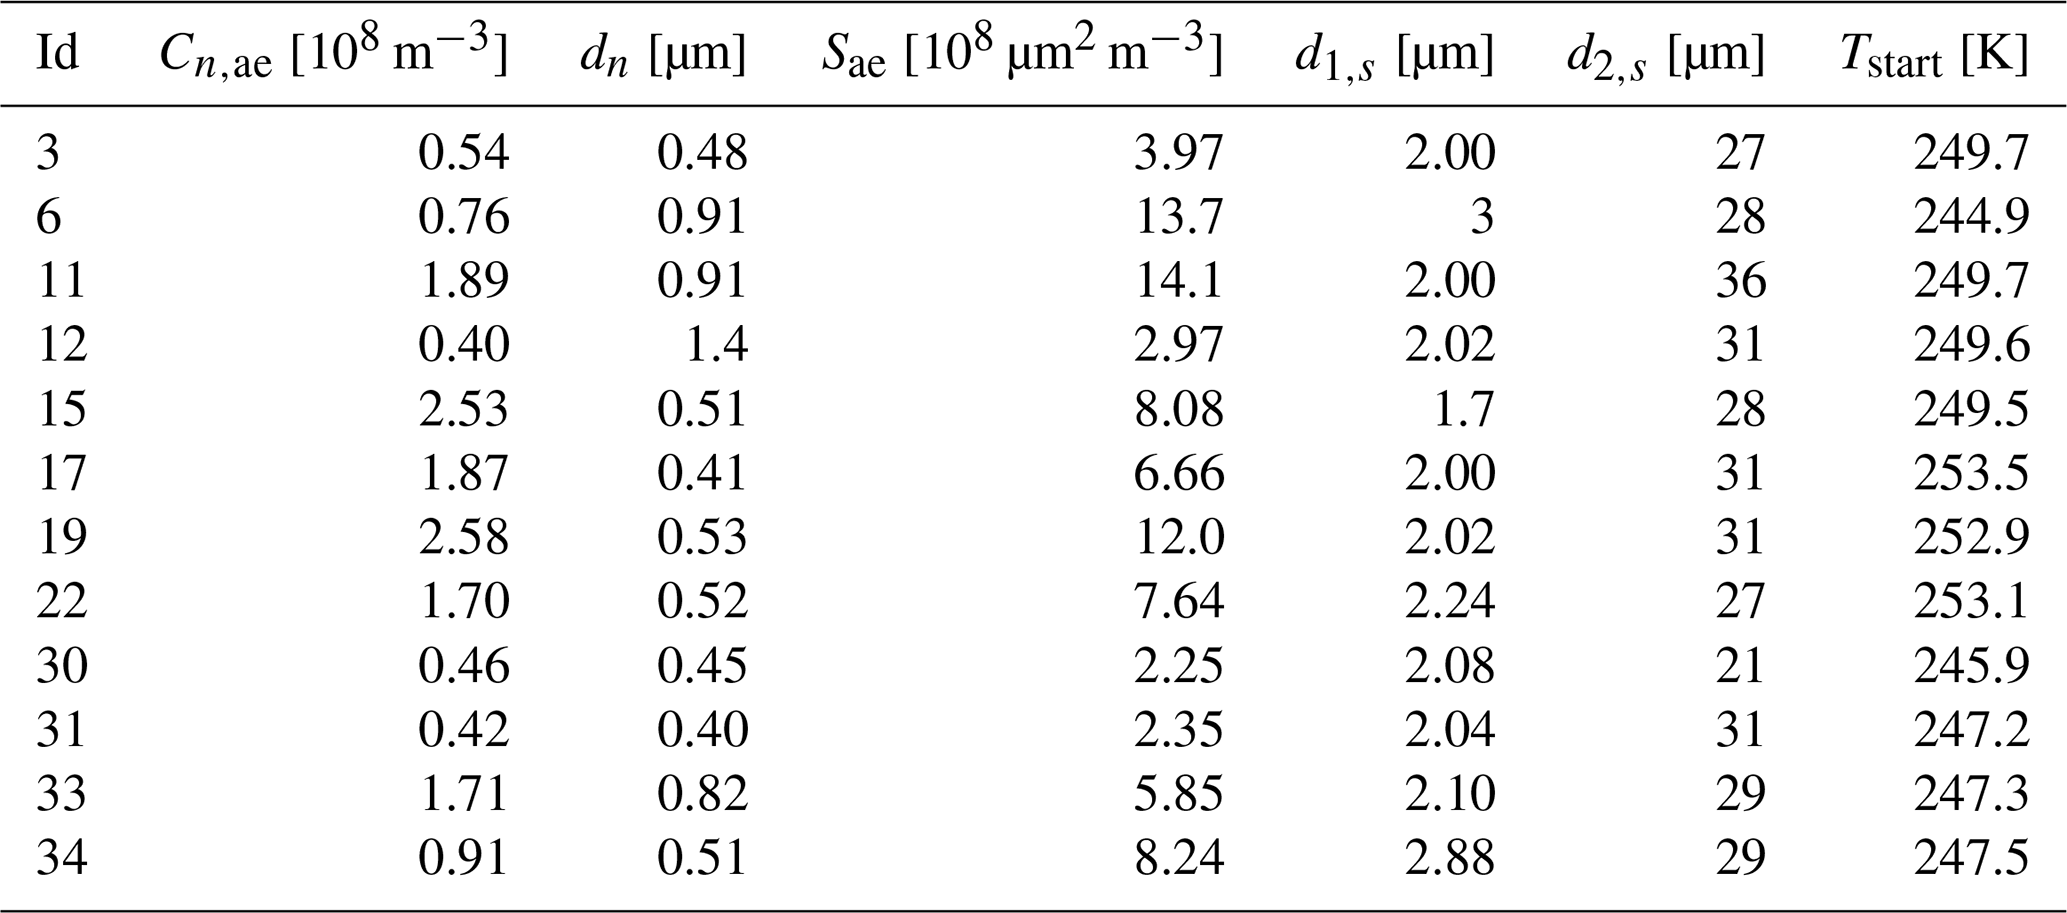
Table 2Conditions during the AIDA experiments conducted with Icelandic samples. Id: experiment identifier, Cn,ae: initial (before chamber expansion) total number concentration, dn: mean diameter for the number concentration size distribution, Sae: initial total surface area concentration, d1,s and d2,s mean diameter of the bimodal surface area size distribution, Tstart: temperature at which the first ice formation was observed.
2.2 MICOS campaign
The Dust-induced ice nucleation: Effects of MIneralogical COmposition and Size (MICOS) campaign took place from 21 November to 9 December 2022 with a total of 32 expansions in the Aerosol Interaction and Dynamics in the Atmosphere (AIDA) chamber. Our main focus was to study the ice nucleation activity of coarse ( µm) and super-coarse ( µm) particles defined in terms of the volume-equivalent (geometric) diameter (D). To this end, the INA of the samples was investigated using four complementary techniques, each fulfilling a distinct and necessary function that could not be covered by a single instrument. AIDA (Sect. 2.2.1) and INSEKT (Sect. 2.2.2) were used in combination to extend the temperature range of the INAS density measurements. While AIDA operates at colder temperatures, INSEKT reaches warmer temperatures through offline filter-based freezing assays, together providing a more complete characterization of the temperature dependence of ns. AIDAm (Appendix A) was used to characterize the temporal evolution of the INAS density at a higher temporal frequency than AIDA, by performing multiple consecutive expansions on aerosol sampled directly from AIDA. This is particularly relevant for the extended size range considered in this study, as larger particles are subject to gravitational settling inside the chamber, which could progressively alter the size distribution of the aerosol during an experiment and therefore affect the measured INAS density. The AIDAm time series therefore allowed to investigate whether the INA changed with changing PSD. Finally, the IR-DROFA (Sect. 2.3) provided an independent cross-check of the INAS density using a bulk suspension approach combined with BET-derived specific surface area measurements. This approach is complementary to the aerosol-based surface area estimates used in AIDA and INSEKT, and allows us to compare the derived ns values obtained with the different surface area estimation methods. The following sections describe each instrument and its specific measurement approach in detail.
2.2.1 AIDA cloud chamber
The AIDA chamber was an 84 m3 aluminum vessel located in a thermostatic housing. The chamber allowed the monitoring and control of relevant variables such as temperature, pressure, and humidity. Ice and water supersaturation conditions were achieved in the chamber by expansion cooling with a mechanical pump, enabling the particles to act as INPs or as CCN (Cotton et al., 2007). In addition, the temperature inside the vessel was monitored with five thermocouples located at different levels. Given the larger size and inertia of the particles we aimed to test, their injection, residence time, and measurement in the chamber posed challenges, because these particles settle more quickly and do not follow the airstream as smaller and lighter particles do. For this reason, a new injection method was implemented for AIDA, in which a valve was used to flush the aerosol samples into the AIDA vessel using synthetic air at 4 bar for 10 s. Once particles were injected into the vessel, the aerosol PSD was measured online with two aerodynamic particle sizers (APS, range 0.523–19.81 µm; TSI GmbH, USA), one on a horizontal and another on a vertical sampling line, and a scanning mobility particle sizer (SMPS, range 0.014–0.82 µm; TSI GmbH, USA) on a horizontal sampling line. The total particle number concentration in the chamber was measured with a condensation particle counter (CPC3010, TSI, USA) using the horizontal sampling line. To identify and measure ice, and to extend the measured PSD to larger sizes, we used two optical particle counters (OPC) Welas 1 (detection range 0.7–46 µm) and Welas 2 (detection range 5–240 µm; Palas GmbH). Figure 1 shows a schematic of the facility and the instruments used during the experiments. It is worth noting that the newly developed AIDA mini (AIDAm) (Vogel et al., 2022) was also used during our experiments. AIDAm enabled us to perform multiple consecutive expansions similar to the ones from AIDA for aerosol sampled directly from AIDA. The size distribution for AIDAm was obtained with the same approach used for AIDA as a combination of APS-SMPS and Welas OPC (Sect. 2.5), but using the APS-SMPS sensors within AIDA together with the OPC located inside AIDAm (Vogel et al., 2022). Experiments with samples from each location (Morocco and Iceland) were conducted at 3 different initial temperatures, each between 248.15 (−25 °C) and 257.15 K (−16 °C).
During each experiment in AIDA and before expansion, the aerosols particles inside AIDA were sampled on nuclepore filters for immersion freezing experiments with INSEKT (Sect. 2.2.2), extending the temperature range that is achievable with AIDA. All experiments consisted of the same steps: First, dust was injected into the chamber. During one hour, the aerosol number concentration distribution was measured every 6 min at constant temperature and pressure, sampling for INSEKT filters (Sect. 2.2.2) and electron microscopy (Sect. 2.6) at different sampling times, and performing multiple expansions with AIDAm. Second, to ensure sufficient aerosol concentration, particularly of the large size fraction, the same aerosol sample type was injected again, followed by the measurement of the PSD during the 6 min after injection. Subsequently, the AIDA expansion was carried out, in which temperature and pressure were decreased, leading to an increase in the supersaturation with respect to water and ice and promoting the droplet formation onto the particles and ice nucleation in immersion freezing mode. Once the expansion ended, AIDA was cleaned by pumping the chamber down to near-vacuum pressure and flushing it with purified air until residual particle and gas concentrations returned to background levels. According to Ullrich et al. (2017) and Vogel et al. (2022), the relative error for the INAS density obtained from AIDA and AIDAm is approximately 40 %. In most cases, two experiments were conducted per day. Tables 1 and 2 present an overview of the experiments conducted together with the corresponding temperature at which the first ice formation was observed.
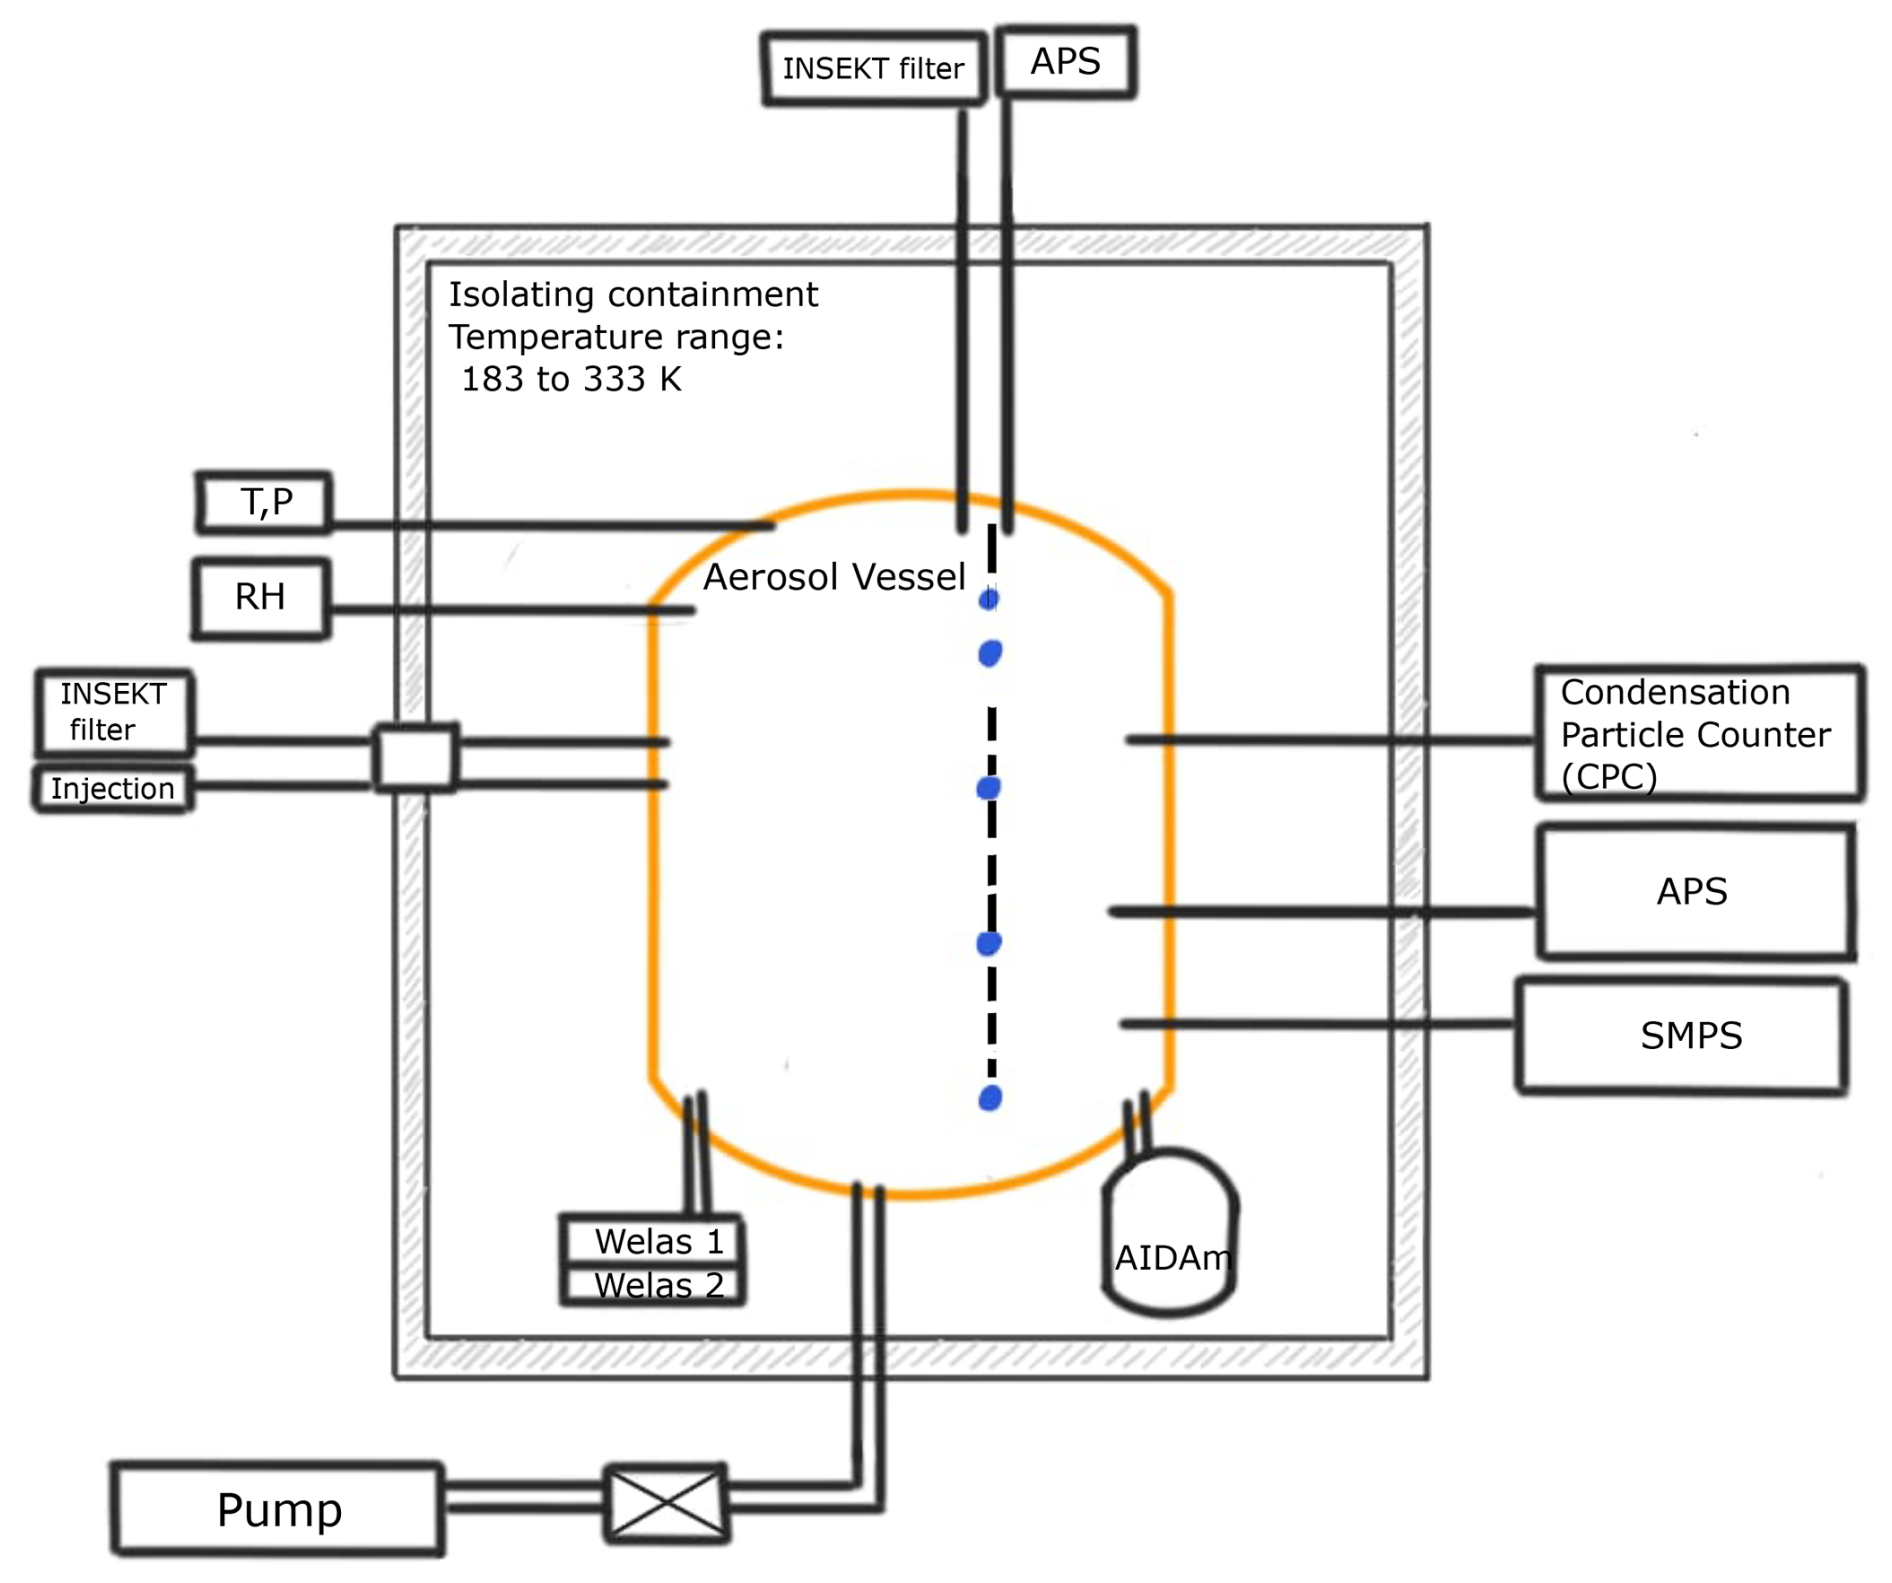
Figure 1Schematic representation of AIDA with the main instruments involved in the experiments.
2.2.2 INSEKT freezing assay
The Ice Nucleation Spectrometer of the Karlsruhe Institute of Technology (INSEKT) is a freezing assay, in which small volumes of clean water and aerosol solutions of interest are tested to determine their ice nucleation activity in immersion freezing mode as a function of temperature. A detailed explanation of the setup and working principle can be found in Schiebel (2017). The samples tested in INSEKT were collected from AIDA at two different locations, one at an intermediate height with a horizontal sampling line and the other one at the top of the chamber with a vertical sampling line (Fig. 1). The samples were collected on filters with a 0.2 µm mesh size (Whatman Nuclepore track-etched polycarbonate membranes, 47 mm) pretreated with a 10 % H2O2 solution and rinsed with deionized water. Filters using the vertical sampling line were sampled for 20 min, and those using the horizontal sampling line for 30 min prior to AIDA expansion. After sampling, the filters were stored in sterile petri dishes, wrapped in aluminum foil, and frozen. For INSEKT experiments, each selected petri dish was unfrozen and the filter was suspended in 8 mL nanopure water that had been passed through a 0.1 µm syringe filter. Subsequently, the solution was placed on a rotator for 20 min. After concluding the rotation, the solution and 10 times dilution were prepared to extend the temperature at which ice nucleation occurs; later, 50 µL volumes were pipetted into 192 wells of two polymerase chain reaction (PCR) plates. The PCRs were introduced into the freezing mechanism and cooled at a constant cooling rate of 0.33°C min−1. The freezing of wells was detected through changes in brightness using a camera mounted vertically and parallel to the plates (EO-23122, Edmund Optics monochrome camera). To rule out impurities in our samples, control freezing experiments were performed in which wells containing pure water were tested to verify that freezing due to impurities in the water was low compared to the freezing observed in the samples. At each temperature interval, INP concentrations were obtained based on the frozen fraction of the wells, i.e. the number of frozen wells divided by the total number of wells (Vali, 1971), as (Schiebel, 2017)
where Cn,INP,corr(T) is the INP concentration at temperature T, η is the dilution factor, Vwell is the volume of each well, Vsol is the volume of the solution in which the filter was immersed, Vair is the volume of air used to sample the particles to the filter, Nu(T) and Nu,bgr(T) are the number of unfrozen wells for the aerosol solution and water control at temperature T (where bgr stands for background), respectively, and Nall, Nall,bgr are the initial amount of wells for the aerosol solution and water control, respectively. INSEKT measurements of INAS density have an error of about 70 % (Vogel et al., 2022).
2.3 Droplet-based INAS density measurements
Additional measurements of INAS density were conducted using a modified version of the droplet freezing assay (IR-DROFA) setup. The basic configuration of this instrument is described in Peckhaus et al. (2016). The modified version includes an infrared (IR) camera (model PI640i, OPTRIS GmbH), which is used to detect the temperature jump associated with the release of latent heat upon freezing of a suspension droplet. Suspensions were prepared using the samples sieved through a 20 µm mesh. Droplets with a volume of 17 nL were deposited onto a 10 × 10 mm2 Si wafer in a square array consisting of 80 to 95 individual droplets. The fraction of frozen droplets as a function of temperature was measured using an initial suspension with 1 wt %, which was then diluted tenfold twice, resulting in suspensions with concentrations of 0.1 wt % and 0.01 wt %. Each IR-DROFA measurement was performed twice at a cooling rate of 3 K min−1.
2.4 Surface area estimation
In order to obtain the differential nucleus concentration (k(T)) or the cumulative nucleus concentration, INAS density (ns(T)) (Sect. 2.7) the surface area of the particles is needed. Previous studies have assumed that mineral dust particles can be approximated to spherical shapes (Niemand et al., 2012; Ullrich et al., 2017). However, newer studies on the shape of mineral dust have found that ellipsoids are better shape approximations (Chesler et al., 2023; Huang et al., 2023; González-Romero et al., 2024). Furthermore, the deviation of the aspect ratio (AR) from unity (AR-1) and the height-to-width ratio (HWR) of these ellipsoids both follow a log-normal distribution (Huang et al., 2020). Using ellipsoids as approximation for mineral dust shape, we computed the surface area using the globally averaged values of the AR and HWR distributions, i.e. a median AR of 1.70 ± 0.03, a median HWR of 0.40 ± 0.07, a geometric standard deviation for AR-1 of 0.70 ± 0.02 and for HWR of 0.73 ± 0.09 (Huang et al., 2020). Following a similar procedure as in Huang et al. (2020), volume-equivalent (geometric) diameters of ellipsoidal dust particles were obtained with Monte Carlo sampling from the AR-1 and HWR log-normal distributions. The surface area of each generated ellipsoidal dust particle is computed. Then, particles with the same volume-equivalent geometric diameter are grouped and the mean surface area is obtained. Figure 2b presents the surface area for the volume-equivalent geometric diameter for both ellipsoidal and spherical shapes. Larger differences in surface area between spheres and ellipsoids become noticeable at approximately 30–40 µm.
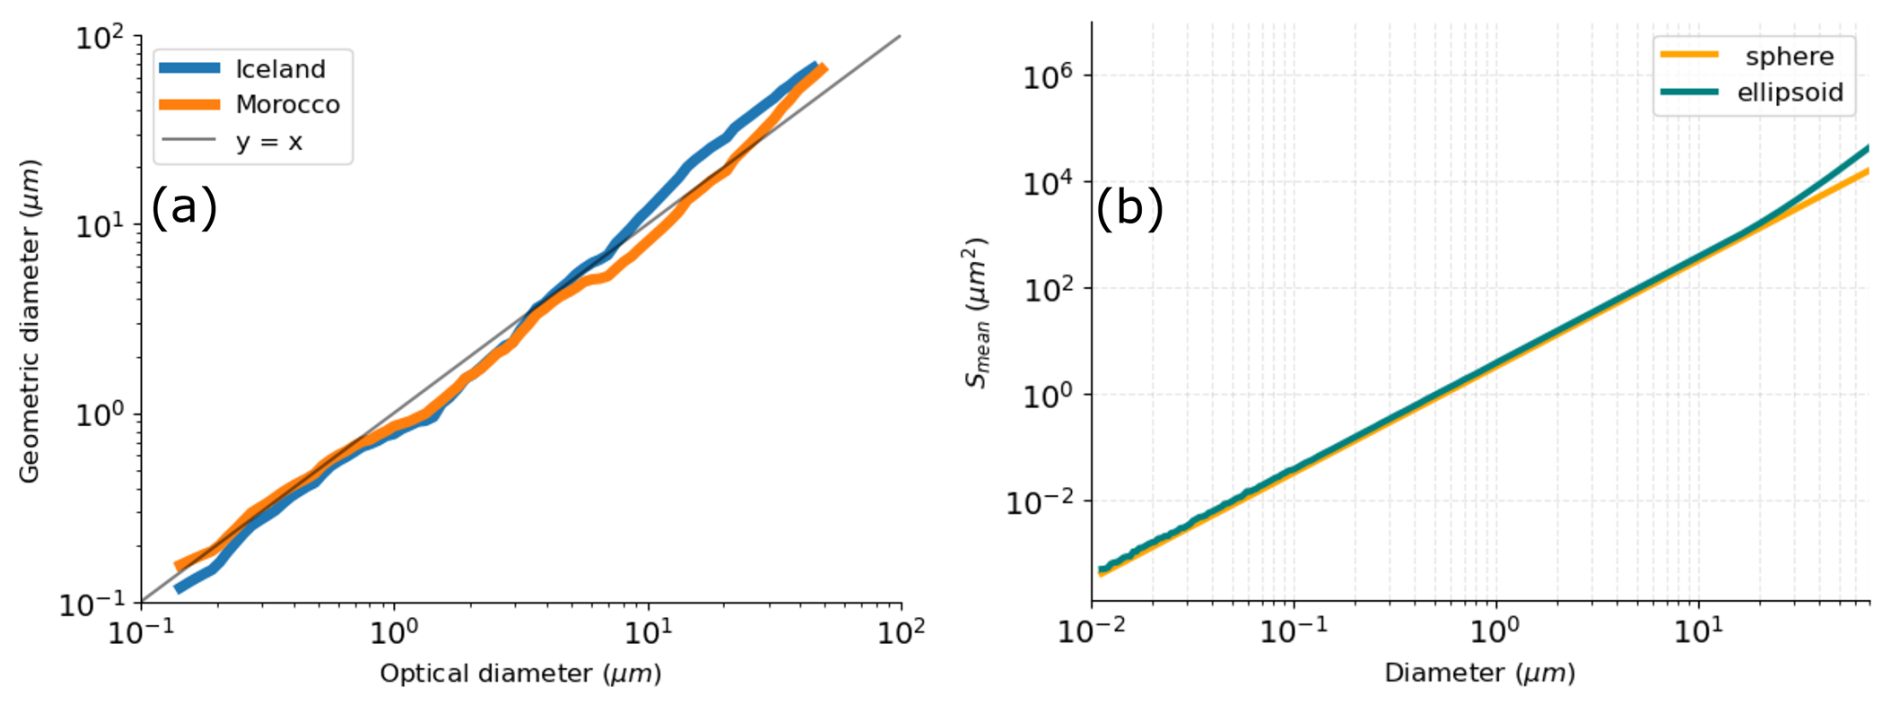
Figure 2(a) Relationship between optical and geometrical diameter for Morocco and Iceland. Optical sensor with wavelength center at 0.44 µm, and 85 to 95° scattering angle, (b) Surface area, Smean, as a function of volume-equivalent diameter assuming spherical and ellipsoidal shapes for globally averaged values of mineral dust AR and HWR distributions.
2.5 Dust aerosol particle size distributions in AIDA and AIDAm
The dust aerosol number PSDs were obtained with APS, SMPS, and OPC. One APS was located at the top of the chamber sampling with a vertical line, and another APS and SMPS were located at an intermediate height sampling with a horizontal line. The additional vertically sampling APS was installed to identify and avoid possible losses from gravitational settling in the horizontal lines. For large particles, the number PSDs were measured with Welas 2 (an explanation of the threshold used is provided below). SMPS and APS were combined by merging overlapping size bins. The size distribution of the mobility diameter from the SMPS and the size distribution of the aerodynamic diameter from the APS were converted to size distributions of the volume equivalent (geometric) diameter, defined as the diameter of a sphere that has the same volume as the measured particle, independent of its actual shape. Welas measurements were converted from optical to geometric diameter considering triaxial ellipsoidal shapes. The complex refractive index for Morocco was set to , where the real part 1.49 accounts for the refraction (phase velocity) and the imaginary part 0.0015 for the absorption (González-Flórez et al., 2023). For Iceland, the complex refractive index was set to (Baldo et al., 2023). Combining the properties of our optical sensor (González-Flórez et al., 2023), with a wavelength centered at 0.44 µm, and a scattering angle from 85 to 95°, and the refractive index of our samples, the conversion from optical to geometric diameters was carried out based on Table S1 reported in Huang et al. (2021). Figure 2a depicts the relationship between optical and geometrical diameter for the characteristics of our sensors and samples. It can be observed that for sizes smaller than 1 µm the geometric and optical diameters are similar. However, for larger sizes, the relationship changes. Initially, the optical diameter is smaller than the geometric diameter up to approximately 7 µm, and becomes larger thereafter.
To reduce measurement noise and minimize rapid fluctuations in concentration, particularly for smaller particle sizes, bin averaging was applied to the SMPS-APS data. After converting both datasets (SMPS-APS and Welas) to their respective geometric diameters, they were overlaid for comparison. Due to the reduced efficiency of the APS at larger particle sizes (beyond ≈3–4 µm), a decline in measured particle counts is observed, while Welas reported higher concentrations at the same diameters. We used the intersection of measurements from APS and Welas, i.e. the transition point where the APS measurements fall below those of the Welas, as the threshold beyond which we utilized Welas data. However, due to the decreased efficiency of both instruments near their overlapping zone, the merged size distributions often exhibit an unrealistic dip in the transition region. However, this does not significantly affect the final results (see Sect. 3.2). Additionally, two other issues were encountered during the measurement of PSDs in AIDA. The first was the presence of residual monodisperse polystyrene latex (PSL) spheres used for calibrating the optical sensors. The second was that the CPC measured a lower particle concentration than the optical sensor during expansion, which is not physically realistic because the CPC's measurement range is broader than that of the optical sensor. The first issue was easily addressed, as the PSL particles exhibited a characteristic and clearly noticeable peak at the same diameter in all measurements, making them easy to identify and exclude from the PSD. The second issue was resolved by scaling the initial PSD (prior to expansion) to the maximum concentration observed during expansion. This approach is justified based on a common assumption in AIDA experiments, in which all particles nucleate into CCN. Therefore, the total particle number before and after expansion is conserved. Figures 3 and 4 show the surface area size distribution of the samples injected into AIDA, as well as the mean surface area size distribution of multiple experiments with the same sample ID for samples in AIDAm. The mean values and standard deviations of the multiple expansions in AIDAm are shown in Figs. A2 and A3 for Morocco and Iceland, respectively, prior to expansion for each experiment, as obtained using the approach described earlier. It is important to mention that due to technical problems with AIDAm in 7 out of 30 experiments (IDs 5, 10, 11, 12, 14, 20, and 21), no AIDAm expansions were carried out in those experiments. Additionally, Figs. 3 and 4 present the surface area distribution measured with laser diffraction (LD, Sect. 2.1) after sieving the samples. Although it relies on a different measurement principle than the other sensors, laser diffraction yields PSDs that are in reasonable agreement with those obtained from the combined SPMS-APS-Welas approach. The largest differences between the two methods are observed for IDs 5, 9, 10, 12, and 34, where the surface area distribution obtained with the combined instruments (SMPS-APS-Welas) tends to show higher values for diameters larger than 10 µm than the LD distributions. Conversely, experiment ID 29 exhibited a different behavior compared to both the combined instruments (IDs 25 and 28) and the LD technique. The reasons for this behavior are not clear.
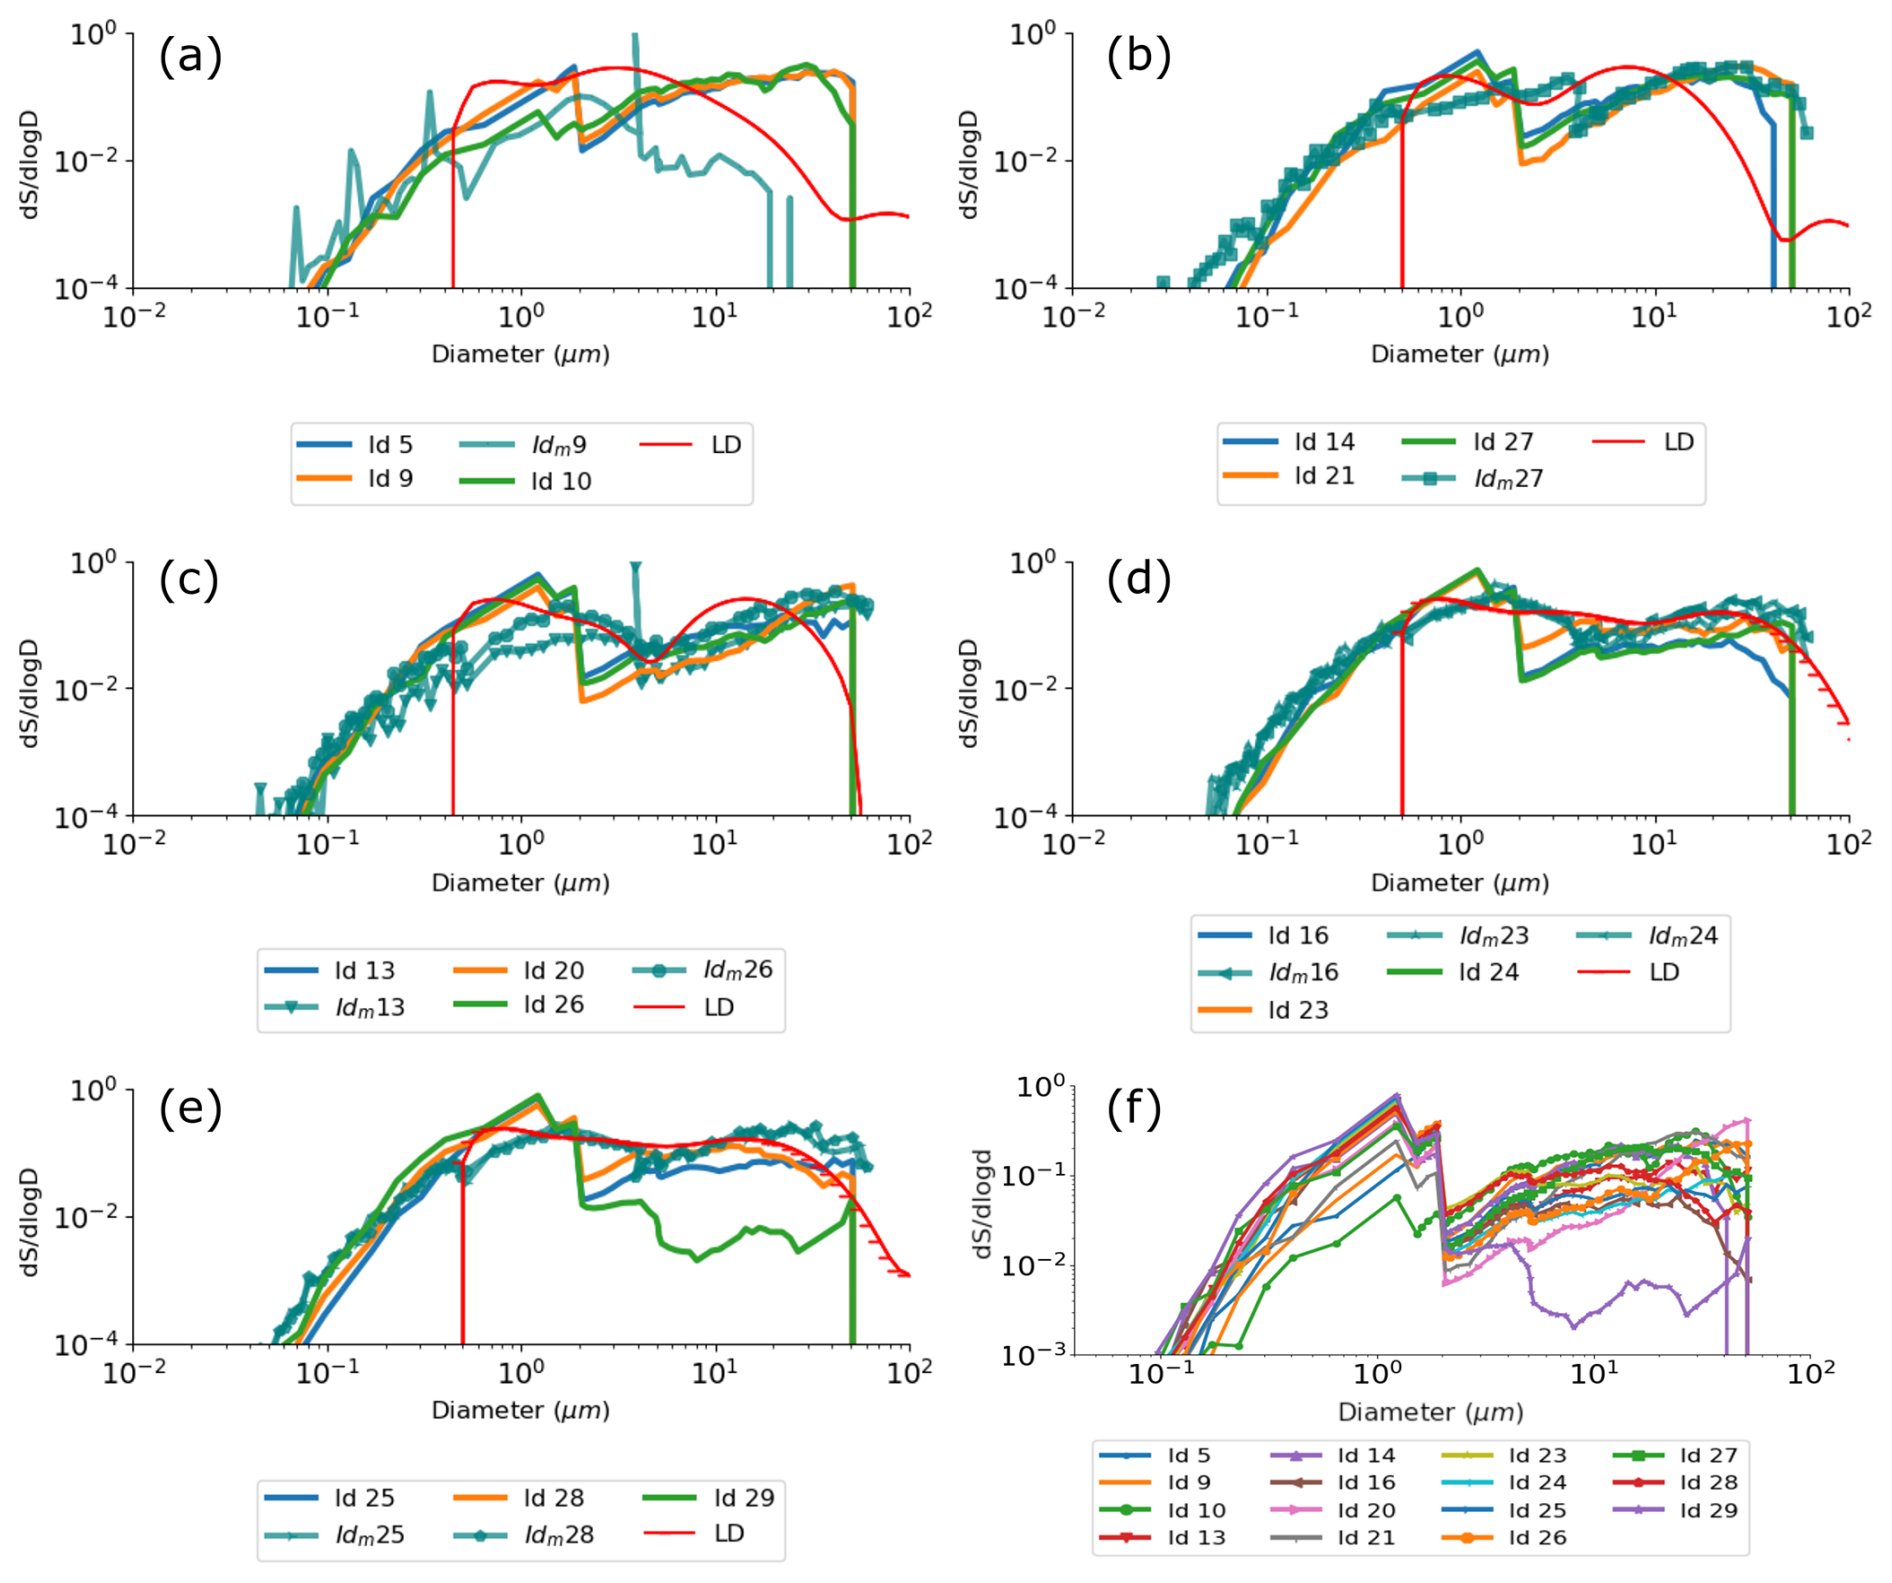
Figure 3Normalized surface area distribution measured during a 5 min interval directly before AIDA (ID) and AIDAm (IDm) expansion for Morocco for experiment (a) ID: 5, 9, 10, IDm: 9; (b) ID: 14, 21, 27, IDm: 27; (c) ID: 13, 20, 26, IDm: 13, 26; (d) ID and IDm: 16, 23, 24; (e) ID: 25, 28, 29, IDm: 25, 28; and (f) for all experiments in AIDA. Additionally, the surface area distribution measured with laser diffraction (LD) technique after sieving the samples presented. The experiments are grouped according to the stage of the cascade impactor they were obtained with.
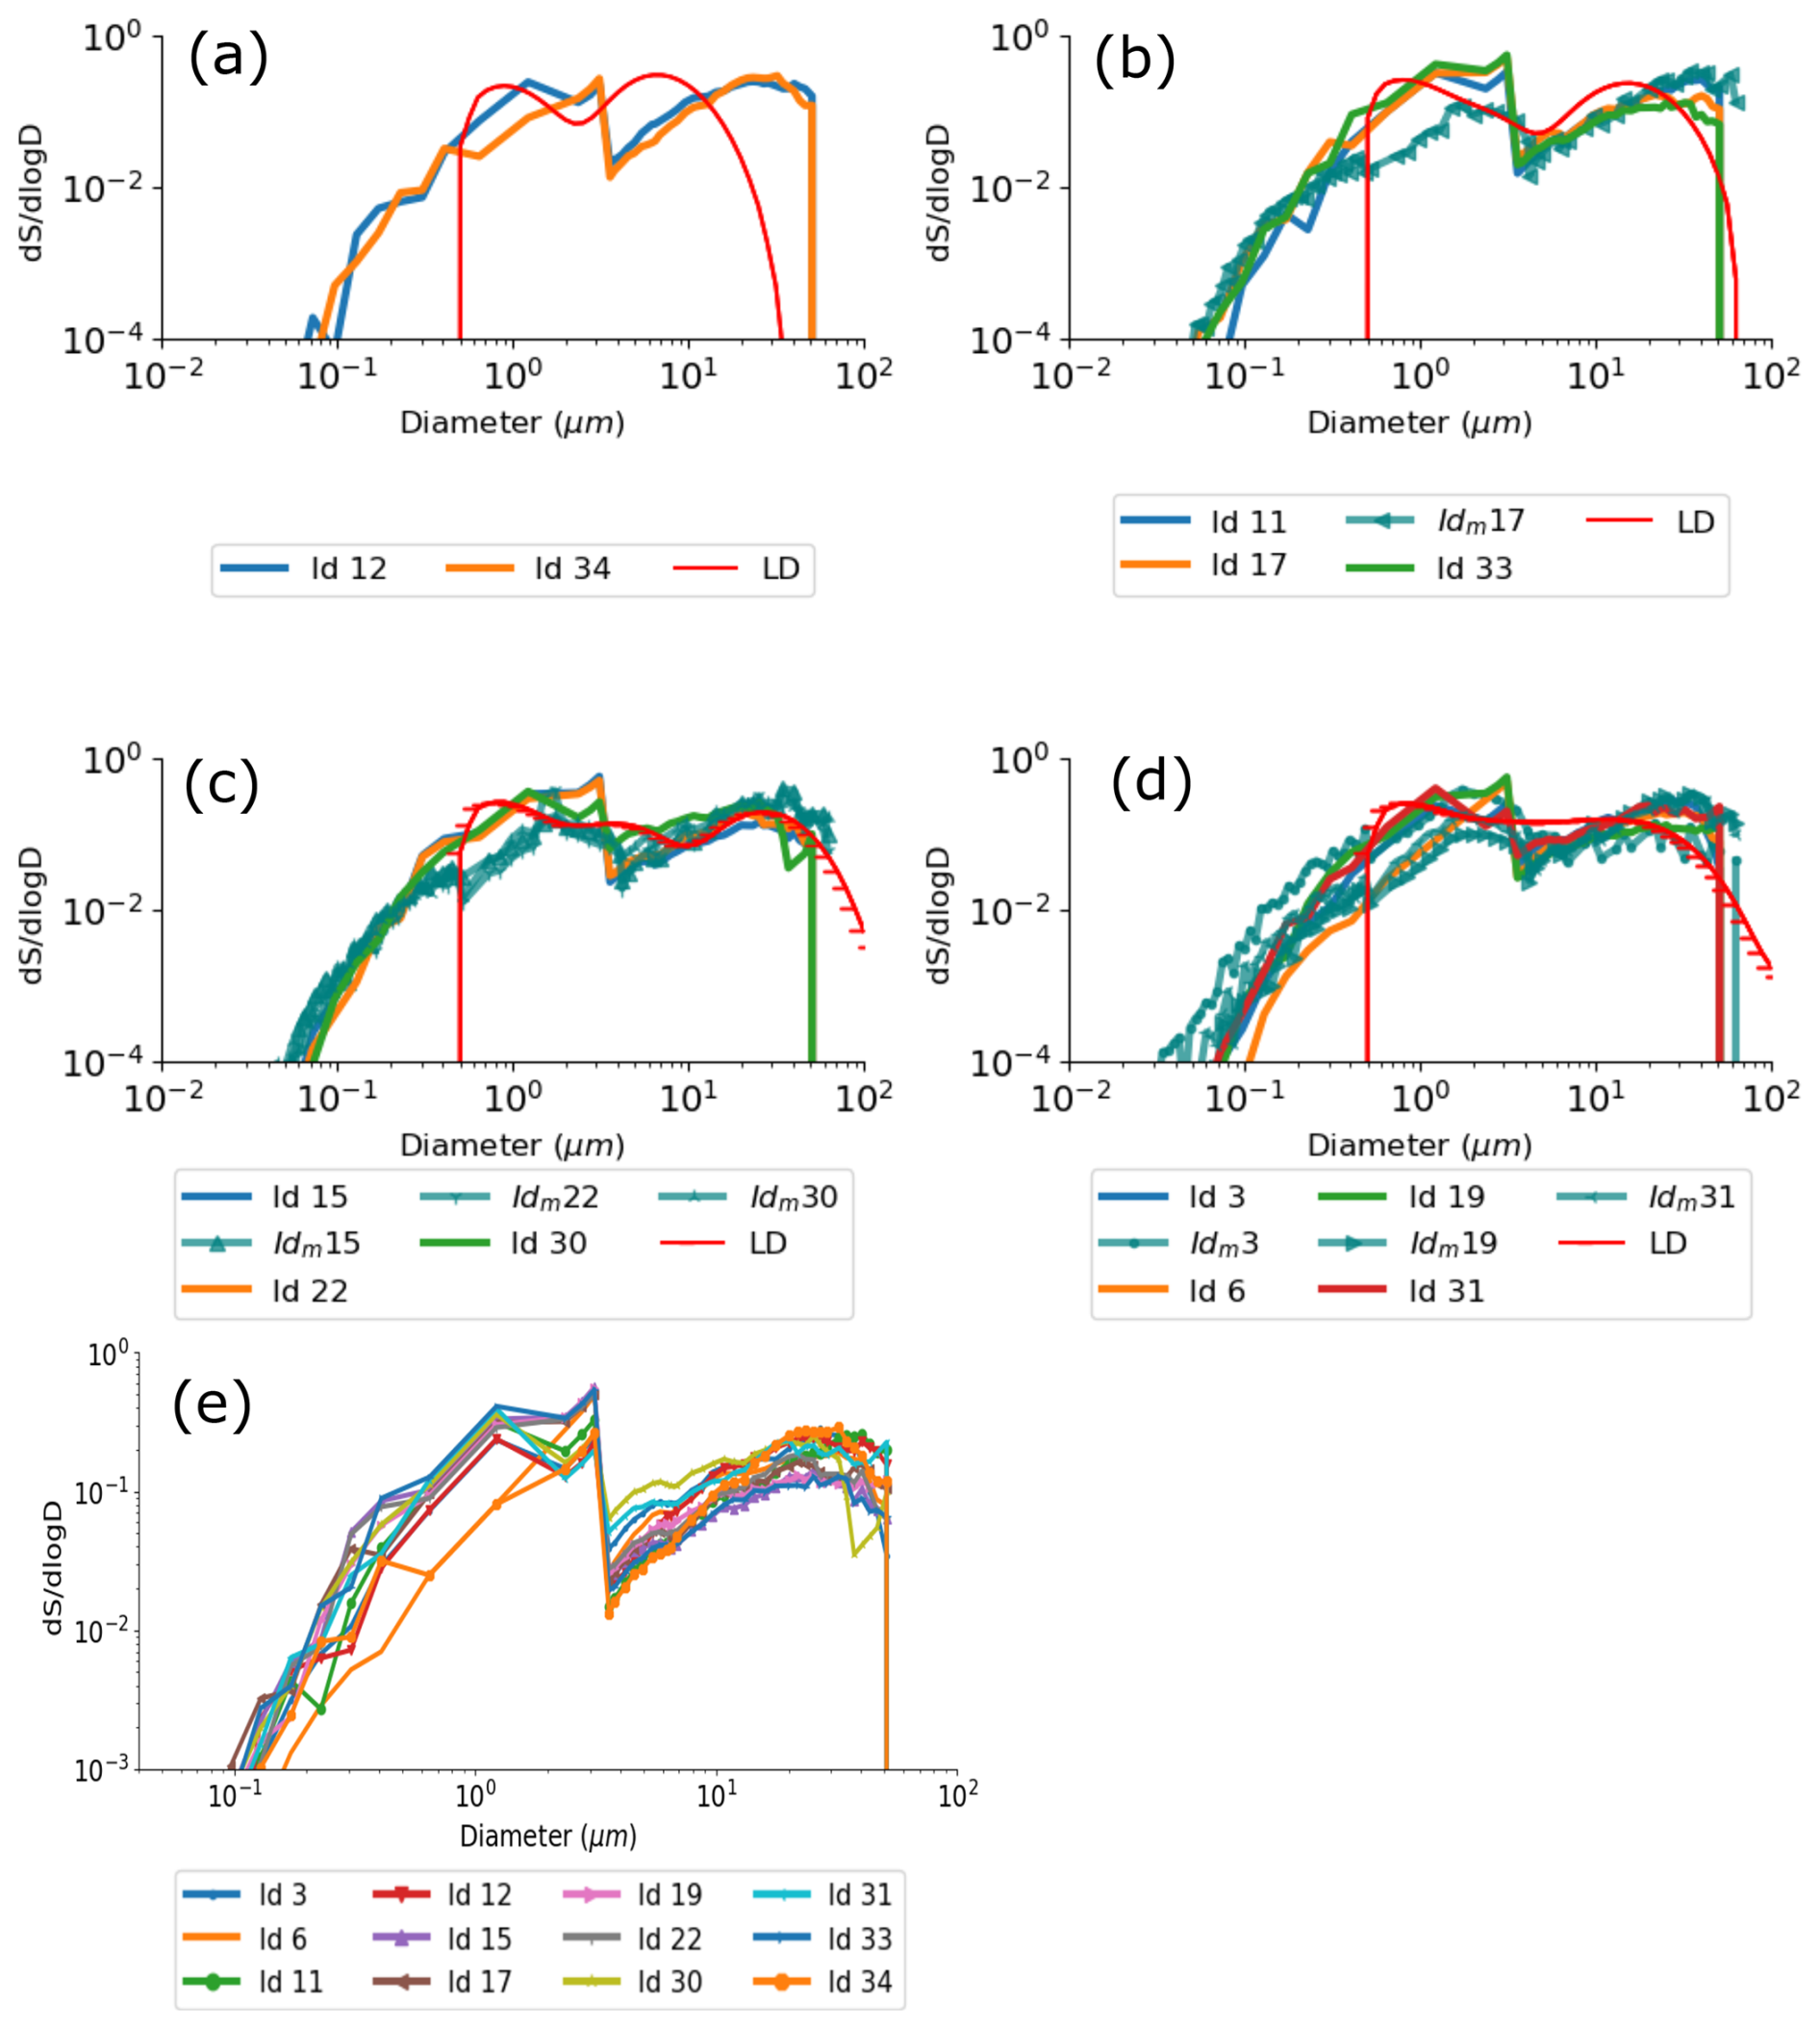
Figure 4Normalized surface area distribution measured during a 5 min interval directly before AIDA (ID) and AIDAm (IDm) expansion for Iceland for experiment (a) ID: 12, 34; (b) ID: 11, 17, 33, IDm: 17; (c) ID and IDm: 15, 22, 30; (d) ID: 3, 6, 19, 31, IDm: 3, 19, 31; and (e) for all experiments in AIDA. Additionally, the surface area distribution measured with laser diffraction (LD) technique after sieving the samples presented. The experiments are grouped according to the stage of the cascade impactor they were obtained with.
2.6 Specific surface area measurements and particle morphology
In addition to the surface area estimates obtained using the methods described in Sect. 2.4 and 2.5, the specific surface area (SSA) and porosity of samples from Morocco and Iceland sieved to 20 µm was determined with the Brunauer–Emmett–Teller (BET) method (Brunauer et al., 1938) using the Anton Paar (Quantachrome) Autosorb iQ device. The analysis was performed for N2 and H2O gases with cell type 9 and 6 mm w/o rod, respectively. Characteristics of the measurement of each sample and gas and the measurement results are summarized in Table 3.
Table 3Preparation and measurement conditions for BET experiments using N2 and H2O as adsorbates, including the resulting specific surface area (SSA BET (multipoint)), pore volume, and pore modes.
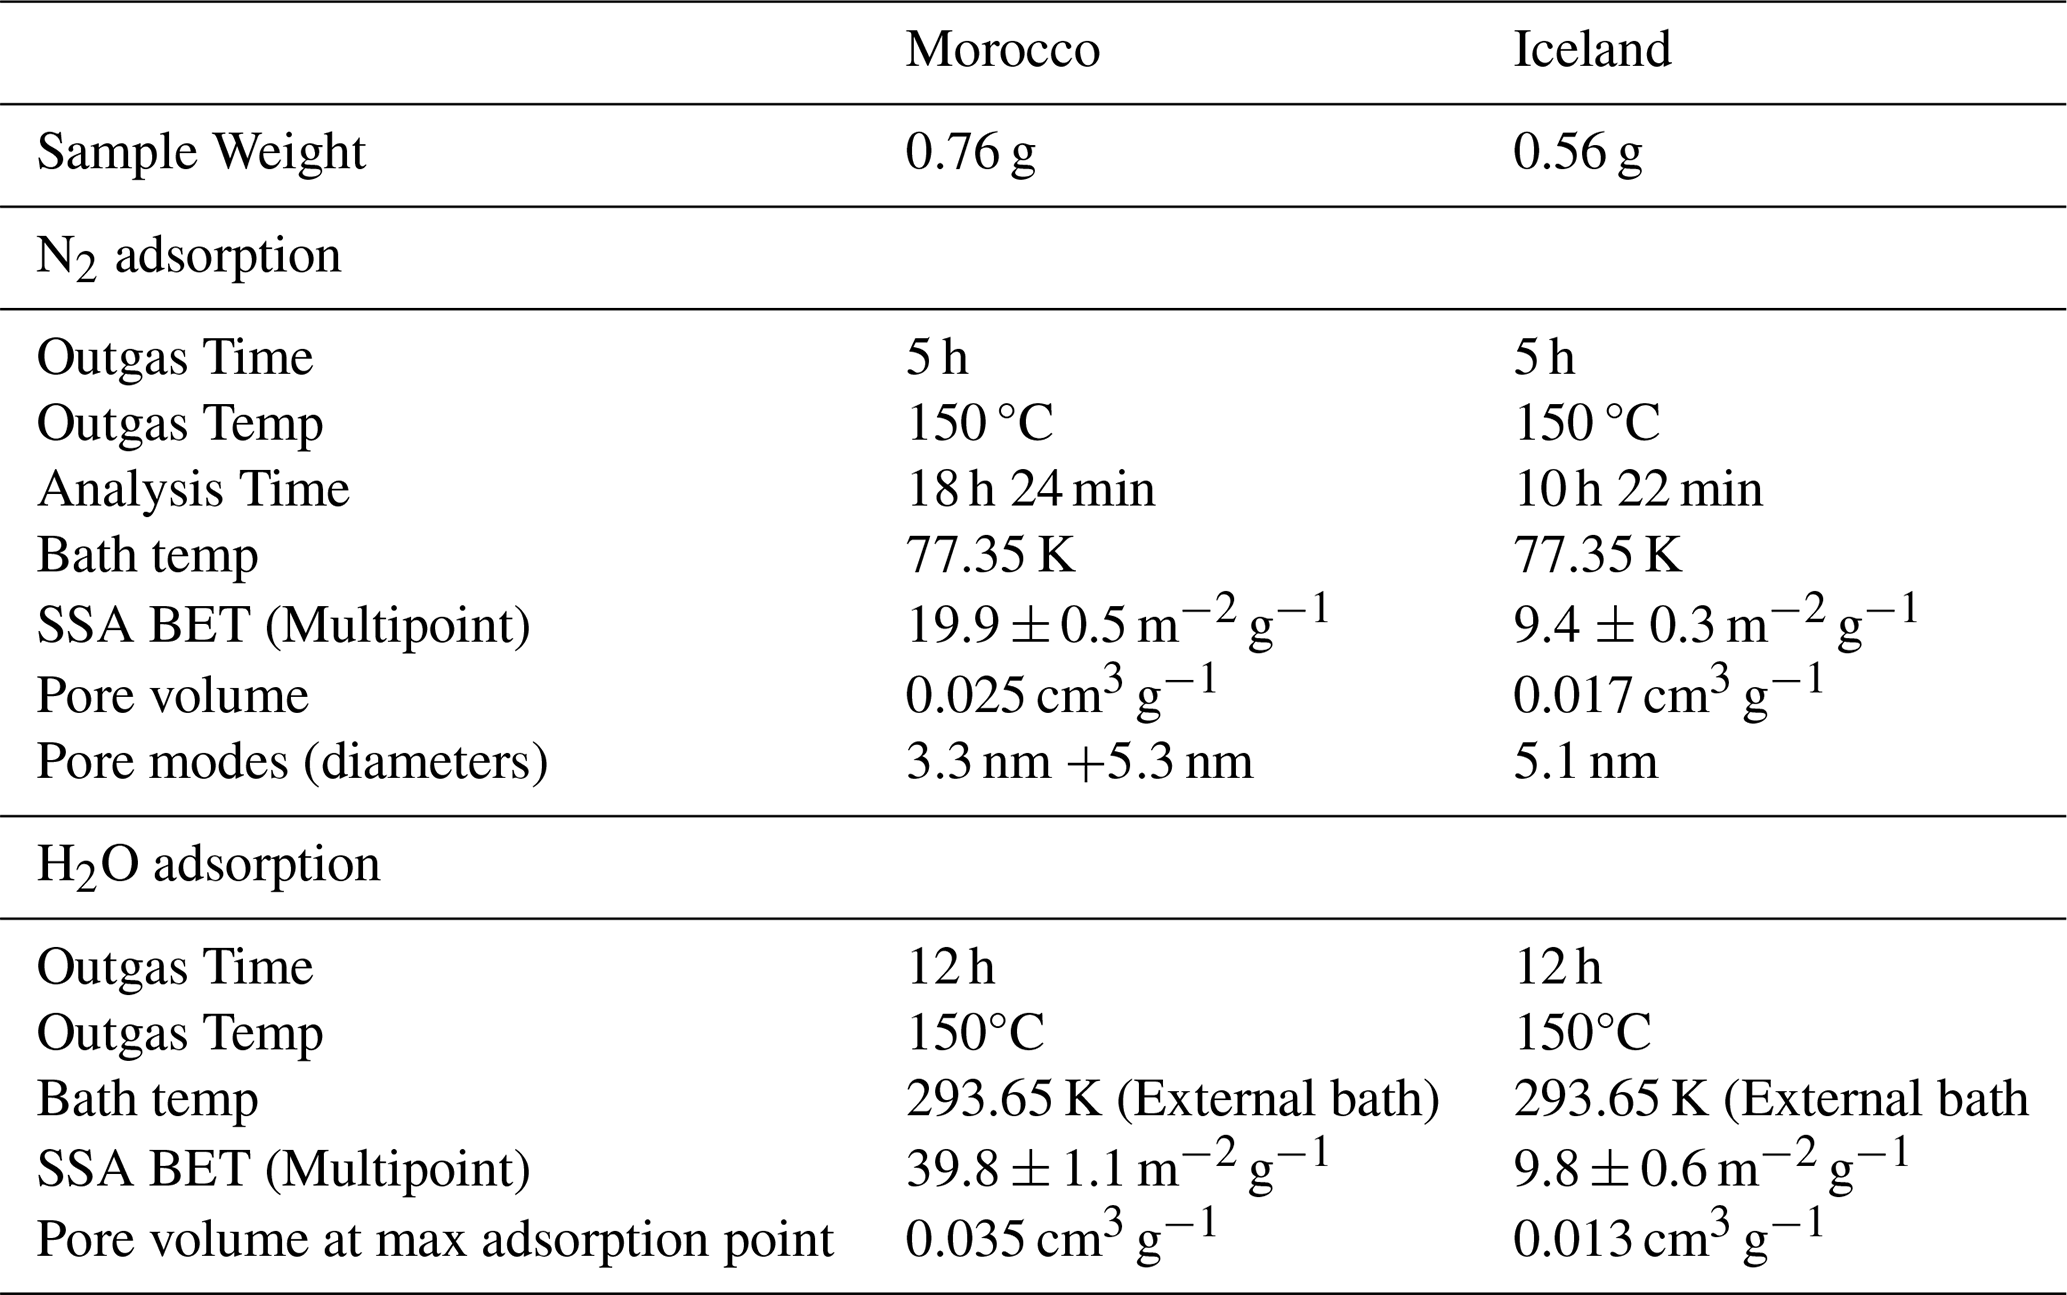
Particle morphology was investigated with scanning electron microscopy (SEM, ThermoFisher Scientific, ESEM FEI Quattro S) on a single analyzed filter collected with the vertical sampling for experiment IDs 20 and 22 for Morocco and Iceland, respectively. All samples were collected on a Nuclepor® membrane filter, pore size 0.2 µm, and coated with 1.5 nm Pt before analysis. Most Icelandic dust particles are compact agglomerates of densely packed plate-like fragments as shown in Fig. 5a and b. In contrast, Moroccan particles are either solid particles (presumably mixtures of chlorite, plagioclase, clays, among others) as shown in Fig. 5c or porous loosely packed agglomerates of nanometer-size fragments, the composition of which is characteristic for montmorillonite (Fig. 5d). The presence of swelling phyllosilicate (montmorillonite) and the intrinsic porosity of such particles is likely responsible for (1) the enhanced gas adsorption capacity of Moroccan dust (Appendix B), and (2) the strong difference of SSA measured with N2 and water vapor, which is not observed for Icelandic dust (Table 3). However, it is important to note that the SEM analysis performed on these samples does not allow for a quantitative estimation of the frequency of agglomerates. A preliminary estimate suggests that the agglomerate frequency lies between 5 and 10 % (Appendix B2). However, the frequency distribution of agglomerates across sizes is not considered. Consequently, the increased adsorption observed in the Moroccan samples cannot be unambiguously attributed to the presence of agglomerates, and further tests are required.
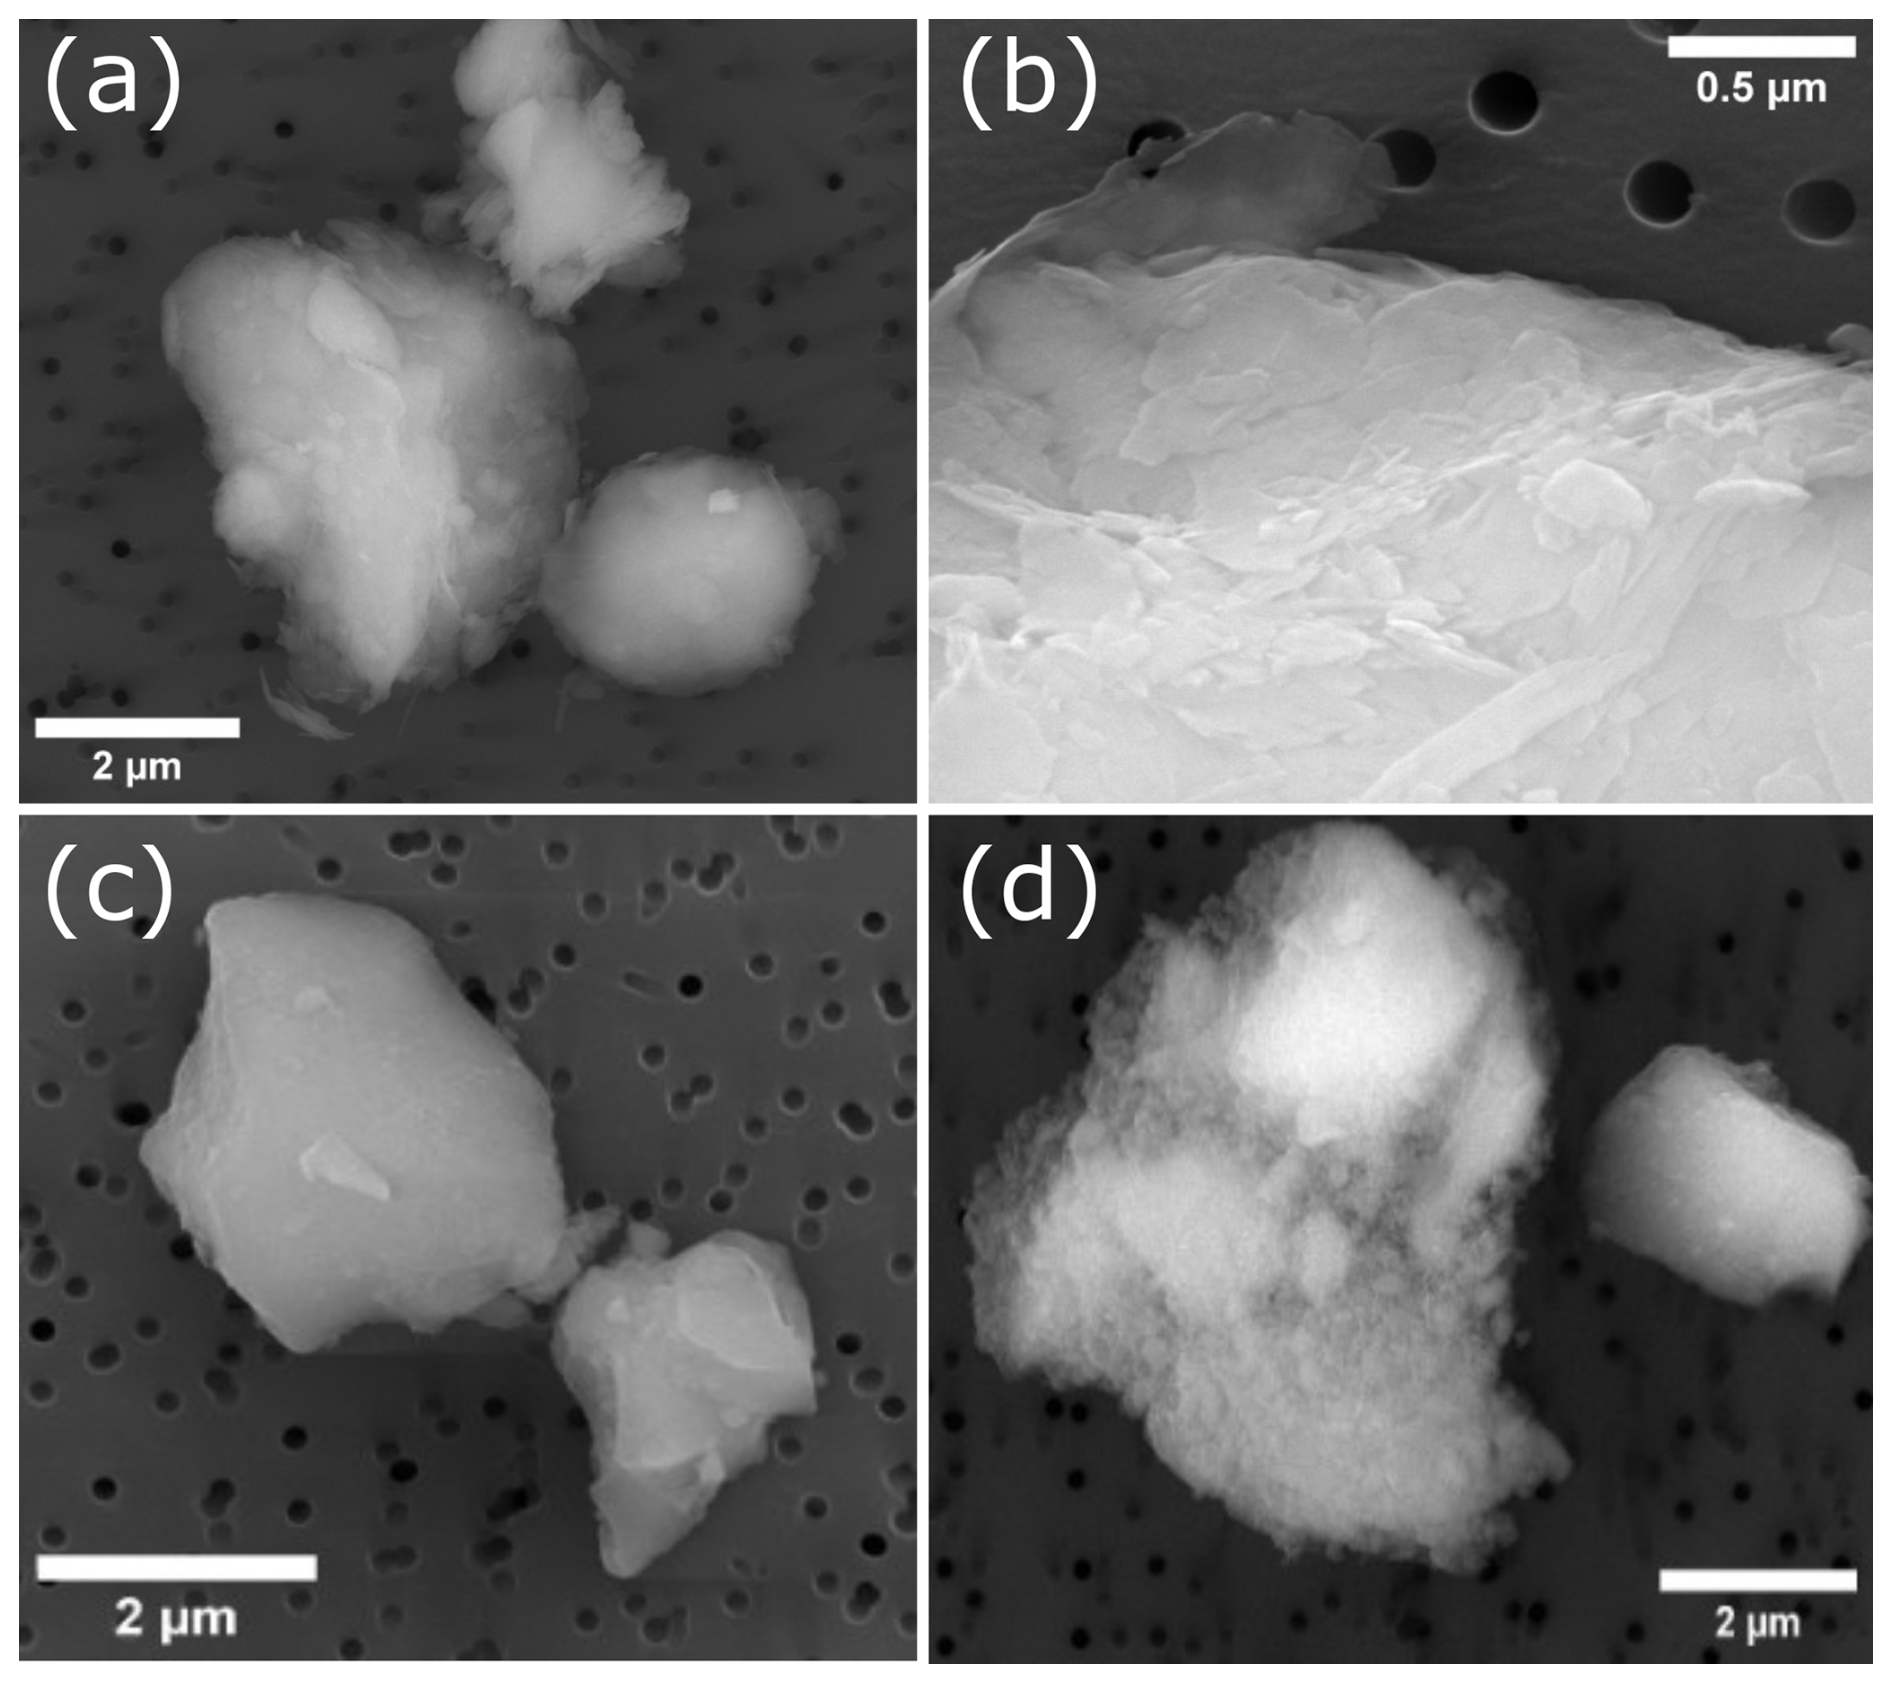
Figure 5SEM images for particles from Icelandic dust sampled in experiment ID 22: (a) a loose aggregate of three particles (Backscattered Electron Detector, BSE). The chemical composition (in atomic fractions O 73 %, Si 14 %, Al 8 %, Fe 1.5 %, Mg 2.6 %, K 1 %, Ca 0.5 %) is characteristic for phyllosilicates like kaolinite and is consistent with the plate-like agglomerate morphology, (b) surface detail (Secondary Electron Detector, SED). For Morocco ID 20: (c) the compact solid particle, SED detector, atomic composition O 70.6 %, Na 0.2 %, Mg 7.6 %, Al 1.3 %, Si 13.2 %, Ca 5.2 %, Fe 1.7 %, possibly a mixture of chlorite and a pyroxene, (d) image (BSE detector) of a loose porous particle, with atomic composition O 73 %, Fe 1 %, Na 1 %, Mg 2 %, Al 5.6 %, Si 14.4 %, Ca 3 %, suggesting a smectite (probably montmorillonite). Both particle types (chlorite and a pyroxene) are present in the sample, but the relationship cannot be estimated based on the analysis of a few particles.
2.7 Differential nucleus concentration and ice nucleation active site (INAS) density
Assuming that ice nucleation occurs at the interface between the particle and the liquid droplet in which it is immersed, the particles have a characteristic number density of ice nucleation active sites (ice nuclei) on their surface at which ice germs form at defined temperatures, i.e. ice formation occurs at this site instantaneously once the characteristic temperature is reached. Considering the average number of ice nuclei that are active in an infinitesimal change of temperature on the surface of a particle, the differential nucleus concentration (Vali, 1971) is defined as
where k(T) [] is the differential nucleus concentration of active sites per surface area and temperature change at temperature T, Sarea is the surface area of the particle, and N0 is the number of unfrozen droplets at temperature T. It is worth noting that the use of the original equation proposed by Vali (1971) has been altered changing volume to surface area (Vali, 2014). It is possible to relate the change in the number of frozen and unfrozen droplets through d, with dN being the change in the number of unfrozen and dNf that in the number of frozen droplets. Considering that the probability of finding one or more active sites within dT follows a Poisson distribution (Vali, 1971) and noting that the presence of one or more active sites on the surface of the particle at temperature T leads to the freezing of the droplet, we obtain for a monodisperse aerosol
It is possible to extend Eq. (3) to the case of a polydisperse aerosol as
with j being the jth size bin and p the number of size bins in the distribution. A common metric used to express the ice activity of particles is the cumulative nucleus concentration, also called INAS density, ns(T), which represents the number of active sites per surface area between temperature T to T+dT. It is possible to obtain ns(T) in two different ways. The first involves the use of Eq. (2) and the relationship . By integrating Eq. (2) and extending it to a polydisperse aerosol population, Eq. (5) is obtained:
Noting the similarities of Eqs. (4) and (5), the procedure to obtain either k(T) or ns(T) is the same. Expressing the exponential term as a Taylor series, we obtain:
where fj is dNf,j or Nf,j, qj is N0,j(T) or N0,j, and bj is k(T)Sarea,jdT or ns(T)Sarea,j, respectively, for Eqs. (4) or (5). Assuming that both k(T) and ns(T) are independent of particle size, and that and , non-linear terms can be neglected, which leads us to the approximated equations for k(T) and ns(t):
The second method consists of computing k(T) according to Eq. (7a) (linear approximation) and from there estimate ns(T) as
where q represents the number of ΔT intervals required to arrive at T from the initial temperature T0, and kh is the differential nucleus concentration at temperature Th.
In this section, we present the results obtained from the ice nucleation experiments performed with AIDA, INSEKT, and IR-DROFA. In Sect. 3.1, we explore how the values for ns obtained with different approaches and assumptions differ and under which circumstances the results agree. In Sect. 3.2, the results from AIDA and INSEKT for Moroccan and Icelandic samples are discussed considering the differential (k(T)) and cumulative (INAS density, ns(T)) nucleus concentrations. Additionally, all experiments from AIDA and INSEKT techniques are combined to obtain a parameterization that best represents the data, considering the dependence of INAS density on temperature. Finally, in Sect. 3.3 the results from IR-DROFA using SSA are presented and contrasted with the other techniques. Experiments conducted with AIDAm were not used for deriving the parameterizations. This is because the reported values obtained with AIDAm exhibited a bias that is not fully characterized with respect to the flow rate, leading to larger discrepancies in the reported INAS values compared to AIDA (Vogel et al., 2022). Therefore, AIDAm results were used to investigate the impact of temporal changes in the dust PSD on ice-nucleation activity, rather than on their absolute values. AIDAm experiments showed consistent INAS density values for the same sample over the full-time period covered by the multiple expansions (≈ 5000 s, Fig. A1). Additionally, the INAS density values obtained with AIDAm exhibited a systematic shift of 6–7 K relative to those measured with AIDA for both Morocco and Iceland samples. The complete AIDAm results are presented in Appendix A.
3.1 Influence of nonlinear terms on ns
As presented in Sect. 2.7, the use of Eqs. (7a) and (7b) assumes that the exponential of Eqs. (4) and (5) are much less than 1. Given that we are considering particle sizes that expand over three orders of magnitude (i.e. from 10−1 to more than 101), it is relevant to evaluate whether or not this assumption and therefore the approximated solutions are valid. For this purpose, we computed ns(T) (a) with Eq. (7b) and (b) including higher powers (up to 5 for stability reasons) in the Taylor series (Eq. 6) to obtain k(T) and ns(T). For the case in which k(T) is computed, Eq. (8) allows to obtain ns(T). We then quantified the difference between these methods as the relative error,
where ns,app is the approximate value of ns(T) calculated with Eq. (7b), and is the value obtained including 5 terms in Eq. (6) (to obtain ns(T) directly) or with Eq. (8) (to obtain ns(T) through k(T)). To obtain the roots of Eq. (6) different approaches were evaluated, and Newton's method proved to be the most stable. Fig. 6 shows the resulting relative error for Moroccan dust for experiments with AIDA (Fig. 6a–b) and INSEKT (Fig. 6c–d). It can be noticed that for INSEKT experiments, there is no appreciable difference between the approximated solution and the one considering higher-order terms (Fig. 6c–d). This is due to the low IN activity present at the temperatures in which INSEKT experiments were carried out. On the other hand, substantial differences are observed for AIDA experiments. Experiments 5, 13, 14, 16, and 29 present the biggest differences for both methods with a relative error closer to 90 % when INAS is computed with a polynomial of degree 5 (Fig. 6a) and around 40 % to 80 % when it is obtained with k(T) (Fig. 6b). The relative error increased with decreasing temperature during an experiment. For example, RE increased from experiment 26 to 29 and the start temperature in those experiments decreased from 251.9 K in experiment 26 to 250.7 K in experiment 29 (Table 1). Experiments conducted at the warmest temperatures (experiment IDs 9, 10, 20, 21, 23, 24, and 25) have a relative error of less than 40 %. Generally, for the coldest temperatures, the error increases because the ice nucleation activity is higher (measured either through k(T) or ns(T)) making higher-order terms in the polynomial expression more relevant. Moreover, the use of a 5th-degree polynomial in the general expression (Eq. 6) is still an approximation that may be affected by numerical instability. For example, large values can cause high-degree terms to grow excessively.
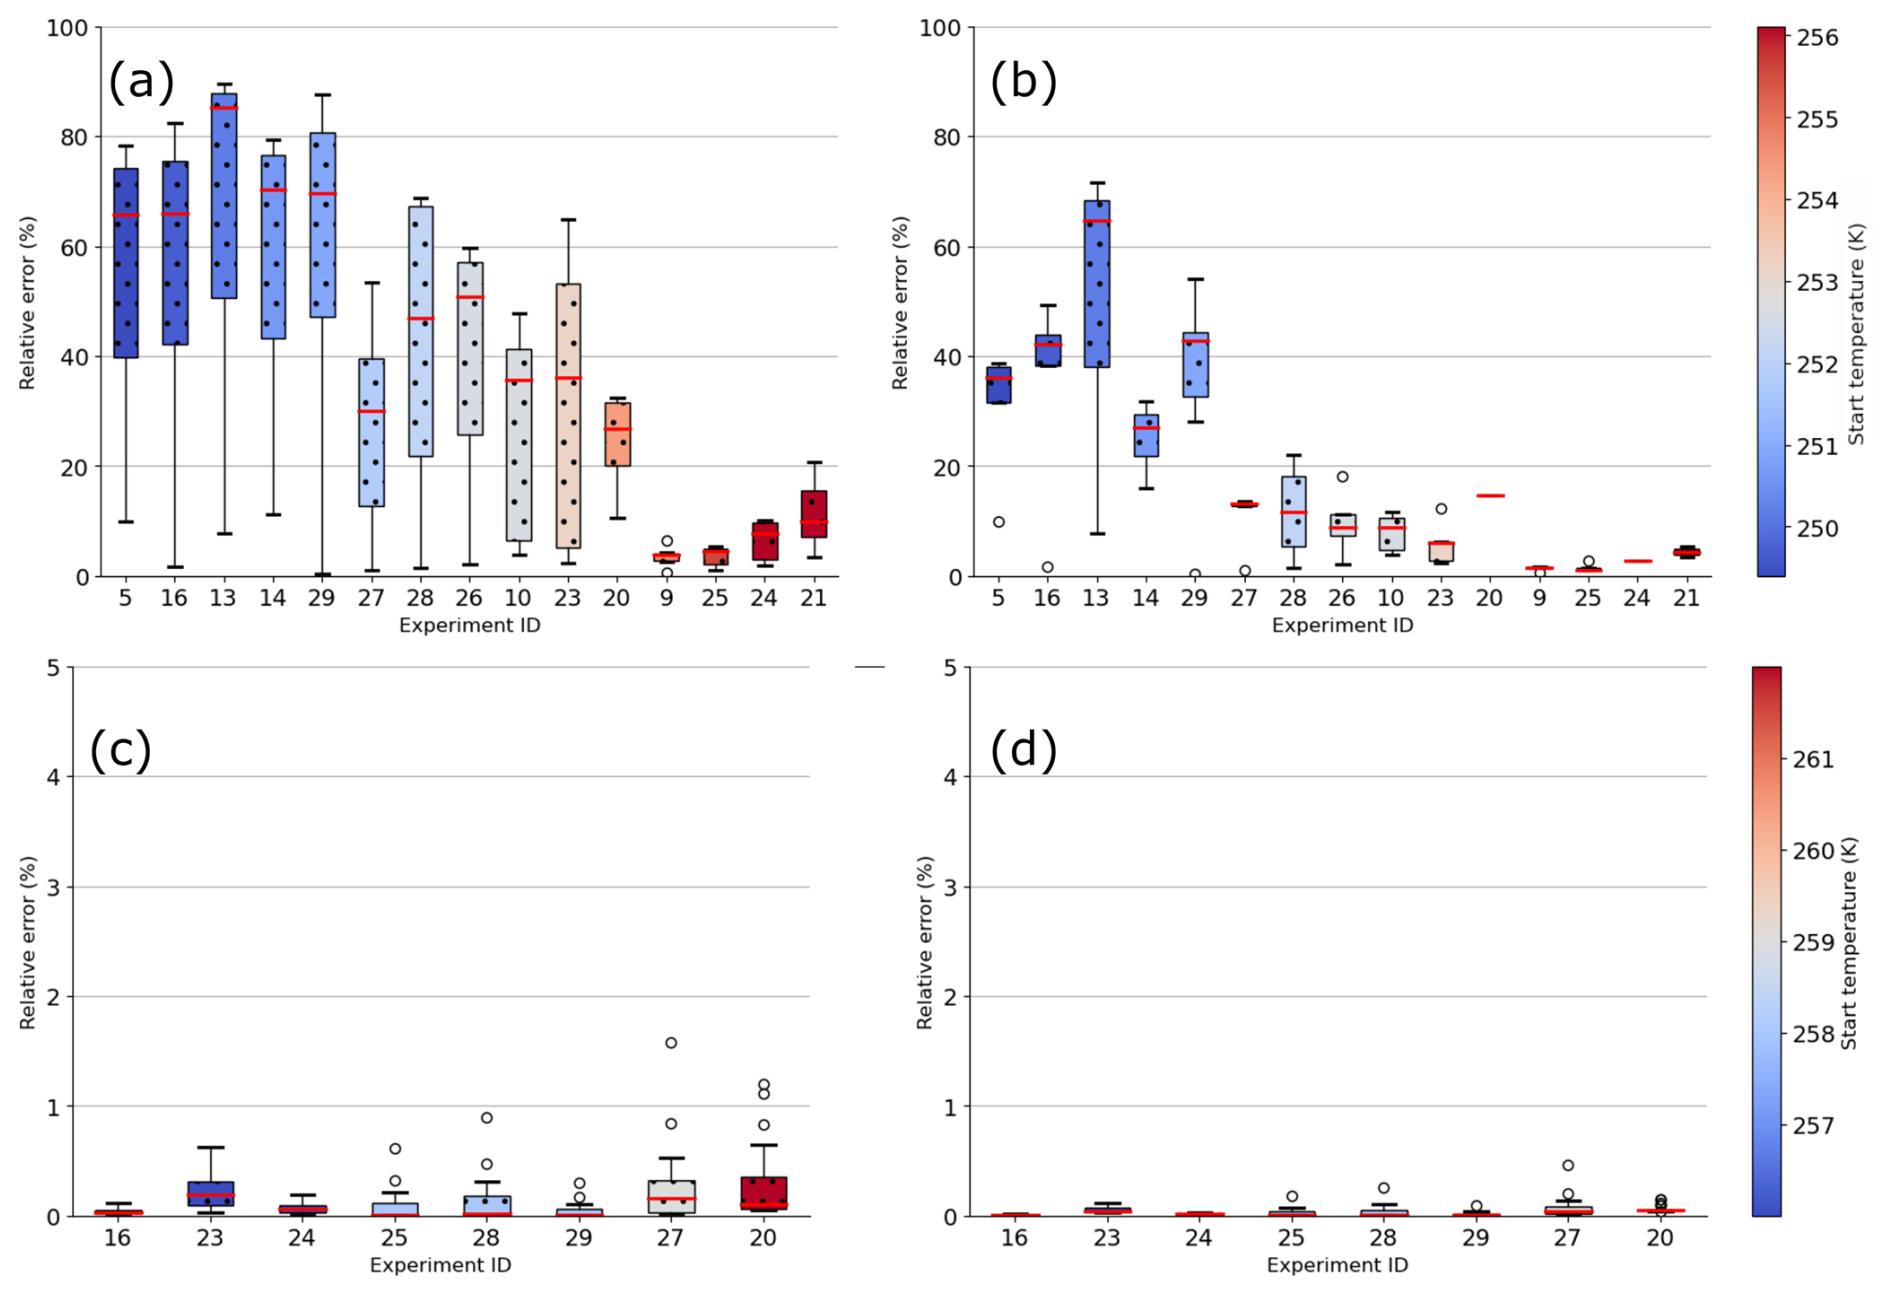
Figure 6Relative error between the different approaches of computing INAS density for Moroccan dust. The box represents the interquartile range (IQR) from the first quartile to the third quartile (Q1 to Q3), the horizontal orange line inside the box represents the median value. The whiskers extend to the smallest and largest values within 1.5 times the IQR, and outliers beyond the whiskers are shown as individual circles. Experiments are sorted by the temperature at which the first ice particle was detected, in order of increasing temperature. For AIDA experiments: (a) for polynomial of degree 5 (Eq. 6) and (b) for summation of differential nucleus concentration (Eq. 8). (c, d) as (a) and (b), but for INSEKT experiments.
Figure 7 presents the relative error for the Iceland experiments for AIDA and for INSEKT. The difference in the ns(T) values obtained with the different methods is almost zero for all INSEKT experiments. This is due to the low INA that the Icelandic samples presented at temperatures between 252–255 K. As was the case for the Moroccan experiments, there is a larger difference for AIDA experiments compared to INSEKT and a similar trend is observed, i.e. experiments at colder temperatures show larger relative differences.
Given that for most of our experiments the difference between both approaches was lower than 50 % or even 30 % (labels b, c, and d for Figs. 6 and 7), and considering more terms in the computation of INAS did not change significantly the final fit, we will use the standard equations (Eqs. 7a and 7b). However, it is important to note that in some experiments the difference exceeded 50 %, which makes it plausible that with samples with a higher INA, or at lower experimental temperatures, the difference could grow even larger. For this reason, it is suggested that the commonly used assumption that (or equivalently ) needs to be revised when the surface area distribution covers several orders of magnitude and in particular when the INA is high.
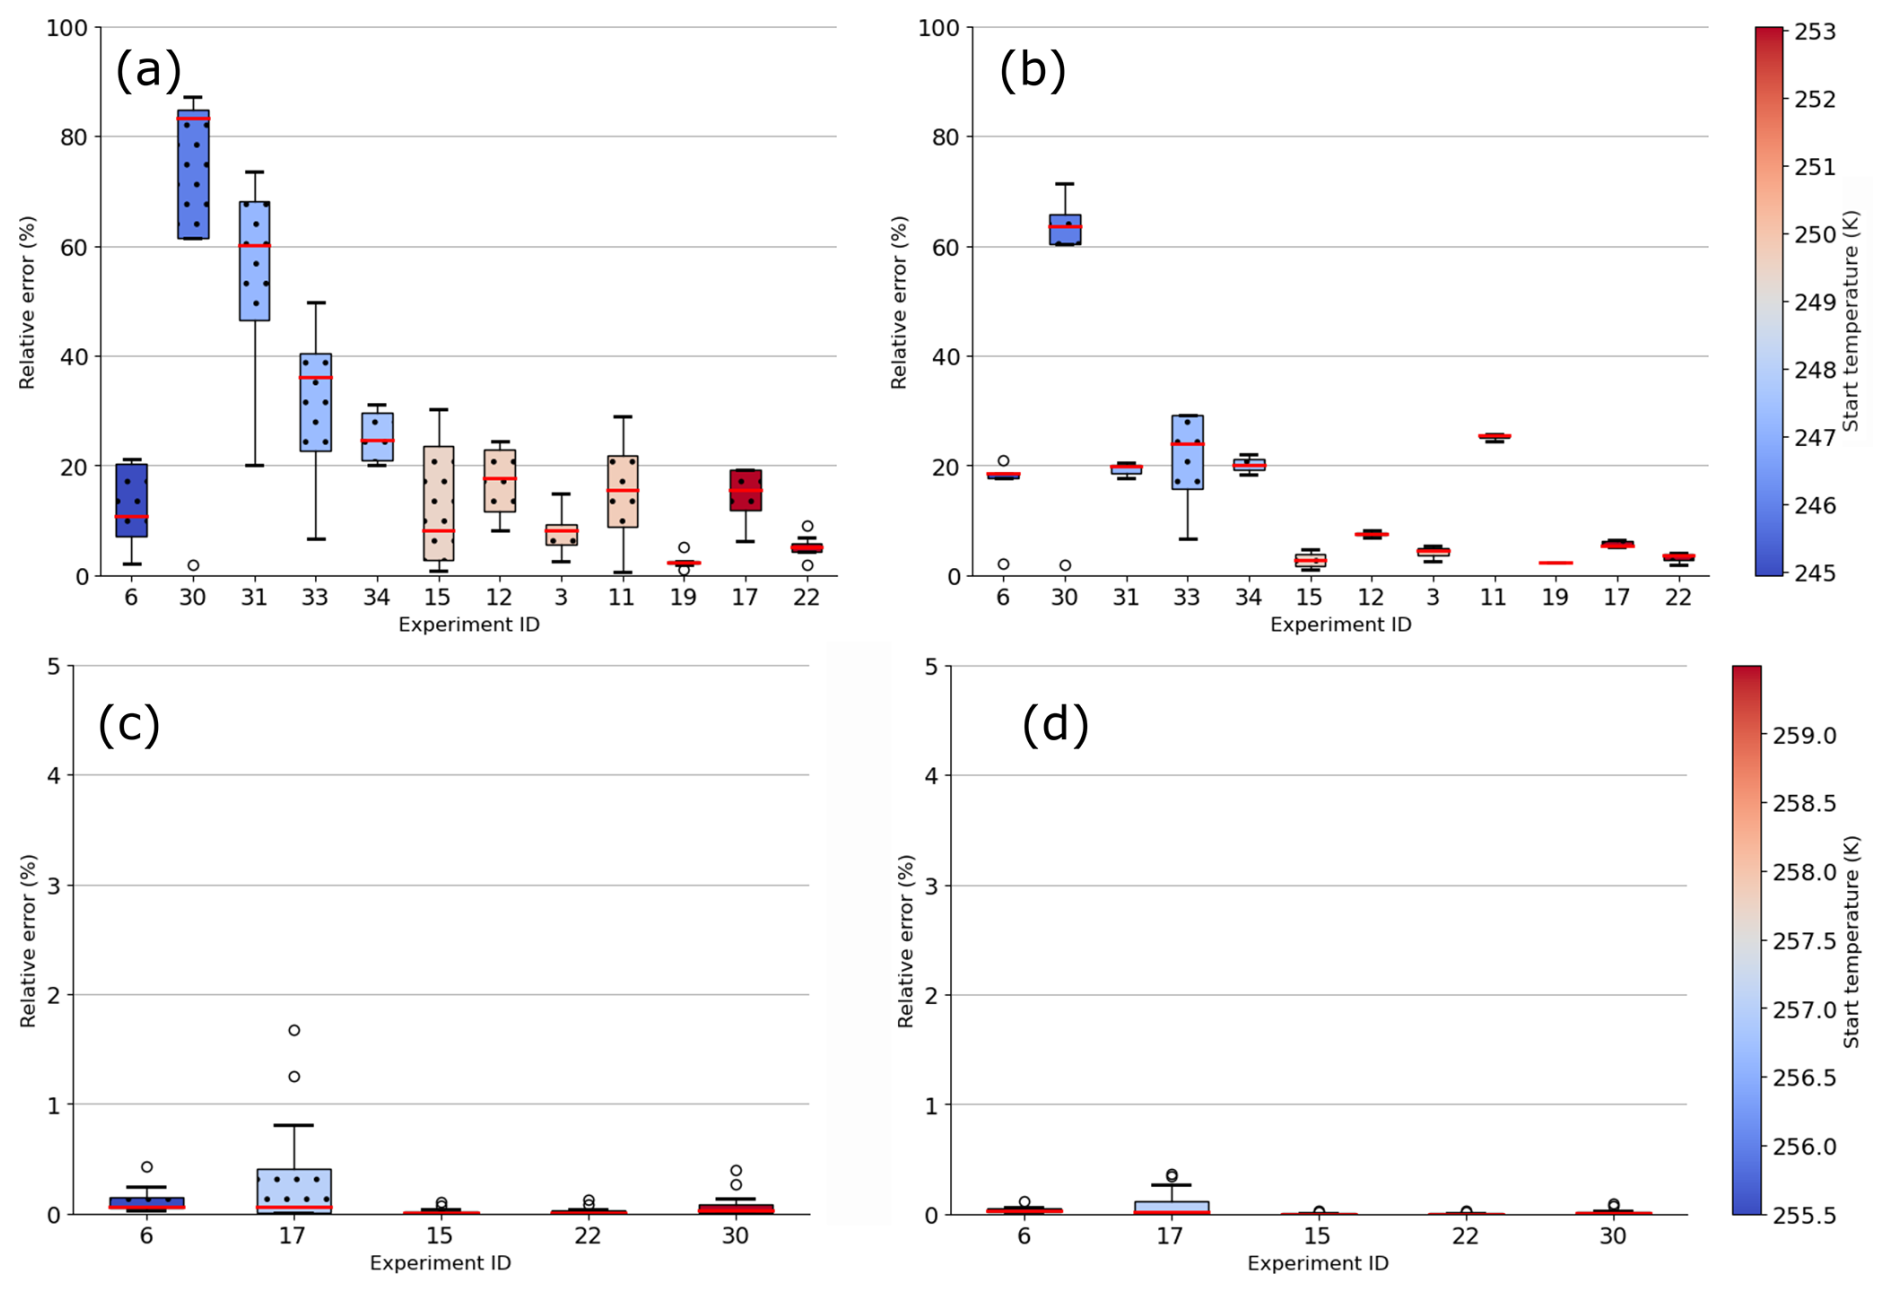
Figure 7Relative error for the different approaches of computing inas density for Iceland. The box represents the interquartile range (IQR) from the first quartile to the third quartile (Q1 to Q3), the horizontal orange line inside the box represents the median value. The whiskers extend to the smallest and largest values within 1.5 times the IQR, and outliers beyond the whiskers are shown as individual circles. Experiments are sorted by the temperature at which the first ice particle was detected, in order of increasing temperature. For AIDA experiments: (a) and (b) for polynomial of degree 5 and summation of differential nucleus concentration, respectively. For INSEKT experiments: (c) and (d) for polynomial of degree 5 and summation of differential nucleus concentration, respectively.
3.2 Ice nucleation activity
The values of k(T) and ns(T) obtained with Eqs. (7a) and (7b) are shown in Fig. 8 for Morocco and Fig. 9 for Iceland as a function of temperature and colored depending on the mean diameter of the surface area size distribution of the probed sample. Figure 8a and b present the experimental results obtained with AIDA and c and d with INSEKT. The differential nucleus concentration, k(T) (Fig. 8a, c) displays a larger variation from a linear behavior as the temperature is decreased for the same experiment. This is because k(T) is more sensitive to variations in ice crystal number concentration than ns(T). While ns(T) generally increases with each new temperature step due to its cumulative nature, k(T) can increase, decrease, or remain constant, reflecting the dynamic changes in ice nucleation. When comparing metrics obtained with the same experiment techniques (Fig. 8a, b for AIDA and Fig. 8c, d for INSEKT) it is notable how similar the slopes of the linear regressions are: 0.75 for ln (k(T)) and 0.80 for ln (ns(T)) for AIDA, and 0.72 for ln (k(T)) and 0.74 for ln (ns(T)) for INSEKT. Interestingly, the different size distributions, indicated by their mean diameter, did not have a notable impact on the values obtained for k(T) and ns(T), i.e. no color gradient is apparent across k(T) or ns(T) for a given temperature in Fig. 8. For example, experiments 9 and 23, which started at similar temperatures, but tested dust aerosol with different mean diameters, presented almost the same behavior and ice nucleation activity.
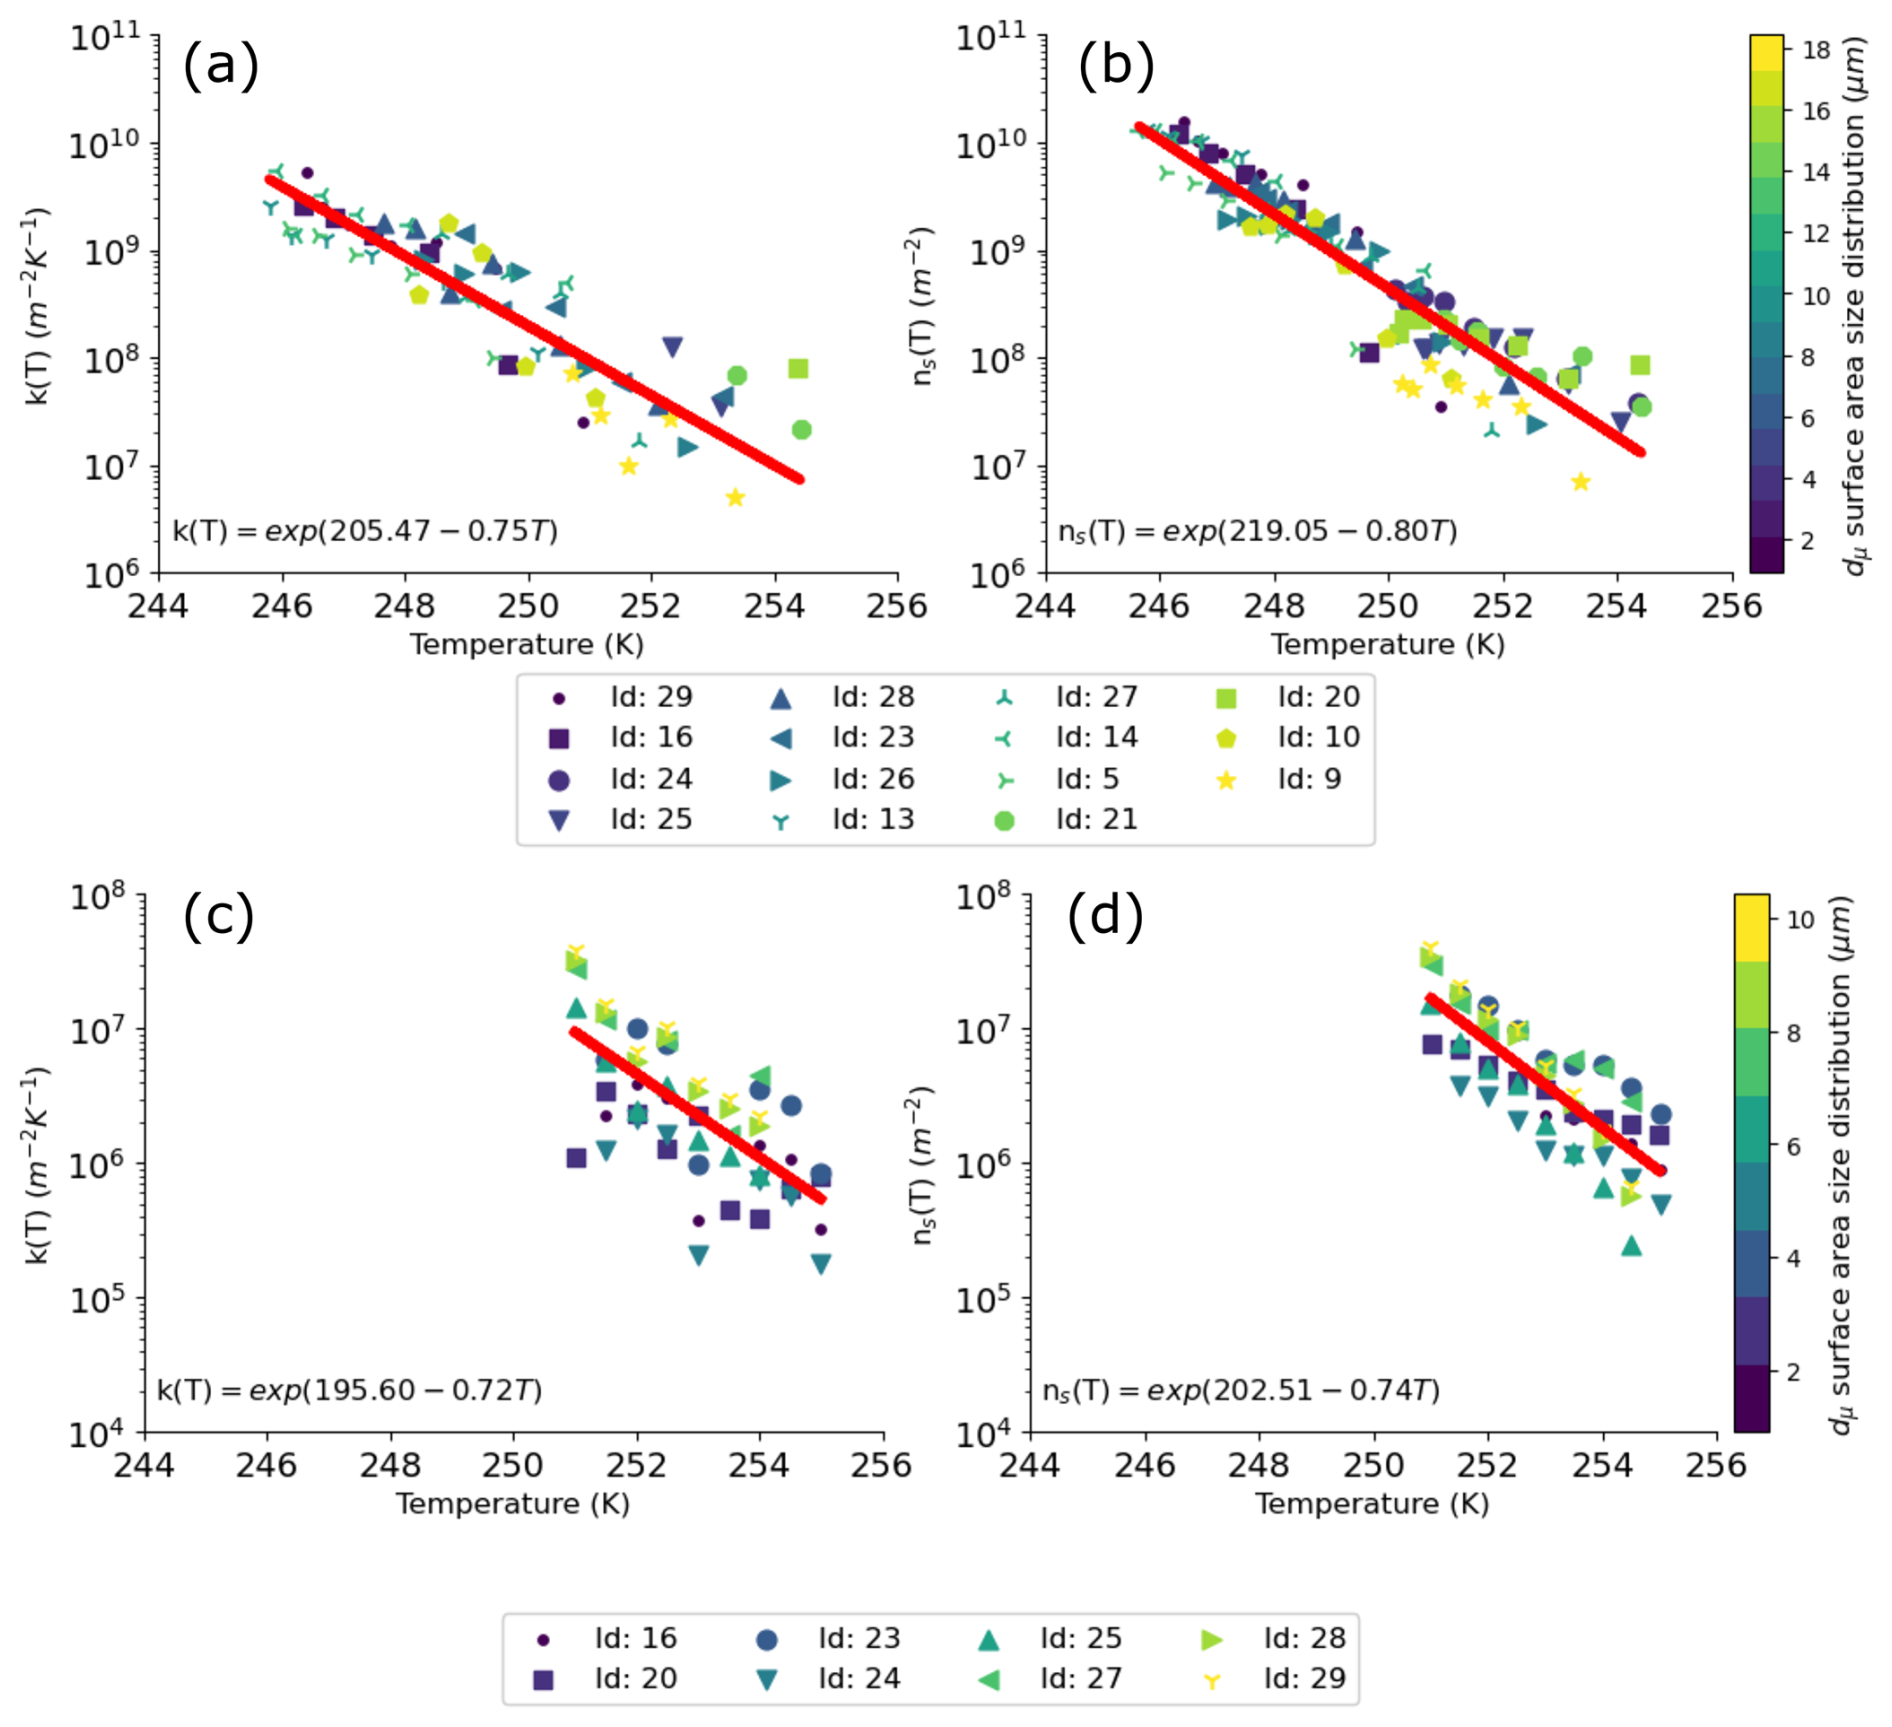
Figure 8Differential (a, c) and cumulative (b, d) nucleus concentrations obtained for samples from Morocco for AIDA experiments (a, b) and INSEKT experiments (c, d).
Figure 9 presents k(T) and ns(T) obtained from AIDA and INSEKT experiments for Icelandic dust. It can be noticed that the logarithm of the differential nucleus spectrum for AIDA does not present a clear linear increment with the decrease in temperature, but rather a more dispersed behavior around the linear fit. Whereas ln (k(T)) shows considerable deviation and dispersion around a linear behavior, ns(T) follows a linear relationship well and with smaller dispersion, particularly for the INSEKT results.
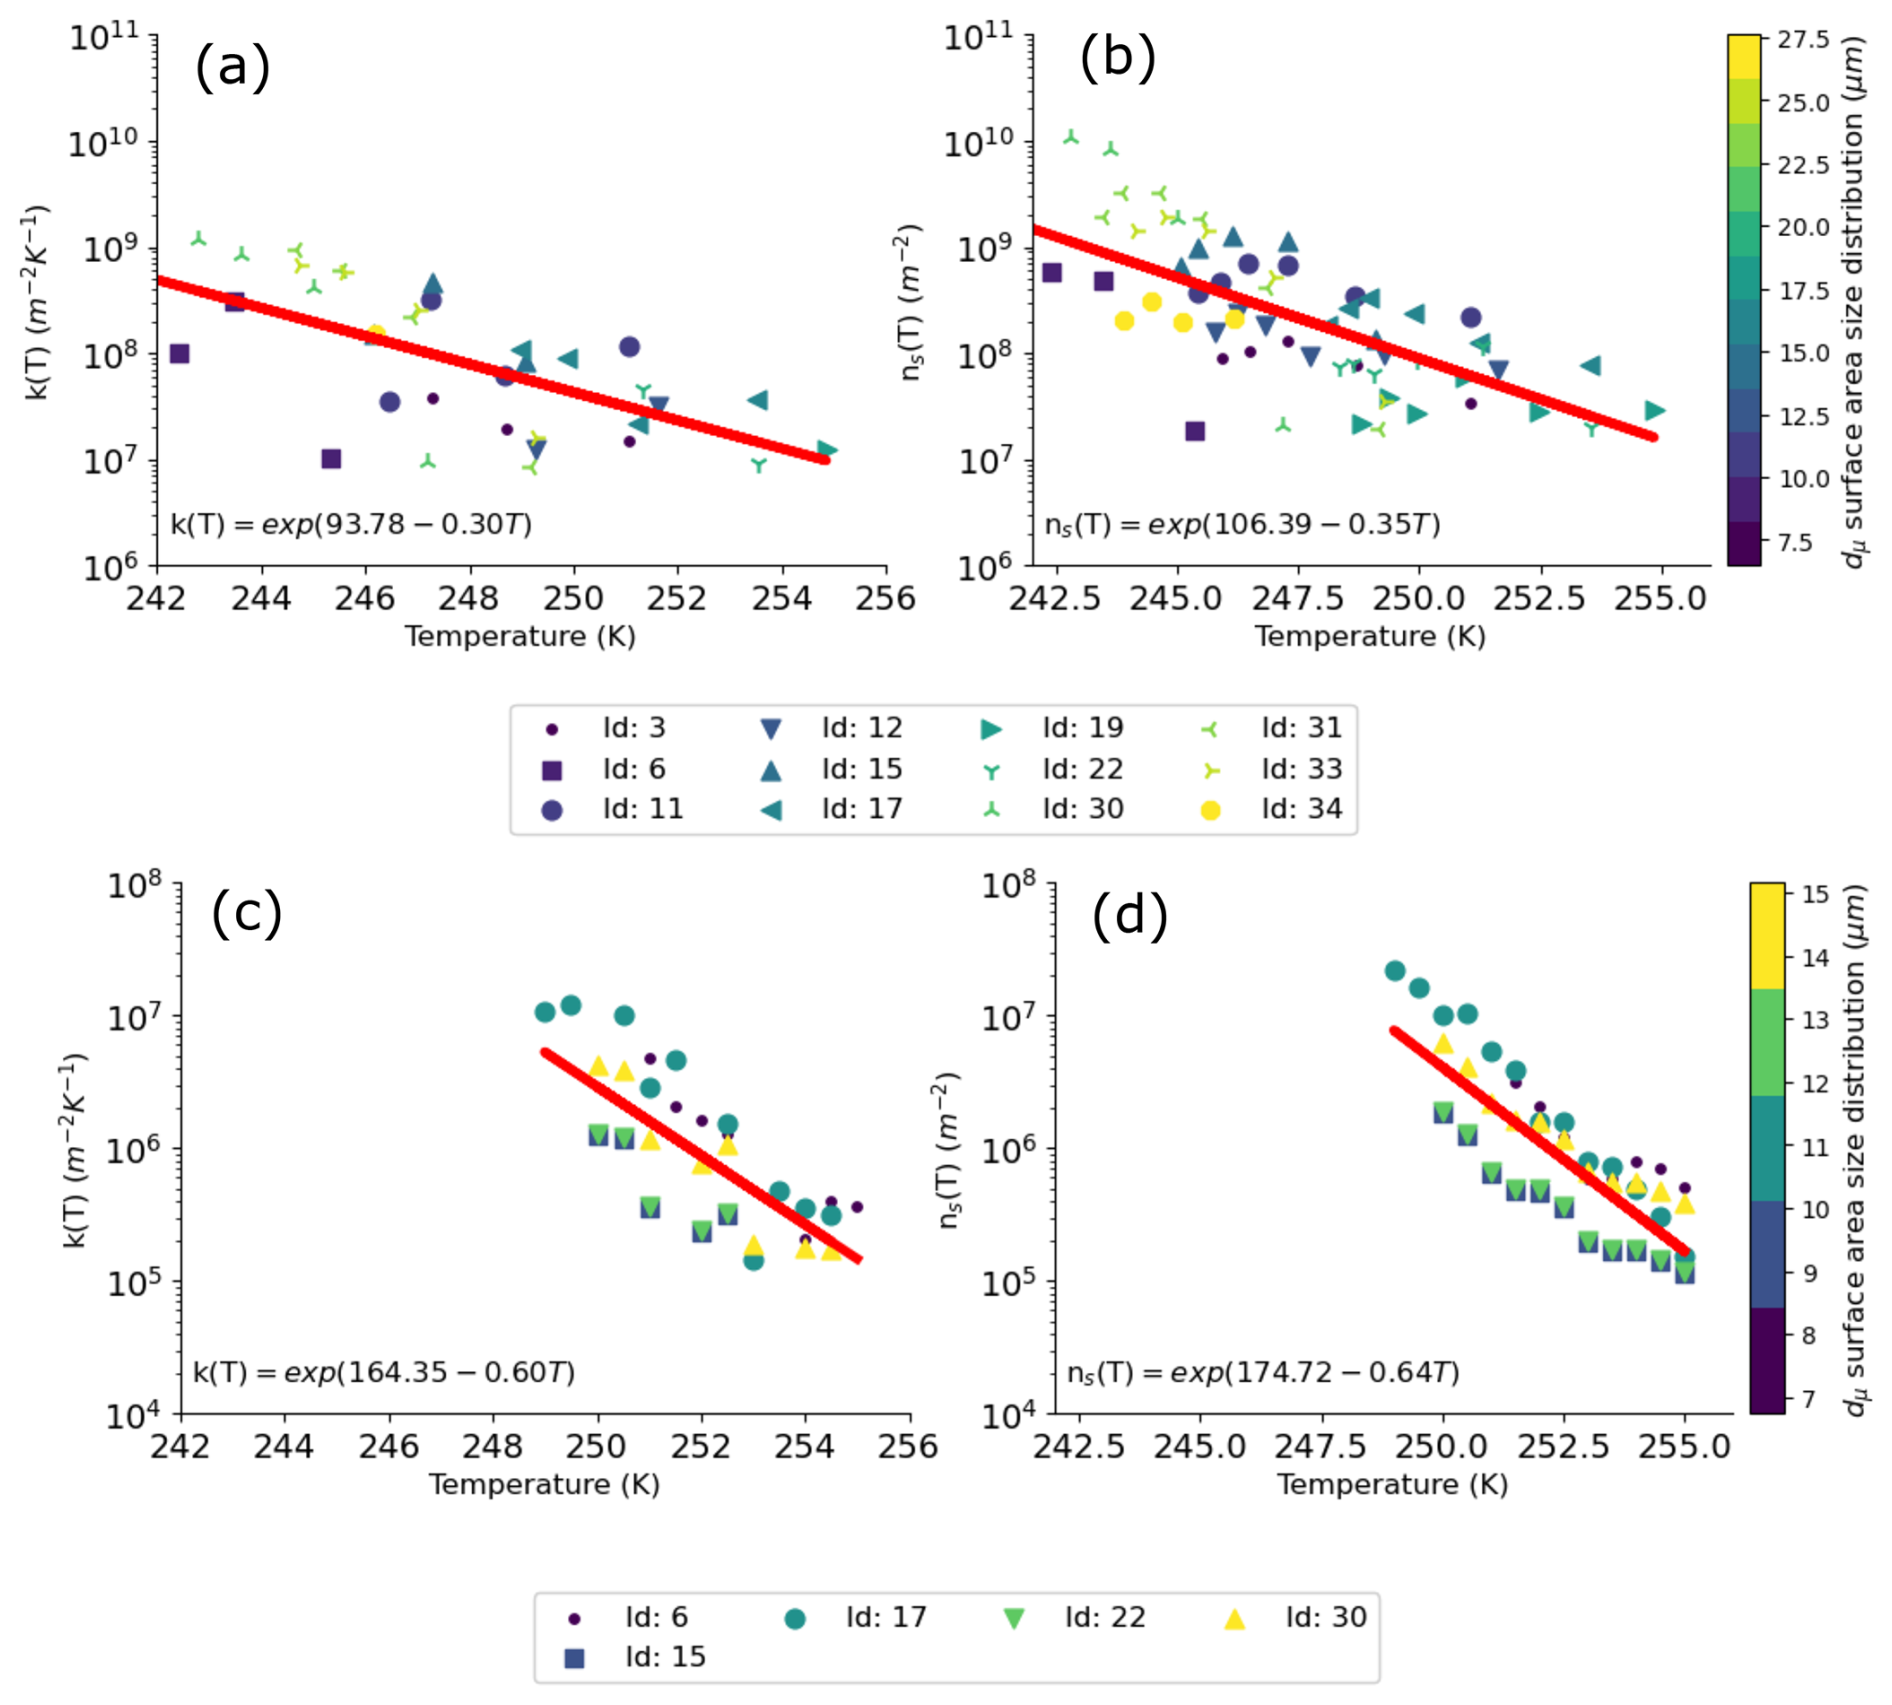
Figure 9Differential (a, c) and cumulative (b, d) nucleus concentrations obtained for samples from Iceland for AIDA experiments (a, b) and INSEKT experiments (c, d).
Figure 10 combines our results from AIDA and INSEKT and shows INAS densities, ns(T), for Morocco (Fig. 10a) and Iceland (Fig. 10b) together with results from previous studies. For the temperature span of AIDA and INSEKT experiments, a notable spread in INAS densities of ∼ 1.5 orders of magnitude for Morocco and ∼ 2 orders of magnitude for Iceland can be observed. The disagreement between these two techniques is not new, and our results are consistent with previous observations (Hiranuma et al., 2015). Table 4 presents the coefficients for the linear regression (a+bx, P1) for both dust sources, Morocco and Iceland. Besides our own experimental results, Fig. 10a also shows results from previous studies as a reference. It can be observed that our AIDA results are closer to previous fits for temperatures lower than 250 K, approaching the parameterization proposed by Ullrich et al. (2017), which is also based on AIDA experiments. Compared with Harrison et al. (2019), we obtained lower values for INAS densities from our experiments. However, our results are within the scaled values of 1 % and 20 % reported by Harrison et al. (2019) for K-feldspar, which agrees with the measured feldspar content of our samples (Sect. 4.1).
INAS densities for Iceland (Fig. 10b) show a greater spread than those for Morocco: ∼ 3 orders of magnitude in the 95 % confidence interval compared to ∼ 2 orders of magnitude for Morocco. Similar to our results for Morocco, INSEKT experiments yielded lower INAS densities than AIDA experiments in the temperature range in which they overlapped. The presented AIDA data (slope −0.35, Fig. 9b) is closer than the INSEKT data (slope −0.64, Fig. 9d) to the parameterization of Sanchez-Marroquin et al. (2020) (slope ). It is important to note that the comparisons in Sect. 4 were always performed between experiments using the same instrument, ensuring that methodological offsets between AIDA and INSEKT did not affect our conclusions regarding sample properties. Nevertheless, we acknowledge that the systematic offset between AIDA and INSEKT affects the absolute ns values and therefore the parameterizations derived from the combined dataset (Table 4, Fig. 10). Although its cause remains unclear, this offset is consistent with previously reported inter-instrument discrepancies (Hiranuma et al., 2015) and introduces an additional source of uncertainty in the proposed parameterizations (as accounted for in the confidence intervals). Disentangling instrument-related from sample-related contributions to the observed spread in the overlapping temperature range has been the subject of previous studies (Hiranuma et al., 2015) and would require dedicated intercomparison experiments using identical aerosol samples measured with both techniques, which is beyond the scope of the present study. For this reason, the fits obtained with each individual technique are also presented (Figs. 8 and 9). As mentioned in Sect. 2.5, experiment IDs 5, 9, and 10 for Morocco, and IDs 12 and 34 for Iceland, exhibited surface area distributions skewed toward larger sizes compared to those obtained using the LD technique. To assess the impact of these experiments on the derived INAS density fits, we performed a sensitivity analysis. This involved computing the INAS fit for Morocco and Iceland (one fit per location) under three different conditions: (1) using all experiments from Morocco and Iceland, (2) excluding the experiments that showed a skewed distribution, and (3) using only the experiments that exhibited a skewed distribution. The fits obtained for each case are shown in Fig. A5. For Moroccan fits, the difference between all experiments and the experiments without the skewed size distribution is minimal, while the discrepancy between the case considering all experiments and only the skewed experiments reaches a maximum of approximately 60 % at the lowest temperature (around 246 K). Similarly, Fig. A5b presents the ns(T) fits for Iceland. In this case, the differences among the fits remain below 20 %. These results indicate that the influence of experiments with deviating surface area distributions relative to those obtained with the LD technique on the ns(T) fits do not exceed one order of magnitude. These variations lie within the confidence intervals shown in Fig. 10a and b for Morocco and Iceland, respectively.
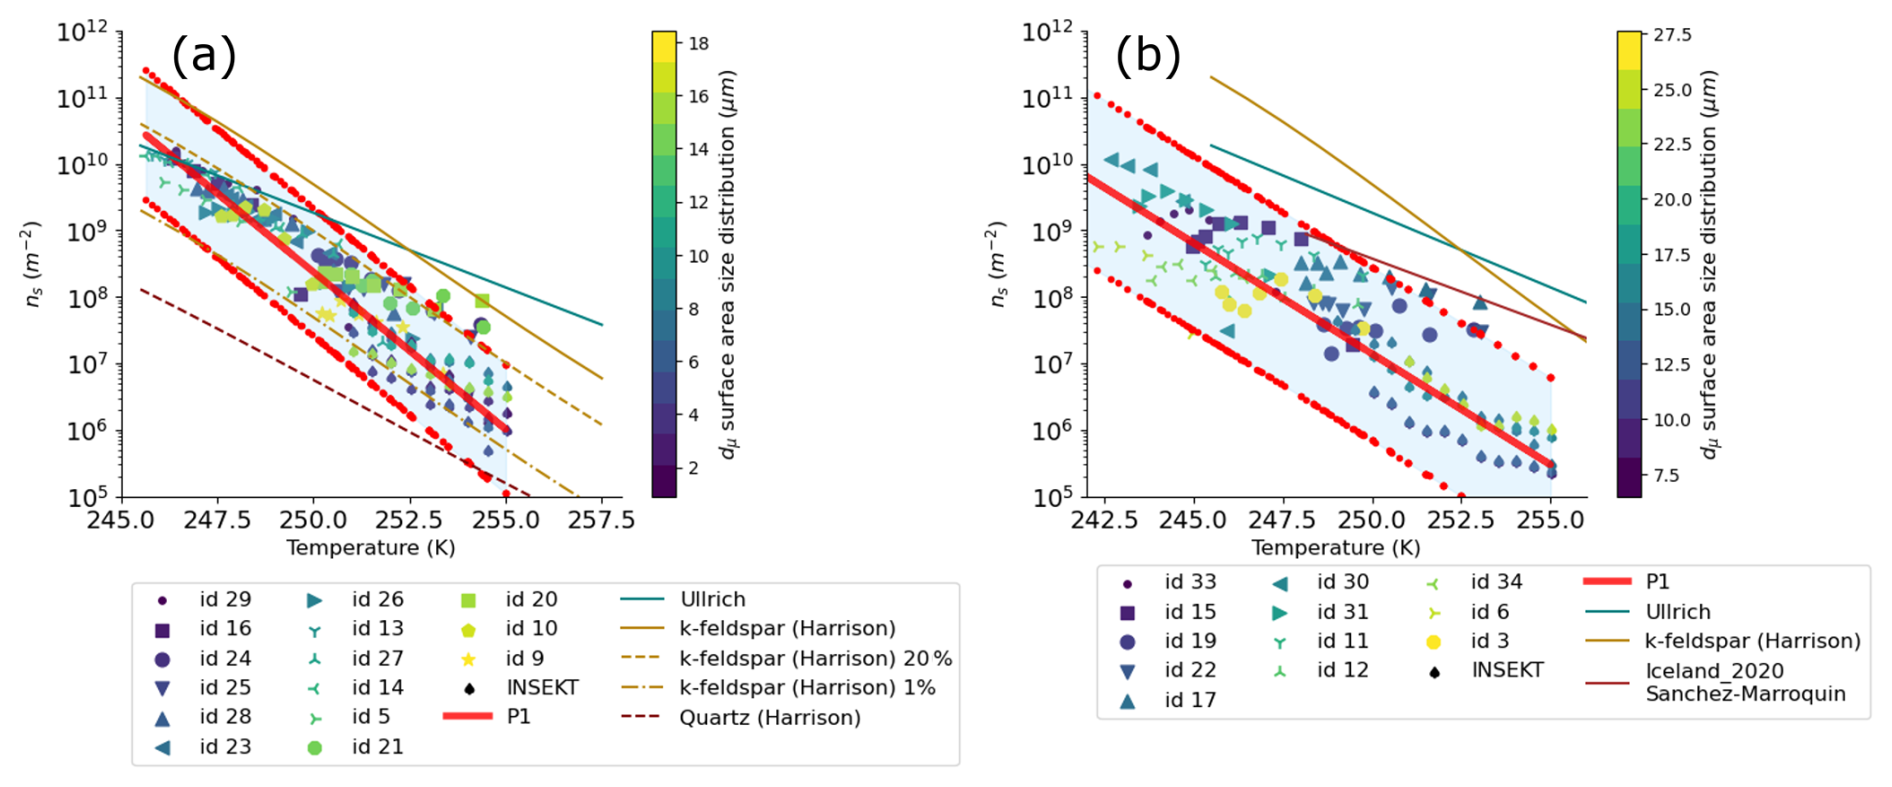
Figure 10Experimental values of INAS density from AIDA and INSEKT experiments for linear regression (P1) for (a) Morocco and (b) Iceland, Table 4 presents the coefficients for the linear regression. Also shown are the parameterizations from Ullrich et al. (2017) denoted as Ullrich, Harrison et al. (2019) denoted as K-feldspar (Harrison), K-feldspar (Harrison) 20 %, and K-feldspar (Harrison) 1 %, and Sanchez-Marroquin et al. (2020) labeled as Iceland_2020 Sanchez-Marroquin. The blue shaded area represents the 95 % confidence interval.
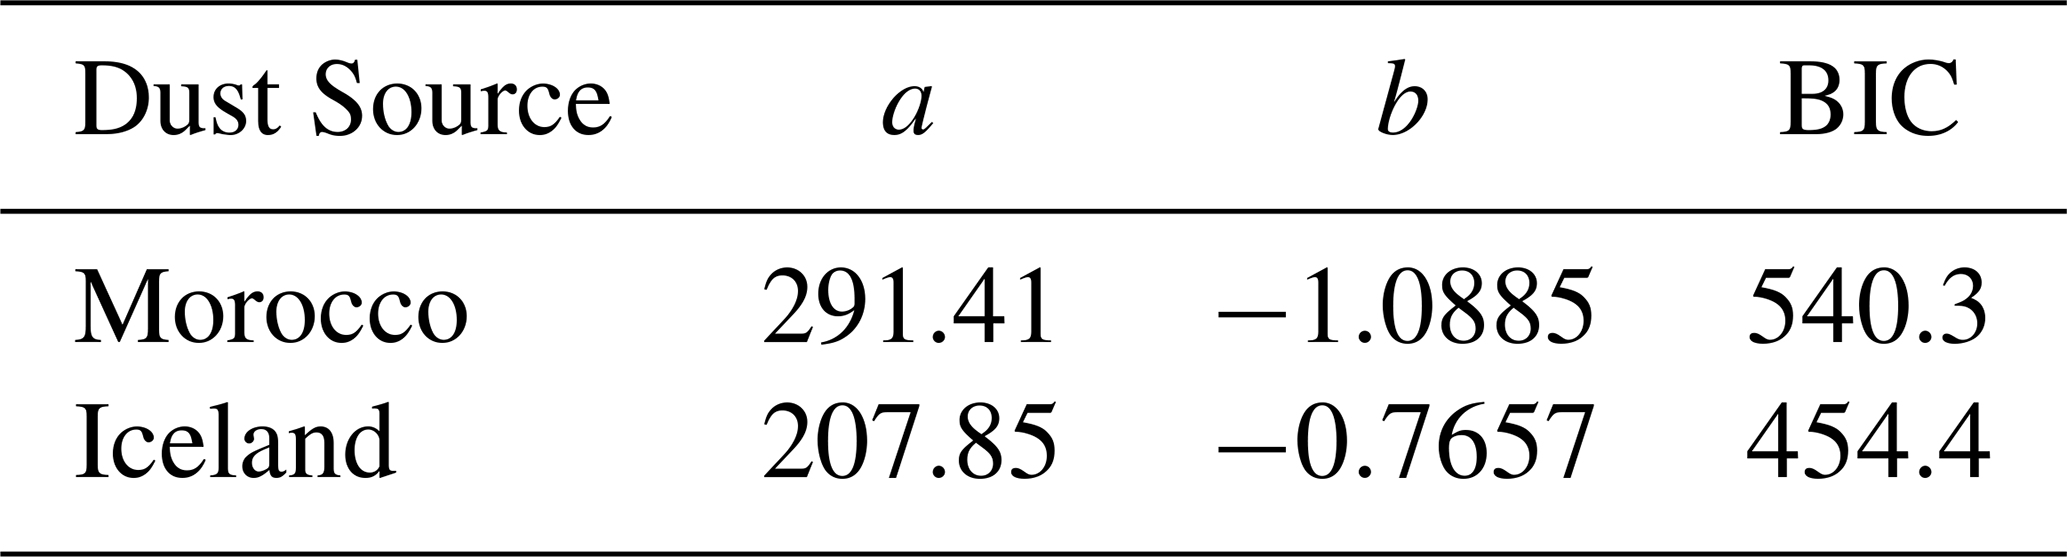
Table 4Coefficients from lower to higher power and Bayesian information criterion (BIC) for linear regression (P1; where T is temperature in K) for Morocco and Iceland, for the combined results from AIDA and INSEKT (Fig. 10) measurements.
3.3 INAS density derived from BET measurements with IR-DROFA technique
Figure 11 shows INAS density, ns(T), from the IR-DROFA measurements, calculated from the fraction of frozen droplets using the total area of all particles in a droplet (see Sect. 2.6). This total surface area was estimated either from BET-based SSA values (SSABET_H2O) or by assuming that all particles in a droplet are spherical with a diameter of 15 µm (see Appendix. C) and a particle density of 2.65 g cm−3 (SSAGEO).
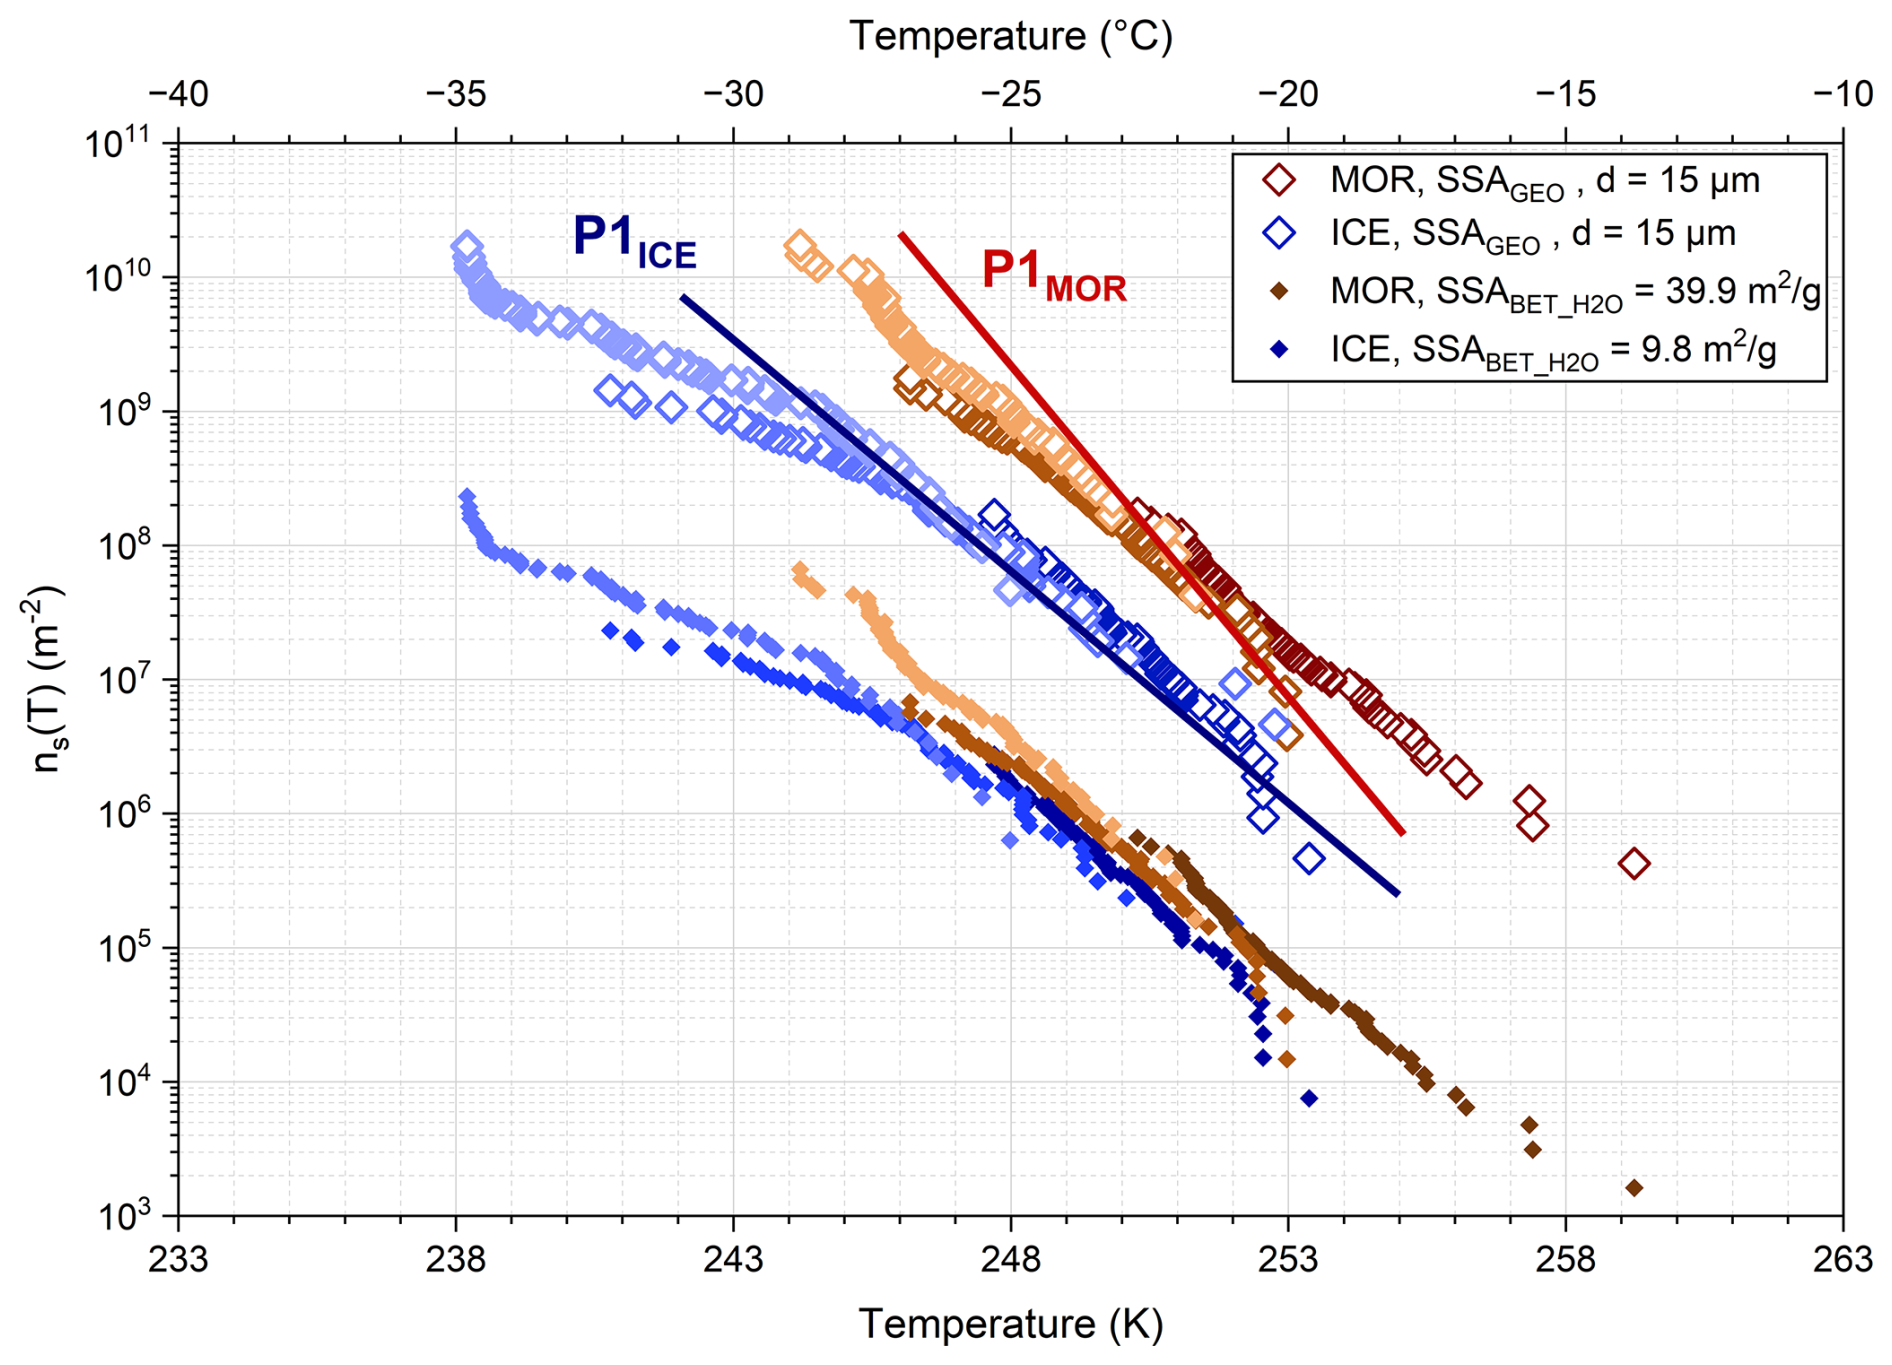
Figure 11INAS densities obtained from IR-DROPA measurements for Moroccan and Icelandic dust samples sieved through a 20 µm mesh. Open symbols represent values calculated under the assumption that particles are spherical with a diameter of 15 µm and a density of 2.65 g cm−3. Solid symbols correspond to INAS densities derived from specific surface areas measured via the BET multipoint method, using water vapor as the adsorbate at 20.5 °C. The lines labeled P1ICE and P1MOR represent the linear regression fits from Fig 10a and b, respectively.
The IR-DROFA measurements (MOR and ICE SSAGEO in Fig. 11) are in good agreement with measurements of Icelandic and Moroccan dust obtained using other methods (AIDA and INSEKT). For Icelandic dust, the agreement is almost perfect (solid blue line and open blue symbols in Fig. 11), whereas the ns(T) values for Moroccan dust follow a less steep curve than the exponential fit to the AIDA and INSEKT data (solid red line and open reddish symbols in Fig. 11). This deviation is not totally clear but it may be attributed to the different particle sizes used in the experiments: while the sieved fraction was confined to particles with geometric diameters below 20 µm, the coarse particles in the cloud chamber extended up to 50 µm and beyond. Furthermore, similar behavior was observed in Fig. 10, which shows deviations in the results obtained from different experimental techniques, such as AIDA and INSEKT. Further studies are required to elucidate the main reasons behind the discrepancies among these techniques. Nevertheless, an overall good agreement is observed.
In addition to differing fractions of ice-nucleating minerals (such as feldspar, Sect. 4.2) present in the two samples, the variation in IN behavior can also be attributed to differences in the internal surface area accessible to water within the particles. Since Moroccan dust exhibits a fourfold higher SSA, a single particle of a given size presents four times more surface area available for ice nucleation compared to an identically sized Icelandic particle. This effect is illustrated by the INAS densities calculated for both dust sources using the water vapor adsorption-based SSA (solid symbols in Fig. 11). As a result, the ns(T) values of both dust types nearly coincide.
It is important to note that calculating the INAS density based on water adsorption-derived SSA has limited practical application, as the SSA of natural dust aerosols is generally not accessible. Nonetheless, this result underscores the necessity of carefully considering surface area measurements for each potential atmospheric aerosol acting as an INP.
Several studies have found a correlation between the presence and amount of specific minerals, i.e. from the feldspar family (K-feldspar), quartz, pyroxene family, clay minerals (illite, kaolinite), in dust samples and the ice nucleation activity of these samples, pointing out that a better understanding of the IN behavior and accurate parameterizations can be obtained when the mineralogical composition of the samples is considered (Zimmermann et al., 2008; Atkinson et al., 2013; Harrison et al., 2019; Jahn et al., 2019). Motivated by this, in Sect. 4.1 and 4.2, we analyze the INA of our samples in the context of their mineral composition. Additionally, given the broad size range of our particles, their mineralogical composition may vary across different sizes. For this reason, in Sect. 4.3, we investigate the impact of variations in mineralogical composition with particle size on INA for samples with different PSDs. Based on our findings of the previous sections and following previous works that scaled INA to the content of certain minerals in the studied samples (Atkinson et al., 2013; Harrison et al., 2019), we computed INAS density again in Sect. 4.4, but scaling the surface area to the fraction of the main ice-active group of minerals at each size.
4.1 Morocco mineralogy
A comprehensive analysis of our Moroccan samples was carried out in Panta et al. (2023). Here, we focus on the mineralogical single-particle composition and its dependence on size. In short, Panta et al. (2023) analyzed more than 300 000 freshly emitted individual particles using offline analysis with scanning electron microscopy (SEM) coupled with energy-disperse X-ray spectrometry (EDX). In their analysis, quartz was found to be the second largest constituent of the analyzed particles behind clay minerals. Furthermore, externally mixed feldspar represented 3.2 % of all particles by mass, and a 10th of it was estimated to correspond to K-feldspar. It is important to note that this is externally mixed K-feldspar and there is additional internally mixed K-feldspar, however, this cannot be isolated by the technique used in Panta et al. (2023). An important finding of the Moroccan samples analyzed was that the relative amount of externally mixed feldspar and K-feldspar was invariant across particle size. In contrast, the mass fractions of complex quartz-like and feldspar-like particles increased with particle size, ranging from 5 % to 18 % for feldspar-like particles.
However, determination of the composition of larger particles is inherently limited. While the elemental composition obtained is most probably representative for the whole particle, as all of the particle's cross-section is scanned, the SEM-EDX technique used in Panta et al. (2023) identifies only the dominant mineral type in each particle. No actual phase identification is carried out, all particle classes are therefore labeled “-like” to reflect similarity in elemental fingerprints rather than confirmed mineral phases. This ambiguity is particularly relevant for larger particles, as the proportion of internally mixed aggregates increases with particle size, making the attribution of the EDX signal to a specific mineral such as K-feldspar increasingly uncertain. Nevertheless, a specific particle size threshold beyond which classification becomes uncertain is not defined, and the limitation is described qualitatively as a progressive effect with increasing particle size. As shown in Sect. 3.2, INAS densities obtained from our experiments fell within the 1 % and 20 % K-feldspar scaled fits (Harrison et al., 2019) and that the values obtained with AIDA aligned with the 20 % K-feldspar scaled fit (Fig. 10a). Although quartz is the second largest constituent by mass of our samples, we observed a higher ice nucleation activity than that obtained for quartz by Harrison et al. (2019) (Fig. 10a). In order to understand the possible role of quartz in promoting ice nucleation, it is important to mention that our samples were collected in September 2019 and stored in plastic bags. Later, in November 2022, they were sieved and stored in small plastic containers. Finally, one month later, they were used in AIDA and INSEKT experiments. The fact that our samples did not exhibit INA similar to quartz might suggests that, despite quartz being larger in mass contribution than feldspar, most of its active sites may have become inactive or the quartz contribution was masked by the more active components like feldspar. Harrison et al. (2019) found that the INA of quartz samples decreased substantially after exposure to air during storage, as well as after exposure to water (Kumar et al., 2019). Consequently, the primary source of active sites in our Moroccan samples likely comes from the less abundant, but more aging-resilient feldspar active sites.
4.2 Iceland mineralogy
The single-particle composition, size, shape, and mixing state of our freshly emitted Icelandic particles were studied in Panta et al. (2025). The size-resolved chemical and physical composition of over 190.000 individual particles with geometric diameters spanning from 0.1–120 µm were analyzed with computer controlled scanning electron microscopy/energy dispersive X-ray spectroscopy (ccSEM/EDX). It was found that the most abundant particle composition was Medium-Al mixed silicate particles (volcanic glass-like particles) varying between 35 % and 93 % by volume of the total aerosol population. Furthermore, a proportion of the Icelandic particles presented sulfate particles, suggesting the contribution of volcanic emissions. Potassium was almost absent from the samples. It was also observed that the relative volume fraction of the quartz-like particle group decreased with size, disappearing at 4 µm. In the same way, pyroxene occupied a higher relative volume fraction for smaller sizes, disappearing almost completely for diameters larger than 16 µm. However, the complex quartz-like structure was almost constant with size. As Panta et al. (2025) pointed out, notable differences emerge when comparing the mineralogy of Moroccan and Icelandic samples. For example, Icelandic dust consisted mainly of glass, intermediate plagioclase, and pyroxene. On other hand, Moroccan samples were dominated by clays, feldspar, quartz, and calcite. Therefore, differences in the ice nucleation activity between these two dust sources are expected, confirming our experimental results (Fig. 12).
The INA of samples from Iceland and, more generally, close to volcanoes was already the focus in previous studies (Jahn et al., 2019; Steinke et al., 2011; Hoyle et al., 2011; Sanchez-Marroquin et al., 2020). In Fig. 12, we present a comparison between our parameterization and experimental data and other parameterizations from earlier studies. It can be seen that our parameterization (Table 4) predicts values almost one order of magnitude lower than previous studies for Iceland (Steinke et al., 2011) and pyroxene (Jahn et al., 2019). Pyroxene is particularly relevant because it has been suggested to be one of the most important minerals promoting the INA in volcanic samples (Jahn et al., 2019; Umo et al., 2021). As the reason for this, it has been hypothesized that exsolution and the presence of perthitic microtextures (surface features that serve as ice-active sites) can occur in minerals commonly seen in volcanic ashes such as pyroxenes (Jahn et al., 2019). Contrasting our parameterization with the one obtained by Sanchez-Marroquin et al. (2020), at first sight a large discrepancy appears. Nevertheless, upon closer inspection, interesting features can be noticed. First, the spread of ns values derived with the same technique , i.e. INSEKT or AIDA experiments, for the whole temperature range is close to 1 order of magnitude (Fig. 9). Second, comparing the values obtained at the same temperature but with different techniques (AIDA vs. INSEKT) the spread increases to ≈ 2 orders of magnitude (Fig. 10). Additionally, data derived only with AIDA shows to agree more with Sanchez-Marroquin et al. (2020) parameterization. This variability of values between experiments might point to a variability in mineralogical content or other properties of the particles which might have a stronger impact at temperatures higher than 250 K given that for lower temperatures the ns values tend to agree more for the considered experiments. Therefore, additional studies are needed to understand the differences in IN values when wet and dry techniques are used and whether these differences are related to the mineralogical composition of the samples.
As said before, pyroxene is considered one of the most ice-active groups present in samples of volcanic origin. The values obtained by Sanchez-Marroquin et al. (2020) are larger than those expected from pyroxene. However, the particles analyzed by Sanchez-Marroquin et al. (2020) are airborne samples making it feasible that their composition and INA is altered in comparison with samples obtained at surface level.
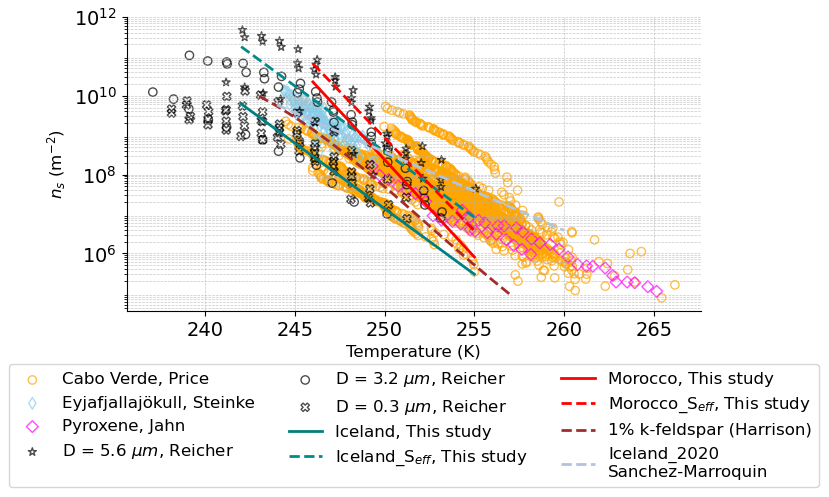
Figure 12INAS density parameterizations for Morocco with standard (red solid line) and effective (red dashed line) surface area, and Iceland with standard (blue solid) and with effective (blue dashed line) surface area. Comparison with experimental data from Steinke et al. (2011, blue diamonds), Jahn et al. (2019, purple diamonds), Price et al. (2018, orange circles), 1 %-K-feldspar scaled Harrison et al. (2019, brown dashed line), Sanchez-Marroquin et al. (2020, light blue dashed line), and Reicher et al. (2019, open black stars, circles, and diagonal crosses) for samples with different cut-off diameter.
4.3 Size dependence
In the previous section, links between ice nucleation activity and mineralogy were considered. In this section, we discuss how the relationship between mineralogy and ice activity depends on particle size. For example, as mentioned in Sect. 4.1, the relative volume fraction of the complex feldspar-like and feldspar mixtures increased with particle diameter for our Moroccan samples. The subsequent question is therefore whether this size dependence has any influence on the INA of the samples. To answer this, we compared experiments carried out with the same start temperature, but with different surface area concentration ratios of the three modes (Sfr, Scr and Sscr) defined as
where ST is the total surface area concentration. Sf, Sc, and Ssc is the surface area concentration coming from fine, coarse and super-coarse particles.
4.3.1 Moroccan samples
Figure 13 presents the ice active fraction (%) for the selected AIDA experiments. Overall, no strong relationship between the surface area ratio contribution of particles of a certain size (fine, coarse or super-coarse, Fig. 13e) and the ice active fraction was found. For instance, Fig 13a presents a similar ice active fraction for experiments 5 and 16, in which the contribution of super-coarse particles to the total surface area to experiment 5 is higher than to experiment 16. In Fig. 13b experiments 9 and 20 exhibit a similar ice active fraction and have a similar contribution of super-coarse particles, but with a difference in the proportion of fine and coarse contributions. Figure 13d presents the case in which for one experiment almost all the surface area concentration comes from fine particles (experiment 29, 99 %) while the other experiment has a more even contribution from fine, coarse, and super-coarse (experiment 28, 40 %–30 %–30 %). In this example, the largest difference in ice activity was observed at warmer temperatures. At colder temperatures, the difference is less pronounced. A similar trend is observed for experiments 26 and 27, Fig. 13c, in which the ice active fraction presents a similar behavior regardless of the difference on their surface area fractions.
A reason for similar ice active fractions of the samples regardless of their size distribution is probably that the relative volume fraction of K-feldspar, the most ice-active mineral in the sample (Atkinson et al., 2013), was constant throughout the size distribution. This behavior suggests that, if there is any dependence, in order to observe this dependence of the ice active fraction on size, more substantial contrasts between the surface area distributions in the compared experiments is required.
4.3.2 Comparison with other studies for Moroccan samples
Evidence for a dependence of the ice active fraction on particle size has been reported in earlier studies. Figure 12 presents data from a study where airborne particles from mid-latitude were collected and subsequently sieved and their ice-activity analyzed as a function of particle diameter (Reicher et al., 2019). In this study, dependence on size was found. It can be seen that our fit for Moroccan samples is in agreement for particles with a cut-off diameter of 3.2 µm. Although there is a difference in ice activity with size distribution for cut-off diameters of 5.6 and 3.2 µm, this is not as pronounced as for particles with cut-off diameter of 0.3 µm, consistent with our results that the dependence of ns on particle size requires a strong difference in the size distribution. Nevertheless, it is important to acknowledge that differences between airborne and surface-collected particles have been observed (Boose et al., 2016). Additionally, the mineralogy of the samples analyzed in Reicher et al. (2019) was not explicitly examined. Therefore, comparisons of our samples with the ones in Reicher et al. (2019) should be interpreted with caution.
In another study, airborne particles from the Eastern Mediterranean were sampled and their INA assessed (Gao et al., 2024), finding a positive correlation between the proportion of coarse particles (1 ≥ µm) and the average number concentration of INP. The strength of the correlation was dependent on the source of the sample and weather the sample was above or below the planetary boundary layer, giving place to aging and mixture with other components, e.g. biological substances, and not solely to mineralogy. In conclusion, evidence of higher INA as the aerosol population contains more larger particles was not clearly observed for our Moroccan samples.
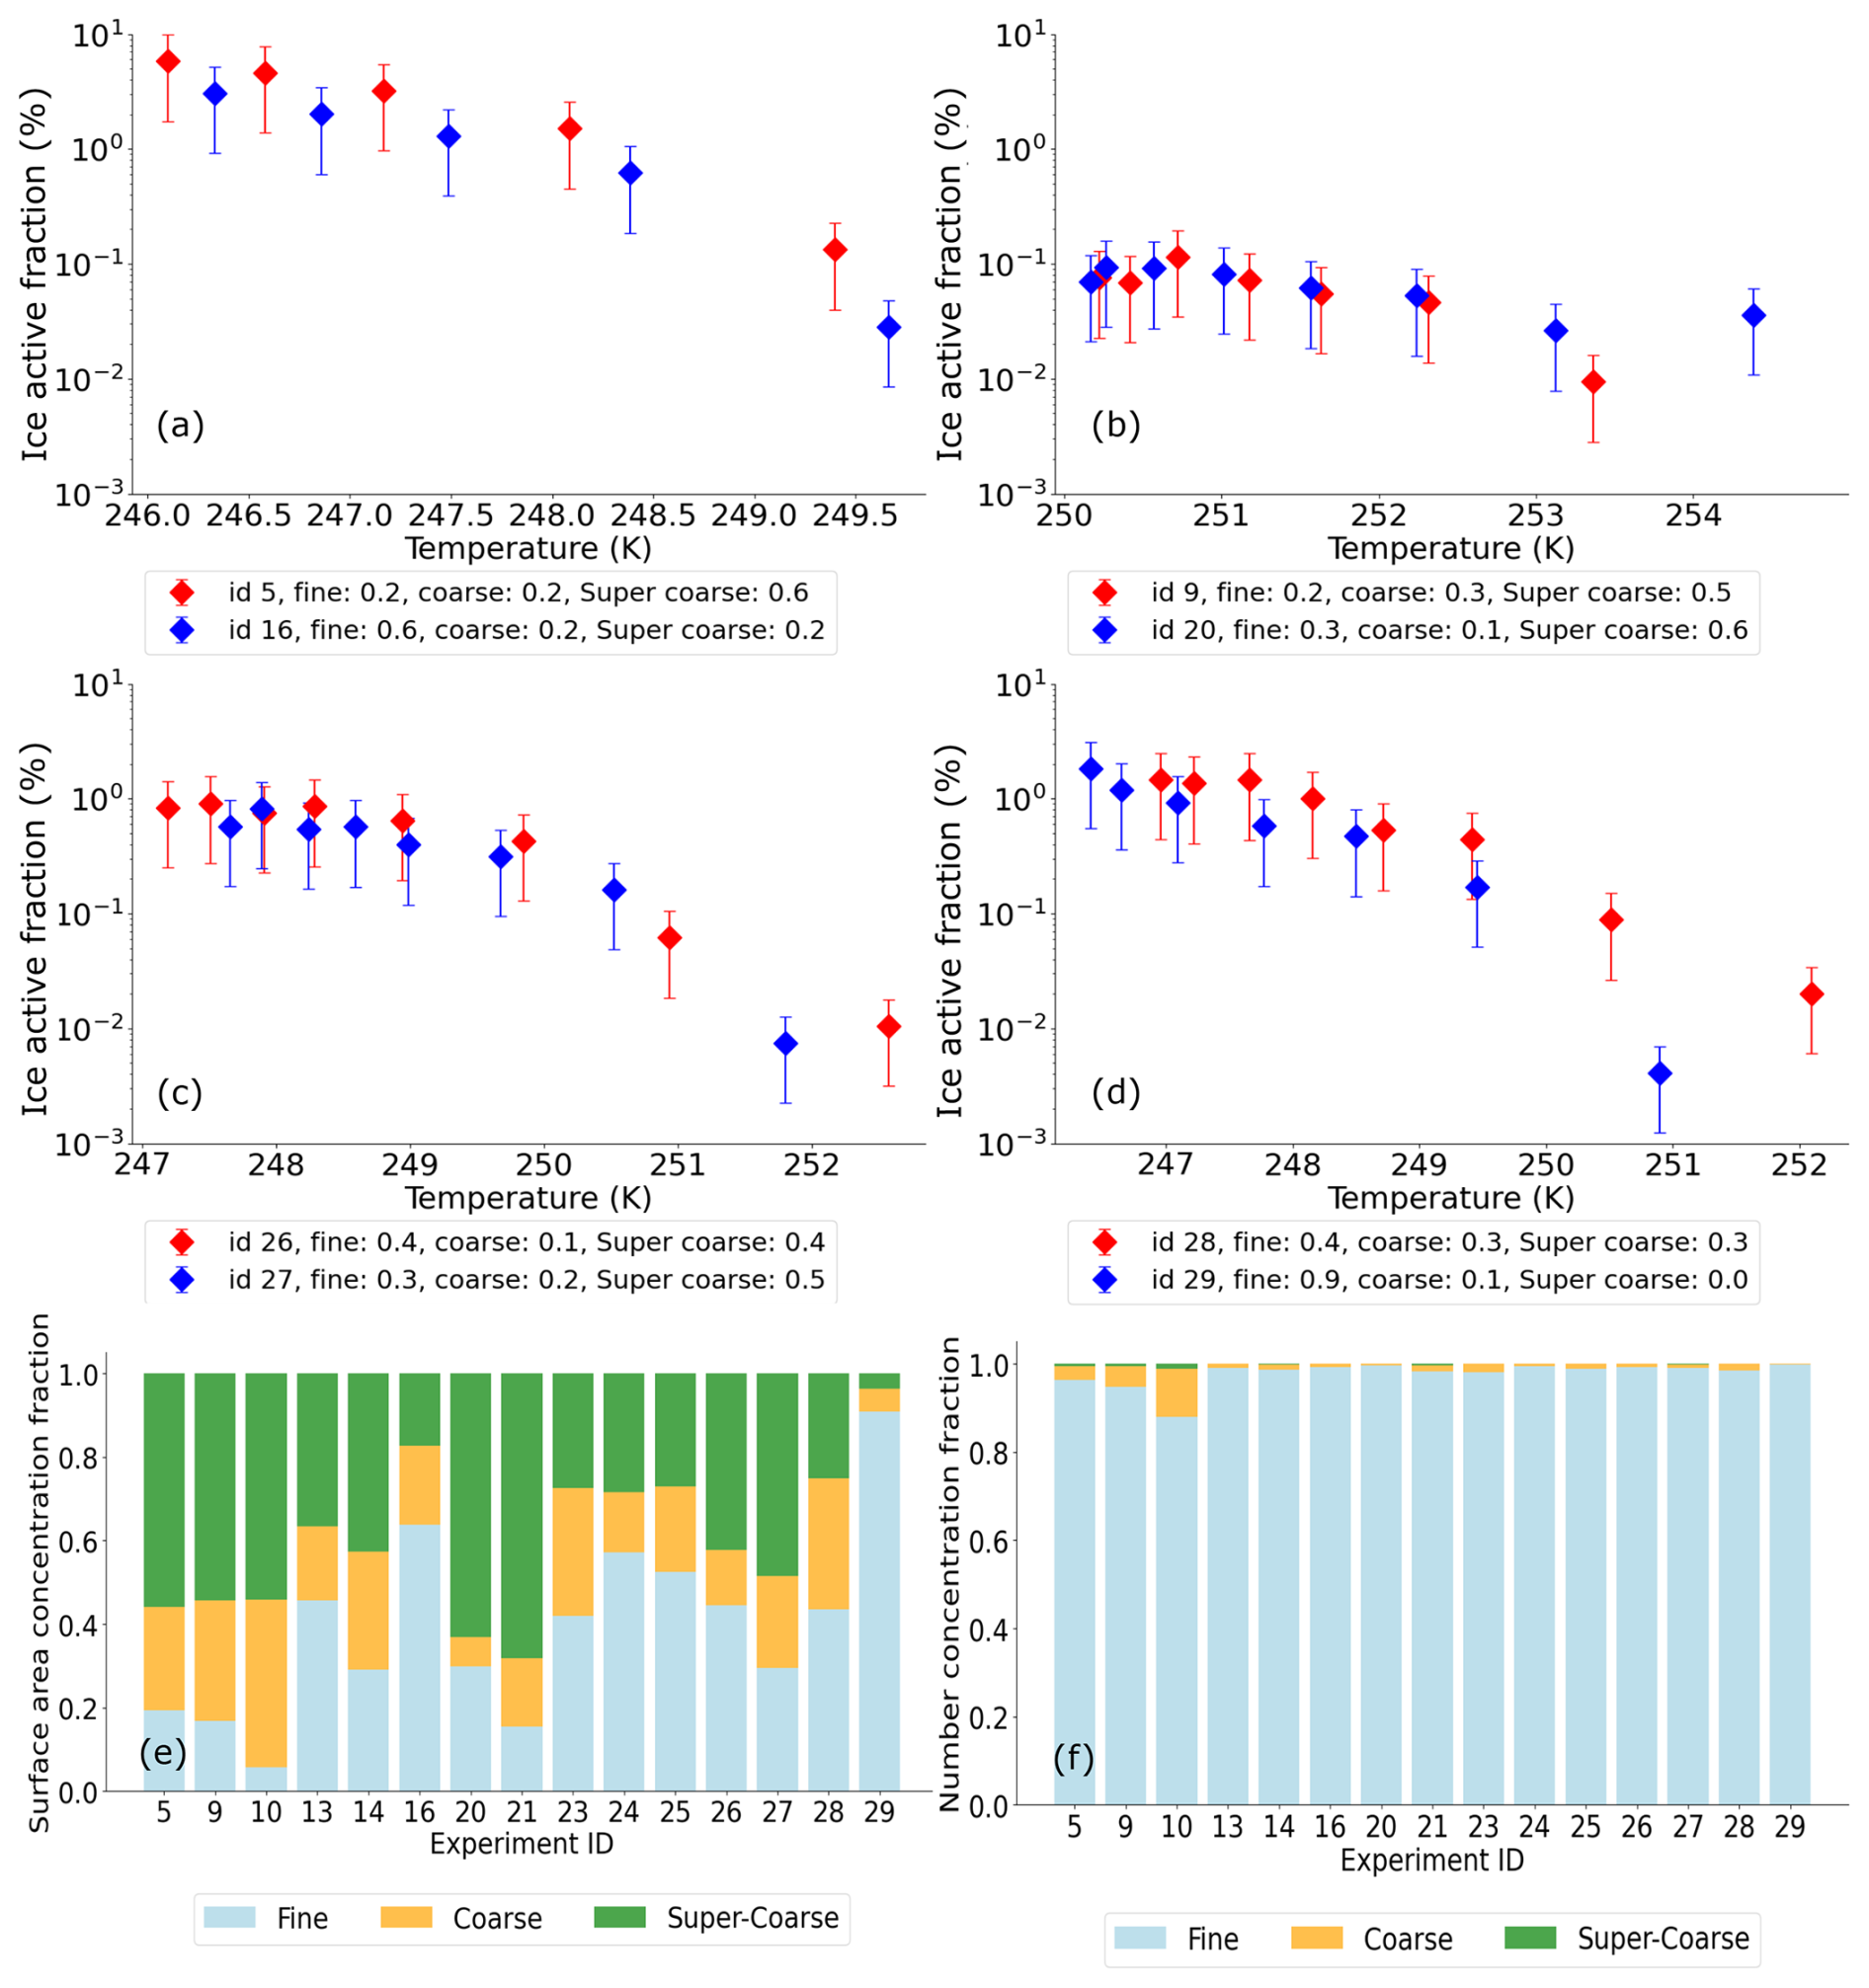
Figure 13Ice active fraction for AIDA experiments carried out with the same initial temperature, but using dust aerosol with different contributions of fine, coarse, and super-coarse particles to the total surface area for Moroccan samples, contribution from each size range are indicated in the label. (a) Experiments 5 and 16 at 249 K, (b) experiments 9 and 20 at 254 K, (c) experiment 26 and 27 at 252 K, (d) experiment 28 and 29 at 251 K, (e) surface area concentration ratio and, (f) number fraction of particles for Moroccan samples divided into fine, coarse, and super-coarse particle contributions for each experiment.
4.3.3 Icelandic samples
Regarding our experiments, Fig. 14e and f show the surface area concentration ratio and number particle concentration ratio of each experiment divided according to the pyroxene size dependence presented in Panta et al. (2025). Comparing again, this time for Icelandic dust samples, our experiments carried out at similar start temperatures but with different size ratio contributions, we found that almost all experiments that contained a higher proportion of small particles yielded higher ice active fractions (Fig. 14). For example, in Fig. 14a, experiment 3 exhibited a higher ice active fraction than experiment 11. Additionally, experiment 3 showed a larger surface area ratio for particles with diameters smaller than 4 µm compared to experiment 11. A similar trend can be observed in Fig. 14d. Despite a difference of approximately 1 K in the initial temperature between experiments 6 and 30, experiment 6 (conducted at a lower temperature) did not exhibit a higher ice active fraction. Interpreting this result in conjunction with the surface area ratio (Fig. 14e), we note that the contribution of particles with diameters smaller than 2 µm to the total surface area is significantly lower in experiment 6 than in experiment 30. Experiments 17 and 22 (Fig. 14c) displayed nearly identical ice active fraction activity and surface area ratios. Finally, Fig. 14c reveals a gradient in ice active fraction activity, increasing from experiments 34 to 33 to 31. Notably, the contribution of particles with diameters smaller than 2 µm to the total surface area in experiment 34 was minimal. This experiment exhibited the lowest ice active fraction values, and only at a temperature approximately 246.5 K did its ice active fraction become comparable to that of experiment 33. This behavior aligns with the size dependence of pyroxene, where the relative volume fraction of pyroxene is higher for smaller particle sizes and decreases with increasing size. Consequently, a larger surface area concentration from small particles implies a higher probability of pyroxene content and the presence of active sites. However, a discrepancy arises in experiment 31. Based on the aforementioned reasoning, experiment 33 would be expected to exhibit the highest ice active fraction among the compared experiments, as it has the highest contribution from particles with diameters smaller than 4 µm at that temperature. Contrary to this expectation, experiment 31 demonstrated the highest ice active fraction. The reasons for this deviation remain unclear. Nevertheless, we can conclude that, in general, a trend was observed in which experiments with similar surface area ratios exhibited similar ice active fractions, and those with a greater contribution from smaller particles (diameters below 4 µm) tended to have higher ice active fractions.
4.3.4 Comparison with other studies for Icelandic samples
Contradictory behavior has been reported regarding the ice-activity of Icelandic and volcanic samples. Steinke et al. (2011) did not observe differences in ns when evaluating samples with diameters smaller than 5 µm and samples with diameters smaller than 10 µm. On the other hand, Jahn et al. (2019) found that, when analyzing 4 different size fractions (PM2.5, PM2.5–10, PM10–37, and PM37) of the same sample, the smallest particles showed a higher ns. Nevertheless, the difference between PM2.5–10 and PM10–37 was not very pronounced, with the most noticeable difference being the onset of ice nucleation, which occurred at a warmer temperature for PM2.5–10. Finally, Sanchez-Marroquin et al. (2020) reported that samples with the largest surface area had the highest number of INP concentration. However, when analyzing the data in terms of ns (normalizing the number concentration of INP by the total surface area) or the ice active fraction (ice number concentration divided by the aerosol concentration), there was no clear trend with size.
What can explain the ambiguity regarding results on the size dependence of INA of volcanic-related samples? Following the idea that pyroxene is one of the main players in the INA of samples of volcanic origin, we can confirm that in our Icelandic samples, the greatest contribution to the relative volume fraction of pyroxene came from particle sizes in the range 0.1–8 µm and almost no contribution came from sizes larger than 16 µm (Panta et al., 2023). This feature may explain why in Steinke et al. (2011) no size dependence was observed. In their experiment, when including particles larger than 5 µm the size fraction contributed only around 5 % to the total surface area (Fig. A4). Under the assumption that the size dependence of mineralogical composition followed a similar behavior as for our samples, only a small proportion of pyroxene was removed compared to what remained in their experiment with particles smaller than 5 µm. Hence, the total amount of pyroxene or minerals with similar size dependence for both samples did not differ substantially, leading to a similar ice activity. This reasoning also matches with what was reported in Jahn et al. (2019). In their study, PM2.5 exhibited the highest ice active fraction. PM2.5–10 presented a similar onset of freezing and at the early stage of cooling had a similar behavior as PM2.5, but once the most active sites were activated, the ice active fraction later became comparable to PM10–37, which lacks most of the pyroxene under the assumption that their samples have a similar mineralogical size dependence to ours. However, the above reasoning does not explain that in Sanchez-Marroquin et al. (2020) more INP were related with larger surface area concentrations. Nevertheless, as mentioned before, the relationship presented in Sanchez-Marroquin et al. (2020) for ns or the ice active fraction with size does not clearly indicate that samples with larger surface area concentration will have a higher INA. Additionally, the fact that the ice active fraction in their experiments spans several degrees of temperature is a strong indication of the heterogeneity of the samples, as well as the variation in the size-resolved composition of the different samples, indicating a more complex composition and interplay of different ice nucleating agents.
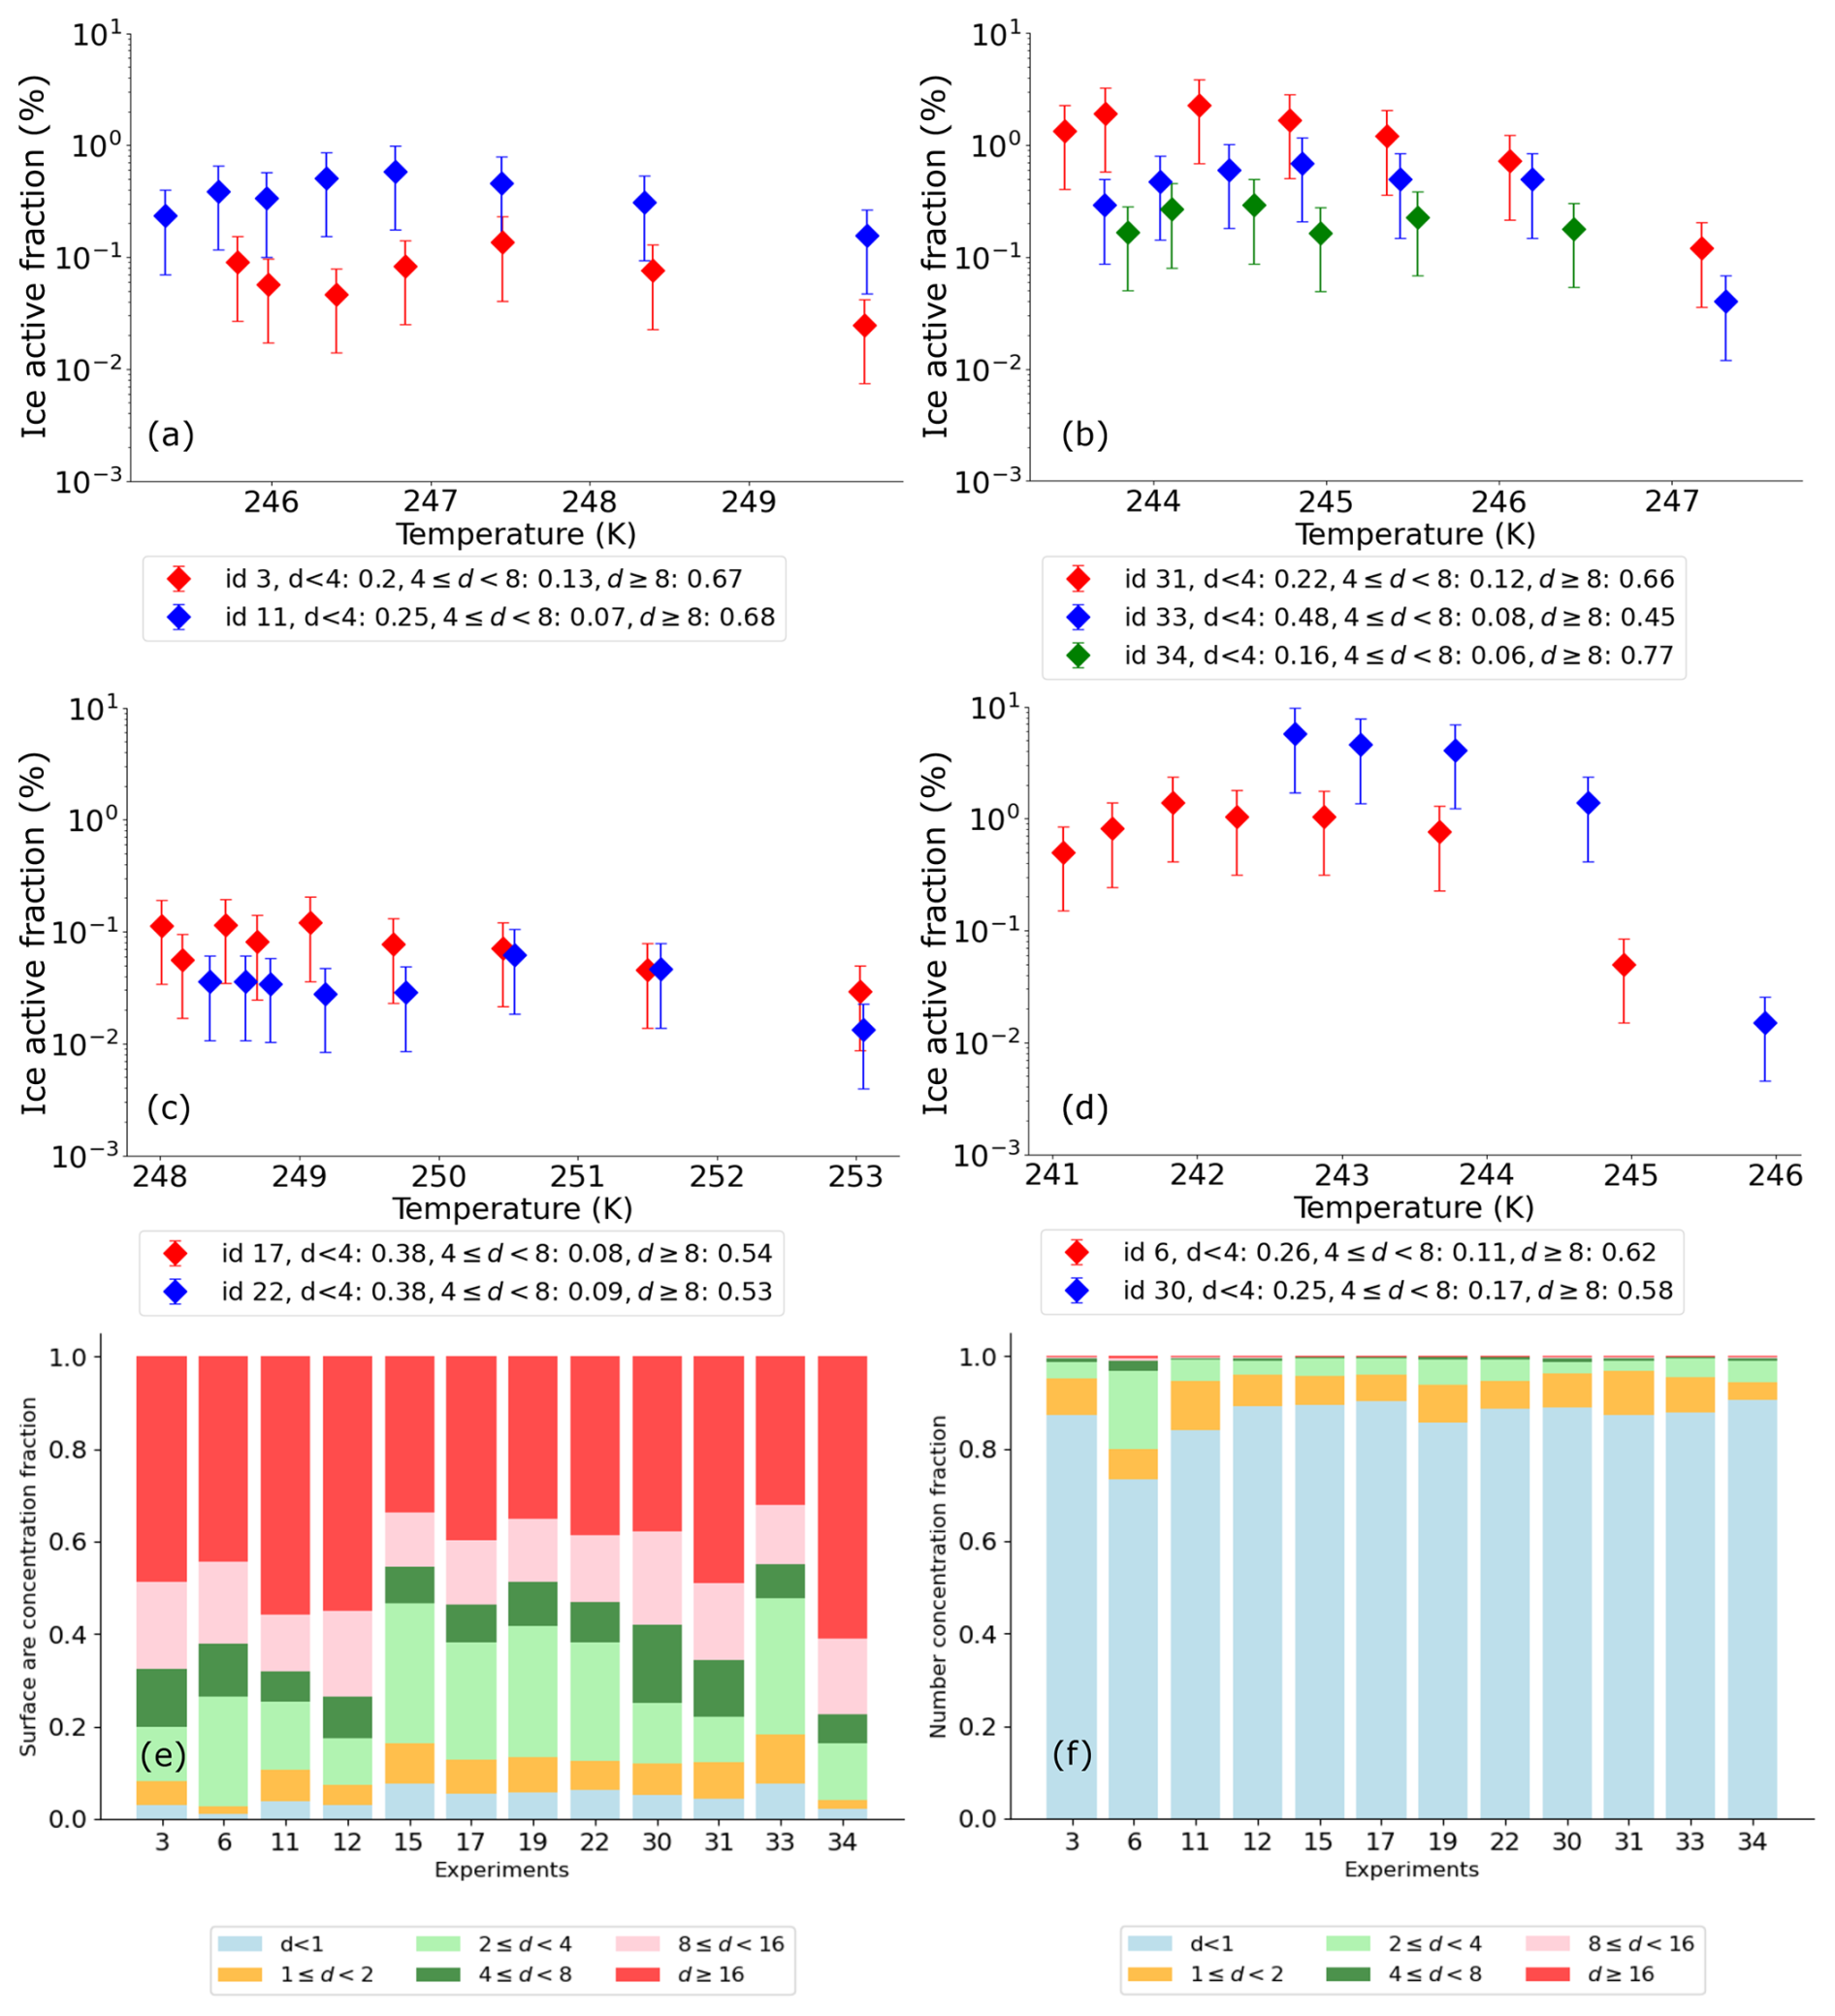
Figure 14Ice active fraction for experiments with Icelandic samples carried out at the same initial temperatures: (a) T≈ 249 K, (b) T=247 K, (c) T=253 K, (d) 245, labels indicate the contribution to the total surface area from each bin. A more detailed division is presented in (e) Surface area concentration ratio and (f) number fraction of particles for samples divided according to the size dependence of the pyroxene relative volume fraction presented in Panta et al. (2025).
4.3.5 Quantitative assessment of size dependence
We have computed pairwise comparisons of the ice active fraction between experiments sharing the same dust source but differing in particle size distribution. For each pair, we report the median log 10 ratio () of frozen fractions at matched temperatures (temperature difference smaller than 0.7 K), defined as , where FFa and FFb are the ice active frozen fractions at matched temperatures for experiments a and b, respectively, as reported in Figs. 13 and 14 for Morocco and Iceland, its interquartile range (IQRlog), the geometric mean ratio (), and the two-sided Wilcoxon signed-rank test p-value. The Wilcoxon signed-rank test is a non-parametric test of the null hypothesis that the median log ratio is zero, i.e. that the two experiments are statistically equivalent. A p-value below 0.05 indicates that the null hypothesis is rejected at the 5 % significance level, meaning that a difference as large as observed would occur by chance in fewer than 5 % of cases if the two experiments were truly equivalent. For Morocco (Table 5), the four pairwise comparisons yield geometric mean ratios ranging from 0.664 (experiments 27 and 26) to 2.138 (experiments 28 and 29), indicating that at the typical matched temperature, experiment 28 has 2.138 times higher frozen fraction than experiment 29. Only one pair reaches statistical significance (experiments 28 and 29, p=0.016). The remaining three pairs show no significant difference (p in the range of 0.062–0.375), and the median log ratios are similar to their IQRlog, e.g. experiments 5 and 16 have a of 0.277 and IQRlog=0.180. This shows that the ice active frozen fraction shows no systematic dependence on particle size for Moroccan dust: the differences between size fractions are modest, statistically weak, and do not point consistently in any direction.
For Iceland (Table 6), all five pairs with sufficiently large number of matched points (n≥6) yield statistically significant differences (p in the range of 0.008–0.031), with geometric mean ratios ranging from 2.1 to 8.3. The pairs with the largest G values correspond to experiments 31 and 34 and experiments 11 and 3, with geometric mean ratios of 8.296 and 5.043, respectively. As shown in Fig. 14, experiments 11 and 31 contain a larger contribution from particles with diameters smaller than 0.8 µm to the total surface area than experiments 3 and 34. In contrast, Fig. 14c shows that experiments 17 and 22 have nearly identical surface area fractions, which is reflected in their statistics: although experiment 17 is consistently above experiment 22 (p=0.008), the ratio varies considerably across the temperature range (IQRlog=0.306, ), with a geometric mean ratio closer to those observed for Moroccan paired experiments. It is worth noting that for all other Icelandic pairs the IQRlog is at least half the value of , indicating a more consistent and strong offset across temperatures. Furthermore, the case of experiments 31 and 33 is noteworthy: despite experiment 33 having a larger surface area contribution from particles smaller than 8 µm than experiment 31, experiment 33 exhibits systematically lower ice active frozen fractions at comparable temperatures, a difference that is statistically significant (p=0.016, , IQRlog=0.237). It is not clear why this pair deviates from the general trend, whereby a larger contribution from smaller particle diameters to the total surface area is associated with higher ice-active frozen fractions at equivalent temperatures.
The one pair that does not reach significance (experiments 30 and 6, p=0.125) is constrained by n=4 matched points, for which p=0.125 is the minimum achievable p-value by construction of the exact Wilcoxon test, regardless of size effect. However, the geometric mean ratio of 5.399 and IQRlog of 0.208 for this pair are consistent with the other Iceland pairs. Taken together, the Iceland comparisons provide quantitative evidence for a size-dependent ice nucleation activity signal that is both statistically significant and physically large.
Table 5Derived statistics for the pairwise logarithmic ratio of ice active frozen fraction between experiment number a (exp a) and experiment number b (exp b), defined as log 10(FFa(T))−log 10(FFb(T)), computed at matched temperatures (temperature difference smaller than 0.7 K) for the Morocco experiments shown in Fig. 13. n is the number of matched ice active frozen fraction pairs used in the calculations, is the median logarithmic ratio, IQRlog is the interquartile range of the log ratio (Q75−Q25), is the geometric mean ratio, and Wp is the two-sided Wilcoxon signed-rank test p-value.
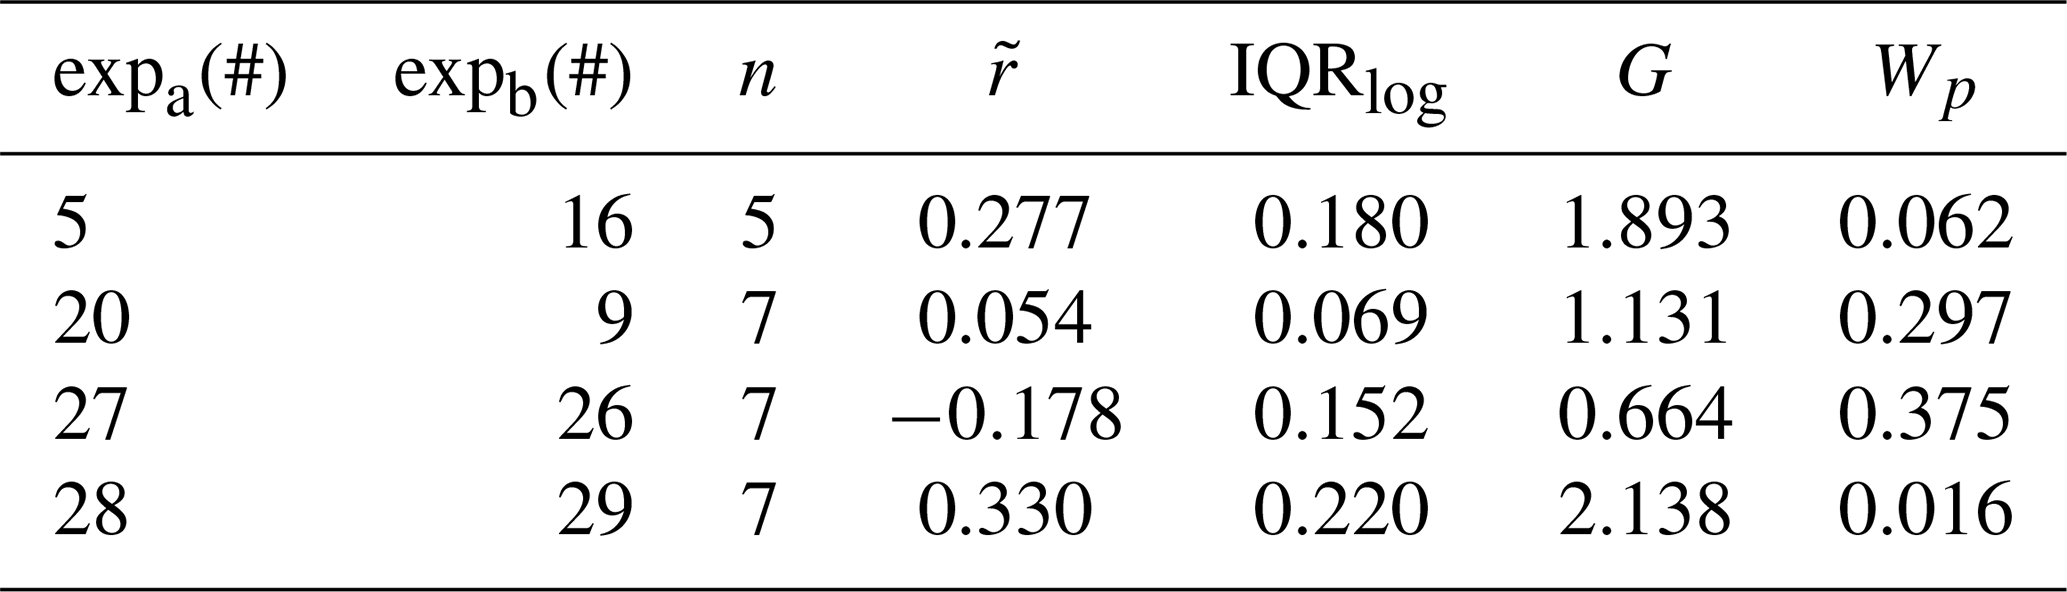
Table 6Derived statistics for the pairwise logarithmic ratio of ice active frozen fraction between experiment number a (exp a) and experiment number b (exp b), defined as log 10(FFa(T))−log 10(FFb(T)), computed at matched temperatures (temperature difference smaller than 0.7 K) for the Iceland experiments shown in Fig. 14. n is the number of matched ice active frozen fraction pairs used in the calculations, is the median logarithmic ratio, IQRlog is the interquartile range of the log ratio (Q75−Q25), is the geometric mean ratio, and Wp is the two-sided Wilcoxon signed-rank test p-value.
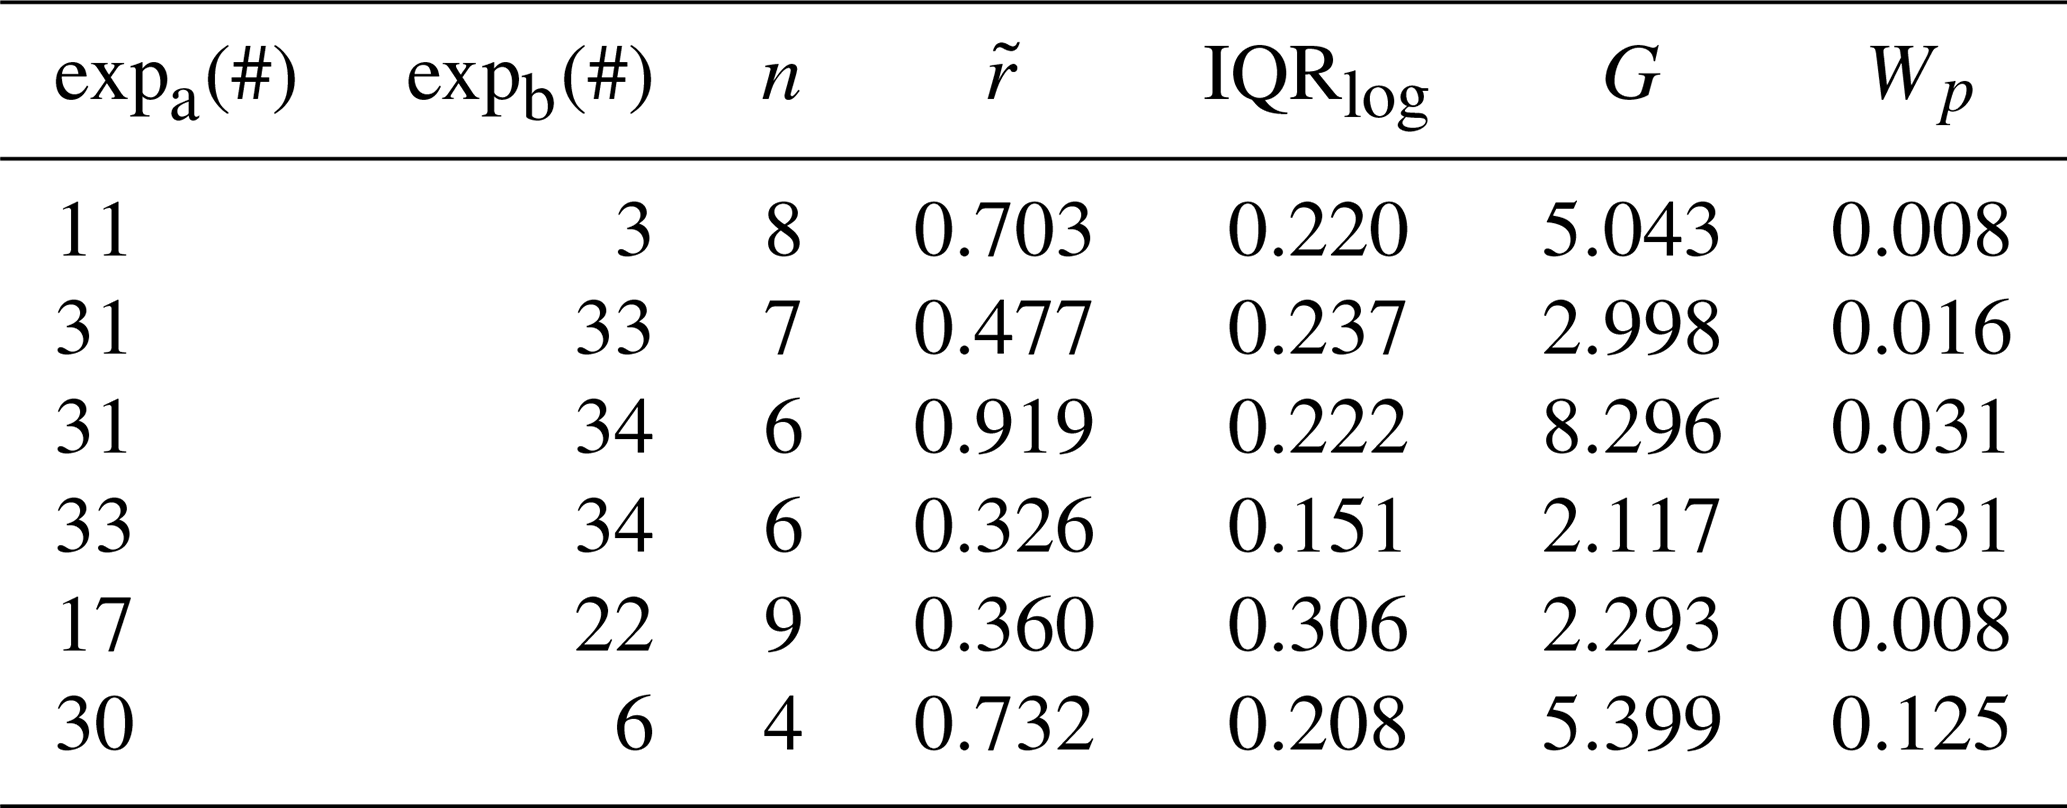
4.4 Effective surface area
The previous results (Table 4) were calculated with the standard assumption that ns(T) is independent of size, i.e. the density of active sites is constant for all size bins. However, under the assumption that the INA of a sample can be linked to the content of a specific mineral or group of minerals, the probability of finding an active site over the surface will not be the same as for all sizes when the relative fraction of that mineral varies with size. This is the case for both of our samples, Morocco and Iceland, where the relative fractions of feldspar and pyroxene vary with particle size.
If enough information about the mineral composition of a sample is known (as well as its size dependence) and if there is a group of minerals that dominates the INA (for example, feldspar), we hypothesize that accounting for this information when computing the surface area will improve the obtained value of ns(T) to predict the concentration of INPs. To test this hypothesis, we calculated ns(T) again, but this time we scaled the surface area to the fraction of feldspar or pyroxene present in each size bin (effective surface area) according to Panta et al. (2023, 2025). Figure 12 presents the obtained fit for ns(T) (T for Iceland and T for Morocco) using the effective surface area (“Iceland_Seff, This study” and “Morocco_Seff, This study”). The main effect of incorporating this new surface area for Iceland is an increase in the ns value by ≈1.5 orders of magnitude. Additionally, the new fit agrees with previous measurements of samples with similar origin or mineralogy, such as those reported by Steinke et al. (2011) and Jahn et al. (2019). This result can be interpreted as a good indicator that the INA of Icelandic samples can be scaled to the content of pyroxene at each size of the considered PSD.
Regarding Morocco, the effect of considering the effective surface area is less pronounced as for Iceland, Fig. 12 shows that the difference between both parameterizations is less than 1 order of magnitude and is within the 95 % confidence interval of the parameterization obtained with the complete surface area. This can be understood in terms of the mineral composition dependence on size, there is low variation of the relative volume fraction of feldspar (and k-feldspar) with size and accounting for almost 30 % for all sizes (Panta et al., 2023).
The differential nucleus concentration is a less commonly used metric in comparison with ns. Nevertheless, it provides additional information that cannot be derived from ns(T), for example, the computation of (Vali, 2014) allows comparing the freezing activity of samples when the temperature is varied ΔT. In this way, nearly constant values of w indicate that the freezing activity of the sample varies in a constant fashion when temperature is changed. This metric was presented in Fig. 8 for Morocco and Fig. 9 for Iceland. Moroccan samples presented a similar slope (w, especially for AIDA experiments) and less spread of the data around the linear fit, while Icelandic samples showed a larger difference in slope for AIDA experiments and a pronounced deviation from a linear behavior for INSEKT experiments. Upon closer inspection, it can be noticed that for our Moroccan samples, k(T) decreased nearly exponentially with temperature (Fig. 8a), whereas a more complex shape is observed for our Icelandic samples, where for temperatures warmer than 248 K the data presents a larger spread than for colder temperatures (Fig. 9a). In the work of Vali (2014), w was analyzed for several previously published experiments and it was found that no general trend in the behavior of w was present, i.e. deviations from the linear trend were quite frequent, and no possible sources of the deviations were suggested. Taking into account the characteristics of the mineral size dependence of our samples, as well as the results from preceding works discussed in previous sections and our own results, we hypothesize that one reason for the change in the exponential decrease of k(T) with temperature is the variation of the presence of the same dominant factor promoting ice nucleation. In the context of our experiments, this dominant factor was linked to mineralogy. In our Moroccan samples, all size bins presented contributions from K-feldspar and feldspar, and the biggest difference in the INA for samples of different surface area ratio contributions from fine, coare, and super-coarse particles was observed at warmer temperatures. On the other hand, we observed a strong dependence with size of the fraction of pyroxene, one of the main minerals for ice nucleation in our Icelandic samples. Pyroxene was mainly present in particles smaller than 8 µm and almost absent in particles with diameters larger than 16 µm. In this way, once the smaller and more active sizes nucleate at relatively warm temperatures, the subsequent nucleation are likely dominated by other minerals or a different probability of finding active sites on the surface of the remaining particles, changing the behavior of nucleation and the slope of w. To test this hypothesis, further experiments are required using samples of which the size dependence of their mineralogy is known and in which different size distributions/fractions are considered.
The ice nucleation activity of selected Moroccan and Icelandic dust sources was assessed using differential and cumulative ice nucleus concentrations, based on a combination of techniques including the cloud chambers AIDA and AIDAm and the freezing assays INSEKT and IR-DROFA, while accounting for both geometric and specific surface area (BET). These are dust-relevant sources located at low- and high-latitudes, given their dust emission load and effects on the atmosphere. The size range usually considered in experiments was extended towards larger particles, updating the surface area to account for a more realistic representation of the dust shape in light of new findings (ellipsoidal shape), and interpreting our results with mineralogy and size dependence information, outlining a more robust picture of the samples being tested.
The analysis of the mineralogical composition of samples from each source and the extended size distribution of our samples allowed us to evaluate a possible dependence of the INA on particle size and mineralogy. Despite the larger content of quartz in our Moroccan samples, the INA was higher and similar to that of feldspar which was present in a lower proportion. One possible reason for this behavior could be the loss in INA of quartz with time and exposure to air, as previous studies have suggested. Additionally, no dependence of INA on particle size was observed. Conversely, we conclude that a size dependence is present for Icelandic samples. Furthermore, the greatest disagreement for ns with other studies was present at warmer temperatures, especially in the case of Iceland when considering the INSEKT experiments.
The experimental data and the fit presented for Moroccan samples agree well with previous studies using samples of similar origin or mineralogy, reinforcing the understanding that one of the predominant factors for active sites and nucleation is the presence of ice-active mineralogical components in the samples. On this basis, an important conclusion of this study is that the validity of typical approximations used in the calculation of ns(T) needs to be evaluated for samples including particles of a wide size range. When considering a polydisperse aerosol in which each particle acts as a CCN and subsequently nucleates, it is at the heart of the calculation of ns that ns(T) can be assumed constant and independent of size. In the past, some studies have checked this condition (Steinke et al., 2011). However, the number size distributions considered were generally very narrow, not extending beyond a couple of µm, so that the particle properties did not vary strongly. However, it is known that particles larger than 10 µm in diameter (as previously discussed, many studies have not considered PSDs larger than that) can travel far from their source and interact with water and water vapor in the atmosphere (Ryder et al., 2020). Therefore, applying existing parameterizations to wider size distributions requires caution. As we demonstrated based on the mineralogy of our samples, the ice activity of samples from different sources shows different relationships with size and size-variable fractions of minerals considered as the main agents of ice nucleation. For our samples from Morocco, feldspar increased with size while K-feldspar was almost constant. As a consequence, the ns(T) values obtained from our experiments are consistent with those estimated for K-feldspar fractions between 1 % and 20 % in previous studies. In contrast, the obtained parameterization for Iceland disagrees from previous studies of similar source or mineralogy by 1.5 to 2 orders of magnitude.
We proposed to use an effective surface area in the calculation of ns(T), in which the total surface area of each size bin is replaced by the surface area fraction of the most ice active minerals for which the probability of finding an active site is larger. The change in the ns obtained for Morocco was less than 1 order of magnitude while for Iceland it was close to 1.5 orders of magnitude, Fig. 12 red dashed line (“Morocco_Seff, This study”) and green dashed line (“Iceland_Seff, This study”), respectively. Additionally, the fit obtained with the effective surface area for Iceland agreed with previous measurements of similar origin or mineralogical compositions. Based on the above, we can conclude that the results presented here have direct implications for the parameterization of INA from HLD sources in atmospheric models. Existing parameterizations used in cloud microphysics schemes are predominantly derived from LLD and MLD sources. Our results show that applying these parameterizations to Icelandic dust would overestimate INP concentrations by up to 1.5–2 orders of magnitude (Fig. 10b). This overestimation would translate into an excessive glaciation of Arctic and boreal mixed-pase clouds with potential effects on cloud lifetime, optical depth, and precipitation. Additionally, the observed pyroxene-associated variability with the INA underscores that a single deterministic parameterization may be insufficient for Icelandic or volcanic related sources. This variability is related to the heterogeneity in pyroxene content and surface properties, and suggests that representing HLD as a distinct aerosol class with source-specific and surface area dependent INP parameterizations in regional Arctic models would improve the fidelity of simulated mixed-phase cloud properties. To this end, the effective surface area approach introduced here – which scales the particle surface area to the size-dependent pyroxene fraction – offers a physically based framework to incorporate mineralogical variability into INP parameterizations for HLD sources.
The difference in the dependence of mineralogy on size for samples of different sources also suggests a need for reconsideration of how ice nucleation on particles occurs. It is generally thought that larger particles will nucleate first, because they have a larger surface area, increasing the probability of finding highly active nucleation sites. However, in the scope of our results and previous ones (Jahn et al., 2019; Reicher et al., 2019), there is evidence that under certain conditions smaller particles nucleate first. It is still uncertain whether this behavior persists under atmospheric conditions. For instance, larger particles might interact more strongly with chemical and organic components, potentially lowering or enhancing their INA. Alternatively, assuming a decreasing temperature, nucleation may begin with smaller particles that have a higher density of active sites, while larger, coated particles activate later, leaving intermediate sized particles to nucleate only at colder temperatures. Further research is required to clarify these mechanisms. However, this suggests considering a size-dependence of ns(T), and future experiments should take into account that ice nucleation may not happen in a similar fashion for each size. This is especially relevant when considering size distributions that extend over several orders of magnitude given the square dependence of surface area on size, where larger particles contribute significantly more than smaller ones to the total surface area concentration. To illustrate the atmospheric relevance of our parameterizations, we present a simple idealized comparison of predicted INP concentrations using the Morocco and Iceland parameterizations from Table 4, grounded in atmospheric observations of Icelandic dust from Sanchez-Marroquin et al. (2020). In that study, airborne Icelandic dust surface area concentrations during dust events were reported. Using a representative dust surface area concentration of 50 µm2 cm−3 (Table S1 in Sanchez-Marroquin et al., 2020), the Morocco parameterization predicts INP concentrations approximately 3.5 times higher than the Iceland parameterization at 255 K, increasing to approximately 46 times (1.7 orders of magnitude) at 247 K. This demonstrates that the choice of parameterization becomes increasingly important at colder temperatures relevant for mixed-phase cloud glaciation. However, it is important to emphasize the idealized and illustrative nature of this comparison. Implementing source-specific INP parameterizations in atmospheric models poses several important challenges. For example, Icelandic dust is an episodic source with high temporal variability (Groot Zwaaftink et al., 2017), requiring accurate representation of dust emission events in regional and global models. Additionally, ns requires knowledge of the PSD evolution of the emitted dust, making it necessary that models independently track Icelandic dust. Furthermore, the relative contribution of Icelandic dust to the atmospheric INP population compared to other dust sources, and the altitudes and temperatures at which this contribution is most relevant, remains to be quantified through dedicated modeling studies. We plan to address these challenges in future work combining the parameterizations derived here with a dust transport model and source-specific tags for high-latitude sources.
AIDAm allowed us to perform ice nucleation experiments of the samples of interest at a higher temporal frequency than AIDA by repeatedly sampling aerosol from AIDA into a small volume chamber and completing an expansion experiment within 6 min (flush – AIDAm is flushed with air and aerosol from AIDA, expansion – adabatic expansion and cooling to initiate ice formation, and refill – replenishing with air from AIDA to reach the same pressure, Vogel et al., 2022). This means that consecutive experiments in AIDAm consider changes in the aerosol PSD in AIDA, which we expect to contain a decreasing proportion of large particles during the one hour before AIDA expansion. AIDAm experiments thereby offer the opportunity to investigate the impact of changes in the dust PSD on ice nucleation activity. Figure A1 shows ns(T) colored by the expansion relative time to the sample injection (time since the first expansion in AIDAm for a given AIDA experiment) for (a) Morocco and (b) Iceland. It can be seen that for both sample sources the expansions are consistent over time for a period of ≈ 5000 s. Additionally, when the experiments were color-coded by mean PSD diameter, no clear trend was observed (not shown). It can also be observed that the values measured with AIDAm differ significantly from those obtained with AIDA (red line in Fig. A1a and b). The experiments using AIDAm show a shift of 6 to 7 K compared to AIDA. Vogel et al. (2022) discussed a dependence of the ns values obtained with AIDAm on the flow rate. However, they found that at expansion flow rates of 10 L min−1, both techniques agreed. It remains unclear whether this is a general trend for all aerosols or specific to the ones considered in the validation of the technique. In the present work, an expansion flow rate of 10 L min−1 was used. Therefore, the reasons for the disagreement between the two techniques are not clear, and for this reason, we did not include AIDAm in the calculations to obtain the parameterizations, but used it only to evaluate the reliability of the experiments over time and the dependence of IN activity on changes in the size distribution.
Additionally, the mean and standard deviation of the measured surface area distribution before expansion in AIDAm for the same experiment ID across different runs is presented in Figs. A2 and A3 for Morocco and Iceland, respectively, along the distributions measured by laser diffraction right after the samples were sieved.
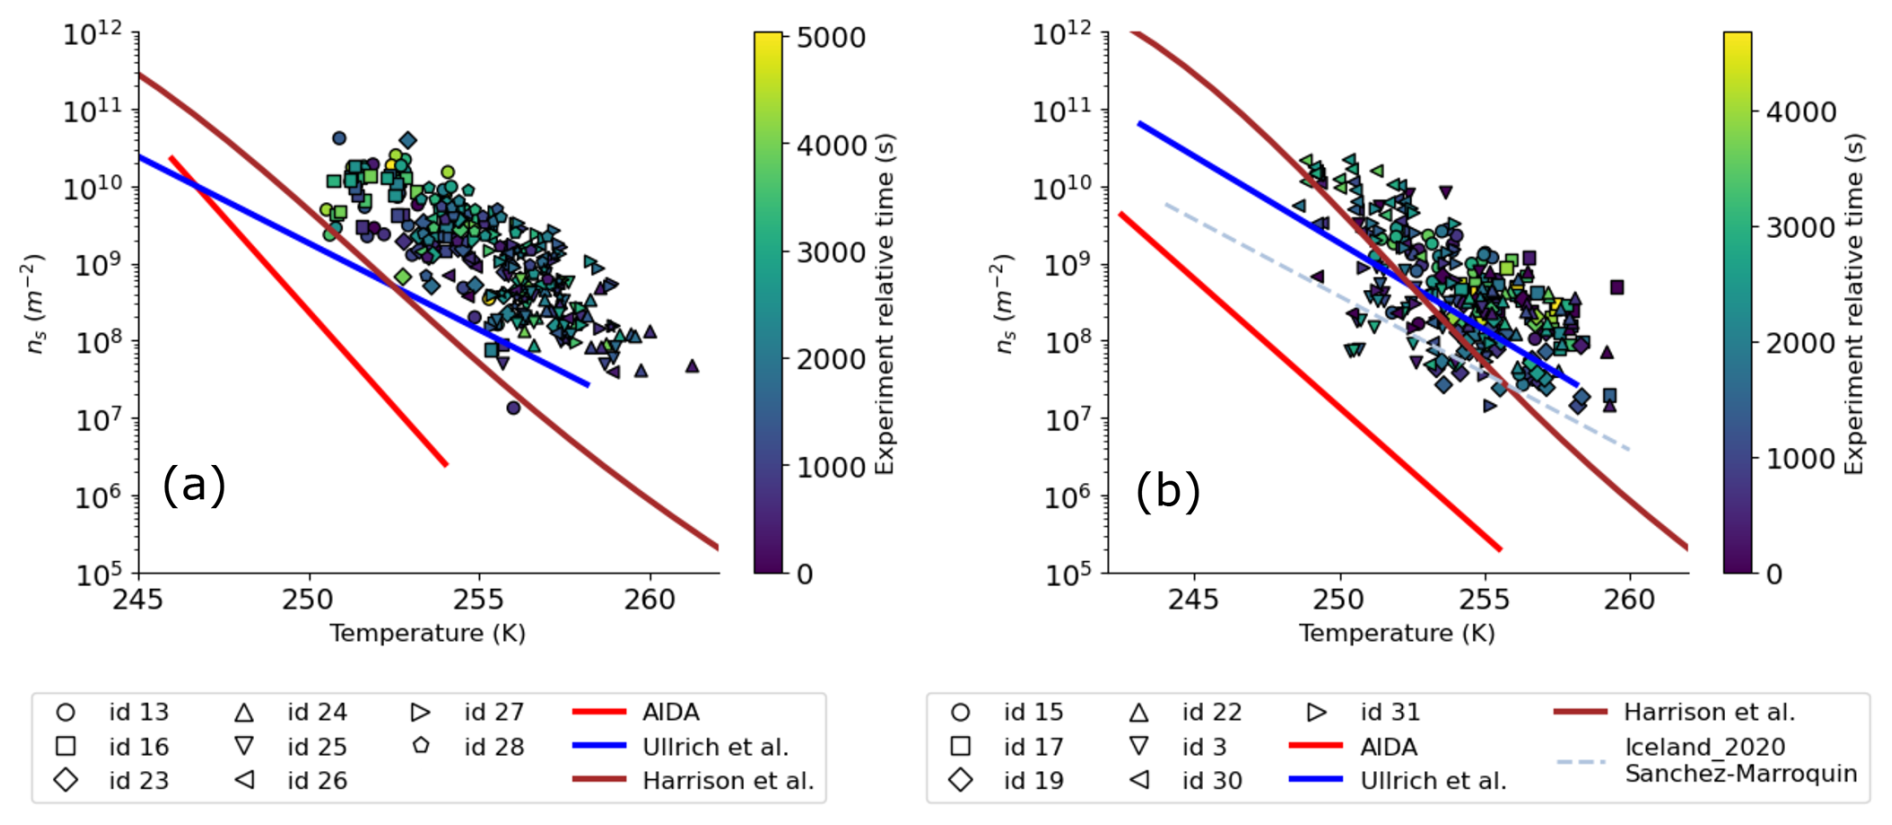
Figure A1INAS density for AIDAm experiments. Symbol color refers to the time at which AIDAm experiment is performed relative to the first expansion in AIDAm for each injection in AIDA. (a) for Moroccan samples, AIDA is the fit developed with AIDA experiments for Morocco. (b) for Icelandic samples, AIDA is the fit obtained with AIDA experiments for our Icelandic samples. In addition, relevant parameterizations from other authors are considered: Harrison et al (Harrison et al., 2019) is the fit for k-feldspar, Ullrich et al (Ullrich et al., 2017) and Iceland_2020 Sanchez-Marroquin (Sanchez-Marroquin et al., 2020).
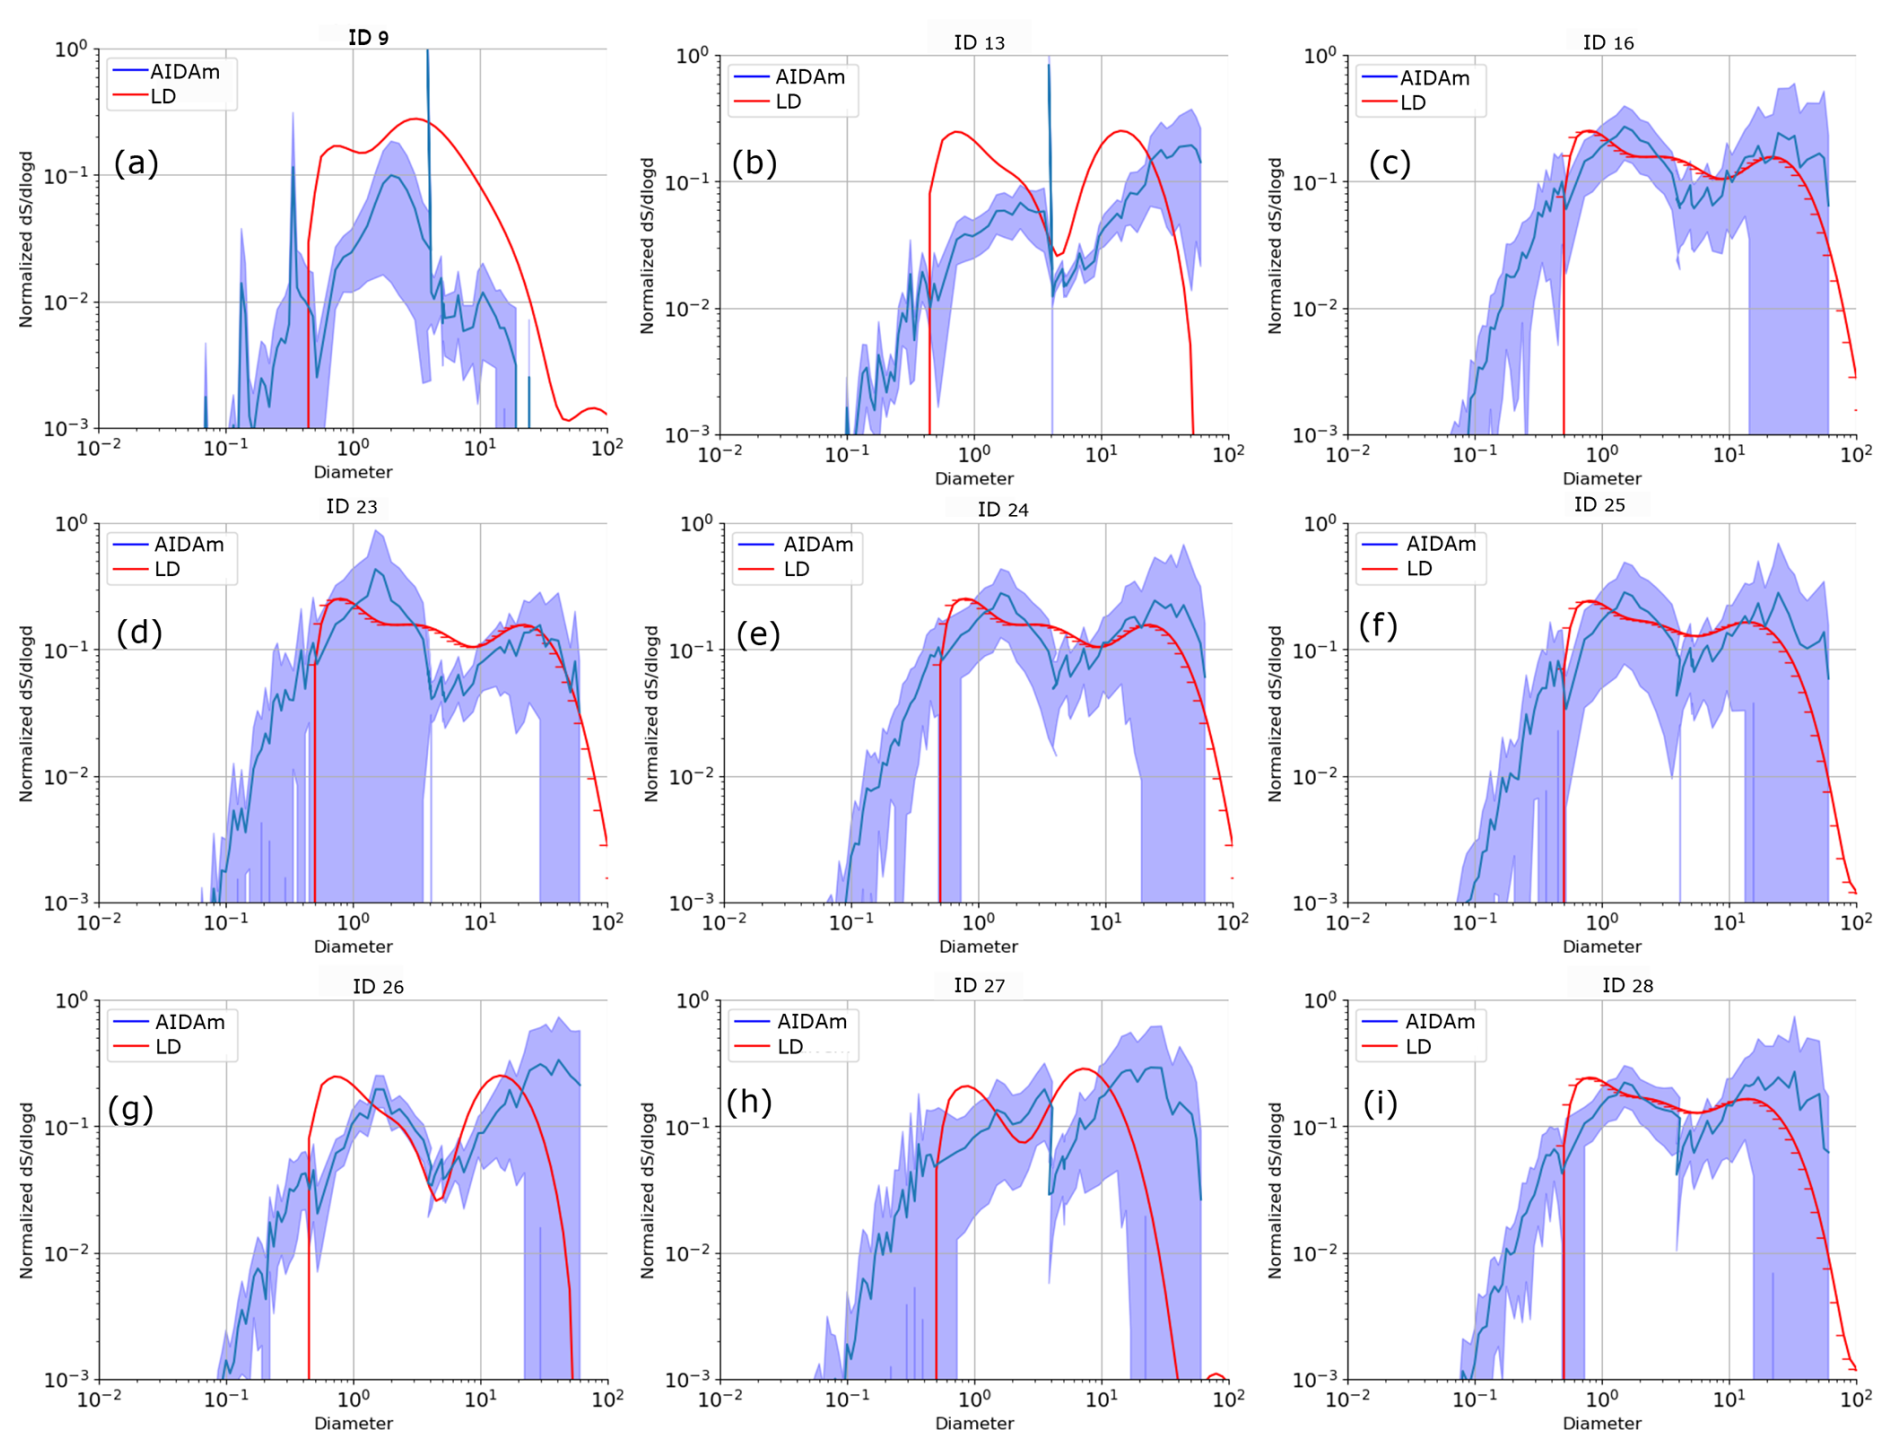
Figure A2Normalized surface area distribution for AIDAm experiments for Moroccan samples. The blue line represents the mean value, while the blue shading indicates the standard deviation across all expansions of the same sample, as measured by AIDAm sensors before expansion (SMPS, APS, and OPC). The red line represents measurements obtained using the laser diffraction (LD) technique on the freshly sieved sample.
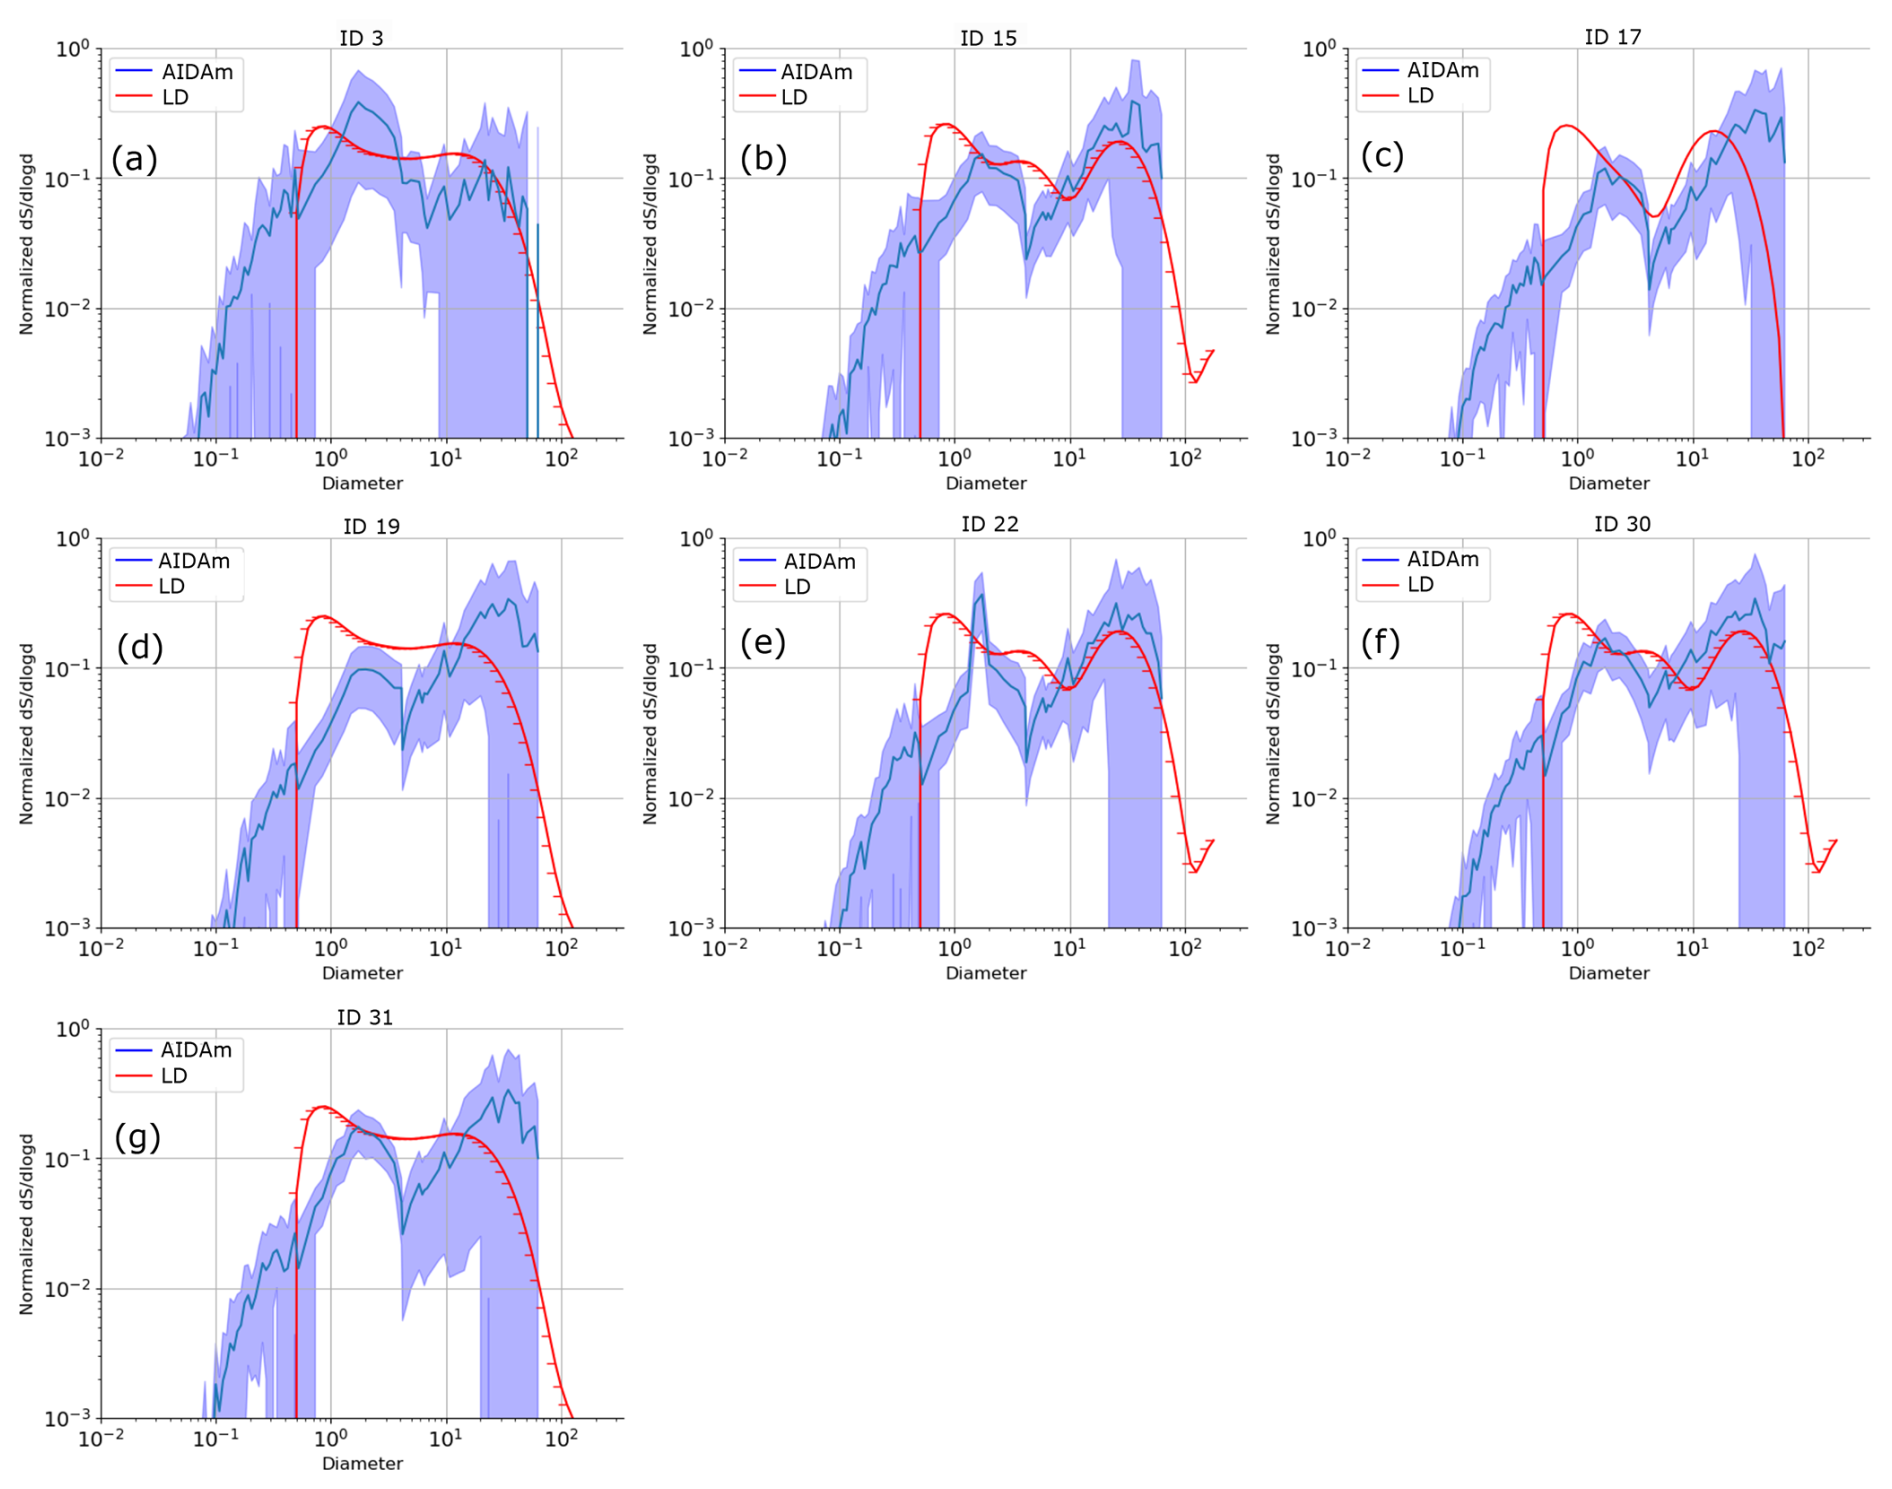
Figure A3Normalized surface area distribution for AIDAm experiments for Icelandic samples. The blue line represents the mean value, while the blue shading indicates the standard deviation across all expansions of the same sample, as measured by AIDAm sensors before expansion (SMPS, APS, and OPC). The red line represents measurements obtained using the laser diffraction (LD) technique on the freshly sieved sample.
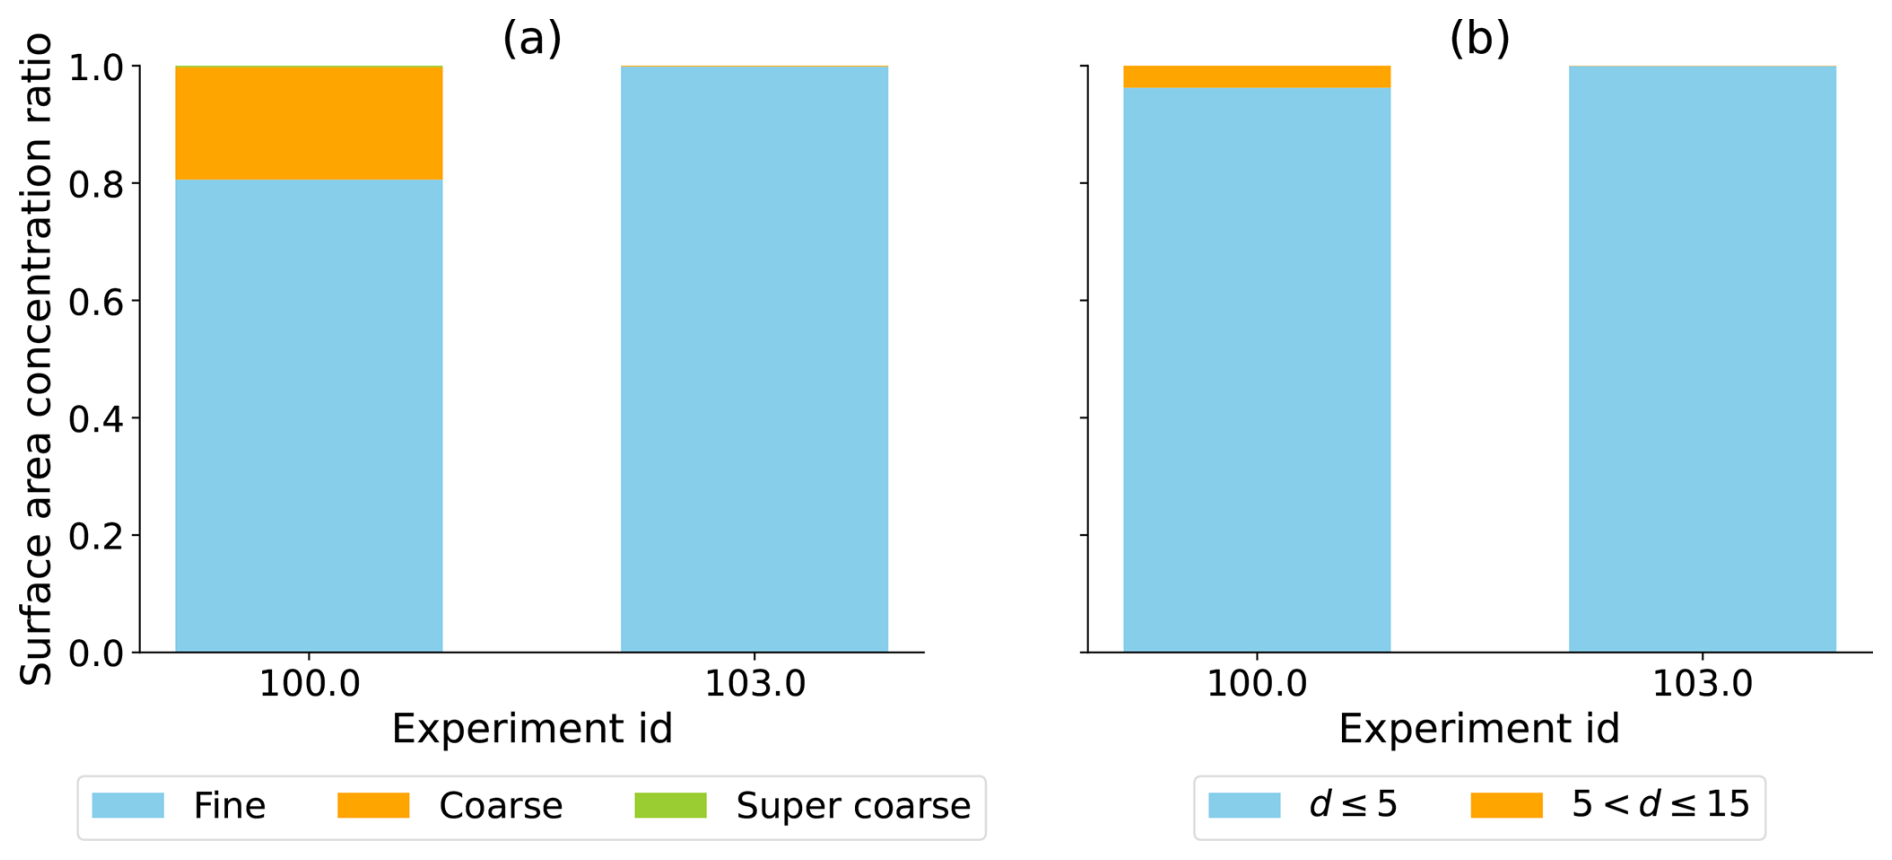
Figure A4Surface area concentration ratio for Iceland experiments in Steinke et al. (2011). Contribution of size ranges divided into (a) fine, coarse, and super-coarse particles, (b) d≤5 and . Metrics computed according to information presented in Fig. 3 in Steinke et al. (2011). Exp 100 with a cut-off of 15 µm, and exp 103 with a cut-off of 5 µm.
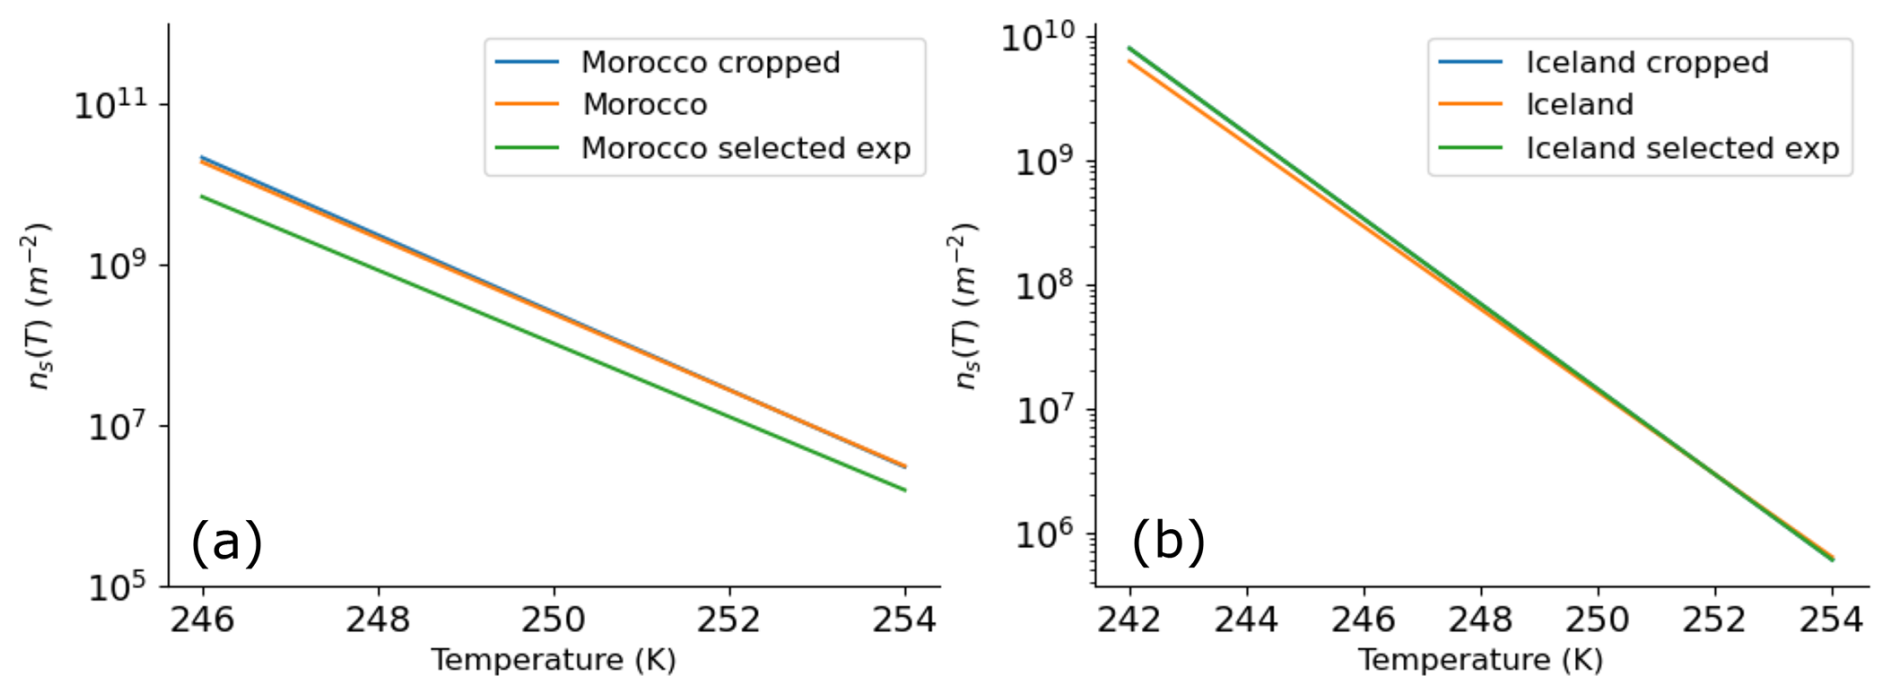
Figure A5(a) INAS density fit computed with all experiments for Morocco (orange line, “Morocco””), not considering experiments IDs 5, 9, 10 (blue line, “Morocco cropped”), and only considering experiment IDs 5, 9, 10 (green line, “Morocco selected exp”). (b) as in (a) but for all experiments for Iceland (orange line, “Iceland”), not considering experiment IDs 12, 34 (blue line, “Iceland cropped”), considering only experiment IDs 12, 34 (green line, “Iceland selected exp”).
The adsorption isotherms of the Type IV (Sing, 1985) exhibit a hysteresis loop associated with capillary condensation in mesopores and the limiting uptake over a range of high (Fig. B1a). The initial rise at the low part of the Type IV isotherm is attributed to monolayer-multilayer adsorption. The strong adsorption in the low range suggests presence of nanopores; further analysis (Non-Linear Density Function Theory, NLDFT) reveals the presence of nanopores in the range from 3 to 5 nm characteristic for aggregates of clay particles (so called “intra-tachoid porosity”, the slit-like voids between the nanocrystallites, Fig. B1b). The H3/H4 – type hysteresis pattern (Sing, 1985) is also indicative of the slit-like pores characteristic for the aggregates of plate-like particles (Kuila and Prasad, 2013). The isotherms also show the “forced closure” of the desorption branch at due to the “tensile strength effect” (blue and green vertical line in Fig. B1a). This supports the hypothesis that both samples have a large amount of small nanopores with diameter <4 nm (Groen et al., 2003). Thus, the N2 adsorption measurements are consistent with the morphology of the particles observed with electron microscope (Fig. 5).
Figure B1c shows the H2O adsorption/desorption isotherms were measured with the same samples after additional outgassing for 24 h at 150 °C, sample temperature 293.65 K (P0=18.2 torr). The most prominent features of the water isotherms in comparison to N2 are (1) the absence of the steep rise of the adsorption in the low range; (2) open hysteresis; (3) inability to reach desorption equilibrium in the low range. This is indicative of a strong interaction between the dust particle material and water molecules, so that the removal of the residual adsorbed water is only possible if the adsorbent is outgassed at higher temperatures. This phenomenon may be associated with the swelling of a non-rigid porous structure or with the irreversible uptake of molecules in pores (or through pore entrances) of about the same width as that of the adsorbate molecule or in some instances with an irreversible chemical interaction of the adsorbate with the adsorbent (Sing, 1985).
The most important difference between the adsorption of water and N2 is revealed by comparing the specific surface area (SSA). Whereas SSA of Icelandic dust measured with water and N2 is essentially identical (9.4 and 9.8 m2 g−1, respectively), the SSA of Moroccan dust measured with water vapor is twice as large as the SSA measured with N2 (39.8 and 19.9 m2 g−1, see Table 3). Previously, a five-fold difference between SSAs measured with water vs. N2 has been observed for montmorillonite, but was not observed for kaolinite (Lin et al., 2020). These differences are present probably because water molecules are more easily adsorbed than N2 on the surfaces of clay minerals, and they can also be hydrated by cations in the interlayer space of clay minerals where the N2 cannot penetrate. For kaolinite, which does not have an interlayer structure for water molecules to access, the difference between the water and N2 based SSA is minimal (Lu and Khorshidi, 2015; Lin et al., 2020).
Figure B2a shows the particles identified as agglomerates in the Moroccan samples (highlighted with red circles), and panel b provides a zoomed-in view of one of these agglomerates. It is estimated that the agglomerate frequency lies between 5 % to 10 %. However, this estimate does not account for the frequency distribution across sizes.
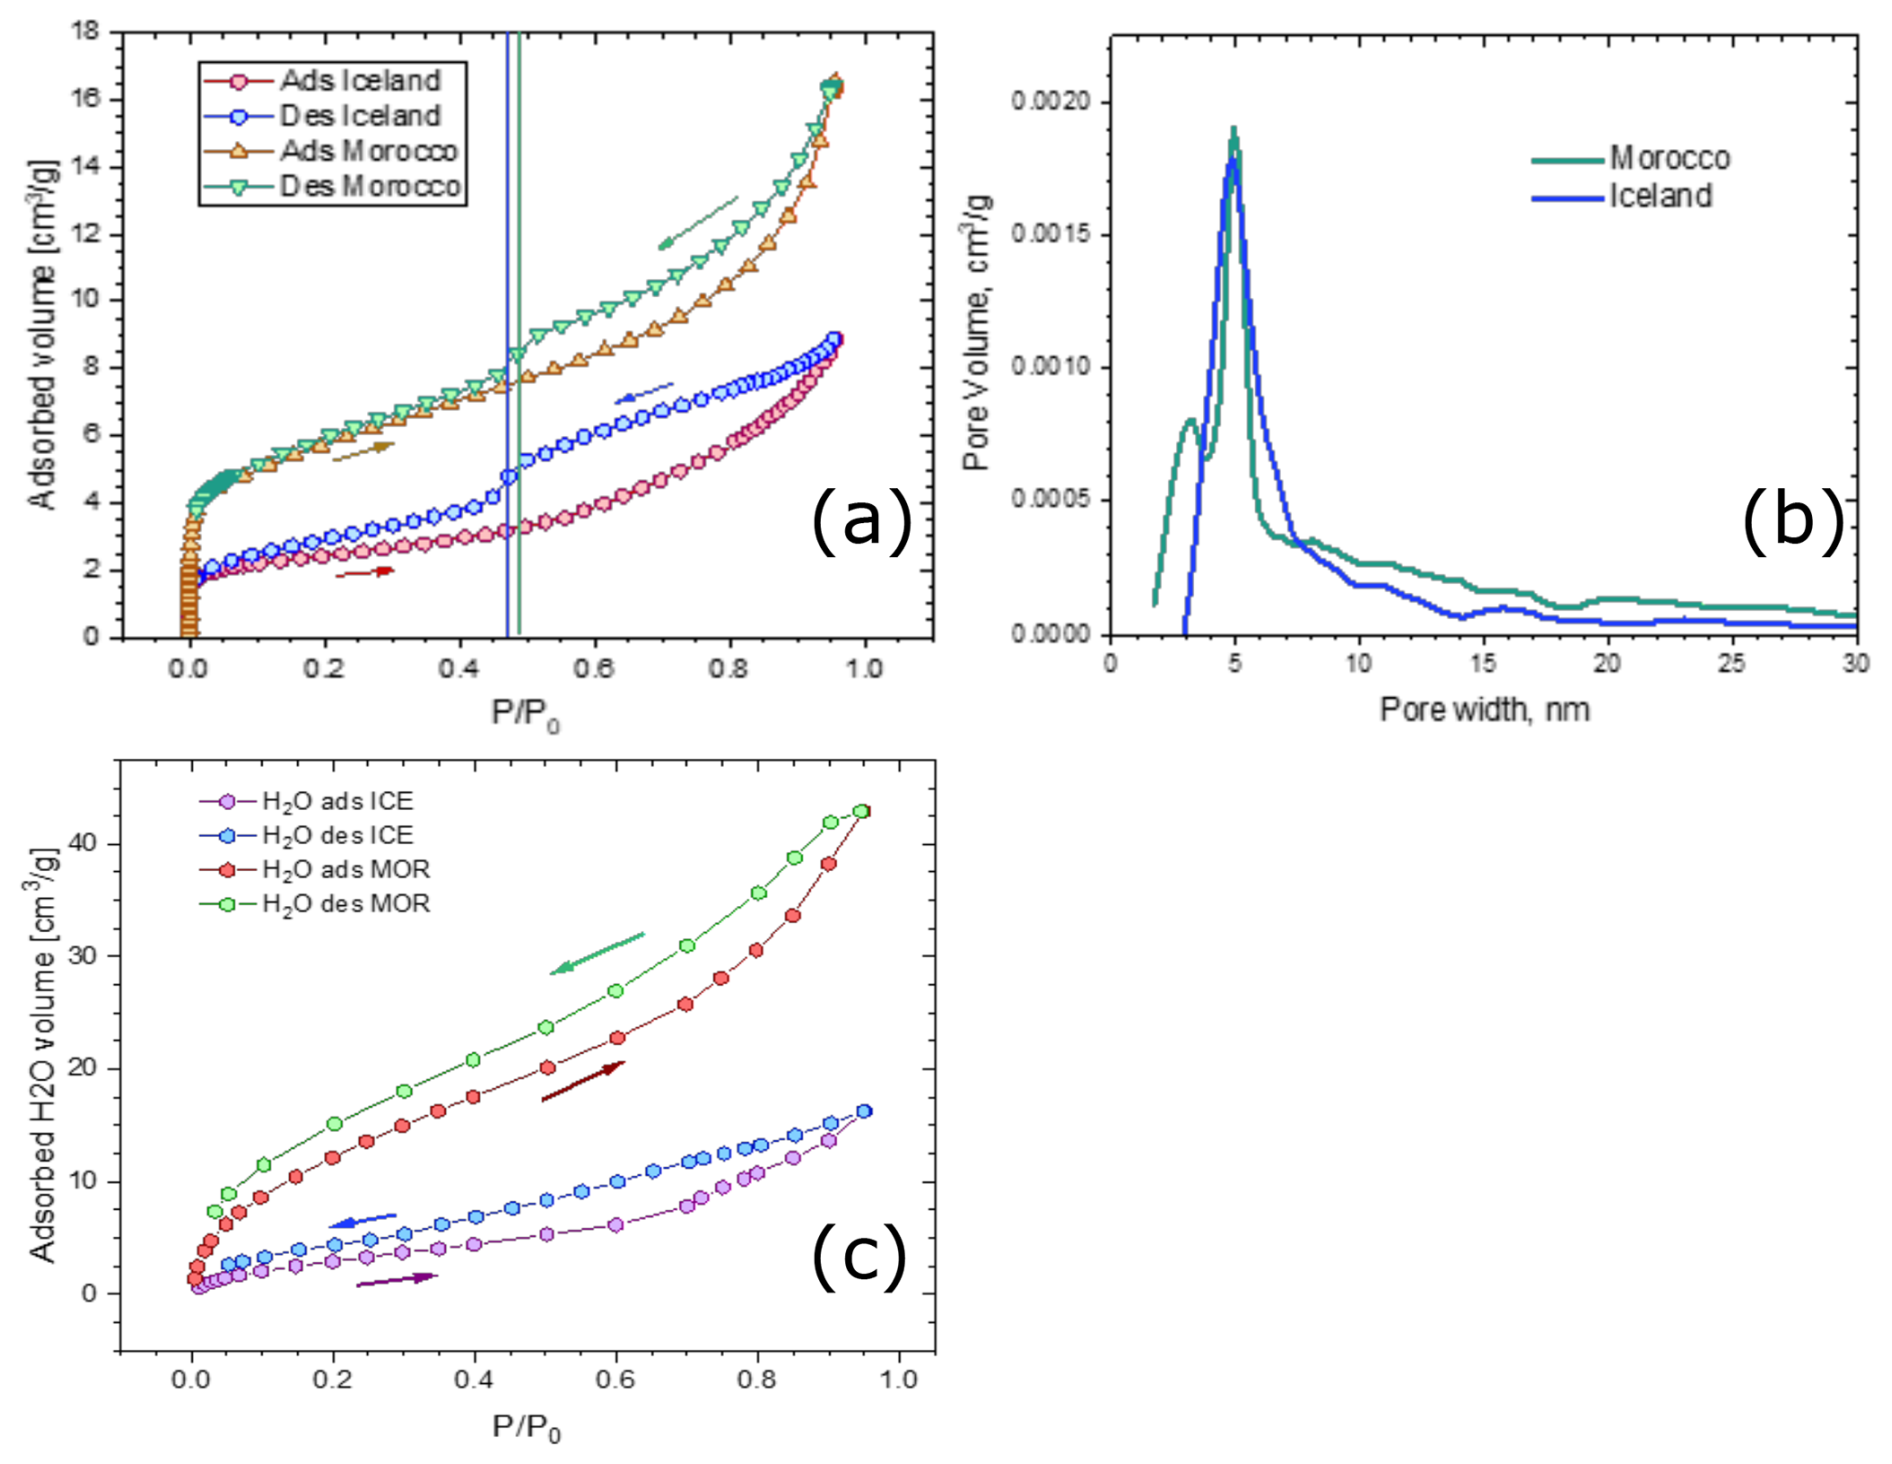
Figure B1Moroccan and Icelandic samples analysis with Non-Linear Density Function Theory, NLDFT. (a) N2 adsorption/desorption isotherms, (b) Nanopore width distributions, (c) H2O adsorption/desorption isotherms measured on the same samples. Note the open hysteresis feature: water cannot be desorbed efficiently from the surface.
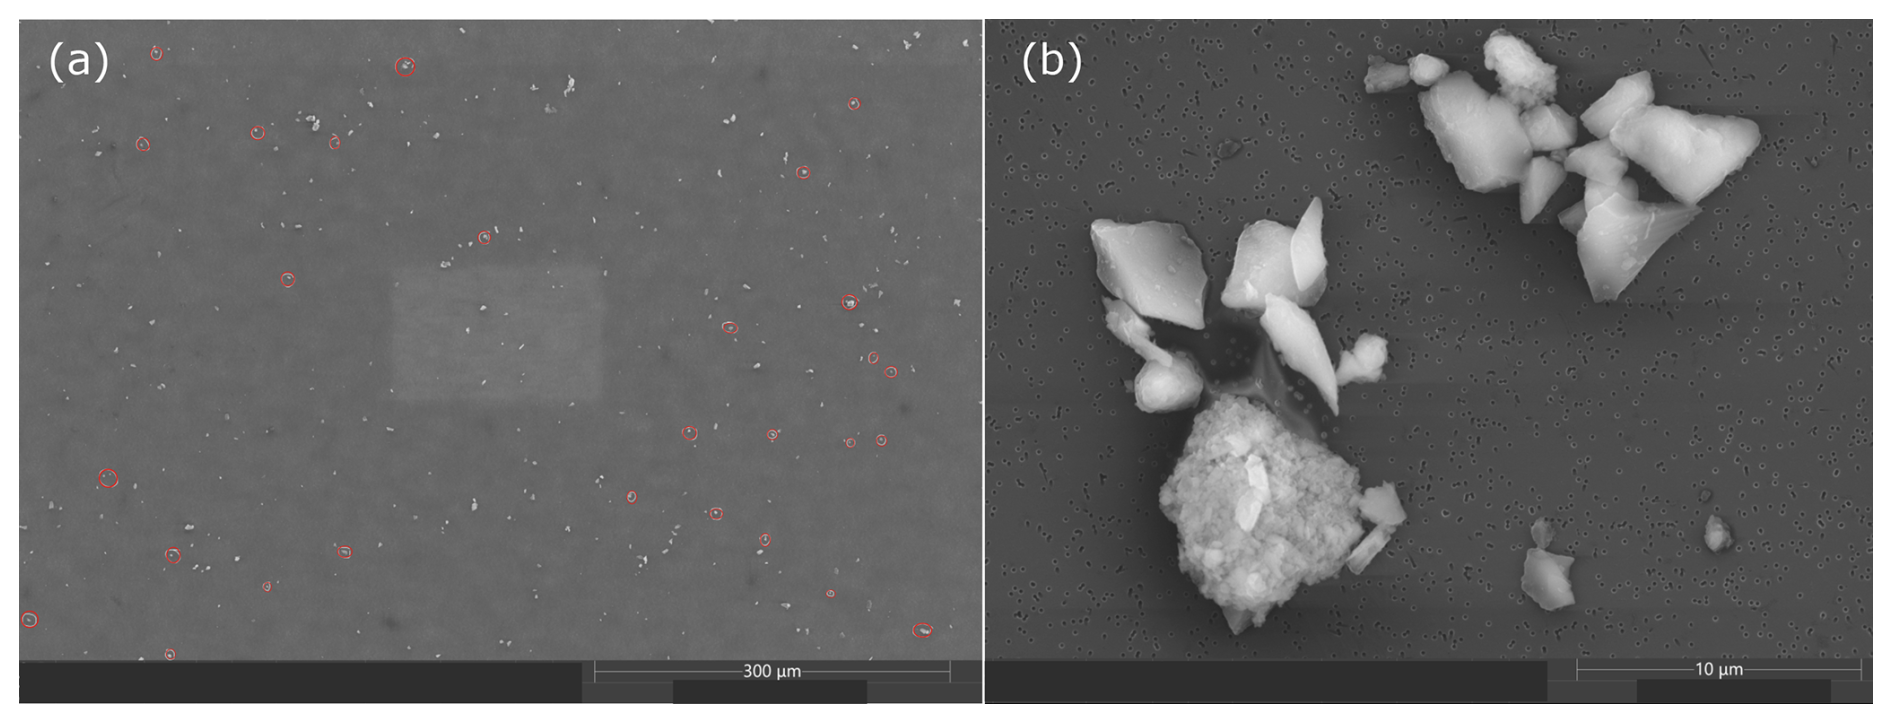
Figure B2SEM images of particles from Moroccan dust sampled in experiment ID 20 (Backscattered Electron Detector, BSE). (a) Agglomerated particles are encircled in red; (b) zoomed-in view to one of the agglomerates.
Assuming that the unsieved particles follow a log-normal distribution given by Eq. (C1), with a median diameter d0=50 µm and a geometric standard deviation σ=5 (red line in Fig. C1), which is a reasonable assumption for ground-collected mineral dust from a desert. A cut-off function (green line in Fig. C1) is then applied to represent the particles that passed through a 20 µm sieve. This function is defined by Eq. (C2), where k is the cut-off width parameter and d50 is the median cut-off diameter.
The resulting size distribution for the sieved particles is obtained by convolving both functions, as shown by the blue line in Fig. C1. The mean area diameter of the distribution is calculated by dividing the second moment by the first moment of the convolved function. This diameter is equal to 14.9 µm, which is rounded to 15 µm.
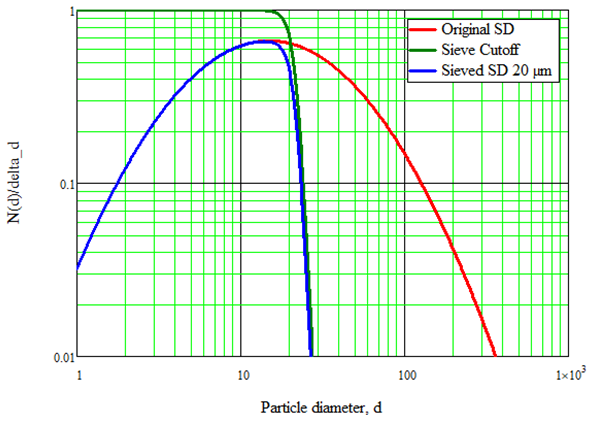
Figure C1Assumed normalized distribution with median diameter d0=50 µm and geometric standard distribution σ=5 for ground collected mineral dust from a desert (red line, Original SD), cut-off function for 20 µm diameter (green line, Sieve Cutoff), and final size distribution representing size distribution for particles sieved (blue line, Sieved SD 20 µm).
The experimental data used in this study are available at Zenodo (https://doi.org/10.5281/zenodo.17933358, Vergara Palacio et al., 2025).
SVP analyzed the data, created most figures and drafted the manuscript. MK and CH supervised the work. AK performed the BET, SEM, and IR-DROFA experiments, and analyzed and formulated the results. SVP and AGR sieved the collected samples instructed by XQ. SVP and FV performed INSEKT experiments. CPGP organized and designed the FRAGMENT field campaigns with contributions from MK, KK, and XQ. CPGP, MK, XQ, KK, and AGR participated in both field campaigns. AGR collected the samples during the campaigns. MK organized and designed the MICOS campaign with contributions from CPGP, FV, NSU, OM, KK, AK, and SVP. MK, FV, SVP, and NSU implemented the MICOS campaign with support from OM, KK, AK, CPGP, and AIDA staff. RF provided the resulting MICOS campaign data. MK edited the manuscript. All authors provided feedback on the manuscript.
At least one of the (co-)authors is a member of the editorial board of Atmospheric Chemistry and Physics. The peer-review process was guided by an independent editor, and the authors also have no other competing interests to declare.
Publisher's note: Copernicus Publications remains neutral with regard to jurisdictional claims made in the text, published maps, institutional affiliations, or any other geographical representation in this paper. The authors bear the ultimate responsibility for providing appropriate place names. Views expressed in the text are those of the authors and do not necessarily reflect the views of the publisher.
This work has received funding through the Helmholtz Association’s Initiative and Networking Fund (grant agreement no. VH-NG-1533). The MICOS campaign is part of a project that is supported by the European Commission under the Horizon 2020 – Research and Innovation Framework Program, H2020-INFRAIA-2020-1, Grant Agreement number: 101008004. We are grateful for campaign support from AIDA staff: Rainer Buschbacher, Olga Dombrowski, Georg Scheurig, and Robert Wagner; and members of the Barcelona Supercomputing Center (BSC): Montse Costa-Surós, and Marios Chaziparaschos. The samples used in this study were collected and analyzed in the context of the ERC Consolidator Grant FRAGMENT, funded by the European Research Council under the Horizon 2020 research and innovation programme (grant agreement no. 773051), and the HiLDA project funded by the Deutsche Forschungsgemeinschaft (DFG, German Research Foundation)-417012665. This work used resources of the Deutsches Klimarechenzentrum (DKRZ) granted by its Scientific Steering Committee (WLA) under project ID 1215. CPGP also acknowledges support from the AXA Research fund, Grant PID2022-140365OB-I00 funded by MICIU/AEI/10.13039/501100011033 and by ERDF, EU, and the Horizon Europe programme under Grant Agreement No 101137680 via project CERTAINTY.
This research has been supported by the Helmholtz-Gemeinschaft (grant no. VH-NG-1533), the European Commission, Horizon 2020 Framework Programme (grant no. 101008004), the European Commission, Horizon 2020 Framework Programme (grant no. 773051), the Deutsche Forschungsgemeinschaft (grant no. 417012665), and the AXA Research Fund and Grant PID2022-140365OB-I00 funded by MICIU/AEI/10.13039/501100011033 and by ERDF, EU.
The article processing charges for this open-access publication were covered by the Karlsruhe Institute of Technology (KIT).
This paper was edited by Luis A. Ladino and reviewed by two anonymous referees.
Adebiyi, A., Kok, J., Murray, B., Ryder, C., Stuut, J.-B., Kahn, R., Knippertz, P., Formenti, P., Mahowald, N., García-Pando, C., Klose, M., Ansmann, A., Samset, B., Ito, A., Balkanski, Y., Di Biagio, C., Romanias, M., Huang, Y., and Meng, J.: A review of coarse mineral dust in the Earth system, Aeolian Res., https://doi.org/10.31223/x5qd36, 2022. a, b, c
Atkinson, J. D., Murray, B. J., Woodhouse, M. T., Whale, T. F., Baustian, K. J., Carslaw, K. S., Dobbie, S., O'Sullivan, D., and Malkin, T. L.: The importance of feldspar for ice nucleation by mineral dust in mixed-phase clouds, Nature, 498, 355–358, https://doi.org/10.1038/nature12278, 2013. a, b, c, d, e
Augustin-Bauditz, S., Wex, H., Denjean, C., Hartmann, S., Schneider, J., Schmidt, S., Ebert, M., and Stratmann, F.: Laboratory-generated mixtures of mineral dust particles with biological substances: characterization of the particle mixing state and immersion freezing behavior, Atmos. Chem. Phys., 16, 5531–5543, https://doi.org/10.5194/acp-16-5531-2016, 2016. a
Augustin-Bauditz, S., Wex, H., Kanter, S., Ebert, M., Niedermeier, D., Stolz, F., Prager, A., and Stratmann, F.: The immersion mode ice nucleation behavior of mineral dusts: A comparison of different pure and surface modified dusts, Geophys. Res. Lett., 41, 7375–7382, https://doi.org/10.1002/2014gl061317, 2014. a
Baldo, C., Formenti, P., Di Biagio, C., Lu, G., Song, C., Cazaunau, M., Pangui, E., Doussin, J.-F., Dagsson-Waldhauserova, P., Arnalds, O., Beddows, D., MacKenzie, A. R., and Shi, Z.: Complex refractive index and single scattering albedo of Icelandic dust in the shortwave part of the spectrum, Atmos. Chem. Phys., 23, 7975–8000, https://doi.org/10.5194/acp-23-7975-2023, 2023. a
Barr, S. L., Wyld, B., McQuaid, J. B., Neely III, R. R., and Murray, B. J.: Southern Alaska as a source of atmospheric mineral dust and ice-nucleating particles, Sci. Adv., 9, https://doi.org/10.1126/sciadv.adg3708, 2023. a
Boose, Y., Welti, A., Atkinson, J., Ramelli, F., Danielczok, A., Bingemer, H. G., Plötze, M., Sierau, B., Kanji, Z. A., and Lohmann, U.: Heterogeneous ice nucleation on dust particles sourced from nine deserts worldwide – Part 1: Immersion freezing, Atmos. Chem. Phys., 16, 15075–15095, https://doi.org/10.5194/acp-16-15075-2016, 2016. a, b
Brunauer, S., Emmett, P. H., and Teller, E.: Adsorption of Gases in Multimolecular Layers, J. Am. Chem. Soc., 60, 309–319, https://doi.org/10.1021/ja01269a023, 1938. a
Bullard, J. E., Baddock, M., Bradwell, T., Crusius, J., Darlington, E., Gaiero, D., Gassó, S., Gisladottir, G., Hodgkins, R., McCulloch, R., McKenna-Neuman, C., Mockford, T., Stewart, H., and Thorsteinsson, T.: High-latitude dust in the Earth system, Rev. Geophys., 54, 447–485, https://doi.org/10.1002/2016rg000518, 2016. a, b
Chesler, A., Winski, D., Kreutz, K., Koffman, B., Osterberg, E., Ferris, D., Thundercloud, Z., Mohan, J., Cole-Dai, J., Wells, M., Handley, M., Putnam, A., Anderson, K., and Harmon, N.: Non-spherical microparticle shape in Antarctica during the last glacial period affects dust volume-related metrics, Clim. Past, 19, 477–492, https://doi.org/10.5194/cp-19-477-2023, 2023. a
Cotton, R. J., Benz, S., Field, P. R., Möhler, O., and Schnaiter, M.: Technical Note: A numerical test-bed for detailed ice nucleation studies in the AIDA cloud simulation chamber, Atmos. Chem. Phys., 7, 243–256, https://doi.org/10.5194/acp-7-243-2007, 2007. a
DeMott, P. J., Prenni, A. J., McMeeking, G. R., Sullivan, R. C., Petters, M. D., Tobo, Y., Niemand, M., Möhler, O., Snider, J. R., Wang, Z., and Kreidenweis, S. M.: Integrating laboratory and field data to quantify the immersion freezing ice nucleation activity of mineral dust particles, Atmos. Chem. Phys., 15, 393–409, https://doi.org/10.5194/acp-15-393-2015, 2015. a
Dupont, S., Klose, M., Irvine, M. R., González-Florez, C., Alastuey, A., Bonnefond, J.-M., Dagsson-Waldhauserova, P., Gonzalez-Romero, A., Hussein, T., Lamaud, E., Meyer, H., Panta, A., Querol, X., Schepanski, K., Vergara Palacio, S., Wieser, A., Yus-Díez, J., Kandler, K., and Pérez García-Pando, C.: Impact of Dust Source Patchiness on the Existence of a Constant Dust Flux Layer During Aeolian Erosion Events, J. Geophys. Res.-Atmos., 129, e2023JD040657, https://doi.org/10.1029/2023JD040657, 2024. a
Gao, K., Vogel, F., Foskinis, R., Vratolis, S., Gini, M. I., Granakis, K., Billault-Roux, A.-C., Georgakaki, P., Zografou, O., Fetfatzis, P., Berne, A., Papayannis, A., Eleftheridadis, K., Möhler, O., and Nenes, A.: Biological and dust aerosols as sources of ice-nucleating particles in the eastern Mediterranean: source apportionment, atmospheric processing and parameterization, Atmos. Chem. Phys., 24, 9939–9974, https://doi.org/10.5194/acp-24-9939-2024, 2024. a
Ginoux, P., Prospero, J. M., Gill, T. E., Hsu, N. C., and Zhao, M.: Global‐scale attribution of anthropogenic and natural dust sources and their emission rates based on MODIS Deep Blue aerosol products, Rev. Geophys., 50, https://doi.org/10.1029/2012rg000388, 2012. a
González-Flórez, C., Klose, M., Alastuey, A., Dupont, S., Escribano, J., Etyemezian, V., Gonzalez-Romero, A., Huang, Y., Kandler, K., Nikolich, G., Panta, A., Querol, X., Reche, C., Yus-Díez, J., and Pérez García-Pando, C.: Insights into the size-resolved dust emission from field measurements in the Moroccan Sahara, Atmos. Chem. Phys., 23, 7177–7212, https://doi.org/10.5194/acp-23-7177-2023, 2023. a, b, c
González-Romero, A., González-Flórez, C., Panta, A., Yus-Díez, J., Reche, C., Córdoba, P., Moreno, N., Alastuey, A., Kandler, K., Klose, M., Baldo, C., Clark, R. N., Shi, Z., Querol, X., and Pérez García-Pando, C.: Variability in sediment particle size, mineralogy, and Fe mode of occurrence across dust-source inland drainage basins: the case of the lower Drâa Valley, Morocco, Atmos. Chem. Phys., 23, 15815–15834, https://doi.org/10.5194/acp-23-15815-2023, 2023. a, b
González-Romero, A., González-Flórez, C., Panta, A., Yus-Díez, J., Córdoba, P., Alastuey, A., Moreno, N., Kandler, K., Klose, M., Clark, R. N., Ehlmann, B. L., Greenberger, R. N., Keebler, A. M., Brodrick, P., Green, R. O., Querol, X., and Pérez García-Pando, C.: Probing Iceland's dust-emitting sediments: particle size distribution, mineralogy, cohesion, Fe mode of occurrence, and reflectance spectra signatures, Atmos. Chem. Phys., 24, 6883–6910, https://doi.org/10.5194/acp-24-6883-2024, 2024. a, b, c
Groen, J. C., Peffer, L. A., and Pérez-Ramı́rez, J.: Pore size determination in modified micro- and mesoporous materials. Pitfalls and limitations in gas adsorption data analysis, Micropor. Mesopor. Mat., 60, 1–17, https://doi.org/10.1016/s1387-1811(03)00339-1, 2003. a
Groot Zwaaftink, C. D., Arnalds, Ó., Dagsson-Waldhauserova, P., Eckhardt, S., Prospero, J. M., and Stohl, A.: Temporal and spatial variability of Icelandic dust emissions and atmospheric transport, Atmos. Chem. Phys., 17, 10865–10878, https://doi.org/10.5194/acp-17-10865-2017, 2017. a
Harrison, A. D., Lever, K., Sanchez-Marroquin, A., Holden, M. A., Whale, T. F., Tarn, M. D., McQuaid, J. B., and Murray, B. J.: The ice-nucleating ability of quartz immersed in water and its atmospheric importance compared to K-feldspar, Atmos. Chem. Phys., 19, 11343–11361, https://doi.org/10.5194/acp-19-11343-2019, 2019. a, b, c, d, e, f, g, h, i, j, k
Hiranuma, N., Augustin-Bauditz, S., Bingemer, H., Budke, C., Curtius, J., Danielczok, A., Diehl, K., Dreischmeier, K., Ebert, M., Frank, F., Hoffmann, N., Kandler, K., Kiselev, A., Koop, T., Leisner, T., Möhler, O., Nillius, B., Peckhaus, A., Rose, D., Weinbruch, S., Wex, H., Boose, Y., DeMott, P. J., Hader, J. D., Hill, T. C. J., Kanji, Z. A., Kulkarni, G., Levin, E. J. T., McCluskey, C. S., Murakami, M., Murray, B. J., Niedermeier, D., Petters, M. D., O'Sullivan, D., Saito, A., Schill, G. P., Tajiri, T., Tolbert, M. A., Welti, A., Whale, T. F., Wright, T. P., and Yamashita, K.: A comprehensive laboratory study on the immersion freezing behavior of illite NX particles: a comparison of 17 ice nucleation measurement techniques, Atmos. Chem. Phys., 15, 2489–2518, https://doi.org/10.5194/acp-15-2489-2015, 2015. a, b, c, d
Hoose, C. and Möhler, O.: Heterogeneous ice nucleation on atmospheric aerosols: a review of results from laboratory experiments, Atmos. Chem. Phys., 12, 9817–9854, https://doi.org/10.5194/acp-12-9817-2012, 2012. a, b, c
Hoyle, C. R., Pinti, V., Welti, A., Zobrist, B., Marcolli, C., Luo, B., Höskuldsson, Á., Mattsson, H. B., Stetzer, O., Thorsteinsson, T., Larsen, G., and Peter, T.: Ice nucleation properties of volcanic ash from Eyjafjallajökull, Atmos. Chem. Phys., 11, 9911–9926, https://doi.org/10.5194/acp-11-9911-2011, 2011. a
Huang, Y., Kok, J. F., Kandler, K., Lindqvist, H., Nousiainen, T., Sakai, T., Adebiyi, A., and Jokinen, O.: Climate Models and Remote Sensing Retrievals Neglect Substantial Desert Dust Asphericity, Geophys. Res. Lett., 47, https://doi.org/10.1029/2019gl086592, 2020. a, b, c
Huang, Y., Adebiyi, A. A., Formenti, P., and Kok, J. F.: Linking the Different Diameter Types of Aspherical Desert Dust Indicates That Models Underestimate Coarse Dust Emission, Geophys. Res. Lett., 48, https://doi.org/10.1029/2020gl092054, 2021. a
Huang, Y., Kok, J. F., Saito, M., and Muñoz, O.: Single-scattering properties of ellipsoidal dust aerosols constrained by measured dust shape distributions, Atmos. Chem. Phys., 23, 2557–2577, https://doi.org/10.5194/acp-23-2557-2023, 2023. a
Jahn, L. G., Fahy, W. D., Williams, D. B., and Sullivan, R. C.: Role of Feldspar and Pyroxene Minerals in the Ice Nucleating Ability of Three Volcanic Ashes, ACS Earth and Space Chemistry, 3, 626–636, https://doi.org/10.1021/acsearthspacechem.9b00004, 2019. a, b, c, d, e, f, g, h, i, j
Kanji, Z. A., Ladino, L. A., Wex, H., Boose, Y., Burkert-Kohn, M., Cziczo, D. J., and Krämer, M.: Overview of Ice Nucleating Particles, Meteorol. Monogr., 58, 1.1–1.33, https://doi.org/10.1175/amsmonographs-d-16-0006.1, 2017. a
Kanji, Z. A., Sullivan, R. C., Niemand, M., DeMott, P. J., Prenni, A. J., Chou, C., Saathoff, H., and Möhler, O.: Heterogeneous ice nucleation properties of natural desert dust particles coated with a surrogate of secondary organic aerosol, Atmos. Chem. Phys., 19, 5091–5110, https://doi.org/10.5194/acp-19-5091-2019, 2019. a
Kim, D., Chin, M., Schuster, G., Yu, H., Takemura, T., Tuccella, P., Ginoux, P., Liu, X., Shi, Y., Matsui, H., Tsigaridis, K., Bauer, S. E., Kok, J. F., and Schulz, M.: Where Dust Comes From: Global Assessment of Dust Source Attributions With AeroCom Models, J. Geophys. Res.-Atmos., 129, https://doi.org/10.1029/2024jd041377, 2024. a
Klose, M., Jorba, O., Gonçalves Ageitos, M., Escribano, J., Dawson, M. L., Obiso, V., Di Tomaso, E., Basart, S., Montané Pinto, G., Macchia, F., Ginoux, P., Guerschman, J., Prigent, C., Huang, Y., Kok, J. F., Miller, R. L., and Pérez García-Pando, C.: Mineral dust cycle in the Multiscale Online Nonhydrostatic AtmospheRe CHemistry model (MONARCH) Version 2.0, Geosci. Model Dev., 14, 6403–6444, https://doi.org/10.5194/gmd-14-6403-2021, 2021. a
Kok, J., Adebiyi, A., Albani, S., Balkanski, Y., Checa-Garcia, R., Chin, M., Colarco, P., Hamilton, D., Huang, Y., Ito, A., Klose, M., Li, L., Mahowald, N., Miller, R., Obiso, V., Perez Garcia-Pando, C., Rocha-Lima, A., and Wan, J.: Contribution of the world’s main dust source regions to the global cycle of desert dust, in: Goldschmidt2021 abstracts, European Association of Geochemistry, https://doi.org/10.7185/gold2021.6364, 2021. a
Kuila, U. and Prasad, M.: Specific surface area and pore‐size distribution in clays and shales, Geophys. Prospect., 61, 341–362, https://doi.org/10.1111/1365-2478.12028, 2013. a
Kumar, A., Marcolli, C., and Peter, T.: Ice nucleation activity of silicates and aluminosilicates in pure water and aqueous solutions – Part 2: Quartz and amorphous silica, Atmos. Chem. Phys., 19, 6035–6058, https://doi.org/10.5194/acp-19-6035-2019, 2019. a
Li, W. J. and Shao, L. Y.: Observation of nitrate coatings on atmospheric mineral dust particles, Atmos. Chem. Phys., 9, 1863–1871, https://doi.org/10.5194/acp-9-1863-2009, 2009. a
Lin, X., Hu, Q., Chen, Z., Wang, Q., Zhang, T., and Sun, M.: Changes in water vapor adsorption and water film thickness in clayey materials as a function of relative humidity, Vadose Zone J., 19, https://doi.org/10.1002/vzj2.20063, 2020. a, b
Lu, N. and Khorshidi, M.: Mechanisms for Soil-Water Retention and Hysteresis at High Suction Range, J. Geotech. Geoenviron., 141, https://doi.org/10.1061/(asce)gt.1943-5606.0001325, 2015. a
Mahowald, N. M., Baker, A. R., Bergametti, G., Brooks, N., Duce, R. A., Jickells, T. D., Kubilay, N., Prospero, J. M., and Tegen, I.: Atmospheric global dust cycle and iron inputs to the ocean, Global Biogeochem. Cy., 19, https://doi.org/10.1029/2004gb002402, 2005. a
Meinander, O., Dagsson-Waldhauserova, P., Amosov, P., Aseyeva, E., Atkins, C., Baklanov, A., Baldo, C., Barr, S. L., Barzycka, B., Benning, L. G., Cvetkovic, B., Enchilik, P., Frolov, D., Gassó, S., Kandler, K., Kasimov, N., Kavan, J., King, J., Koroleva, T., Krupskaya, V., Kulmala, M., Kusiak, M., Lappalainen, H. K., Laska, M., Lasne, J., Lewandowski, M., Luks, B., McQuaid, J. B., Moroni, B., Murray, B., Möhler, O., Nawrot, A., Nickovic, S., O’Neill, N. T., Pejanovic, G., Popovicheva, O., Ranjbar, K., Romanias, M., Samonova, O., Sanchez-Marroquin, A., Schepanski, K., Semenkov, I., Sharapova, A., Shevnina, E., Shi, Z., Sofiev, M., Thevenet, F., Thorsteinsson, T., Timofeev, M., Umo, N. S., Uppstu, A., Urupina, D., Varga, G., Werner, T., Arnalds, O., and Vukovic Vimic, A.: Newly identified climatically and environmentally significant high-latitude dust sources, Atmos. Chem. Phys., 22, 11889–11930, https://doi.org/10.5194/acp-22-11889-2022, 2022. a
Murray, B. J., O’Sullivan, D., Atkinson, J. D., and Webb, M. E.: ChemInform Abstract: Ice Nucleation by Particles Immersed in Supercooled Cloud Droplets, ChemInform, 43, https://doi.org/10.1002/chin.201248216, 2012. a
Niemand, M., Möhler, O., Vogel, B., Vogel, H., Hoose, C., Connolly, P., Klein, H., Bingemer, H., DeMott, P., Skrotzki, J., and Leisner, T.: A Particle-Surface-Area-Based Parameterization of Immersion Freezing on Desert Dust Particles, J. Atmos. Sci., 69, 3077–3092, https://doi.org/10.1175/jas-d-11-0249.1, 2012. a
Pan, L., Bhattacharjee, P. S., Zhang, L., Montuoro, R., Baker, B., McQueen, J., Grell, G. A., McKeen, S. A., Kondragunta, S., Zhang, X., Frost, G. J., Yang, F., and Stajner, I.: Analysis of the GEFS-Aerosols annual budget to better understand aerosol predictions simulated in the model, Geosci. Model Dev., 17, 431–447, https://doi.org/10.5194/gmd-17-431-2024, 2024. a
Panta, A., Kandler, K., Alastuey, A., González-Flórez, C., González-Romero, A., Klose, M., Querol, X., Reche, C., Yus-Díez, J., and Pérez García-Pando, C.: Insights into the single-particle composition, size, mixing state, and aspect ratio of freshly emitted mineral dust from field measurements in the Moroccan Sahara using electron microscopy, Atmos. Chem. Phys., 23, 3861–3885, https://doi.org/10.5194/acp-23-3861-2023, 2023. a, b, c, d, e, f, g, h, i
Panta, A., Kandler, K., Schepanski, K., Alastuey, A., Dagsson Waldhauserova, P., Dupont, S., Eknayan, M., González-Flórez, C., González-Romero, A., Klose, M., Montag, M., Querol, X., Yus-Díez, J., and Pérez García-Pando, C.: Unveiling single-particle composition, size, shape, and mixing state of freshly emitted Icelandic dust via electron microscopy analysis, Atmos. Chem. Phys., 25, 10457–10478, https://doi.org/10.5194/acp-25-10457-2025, 2025. a, b, c, d, e, f, g
Paramonov, M., David, R. O., Kretzschmar, R., and Kanji, Z. A.: A laboratory investigation of the ice nucleation efficiency of three types of mineral and soil dust, Atmos. Chem. Phys., 18, 16515–16536, https://doi.org/10.5194/acp-18-16515-2018, 2018. a
Parra, S., Bravo, M. A., Quiroz, W., Moreno, T., Karanasiou, A., Font, O., Vidal, V., and Cereceda, F.: Distribution of trace elements in particle size fractions for contaminated soils by a copper smelting from different zones of the Puchuncaví Valley (Chile), Chemosphere, 111, 513–521, https://doi.org/10.1016/j.chemosphere.2014.03.127, 2014. a
Peckhaus, A., Kiselev, A., Hiron, T., Ebert, M., and Leisner, T.: A comparative study of K-rich and Na/Ca-rich feldspar ice-nucleating particles in a nanoliter droplet freezing assay, Atmos. Chem. Phys., 16, 11477–11496, https://doi.org/10.5194/acp-16-11477-2016, 2016. a
Price, H. C., Baustian, K. J., McQuaid, J. B., Blyth, A., Bower, K. N., Choularton, T., Cotton, R. J., Cui, Z., Field, P. R., Gallagher, M., Hawker, R., Merrington, A., Miltenberger, A., Neely III, R. R., Parker, S. T., Rosenberg, P. D., Taylor, J. W., Trembath, J., Vergara-Temprado, J., Whale, T. F., Wilson, T. W., Young, G., and Murray, B. J.: Atmospheric Ice-Nucleating Particles in the Dusty Tropical Atlantic, J. Geophys. Res.-Atmos., 123, 2175–2193, https://doi.org/10.1002/2017jd027560, 2018. a
Pruppacher, H. R. and Klett, J. D.: Microphysics of Clouds and Precipitation, Springer Netherlands, ISBN 9789400999053, https://doi.org/10.1007/978-94-009-9905-3, 1978. a
Reicher, N., Budke, C., Eickhoff, L., Raveh-Rubin, S., Kaplan-Ashiri, I., Koop, T., and Rudich, Y.: Size-dependent ice nucleation by airborne particles during dust events in the eastern Mediterranean, Atmos. Chem. Phys., 19, 11143–11158, https://doi.org/10.5194/acp-19-11143-2019, 2019. a, b, c, d, e, f
Ryder, C., Highwood, E., Walser, A., Walser, P., Philipp, A., and Weinzierl, B.: Coarse and giant particles are ubiquitous in Saharan dust export regions and are radiatively significant over the Sahara, EGU General Assembly 2020, Online, 4–8 May 2020, EGU2020-5722, https://doi.org/10.5194/egusphere-egu2020-5722, 2020. a
Sanchez-Marroquin, A., Arnalds, O., Baustian-Dorsi, K. J., Browse, J., Dagsson-Waldhauserova, P., Harrison, A. D., Maters, E. C., Pringle, K. J., Vergara-Temprado, J., Burke, I. T., McQuaid, J. B., Carslaw, K. S., and Murray, B. J.: Iceland is an episodic source of atmospheric ice-nucleating particles relevant for mixed-phase clouds, Sci. Adv., 6, https://doi.org/10.1126/sciadv.aba8137, 2020. a, b, c, d, e, f, g, h, i, j, k, l, m, n, o
Schiebel, T.: Ice nucleation activity of soil dust aerosols, Ph.D. thesis, Dissertation, Karlsruhe, Karlsruher Institut für Technologie (KIT), https://doi.org/10.5445/IR/1000076327, 2017. a, b
Sing, K. S. W.: Reporting physisorption data for gas/solid systems with special reference to the determination of surface area and porosity (Recommendations 1984), Pure Appl.Chem., 57, 603–619, https://doi.org/10.1351/pac198557040603, 1985. a, b, c
Steinke, I., Möhler, O., Kiselev, A., Niemand, M., Saathoff, H., Schnaiter, M., Skrotzki, J., Hoose, C., and Leisner, T.: Ice nucleation properties of fine ash particles from the Eyjafjallajökull eruption in April 2010, Atmos. Chem. Phys., 11, 12945–12958, https://doi.org/10.5194/acp-11-12945-2011, 2011. a, b, c, d, e, f, g, h, i
Sullivan, R. C., Moore, M. J. K., Petters, M. D., Kreidenweis, S. M., Roberts, G. C., and Prather, K. A.: Effect of chemical mixing state on the hygroscopicity and cloud nucleation properties of calcium mineral dust particles, Atmos. Chem. Phys., 9, 3303–3316, https://doi.org/10.5194/acp-9-3303-2009, 2009. a
Ullrich, R., Hoose, C., Möhler, O., Niemand, M., Wagner, R., Höhler, K., Hiranuma, N., Saathoff, H., and Leisner, T.: A New Ice Nucleation Active Site Parameterization for Desert Dust and Soot, J. Atmos. Sci., 74, 699–717, https://doi.org/10.1175/jas-d-16-0074.1, 2017. a, b, c, d, e, f
Umo, N. S., Ullrich, R., Maters, E. C., Steinke, I., Benker, N., Höhler, K., Wagner, R., Weidler, P. G., Hoshyaripour, G. A., Kiselev, A., Kueppers, U., Kandler, K., Dingwell, D. B., Leisner, T., and Möhler, O.: The Influence of Chemical and Mineral Compositions on the Parameterization of Immersion Freezing by Volcanic Ash Particles, J. Geophys. Res.-Atmos., 126, https://doi.org/10.1029/2020jd033356, 2021. a
Vali, G.: Quantitative Evaluation of Experimental Results an the Heterogeneous Freezing Nucleation of Supercooled Liquids, J. Atmos. Sci., 28, 402–409, https://doi.org/10.1175/1520-0469(1971)028<0402:qeoera>2.0.co;2, 1971. a, b, c, d
Vali, G.: Interpretation of freezing nucleation experiments: singular and stochastic; sites and surfaces, Atmos. Chem. Phys., 14, 5271–5294, https://doi.org/10.5194/acp-14-5271-2014, 2014. a, b, c
Vergara Palacio, S., Kiselev, A., Vogel, F., González-Romero, A., Fösig, R., Querol, X., Hoose, C., Umo, N. S., Möhler, O., Kandler, K., Pérez García-Pando, C., and Klose, M.: Ice nucleation activity of mineral dust from Morocco and Iceland in immersion freezing mode: experimental data from AIDA, AIDAm, and INSEKT, Zenodo [data set], https://doi.org/10.5281/zenodo.17933358, 2025. a
Vogel, F., Lacher, L., Nadolny, J., Saathoff, H., Leisner, T., and Möhler, O.: Development and validation of a new cloud simulation experiment for lab-based aerosol–cloud studies, Rev. Sci. Instrum., 93, https://doi.org/10.1063/5.0098777, 2022. a, b, c, d, e, f, g
Wang, Y., Zhang, P., Li, J., Liu, Y., Zhang, Y., Li, J., and Han, Z.: An updated aerosol simulation in the Community Earth System Model (v2.1.3): dust and marine aerosol emissions and secondary organic aerosol formation, Geosci. Model Dev., 17, 7995–8021, https://doi.org/10.5194/gmd-17-7995-2024, 2024. a
Zhu, H., Li, R., Yang, S., Zhao, C., Jiang, Z., and Huang, C.: The impacts of dust aerosol and convective available potential energy on precipitation vertical structure in southeastern China as seen from multisource observations, Atmos. Chem. Phys., 23, 2421–2437, https://doi.org/10.5194/acp-23-2421-2023, 2023. a
Zimmermann, F., Weinbruch, S., Schütz, L., Hofmann, H., Ebert, M., Kandler, K., and Worringen, A.: Ice nucleation properties of the most abundant mineral dust phases, J. Geophys. Res.-Atmos., 113, https://doi.org/10.1029/2008jd010655, 2008. a
- Abstract
- Introduction
- Materials and Methods
- Results
- Discussion
- Conclusions
- Appendix A: AIDAm results and INAS sensitivity tests.
- Appendix B: N2 and H2O adsorption for Moroccan and Icelandic samples.
- Appendix C: INAS density with the assumption of 15 µm mean diameter
- Data availability
- Author contributions
- Competing interests
- Disclaimer
- Acknowledgements
- Financial support
- Review statement
- References