the Creative Commons Attribution 4.0 License.
the Creative Commons Attribution 4.0 License.
 | 24 Jun 2026
Observations of nanoparticle shrinkage phenomena
Neha Deot
Mihai Ciobanu
Aliki Christodoulou
Marije van den Born
Chengfeng Liu
Alkistis Papetta
Rima Baalbaki
Michael Pikridas
Spyros Bezantakos
Anchal Garg
Chrysanthos Savvides
Efstratios Bourtsoukidis
George Biskos
Franco Marenco
Jean Sciare
Atmospheric new particle formation (NPF) is a major source of aerosol particles in the Earth's atmosphere. However, process-level understanding of the early stages of particle formation and growth remains poorly represented in climate models, limiting accurate estimates of aerosol effective radiative forcing. Here, we use comprehensive observations from the Spring Particles in Cyprus (SPICY) field campaign conducted at a rural background site in Cyprus. We report new observations of nanoparticle shrinkage (NPS), marked by the rapid decrease in size of sub-20 nm particles occurring in the absence of preceding NPF event. Thus, the particle size distributions exhibit a mirror image of the conventional “banana-shaped” NPF pattern, forming a distinctive “reverse-NPF” pattern. We identified three NPS events during the campaign and show that this phenomenon is not primarily driven by low concentrations of condensable vapours, their scavenging by pre-existing particles, or primary nanoparticle sources. Instead, it is associated with atmospheric dilution, as indicated by air-mass trajectory analysis. Furthermore, fast-moving air masses can enhance turbulent mixing, thereby altering particle size distributions. Together with volatility-resolved analysis, these results suggest that NPS is governed by atmospheric dilution, which reduces particle-phase organic mass and shift the gas-particle equilibrium toward evaporation, with contributions dominated by organic compounds of low and moderate volatility. Our results demonstrate that NPS events provide a previously unrecognised sink for nanoparticles, which are controlled by air-mass dynamics and organic vapour volatility.
- Article
(7195 KB) - Full-text XML
-
Supplement
(2641 KB) - BibTeX
- EndNote


Atmospheric aerosols remain one of the largest uncertainties in quantifying effective radiative forcing and, consequently, predictions of climate change. Aerosols affect climate directly by scattering and absorbing solar radiation and indirectly by serving as cloud condensation nuclei (CCN), thereby influencing cloud properties and precipitation patterns (Twomey, 1977; Charlson et al., 1992; Rosenfeld et al., 2014; IPCC, 2023). Atmospheric new particle formation (NPF) from low-volatility condensable vapours is prevalent throughout the troposphere (Kulmala et al., 2000; Zhang et al., 2004; Clarke, 1993), and represents the dominant global source of aerosol number concentrations. NPF occurs under a broad spectrum of atmospheric environments, from urban and forested sites to marine and free-tropospheric conditions (Kerminen et al., 2018; Kulmala et al., 2004; Zhao et al., 2024). Atmospheric observations indicate that 10 %–60 % of NPF events contribute to CCN formation, enhancing their concentrations by factors that range from 0.5–11 at regional scales (Kerminen et al., 2018; Laakso et al., 2013; Asmi et al., 2011; Sebastian et al., 2022; Sihto et al., 2011; Rose et al., 2017; Williamson et al., 2019). Global model simulations also suggest that NPF accounts for roughly half of the tropospheric CCN population (Gordon et al., 2017; Merikanto et al., 2009; Yu and Luo, 2009). NPF events and nanoparticle growth have also been linked to severe haze episodes that exacerbate air pollution (Kulmala et al., 2022; Mishra et al., 2023; Guo et al., 2014). However, limited understanding of which condensable vapours dominate the phenomena, the initial stages of particle formation and growth, and the survival probability of nanoparticles hinder accurate representation of particle evolution from a few nanometers to CCN-active sizes () in models.
Decreasing mode diameter (DMD; also referred to as particle shrinkage) events are characterised by an evolution of particle size distributions during NPF, in which the modal diameter of nucleation-mode particles initially increases into the Aitken-mode size range and subsequently decreases to smaller sizes. This results in an inverted U-shaped temporal evolution of the modal diameter (Kamra et al., 2022; Hakala et al., 2019; Alonso-Blanco et al., 2017; Salma et al., 2016; Skrabalova et al., 2015; Cusack et al., 2013; Young et al., 2013; Yao et al., 2010; Backman et al., 2012; Hussein et al., 2020; Zhang et al., 2016; Yue et al., 2016; Kivekäs et al., 2016). As a result, DMD events can substantially suppress CCN production by preventing particles from reaching activation sizes. Hakala et al. (2023) attributed DMD events to low-growth environments associated with reduced photochemical productions of condensable vapours. Limited or slow particle growth rate, together with surface tension effects, can inhibit CCN activation during NPF events (Cai et al., 2021), a process that remains underrepresented in current atmospheric process-based models.
Observations across diverse regions reveal that DMD events arise from distinct mechanisms influenced by local-to-regional conditions and photochemical processes. Observations in East Asia (Hong Kong and Taiwan) suggest that DMD events are often driven by the evaporation of condensed semi-volatile compounds under varying photochemical conditions (Yao et al., 2010; Young et al., 2013), while studies in European urban areas (Budapest, Prague, and Madrid) and densely forested environments in the western Mediterranean (Montseny) attribute these events to a combination of late-afternoon reductions in condensable vapours, diminished photochemistry, evaporation of semi-volatile compounds, and increased atmospheric dilution (Salma et al., 2016; Alonso-Blanco et al., 2017; Skrabalova et al., 2015; Cusack et al., 2013). In cleaner environments, such as the city of Toronto, limited availability of low-volatility vapours was found to inhibit particle growth, favoring DMD events compared to polluted locations like Qingdao (Zhu et al., 2014). El-Sayed et al. (2018) suggest that isoprene oxidation products under low oxides of nitrogen (NOx) conditions can reversibly partition into condensed water in the particle phase, forming transient secondary organic aerosol (SOA) prone to evaporation. At an urban background site in Amman, Jordan, DMD events were observed on nearly 50 % of NPF days and were linked to variations in particle formation and growth rates during atmospheric transport (Hussein et al., 2020). At a rural arid site in Western Saudi Arabia (Hada Al Sham), DMD events were even more frequent, occurring on 76 % of NPF days (Hakala et al., 2019). Such events are driven by changes in air-mass origin (Kivekäs et al., 2016), with less-grown particles arriving at the site after larger ones, while evaporation plays an insignificant role (Hakala et al., 2023). These observations indicate that DMD events result from a complex coupling of photochemical activity, condensing vapour availability, meteorological conditions, and air-mass history.
Here, we elucidate a new class of DMD events, which we refer to as nanoparticle shrinkage (NPS) events, characterised by a rapid decrease in particle mode diameter within the sub-20 nm size range that occurs in the absence of preceding NPF typically associated with DMD events. As a result, the particle size distributions display a mirror image of the conventional “banana-shaped” NPF pattern, forming a distinctive “reverse-NPF” signature. To our knowledge, this behaviour has not previously been examined in literature. We investigate these events using comprehensive measurements carried out during the Spring Particles In CYprus (SPICY) field campaign at the rural background site, Cyprus Atmospheric Observatory – Agia Marina Xyliatou (CAO-AMX) in spring 2024.
2.1 Measurement Site
Cyprus is the third most populous island in the Mediterranean. The SPICY field campaign was conducted from 1 April–15 June 2024 at the rural background site CAO-AMX (35.038692° N, 33.057850° E, 532 m a.m.s.l., Fig. 1), with a focus on processes linking direct emissions to CCN formation in an environment where NPF events dominate (annual median>58 %) (Deot et al., 2025; Baalbaki et al., 2021). The campaign included an extensive suite of instruments for measuring condensing vapours, trace gases, VOCs, as well as particle size distributions and CCN concentrations. The CAO-AMX site is integrated into several international monitoring networks, including European Monitoring and Evaluation Programme (EMEP, Tørseth et al., 2012), Global Atmosphere Watch (GAW, Schultz et al., 2015), Aerosol, Clouds, and Trace Gases Research Infrastructure (ACTRIS, Laj et al., 2024), AErosol RObotic NETwork (AERONET, Holben et al., 1998), and EUMETNET Profiling Program (E-PROFILE, Illingworth et al., 2019), and is collocated with one of the nine stations of the Cyprus air quality monitoring network operated by the Department of Labour Inspection (DLI). Further details of CAO-AMX site is available in Deot et al. (2025). The CAO-AMX site is characterised by a Mediterranean climate, with hot, dry summers and mild, wet winters. In spring, the median (range) values of temperature, relative humidity, solar radiation, and rainfall are 17.8°C (2.4–37.6 °C), 51.2 % (7.6 %–99.2 %), 448.4 W m−2 (10.5–1027.4 W m−2), and 3.1 mm (1.2–24.6 mm), respectively (Vrekoussis et al., 2022). Anthropogenic emissions around the CAO-AMX site are minimal, with the nearest major cities located ∼35 km northeast (Nicosia) and ∼50 km southeast (Larnaca) of the site.
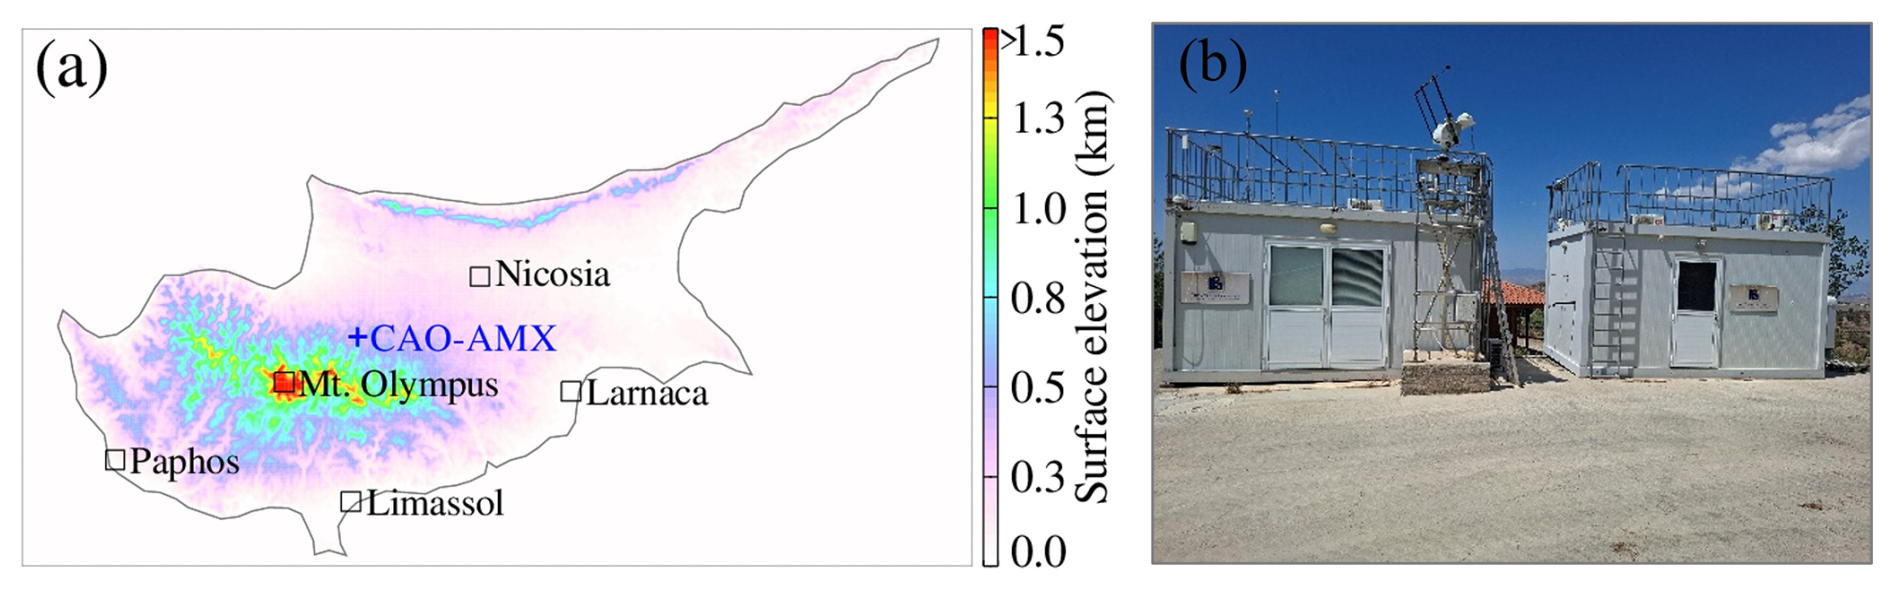
Figure 1(a) Surface elevation map of Cyprus, showing the location of the CAO-AMX measurement station (blue marker) in the foothills of the Troodos Mountains. Major cities (Paphos, Limassol, Larnaca, and Nicosia) and Mount Olympus (the highest point in Cyprus) are indicated by open square boxes. Elevation data are taken from the U.S. Geological Survey global digital elevation model (DEM) with a horizontal resolution of 30 arcsec (approximately 1 km; GTOPO30). (b) Image of the CAO-AMX station, consisting of two containers housing advanced instrumentation for condensing vapours, trace gases, and aerosols.
2.2 Instrumentation and ancillary data
2.2.1 Multi-scheme chemical IONisation Atmospheric Pressure interface Time-Of-Flight mass spectrometer (MION-APi-TOF)
The APi-TOF (Tofwerk AG, Switzerland) is a high-resolution mass spectrometer capable of identifying ambient atmospheric ions and naturally occurring ion clusters with high mass accuracy and resolving power. The APi-TOF was equipped with a second-generation MION-2 inlet (Karsa Ltd., Finland), which allows rapid switching of reagent ions based on the chemical ionisation (CI)-inlet principle and ambient naturally charged ions (Rissanen et al., 2019). In this campaign, the MION-2 inlet was operated exclusively in negative polarity and operated with a 15 min temporal resolution, switching between ambient ion mode for anion measurements and nitrate-based CI-mode for neutral compounds. The MION-APi-TOF sampled ambient air at 0.8 L min−1 through a critical orifice (0.3 mm diameter). The sampled air was ionised in the MION source, and subsequently the gas-phase ions were transferred to the TOF chamber, where the charged compounds were separated according to their mass-to-charge ratio () with a resolving power of about 9000 Th/Th. Data analysis was performed using the MATLAB-based tofTools package developed by Junninen et al. (2010). The Csat values for individual HOMs were calculated based on their molecular composition using the parametrisation by Mohr et al. (2019).
2.2.2 Proton Transfer Reaction Time-of-Flight mass spectrometer (PTR-ToF-MS)
Online measurements of VOCs were conducted using a high-resolution PTR-ToF-MS 4000 (Ionicon Analytik GmbH, Austria) following the methodology described by Desservettaz et al. (2023). The drift tube was operated at , 2.2 mbar, 630 V, and 85 °C. Ambient air was sampled at 0.21 L min−1 through a heated 2 m long PEEK line with a PTFE filter, minimizing losses by using inert materials (PTFE, PEEK, glass). Mass spectra was recorded every 30 s and averaged to 10 min. Background signals were acquired every two hours with VOC-free air from a platinum catalyst, and calibrations were performed bi-weekly with certified standards (Apel-Riemer Environmental, USA). Data were processed with the Ionicon Data Analyzer (IDA) and matched against the GLOVOCS database (Yáñez-Serrano et al., 2016), yielding ∼76 reliably quantified VOCs after applying detection limits, calibration corrections, and quality filtering. Formaldehyde was excluded due to humidity-related detection artefacts (Vlasenko et al., 2010).
2.2.3 Nano condensation nucleus counter (nCNC)
The A11 nCNC (Airmodus Oy, Finland) is composed of a particle size magnifier (PSM; Model A10) coupled with a CPC (Model A20) (Vanhanen et al., 2011). The sample inlet tube was approximately 60 cm long. The PSM was operated in scanning saturator flow mode (0.1–1.3 L min−1), corresponding to a cutoff diameter of . To minimize artefacts, the setup included an inlet system performing background (zero) checks three times daily (12 min each, equivalent to three full scans) and a core sampling piece to reduce line losses of sub-3 nm particles (Baalbaki et al., 2021). A dilution with dry particle-free air behind the inlet head was employed to ensure the dew point temperatures<20 °C, following ACTRIS standard procedures for in-situ aerosol sampling and analyses (Lehtipalo et al., 2022).
2.2.4 Neutral Cluster and Air Ion Spectrometer (NAIS)
Ion and particle size distributions were measured using a NAIS (Airel Ltd., Estonia). This instrument measures ion and naturally charged particle size distributions in the diameter range of 0.8–42 nm (109 size bins obtained from 25 electrometers) (Mirme and Mirme, 2013; Manninen et al., 2016), with measurements performed in both positive and negative polarities. The total particle size distribution was measured by charging aerosols using a corona charger, followed by size separation and detection carried out by two multichannel electrical mobility analyzer columns operated in parallel. Concentrations of particles with sizes smaller than ∼2 nm were excluded due to known artefacts from the corona charger. Raw counts were inverted using the NAIS SPECTOPS algorithm and corrected for inlet losses (Gormley and Kennedy, 1948). Further details of the NAIS setup at CAO-AMX are available in Deot et al. (2025).
2.2.5 Scanning Mobility Particle Sizer (SMPS)
The SMPS is composed of a TSI 3083 long differential mobility analyzer (DMA) and a TSI 3789 CPC. It measures particle size distribution between 10 and 777 nm (61 size bins). The aerosol and sheath flows were checked weekly and set to 1.0 and 4.8 L min−1, respectively. The SMPS sampled ambient air using a 3 m long sample inlet tube. Aerosol sample drying was achieved using a Nafion dryer (typically RH<40 %), following the ACTRIS standard procedures for in situ aerosol sampling and analyses, and charge neutralization was achieved using a TSI radioactive (85Kr) neutralizer (model 3077). The raw data from the SMPS was inverted using TSI's Aerosol Instrument Manager (AIM, version 11.5) software. The nano-DMA SMPS, consisting of a TSI 3085 DMA and a TSI water-based 3786 CPC, was also operated simultaneously, with a sample flow rate of 0.3 L min−1. The nano-DMA SMPS sampled ambient air using a 2 m long sample inlet tube. It measures particle size distribution between 3.1 and 105.5 nm (99 size bins). Additionally, a TSI butanol-based standalone 3750 CPC (D50=7 nm) was also operated, with a sample flow rate of 1 L min−1.
2.2.6 Aethalometer
BC mass concentrations were measured using a seven-wavelength aethalometer (AE33, Magee Scientific, USA) at 1 min resolution. Ambient aerosol was sampled through a PM1 inlet at 5 L min−1 after drying with a Nafion dryer. BC concentrations were derived at 880 nm using a mass absorption cross-section of 7.77 m2 g−1 (Petzold et al., 2013). This wavelength was chosen for calculating BC concentration because absorption by other aerosols is negligible at this wavelength (Drinovec et al., 2015). The aethalometer uses Teflon-coated glass fiber tape, and aerosols are collected onto two parallel spots for optical absorption measurements, which provide real-time compensation for the filter loading effect.
2.2.7 Ceilometer
The Vaisala Ceilometer CL51, in operation since 2021 and part of the E-PROFILE network , provides vertical profiles of aerosols and clouds (Münkel and Roininen, 2010). It employs an eye-safe InGaAs diode-laser lidar (910±10 nm, 110 ns pulses, 6.5 kHz) in a vertical or near-vertical direction, detecting aerosols and clouds from ∼300 m–15 km with 10 m resolution. Backscatter profiles are processed with the BL-VIEW software, which applies a gradient method with a “cloud and precipitation filter” to remove spurious signals (Münkel and Roininen, 2010; Emeis et al., 2007). The software combines gradient and idealized backscatter approaches to automatically estimate planetary boundary layer (PBL) height at 16 s temporal and 10 m vertical resolution. In this study, we retained Level 3 boundary layer height data with a “good” quality control index.
2.2.8 Ancillary observations
Collocated (within a 50 m radius) trace gas measurements, including NOx, CO, and O3, as well as meteorological parameters, including air temperature, relative humidity, solar radiation, wind speed, and wind direction, were obtained from the national air quality monitoring network operated by the DLI of Cyprus. O3 was measured with UV photometric monitors (Ecotech 9810B). CO was measured with non-dispersive IR (NDIR) spectroscopy monitors (Ecotech 9830B). NOx was measured with the chemiluminescence technique. Solar radiation was measured with a Kipp & Zonen CMP22 solar irradiance sensor. Further details of DLI instrumentation are available in Vrekoussis et al. (2022). In addition, aerosol optical depth (AOD) was obtained from the AERONET sun photometers operated at the CAO-AMX site. All data are reported in Coordinated Universal Time (UTC). Local time in Cyprus is UTC+3 during daylight saving time (Eastern European Summer Time, late March to late October). Only quality-assured and quality-controlled datasets, based on standard procedures and instrument-specific data quality flags, were used in this study. Air-mass backward trajectories were computed using NOAA's Air Resources Laboratory (ARL), Hybrid Single-Particle Lagrangian Integrated Trajectory (HYSPLIT) PC-version model, version 4.4 (Draxler and Rolph, 2010; Stein et al., 2015), incorporating meteorological data from the Global Data Assimilation System (GDAS) with a spatial resolution of 0.25°×0.25° and a temporal resolution of 1 h (Draxler and Rolph, 2010). Two-day hourly backward air-mass trajectories, initialized at 500 m above the ground level, were used in this analysis. We further used ERA5, a fifth-generation reanalysis produced by the European Centre for Medium-Range Weather Forecasts (ECMWF), 0.25° gridded data of vertical velocity and specific humidity at hourly resolution on pressure levels from 1000–550 hPa (Hersbach et al., 2023).
3.1 Identification of event types
Event types were classified by visual inspection of particle size distribution contour plots (Dal Maso et al., 2005). A day was identified as an NPF event day when a pronounced increase in particle number concentrations was observed in the nucleation size range (<25 nm), followed by continuous growth of these particles to larger diameters. Such events typically extend over spatial scales of hundreds of kilometers while they persist for 1–2 d, and are therefore characterised as regional NPF events (Kulmala et al., 2004). NPF events are accompanied by a decrease in particle mode diameter from the Aitken size range during the afternoon hours, a phenomenon referred to as DMD (or shrinkage event) in the literature. As described earlier, we also observed events characterised by a rapid decrease in particle mode diameter within the sub-20 nm size range that occurred in the absence of the preceding particle formation and growth typically associated with DMD events, referred to as NPS. Such behavior has previously been reported at our site (Baalbaki et al., 2021) and in Pune, India (Kamra et al., 2022), but the underlying processes were not examined, and similar events have not been reported elsewhere. Notably, the particle size distribution contour plot during an NPS event displays a mirror image of the conventional “banana-shaped” NPF pattern, appearing as a distinctive “reverse-NPF” shape. A day without the onset of a new particle mode in the nucleation size range is classified as a non-event day. A day that could not be classified into any of the above categories was classified as an unclear day. A day without a valid full-day measurement, due to instrument maintenance, troubleshooting, or occasional power outages, was classified as a “nodata” day. Figure S1 in the Supplement shows the temporal evolution of median particle size distributions from nano Condensation Nucleus Counter (nCNC), Neutral Air Ion Spectrometer (NAIS; negative polarity ions and particles), and scanning mobility particle sizer (SMPS), while Fig. S2 shows typical examples of NPF, DMD, NPS, unclear, and non-event days.
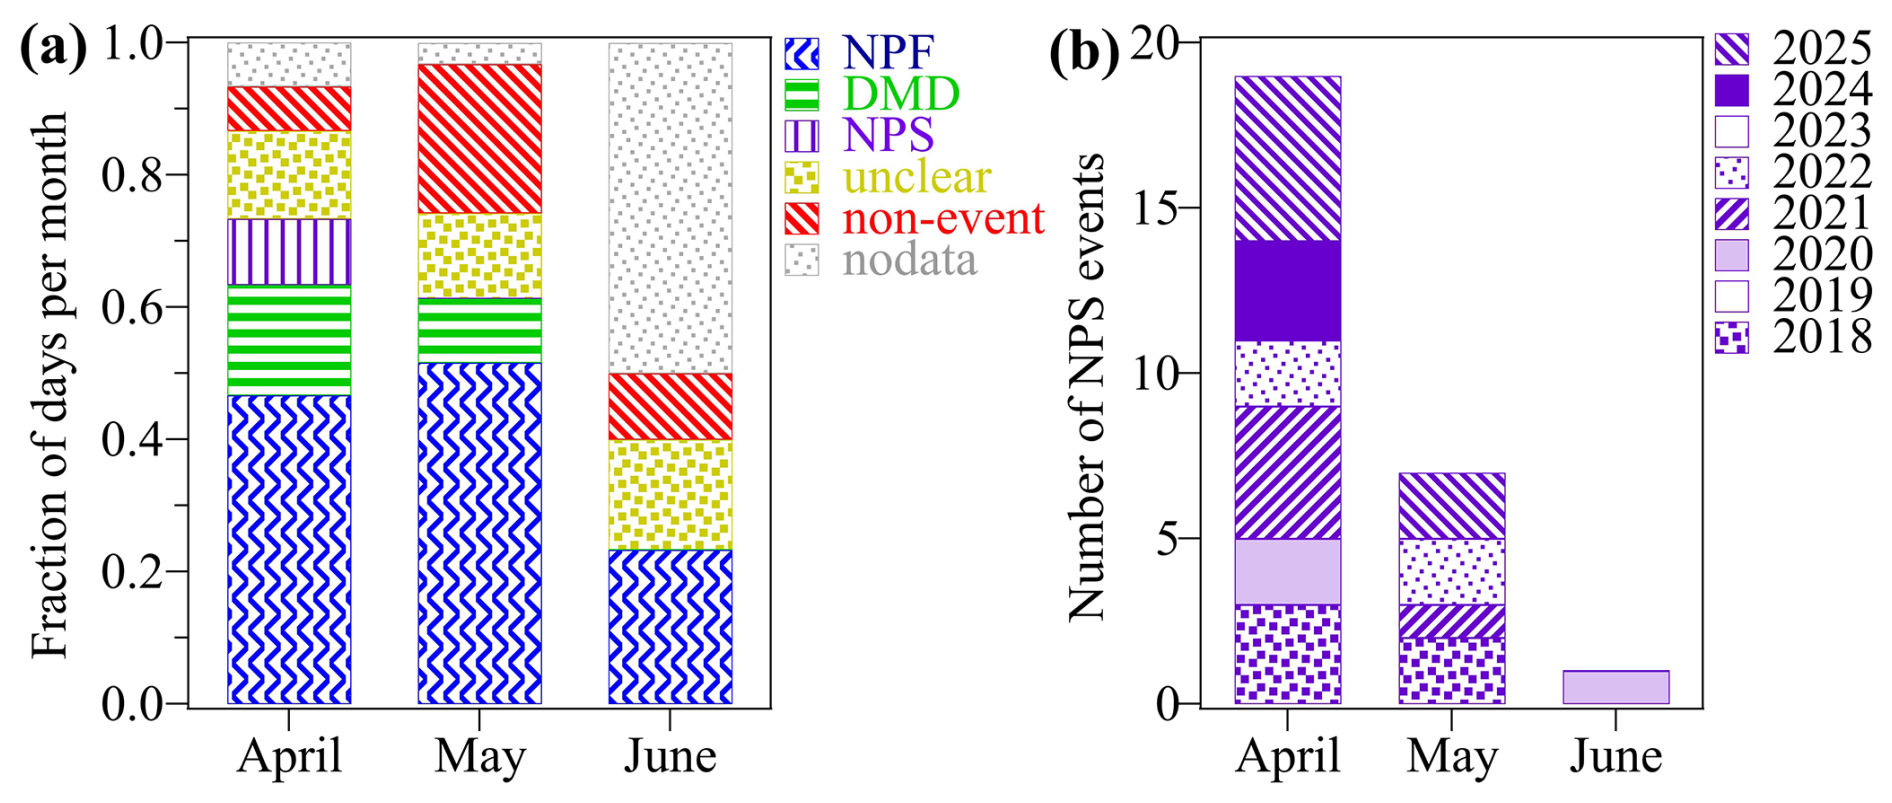
Figure 2(a) Monthly fraction of days classified into different event types during the SPICY campaign (1 April–15 June 2024). (b) Total number of NPS event days identified from 2018–2025. There are no measurements during 2019 and 2023.
Figure 2a shows the monthly fraction of days classified into different event types during the SPICY campaign. NPF events accounted for the largest fraction of days, occurring on 45 of the 76 campaign days (59.2 %). Of these, 37 d were classified as conventional NPF events (48.7 %), while 8 d were identified as DMD events (10.5 %). NPS events were observed on 3 d (3.9 %). non-events and unclear days accounted for 12 (15.8 %) and 13 d (17.1 %), respectively. There were no valid measurements on 3 d (3.9 %) during the campaign. Here, we present a 2 d consecutive case study consisting of an NPF event on 6 April followed by an NPS event on 7 April. This consecutive case was selected to minimize variability associated with regional meteorological conditions and to enable a detailed analysis of the physicochemical mechanisms underlying the NPS phenomenon. In addition, two further consecutive NPF-NPS cases (11–12 April and 20–21 April) are presented in the Supplement (Figs. S3–S7), and all three cases are summarised below. Long-term measurements of particle size distributions at the CAO-AMX site indicate that NPS is a commonly observed phenomenon (Fig. 2b), highlighting the importance of the comprehensive SPICY observations for elucidating its underlying mechanisms.
3.2 Elucidating a nanoparticle shrinkage event
3.2.1 Particle size distributions and aerosol properties during consecutive NPF and NPS events
The median diurnal variation of particle size distributions and aerosol properties during two consecutive events, an NPF event on 6 April followed by an NPS event on 7 April, are shown in Fig. 3. A sharp increase in sub-3 nm particle number concentrations (nCNC; Fig. 3a), followed by a typical “banana-shaped” aerosol growth pattern in the particle size distribution (Fig. 3b–d), was observed during the NPF event. In contrast, the NPS event exhibited a rapid decrease in nanoparticle mode diameter (<20 nm) without any preceding evidence of particle formation or growth. During the NPF event, an approximately 2 h time lag between the peak number concentrations of sub-3 nm particles (nCNC) and >7 nm particles (CPC) clearly indicate particle growth, whereas the nearly simultaneous peaks observed during the NPS event suggest the absence of particle growth (Fig. 3e). While the concentrations of ions with diameters 2.0–2.3 nm, indicative of local intermediate ion (2–7 nm) formation (Tuovinen et al., 2024), increased sharply during the NPF event, they remained negligible during the NPS event (Fig. 3e). This indicates the absence of local NPF processes during the NPS event. The number concentrations of nucleation mode particles (N10−25 nm) and total particles (N10−777 nm) were comparable on 6 and 7 April. In contrast, both the total condensation sink (CS10−777 nm) and particulate matter with an aerodynamic diameter less than 2.5 µm (PM2.5) were approximately twofold lower during the NPS event than during the NPF event (Fig. 3f). While a lower CS generally favors the growth of small clusters or newly formed particles by reducing vapour losses to pre-existing particles (Kulmala et al., 2001), it also indicates cleaner atmospheric conditions with a limited availability of condensing vapours. Consistently, black carbon (BC) mass concentrations were slightly lower during the NPS event, suggesting a minimal influence from local anthropogenic sources such as fossil fuel combustion or biomass burning. This further suggests the absence of anthropogenic sources of nanoparticles upwind of the site. Two other consecutive NPF-NPS cases (10–11 and 20–21 April) showed a similar temporal evolution of particle size distributions and aerosol properties (Figs. S3 and S4), except for higher pre-existing particle concentrations during the NPS event in the 10–11 April case.
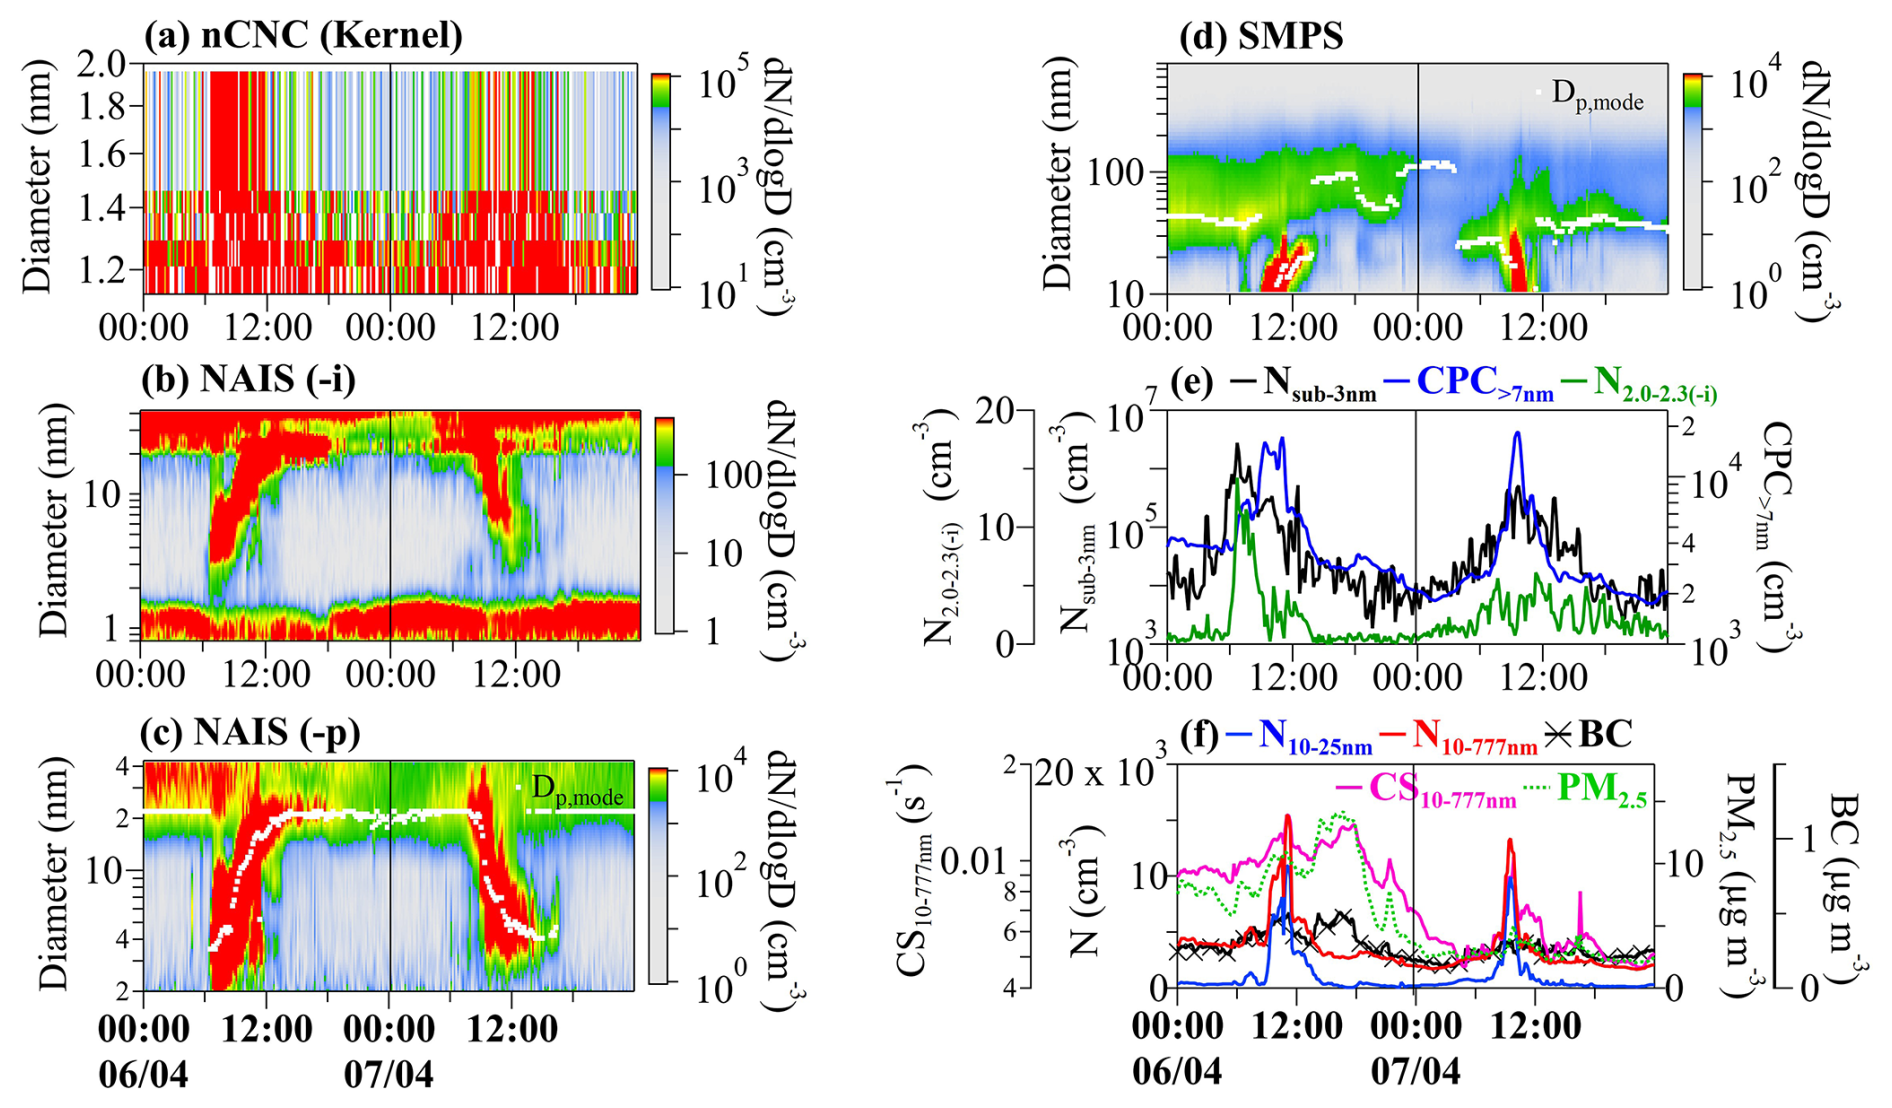
Figure 3Median diurnal variation of aerosol properties during the consecutive NPF (6 April) and NPS (7 April) events. Particle size distributions measured by (a) nCNC, (b, c) NAIS negative polarity ions and particles, and (d) SMPS. Concentrations of (e) negative polarity ions in the 2.0–2.3 nm size range measured by NAIS (), sub-3 nm particles measured by nCNC (Nsub-3 nm), and >7 nm particles measured by CPC (N>7 nm); (f) nucleation mode (N10−25 nm) and total particle (N10−777 nm) number concentrations from SMPS, total condensation sink (CS10−777 nm), and particulate matter of aerodynamic diameter less than 2.5 µm (PM2.5) and black carbon (BC) mass concentrations.
3.2.2 Influence of meteorological conditions and air-mass transport
Meteorological conditions were largely comparable during the NPF event on 6 April and the NPS event on 7 April (Fig. 4). The diurnal temperature variation was similar, with mean temperatures of 20.1 and 19.9 °C (averaged over 06:00–12:00 UTC) during the NPF and NPS events, respectively. Relative humidity also showed little difference, with mean values of 30.4 % during the NPF event and 30.7 % during the NPS event. Wind speeds were similar for both events, although wind direction differed, being northeasterly on 6 April and northwesterly on 7 April during the same period (Fig. 4b). Boundary layer height and solar radiation (Fig. 4c), which are key factors influencing new particle formation and growth (Kulmala et al., 2004; Deot et al., 2025), likewise exhibited no substantial differences between the two events. Overall, local meteorological conditions were similar during the NPF and NPS events, with wind direction being the notable difference. A comparable temporal evolution of meteorological parameters was also observed for the two additional consecutive NPF-NPS cases (Fig. S5), suggesting that the contrasting particle behavior was unlikely to be primarily driven by local meteorological variability but rather by variations in air-mass history (discussed next).
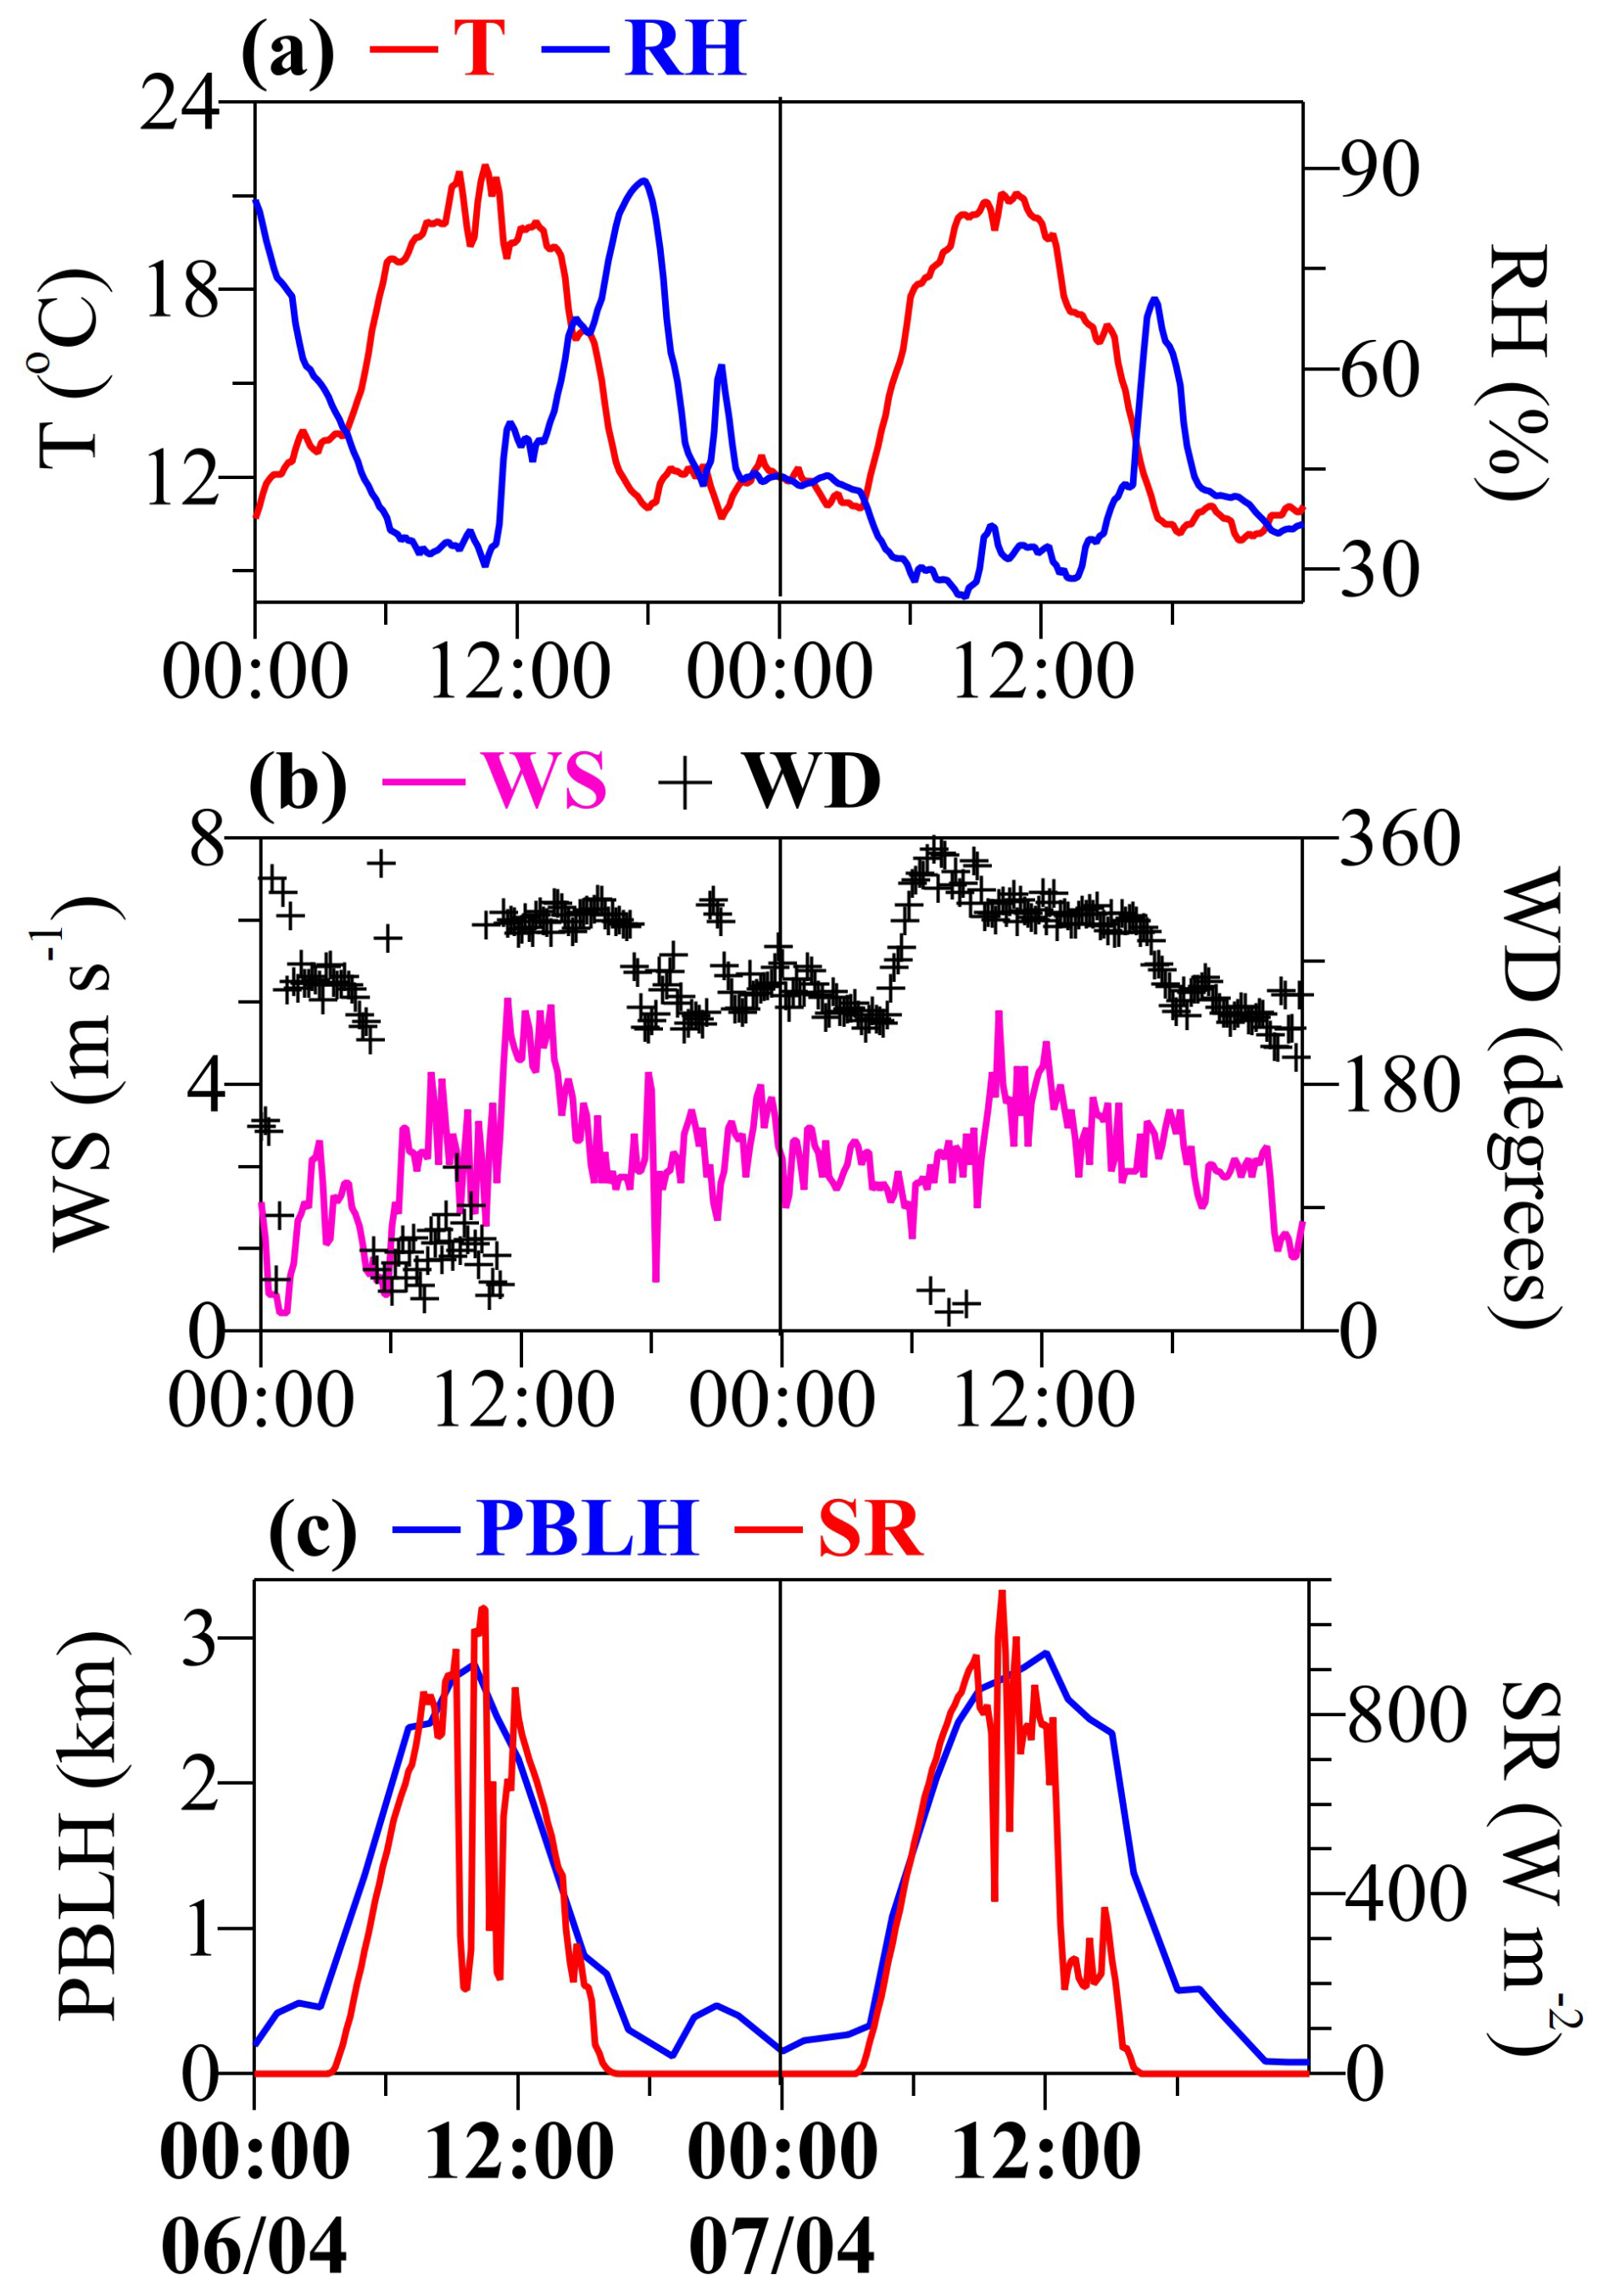
Figure 4Median diurnal variation of meteorological parameters during the consecutive NPF-NPS events (6 and 7 April). (a) Air temperature (T) and relative humidity (RH), (b) wind speed (WS) and wind direction (WD), and (c) planetary boundary layer height (PBLH) and solar radiation (SR).
Previous studies have shown that variations in air-mass origin, transport pathways, atmospheric dilution, vertical mixing, and the mixing of different air-masses can strongly influence the occurrence and evolution of NPF events (Kulmala et al., 2004; Kanawade et al., 2012; Nilsson et al., 2001; Hussein et al., 2009; Tunved et al., 2004). Air-mass trajectory analysis reveals distinct transport pathways and air-mass characteristics between the two cases, particularly on 6 and 7 April (Fig. 5a). During the NPF event, air masses traveled slowly near the ocean surface and largely remained within the PBL. In contrast, during the NPS event, the air masses traveled fast and descended from the free troposphere to near-surface levels during the passage over the Western Taurus mountain range (Fig. 5a). A similar contrast in air-mass history between NPF and NPS events was observed for the 10–11 April case (Fig. S6a). While the air masses traveled within the PBL during both the NPF and NPS events for the 20–21 April case (Fig. S7a), air masses traveled fast near the ocean surface on 21 April (NPS event).
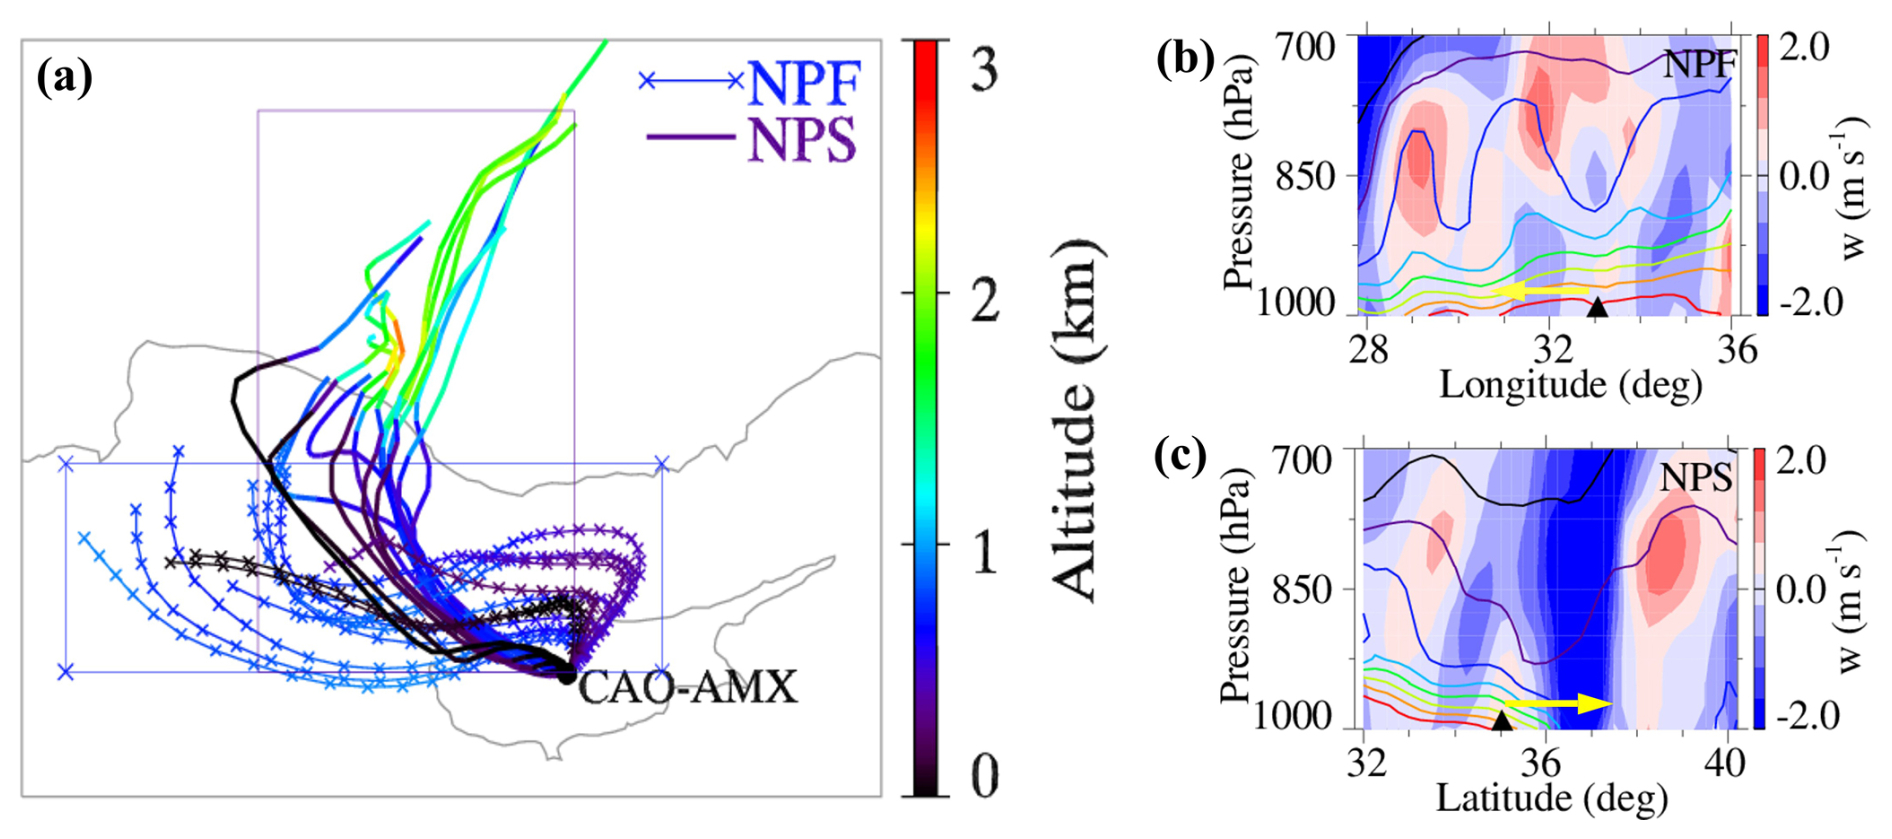
Figure 548 h air-mass backward trajectories (00:00–12:00 UTC) as a function of altitude, initialized at 500 m a.g.l. at the AMX site during the NPF event (6 April, line connected by cross symbol) and the NPS event (7 April, solid lines). The region shown by the rectangular box is used to create longitude (latitude)-altitude cross-sections of averaged (b, c) vertical velocity (w, filled contours) along air-mass trajectories over 00:00–09:00 UTC for NPF and NPS event days observed on 6 and 7 April, respectively. Contour lines represent specific humidity of 2, 3, 4, 5, 6, 7, 8, and 10 g kg−1, shown in black, violet, blue, cyan, green, yellow, orange, and red, respectively. The negative value of w indicates subsidence, while the positive values indicate the updraft. The yellow-colored arrows indicate the upwind region of the measurement site.
To further assess the dynamic state of the lower atmosphere, vertical velocity and specific humidity were examined (Fig. 5b and c). Stronger low-level subsidence, accompanied by lower specific humidity (i.e., drier air), was evident in the upwind region of the measurement site on NPS event days (Fig. 5c), indicating the intrusion of drier air masses from higher altitudes. Such enhanced vertical mixing and entrainment of cleaner, drier free tropospheric air are indicative of atmospheric dilution and are consistent with the observed lower near-surface aerosol mass (Fig. 6a and b) and reduced columnar aerosol loading (Fig. 6c), as well as lower NOx (Fig. 6d) and carbon monoxide (CO; Fig. 6e). Fast-moving air-masses accompanied by strong winds can enhance turbulent mixing, leading to dilution of particle concentrations and changes in particle size distributions (Shi et al., 1999), which is evident during NPS events (Figs. 5a, S6 and S7). Furthermore, the observed nucleation mode particles may originate from NPF occurring upwind of the measurement site and subsequently advected to the site, or from overlapping nucleation modes arising from distinct nearby anthropogenic sources (Hakala et al., 2023; Kivekäs et al., 2016). As discussed earlier, anthropogenic sources upwind of the measurement site are minimal (Fig. 3f); thus, the advection of nucleation-mode particles directly from primary emissions is unlikely to explain the observed nucleation mode particles during the NPS event.
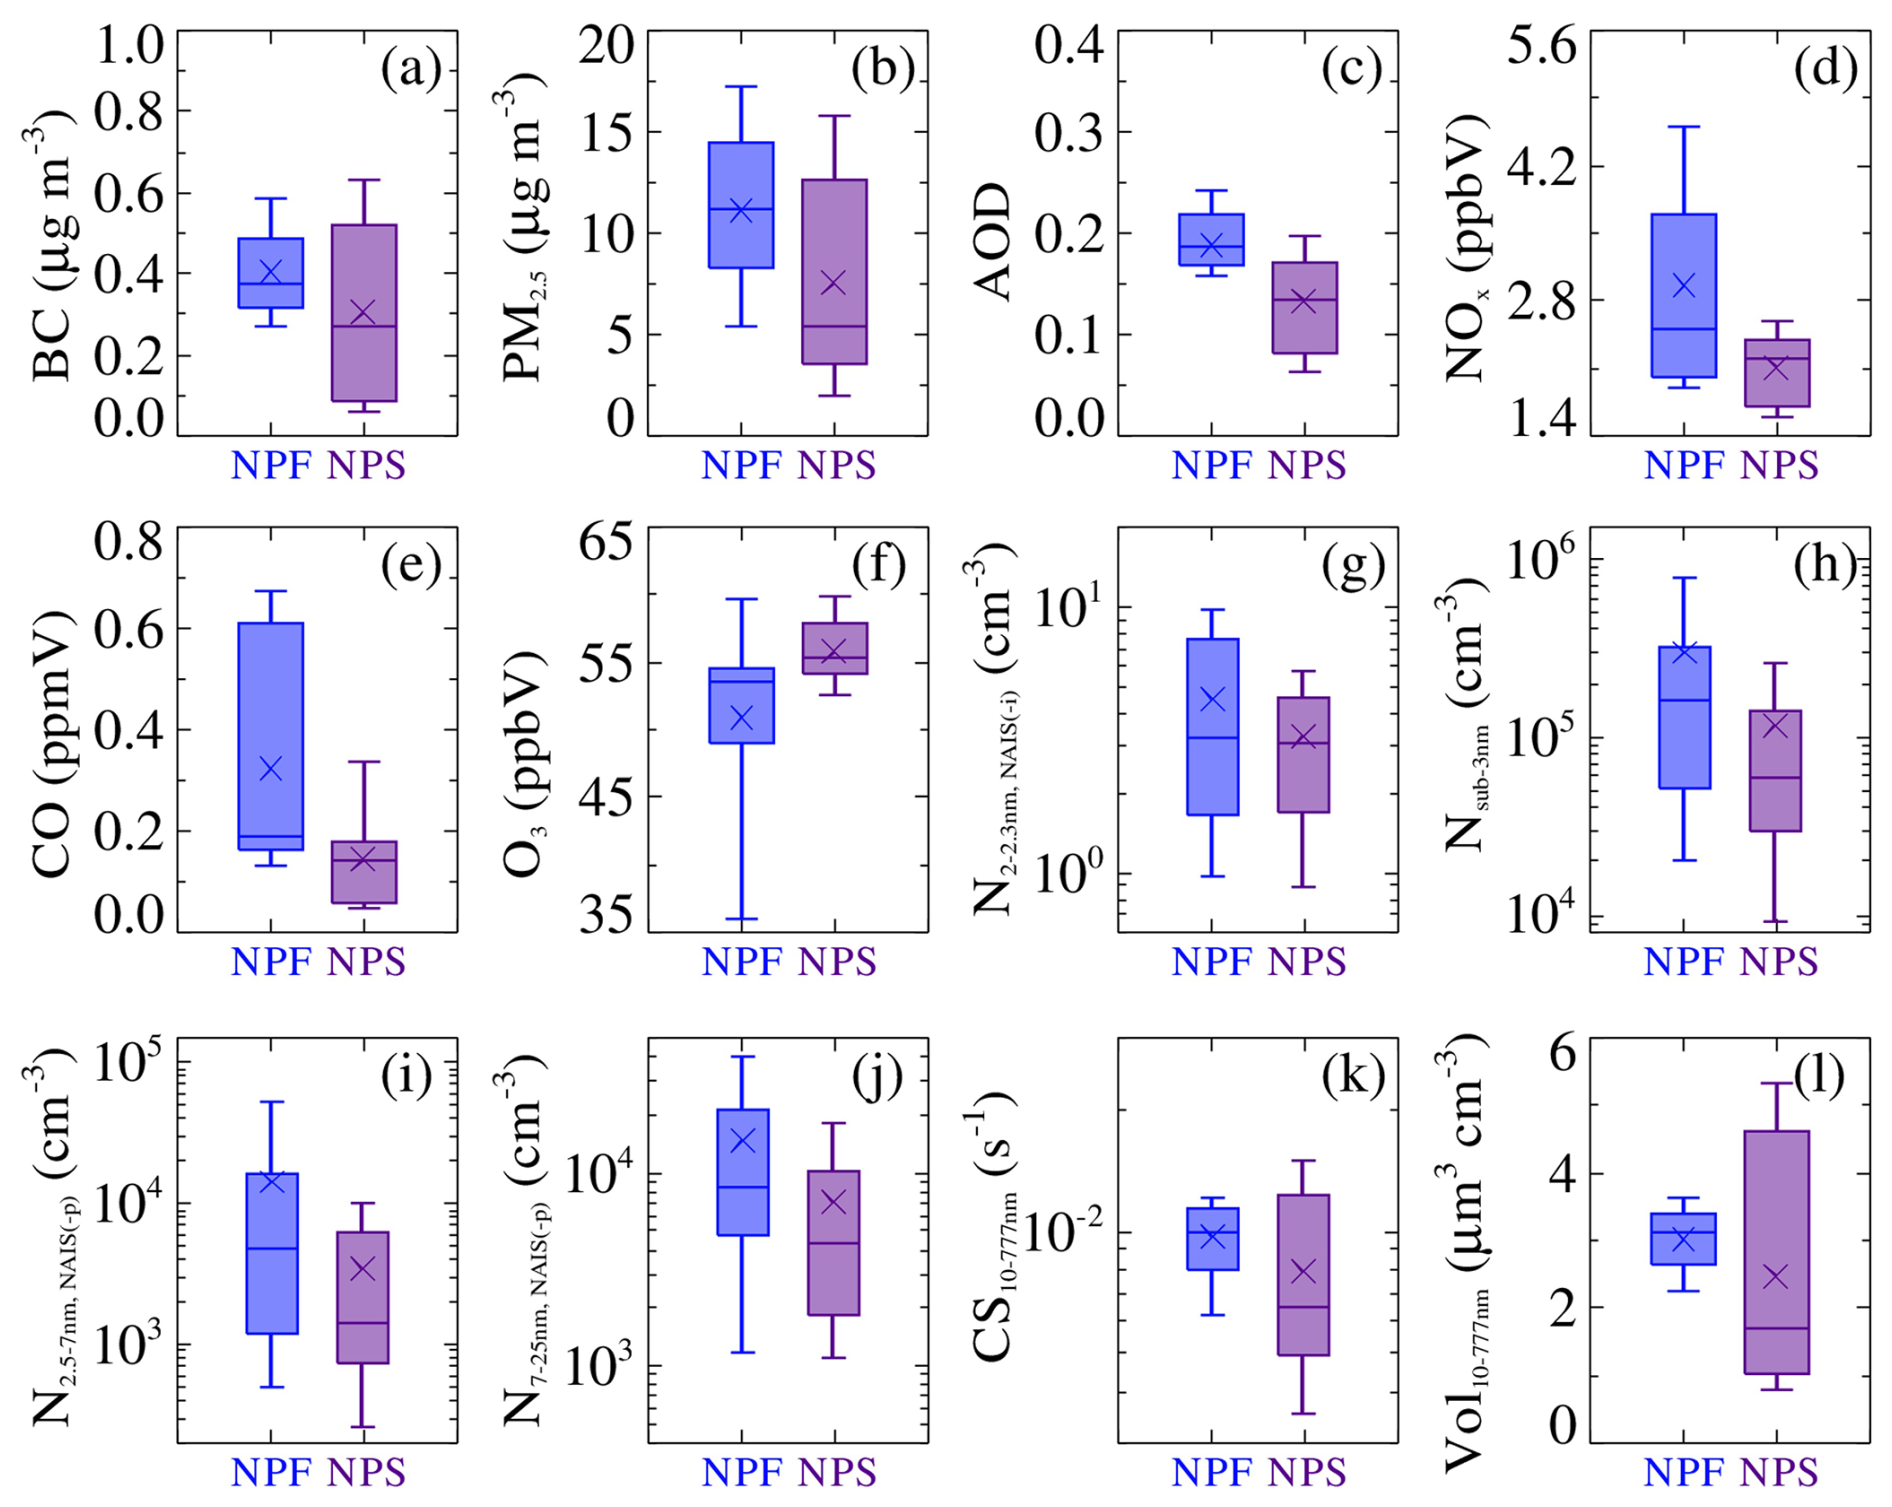
Figure 6Key differences in aerosols, gases, and nanoparticles averaged over the observed NPF (6, 10, and 20 April) and NPS (7, 11, and 21 April) event days. Box–whisker plots show (a) black carbon (BC) mass concentrations, (b) particulate matter with an aerodynamic diameter less than 2.5 µm (PM2.5), (c) aerosol optical depth (AOD), (d) oxides of nitrogen (NOx), (e) carbon monoxide (CO), (f) ozone (O3), (g) negative ions in the 2.0–2.3 nm size range, (h) sub-3 nm particles, (i) negative particles in the 2.5–7.0 nm size range, (j) negative particles in the 7.0–25 nm size range, (k) total condensation sink (CS10−777 nm), and (l) total particle volume concentration. Data correspond to the 06:00–12:00 UTC period. The cross symbol indicates the mean, the horizontal line indicates the median, the bottom and top of the box indicate the 25th and 75th percentiles, and the bottom and top of the whisker indicate the 10th and 90th percentiles.
The origin of the observed nanoparticles during NPS event days can be constrained into three physically consistent scenarios: the particles were either transported from nearby anthropogenic sources or formed upwind of the measurement site and subsequently advected to the site or formed locally but failed to grow. The low BC mass concentrations (Figs. 3f and 6a), together with reduced NOx (Fig. 6d) and CO (Fig. 6e) levels, suggest that contributions from overlapping nucleation modes arising from nearby anthropogenic sources (Hakala et al., 2023) are unlikely to explain the observed nucleation mode particles during the NPS event. Instead, these particles are more likely to be formed upwind of the site and subsequently transported to the observation location. It is therefore critical to constrain the spatial extent of over which particle formation occurs. Two approaches are commonly used to estimate this extent. The first, and more resource-intensive, approach relies on simultaneous measurements of particle size distributions at multiple stationary sites along the air-mass transport pathway. The second approach is based on hourly calculated backward air-mass trajectories. As no simultaneous measurements were available at the upwind locations of the measurement site, the spatial extent of the observed NPF and NPS events was estimated based on backward air-mass trajectory analysis, following the methodology of Hussein et al. (2009). This analysis reveals similar spatial scales for both event types (NPF and NPS; approximately 50–200 km, Fig. S8), with NPS events occurring along a similar air-mass path. This suggests that particle formation occurring upwind of the measurement site on NPS event days is plausible. In our recent study, using simultaneous measurements from a low-altitude site (CAO-AMX) and a high-altitude site (Troodos, CAO-TRO), we showed that approximately half of the observed NPF events at both sites occurred concurrently along the same air-mass pathway, under the influence of an evolving planetary boundary layer height (Deot et al., 2025). The lower number concentrations of negative ions in 2.0–2.3 nm size range (Fig. 6g), sub-3 nm neutral particles (Fig. 6 h), and negative particles in the 2.5–7 nm (Fig. 6i) and 7–25 nm (Fig. 6j) size range on NPS event days can be attributed to reduced levels of condensing vapours (discussed in Sect. 3.2.3), together with a lower condensation sink (Fig. 6k) and a lower particle volume concentration (Fig. 6l).
3.2.3 Role of precursor gases and condensing vapours
Volatile organic compound (VOC) mixing ratios and their early oxidation products were examined to identify the dominant chemical regimes associated with NPF and NPS events. VOCs at the CAO-AMX site are controlled by local temperature and continental transport, with long-term observations indicating the onset of local biogenic emissions in mid-March each year (Garg et al., 2026). Mixing ratios of benzene and toluene (anthropogenic tracers), as well as biogenic tracers such as isoprene and monoterpenes (MTs), were comparable between the 2 d (Fig. 7a). Methyl vinyl ketone (MVK) and methacrolein (MACR), first-generation OH-initiated oxidation products of isoprene, showed similar behavior on both days; accordingly, the (MVK + MACR) isoprene ratio, a proxy for the extent of isoprene oxidation, was also comparable (Fig. 7b). Plant chamber studies (Kiendler-Scharr et al., 2009) and field observations (Kanawade et al., 2011) have shown that isoprene can suppress biogenic NPF at ground level, thereby dampening aerosol cooling effects (Lee et al., 2016), with the extent of suppression depending on the relative contributions of isoprene- and monoterpene-derived carbon. To compare the relative OH-initiated oxidation rates of isoprene and MTs, we calculated the ratio , where and represent the reaction rate coefficients of isoprene and alpha-pinene with OH radical, respectively (Finlayson-Pitts and Pitts, 2000). This ratio was slightly higher during the NPF event (Fig. 7b), indicating an isoprene-dominated OH-reactivity regime that favors the formation of more volatile, lower oxygen-to-carbon () oxidation products, which are less favorable for biogenic NPF. In contrast, the lower ratio observed during the NPS event rules out isoprene-driven suppression of biogenic NPF under those conditions; nevertheless, NPF did not occur at the site on 7 April. Curtius et al. (2024) showed that organonitrates formed from OH-initiated oxidation of isoprene in the presence of nitrogen oxides drive NPF in the upper troposphere over the Amazon. Consistently, concentrations of isoprene-derived hydroxy hydroperoxy nitrate (C5H10O4(ONO2)) measured by MION-APi-TOF were comparable on both days, indicating that the initial stages of isoprene oxidation proceeded similarly during the two events (Fig. 7c). In contrast, peak concentrations of isoprene-derived dinitrates (C5H10O2(ONO2)2) were slightly higher during the NPF event than during the NPS event, indicating a stronger influence of high-NOx driven chemistry during the NPF event. This interpretation is supported by the reactive nitrogen compounds (NOy) concentrations, which were also slightly higher during the NPF event than during the NPS event (Fig. 7c). Further, acetaldehyde (C2H4O), a marker of atmospheric oxidation, also exhibited similar mixing ratios on both days, indicating comparable overall oxidation levels (Fig. 7c).
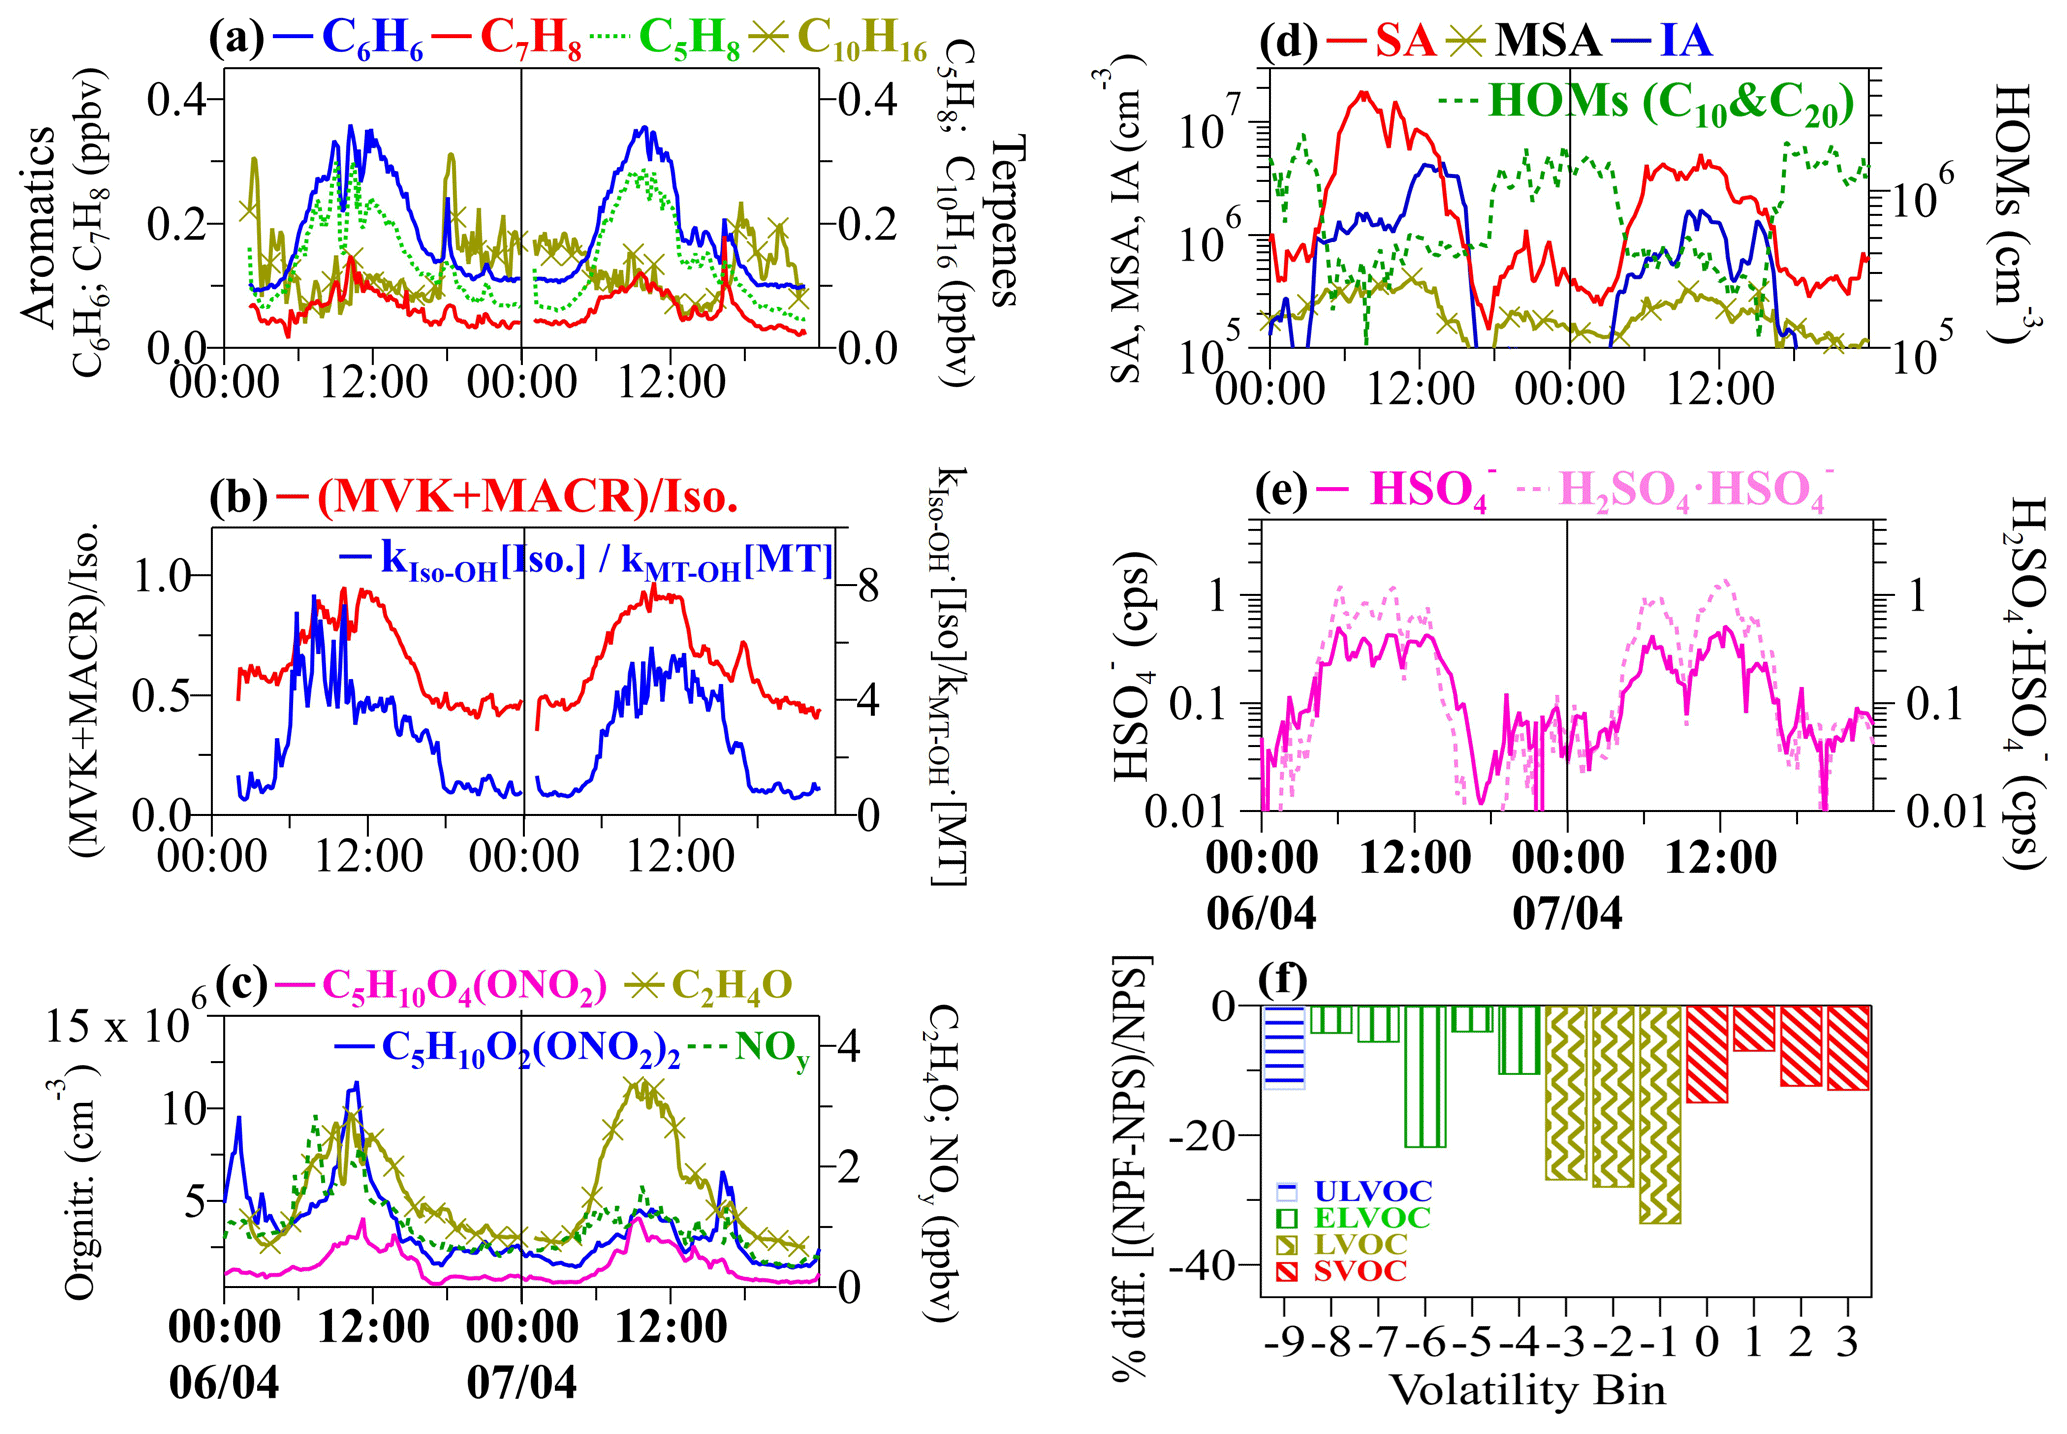
Figure 7Median diurnal variation of aerosol precursors and condensing vapours during the consecutive NPF-NPS events observed during 6 and 7 April. (a) mixing ratios of benzene (C6H6), toluene (C7H8), isoprene (C5H8), and monoterpenes (C10H16); (b) the ratio of the sum of methyl vinyl ketone (MVK) and maethacrolein (MACR) to the isoprene and the relative OH reaction rates of isoprene and ; (c) organonitrates [C5H10O4(ONO2) and C5H10O2(ONO2)2], acetaldehyde (C2H4O) and reactive nitrogen compounds (NOy); (d) concentrations of sulfuric acid (SA), methyl sulfonic acid (MSA), iodic acid (IA), and highly oxygenated organic molecules (HOMs, C10 and C20); (e) ambient ion mode signals of bisulfate monomer () and dimer () in counts per second (cps); (f) percentage difference in organic vapour concentrations () between the NPF and NPS events as a function of volatility bin, expressed as log 10 of the effective saturation concentration, log 10(C*). Negative percentage differences indicate higher organic vapour concentrations during the NPS event. ULVOC, ELVOC, LVOC, and SVOC denote ultra-low volatile organic compound, extremely low volatile organic compound, low volatile organic compound, and semi-volatile organic compound, respectively.
Next, we examined neutral aerosol precursors, including sulfuric acid (SA), methanesulfonic acid (MSA), iodic acid (IA), and HOMs, measured using the nitrate mode of the MION-APi-TOF. SA concentrations were approximately five-fold higher during the NPF event than during the NPS event (Fig. 7d). Nevertheless, SA concentrations during the NPS event () were sufficient to trigger NPF under atmospherically relevant ammonia mixing ratios of 100 parts per trillion by volume (pptv) and dimethylamine mixing ratios of 40 pptv (Kirkby et al., 2011; Kürten et al., 2018). Concurrently, HOMs concentrations increased during the NPF event, but decreased during the NPS event (Fig. 7d), whereas MSA and IA concentrations were comparable on both days (Fig. 7d). Negative ion measurements from APi-TOF further showed that concentrations of bisulfate monomers () and dimers () were also similar on both days (Fig. 7e), indicating comparable levels of ionised SA clusters in the ambient air. No indication of higher multimers or ammonia-containing clusters was detected.
Chamber experiments have demonstrated that initial nanoparticle growth is dominated by extremely low-volatility organics (ELVOC; approximately , volatility ), whereas growth at larger sizes is increasingly supported by more abundant, slightly higher-volatility vapours in the low-volatility organic compounds (LVOC) range (; ) as the Kelvin barrier falls with increasing diameter (Tröstl et al., 2016). We, therefore, examined differences in organic vapour concentrations relevant to early cluster formation and subsequent growth between the two event types (Fig. 7f). Organic vapour concentrations were higher during the NPS event than during the NPF event across all volatility bins (Fig. 7f), indicating that particle growth was not limited by the availability of condensable vapours. Instead, these conditions point to an environment less favorable for stable initial cluster formation and subsequent growth, and more favorable to net evaporation of condensed material. Fast-moving air-masses enhance turbulent mixing, leading to dilution of particle concentrations, precursor gases, and changes in particle size distributions (Shi et al., 1999). This dilution lowers organic aerosol concentrations and reduces the absorptive capacity of the particle phase. As a result, gas-particle equilibrium shifts towards the vapour phase, enhancing evaporation of semi-volatile species from particle surfaces to re-establish equilibrium (Pankow, 1994; Zhang and Wexler, 2004). This repartitioning can cause aerosol mass to decrease more rapidly than expected from dilution alone, reflecting the dynamic response of SVOCs to changing ambient conditions (Donahue et al., 2014). Under ambient conditions, SVOCs partition between the gas and particle phases, whereas LVOCs and ELVOCs exist primarily, or entirely, in the particle phase (Barsanti et al., 2017). Consistent with this framework, the observed reduction in HOM concentrations (Figs. 7d, S9, and S10) and the absence of particle growth suggest that dilution associated with the entrainment of cleaner, drier free tropospheric air into the boundary layer (Figs. 5, S6 and S7) played a key role during NPS events. The similar chemical environment (Figs. 7, S9 and S10) and local meteorological conditions (Figs. 4 and S5), together associated with the contrasting particle evolution (Figs. 3, S3 and S4), indicate that the observed differences in particle behavior were not primarily driven by low condensing vapours but are instead associated with atmospheric dilution.
The higher concentrations of LVOCs and SVOCs observed during the NPS event (Fig. 7f) would, in principle, be expected to condense onto existing particles and promote growth; however, condensation onto the smallest particles is likely suppressed by the strong curvature (Kelvin) effect. This inhibition limits nanoparticle growth despite the availability of condensable material, preventing particles from growing to larger sizes. Consistent with this interpretation, the shift in the modal diameter of the volume size distribution from larger to smaller sizes (Fig. S11), together with the low total particle volume concentrations (Fig. 6l) and elevated LVOC and SVOC concentrations (Fig. 7f), points to the evaporation of condensed material during NPS event days.
This study presents new evidence of nanoparticle shrinkage observed at the rural background site (CAO-AMX) in Cyprus. These events are characterised by a rapid reduction in particle diameters within the sub-20 nm size range, with the particle size distributions contour plot displaying a mirror image of the conventional “banana-shaped” NPF pattern. To our knowledge, this is the first time such a behavior is reported and analyzed, expanding the current phenomenology of atmospheric aerosol evolution.
Using a suite of instruments that enabled comprehensive gas- and particle-phase measurements, we conclude that NPS events are not primarily driven by low vapour concentrations but associated with atmospheric dilution, as indicated by air-mass trajectory analysis. SA concentrations during NPS events were sufficient to trigger NPF under atmospherically relevant boundary layer conditions, while key VOC mixing ratios and oxidation rates were comparable between NPF and NPS cases. Moreover, the limited local cluster formation, low black carbon and NOx concentrations, and a distinct air-mass source region rule out local primary emissions as the origin of the observed sub-20 nm particles. The similar spatial scales of these events suggest that the sub-20 nm particles likely originated from particle formation occurring upwind of the measurement site. These events were further characterized by fast-moving air masses, which can enhance turbulent mixing, thereby altering particle size distributions. Such conditions reduce organic aerosol mass and shifts gas-particle equilibrium towards evaporation. Volatility-resolved analysis further indicated a dominance of organic compounds of low and moderate volatility. Although ULVOCs and ELVOCs concentrations were slightly higher during NPS events, particle formation and subsequent growth remained inhibited, supporting net evaporation and leading to rapid particle shrinkage.
Our findings highlight a previously unrecognised sink for nanoparticles occurring under conditions favorable for particle formation and growth. This can negatively impact the CCN budget, thereby damping the aerosol-induced radiative cooling effect.
Time-synchronised 10 min median 1-D and 3-D data variables are available at Zenodo (https://doi.org/10.5281/zenodo.18685092, Kanawade et al., 2026). Ceilometer data can be viewed at https://e-profile.eu/ (last access date: 25 January 2025). ERA5 reanalysis data are publicly available from Copernicus Climate Change Service (C3S) Climate Data Store (CDS) at https://cds.climate.copernicus.eu/datasets (last access: 27 January 2025). AERONET aerosol optical depth data are available publicly to download from https://aeronet.gsfc.nasa.gov/ (last access: 7 October 2025). Surface elevation data from the U.S. Geological Survey Earth Resources Observation and Science (EROS) Center is available publicly to download from https://www.usgs.gov/centers/eros/science/usgs-eros-archive-digita l-elevation-global-30-arc-second-elevation-gtopo30 (last access: 22 October 2024).
The IGOR Pro (V9) data analysis tool is available from the corresponding author upon reasonable request.
The supplement related to this article is available online at https://doi.org/10.5194/acp-26-8839-2026-supplement.
VPK, MP, FM, GB, EB, JS, and TJ designed the experiments. ND, AC, MvdB, AP, MP, SB, and CS carried them out. VPK, MC, AC, CL, AP, RB, MP, and AG analyzed the data. VPK prepared the manuscript with contributions from all co-authors.
The contact author has declared that none of the authors has any competing interests.
Views and opinions expressed are, however, those of the author(s) only and do not necessarily reflect those of the European Union or the European Research Council Executive Agency. Neither the European Union nor the granting authority can be held responsible for them.
Publisher's note: Copernicus Publications remains neutral with regard to jurisdictional claims made in the text, published maps, institutional affiliations, or any other geographical representation in this paper. The authors bear the ultimate responsibility for providing appropriate place names. Views expressed in the text are those of the authors and do not necessarily reflect the views of the publisher.
VPK and TJ acknowledge support from the European Union's ERC-2022-STGERC-BAE-Project (grant no. 101076311). The authors thank the University of Helsinki, INAR/Physics, and CiGas-UHEL for support and instrumentation. We thank the PIs of the AERONET station at Agia Marina Xyliatou for their efforts in establishing and maintaining the station and for providing valuable data. The authors also would like to thank the Department of Labour Inspection (DLI) for providing air quality and meteorological data. The authors are grateful to the technical support team: Nikoleta Lekaki, Moreno Parolin, Pierre-Yves Quehe, and Rafail Konatzii for maintaining field stations, and Maximillien Desservettaz for assisting with the PTR-ToF-MS operation. The authors acknowledge valuable comments and suggestions from the reviewers.
This work was funded by the European Union's ERC-2022-STGERC-BAE-Project (grant no. 101076311), the European Union's Horizon 2020 research and innovation program (grant no. 856612), the Cyprus Government (EMME-CARE), and the EVOCPOLIS project (grant no. Vision ERC-Parth 2/0524/0215), co-funded by the EU within the framework of the Cohesion Policy Programme “THALIA 2021-2027”.
This paper was edited by Imre Salma and reviewed by Niku Kivekäs and one anonymous referee.
Alonso-Blanco, E., Gómez-Moreno, F. J., Núñez, L., Pujadas, M., Cusack, M., and Artíñano, B.: Aerosol particle shrinkage event phenomenology in a south European suburban area during 2009–2015, Atmos. Environ., 160, 154–164, https://doi.org/10.1016/j.atmosenv.2017.04.013, 2017.
Asmi, E., Kivekäs, N., Kerminen, V.-M., Komppula, M., Hyvärinen, A.-P., Hatakka, J., Viisanen, Y., and Lihavainen, H.: Secondary new particle formation in Northern Finland Pallas site between the years 2000 and 2010, Atmos. Chem. Phys., 11, 12959–12972, https://doi.org/10.5194/acp-11-12959-2011, 2011.
Baalbaki, R., Pikridas, M., Jokinen, T., Laurila, T., Dada, L., Bezantakos, S., Ahonen, L., Neitola, K., Maisser, A., Bimenyimana, E., Christodoulou, A., Unga, F., Savvides, C., Lehtipalo, K., Kangasluoma, J., Biskos, G., Petäjä, T., Kerminen, V.-M., Sciare, J., and Kulmala, M.: Towards understanding the characteristics of new particle formation in the Eastern Mediterranean, Atmos. Chem. Phys., 21, 9223–9251, https://doi.org/10.5194/acp-21-9223-2021, 2021.
Backman, J., Rizzo, L. V., Hakala, J., Nieminen, T., Manninen, H. E., Morais, F., Aalto, P. P., Siivola, E., Carbone, S., Hillamo, R., Artaxo, P., Virkkula, A., Petäjä, T., and Kulmala, M.: On the diurnal cycle of urban aerosols, black carbon and the occurrence of new particle formation events in springtime São Paulo, Brazil, Atmos. Chem. Phys., 12, 11733–11751, https://doi.org/10.5194/acp-12-11733-2012, 2012.
Barsanti, K. C., Kroll, J. H., and Thornton, J. A.: Formation of low-volatility organic compounds in the atmosphere: recent advancements and insights, J. Phys. Chem. Lett., 8, 1503–1511, https://doi.org/10.1021/acs.jpclett.6b02969, 2017.
Cai, M., Liang, B., Sun, Q., Liu, L., Yuan, B., Shao, M., Huang, S., Peng, Y., Wang, Z., Tan, H., Li, F., Xu, H., Chen, D., and Zhao, J.: The important roles of surface tension and growth rate in the contribution of new particle formation (NPF) to cloud condensation nuclei (CCN) number concentration: evidence from field measurements in southern China, Atmos. Chem. Phys., 21, 8575–8592, https://doi.org/10.5194/acp-21-8575-2021, 2021.
Charlson, R. J., Schwartz, S. E., Hales, J. M., Cess, R. D., Coakley, J. A., Hansen, J. E., and Hofmann, D. J.: Climate forcing by anthropogenic aerosols, Science, 255, 423–430, https://doi.org/10.1126/science.255.5043.423, 1992.
Clarke, A. D.: Atmospheric nuclei in the Pacific midtroposphere: their nature, concentration, and evolution, J. Geophys. Res., 98, 20633–20647, https://doi.org/10.1029/93JD00797, 1993.
Curtius, J., Heinritzi, M., Beck, L. J., Pöhlker, M. L., Tripathi, N., Krumm, B. E., Holzbeck, P., Nussbaumer, C. M., Hernández Pardo, L., Klimach, T., Barmpounis, K., Andersen, S. T., Bardakov, R., Bohn, B., Cecchini, M. A., Chaboureau, J.-P., Dauhut, T., Dienhart, D., Dörich, R., Edtbauer, A., Giez, A., Hartmann, A., Holanda, B. A., Joppe, P., Kaiser, K., Keber, T., Klebach, H., Krüger, O. O., Kürten, A., Mallaun, C., Marno, D., Martinez, M., Monteiro, C., Nelson, C., Ort, L., Raj, S. S., Richter, S., Ringsdorf, A., Rocha, F., Simon, M., Sreekumar, S., Tsokankunku, A., Unfer, G. R., Valenti, I. D., Wang, N., Zahn, A., Zauner-Wieczorek, M., Albrecht, R. I., Andreae, M. O., Artaxo, P., Crowley, J. N., Fischer, H., Harder, H., Herdies, D. L., Machado, L. A. T., Pöhlker, C., Pöschl, U., Possner, A., Pozzer, A., Schneider, J., Williams, J., and Lelieveld, J.: Isoprene nitrates drive new particle formation in Amazon's upper troposphere, Nature, 636, 124–130, https://doi.org/10.1038/s41586-024-08192-4, 2024.
Cusack, M., Alastuey, A., and Querol, X.: Case studies of new particle formation and evaporation processes in the western Mediterranean regional background, Atmos. Environ., 81, 651–659, https://doi.org/10.1016/j.atmosenv.2013.09.025, 2013.
Dal Maso, M., Kulmala, M., Riipinen, I., Wagner, R., Hussein, T., Aalto, P. P., and Lehtinen, K. E. J.: Formation and growth of fresh atmospheric aerosols: eight years of aerosol size distribution data from SMEAR II, Hyytiälä, Finland, Boreal Environ. Res., 10, 323–336, 2005.
Deot, N., Kanawade, V. P., Papetta, A., Baalbaki, R., Pikridas, M., Marenco, F., Kulmala, M., Sciare, J., Lehtipalo, K., and Jokinen, T.: Effect of planetary boundary layer evolution on new particle formation events over Cyprus, Aerosol Research, 3, 139–154, https://doi.org/10.5194/ar-3-139-2025, 2025.
Desservettaz, M., Pikridas, M., Stavroulas, I., Bougiatioti, A., Liakakou, E., Hatzianastassiou, N., Sciare, J., Mihalopoulos, N., and Bourtsoukidis, E.: Emission of volatile organic compounds from residential biomass burning and their rapid chemical transformations, Sci. Total Environ., 903, 166592, https://doi.org/10.1016/j.scitotenv.2023.166592, 2023.
Donahue, N. M., Robinson, A. L., Trump, E. R., Riipinen, I., and Kroll, J. H.: Volatility and aging of atmospheric organic aerosol, in: Atmospheric and Aerosol Chemistry, edited by: McNeill, V. F. and Ariya, P. A., Springer, Berlin, Heidelberg, 97–143, https://doi.org/10.1007/128_2012_355, 2014.
Draxler, R. R. and Rolph, G. D.: HYSPLIT (Hybrid Single-Particle Lagrangian Integrated Trajectory) Model, http://ready.arl.noaa.gov/HYSPLIT.php (last access: 25 February 2026), 2010.
Drinovec, L., Močnik, G., Zotter, P., Prévôt, A. S. H., Ruckstuhl, C., Coz, E., Rupakheti, M., Sciare, J., Müller, T., Wiedensohler, A., and Hansen, A. D. A.: The “dual-spot” Aethalometer: an improved measurement of aerosol black carbon with real-time loading compensation, Atmos. Meas. Tech., 8, 1965–1979, https://doi.org/10.5194/amt-8-1965-2015, 2015.
El-Sayed, M. M. H., Ortiz-Montalvo, D. L., and Hennigan, C. J.: The effects of isoprene and NOx on secondary organic aerosols formed through reversible and irreversible uptake to aerosol water, Atmos. Chem. Phys., 18, 1171–1184, https://doi.org/10.5194/acp-18-1171-2018, 2018.
Emeis, S., Jahn, C., Münkel, C., Münsterer, C., and Schäfer, K.: Multiple atmospheric layering and mixing-layer height in the Inn valley observed by remote sensing, Meteorol. Z., 16, 415–424, 2007.
Finlayson-Pitts, B. J. and Pitts, J. N., Jr.: Chemistry of the Upper and Lower Atmosphere, Elsevier/Academic Press, https://doi.org/10.1016/B978-012257060-5/50010-1, 2000.
Garg, A., Desservettaz, M., Christodoulou, A., Christoudias, T., Kanawade, V. P., Savvides, C., Vrekoussis, M., Naqui, S., Jokinen, T., Byron, J., Williams, J., Mihalopoulos, N., Liakakou, E., Sciare, J., and Bourtsoukidis, E.: Heat and continental transport shape the variability of volatile organic compounds in the Eastern Mediterranean: insights from multi-year observations and regional modeling, Atmos. Chem. Phys., 26, 2597–2622, https://doi.org/10.5194/acp-26-2597-2026, 2026.
Gordon, H., Kirkby, J., Baltensperger, U., Bianchi, F., Breitenlechner, M., Curtius, J., Dias, A., Dommen, J., Donahue, N. M., Dunne, E. M., Duplissy, J., Ehrhart, S., Flagan, R. C., Frege, C., Fuchs, C., Hansel, A., Hoyle, C. R., Kulmala, M., Kürten, A., Lehtipalo, K., Makhmutov, V., Molteni, U., Rissanen, M. P., Stozkhov, Y., Tröstl, J., Tsagkogeorgas, G., Wagner, R., Williamson, C., Wimmer, D., Winkler, P. M., Yan, C., and Carslaw, K. S.: Causes and importance of new particle formation in the present-day and preindustrial atmospheres, J. Geophys. Res.-Atmos., 122, 8739–8760, https://doi.org/10.1002/2017JD026844, 2017.
Gormley, P. G. and Kennedy, M.: Diffusion from a stream flowing through a cylindrical tube, Proc. R. Ir. Acad. A, 52, 163–169, 1948.
Guo, S., Hu, M., Zamora, M. L., Peng, J., Shang, D., Zheng, J., Du, Z., Wu, Z., Shao, M., Zeng, L., Molina, M. J., and Zhang, R.: Elucidating severe urban haze formation in China, P. Natl. Acad. Sci. USA, 111, 17373–17378, https://doi.org/10.1073/pnas.1419604111, 2014.
Hakala, S., Alghamdi, M. A., Paasonen, P., Vakkari, V., Khoder, M. I., Neitola, K., Dada, L., Abdelmaksoud, A. S., Al-Jeelani, H., Shabbaj, I. I., Almehmadi, F. M., Sundström, A.-M., Lihavainen, H., Kerminen, V.-M., Kontkanen, J., Kulmala, M., Hussein, T., and Hyvärinen, A.-P.: New particle formation, growth and apparent shrinkage at a rural background site in western Saudi Arabia, Atmos. Chem. Phys., 19, 10537–10555, https://doi.org/10.5194/acp-19-10537-2019, 2019.
Hakala, S., Vakkari, V., Lihavainen, H., Hyvärinen, A.-P., Neitola, K., Kontkanen, J., Kerminen, V.-M., Kulmala, M., Petäjä, T., Hussein, T., Khoder, M. I., Alghamdi, M. A., and Paasonen, P.: Explaining apparent particle shrinkage related to new particle formation events in western Saudi Arabia does not require evaporation, Atmos. Chem. Phys., 23, 9287–9321, https://doi.org/10.5194/acp-23-9287-2023, 2023.
Hersbach, H., Bell, B., Berrisford, P., Biavati, G., Horányi, A., Muñoz Sabater, J., Nicolas, J., Peubey, C., Radu, R., Rozum, I., Schepers, D., Simmons, A., Soci, C., Dee, D., and Thépaut, J.-N.: ERA5 hourly data on pressure levels from 1940 to present, Copernicus Climate Change Service (C3S) Climate Data Store (CDS), https://doi.org/10.24381/cds.bd0915c6, 2023.
Holben, B. N., Eck, T. F., Slutsker, I., Tanré, D., Buis, J. P., Setzer, A., Vermote, E., Reagan, J. A., Kaufman, Y. J., Nakajima, T., Lavenu, F., Jankowiak, I., and Smirnov, A.: AERONET – A Federated Instrument Network and Data Archive for Aerosol Characterization, Remote Sens. Environ., 66, 1–16, https://doi.org/10.1016/S0034-4257(98)00031-5, 1998.
Hussein, T., Junninen, H., Tunved, P., Kristensson, A., Dal Maso, M., Riipinen, I., Aalto, P. P., Hansson, H.-C., Swietlicki, E., and Kulmala, M.: Time span and spatial scale of regional new particle formation events over Finland and Southern Sweden, Atmos. Chem. Phys., 9, 4699–4716, https://doi.org/10.5194/acp-9-4699-2009, 2009.
Hussein, T., Atashi, N., Sogacheva, L., Hakala, S., Dada, L., Petäjä, T., and Kulmala, M.: Characterization of urban new particle formation in Amman – Jordan, Atmosphere, 11, 79, https://doi.org/10.3390/atmos11010079, 2020.
Illingworth, A. J., Cimini, D., Haefele, A., Haeffelin, M., Hervo, M., Kotthaus, S., Löhnert, U., Martinet, P., Mattis, I., O'Connor, E. J., and Potthast, R.: How Can Existing Ground-Based Profiling Instruments Improve European Weather Forecasts?, B. Am. Meteorol. Soc., 100, 605–619, https://doi.org/10.1175/BAMS-D-17-0231.1, 2019.
IPCC: Climate Change 2023: Synthesis Report. Contribution of Working Groups I, II and III to the Sixth Assessment Report of the Intergovernmental Panel on Climate Change, Core Writing Team, edited by: Lee, H. and Romero, J., IPCC, Geneva, Switzerland, 35–115, https://doi.org/10.59327/IPCC/AR6-9789291691647, 2023.
Junninen, H., Ehn, M., Petäjä, T., Luosujärvi, L., Kotiaho, T., Kostiainen, R., Rohner, U., Gonin, M., Fuhrer, K., Kulmala, M., and Worsnop, D. R.: A high-resolution mass spectrometer to measure atmospheric ion composition, Atmos. Meas. Tech., 3, 1039–1053, https://doi.org/10.5194/amt-3-1039-2010, 2010.
Kamra, A. K., Victor, J. N., Siingh, D., Singh, A., and Dharmaraj, T.: Changes in the new particle formation and shrinkage events of the atmospheric ions during the COVID-19 lockdown, Urban Clim., 44, 101214, https://doi.org/10.1016/j.uclim.2022.101214, 2022.
Kanawade, V., Deot, N., Ciobanu, M., Christodoulou, A., van den Born, M., Liu, C., Papetta, A., Baalbaki, R., Pikridas, M., Bezantakos, S., Garg, A., Savvides, C., Bourtsoukidis, E., Biskos, G., Marenco, F., Sciare, J., and Jokinen, T.: Dataset for ”Atypical nanoparticle shrinkage phenomenon”, Version v1, Zenodo [data set], https://doi.org/10.5281/zenodo.18685092, 2026.
Kanawade, V. P., Benson, D. R., and Lee, S. H.: Statistical analysis of 4 year observations of aerosol sizes in a semi-rural continental environment, Atmos. Environ., 59, 30–38, https://doi.org/10.1016/j.atmosenv.2012.05.047, 2012.
Kanawade, V. P., Jobson, B. T., Guenther, A. B., Erupe, M. E., Pressley, S. N., Tripathi, S. N., and Lee, S.-H.: Isoprene suppression of new particle formation in a mixed deciduous forest, Atmos. Chem. Phys., 11, 6013–6027, https://doi.org/10.5194/acp-11-6013-2011, 2011.
Kerminen, V.-M., Chen, X., Vakkari, V., Petäjä, T., Kulmala, M., and Bianchi, F.: Atmospheric new particle formation and growth: review of field observations, Environ. Res. Lett., 13, 103003, https://doi.org/10.1088/1748-9326/aadf3c, 2018.
Kiendler-Scharr, A., Wildt, J., Dal Maso, M., Hohaus, T., Kleist, E., Mentel, T. F., Tillmann, R., Uerlings, R., Schurr, U., and Wahner, A.: New particle formation in forests inhibited by isoprene emissions, Nature, 461, 381–384, https://doi.org/10.1038/nature08292, 2009.
Kirkby, J., Curtius, J., Almeida, J., Dunne, E., Duplissy, J., Ehrhart, S., Franchin, A., Gagne, S., Ickes, L., Kürten, A., Kupc, A., Metzger, A., Riccobono, F., Rondo, L., Schobesberger, S., Tsagkogeorgas, G., Wimmer, D., Amorim, A., Bianchi, F., Breitenlechner, M., David, A., Dommen, J., Downard, A., Ehn, M., Flagan, R. C., Haider, S., Hansel, A., Hauser, D., Jud, W., Junninen, H., Kreissl, F., Kvashin, A., Laaksonen, A., Lehtipalo, K., Lima, J., Lovejoy, E. R., Makhmutov, V., Mathot, S., Mikkilä, J., Minginette, P., Mogo, S., Nieminen, T., Onnela, A., Pereira, P., Petäjä, T., Schnitzhofer, R., Seinfeld, J. H., Sipilä, M., Stozhkov, Y., Stratmann, F., Tomè, A., Vanhanen, J., Viisanen, Y., Vrtala, A., Wagner, P. E., Walther, H., Weingartner, E., Wex, H., Winkler, P. M., Carslaw, K. S., Worsnop, D. R., Baltensperger, U., and Kulmala, M.: Role of sulphuric acid, ammonia and galactic cosmic rays in atmospheric aerosol nucleation, Nature, 476, 429–433, https://doi.org/10.1038/nature10343, 2011.
Kivekäs, N., Carpman, J., Roldin, P., Leppä, J., O'Connor, E., Kristensson, A., and Asmi, E.: Coupling an aerosol box model with one-dimensional flow: a tool for understanding observations of new particle formation events, Tellus B, 68, 29706, https://doi.org/10.3402/tellusb.v68.29706, 2016.
Kulmala, M., Pirjola, L., and Mäkelä, J. M.: Stable sulphate clusters as a source of new atmospheric particles, Nature, 404, 66–69, https://doi.org/10.1038/35003550, 2000.
Kulmala, M., Dal Maso, M., Mäkelä, J. M., Pirjola, L., Väkevä, M., Aalto, P., Miikkulainen, P., Hämeri, K., and O'Dowd, C. D.: On the formation, growth and composition of nucleation mode particles, Tellus B, 53, 479–490, https://doi.org/10.3402/tellusb.v53i4.16622, 2001.
Kulmala, M., Vehkamäki, H., Petäjä, T., Dal Maso, M., Lauri, A., Kerminen, V.-M., Birmili, W., and McMurry, P. H.: Formation and growth rates of ultrafine atmospheric particles: a review of observations, J. Aerosol Sci., 35, 143–176, https://doi.org/10.1016/j.jaerosci.2003.10.003, 2004.
Kulmala, M., Cai, R., Stolzenburg, D., Zhou, Y., Dada, L., Guo, Y., Yan, C., Petäjä, T., Jiang, J., and Kerminen, V.-M.: The contribution of new particle formation and subsequent growth to haze formation, Environ. Sci.: Atmos., 2, 352–361, https://doi.org/10.1039/D1EA00096A, 2022.
Kürten, A., Li, C., Bianchi, F., Curtius, J., Dias, A., Donahue, N. M., Duplissy, J., Flagan, R. C., Hakala, J., Jokinen, T., Kirkby, J., Kulmala, M., Laaksonen, A., Lehtipalo, K., Makhmutov, V., Onnela, A., Rissanen, M. P., Simon, M., Sipilä, M., Stozhkov, Y., Tröstl, J., Ye, P., and McMurry, P. H.: New particle formation in the sulfuric acid–dimethylamine–water system: reevaluation of CLOUD chamber measurements and comparison to an aerosol nucleation and growth model, Atmos. Chem. Phys., 18, 845–863, https://doi.org/10.5194/acp-18-845-2018, 2018.
Laakso, L., Merikanto, J., Vakkari, V., Laakso, H., Kulmala, M., Molefe, M., Kgabi, N., Mabaso, D., Carslaw, K. S., Spracklen, D. V., Lee, L. A., Reddington, C. L., and Kerminen, V.-M.: Boundary layer nucleation as a source of new CCN in savannah environment, Atmos. Chem. Phys., 13, 1957–1972, https://doi.org/10.5194/acp-13-1957-2013, 2013.
Laj, P., Lund Myhre, C., Riffault, V., Amiridis, V., Fuchs, H., Eleftheriadis, K., Petäjä, T., Salameh, T., Kivekäs, N., Juurola, E., Saponaro, G., Philippin, S., Cornacchia, C., Alados Arboledas, L., Baars, H., Claude, A., De Mazière, M., Dils, B., Dufresne, M., Evangeliou, N., Favez, O., Fiebig, M., Haeffelin, M., Herrmann, H., Höhler, K., Illmann, N., Kreuter, A., Ludewig, E., Marinou, E., Möhler, O., Mona, L., Eder Murberg, L., Nicolae, D., Novelli, A., O'Connor, E., Ohneiser, K., Petracca Altieri, R. M., Picquet-Varrault, B., van Pinxteren, D., Pospichal, B., Putaud, J.-P., Reimann, S., Siomos, N., Stachlewska, I., Tillmann, R., Voudouri, K. A., Wandinger, U., Wiedensohler, A., Apituley, A., Comerón, A., Gysel-Beer, M., Mihalopoulos, N., Nikolova, N., Pietruczuk, A., Sauvage, S., Sciare, J., Skov, H., Svendby, T., Swietlicki, E., Tonev, D., Vaughan, G., Zdimal, V., Baltensperger, U., Doussin, J.-F., Kulmala, M., Pappalardo, G., Sorvari Sundet, S., and Vana, M.: Aerosol, Clouds and Trace Gases Research Infrastructure (ACTRIS): The European Research Infrastructure Supporting Atmospheric Science, B. Am. Meteorol. Soc., 105, E1098–E1136, https://doi.org/10.1175/BAMS-D-23-0064.1, 2024.
Lee, S. H., Uin, J., Guenther, A. B., de Gouw, J. A., Yu, F., Nadykto, A. B., Herb, J., Ng, N. L., Koss, A., Brune, W. H., Baumann, K., Kanawade, V. P., Keutsch, F. N., Nenes, A., Olsen, K., Goldstein, A., and Ouyang, Q.: Isoprene suppression of new particle formation: potential mechanisms and implications, J. Geophys. Res.-Atmos., 121, 14621–14635, https://doi.org/10.1002/2016JD024844, 2016.
Lehtipalo, K., Ahonen, L. R., Baalbaki, R., Sulo, J., Chan, T., Laurila, T., Dada, L., Duplissy, J., Miettinen, E., Vanhanen, J., Kangasluoma, J., Kulmala, M., Petäjä, T., and Jokinen, T.: The standard operating procedure for Airmodus Particle Size Magnifier and nano-condensation nucleus counter, J. Aerosol Sci., 159, 105896, https://doi.org/10.1016/j.jaerosci.2021.105896, 2022.
Manninen, H. E., Mirme, S., Mirme, A., Petäjä, T., and Kulmala, M.: How to reliably detect molecular clusters and nucleation mode particles with Neutral cluster and Air Ion Spectrometer (NAIS), Atmos. Meas. Tech., 9, 3577–3605, https://doi.org/10.5194/amt-9-3577-2016, 2016.
Merikanto, J., Spracklen, D. V., Mann, G. W., Pickering, S. J., and Carslaw, K. S.: Impact of nucleation on global CCN, Atmos. Chem. Phys., 9, 8601–8616, https://doi.org/10.5194/acp-9-8601-2009, 2009.
Mirme, S. and Mirme, A.: The mathematical principles and design of the NAIS – a spectrometer for the measurement of cluster ion and nanometer aerosol size distributions, Atmos. Meas. Tech., 6, 1061–1071, https://doi.org/10.5194/amt-6-1061-2013, 2013.
Mishra, S., Tripathi, S. N., Kanawade, V. P., Haslett, S. L., Dada, L., Ciarelli, G., Kumar, V., Singh, A., Bhattu, D., Rastogi, N., Daellenbach, K. R., Ganguly, D., Gargava, P., Slowik, J. G., Kulmala, M., Mohr, C., El-Haddad, I., and Prévôt, A. S. H.: Rapid night-time nanoparticle growth in Delhi driven by biomass-burning emissions, Nat. Geosci., 16, 224–230, https://doi.org/10.1038/s41561-023-01138-x, 2023.
Mohr, C., Thornton, J. A., Heitto, A., Lopez-Hilfiker, F. D., Lutz, A., Riipinen, I., Hong, J., Donahue, N. M., Hallquist, M., Petäjä, T., Kulmala, M., and Yli-Juuti, T.: Molecular identification of organic vapors driving atmospheric nanoparticle growth, Nat. Commun., 10, 4442, https://doi.org/10.1038/s41467-019-12473-2, 2019.
Münkel, C. and Roininen, R.: Investigation of boundary layer structures with ceilometer using a novel robust algorithm, in: Proceedings of the 15th Symposium on Meteorological Observation and Instrumentation, American Meteorological Society, Atlanta, Georgia, Paper No. 5.3, https://ams.confex.com/ams/90annual/webprogram/Session23894.html (last access: 21 August 2025), 19 January 2010.
Nilsson, E. D., Paatero, J., and Boy, M.: Effects of air masses and synoptic weather on aerosol formation in the continental boundary layer, Tellus B, 53, 462–478, https://doi.org/10.3402/tellusb.v53i4.16619, 2001.
Pankow, J. F.: An absorption model of gas/particle partitioning of organic compounds in the atmosphere, Atmos. Environ., 28, 185–188, https://doi.org/10.1016/1352-2310(94)90093-0, 1994.
Petzold, A., Ogren, J. A., Fiebig, M., Laj, P., Li, S.-M., Baltensperger, U., Holzer-Popp, T., Kinne, S., Pappalardo, G., Sugimoto, N., Wehrli, C., Wiedensohler, A., and Zhang, X.-Y.: Recommendations for reporting “black carbon” measurements, Atmos. Chem. Phys., 13, 8365–8379, https://doi.org/10.5194/acp-13-8365-2013, 2013.
Rissanen, M. P., Mikkilä, J., Iyer, S., and Hakala, J.: Multi-scheme chemical ionization inlet (MION) for fast switching of reagent ion chemistry in atmospheric pressure chemical ionization mass spectrometry (CIMS) applications, Atmos. Meas. Tech., 12, 6635–6646, https://doi.org/10.5194/amt-12-6635-2019, 2019.
Rose, C., Sellegri, K., Moreno, I., Velarde, F., Ramonet, M., Weinhold, K., Krejci, R., Andrade, M., Wiedensohler, A., Ginot, P., and Laj, P.: CCN production by new particle formation in the free troposphere, Atmos. Chem. Phys., 17, 1529–1541, https://doi.org/10.5194/acp-17-1529-2017, 2017.
Rosenfeld, D., Sherwood, S., Wood, R., and Donner, L.: Climate effects of aerosol-cloud interactions, Science, 343, 379–380, https://doi.org/10.1126/science.1247490, 2014.
Salma, I., Németh, Z., Weidinger, T., Kovács, B., and Kristóf, G.: Measurement, growth types and shrinkage of newly formed aerosol particles at an urban research platform, Atmos. Chem. Phys., 16, 7837–7851, https://doi.org/10.5194/acp-16-7837-2016, 2016.
Schultz, M. G., Akimoto, H., Bottenheim, J., Buchmann, B., Galbally, I. E., Gilge, S., Helmig, D., Koide, H., Lewis, A. C., Novelli, P. C., Plass-Dülmer, C., Ryerson, T. B., Steinbacher, M., Steinbrecher, R., Tarasova, O., Tørseth, K., Thouret, V., and Zellweger, C.: The Global Atmosphere Watch reactive gases measurement network, Elementa: Science of the Anthropocene, 3, https://doi.org/10.12952/journal.elementa.000067, 2015.
Sebastian, M., Kompalli, S. K., Kumar, V. A., Jose, S., Babu, S. S., Pandithurai, G., Singh, S., Hooda, R. K., Soni, V. K., Pierce, J. R., Vakkari, V., Asmi, E., Westervelt, D. M., Hyvärinen, A.-P., and Kanawade, V. P.: Observations of particle number size distributions and new particle formation in six Indian locations , Atmos. Chem. Phys., 22, 4491–4508, https://doi.org/10.5194/acp-22-4491-2022, 2022.
Shi, J. P., Khan, A. A., and Harrison, R. M.: Measurements of ultrafine particle concentration and size distribution in the urban atmosphere, Sci. Total Environ., 235, 51–64, https://doi.org/10.1016/S0048-9697(99)00189-8, 1999.
Sihto, S.-L., Mikkilä, J., Vanhanen, J., Ehn, M., Liao, L., Lehtipalo, K., Aalto, P. P., Duplissy, J., Petäjä, T., Kerminen, V.-M., Boy, M., and Kulmala, M.: Seasonal variation of CCN concentrations and aerosol activation properties in boreal forest, Atmos. Chem. Phys., 11, 13269–13285, https://doi.org/10.5194/acp-11-13269-2011, 2011.
Skrabalova, L., Zikova, N., and Zdimal, V.: Shrinkage of newly formed particles in an urban environment, Aerosol Air Qual. Res., 15, 1313–1324, https://doi.org/10.4209/aaqr.2015.01.0015, 2015.
Stein, A. F., Draxler, R. R., Rolph, G. D., Stunder, B. J. B., Cohen, M. D., and Ngan, F.: NOAA's HYSPLIT atmospheric transport and dispersion modeling system, B. Am. Meteorol. Soc., 96, 2059–2077, https://doi.org/10.1175/BAMS-D-14-00110.1, 2015.
Tørseth, K., Aas, W., Breivik, K., Fjæraa, A. M., Fiebig, M., Hjellbrekke, A. G., Lund Myhre, C., Solberg, S., and Yttri, K. E.: Introduction to the European Monitoring and Evaluation Programme (EMEP) and observed atmospheric composition change during 1972–2009, Atmos. Chem. Phys., 12, 5447–5481, https://doi.org/10.5194/acp-12-5447-2012, 2012.
Tröstl, J., Chuang, W. K., Gordon, H., Heinritzi, M., Yan, C., Molteni, U., Ahlm, L., Frege, C., Bianchi, F., Wagner, R., Simon, M., Lehtipalo, K., Williamson, C. J., Craven, J. S., Duplissy, J., Adamov, A., Almeida, J., Bernhammer, A. K., Breitenlechner, M., Brilke, S., Dias, A., Ehrhart, S., Flagan, R. C., Franchin, A., Fuchs, C., Guida, R., Gysel, M., Hansel, A., Hoyle, C. R., Jokinen, T., Junninen, H., Kangasluoma, J., Keskinen, H., Kim, J., Krapf, M., Kürten, A., Laaksonen, A., Lawler, M. J., Leiminger, M., Mathot, S., Möhler, O., Nieminen, T., Onnela, A., Petäjä, T., Piel, F. M., Miettinen, P., Rissanen, M. P., Rondo, L., Sarnela, N., Schobesberger, S., Sengupta, K., Sipilä, M., Smith, J. N., Steiner, G., Tomè, A., Virtanen, A., Wagner, A. C., Weingartner, E., Wimmer, D., Winkler, P. M., Ye, P., Carslaw, K. S., Curtius, J., Dommen, J., Kirkby, J., Kulmala, M., Riipinen, I., Worsnop, D. R., Donahue, N. M., and Baltensperger, U.: The role of low-volatility organic compounds in initial particle growth in the atmosphere, Nature, 533, 527–531, https://doi.org/10.1038/nature18271, 2016.
Tunved, P., Ström, J., and Hansson, H.-C.: An investigation of processes controlling the evolution of the boundary layer aerosol size distribution properties at the Swedish background station Aspvreten, Atmos. Chem. Phys., 4, 2581–2592, https://doi.org/10.5194/acp-4-2581-2004, 2004.
Tuovinen, S., Lampilahti, J., Kerminen, V.-M., and Kulmala, M.: Intermediate ions as indicator for local new particle formation, Aerosol Research, 2, 93–105, https://doi.org/10.5194/ar-2-93-2024, 2024.
Twomey, S.: The influence of pollution on the shortwave albedo of clouds, J. Atmos. Sci., 34, 1149–1152, 1977.
Vanhanen, J., Mikkilä, J., Lehtipalo, K., Sipilä, M., Manninen, H. E., Siivola, E., Petäjä, T., and Kulmala, M.: Particle Size Magnifier for nano-CN detection, Aerosol Sci. Tech., 45, 533–542, https://doi.org/10.1080/02786826.2010.547889, 2011.
Vlasenko, A., Macdonald, A. M., Sjostedt, S. J., and Abbatt, J. P. D.: Formaldehyde measurements by Proton transfer reaction – Mass Spectrometry (PTR-MS): correction for humidity effects, Atmos. Meas. Tech., 3, 1055–1062, https://doi.org/10.5194/amt-3-1055-2010, 2010.
Vrekoussis, M., Pikridas, M., Rousogenous, C., Christodoulou, A., Desservettaz, M., Sciare, J., Richter, A., Bougoudis, I., Savvides, C., and Papadopoulos, C.: Local and regional air pollution characteristics in Cyprus: a long-term trace gases observations analysis, Sci. Total Environ., 845, 157315, https://doi.org/10.1016/j.scitotenv.2022.157315, 2022.
Williamson, C. J., Kupc, A., Axisa, D., Bilsback, K. R., Bui, T., Campuzano-Jost, P., Dollner, M., Froyd, K. D., Hodshire, A. L., Jimenez, J. L., Kodros, J. K., Luo, G., Murphy, D. M., Nault, B. A., Ray, E. A., Weinzierl, B., Wilson, J. C., Yu, F., Yu, P., Pierce, J. R., and Brock, C. A.: A large source of cloud condensation nuclei from new particle formation in the tropics, Nature, 574, 399–403, https://doi.org/10.1038/s41586-019-1638-9, 2019.
Yáñez-Serrano, A. M., Nölscher, A. C., Bourtsoukidis, E., Derstroff, B., Zannoni, N., Gros, V., Lanza, M., Brito, J., Noe, S. M., House, E., Hewitt, C. N., Langford, B., Nemitz, E., Behrendt, T., Williams, J., Artaxo, P., Andreae, M. O., and Kesselmeier, J.: Atmospheric mixing ratios of methyl ethyl ketone (2-butanone) in tropical, boreal, temperate and marine environments, Atmos. Chem. Phys., 16, 10965–10984, https://doi.org/10.5194/acp-16-10965-2016, 2016.
Yao, X., Choi, M. Y., Lau, N. T., Lau, A. P. S., Chan, C. K., and Fang, M.: Growth and shrinkage of new particles in the atmosphere in Hong Kong, Aerosol Sci. Tech., 44, 639–650, https://doi.org/10.1080/02786826.2010.482576, 2010.
Young, L.-H., Lee, S.-H., Kanawade, V. P., Hsiao, T.-C., Lee, Y. L., Hwang, B.-F., Liou, Y.-J., Hsu, H.-T., and Tsai, P.-J.: New particle growth and shrinkage observed in subtropical environments, Atmos. Chem. Phys., 13, 547–564, https://doi.org/10.5194/acp-13-547-2013, 2013.
Yu, F. and Luo, G.: Simulation of particle size distribution with a global aerosol model: contribution of nucleation to aerosol and CCN number concentrations, Atmos. Chem. Phys., 9, 7691–7710, https://doi.org/10.5194/acp-9-7691-2009, 2009.
Yue, D., Zhong, L., Zhang, T., Shen, J., Yuan, L., Ye, S., Zhou, Y., and Zeng, L.: Particle growth and variation of cloud condensation nucleus activity on polluted days with new particle formation: a case study for regional air pollution in the PRD region, China, Aerosol Air Qual. Res., 16, 323–335, https://doi.org/10.4209/aaqr.2015.06.0381, 2016.
Zhang, J., Chen, Z., Lu, Y., Gui, H., Liu, J., Wang, J., Yu, T., and Cheng, Y.: Observations of new particle formation, subsequent growth and shrinkage during summertime in Beijing, Aerosol Air Qual. Res., 16, 1591–1602, https://doi.org/10.4209/aaqr.2015.07.0480, 2016.
Zhang, K. M. and Wexler, A. S.: Evolution of particle number distribution near roadways – Part I: analysis of aerosol dynamics and its implications for engine emission measurement, Atmos. Environ., 38, 6643–6653, https://doi.org/10.1016/j.atmosenv.2004.06.043, 2004.
Zhang, R., Suh, I., Zhao, J., Zhang, D., Fortner, E. C., Tie, X., Molina, L. T., and Molina, M. J.: Atmospheric new particle formation enhanced by organic acids, Science, 304, 1487–1490, https://doi.org/10.1126/science.1095139, 2004.
Zhao, B., Donahue, N. M., Zhang, K., Mao, L., Shrivastava, M., Ma, P.-L., Shen, J., Wang, S., Sun, J., Gordon, H., Tang, S., Fast, J., Wang, M., Gao, Y., Yan, C., Singh, B., Li, Z., Huang, L., Lou, S., Lin, G., Wang, H., Jiang, J., Ding, A., Nie, W., Qi, X., Chi, X., and Wang, L.: Global variability in atmospheric new particle formation mechanisms, Nature, 631, 98–105, https://doi.org/10.1038/s41586-024-07547-1, 2024.
Zhu, Y., Sabaliauskas, K., Liu, X., Meng, H., Gao, H., Jeong, C.-H., Evans, G. J., and Yao, X.: Comparative analysis of new particle formation events in less and severely polluted urban atmosphere, Atmos. Environ., 98, 655–664, https://doi.org/10.1016/j.atmosenv.2014.09.043, 2014.