the Creative Commons Attribution 4.0 License.
the Creative Commons Attribution 4.0 License.
 | 22 Jun 2026
Wintertime photochemistry of acyl peroxynitrates and ozone in South Korea during the ASIA-AQ campaign
Young Ro Lee
Linda Arterburn
Masayuki Takeuchi
David J. Tanner
James M. Roberts
Behrooz Roozitalab
Daun Jeong
Alan J. Hills
Rebecca S. Hornbrook
Eric C. Apel
Simone Meinardi
Barbara Barletta
Nicola J. Blake
Donald R. Blake
Saewung Kim
Wojciech Wojnowski
Felix Piel
Armin Wisthaler
Katherine Ball
John D. Crounse
Paul O. Wennberg
Jason Miech
Yonghoon Choi
Joshua P. DiGangi
Glenn S. Diskin
Abby Sebol
Erin R. Delaria
Reem A. Hannun
Jason M. St. Clair
Glenn M. Wolfe
Changmin Cho
Courtney Owen
Kirk Lesko
Alessandro Franchin
Edward L. Winstead
Luke D. Ziemba
Richard Moore
Elizabeth B. Wiggins
Guy Symonds
Dongwook Kim
Douglas A. Day
Pedro Campuzano-Jost
Jose L. Jimenez
Kirk Ullmann
Samuel R. Hall
James H. Crawford
Wintertime photochemical air pollution in East Asia remains poorly constrained despite its impact on regional air quality. Sources and formation pathways of acyl peroxynitrates (PANs) and ozone (O3), key photochemical products, are not well understood, hindering effective mitigation strategies. We investigate PANs and O3 over South Korea using observations from the ASIA-AQ campaign (February–March 2024). PANs reached 5.5 ppbv, strongly correlating with formaldehyde and particulate matter, indicating active winter photochemistry. Median PANs were higher in the mid-southern peninsula (MS; 990 pptv) and Yellow Sea (1200 pptv) than the Seoul Metropolitan Area (840 pptv). Elevated homologue-to-acetyl peroxynitrate ratios over the MS, with enhanced acryloyl peroxynitrate, acrolein, and ethylene oxide, provided tracers for petrochemical emissions and their impacts. Acetaldehyde contributed 53 %–80 % of PAN production. Ethanol was a major precursor of acetaldehyde (∼ 50 %). Strong correlations (r2 > 0.8) of ethanol and halocarbons indicate industrial and solvent sources under-represented in inventories. Formaldehyde and C2+ aldehydes contributed ∼ 30 % to ozone production. Low ozone production efficiency (< 10) and radical termination dominated by nitric acid and PANs (> 80 %) indicate VOC-limited conditions. The fractional PANs contribution to NOx loss increased with decreasing OH reactivity ratio of NO2 to aldehydes, suggesting spatial increases in ozone production following NOx reductions. These findings demonstrate that a comprehensive understanding of VOC oxidation, particularly oxygenates from industrial sources, is essential for representing winter photochemistry. PANs measurements provide critical constraints on oxidation processes and their implications for emission control.
- Article
(6392 KB) - Full-text XML
-
Supplement
(1465 KB) - BibTeX
- EndNote


Wintertime photochemical smog remains a persistent air quality challenge in East Asia. Despite reduced solar radiation and temperatures, observations indicate active oxidation of volatile organic compounds (VOCs) and nitrogen oxides (NOx= NO + NO2) by atmospheric radicals, especially the hydroxy radical (OH) (Tan et al., 2018; Lu et al., 2019; An et al., 2019). The photooxidation of VOCs and NOx (hereafter VOC–NOx photochemistry) produces a suite of oxidized VOCs species when sufficient OH levels are sustained by photolysis of nitrous acid (HONO) and ozone (O3). Products include aldehydes (Apel et al., 2010), as well as NOx oxidation products (NOz) such as nitric acid (HNO3), acyl peroxynitrates (PANs; RC(O)OONO2), alkyl nitrates (ANs; RONO2) and particulate nitrate (pNO) (Guo et al., 2014; Tan et al., 2018; Fu et al., 2020; Lee et al., 2021).
Understanding the atmospheric impacts of VOC–NOx photochemistry requires an accurate representation of emissions and oxidation pathways (Bates et al., 2021; von Schneidemesser et al., 2023). A growing body of observations in East Asia points to high VOC levels influenced by complex emissions from combustion (e.g., vehicle exhaust and biomass burning) and non-combustion sources (e.g., volatile chemical products; VCPs), both of which are poorly constrained in inventories (McDonald et al., 2018; Li et al., 2019; Simpson et al., 2020; Travis et al., 2024). Uncertainties in emissions, and consequently in post-emission atmospheric processing, translate to uncertainties in the simulation of photochemical products, including major smog pollutants such as O3 and fine particulate matter (PM2.5). Reducing these uncertainties is therefore critical for predicting the extent of air pollution and formulating mitigation strategies for present environmental issues such as decadal rise in average surface O3 concentrations, increasing winter–spring O3 levels, and severe winter haze events (Cooper et al., 2020; Li et al., 2020, 2021; Zhai et al., 2019).
VOC emission reductions have been proposed to mitigate O3 and particulate pollution (i.e., VOC-limited chemical regime) in winter–spring East Asia, but the complexity in VOC emissions and chemical evolution complicate identification of which VOCs contribute to photochemistry and pollutant formation (Li et al., 2021; Schroeder et al., 2020; Nault et al., 2018).
An experimental approach is to examine observed secondary products of VOC oxidation (e.g., Ryerson et al., 2003). Among these, formed via VOC–NOx photochemistry, PANs are effective tracers of VOC oxidation and often a major component of NOz (Roberts, 2007). Recent field observations across East Asia, including China and South Korea, underscore the diagnostic utility of PANs as tracers of VOC–NOx photochemistry. For example, in China, wintertime acetyl peroxynitrate (PAN), the simplest and most abundant member of PANs, strongly correlates with PM2.5, often more so than with O3, partly due to titration of O3 by elevated NOx (Qiu et al., 2019, 2020; Lu et al., 2019; Xu et al., 2021). Here, PAN serves as a more useful indicator of photochemistry than O3 and provides observational evidence for the contribution of atmospheric chemistry to particulate pollution. Similarly, in the Seoul Metropolitan Area (SMA), home to 50 % of South Korea's population, springtime production of O3 was found to be dominated by local oxidation of small (< C5) anthropogenic alkenes and aromatics (> C7) such as toluene and xylenes from traffic and solvent emissions. Organic aerosol (OA) production was driven by oxidation of aromatics and other VOCs with semi- and intermediate volatility (SVOCs and IVOCs) (Simpson et al., 2020; Schroeder et al., 2020; Nault et al., 2018). The dominant role of secondary formation is further demonstrated by the co-occurrence of OA and O3 with short-lived photochemical tracers including formaldehyde (CH2O) and PAN (Schroeder et al., 2020; Nault et al., 2018).
More recently, an evaluation of Korea-United States Air Quality (KORUS-AQ) observations by Nault et al. (2024) showed that approximately half of the species comprising PANs predicted by near-explicit box model simulations were unmeasured despite their importance in O3 and radical chemistry in the SMA. To reconcile the PANs budget, GEOS-Chem transport model simulations required increased VOC emissions from non-combustion sources, such as VCPs, and revised chemical mechanisms (Bey et al., 2001; Travis et al., 2024). Consistent with this, in New York City (NYC), PAN formation in WRF-Chem simulations was highly sensitive to oxygenated VCPs such as ethanol and isopropanol whose inclusion increased predicted PAN by 15 %–20 % (Grell et al., 2005; Coggon et al., 2021). These studies demonstrated difficulties in constraining both the magnitude and speciation of PANs, and their utility as VOC–NOx photochemical tracers in polluted urban environments with complex VOCs.
A large data set of PANs observations has been accumulated globally, spanning regions from remote hemispheric backgrounds to heavy pollution (Roberts, 2007; Fischer et al., 2014; Lee et al., 2025). However, such observations in East Asia, including South Korea, remain scarce. To address this gap, in situ airborne observations onboard the NASA DC-8 were conducted over South Korea in February and March 2024 as part of the Airborne Satellite Investigation of Asian Air Quality (ASIA-AQ) campaign. A key objective was to assess South Korean air quality in winter and build upon KORUS-AQ findings (Crawford et al., 2021). The ASIA-AQ instrument suite includes measurements of PANs, their oxygenated VOC (OVOC) precursors (e.g., aldehydes, alcohols, and esters), and aromatic oxidation products. To our knowledge, no prior studies have provided such a comprehensive measurement of those compounds. Therefore, the ASIA-AQ observations offer a unique opportunity to characterize wintertime photochemical processing in East Asia.
This work investigates wintertime photochemistry in South Korea, focusing on the chemistry and distribution of PANs. We report measurements of PANs, including rarely observed homologues such as acryloyl peroxynitrate (APAN) and benzoyl peroxynitrate (PBzN). Combining kinetic calculations and 0-D box modeling, highly constrained by observations, we examine key factors controlling PAN and O3 production. For this examination, we focus on diagnosing instantaneous PAN and O3 production using observed precursors across different regions in South Korea. To systematically represent spatial and pollution-dependent variations in photochemistry, we analyze the fractional contribution of NOx loss pathways to either PANs or HNO3 formation as well as ozone production efficiency (OPE) as a function of the probability of OH reacting with NO2 or aldehydes.
2.1 Brief overview of the ASIA-AQ campaign
The ASIA-AQ campaign was conducted over the Philippines, South Korea, Thailand, and Taiwan from 6 February to 27 March 2024. Airborne measurements were primarily obtained from the NASA DC-8 and G-III, complemented by satellite, ground-based, and additional aircraft observations from domestic collaborators (ASIA-AQ, 2023). This work focuses on five DC-8 research flights (RFs) over South Korea and the Yellow Sea from 17 February to 11 March, during cold conditions (median temperature of 4 °C at altitudes below 500 m).
During ASIA-AQ, DC-8 flights departed from Osan Air Base and followed consistent transects at altitudes ranging from ∼ 200 m to 2.5 km. The near-constant flight paths were performed to obtain consistent and representative sampling of the South Korean atmosphere. Each RF included 4–6 low approaches at Seoul and Gimpo Airports to capture vertical distributions over urban areas, totaling 27 low approaches over the SMA during the campaign. To assess regional air pollution, the DC-8 flights included sampling over relatively remote regions such as the Yellow Sea and the mid- and southern regions of the peninsula. Measurement locations and conditions during the campaign are shown in Fig. S1 in the Supplement.
2.2 TD-CIMS measurements
A comprehensive suite of chemical, optical, and meteorological measurements was obtained aboard the DC-8 aircraft during the ASIA-AQ campaign. Table S1 summarizes the measurements used in this study, including instrumental techniques, uncertainties, and references. Of the measured compounds, this study focuses primarily on PANs measured by the Georgia Tech Thermal Dissociation-Chemical Ionization Mass Spectrometer (GT TD-CIMS) with a Time-of-Flight (ToF) mass analyzer (TofWerk/Aerodyne). Building on established methods (Slusher et al., 2004; Zheng et al., 2011; Lee et al., 2020), this deployment incorporated several key modifications, as shown in Fig. S2. A major improvement was the replacement of the quadrupole mass filter with a ToF analyzer (resolving power ∼ 5000 m Δ m), which enhanced mass resolution and thereby improved the selective measurement of PAN homologues. As in our prior DC-8 deployments, quantification of PANs was further supported by the continuous addition of isotopically labeled PAN (C13H3C13(O)OONO2) for calibrations and periodic NO addition to react away peroxyacyl radicals in the thermal dissociation (TD) region for background determination. In addition, post-campaign laboratory experiments were carried out to constrain sensitivities of PAN homologues relative to that of PAN, following the method described in Roberts et al. (2022).
An additional modification to the GT TD-CIMS was the use of an automated variable orifice upstream of the heated Teflon inlet (i.e., TD region), replacing the in-line pressure controller used in the KORUS-AQ and Atmospheric Tomography (ATom) campaigns (Fig. S2). The variable orifice, previously applied to regulate flow tube pressure across altitude ranges (Chen et al., 2016), maintained constant pressure in both the TD and Ion Molecule Reaction (IMR) regions during ASIA-AQ. This also reduced interactions with metal surfaces compared to the previous inlet system (Lee et al., 2020). While wall losses for most PANs are minimal, this configuration is expected to improve the measurements of PBzN for which potential loss on Teflon inlet wall has been reported (Zheng et al., 2011; Liu et al., 2019). It should be noted that such potential effects were further resolved by applying homologue-specific sensitivities during data analysis.
Finally, the CIMS instrument utilized a vacuum ultraviolet (VUV) lamp (Heraeus, PKS 106) as an ion source (Ji et al., 2020), eliminating the safety and regulatory constraints associated with polonium-210 sources (1.5–20 mCi) used in previous flight instruments (e.g., Lee et al., 2020, 2022). For a campaign such as ASIA-AQ, with the extended duration and multiple deployment sites, the VUV lamp reduces logistical demand in contrast to radioactive sources that require regulatory oversight (Lee et al., 2020).
2.3 VOCs measurements and data analysis
This study includes kinetic calculations and 0-D box modeling, both highly constrained by observations, including an extensive suite of hydrocarbons and OVOC measurements, on the NASA DC-8. During ASIA-AQ, VOCs were measured by the NSF NCAR Trace Organic Gas Analyzer with a time-of-flight mass spectrometer (TOGA-TOF), the University of California, Irvine Whole Air Sampler (WAS), and the University of Oslo FUSION proton transfer-reaction time-of-flight mass spectrometer (PTR-ToF-MS; Reinecke et al., 2023). Among these, the TOGA-TOF, which utilizes fast in situ gas chromatography coupled with a high-resolution time-of-flight electron impact mass spectrometer served as the primary dataset (Apel et al., 2010; Hornbrook et al., 2016). Analyses incorporating VOC observations utilized data merged to the TOGA sampling interval (35 s of integrated sampling every 2 min). For analyses using only PANs data (Sect. 3.1), measurements were merged to a 1 s time base. All DC-8 measurement data are publicly available through the NASA data archive (https://doi.org/10.5067/SUBORBITAL/ASIA-AQ/DATA001).
To assess regional variability in atmospheric composition and photochemistry, the time-averaged data were categorized into three regions based on geographic boundaries: Seoul Metropolitan Area (SMA), Mid and South (MS), and Yellow Sea (YS) (Fig. S3a). In addition, we incorporated 1 km × 1 km gridded data from the Statistical Geographic Information Service (SGIS) of the Korean government (https://sgis.kostat.go.kr, last access: 4 May 2026) to complement chemical observations with spatially resolved information relevant to anthropogenic activities. The statistical data includes industrial facilities, classified by sector (Fig. S3b–c), as well as population density. For this analysis, industrial sectors included manufacturing, power generation, and utilities/management. The population and industrial facility densities were averaged within a 5 km radius of each DC-8 measurement point, denoted as PD5 km and ID5 km, respectively, and used to support qualitative interpretation of pollutant distribution using chemical tracer measurements.
2.3.1 Kinetic calculations of instantaneous rates and reactivity
A series of kinetic calculations were conducted to estimate instantaneous production rates of O3 and reactive nitrogen (NOy), including nitric acid (HNO3) and PANs, based on observed concentrations, photolysis frequencies, and established kinetic parameters. These estimates were integrated with observations and box model simulations to investigate O3 and NOz formation during the campaign.
As daytime oxidation of atmospheric species is primarily initiated by reaction with OH, instantaneous production rates, considered here, depend on OH reactivity. In this work, the OH reactivity of an individual compound Xi (RXi) is defined as the product of its observed concentrations and its corresponding OH rate coefficients (kOH). The summed OH reactivity (RX) is then obtained by adding the individual contributions (Eq. 1).
The instantaneous production rate of ozone (P(O3)) can be approximated by the rate at which peroxy radicals (HO2 and RO2) react with NO (Eq. 2) and was used to calculate modeled P(O3). Given the absence of peroxy radical measurements during ASIA-AQ, we estimate P(O3) using Eq. (3), following Rosen et al. (2004) and Perring et al. (2013), which represent ozone production as a function of RVOCi, OH concentration, speciated radical yields (γi) and alkyl nitrate branching ratios (αi), as summarized in Table S2. A constant OH concentration of 2 × 10⁶ molec. cm−3 was used for the base case to generalize the analysis and enable application across a broader observational dataset than model simulations that require fully synchronized inputs. Modeled OH concentrations were used when comparing kinetic calculations to model simulations.
Similarly, production rates of HNO3 (P(HNO3)) and PANs (P(PANs)) are estimated using Eqs. (4)–(5), respectively. In Eq. (5), βPAN represents the fraction of acyl peroxy radicals (PAs) reacting with NO2 relative to the total loss pathways, and αHydrogen Abstraction is the branching ratio for hydrogen abstraction of the corresponding aldehydes. The OH reactivity from aldehyde precursors of PANs (RALD) is calculated using observed mixing ratios of acetaldehyde, propanal, butanals, acrolein and benzaldehyde. The photolytic loss of OVOC, ji[OVOCi], is the product of measured photolysis frequencies and OVOCs concentrations (acetone, methyl ethyl ketone, and biacetyl), weighted by the photolytic yield of acetyl peroxy (PA) radical (γi, PA), generally unity except for biacetyl, which yields two PA radicals. Based on the rate estimates, ozone production efficiency (OPE) is approximated as the ratio of P(O3) to the sum of HNO3 and PANs production rates (Eq. 6).
2.3.2 Steady state 0-D box modeling
We used a zero-dimensional box model (F0AM; The Framework for 0-D Atmospheric Modeling; Wolfe et al., 2016) to simulate production rates of O3 and NOz. The model was constrained using synchronous measurements of trace gases and meteorological parameters that were averaged to the TOGA sampling interval (TOGA-merge). A complete list of observational constraints is provided in Table S3. To interpret airborne measurements under rapidly changing spatial and temporal conditions, we used the flight steady-state method (Crawford et al., 1999). This approach is widely used in airborne studies and is particularly suited for estimating concentrations of short-lived species (e.g., radicals) and diagnosing instantaneous photochemistry (Olson et al., 2006; Schroeder et al., 2020). In this work, each model step is treated as an independent steady-state run incorporating the near-explicit chemical mechanism (the Master Chemical Mechanism (MCM) v3.3.1; Jenkin et al., 2015) to iterate through full diurnal cycles until unconstrained species (e.g., radicals) converged within 1 % (e.g., Nault et al., 2024). A similar approach has been previously applied to investigate radical chemistry, ozone production and reactive nitrogen processing for KORUS-AQ (Brune et al., 2022; Schroeder et al., 2020; Nault et al., 2024). To account for differences between observed and modeled j values, we apply a scaling factor to all j values based on the averaged ratio of measured to MCM-parameterized and . In addition, a first-order loss is applied to all species, equivalent to a 12 h lifetime, following Brune et al. (2022) and Nault et al. (2024). However, due to the short atmospheric lifetime of the species considered here and the use of highly constrained input for instantaneous rate calculations, this loss term has a minimal influence (< ∼ 5 % variability for a factor of two change in loss rate) on the results in this study (Fig. S4).
High PANs levels were observed across the Korean Peninsula (mean ± 1σ; 1.06 ± 0.64 ppbv) and the YS (1.43 ± 0.95 ppbv) during ASIA-AQ, with the maximum value (5.5 ppbv) measured in Gyeonggi Province within the SMA. These elevated PANs levels were accompanied by high levels of CH2O, odd oxygen (Ox; approximated as O3+NO2), OA and aerosol concentrations (number, volume, and surface area) with generally r2 > 0.5 across the selected regions (Fig. S5), indicating a strong photochemical relevance.
Correlations of PANs with aerosols were particularly strong during ASIA-AQ, exceeding those with Ox, similar to wintertime China (Qiu et al., 2019, 2020; Lu et al., 2019; Xu et al., 2021). During ASIA-AQ aerosol concentrations were measured by multiple instruments targeting different particle size ranges, providing additional constraints on these relationships. As shown in Fig. S5, aerosol concentrations (i.e., number, volume, and surface area) were highly correlated with PANs (r2 up to ∼ 0.9) with the strongest relationships for fine particles (< 1 µm) measured by an Ultra-High Sensitivity Aerosol Spectrometer (UHSAS). These observations suggest that PANs broadly capture the impacts of active VOC–NOx photochemistry on both gaseous and particulate pollution under cold conditions in East Asia, consistent with previous observations of the region (Lu et al., 2019; Xu et al., 2021; Lee et al., 2021).
Significant heterogeneity in both concentration and speciation of PANs demonstrated the influence of complex emission sources and photochemical processing. For example, the observed PANs distribution reflected the regional extent of photochemical pollution, extending well beyond source regions, and impacting downwind areas. Despite spanning more remote areas, median mixing ratios of PANs in the MS (990 pptv) and YS (1200 pptv) were higher than those in the SMA (840 pptv). This contrasts with the much higher population and industrial densities (e.g., ∼ 40 times greater median PD5 km and ID5 km) in the SMA as well as more abundant precursor emissions. Figure 1a shows the spatial distribution, with the DC-8 flight tracks colored by PANs mixing ratios overlaid on a population density map (top panel), and longitudinal PANs quartiles and median PD5 km in 0.02° bins (bottom panel). The longitudinal medians frequently exceeding 1 ppbv, including in remote areas, were particularly notable over the MS and YS. The longitudinal pattern of the MS showed increasing concentrations near the western and eastern boundaries, in close proximity to major industrial facilities including Banweol Industrial Complex (BIC), Daesan petrochemical complex (DPCC) and Gumi Industrial Complex (GIC), suggesting their potential contributions to pollutant distributions in the MS. In addition to South Korean sources, biomass burning plumes from China contributed to marked increases in PANs over the YS, as evidenced by concurrent enhancements of hydrogen cyanide (HCN) and acetonitrile (CH3CN) (Figs. S5 and S6). These observations are consistent with high PAN episodes in Seoul (> 3 ppbv in 2019) (Savic et al., 2024) and at Gosan Climate Observatory (up to 2.4 ppbv), located near the southern YS (Han et al., 2017), attributed to long-range transport of biomass burning emissions from China. Consequently, the observed PANs distribution during ASIA-AQ is impacted by diverse sources including urban, industrial, and biomass burning emissions.
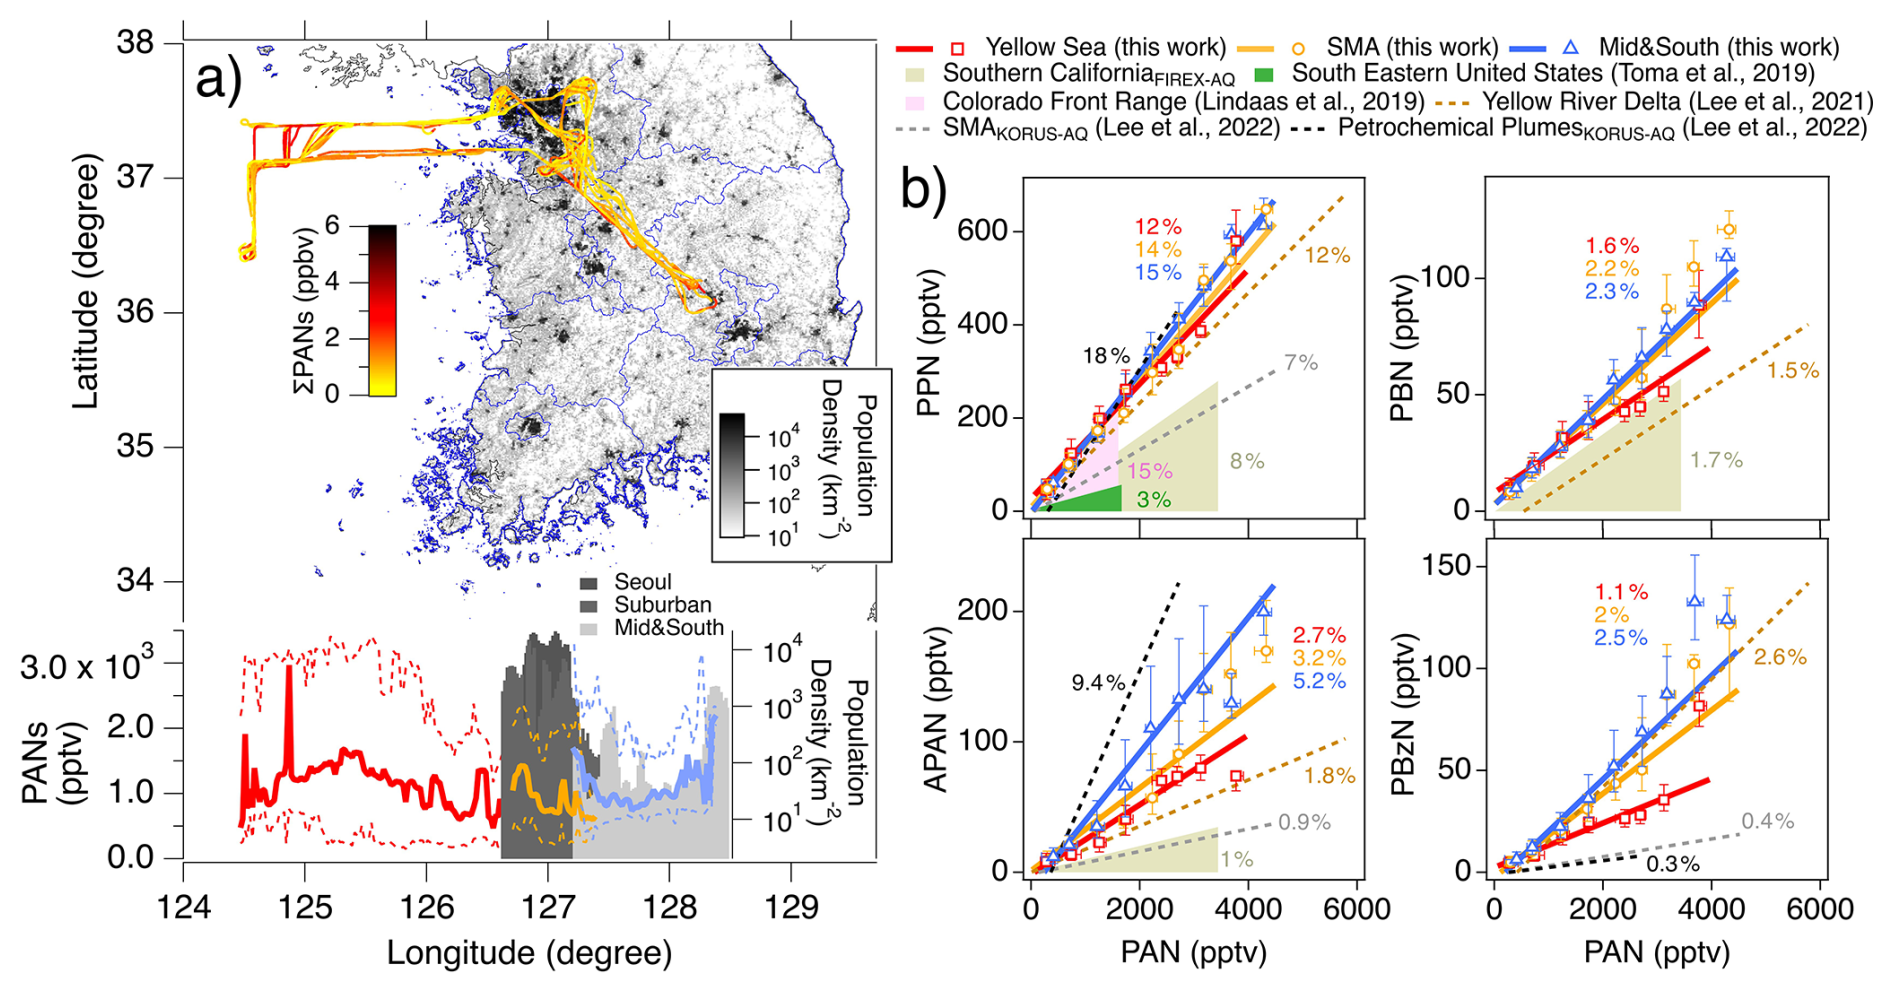
Figure 1(a) (Top) Map of South Korea DC-8 flight tracks colored by PANs mixing ratios, overlaid on a 1 km2 population density map. (Bottom) Longitudinal dependence of median PANs over the Yellow Sea (YS, red), Seoul Metropolitan Area (SMA, orange) and Mid and South (MS, blue) in 0.02° bins. The dashed lines represent longitudinal 25th and 75th percentiles of PANs. The shaded areas indicate median PD5 km of the selected regions in 0.02° bins. (b) Scatter plots of median PAN homologues versus median PAN (i.e., homologue PAN ratios), binned in intervals of 500 pptv PAN, with error bars denoting the 25th and 75th percentiles of the homologues in each bin. The red, orange, and blue solid lines indicate linear regression slopes for the 1 s merged data obtained over the YS, SMA and MS, respectively, during ASIA-AQ. Recent observations from Southern California (beige), the Southeastern United States (green), Colorado Front Range (pink), Yellow River Delta in China (light brown), and SMA (gray) and petrochemical plumes (black) from KORUS-AQ are also shown as dashed lines and shaded sectors.
The speciation of PANs during ASIA-AQ exhibited heterogeneity as well. As shown in Fig. 1b, the relative abundance of PAN and its homologues (i.e., homologue PAN ratios), derived from linear regression slopes, was at the upper end of previous reported values. These ratios exceeded those from recent US observations from biogenic (Toma et al., 2019), industrial (Lindaas et al., 2019) and urban (Southern California during Fire Influence on Regional to Global Environments Experiment – Air Quality, FIREX-AQ 2019) regions, as well as during KORUS-AQ, and were most comparable to our measurements at a polluted remote site in China (Lee et al., 2021). Efficient thermal decomposition favors higher homologue PAN ratios due to the ∼ 15 %–25 % faster thermolysis of PAN than its homologues (Kabir et al., 2014; Gomez et al., 2025). Consequently, the colder ASIA-AQ conditions in South Korea relative to the US studies are unlikely to explain the higher ratios. Although not well constrained by experiments, potential slower OH oxidation of PAN compared to most larger homologues does not account for the observed homologue ratios and likely has a minor impact. However, it certainly contributes to a shorter lifetime of APAN (a few hours with kAPAN+OH ∼ 1 to 2 × 10⁻¹¹ cm3 molec.−1 s−1 and [OH] = 2 × 10⁶ molec. cm−3) which depresses APAN PAN ratios in cold environments (Orlando and Tyndall, 2002). Instead, the elevated ratios point to a significant degree of photochemical pollution driven by photooxidation of complicated VOC mixtures, rarely observed outside East Asia in recent years.
In addition, the variance in data points and the homologue ratios in Fig. 1b also point toward varying source contributions, with greater variability associated with homologues from more specific sources. Propionyl peroxynitrate (PPN) and the sum of iso- and n-butyl peroxynitrate (PBN), formed from a broad range of anthropogenic alkanes and alkenes, showed relatively consistent ratios, whereas APAN and PBzN, formed from more reactive and source-specific alkenes and their product aldehydes (e.g., 1,3-butadiene and acrolein for APAN, and styrene and benzaldehyde for PBzN), showed considerable variability. For example, PBzN/PAN ratios were lower over the YS compared to over the peninsula, consistent with significantly reduced aromatic concentrations (Fig. S6a). In contrast, this pattern is not observed for APAN PAN ratios, despite the short lifetime of APAN due to removal by OH, because biomass burning is also a major source of APAN (Fig. S6b; Roberts et al., 2022).
Among all regions, the MS exhibited the highest homologue PAN ratios, with the most pronounced enhancements for the ratios of APAN and PBzN. A consistent increase in the ratios for APAN and PBzN was observed in the MS with their concentrations reaching hundreds of pptv and the strongest regional correlation (r2 ∼ 0.5) between the two species. Based on our previous field measurements in various environments, such elevated levels and ratios have only been observed in regions with dominant contributions of petrochemical and biomass burning emissions. While PANs observations are widely used to assess VOC–NOx photochemistry over the past decades, their application to APAN and PBzN remain scarce, particularly in East Asia. Given their clear enhancements, limited precursor sources and low background concentrations, APAN and PBzN can provide valuable insights into complex photochemical processes. Therefore, in the following section, we present a case study using these tracers to investigate regional-scale pollution in the MS.
3.1 Investigation of MS pollution using APAN and PBzN
Although significant pollution over the MS was observed during ASIA-AQ, this region is understudied. For this purpose, we utilize APAN as a primary tracer, complemented by PBzN as an additional proxy for anthropogenic aromatic sources. APAN is particularly useful due to its short atmospheric lifetime and substantial enhancements over low background levels observed in this region. Figure 2 presents spatial distributions of APAN and APAN PAN ratios, along with wind rose plots in 0.5° longitudinal bins and back trajectories (HYSPLIT; Stein et al., 2015) initiated at the 10 largest APAN PAN values. Elevated APAN concentrations and APAN PAN ratios up to 343 pptv and 0.2, respectively, were consistently associated with west and northwesterly winds (270°–315°), indicating transport from west coast industrial sources. Although median APAN levels were low (24 pptv), upper-end values were elevated and spatially extensive. Longitudinal profiles in Fig. 3a show APAN increasing near the eastern and western boundaries, consistent with the PANs distribution in Fig. 1a. In addition to the major influence of industrial sources from the northwest, the southeastern enhancements may also reflect secondary contribution from sources to the south and east, including the Gumi Industrial Complex, associated with variable winds.
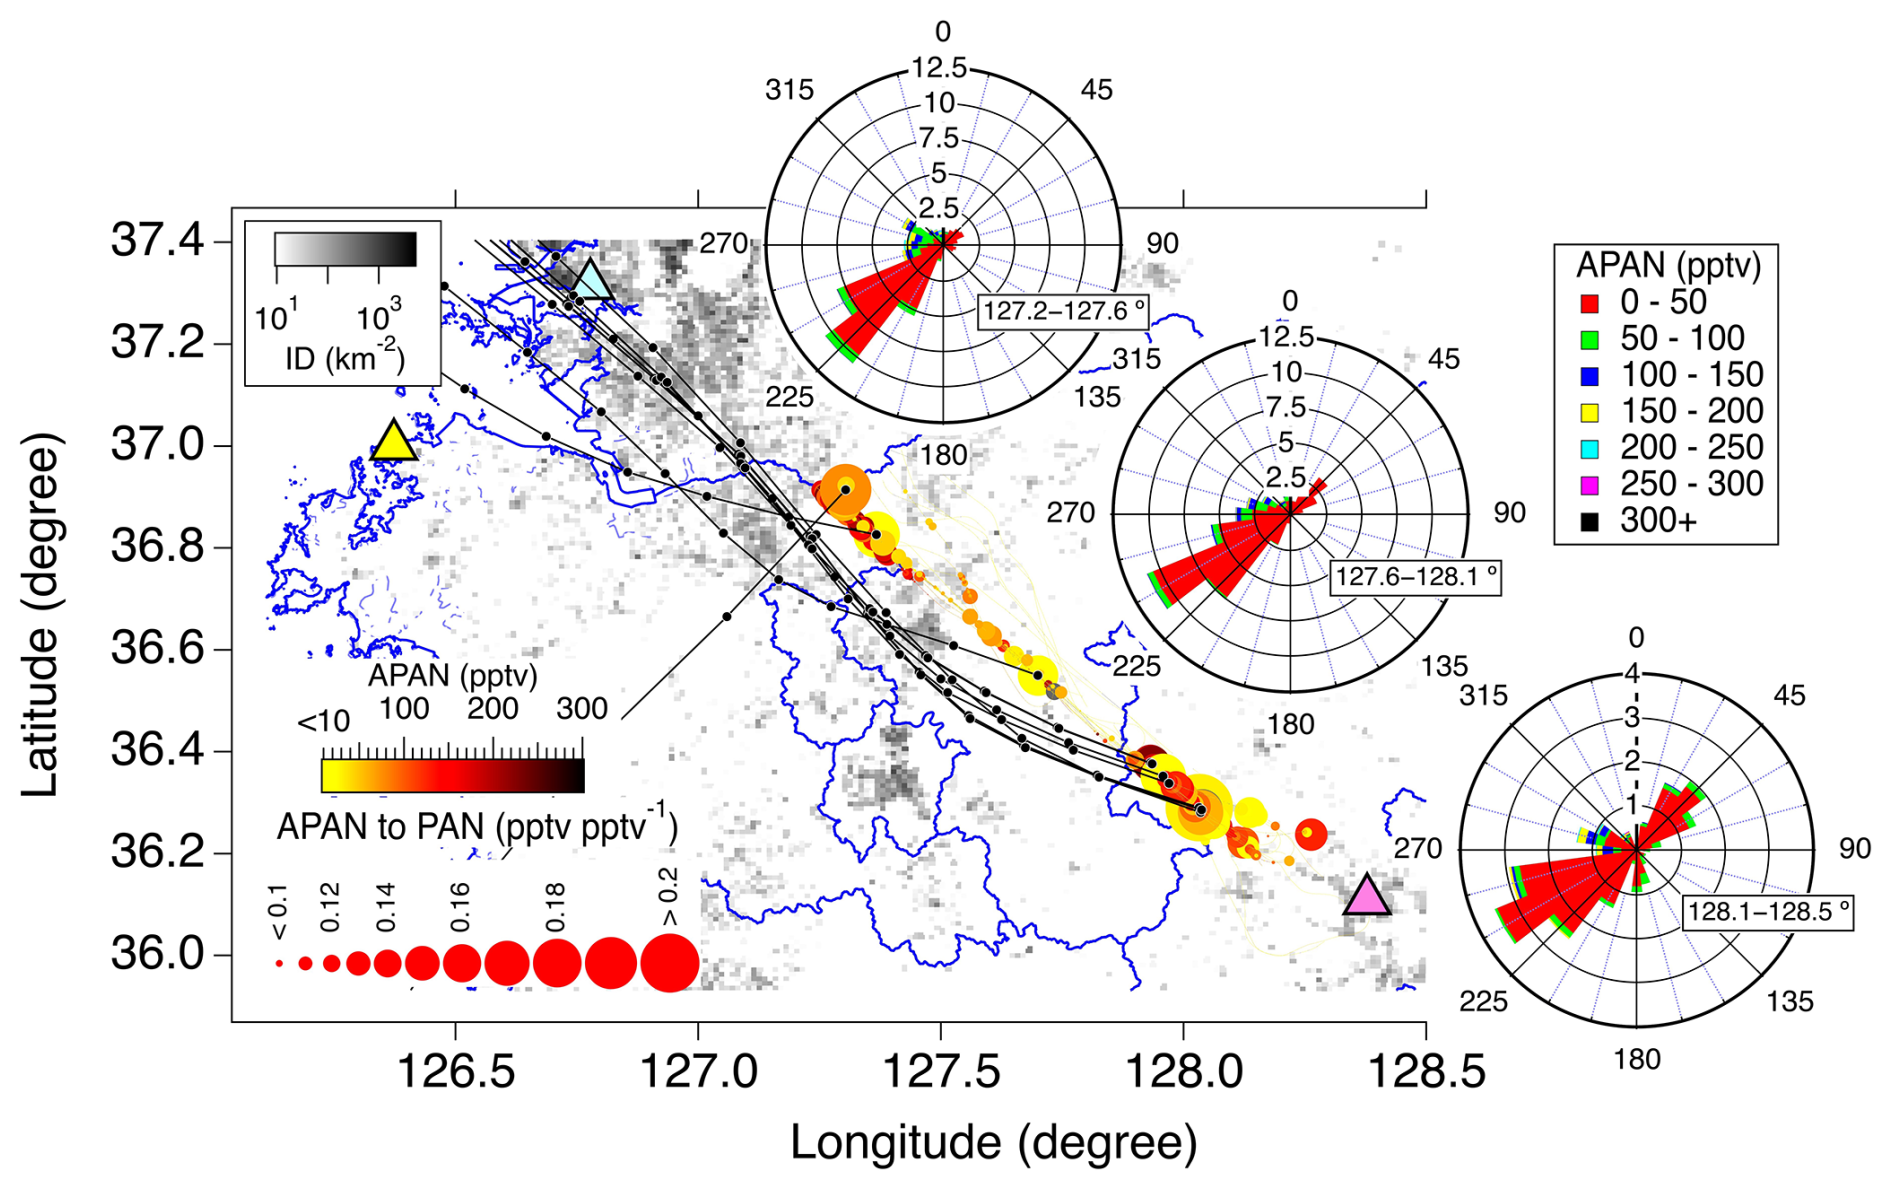
Figure 2APAN and APAN PAN ratios over the MS illustrated as marker color and size, respectively, overlaid on a 1 km2 industrial facility density map, with wind rose plots for three 0.5° longitudinal bins colored by APAN mixing ratios. The black lines with solid circles indicate back trajectories initiated at the 10 largest APAN PAN values. The cyan, yellow, and magenta triangles indicate the locations of Banweol Industrial, Daesan Petrochemical, and Gumi Industrial Complexes, respectively.
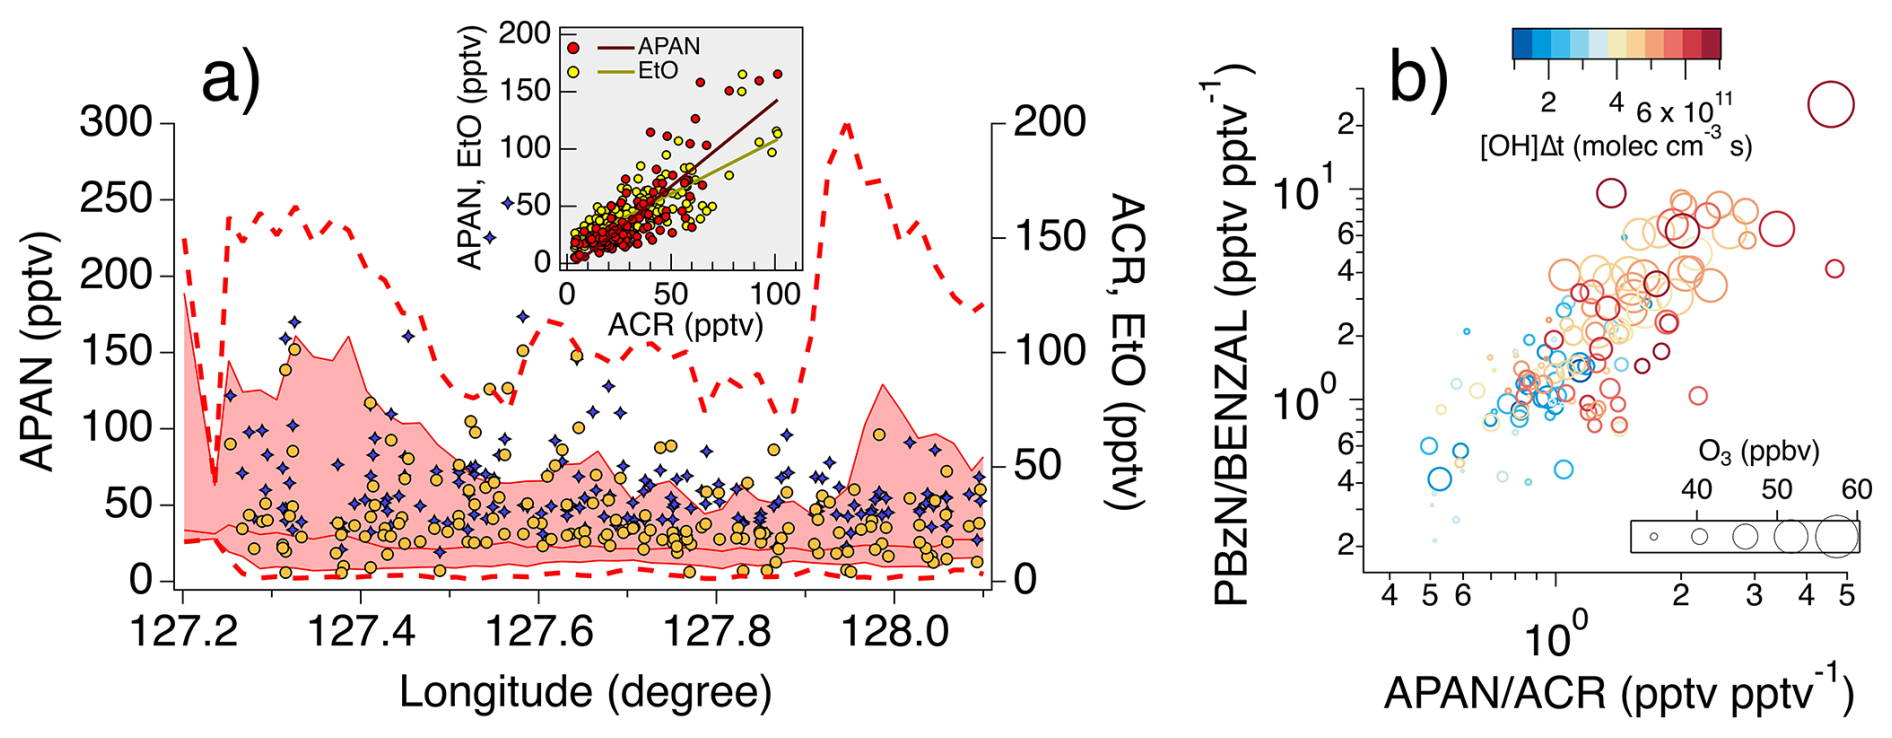
Figure 3(a) APAN, acrolein (ACR) and EtO (ethylene oxide) as a function of longitude over the MS. The solid red line and shaded area indicate longitudinal 50th, 25th, and 75th percentiles, respectively, of APAN in 0.02° bins, and the dashed red lines are the longitudinal 1st and 99th percentiles. The orange and blue markers represent ACR and EtO mixing ratios. The inset shows correlation of ACR with APAN (red markers with black linear fit line) and with EtO (yellow markers with beige linear fit line). (b) Scatter plots of PBzN benzaldehyde (BENZAL) versus APAN ACR over the MS. The markers are colored and sized by OH exposure, defined as the product of OH concentration and time over the photochemical age of an air amass, and O3 mixing ratios, respectively.
The inset of Fig. 3a shows acrolein (ACR), a primary aldehyde precursor of APAN, correlated most strongly (r2 > 0.6) with APAN and ethylene oxide (EtO) among all ASIA-AQ measurements. It is noted that concurrent airborne measurements of these species were conducted for the first time in East Asia. Given the short lifetimes of APAN and acrolein, the enhancements are indicative of recent emissions from local to regional sources. The source of APAN and acrolein being dominated by biomass burning in the MS is unlikely due to a lack of correlation with HCN and CH3CN (Holzinger et al., 1999). The positive relationship between acrolein and benzene (r2 ∼ 0.6) measured by TOGA in the SMA, but not in the MS, suggests that urban emissions do not explain the observations over the MS. Instead, the results point to industrial sources, particularly petrochemical facilities along the west coast, as the origin of both acrolein and APAN, supported by strong correlations with EtO, a tracer almost exclusively emitted from petrochemical activity (Robinson et al., 2024).
Recently, Robinson et al. (2024) reported EtO levels reaching hundreds of pptv in southeastern Louisiana's petrochemical corridor, exceeding EPA estimates (median difference of 21 pptv) and highlighting both the scarcity of ambient EtO data and potential negative health risks. Further evidence for a similar source attribution in South Korea is provided by back trajectories in Fig. 2, which intersects the BIC, a major industrial complex hosting roughly 13 000 metal manufacturing and 1400 petrochemical facilities, including synthetic rubber production (Chae et al., 2024). Although the back trajectories of the selected points did not directly intersect the DPCC, observations during KORUS-AQ demonstrated that its emissions influence the YS and southern Chungcheong regions adjacent to the MS. For example, our previous work showed efficient production of APAN and acrolein from 1,3-butadiene oxidation in plumes near DPCC and over the YS (Lee et al., 2022). In addition, the highest acrolein level observed during ASIA-AQ over the YS (600 pptv) coincided with the maximum 1,3-butadiene mixing ratio (1447 pptv) and elevated APAN (90 pptv), indicating the continued impact of petrochemical emissions in South Korea and their potential contribution to observations over the MS. Given the rapid formation of acrolein from 1,3-butadiene oxidation, direct source attribution is challenging. However, the strong positive relationship of APAN with EtO supports a dominant contribution from petrochemical emissions and suggest elevated exposure to highly toxic pollutants in the MS.
Previous model simulations by Lee et al. (2022) predict PBzN formation from styrene oxidation in the DPCC plumes. Our PBzN measurements during ASIA-AQ showed consistent enhancements alongside APAN, in agreement with the simulations. Figure 3b shows both APAN acrolein and PBzN benzaldehyde ratios increase generally with OH exposure, which provides an observation-based proxy for the extent of photochemical processing by OH radical, consistent with secondary formation from aldehyde precursors. The OH exposure, derived using Eq. (S1) based on observed isopropyl nitrate to propane ratios (see Sect. S5.1) captured the expected decay in the NOx contribution to NOy (approximated as NOx+ PANs + HNO3+ pNO) and the increase in PANs to aldehyde ratios with increasing OH exposure (Fig. S7). Both APAN acrolein and PBzN benzaldehyde ratios increased with O3 as well, further implicating photochemical oxidation of petrochemical VOCs in O3 production, consistent with markedly significant O3 levels up to 250 ppbv in petrochemical plumes during KORUS-AQ (Fried et al., 2020; Cho et al., 2021; Lee et al., 2022). Together, observations over the MS provide strong observational evidence of regional-scale photochemical pollution influenced by petrochemical emissions, with APAN, PBzN and their precursors as effective tracers of this impact.
4.1 Instantaneous production of PANs
To interpret the observed distributions of PANs, we use a combined analysis based on kinetic calculations and model simulations to estimate instantaneous production rates of PANs and their precursor contributions. For this purpose, we investigate the influence of precursor oxidation on PANs formation by focusing on the relative abundances of speciated PANs, which are less sensitive to atmospheric mixing and dilution than absolute concentrations. These processes are difficult to constrain in model simulations, particularly in regions with complex and uncertain emissions. Figure 4a compares observed fractional contributions with modeled instantaneous production rates (P(PANs)), where P(PANs) denotes the combined production of PANs and corresponding peroxyacyl (PAs) radicals as a chemical family. The agreement between observations and P(PANs) suggests that local photooxidation is consistent with the chemical evolution responsible for the observed PANs distribution. This agreement was strongest over inland regions, where the influence of local emissions and recent photochemistry is expected to be more pronounced.
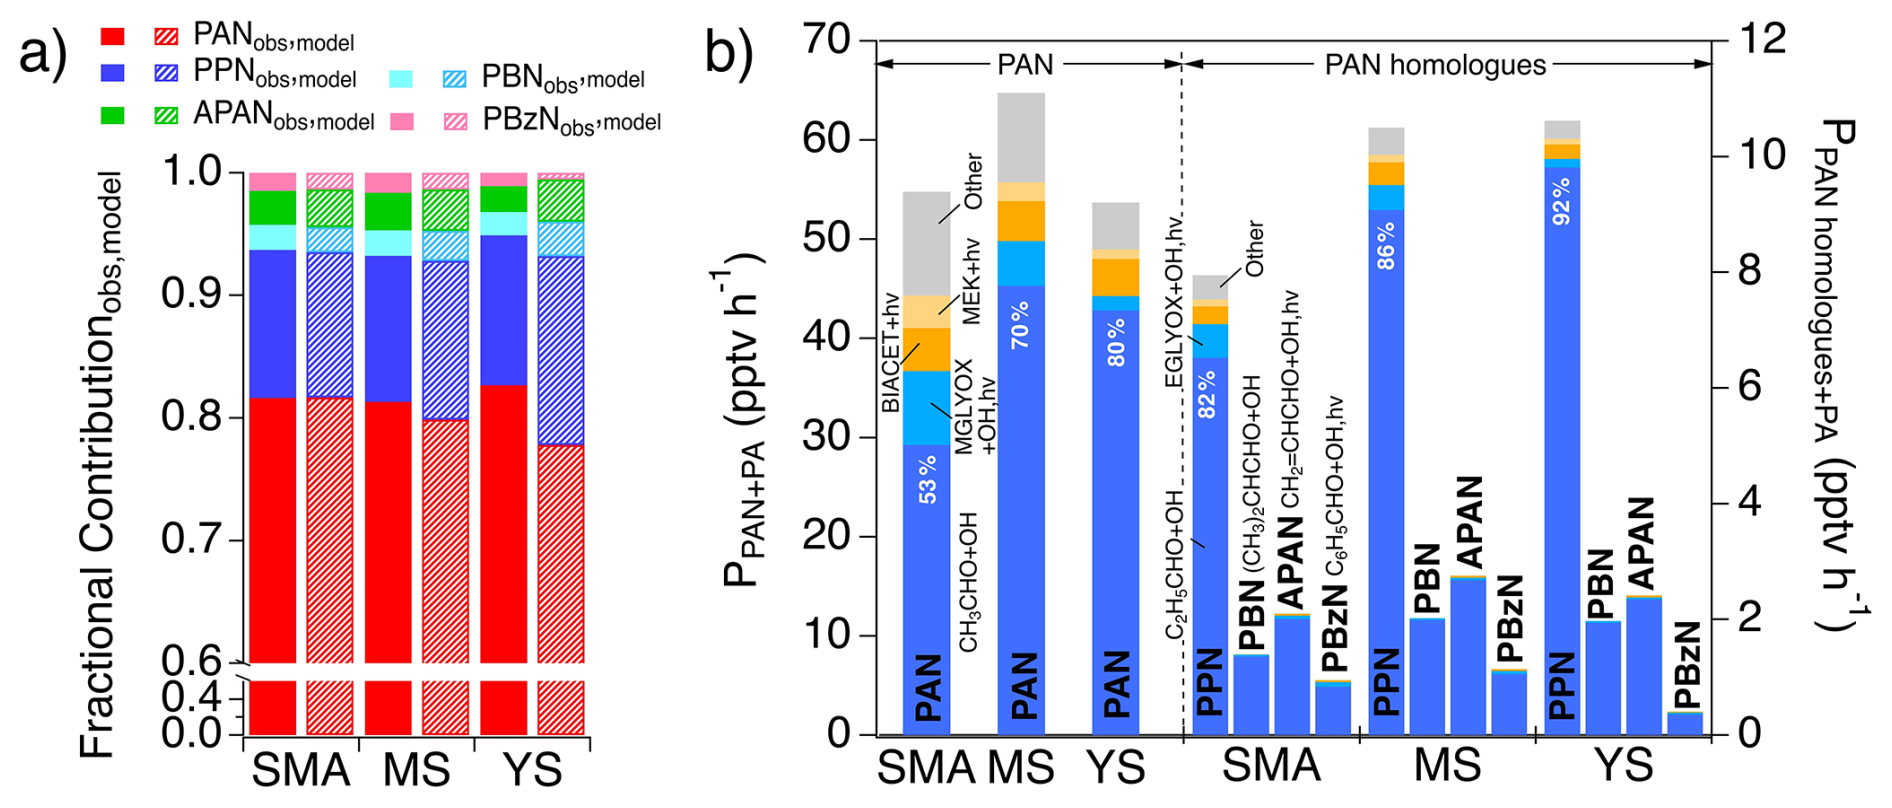
Figure 4(a) Averaged fractional contributions of observed PANs compounds (bright colored bars) and those of modeled instantaneous production rates of PANs, P(PANs), (colored bars with patterns) over the SMA, MS, and YS. The split y-axis is used to improve visibility of the homologue contributions. (b) Averaged P(PANs) over the SMA, MS, and YS along with precursor contributions. The left three bars correspond to P(PAN) and other bars corresponds to P(PAN homologues).
Regional differences in P(PANs) and precursor contributions are illustrated in Fig. 4b. P(PANs) was higher over the MS and YS, consistent with elevated PANs mixing ratios and indicative of abundant precursors and active local formation. In contrast to regions with simpler VOC composition, in which acetaldehyde often dominates PAN production, our analysis illustrates non-acetaldehyde sources including methyl ethyl ketone (MEK), biacetyl (BIACET) and methyl glyoxal (MGLYOX), accounted for up to 47 % of PAN formation on average. While MEK and BIACET were measured, MGLYOX from model simulations was used for P(PANs) calculations. The findings in this work suggest that less common precursors are critical for PAN chemistry over South Korea, which has been hypothesized in previous studies from KORUS-AQ (Nault et al., 2024) and from other polluted environments (Liu et al., 2010).
As the structure of PANs becomes more complex, the range of possible precursors narrows (Roberts, 2007). Consistent with this general tendency, contributions of unconventional precursors on PAN homologue formation was limited. Although PPN had a non-negligible contribution from ethyl glyoxal, analogous with MGLYOX contribution for PAN formation, propanal dominated its production. Larger homologues including APAN, PBN and PBzN were produced almost exclusively from their respective aldehyde precursors. Though present at much lower levels than PAN, the simpler formation pathways of the larger PAN compounds make them useful photochemical tracers for their precursor sources.
Constraining PAN formation from non-acetaldehyde precursors, hereafter P(PAN), has been a focus of research, particularly in environments impacted by isoprene and aromatics (Roberts et al., 2006; Liu et al., 2010; Nault et al., 2024; Travis et al., 2024). Major PAN precursors identified in the previous section such as MEK, BIACET, and MGLYOX can originate from both biogenic and anthropogenic sources (Fischer et al., 2014), complicating source attribution in East Asia, including South Korea, where both sources are prominent (Simpson et al., 2020). With limited isoprene during wintertime ASIA-AQ conditions, PAN formation is expected to be dominated by anthropogenic sources, providing a testbed to assess their impacts on PAN precursors.
Given that MGLYOX is expected to contribute significantly to P(PAN) and is a known product of aromatic oxidation (e.g., Fu et al., 2008; Nishino et al., 2010), we investigate the fractional contribution of PAN precursors as a function of aromatic contribution to OH reactivity (Fig. 5a–c). The modeled P(PAN) exhibited decreasing relative contribution from acetaldehyde with increasing aromatic contribution to OH reactivity. This is most prominent over the SMA, where aromatic contributions are the highest (Fig. 5a). Over the SMA, the acetaldehyde contribution decreased to ∼ 30 %, with substantial contributions from MEK, BIACET, and MGLYOX, consistent with regional mean P(PAN) shown in Fig. 4. The contribution of MEK was also higher in regions with greater aromatic influence, while the impacts of BIACET are relatively constant.
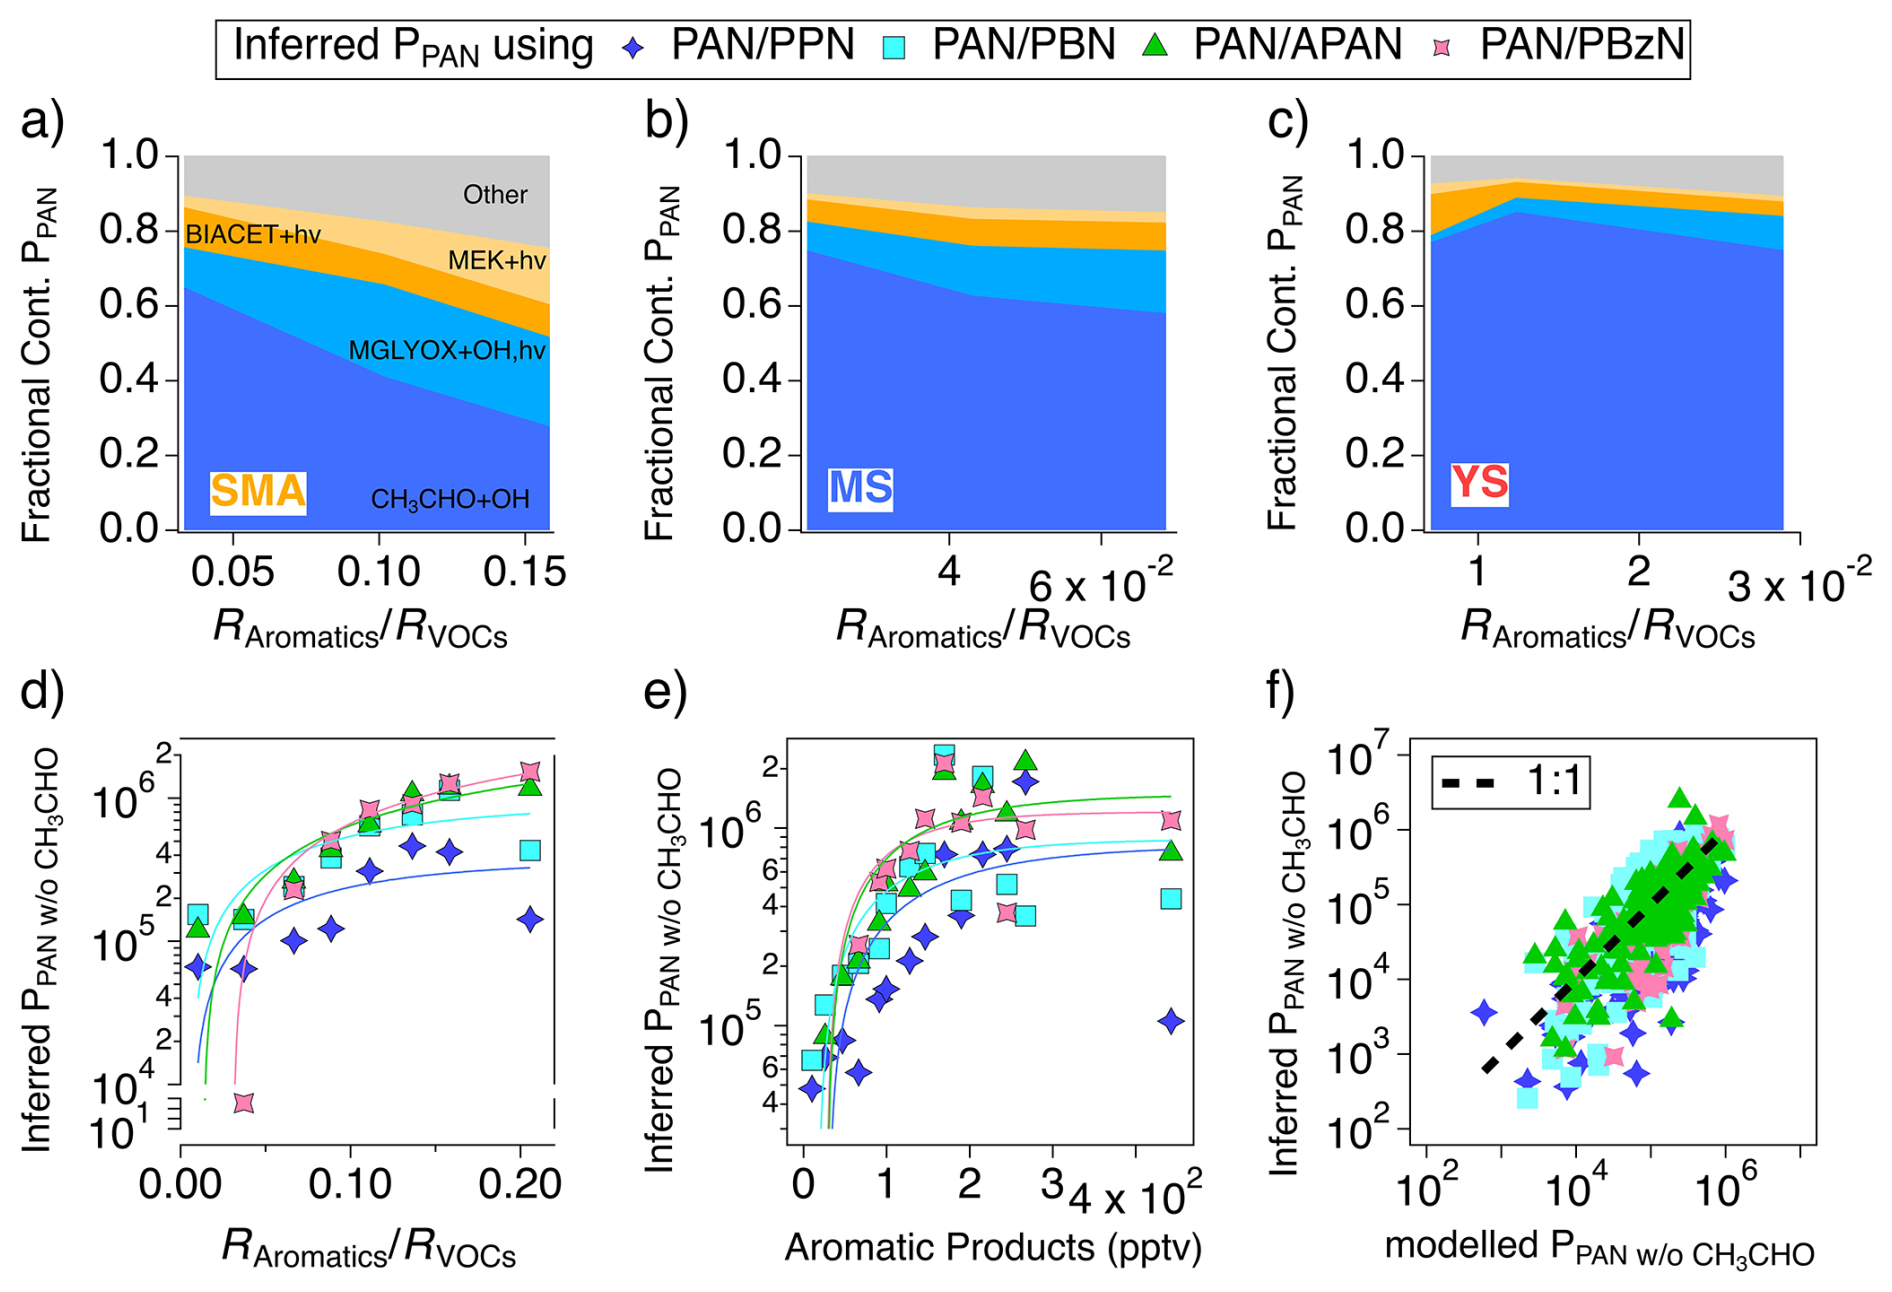
Figure 5(a–c) Modeled fractional contributions from PAN production channels as a function of aromatic contribution to OH reactivity from VOCs, RAromatics RVOCs, over the SMA, MS, and YS. Inferred P(PAN) as a function of (d) RAromatics RVOCs and (e) mixing ratios of aromatic oxidation products. The solid fit lines in (d) and (e) are provided as a visual aid. (f) Inferred P(PAN) based on kinetic calculations compared to modeled P(PAN). The bold dashed line is the 1:1 line. Inferred and modeled P(PAN) are in units of molec. cm−3 s−1.
To complement our model analysis, we use kinetic calculations to infer P(PAN) from non-acetaldehyde sources (inferred P(PAN)), using Eqs. (S2)–(S3) in Sect. S2.2. This analysis provides an additional constraint on P(PAN) to our model analysis because direct experimental quantification remains challenging due in part to significant interferences in even state-of-the-art mass spectrometric and optical techniques for MGLYOX measurements (Koss et al., 2018). Briefly, the method leverages extensive measurements of PANs and their precursors and is based on two assumptions: (1) observed PAN-to-homologue ratios are representative of the ratios of their instantaneous production rates; and (2) PAN homologues are dominantly formed from their corresponding aldehydes. These assumptions were assessed in the previous section using model simulations and found reasonable.
The inferred P(PAN) was illustrated as a function of aromatic contribution to OH reactivity (Fig. 5d) as well as the summed concentrations of observed aromatic oxidation products including benzaldehyde, cresol, phenol, nitrocresol, and nitrophenol (Fig. 5e). The inferred P(PAN) increased with these proxies for aromatic oxidation, consistent with the modeled contribution of MGLYOX in this work and previous model studies in East Asia (Liu et al., 2010; Fischer et al., 2014). Notably, the values based on PAN PPN ratios were generally lower than those from other homologues, consistent with minor contributions to PPN from non-propanal precursors (8 %–18 %) and almost exclusive contribution of the respective aldehydes to larger PAN homologues. When compared to the model-derived P(PAN), the kinetic estimates were in reasonable accord, supporting the validity of the estimations from two different methods (Fig. 5f). Overall, our observation-based diagnostic, combining model simulations and kinetic calculations, provides strong evidence for the contribution of non-acetaldehyde sources to PAN formation in South Korea. This contribution is particularly important in the SMA where aromatics are more abundant.
4.2 Contribution of ethanol and other precursors to secondary acetaldehyde production
Despite the important contributions of non-acetaldehyde sources to PAN production, acetaldehyde remains the most important precursor of PAN on average. In urban environments, acetaldehyde is often dominated by secondary production from oxidation of hydrocarbons from anthropogenic emissions, although acetaldehyde can originate from primary emissions from various anthropogenic and biogenic sources (e.g., Grosjean et al., 2002; Millet et al., 2010; de Gouw et al., 2018). Here, we investigate the source of acetaldehyde as it is of particular importance for PAN as well as O3 formation (e.g., Sect. 3.2.3) in South Korea.
The pie chart in Fig. 6a shows fractional contribution of direct precursors of modeled acetaldehyde production, P(CH3CHO), with a mean value of 51 ± 46 (1σ) pptv h−1 over South Korea. The bar charts illustrate how P(CH3CHO) and its direct precursors change upon removal of the selected major precursors in model simulations for South Korea. The most significant reduction of P(CH3CHO) was found when ethanol was set to zero. Compared to the base case simulation, P(CH3CHO) decreased by nearly a half. This result from a simple diagnostic box modeling is consistent with a 50 % reduction in acetaldehyde without including ethanol in GEOS-Chem transport model simulations for the SMA during KORUS-AQ (Travis et al., 2024). To a lesser extent, oxidation of more common hydrocarbon precursors (e.g., ethane and propene) and carbonyls (e.g., propanal and ethyl acetate) also contributed to P(CH3CHO).
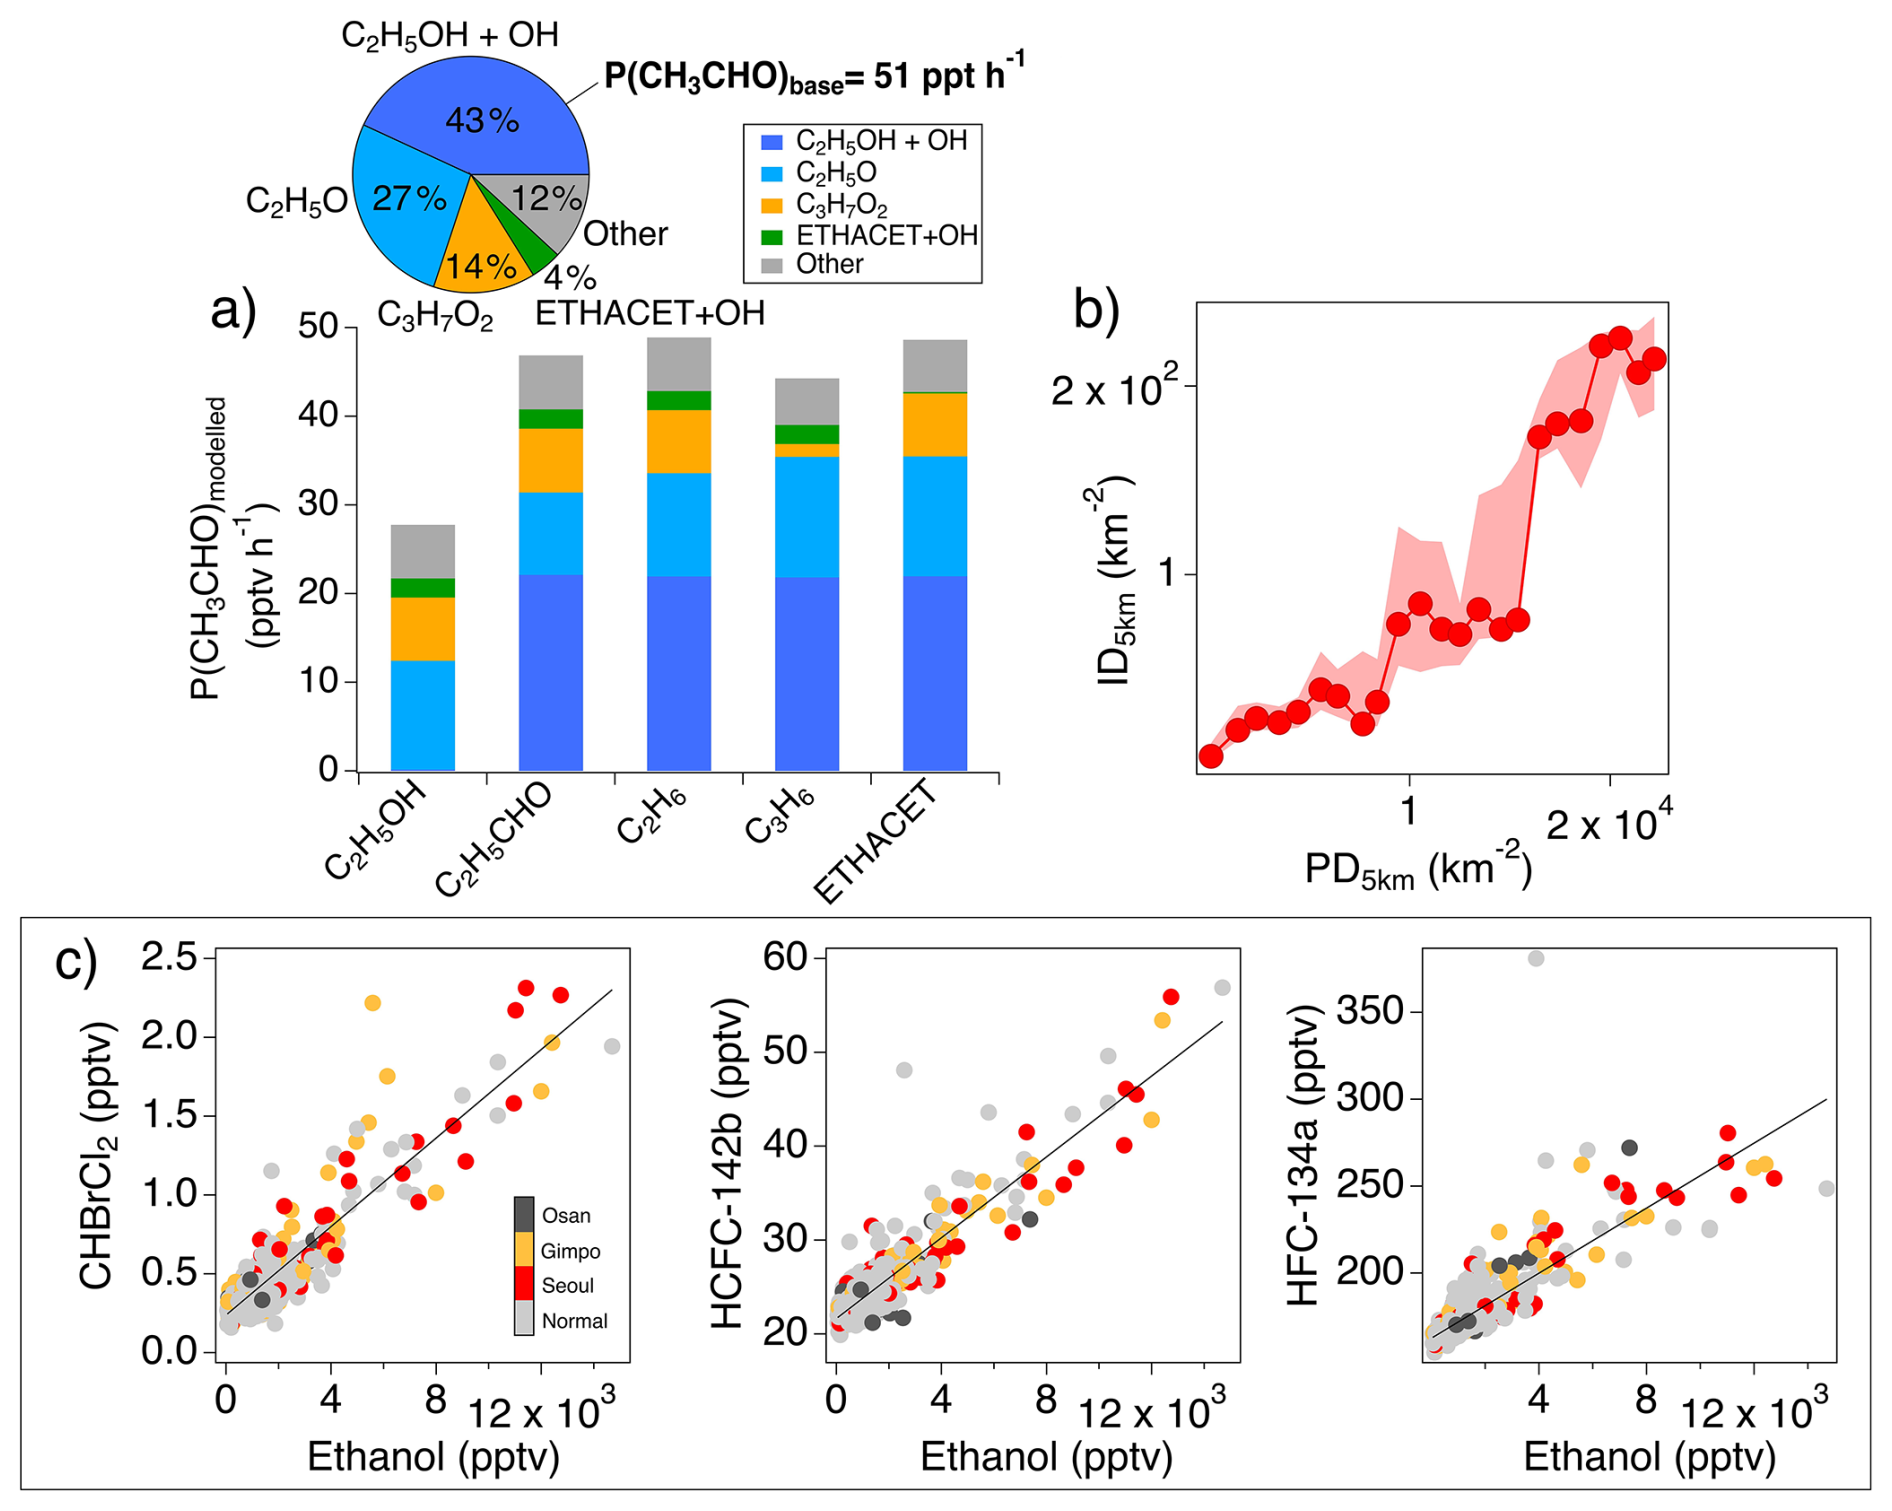
Figure 6(a) Pie chart illustrating the fractional contributions to direct acetaldehyde production, P(CH3CHO), from individual pathways in the base-case model simulation (mean P(CH3CHO) = 51 ppt h−1). C2H5OH + OH represent ethanol oxidation by OH. C2H5O and C3H7O2 denote alkoxy and hydroxy alkoxy radicals, respectively, which decompose to form acetaldehyde. ETHACET + OH indicates OH oxidation of ethyl acetate. Others include minor pathways such as OH oxidation of MEK and PPN, and ozonolysis of propene and butene isomers. The bar charts illustrate changes of P(CH3CHO) in response to removal of the selected major precursors of acetaldehyde in model simulations. (b) Scatter plot showing median industrial facility density (ID5 km) as a function of population density (PD5 km), binned in intervals of 1000, with shaded areas indicating the 25th and 75th percentiles in each bin. (c) Scatter plots of CHBrCl2, HCFC-142b and HFC-134a versus ethanol, with colored and gray markers indicating measurements during low approaches and normal operations, respectively.
The substantial contribution of ethanol to P(CH3CHO), particularly due to its high abundance at low altitudes (median = 2 ppbv, maximum = 13 ppbv at altitudes < 500 m), underscores its importance for PAN and motivate further investigation on its local sources in South Korea. Recent model analyses based on KORUS-AQ data have identified ethanol as a key precursor to acetaldehyde and PAN, consistent with findings in this work, using estimated ethanol levels from ethanol methanol ratios of 0.4 obtained from previous ground-based campaign (the Megacity Air Pollution Studies-Seoul; MAPS-Seoul) (Nault et al., 2024; Travis et al., 2024). The ASIA-AQ observations over South Korea showed a moderately correlated relationship between ethanol and methanol (r2= 0.44) and an ethanol methanol ratio of 0.48, derived from the slope of a linear regression, supporting these estimates. In addition, Travis et al. (2024) demonstrated that increasing ethanol emission factors by a factor of 40 over those in current emission inventory (KORUS-AQ v5) was necessary to reduce model bias in PAN over the SMA from −50 % to −23 %, while the significant increase in ethanol was attributed to VCPs.
Consistent with this source attribution, Beaudry et al. (2025) reported that reproducing ethanol levels during KORUS-AQ and MAPS-Seoul campaigns required per capita VCP emissions in South Korea to be 2.4 times higher than in the US. In contrast to the implementation of population-based emissions of ethanol from VCPs, no significant relationship was found between ethanol and PD5 km, suggesting ethanol is from a source unrelated to local population density or is distributed over large areas. In addition, Fig. 6b illustrates co-location of industrial facilities and populated areas using scatter plot of ID5 km over PD5 km. This spatial overlap of the sources may partially explain improved model performance implementing population-based emissions when ethanol emissions from industrial sources contribute to the observed distribution. This indicated that a comprehensive source attribution including VCP emissions from industrial and consumer products, as well as other possible sources (e.g., fuel combustion), is critical for accurately assessing atmospheric impacts of ethanol. Supporting this interpretation, Fig. 6c shows that ethanol correlated most strongly with halocarbons, including bromodichloromethane (CHBrCl2), HCFC-142b, and HFC-134a with r2 > 0.8. The strong positive relationships were particularly noticeable during low approaches near major urban airports (i.e., Seoul and Gimpo), suggesting surface emissions from industrial (e.g., chemical production, refrigerants and blowing agents) and solvent-related sources (ATSDR, 2005, 2020, and references therein). Beyond air quality implications, investigation of ethanol and halocarbon emissions over South Korea has the potential to improve understanding of the sources and distributions of short-lived (O3) and longer-lived (HCFCs, HFCs) climate forcers, given increasing background levels of such halocarbons with unidentified sources in East Asia (Choi et al., 2024).
In summary, ethanol and other species were significant sources of acetaldehyde. Previous studies have attributed ethanol emissions to VCPs based on findings from US cities. However, our results indicate that such attribution requires a more detailed understanding of local sources, including industrial activities near populated areas. The heterogenous distribution of VOCs and PANs observed in this work support this conclusion.
4.3 Instantaneous production rates, efficiency, and chemical regimes of O3
Ozone formation is evaluated based on instantaneous ozone production rates, P(O3), and efficiency, OPE. For this evaluation we use a combined analysis incorporating kinetic calculations and model simulations. This analysis enables a detailed diagnostic of ozone production by integrating observation-based estimates using experimental parameters with near-explicit chemical modeling that includes precursors not directly measured such as radicals. Figure 7a shows P(O3) from kinetic calculations using Eq. (3) and an OH concentration of 2 × 10⁶ molec. cm−3 as a function of NOx on a logarithmic scale, with OH exposure shown in the upper panel. The general increase in P(O3) is due to increasing OH reactivity with NOx, as the calculation does not account for suppression of OH at high NOx levels.
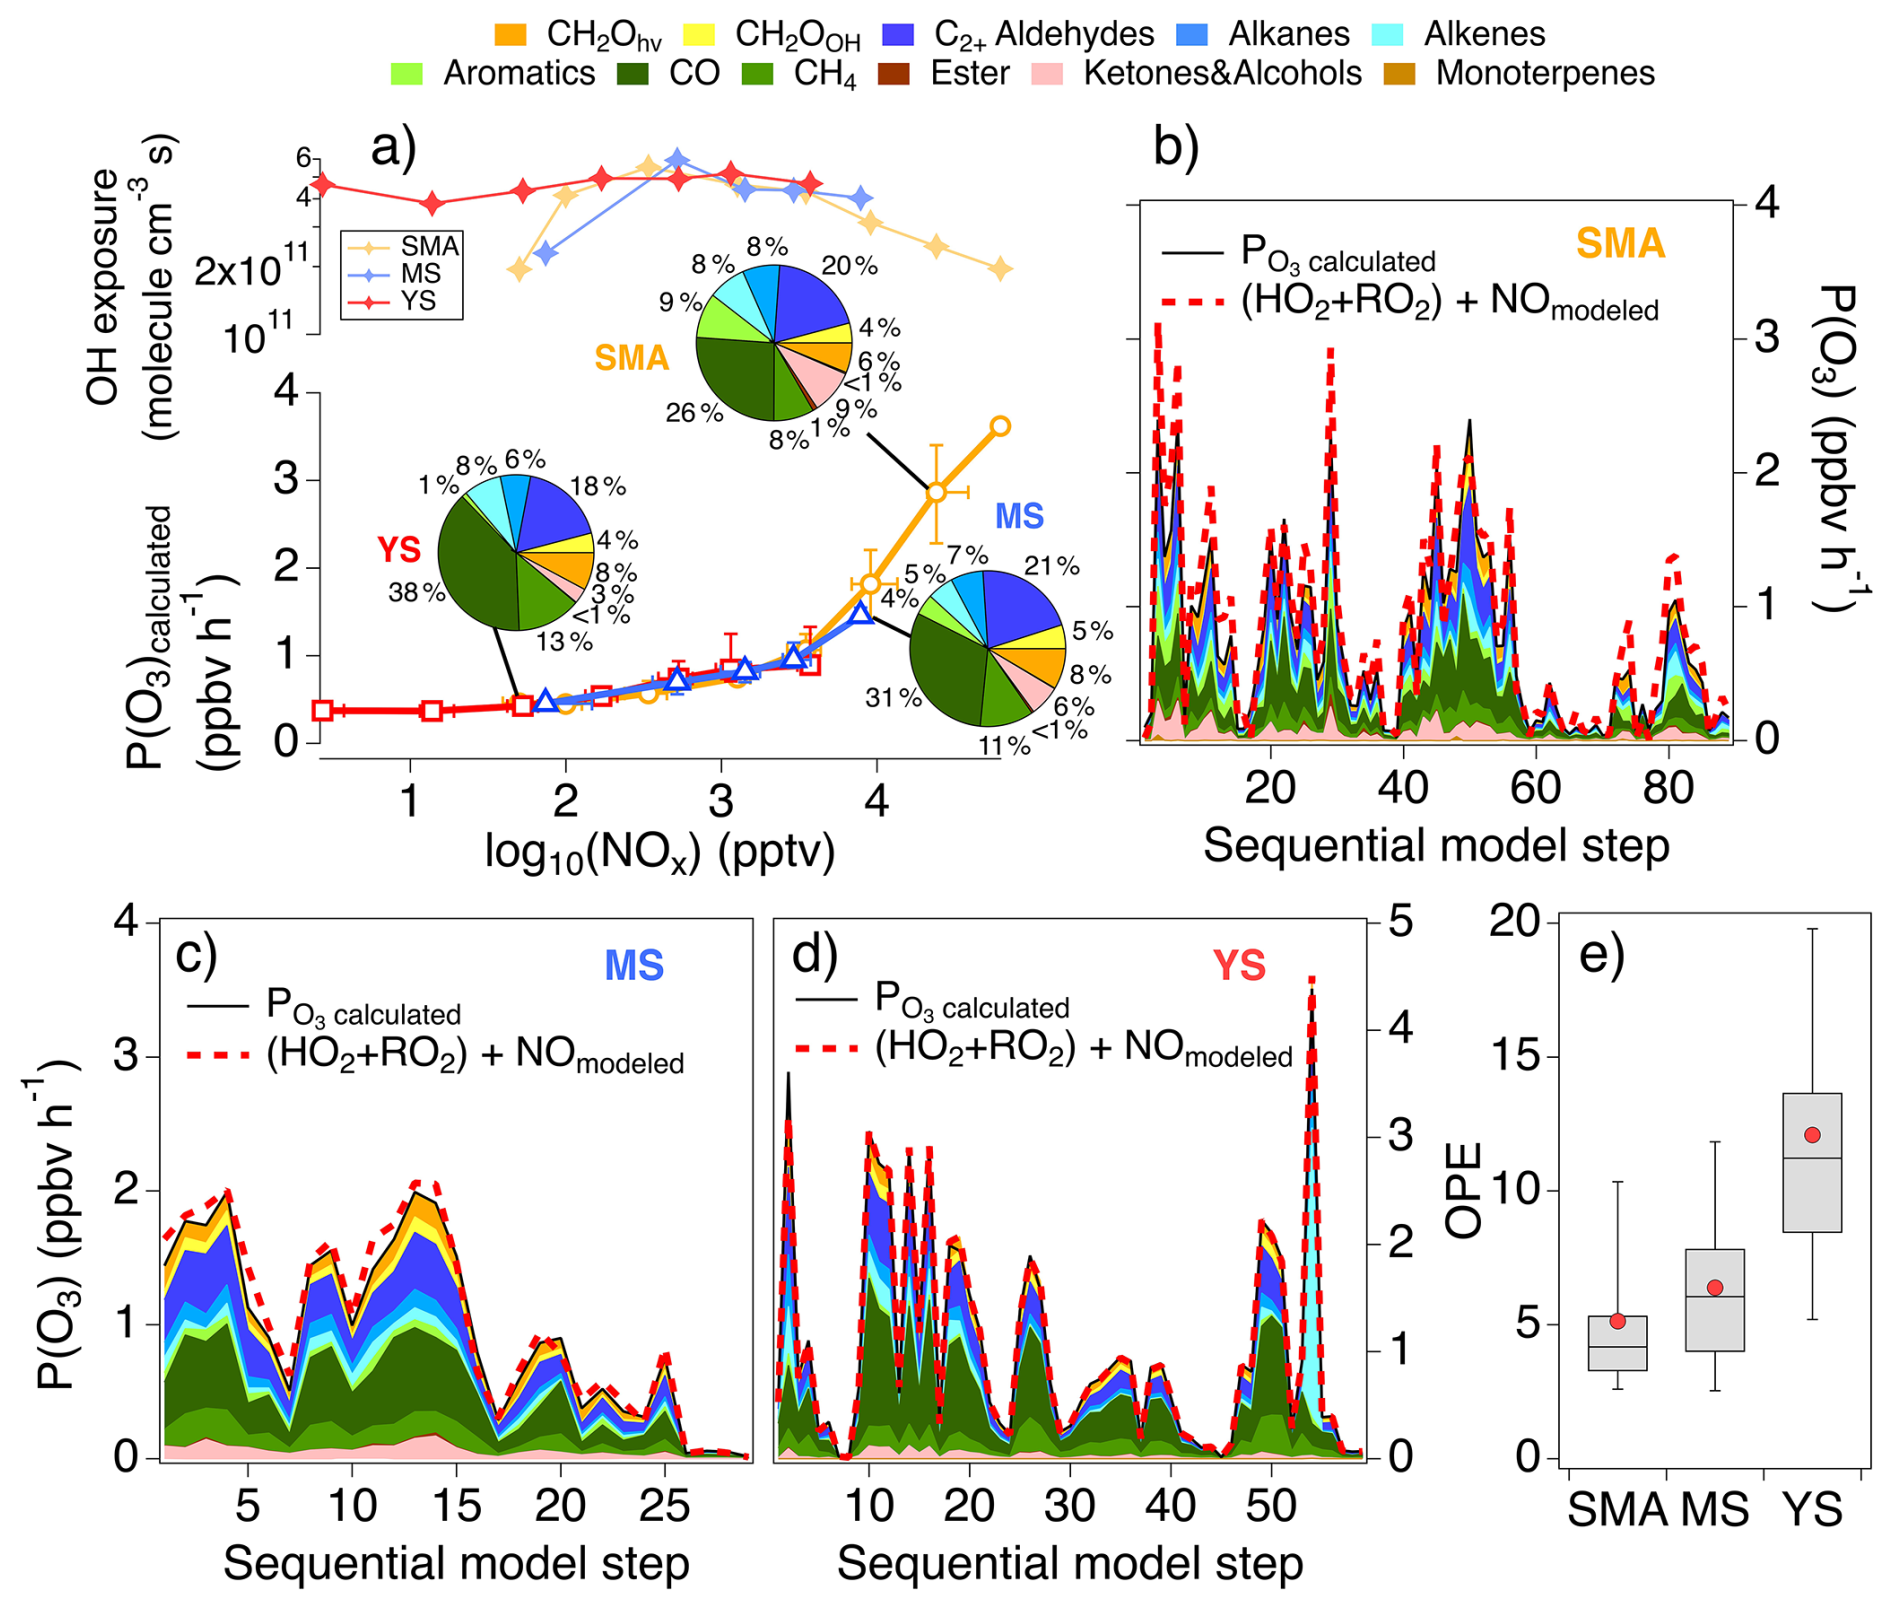
Figure 7(a) Median ozone production, P(O3), from kinetic calculations using [OH] = 2 × 10⁶ molec. cm−3 for the SMA (orange line with circles), MS (blue line with triangles) and YS (red line with squares) in 0.5-logarithmic NOx bins. Vertical and horizontal lines represent 25th and 75th percentiles on the respective axes. The OH exposure (lines with markers) for each region is shown in the upper panel. Pie charts indicate the fractional contribution of each of the VOC classes (defined in the legend) to P(O3). (b–d) Comparisons of P(O3) from kinetic calculations using modeled [OH] (black lines with shaded areas representing precursor contributions) and model simulations based on the sum of reactions of peroxy radicals with NO over the selected regions (red dashed lines). Sequential model step on the x-axis represents sequential indices of model output, used to illustrate the comparison between kinetic calculations and model simulations. (e) Box and whisker plot of instantaneous ozone production efficiency (OPE), along with regional averages (red markers).
P(O3) from kinetic calculations is more effective for evaluating relative precursor contributions independent of OH. The pie charts in Fig. 7a show substantial contributions of oxygenates, especially C2+ aldehydes to P(O3), second in importance to CO. Other important oxygenated contributors include formaldehyde as well as ketones and alcohols such as MEK, methanol, ethanol, and isopropanol, which together account for ∼ 95 % of this category. Less significantly, primary hydrocarbons including methane (CH4), alkanes, alkenes, and aromatics over South Korea showed similar contributions, while aromatic impacts were minimal in the YS. Less-reactive species such as CO and CH4 were more important over the YS, likely due to sampling of air masses with biomass burning influence and with longer time since emissions.
When modeled OH was used in the kinetic calculations, instead of using a constant value for generalization, P(O3) from kinetic calculations was in excellent agreement with model simulations based on Eq. (2) (Fig. 7b–d). This indicates that the modeled oxidative chemistry driving ozone production and radical cycling can be explained by the current understanding of observed VOC photooxidation. Consistent with the averaged impacts shown in Fig. 7a, oxygenates including C2+ aldehydes and formaldehyde showed significant and persistent contribution in all regions. In addition, peak ozone production over the YS occurred during episodic enhancements of alkenes that dominated P(O3), which was attributed to sampling of relatively fresh petrochemical plumes, also described in Sect. 3.1. Another important measure for ozone production is OPE. Figure 7e shows modeled OPE using box plots, with red markers indicating regional averages. OPE generally decreased with increasing NOx, resulting in the lowest and highest values in the SMA and YS, respectively. Higher OPE indicates more efficient radical propagation relative to termination by NOx. The interquartile ranges of OPE for the SMA (3.3–5.3) and MS (4–7.8) were comparable to the previous reported values in East Asia (< ∼ 10) in winter–spring, though only limited values are available for winter (Lin et al., 2011; Lee et al., 2021; Kim et al., 2020; Oak et al., 2019).
A key factor determining OPE and the prevailing chemical regime is the balance of radical (ROx= OH + HO2+ RO2) termination pathways, including self-reactions of peroxy radicals and reactions with NOx, which removes radicals and NOx from ozone producing photochemical cycles. The modeled instantaneous radical loss indicates that radical loss by reaction with NOx dominates over the SMA (88 %) and MS (80 %), with nitric acid (HNO3) and PANs as the major products and smaller contributions from alkyl nitrates and nitroaromatic compounds (Fig. 8). It should be noted that the chemistry of nitroaromatics in the MCM mechanism may be uncertain and needs further investigation (Bates et al., 2021; MacFarlane et al., 2025). The dominant contributions of HNO3 and PANs to radical loss are consistent with wintertime observations in Beijing based on direct radical measurements (Tan et al., 2018; Lu et al., 2019). Other minor radical termination pathways include formation of peroxides, HONO, and pernitric acid (HO2NO2).
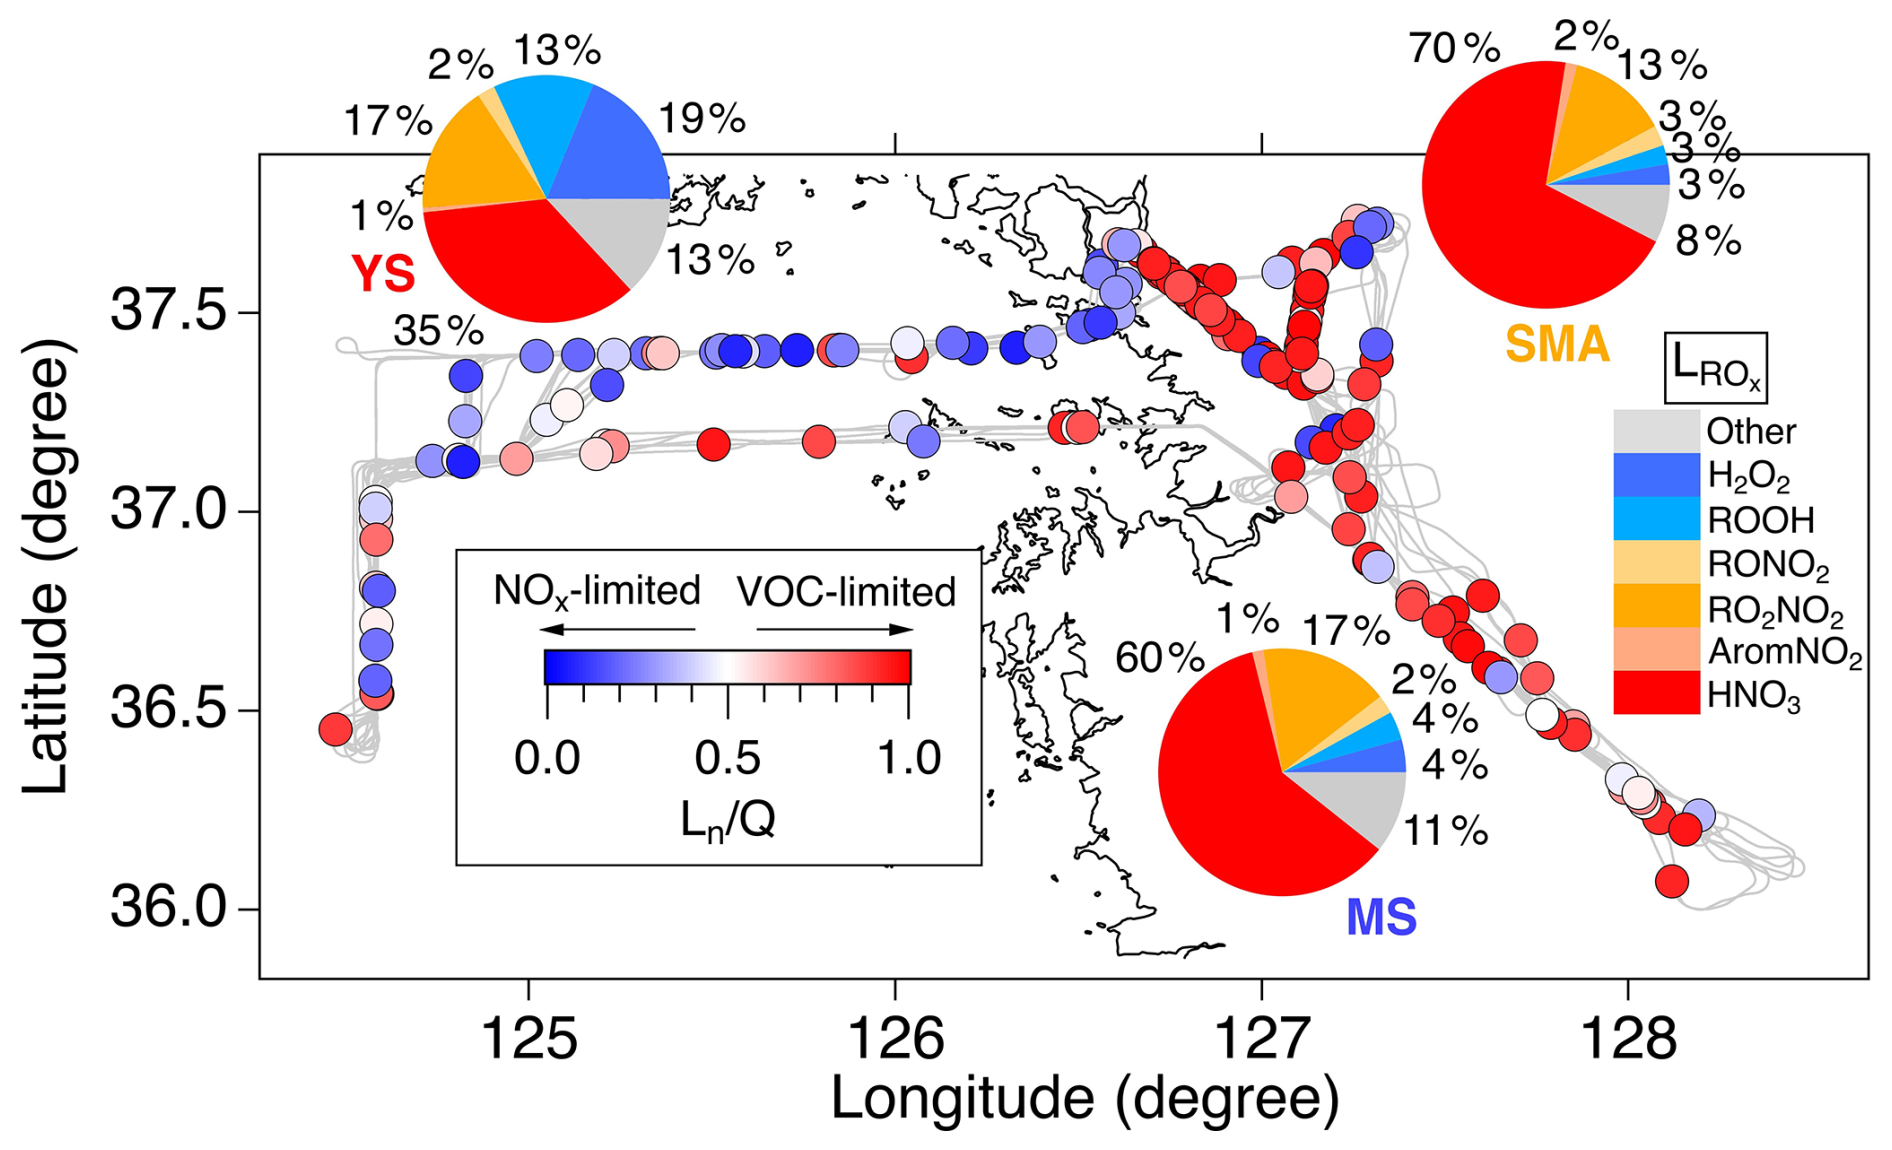
Figure 8Averaged fractional contributions of modeled instantaneous radical loss pathways over the SMA, MS, and YS (pie charts), along with markers colored by instantaneous fraction of radical loss by NOx in total loss (Ln Q).
In addition to OPE, the ratio of radical loss by NOx (Ln) to total loss (Q), Ln Q ratio, provides an additional diagnostic measure for ozone formation regimes, with Ln Q > 0.5 indicating VOC-limited regimes and Ln Q < 0.5 indicating NOx-limited regimes (Kleinman et al., 2002). Figure 8a shows a median Ln Q values of 0.9 over South Korea, representative of VOC-limited regimes with major radical loss driven by HNO3 and PANs formation in the region. Over the YS, radical-radical reactions producing peroxides become increasingly important, resulting in a lower median Ln Q of 0.4.
To investigate potential impacts of emission changes on chemical regimes, model sensitivity simulations were conducted by evaluating P(PANs), P(O3) and OPE responses to perturbations of NOx and VOCs constraints (±40 % of the base case). Figure S8a–b show the average relative changes of P(PANs) and P(O3) exhibit a strong positive response to VOCs across all regions, while NOx perturbation produces opposite responses in South Korea and a weaker effect in the YS. In contrast to this regional difference, OPE showed more uniform response across regions as it represents the average changes in the ratio between formation of radicals and NOx oxidation products (Fig. S8c). The model sensitivity results point out that PANs and ozone formation during ASIA-AQ occurred in VOC-limited conditions and suggest that VOC reductions, especially anthropogenic aldehydes, alkenes and aromatics, would be more effective than NOx controls for mitigation of photochemical pollution.
4.4 Diagnostic kinetic and model analysis on NOx loss pathways
A defining feature of the ASIA-AQ observations was the substantial variability in pollutant distributions, reflecting a broad range of photochemical conditions and pollution intensities (e.g., NOx levels spanning orders of magnitude; Fig. 7a). While NOx removal was dominated by HNO3 and PANs, which together accounted for ∼ 90 % of modeled NOx loss over South Korea, their relative contributions varied largely during the campaign, in part due to this variability. Romer et al. (2020) evaluated observed relative contributions of HNO3 and alkyl nitrates (RONO2) to NOx loss during the summer daytime across multiple campaigns in the US over 15 years, using kinetic calculations based on instantaneous production rates. They pointed out the relative contribution of HNO3 decline with the OH reactivity ratio of NO2 to the sum of VOCs ( RVOCs), suggesting increased importance of RONO2 chemistry with decreases in NOx levels.
Using a similar kinetic approach to Romer et al. (2020), we investigate the fractional contribution of PANs to total NOx loss (χPANs). Here, observation-based χPANs (χPANs−obs) is defined as the ratio of observed PANs to the sum of observed PANs, HNO3, and particulate inorganic nitrate (pNO). pNO was estimated by excluding organic nitrate contribution (∼ 10 % of pNO over South Korea) from total nitrate measured by the University of Colorado Aerosol Mass Spectrometer (CU aircraft AMS), following the method of Day et al. (2022). This diagnostic analysis may be particularly relevant for wintertime East Asia, where cold conditions extend PANs lifetime (effective lifetime of ∼ 3 d) and enable efficient NOx sequestration (e.g., Fig. 8). The competition among HNO3 and PANs formation is a critical factor that controls NOx lifetimes and the spatial extent of ozone pollution, as HNO3 formation constitutes a permanent sink, whereas PANs serve as a reservoir and can facilitate NOx transport on local–regional scales.
During ASIA-AQ, χPANs−obs varied substantially (0.2–0.94) and had an inverse relationship with the OH reactivity ratio of NO2 to the sum of observed aldehyde precursors of PANs ( RALD). The decrease in χPANs−obs with RALD suggests the importance of competition between OH reacting with NO2 to form HNO3 versus with aldehydes to form PAs, which promotes PANs formation, in determining NOx loss pathways. It should be noted that RALD is more relevant than RVOCs used in previous studies for the analysis herein and may provide a more consistent basis for future analyses, given that kinetic calculations are sensitive to the selection of VOCs and their associated kinetic parameters (e.g., alkyl nitrate branching ratios and yields).
The observed dependence of χPANs−obs with RALD is consistent with kinetic expressions (Eqs. S4–S6) that define the ratio of instantaneous PANs production rates to the combined rates of PANs and HNO3 production. These equations exhibit a negative relationship of χPANs with RALD and NO RALD, reflecting a broader dependence of χPANs on NOx to aldehydes ratios. For comparison with χPANs−obs, we include estimates from kinetic calculations assuming a constant [OH] = 2 × 10⁶ molec. cm−3 (χPANs based on kinetic calculations; χPANs−kc) from calculations using modeled [OH] (), and from full model simulations (χPANs−model) in Fig. 9a. As expected from the kinetic equations, all estimates exhibit a decreasing trend with increasing RALD, in reasonable accordance with the observations.
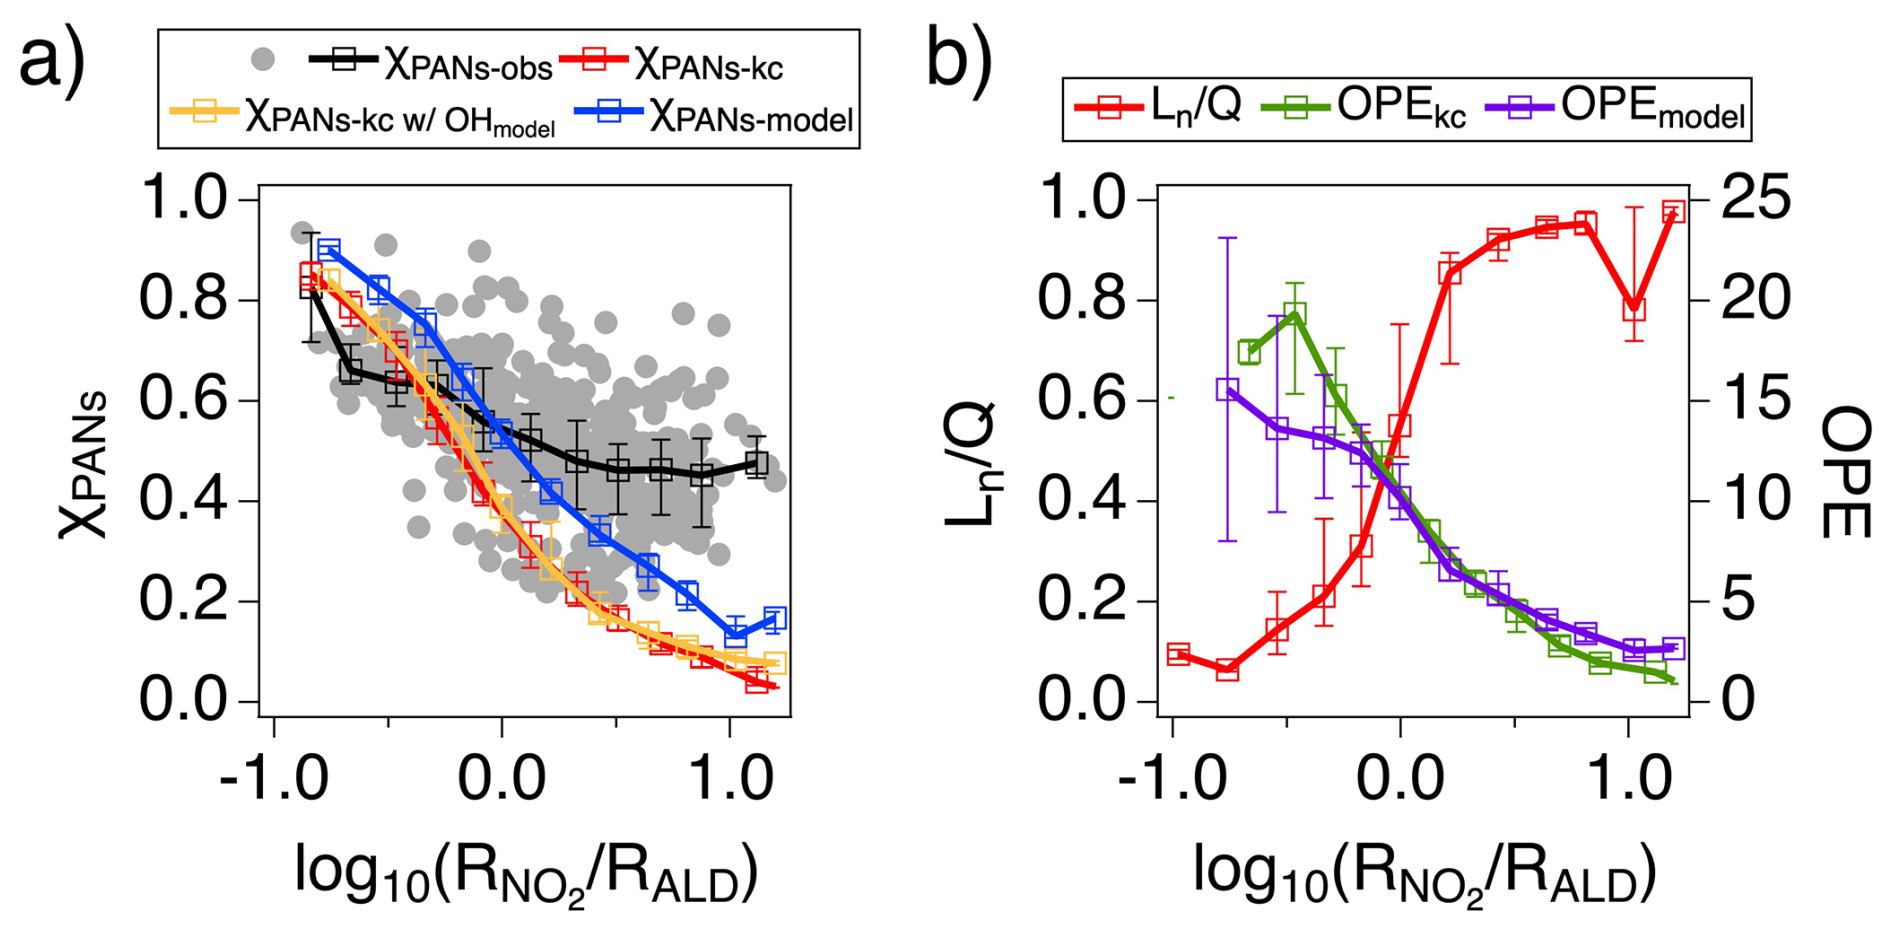
Figure 9(a) Median observed fractional contribution of PANs to the total NOx loss based on observations (χPANs−obs; black line with markers) along with median ratios of instantaneous PANs production rates to the combined rates of PANs and HNO3 production from kinetic calculations using [OH] = 2 × 10⁶ molec. cm−3 (χPANs−kc; red line with markers) and modeled [OH] (; orange line with markers), and from model simulations (χPANs−model; blue line with markers) in 0.2-logarithmic RALD bins. All data points used to calculate χPANs−obs are illustrated as gray markers. (b) Median modeled Ln Q (red line with markers) and OPE (OPEmodel; purple line with markers) and kinetic calculated OPE (OPEkc; green line with markers) in 0.2-logarithmic RALD bins. The error bars in both figures indicate 25th and 75th percentiles in each bin.
Because χPANs represent a ratio of production rates, it is largely independent of OH concentrations, as indicated by the overlap between χPANs−kc and in Fig. 9a. This suggests that the consistently higher χPANs−model values than both χPANs−kc and are not driven by differences in OH but instead by other factors such as additional PANs sources in the model not accounted for by the kinetic calculations (detailed discussion in Sect. 3.2.1). Despite the similar dependence of observed and estimated χPANs on RALD, the estimated values systematically underestimated χPANs−obs. This discrepancy likely reflects the cumulative nature of the observations, which integrate ambient processes such as total nitrate loss and unaccounted PANs contributions from chemical production, transport, and background sources.
The diagnostic ratio RALD effectively characterizes the observed partitioning of NOx loss. To further assess its utility, we examine the sensitivity of Ln Q and OPE to changes in RALD. As shown in Fig. 9b, Ln Q from model simulations increase with RALD, indicating shift toward VOC-limited conditions at higher NOx to aldehyde ratios. Consistent with this, OPE decreases with increasing RALD in both kinetic calculations (using [OH] = 2 × 10⁶ molec. cm−3) and model simulations. These sensitivities likely represent that lower RALD facilitates radical propagation and PANs formation, while higher values favor HNO3 formation and thus radical termination. Although not explicitly stated in kinetic expressions, RALD likely evolves with photochemical aging as NOx is converted to HNO3 and PANs, and secondary aldehydes are produced downwind. Consistent with this interpretation, OH exposure generally decreases with RALD (not shown).
Overall, the dependence of χPANs−obs on RALD, consistent with kinetic theory, suggests continued NOx reduction, following the trends observed over the past decade over South Korea and other East Asian countries (Duncan et al., 2016), may decrease RALD and shift NOx loss pathways more toward PANs formation than HNO3 in winter. Supporting this postulation, χPANs−model increased by 22 % on average in sensitivity simulations with a 40 % reduction in NOx constraints. However, the predicted increase in PANs likely represents an upper limit, as observed aldehydes were constrained in the simulations, despite their yields from VOC oxidation often being NOx-dependent (e.g., Millet et al., 2010). The potential shift in NOx loss partitioning in response to NOx reductions may result in extended spatial impacts of NOx emissions and consequently ozone pollution, which may be further exacerbated by increase in OPE (Fig. S8 and Fig. 9).
This study provides a comprehensive characterization of wintertime acyl peroxynitrates (PANs) chemistry over South Korea during the Airborne and Satellite Investigation of Asian Air Quality (ASIA-AQ) campaign, combining novel measurements of rare acetyl peroxynitrate (PAN) homologues with integrated kinetic and modeling analysis. Our findings reveal active photochemical processing despite cold conditions and provide critical insights into volatile organic compounds (VOC) sources, oxidation pathways, and their implications for air quality management.
PANs levels were persistently elevated across South Korea and the Yellow Sea (YS) (frequently exceeding 1 ppbv, maximum 5.5 ppbv), with strong correlations to formaldehyde (CH2O), odd oxygen (Ox; approximated as O3+ NO2) and secondary aerosols confirming active winter photochemistry. Regional pollution was extensive, with higher median PANs in remote areas (the mid- and southern region (MS): 990 pptv; YS: 1200 pptv) than in the Seoul Metropolitan Area (SMA: 840 pptv) despite lower emissions, demonstrating significant transport and regional impacts. Elevated homologue PAN ratios, particularly for acryloyl peroxynitrate (APAN) and benzoyl peroxynitrate (PBzN), indicate complex source influences. Notably, strong correlations between APAN, acrolein, and ethylene oxide provided strong evidence of petrochemical impacts and associated toxic exposures in the MS, with back trajectories indicating transport from west coast industrial complexes.
Mechanistic analysis demonstrated that while acetaldehyde dominates PAN production (53 %–80 %), other precursors including aromatics make significant contributions (up to 47 % in Seoul). Ethanol was demonstrated to be a critical precursor, as it contributes approximately 50 % to acetaldehyde formation. In addition, ethanol was very strongly correlated with industrial halocarbons (r2 > 0.8), including bromodichloromethane, HCFC-142b and HFC-134a, indicating important industrial and solvent sources beyond consumer products. This finding challenges previous attributions to volatile chemical products alone and highlights the need for better constraints on industrial VOC emissions in South Korea.
Ozone production analysis confirmed VOC-limited conditions across South Korea, with aldehydes (formaldehyde and C2+ aldehydes) contributing approximately 20 %–30 % of instantaneous ozone production. Radical loss was dominated (> 80 %) by formation of nitric acid and PANs, with median Ln Q ratios of 0.9 indicating strong VOC limitation. Ozone production efficiency values (< 10) were consistent with wintertime observations elsewhere in East Asia.
A finding with important policy implications is that continued NOx reductions may paradoxically expand the spatial extent of ozone pollution. Our diagnostic analysis shows that the fractional contribution of PANs to NOx loss increases systematically as the ratio of NO2 to aldehyde reactivity decreases. Model simulations indicate that a 40 % NOx reduction could increase PANs' contribution to NOx loss by 22 %, shifting nitrogen oxide chemistry toward the longer-lived PANs reservoir rather than permanent removal as nitric acid. This shift, combined with increases in ozone production efficiency, may extend the spatial impacts of NOx emissions and exacerbate regional ozone pollution.
These findings have implications for air quality management in South Korea and East Asia. Effective control of wintertime photochemical pollution requires prioritizing reductions in aldehydes and their precursors – particularly ethanol and reactive alkenes from both industrial and consumer sources. Better characterization of industrial VOC emissions, including from petrochemical facilities, is essential. While concurrent NOx reductions remain important for long-term benefits and reducing fine particulate matter, policymakers should anticipate potential near-term increases in the spatial extent of ozone pollution as NOx levels decline. Together with prior springtime observations from KORUS-AQ, future studies of summertime PANs in South Korea would improve understanding of seasonable differences in their chemistry and inform broader control strategies for photochemical pollution. Finally, our integrated approach demonstrates the value of comprehensive PAN homologue measurements as diagnostic tools for understanding complex urban and regional photochemistry.
All data used in this work is available at https://www-air.larc.nasa.gov/cgi-bin/ArcView/asiaaq (last access: 18 June 2026). The F0AM model (version 4.3.0.1) and setup file are available at https://doi.org/10.5281/zenodo.10069985 (Wolfe and Haskins, 2023).
The supplement related to this article is available online at https://doi.org/10.5194/acp-26-8695-2026-supplement.
All of the authors reviewed and edited the document and participated in the investigation by data acquisition or flight planning. YRL conceived and performed the formal analysis and wrote the first draft of the document. LA was responsible for data curation. LGH was responsible for obtaining funding and aided in writing the first draft.
The contact author has declared that none of the authors has any competing interests.
Publisher's note: Copernicus Publications remains neutral with regard to jurisdictional claims made in the text, published maps, institutional affiliations, or any other geographical representation in this paper. The authors bear the ultimate responsibility for providing appropriate place names. Views expressed in the text are those of the authors and do not necessarily reflect the views of the publisher.
The authors thank the flight crew of the NASA-DC8.
YRL was supported by NASA (grant no. 80NSSC21K1704). LA, DT and LGH were supported by NASA (grant no. 80NSSC23K0826). AJH, RSH and ECA were supported in part by NASA (grant no. 80NSSC23K0818). SM, BB, NJB and DRB were supported by NASA (grant no. 80NSSC23K0819). PTR-ToF-MS measurements aboard the NASA DC-8 during ASIA-AQ were partially funded by the Austrian Federal Ministry for Climate Action, Environment, Energy, Mobility, Innovation, and Technology (BMK), represented by the Austrian Research Promotion Agency (FFG), through the Austrian Space Applications Programme (ASAP 2022, grant no. FO999900547). IONICON Analytik is acknowledged for supplying a FUSION PTR-ToF-MS analyzer and providing staff support. WW gratefully acknowledges the support from Gdańsk University of Technology through the DEC-4/1/2024/IDUB/II.1b/Am grant under the Americium International Career Development – “Excellence Initiative – Research University” program. JDC and POW were supported by NASA (grant no. 80NSSC21K1704). KB was supported by NASA FINESST (grant no. 80NSSC24K0005). GS, DK, DD, PCJ and JLJ were supported by NASA (grant no. 80NSSC21K1451 and grant no. 80NSSC23K0828). NASA (grant no. 80NSSC23K0825) funded the CAFS deployment and SH and KU. AS, ERD, RAH, JMSC, and GMW were supported by the NASA Tropospheric Composition Program. This material is based upon work supported by the NSF National Center for Atmospheric Research, which is a major facility sponsored by the US National Science Foundation under Cooperative Agreement grant no. 1852977.
This paper was edited by Eva Y. Pfannerstill and reviewed by two anonymous referees.
Agency for Toxic Substances and Disease Registry (ATSDR): Toxicological Profile for Bromoform and Dibromochloromethane, https://www.atsdr.cdc.gov/toxprofiles/tp130.pdf (last access: 18 June 2026), 2005.
Agency for Toxic Substances and Disease Registry (ATSDR): Toxicological Profile for Bromodichloromethane, https://www.atsdr.cdc.gov/toxprofiles/tp129.pdf (last access: 18 June 2026), 2020.
An, Z., Huang, R.-J., Zhang, R., Tie, X., Li, G., Cao, J., Zhou, W., Shi, Z., Han, Y., Gu, Z., and Ji, Y.: Severe haze in northern China: A synergy of anthropogenic emissions and atmospheric processes, Proc. Natl. Acad. Sci. USA, 116, 8657–8666, https://doi.org/10.1073/pnas.1900125116, 2019.
Apel, E. C., Emmons, L. K., Karl, T., Flocke, F., Hills, A. J., Madronich, S., Lee-Taylor, J., Fried, A., Weibring, P., Walega, J., Richter, D., Tie, X., Mauldin, L., Campos, T., Weinheimer, A., Knapp, D., Sive, B., Kleinman, L., Springston, S., Zaveri, R., Ortega, J., Voss, P., Blake, D., Baker, A., Warneke, C., Welsh-Bon, D., de Gouw, J., Zheng, J., Zhang, R., Rudolph, J., Junkermann, W., and Riemer, D. D.: Chemical evolution of volatile organic compounds in the outflow of the Mexico City Metropolitan area, Atmos. Chem. Phys., 10, 2353–2375, https://doi.org/10.5194/acp-10-2353-2010, 2010.
ASIA-AQ: Airborne and Satellite Investigation of Asian Air Quality (ASIA-AQ) white paper, https://espo.nasa.gov/asia-aq/document/ASIA-AQ_White_Paper (last access: 18 June 2026), 2023.
Bates, K. H., Jacob, D. J., Li, K., Ivatt, P. D., Evans, M. J., Yan, Y., and Lin, J.: Development and evaluation of a new compact mechanism for aromatic oxidation in atmospheric models, Atmos. Chem. Phys., 21, 18351–18374, https://doi.org/10.5194/acp-21-18351-2021, 2021.
Beaudry, E., Jacob, D. J., Bates, K. H., Zhai, S., Yang, L. H., Pendergrass, D. C., Colombi, N., Simpson, I. J., Wisthaler, A., Hopkins, J. R., Li, K., and Liao, H.: Ethanol and Methanol in South Korea and China: Evidence for Large Anthropogenic Emissions Missing from Current Inventories, ACS ES&T Air, 2, 456–465, https://doi.org/10.1021/acsestair.4c00210, 2025.
Bey, I., Jacob, D. J., Yantosca, R. M., Logan, J. A., Field, B. D., Fiore, A. M., Li, Q.-B., Liu, H.-Y., Mickley, L. J., and Schultz, M. G.: Global Modeling of Tropospheric Chemistry with Assimilated Meteorology: Model Description and Evaluation, J. Geophys. Res.-Atmos., 106, 73–95, https://doi.org/10.1029/2001JD000807, 2001.
Brune, W. H., Miller, D. O., Thames, A. B., Brosius, A. L., Barletta, B., Blake, D. R., Blake, N. J., Chen, G., Choi, Y., Crawford, J. H., DiGangi, J. P., Diskin, G., Fried, A., Hall, S. R., Hanisco, T. F., Huey, G. L., Hughes, S. C., Kim, M., Meinardi, S., Montzka, D. E., and Wennberg, P. O.: Observations of atmospheric oxidation and ozone production in South Korea, Atmos. Environ., 269, 118854, https://doi.org/10.1016/j.atmosenv.2021.118854, 2022.
Chae, J.-S., Chae, J.-S., Jeon, J.-M., Kang, B.-W., Kim, J.-H., Moon, K.-J., Park, G.-T., and Kang, D.-I.: The study on emission characteristics of gas-phase hazardous air pollutants generated at the large-scale industrial complexes, J. Korean Soc. Atmos. Environ., 40, 27–47, https://doi.org/10.5572/KOSAE.2024.40.1.27, 2024.
Chen, D., Huey, L. G., Tanner, D. J., Salawitch, R. J., Anderson, D. C., Wales, P. A., Pan, L. A., Atlas, E. L., Hornbrook, R. S., Apel, E. C., Blake, N. J., Campos, T. L., Donets, V., Flocke, F. M., Hall, S. R., Hanisco, T. F., Hills, A. J., Hornomichl, S. B., Jensen, J. B., Kaser, L., Montzka, D. D., Nicely, J. M., Reeves, J. M., Riemer, D. D., Schauffler, S. M., Ullmann, K., Weinheimer, A. J., and Wolfe, G. M.: Airborne measurements of BrO and the sum of HOBr and Br2 over the Tropical West Pacific from 1 to 15 km during the CONvective TRansport of Active Species in the Tropics (CONTRAST) experiment, J. Geophys. Res.-Atmos., 121, 12560–12578, https://doi.org/10.1002/2016JD025561, 2016.
Cho, C., St. Clair, J. M., Liao, J., Wolfe, G. M., Jeong, S., Kang, D., Choi, J., Shin, M.-H., Park, J., Park, J.-H., Fried, A., Weinheimer, A., Blake, D. R., Diskin, G. S., Ullmann, K., Hall, S. R., Brune, W. H., Hanisco, T. F., and Min, K.-E.: Evolution of formaldehyde (HCHO) in a plume originating from a petrochemical industry and its volatile organic compounds (VOCs) emission rate estimation, Elem. Sci. Anth., 9, 1, https://doi.org/10.1525/elementa.2021.00015, 2021.
Choi, H., Redington, A. L., Park, H., Kim, J., Thompson, R. L., Mühle, J., Salameh, P. K., Harth, C. M., Weiss, R. F., Manning, A. J., and Park, S.: Revealing the significant acceleration of hydrofluorocarbon (HFC) emissions in eastern Asia through long-term atmospheric observations, Atmos. Chem. Phys., 24, 7309–7330, https://doi.org/10.5194/acp-24-7309-2024, 2024.
Coggon, M. M., Gkatzelis, G. I., McDonald, B. C., Gilman, J. B., Schwantes, R. H., Abuhassan, N., Aikin, K. C., Arend, M. F., Berkoff, T. A., Brown, S. S., Campos, T. L., Dickerson, R. R., Gronoff, G., Hurley, J. F., Isaacman-VanWertz, G., Koss, A. R., Li, M., McKeen, S. A., Moshary, F., Peischl, J., Pospisilova, V., Ren, X., Wilson, A., Wu, Y., Trainer, M., and Warneke, C.: Volatile chemical product emissions enhance ozone and modulate urban chemistry, Proc. Natl. Acad. Sci. USA, 118, e2026653118, https://doi.org/10.1073/pnas.2026653118, 2021.
Cooper, O. R., Schultz, M. G., Schröder, S., Chang, K.-L., Gaudel, A., Benítez, G. C., Cuevas, E., Fröhlich, M., Galbally, I. E., Molloy, S., Kubistin, D., Lu, X., McClure-Begley, A., Nédélec, P., O'Brien, J., Oltmans, S. J., Petropavlovskikh, I., Ries, L., Senik, I., Sjöberg, K., Solberg, S., Spain, G. T., Spangl, W., Steinbacher, M., Tarasick, D., Thouret, V., and Xu, X.: Multi-decadal surface ozone trends at globally distributed remote locations, Elem. Sci. Anth., 8, 23, https://doi.org/10.1525/elementa.420, 2020.
Crawford, J., Davis, D., Olson, J., Chen, G., Liu, S., Gregory, G., Barrick, J., Sachse, G., Sandholm, S., Heikes, B., Singh, H., and Blake, D.: Assessment of upper tropospheric HOx sources over the tropical Pacific based on NASA GTE/PEM data: Net effect on HOx and other photochemical parameters, J. Geophys. Res.-Atmos., 104, 16255–16273, https://doi.org/10.1029/1999JD900106, 1999.
Crawford, J. H., Ahn, J.-Y., Al-Saadi, J., Chang, L., Emmons, L. K., Kim, J., Lee, G., Park, J.-H., Park, R. J., Woo, J. H., Song, C.-K., Hong, J.-H., Hong, Y.-D., Lefer, B. L., Lee, M., Lee, T., Kim, S., Min, K.-E., Yum, S. S., Shin, H. J., Kim, Y.-W., Choi, J.-S., Park, J.-S., Szykman, J. J., Long, R. W., Jordan, C. E., Simpson, I. J., Fried, A., Dibb, J. E., Kim, S. Y., and Kim, Y. P.: The Korea–United States Air Quality (KORUS-AQ) field study, Elem. Sci. Anth., 9, 00163, https://doi.org/10.1525/elementa.2020.00163, 2021.
Day, D. A., Campuzano-Jost, P., Nault, B. A., Palm, B. B., Hu, W., Guo, H., Wooldridge, P. J., Cohen, R. C., Docherty, K. S., Huffman, J. A., de Sá, S. S., Martin, S. T., and Jimenez, J. L.: A systematic re-evaluation of methods for quantification of bulk particle-phase organic nitrates using real-time aerosol mass spectrometry, Atmos. Meas. Tech., 15, 459–483, https://doi.org/10.5194/amt-15-459-2022, 2022.
de Gouw, J. A., Gilman, J. B., Kim, S.-W., Alvarez, S. L., Dusanter, S., Graus, M., Griffith, S. M., Isaacman-VanWertz, G., Kuster, W. C., Lefer, B. L., Lerner, B. M., McDonald, B. C., Rappenglück, B., Roberts, J. M., Stevens, P. S., Stutz, J., Thalman, R., Veres, P. R., Volkamer, R., Warneke, C., Washenfelder, R. A., and Young, C. J.: Chemistry of volatile organic compounds in the Los Angeles Basin: Formation of oxygenated compounds and determination of emission ratios, J. Geophys. Res.-Atmos., 123, 2298–2319, https://doi.org/10.1002/2017JD027976, 2018.
Duncan, B. N., Lamsal, L. N., Thompson, A. M., Yoshida, Y., Lu, Z., Streets, D. G., Hurwitz, M. M., and Pickering, K. E.: A space-based, high-resolution view of notable changes in urban NOx pollution around the world (2005–2014), J. Geophys. Res.-Atmos., 121, 976–996, https://doi.org/10.1002/2015JD024121, 2016.
Fischer, E. V., Jacob, D. J., Yantosca, R. M., Sulprizio, M. P., Millet, D. B., Mao, J., Paulot, F., Singh, H. B., Roiger, A., Ries, L., Talbot, R. W., Dzepina, K., and Pandey Deolal, S.: Atmospheric peroxyacetyl nitrate (PAN): a global budget and source attribution, Atmos. Chem. Phys., 14, 2679–2698, https://doi.org/10.5194/acp-14-2679-2014, 2014.
Fried, A., Walega, J., Weibring, P., Richter, D., Simpson, I. J., Blake, D. R., Blake, N. J., Meinardi, S., Barletta, B., Hughes, S. C., Crawford, J. H., Diskin, G., Barrick, J., Fenn, M., Wisthaler, A., Mikoviny, T., Woo, J.-H., Park, M., Kim, J., Kim, K.-E., Jeong, S., Wennberg, P. O., Kim, M. J., Crounse, J. D., Teng, A. P., Bennett, R., Yang-Martin, M., Shook, M. A., Huey, G., Tanner, D., Knote, C., Kim, J.-H., Park, R., and Brune, W.: Airborne formaldehyde and volatile organic compound measurements over the Daesan petrochemical complex on Korea's northwest coast during the Korea–United States Air Quality study: Estimation of emission fluxes and effects on air quality, Elem. Sci. Anth., 8, 121, https://doi.org/10.1525/elementa.2020.121, 2020.
Fu, T.-M., Jacob, D. J., Wittrock, F., Burrows, J. P., Vrekoussis, M., and Henze, D. K.: Global budgets of atmospheric glyoxal and methylglyoxal, and implications for formation of secondary organic aerosols, J. Geophys. Res.-Atmos., 113, D15303, https://doi.org/10.1029/2007JD009505, 2008.
Fu, X., Wang, T., Gao, J., Wang, P., Liu, Y., Wang, S., Zhao, B., and Xue, L.: Persistent heavy winter nitrate pollution driven by increased photochemical oxidants in northern China, Environ. Sci. Technol., 54, 3881–3889, https://doi.org/10.1021/acs.est.9b07248, 2020.
Gomez, A. L., Easterbrook, K. D., Johnson, N. M., Johnson, S., and Osthoff, H. D.: Thermal decomposition of peroxyacrylic nitric anhydride (APAN), Environ. Sci. Atmos., 5, 801–813, https://doi.org/10.1039/d5ea00032g, 2025.
Grell, G. A., Peckham, S. E., Schmitz, R., McKeen, S. A., Frost, G., Skamarock, W. C., and Eder, B.: Fully coupled “online” chemistry within the WRF model, Atmos. Environ., 39, 6957–6975, https://doi.org/10.1016/j.atmosenv.2005.04.027, 2005.
Grosjean, E., Grosjean, D., Woodhouse, L. F., and Yang, Y.-J.: Peroxyacetyl nitrate and peroxypropionyl nitrate in Porto Alegre, Brazil, Atmos. Environ., 36, 2405–2419, https://doi.org/10.1016/S1352-2310(01)00541-6, 2002.
Guo, S., Hu, M., Zamora, M. L., Peng, J., Shang, D., Zheng, J., Du, Z., Wu, Z., Shao, M., Zeng, L., Molina, M. J., and Zhang, R.: Elucidating severe urban haze formation in China, Proc. Natl. Acad. Sci. USA, 111, 17373–17378, https://doi.org/10.1073/pnas.1419604111, 2014.
Han, J., Lee, M., Shang, X., Lee, G., and Emmons, L. K.: Decoupling peroxyacetyl nitrate from ozone in Chinese outflows observed at Gosan Climate Observatory, Atmos. Chem. Phys., 17, 10619–10631, https://doi.org/10.5194/acp-17-10619-2017, 2017.
Holzinger, R., Warneke, C., Hansel, A., Jordan, A., Lindinger, W., Scharffe, D. H., Schade, G., and Crutzen, P. J.: Biomass Burning as a Source of Formaldehyde, Acetaldehyde, Methanol, Acetone, Acetonitrile, and Hydrogen Cyanide, Geophys. Res. Lett., 26, 1161–1164, https://doi.org/10.1029/1999GL900156, 1999.
Hornbrook, R. S., Hills, A. J., Riemer, D. D., Abdelhamid, A., Flocke, F. M., Hall, S. R., Huey, L. G., Knapp, D. J., Liao, J., Mauldin III, R. L., Montzka, D. D., Orlando, J. J., Shepson, P. B., Sive, B., Staebler, R. M., Tanner, D. J., Thompson, C. R., Turnipseed, A., Ullmann, K., Weinheimer, A. J., and Apel, E. C.: Arctic springtime observations of volatile organic compounds during the OASIS-2009 campaign, J. Geophys. Res.-Atmos., 121, 9789–9813, https://doi.org/10.1002/2015JD024360, 2016.
Jenkin, M. E., Young, J. C., and Rickard, A. R.: The MCM v3.3.1 degradation scheme for isoprene, Atmos. Chem. Phys., 15, 11433–11459, https://doi.org/10.5194/acp-15-11433-2015, 2015.
Ji, Y., Huey, L. G., Tanner, D. J., Lee, Y. R., Veres, P. R., Neuman, J. A., Wang, Y., and Wang, X.: A vacuum ultraviolet ion source (VUV-IS) for iodide–chemical ionization mass spectrometry: a substitute for radioactive ion sources, Atmos. Meas. Tech., 13, 3683–3696, https://doi.org/10.5194/amt-13-3683-2020, 2020.
Kabir, M., Jagiella, S., and Zabel, F.: Thermal stability of n-acyl peroxynitrates, Int. J. Chem. Kinet., 46, 462–469, https://doi.org/10.1002/kin.20862, 2014.
Kim, H., Gil, J., Lee, M., Jung, J., Whitehill, A., Szykman, J., Lee, G., Kim, D.-S., Cho, S., Ahn, J.-Y., Hong, J., and Park, M.-S.: Factors controlling surface ozone in the Seoul Metropolitan Area during the KORUS-AQ campaign, Elem. Sci. Anth., 8, 46, https://doi.org/10.1525/elementa.444, 2020.
Kleinman, L. I., Daum, P. H., Lee, Y.-N., Nunnermacker, L. J., Springston, S. R., Weinstein-Lloyd, J., and Rudolph, J.: Ozone production efficiency in an urban area, J. Geophys. Res.-Atmos., 107, 4733, https://doi.org/10.1029/2002JD002529, 2002.
Koss, A. R., Sekimoto, K., Gilman, J. B., Selimovic, V., Coggon, M. M., Zarzana, K. J., Yuan, B., Lerner, B. M., Brown, S. S., Jimenez, J. L., Krechmer, J., Roberts, J. M., Warneke, C., Yokelson, R. J., and de Gouw, J.: Non-methane organic gas emissions from biomass burning: identification, quantification, and emission factors from PTR-ToF during the FIREX 2016 laboratory experiment, Atmos. Chem. Phys., 18, 3299–3319, https://doi.org/10.5194/acp-18-3299-2018, 2018.
Lee, Y., Huey, L. G., Wang, Y., Qu, H., Zhang, R., Ji, Y., Tanner, D. J., Wang, X., Tang, J., Song, W., Hu, W., and Zhang, Y.: Photochemistry of volatile organic compounds in the Yellow River Delta, China: Formation of O3 and peroxyacyl nitrates, J. Geophys. Res.-Atmos., 126, e2021JD035296, https://doi.org/10.1029/2021JD035296, 2021.
Lee, Y. R., Ji, Y., Tanner, D. J., and Huey, L. G.: A low-activity ion source for measurement of atmospheric gases by chemical ionization mass spectrometry, Atmos. Meas. Tech., 13, 2473–2480, https://doi.org/10.5194/amt-13-2473-2020, 2020.
Lee, Y. R., Huey, L. G., Tanner, D. J., Takeuchi, M., Qu, H., Liu, X., Ng, N. L., Crawford, J. H., Fried, A., Richter, D., Simpson, I. J., Blake, D. R., Blake, N. J., Meinardi, S., Kim, S., Diskin, G. S., Digangi, J. P., Choi, Y., Pusede, S. E., Wennberg, P. O., Kim, M. J., Crounse, J. D., Teng, A. P., Cohen, R. C., Romer, P. S., Brune, W., Wisthaler, A., Mikoviny, T., Jimenez, J. L., Campuzano-Jost, P., Nault, B. A., Weinheimer, A., Hall, S. R., and Ullmann, K.: An investigation of petrochemical emissions during KORUS-AQ: Ozone production, reactive nitrogen evolution, and aerosol production, Elem. Sci. Anth., 10, 1, https://doi.org/10.1525/elementa.2022.00079, 2022.
Lee, Y. R., Huey, L. G., Tanner, D. J., Roberts, J. M., Wang, Y., Wennberg, P. O., Crounse, J. D., Allen, H., Apel, E. C., Hills, A. J., Hornbrook, R. S., Elkins, J. W., Hintsa, E., Moore, F., Hall, S. R., Ullmann, K., McKain, K., Sweeney, C., Ryerson, T. B., Peischl, J., Thompson, C. R., Bourgeois, I., Ray, E., Newman, P. A., and Strode, S.: Global observations of acetyl peroxynitrate (PAN) in the remote troposphere, Geophys. Res. Lett., 52, e2025GL115001, https://doi.org/10.1029/2025GL115001, 2025.
Li, J., Hao, Y., Simayi, M., Shi, Y., Xi, Z., and Xie, S.: Verification of anthropogenic VOC emission inventory through ambient measurements and satellite retrievals, Atmos. Chem. Phys., 19, 5905–5921, https://doi.org/10.5194/acp-19-5905-2019, 2019.
Li, K., Jacob, D. J., Shen, L., Lu, X., De Smedt, I., and Liao, H.: Increases in surface ozone pollution in China from 2013 to 2019: anthropogenic and meteorological influences, Atmos. Chem. Phys., 20, 11423–11433, https://doi.org/10.5194/acp-20-11423-2020, 2020.
Li, K., Jacob, D. J., Liao, H., Qiu, Y., Shen, L., Zhai, S., Bates, K. H., Sulprizio, M. P., Song, S., Lu, X., Zhang, Q., Zheng, B., Zhang, Y., Zhang, J., Lee, H. C., Kuk, S. K., and Zhang, Y.: Ozone pollution in the North China Plain spreading into the late-winter haze season, Proc. Natl. Acad. Sci. USA, 118, e2015797118, https://doi.org/10.1073/pnas.2015797118, 2021.
Lin, W., Xu, X., Ge, B., and Liu, X.: Gaseous pollutants in Beijing urban area during the heating period 2007–2008: variability, sources, meteorological, and chemical impacts, Atmos. Chem. Phys., 11, 8157–8170, https://doi.org/10.5194/acp-11-8157-2011, 2011.
Lindaas, J., Farmer, D. K., Pollack, I. B., Abeleira, A., Flocke, F., and Fischer, E. V.: Acyl peroxy nitrates link oil and natural gas emissions to high ozone abundances in the Colorado Front Range during summer 2015, J. Geophys. Res.-Atmos., 124, 2336–2350, https://doi.org/10.1029/2018JD028825, 2019.
Liu, X., Deming, B., Pagonis, D., Day, D. A., Palm, B. B., Talukdar, R., Roberts, J. M., Veres, P. R., Krechmer, J. E., Thornton, J. A., de Gouw, J. A., Ziemann, P. J., and Jimenez, J. L.: Effects of gas–wall interactions on measurements of semivolatile compounds and small polar molecules, Atmos. Meas. Tech., 12, 3137–3149, https://doi.org/10.5194/amt-12-3137-2019, 2019.
Liu, Z., Wang, Y., Gu, D., Zhao, C., Huey, L. G., Stickel, R., Liao, J., Shao, M., Zhu, T., Zeng, L., Liu, S.-C., Chang, C.-C., Amoroso, A., and Costabile, F.: Evidence of reactive aromatics as a major source of peroxyacetyl nitrate over China, Environ. Sci. Technol., 44, 7017–7022, https://doi.org/10.1021/es1007966, 2010.
Lu, K., Fuchs, H., Hofzumahaus, A., Tan, Z., Wang, H., Zhang, L., Schmitt, S. H., Rohrer, F., Bohn, B., Broch, S., Dong, H., Gkatzelis, G. I., Hohhaus, T., Holland, F., Li, X., Liu, Y., Liu, Y., Ma, X., Novelli, A., Schlag, P., Shao, M., Wu, Y., Wu, Z., Zeng, L., Hu, M., Kiendler-Scharr, A., Wahner, A., and Zhang, Y.: Fast photochemistry in wintertime haze: consequences for pollution mitigation strategies, Environ. Sci. Technol., 53, 10676–10684, https://doi.org/10.1021/acs.est.9b02422, 2019.
MacFarlane, S. M., Fisher, J. A., Xu, L., Wennberg, P. O., Crounse, J. D., Ball, K., Zhai, S., Bates, K. H., Kim, Y., Zhang, Q., and Blake, D. R.: Sources, sinks, and oxidation pathways of phenolic compounds in South Korea constrained using KORUS-AQ airborne observations, J. Geophys. Res.-Atmos., 130, e2024JD043110, https://doi.org/10.1029/2024JD043110, 2025.
McDonald, B. C., de Gouw, J. A., Gilman, J. B., Jathar, S. H., Akherati, A., Cappa, C. D., Jimenez, J. L., Lee-Taylor, J., Hayes, P. L., McKeen, S. A., Cui, Y. Y., Kim, S.-W., Gentner, D. R., Isaacman-VanWertz, G., Goldstein, A. H., Harley, R. A., Frost, G. J., Roberts, J. M., Ryerson, T. B., Trainer, M., Jimenez, J. L., Lee-Taylor, J., Hayes, P. L., McKeen, S. A., Cui, Y. Y., Kim, S.-W., Gentner, D. R., Isaacman-VanWertz, G., Goldstein, A. H., Harley, R. A., Frost, G. J., Roberts, J. M., Ryerson, T. B., and Trainer, M.: Volatile chemical products emerging as largest petrochemical source of urban organic emissions, Science, 359, 760–764, https://doi.org/10.1126/science.aaq0524, 2018.
Millet, D. B., Guenther, A., Siegel, D. A., Nelson, N. B., Singh, H. B., de Gouw, J. A., Warneke, C., Williams, J., Eerdekens, G., Sinha, V., Karl, T., Flocke, F., Apel, E., Riemer, D. D., Palmer, P. I., and Barkley, M.: Global atmospheric budget of acetaldehyde: 3-D model analysis and constraints from in-situ and satellite observations, Atmos. Chem. Phys., 10, 3405–3425, https://doi.org/10.5194/acp-10-3405-2010, 2010.
Nault, B. A., Campuzano-Jost, P., Day, D. A., Schroder, J. C., Anderson, B., Beyersdorf, A. J., Blake, D. R., Brune, W. H., Choi, Y., Corr, C. A., de Gouw, J. A., Dibb, J., DiGangi, J. P., Diskin, G. S., Fried, A., Huey, L. G., Kim, M. J., Knote, C. J., Lamb, K. D., Lee, T., Park, T., Pusede, S. E., Scheuer, E., Thornhill, K. L., Woo, J.-H., and Jimenez, J. L.: Secondary organic aerosol production from local emissions dominates the organic aerosol budget over Seoul, South Korea, during KORUS-AQ, Atmos. Chem. Phys., 18, 17769–17800, https://doi.org/10.5194/acp-18-17769-2018, 2018.
Nault, B. A., Travis, K. R., Crawford, J. H., Blake, D. R., Campuzano-Jost, P., Cohen, R. C., DiGangi, J. P., Diskin, G. S., Hall, S. R., Huey, L. G., Jimenez, J. L., Min, K.-E., Lee, Y. R., Simpson, I. J., Ullmann, K., and Wisthaler, A.: Using observed urban NOx sinks to constrain VOC reactivity and the ozone and radical budget in the Seoul Metropolitan Area, Atmos. Chem. Phys., 24, 9573–9595, https://doi.org/10.5194/acp-24-9573-2024, 2024.
Nishino, N., Arey, J., and Atkinson, R.: Formation yields of glyoxal and methylglyoxal from the gas-phase OH radical-initiated reactions of toluene, xylenes, and trimethylbenzenes as a function of NO2 concentration, J. Phys. Chem. A, 114, 10140–10147, https://doi.org/10.1021/jp105112h, 2010.
Oak, Y. J., Park, R. J., Schroeder, J. R., Crawford, J. H., Blake, D. R., Weinheimer, A. J., Woo, J.-H., Kim, S.-W., Yeo, H., Fried, A., Wisthaler, A., and Brune, W. H.: Evaluation of simulated O3 production efficiency during the KORUS-AQ campaign: Implications for anthropogenic NOx emissions in Korea, Elem. Sci. Anth., 7, 56, https://doi.org/10.1525/elementa.394, 2019.
Olson, J. R., Crawford, J. H., Chen, G., Brune, W. H., Faloona, I. C., Tan, D., Harder, H., and Martinez, M.: A reevaluation of airborne HOx observations from NASA field campaigns, J. Geophys. Res.-Atmos., 111, D10301, https://doi.org/10.1029/2005JD006617, 2006.
Orlando, J. J. and Tyndall, G. S.: Mechanisms for the Reactions of OH with Two Unsaturated Aldehydes: Crotonaldehyde and Acrolein, J. Phys. Chem. A., 106, 12252–12259, https://doi.org/10.1021/jp021530f, 2002.
Perring, A. E., Pusede, S. E., and Cohen, R. C.: An observational perspective on the atmospheric impacts of alkyl and multifunctional nitrates on ozone and secondary organic aerosol, Chem. Rev., 113, 5848–5870, https://doi.org/10.1021/cr300520x, 2013.
Qiu, Y., Ma, Z., and Li, K.: A modeling study of the peroxyacetyl nitrate (PAN) during a wintertime haze event in Beijing, China, Sci. Total Environ., 650, 1944–1953, https://doi.org/10.1016/j.scitotenv.2018.09.253, 2019.
Qiu, Y., Ma, Z., Li, K., Lin, W., Tang, Y., Dong, F., and Liao, H.: Markedly enhanced levels of peroxyacetyl nitrate (PAN) during COVID-19 in Beijing, Geophys. Res. Lett., 47, e2020GL089623, https://doi.org/10.1029/2020GL089623, 2020.
Reinecke, T., Leiminger, M., Jordan, A., Wisthaler, A., and Müller, M.: Ultrahigh sensitivity PTR-MS instrument with a well-defined ion chemistry, Anal. Chem., 95, 11879–11884, https://doi.org/10.1021/acs.analchem.3c02669, 2023.
Roberts, J. M.: PAN and related compounds, in: Volatile organic compounds in the atmosphere, Blackwell Publishing Ltd., 221–268, https://doi.org/10.1002/9780470988657.ch6, 2007.
Roberts, J. M., Marchewka, M., Bertman, S. B., Goldan, P., Kuster, W., de Gouw, J., Warneke, C., Williams, E., Lerner, B., Murphy, P., Apel, E., and Fehsenfeld, F. C.: Analysis of the isoprene chemistry observed during the New England Air Quality Study (NEAQS) 2002 intensive experiment, J. Geophys. Res.-Atmos., 111, D23S12, https://doi.org/10.1029/2006JD007570, 2006.
Roberts, J. M., Neuman, J. A., Brown, S. S., Veres, P. R., Coggon, M. M., Stockwell, C. E., Warneke, C., Peischl, J., and Robinson, M. A.: Furoyl peroxynitrate (fur-PAN), a product of VOC–NOx photochemistry from biomass burning emissions: photochemical synthesis, calibration, chemical characterization, and first atmospheric observations, Environ. Sci. Atmos., 2, 1087–1097, https://doi.org/10.1039/d2ea00068g, 2022.
Robinson, E. S., Tehrani, M. W., Yassine, A., Agarwal, S., Nault, B. A., Gigot, C., Chiger, A. A., Lupolt, S. N., Daube, C., Avery, A. M., Claflin, M. S., Stark, H., Lunny, E. M., Roscioli, J. R., Herndon, S. C., Skog, K., Bent, J., Koehler, K., Rule, A. M., Burke, T., Yacovitch, T. I., Nachman, K., and DeCarlo, P. F.: Ethylene oxide in southeastern Louisiana's petrochemical corridor: High spatial resolution mobile monitoring during HAP-MAP, Environ. Sci. Technol., 58, 11084–11095, https://doi.org/10.1021/acs.est.3c10579, 2024.
Romer, P. S., Zare, A., and Cohen, R. C.: The changing role of organic nitrates in the removal and transport of NOx, Atmos. Chem. Phys., 20, 267–279, https://doi.org/10.5194/acp-20-267-2020, 2020.
Rosen, R. S., Wood, E. C., Wooldridge, P. J., Thornton, J. A., Day, D. A., Kuster, W., Williams, E. J., Jobson, B. T., and Cohen, R. C.: Observations of total alkyl nitrates during Texas Air Quality Study 2000: Implications for O3 and alkyl nitrate photochemistry, J. Geophys. Res.-Atmos., 109, D07303, https://doi.org/10.1029/2003JD004227, 2004.
Ryerson, T. B., Trainer, M., Angevine, W. M., Brock, C. A., Dissly, R. W., Fehsenfeld, F. C., Frost, G. J., Goldan, P. D., Holloway, J. S., Hübler, G., Jakoubek, R. O., Kuster, W. C., Neuman, J. A., Nicks Jr., D. K., Parrish, D. D., Roberts, J. M., Sueper, D. T., Atlas, E. L., Donnelly, S. G., Flocke, F., Fried, A., Potter, W. T., Schauffler, S., Stroud, V., Weinheimer, A. J., Wert, B. P., Wiedinmyer, C., Alvarez, R. J., Banta, R. M., Darby, L. S., and Senff, C. J.: Effect of petrochemical industrial emissions of reactive alkenes and NOx on tropospheric ozone formation in Houston, Texas, J. Geophys. Res.-Atmos., 108, 4249, https://doi.org/10.1029/2002JD003070, 2003.
Savic, A., Gil, J., Cha, J., Lee, M., Choi, Y., and Park, M.-S.: Exploring the long-term variations and high concentration episodes of peroxyacetyl nitrate in Megacity Seoul, Atmos. Environ., 2024, 120821, https://doi.org/10.1016/j.atmosenv.2024.120821, 2024.
Schroeder, J. R., Crawford, J. H., Ahn, J.-Y., Chang, L., Fried, A., Walega, J., Weinheimer, A., Montzka, D. D., Hall, S. R., Ullmann, K., Wisthaler, A., Mikoviny, T., Chen, G., Blake, D. R., Blake, N. J., Hughes, S. C., Meinardi, S., Diskin, G., DiGangi, J. P., Choi, Y., Pusede, S. E., Huey, G. L., Tanner, D. J., Kim, M., and Wennberg, P.: Observation-based modeling of ozone chemistry in the Seoul metropolitan area during the Korea–United States Air Quality Study (KORUS-AQ), Elem. Sci. Anth., 8, 3, https://doi.org/10.1525/elementa.400, 2020.
Simpson, I. J., Blake, D. R., Blake, N. J., Meinardi, S., Barletta, B., Hughes, S. C., Fleming, L. T., Crawford, J. H., Diskin, G. S., Emmons, L. K., Fried, A., Guo, H., Peterson, D. A., Wisthaler, A., Woo, J.-H., Barré, J., Gaubert, B., Kim, J., Kim, M. J., Kim, Y., Knote, C., Mikoviny, T., Pusede, S. E., Schroeder, J. R., Wang, Y., Wennberg, P. O., and Zeng, L.: Characterization, sources and reactivity of volatile organic compounds (VOCs) in Seoul and surrounding regions during KORUS-AQ, Elem. Sci. Anth., 8, 37, https://doi.org/10.1525/elementa.434, 2020.
Slusher, D. L., Huey, L. G., Tanner, D. J., Flocke, F. M., and Roberts, J. M.: A thermal dissociation–chemical ionization mass spectrometry (TD-CIMS) technique for the simultaneous measurement of peroxyacyl nitrates and dinitrogen pentoxide, J. Geophys. Res.-Atmos., 109, D19315, https://doi.org/10.1029/2004JD004670, 2004.
Stein, A. F., Draxler, R. R., Rolph, G. D., Stunder, B. J. B., Cohen, M. D., and Ngan, F: NOAA's HYSPLIT atmospheric transport and dispersion modeling system, B. Am. Meteorol. Soc., 96, 2059–2077, https://doi.org/10.1175/BAMS-D-14-00110.1, 2015.
Tan, Z., Rohrer, F., Lu, K., Ma, X., Bohn, B., Broch, S., Dong, H., Fuchs, H., Gkatzelis, G. I., Hofzumahaus, A., Holland, F., Li, X., Liu, Y., Liu, Y., Novelli, A., Shao, M., Wang, H., Wu, Y., Zeng, L., Hu, M., Kiendler-Scharr, A., Wahner, A., and Zhang, Y.: Wintertime photochemistry in Beijing: observations of ROx radical concentrations in the North China Plain during the BEST-ONE campaign, Atmos. Chem. Phys., 18, 12391–12411, https://doi.org/10.5194/acp-18-12391-2018, 2018.
Toma, S., Bertman, S., Groff, C., Xiong, F., Shepson, P. B., Romer, P., Duffey, K., Wooldridge, P., Cohen, R., Baumann, K., Edgerton, E., Koss, A. R., de Gouw, J., Goldstein, A., Hu, W., and Jimenez, J. L.: Importance of biogenic volatile organic compounds to acyl peroxy nitrates (APN) production in the southeastern US during SOAS 2013, Atmos. Chem. Phys., 19, 1867–1880, https://doi.org/10.5194/acp-19-1867-2019, 2019.
Travis, K. R., Nault, B. A., Crawford, J. H., Bates, K. H., Blake, D. R., Cohen, R. C., Fried, A., Hall, S. R., Huey, L. G., Lee, Y. R., Meinardi, S., Min, K.-E., Simpson, I. J., and Ullman, K.: Impact of improved representation of volatile organic compound emissions and production of NOx reservoirs on modeled urban ozone production, Atmos. Chem. Phys., 24, 9555–9572, https://doi.org/10.5194/acp-24-9555-2024, 2024.
von Schneidemesser, E., McDonald, B. C., Denier van der Gon, H., Crippa, M., Guizzardi, D., Borbon, A., Dominutti, P., Huang, G., Janssens-Maenhout, G., Li, M., Ou-Yang, C.-F., Tisiniar, S., and Wang, J.-L.: Comparing urban anthropogenic NMVOC measurements with representation in emission inventories—A global perspective, J. Geophys. Res.-Atmos., 128, e2022JD037906, https://doi.org/10.1029/2022JD037906, 2023.
Wolfe, G. and Haskins, J.: AirChem/F0AM: v4.3.0.1 (v4.3.0.1), Zenodo [code], https://doi.org/10.5281/zenodo.10069985, 2023.
Wolfe, G. M., Marvin, M. R., Roberts, S. J., Travis, K. R., and Liao, J.: The Framework for 0-D Atmospheric Modeling (F0AM) v3.1, Geosci. Model Dev., 9, 3309–3319, https://doi.org/10.5194/gmd-9-3309-2016, 2016.
Xu, W., Zhang, G., Wang, Y., Tong, S., Zhang, W., Ma, Z., Lin, W., Kuang, Y., Yin, L., and Xu, X.: Aerosol promotes peroxyacetyl nitrate formation during winter in the North China Plain, Environ. Sci. Technol., 55, 3568–3581, https://doi.org/10.1021/acs.est.0c08157, 2021.
Zhai, S., Jacob, D. J., Wang, X., Shen, L., Li, K., Zhang, Y., Gui, K., Zhao, T., and Liao, H.: Fine particulate matter (PM2.5) trends in China, 2013–2018: separating contributions from anthropogenic emissions and meteorology, Atmos. Chem. Phys., 19, 11031–11041, https://doi.org/10.5194/acp-19-11031-2019, 2019.
Zheng, W., Flocke, F. M., Tyndall, G. S., Swanson, A., Orlando, J. J., Roberts, J. M., Huey, L. G., and Tanner, D. J.: Characterization of a thermal decomposition chemical ionization mass spectrometer for the measurement of peroxy acyl nitrates (PANs) in the atmosphere, Atmos. Chem. Phys., 11, 6529–6547, https://doi.org/10.5194/acp-11-6529-2011, 2011.
- Abstract
- Introduction
- Methods and data analysis
- Observations of PANs over the Korean Peninsula and the Yellow Sea
- Observation-based kinetic calculations and box modeling for diagnosis of VOC–NOx photochemistry
- Conclusion
- Code and data availability
- Author contributions
- Competing interests
- Disclaimer
- Acknowledgements
- Financial support
- Review statement
- References
- Supplement