the Creative Commons Attribution 4.0 License.
the Creative Commons Attribution 4.0 License.
 | 17 Jun 2026
Gas-particle partitioning, molecular weight, and yield of organic nitrate under different urban VOC, NOx, and oxidation conditions during SAPHIR-CHANEL campaign
Farhan R. Nursanto
Quanfu He
Sophia van de Wouw
Annika Zanders
Thorsten Hohaus
Willem S. J. Kroese
Robert Wegener
Max Gerrit Adam
Benjamin Winter
René Dubus
Lukas Kesper
Franz Rohrer
Yuwei Wang
Emily Matthews
Aristeidis Voliotis
Thomas J. Bannan
Gordon McFiggans
Yizhen Wu
Milan Roska
Manjula Canagaratna
Mitch Alton
Matthew M. Coggon
Chelsea E. Stockwell
Kelvin H. Bates
Eva Y. Pfannerstill
Sören R. Zorn
Matthieu Riva
Sebastien Perrier
Boxing Yang
Anna Novelli
Michelle Färber
Hendrik Fuchs
Andrea Carolina Marcillo Lara
Achim Grasse
Christian Wesolek
Ralf Tillmann
Rupert Holzinger
Maarten C. Krol
Georgios I. Gkatzelis
Oxidation of volatile organic compounds (VOCs) involving hydroxyl radicals (OH•) and nitrogen oxides (NOx), or nitrate radicals (NO3•) forms organic nitrates that undergo gas-particle partitioning, changing the lifetime of nitrogen and their deposition on ecosystems. In urban areas, VOC composition is complex, with contributions from traffic, cooking, volatile chemical products (VCPs), and biogenic emissions. Secondary organic aerosol (SOA) formation from urban VOC mixtures was investigated using chamber experiments during the SAPHIR-CHANEL campaign under realistic VOC-NOx and oxidation conditions. The yield of total organic nitrates is higher for precursor mixtures with a higher percentage of unsaturated VOCs, such as those from traffic and cooking sources (11 %–21 %), compared to VCPs and complex urban emission replicas (2 %–7 %). Enhanced particle-phase partitioning is observed under nighttime oxidation (by NO3•) versus daytime oxidation (by OH•). Particulate organic nitrates have a higher average molecular weight under nighttime conditions (330 ± 80 g mol−1) than under daytime conditions (250 ± 30 g mol−1) mainly due to a higher dimer fraction. Similarly, the mass fraction of the total organic aerosol that is organic nitrate is 2.6–4.5 times higher under nighttime than daytime conditions, likely due to higher molecular weight and lower temperatures. Although gas-phase organic nitrate composition varies substantially between precursor mixtures, bulk organic nitrate partitioning is generally similar to that of modeled oxidized monoterpene nitrates (10−4–10−2 m3 µg−1 at 18–40 °C). These findings improve understanding of bulk organic nitrate sources and properties in complex urban environments, allowing better simulations of air quality and nitrate deposition.
- Article
(3845 KB) - Full-text XML
-
Supplement
(4608 KB) - BibTeX
- EndNote


As sulfur oxide emissions decrease due to emission controls, reactive nitrogen species are becoming increasingly important atmospheric constituents, in particular for the formation of secondary aerosols. The term “total odd nitrogen species” (NOy) is commonly used to refer to reactive nitrogen species, which include nitrogen oxides (]) and NOx reservoir species (NOz). NOz includes chemical species such as nitrate radical (NO3•), nitrogen pentoxide (N2O5), nitric acid (HNO3), nitrous acid (HONO), organic nitrates (ON; e.g., alkyl nitrates (RONO2), peroxy nitrates (RO2NO2)), and inorganic nitrate ().
Several modeling studies have shown that particulate nitrate is becoming the principal component of continental aerosols on both the global and regional scales (Adams et al., 1999; Metzger, 2002; Liao et al., 2003; Rodriguez and Dabdub, 2004; Feng and Penner, 2007; Bauer et al., 2007; Paulot et al., 2016; Bian et al., 2017; Vasilakos et al., 2018; Drugé et al., 2019; Lu et al., 2021). The climatic impact of nitrates through aerosol radiative forcing modification is predicted to become larger than sulfate in the upcoming century (Adams et al., 2001; Schaap et al., 2004; Liao et al., 2003; Bauer et al., 2007; Erisman et al., 2011; Westervelt et al., 2015). Some regions of Northwestern Europe with relatively higher nitrogen emissions, compared to the rest of Europe, already experience greater importance of nitrate than sulfate aerosol. For instance, in the Netherlands, inorganic nitrate in the form of ammonium nitrate (NH4NO3) makes up the majority of ambient aerosol mass (Schaap et al., 2004; Schlag et al., 2016; Nursanto et al., 2023).
Although inorganic nitrate is dominant, the contribution of ambient ON is not negligible. With spatial and seasonal variability, the average mass fraction of particulate nitrate in forms of ON varies from 9.8 % in winter Beijing, China (Xu et al., 2021), 13 % in Barcelona, Spain (Mohr et al., 2012; Pandolfi et al., 2014), 17 %–31 % for annual average in China (Yu et al., 2024), up to 34 %–44 % in Europe (Kiendler-Scharr et al., 2016) and 20 %–60 % in the Netherlands during spring and summer (Nursanto et al., 2025). ON can play a significant role in secondary organic aerosol (SOA). ONs have variable atmospheric multiphase lifetimes ranging from 12–97 h for non-hydrolyzable small RONO2 and from 2–15 h for non-hydrolyzable isoprene and terpene nitrates (González-Sánchez et al., 2023), different compared to the lifetime of NOx, 2–29 h (Singh, 1987; Ryerson et al., 1998; Nunnermacker et al., 2000; Valin et al., 2013; Romer et al., 2016; Kenagy et al., 2018; Lange et al., 2022). Thus, ONs can modify the overall atmospheric lifetime of reactive nitrogen species, transport distance, and therefore the natural areas affected by nitrogen deposition. Therefore, it is important to identify ON compounds formed in the atmosphere and to understand their precursor emissions and the chemical processes they undergo to assess their impact on ecosystems.
NOx is mainly introduced to the atmosphere via combustion emissions, and involved in the oxidation of volatile organic compounds (VOCs) produced from different sources in the troposphere. The fate of NOx emissions is illustrated in Fig. 1, showing that it can end up in the particulate phase as NH4NO3 or ON. ONs are typically formed at first in the gas phase, either by the reaction between organic peroxy radicals (RO2•) and NOx or between NO3• and VOCs (the latter is usually considered nighttime chemistry, because the NO3• photodissociates and reacts with NO rapidly during the day). These species can then condense into the particle phase or undergo further reactions, forming SOA. The condensation of organic compounds depends on many factors, such as the temperature, relative humidity, and oxidation level of the compound (Kroll and Seinfeld, 2008). In urban mixtures with various VOC sources, the variety of produced ON compounds is still largely unknown. Because much ON chemistry is not well understood, this component of SOA is likely to be poorly estimated in models.
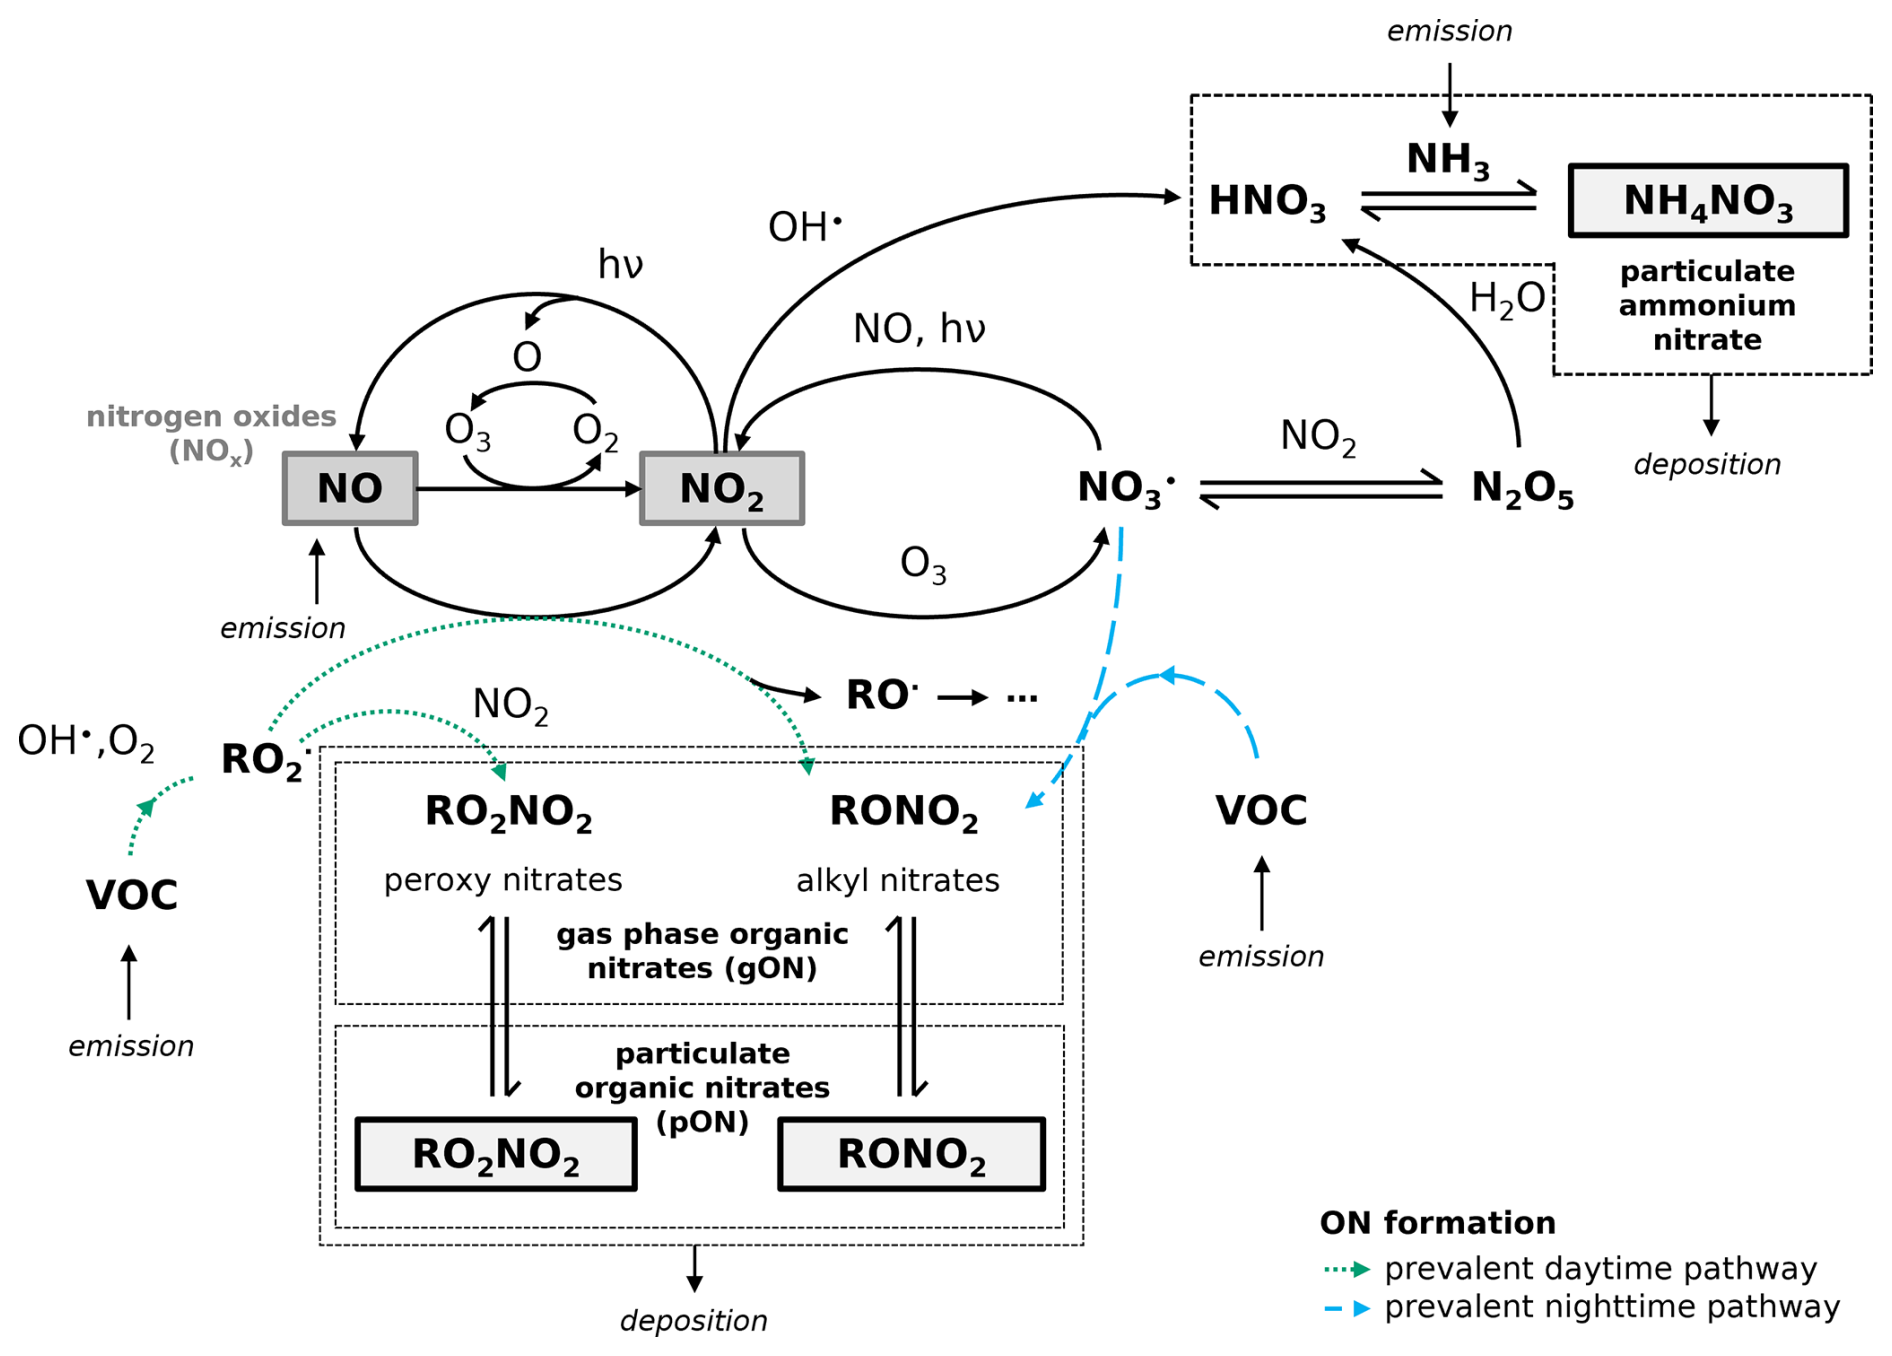
Figure 1Reactive nitrogen species formation in the troposphere involving emissions of NOx, NH3, VOCs, and their reactions with oxidants (e.g., OH•, and NO3•) to form particulate ammonium nitrate (NH4NO3) and ONs that are in equilibrium between gas phase ON (gON) and particulate ON (pON). The dashed blue arrows represent the NO3• chemistry pathway for ON formation prevalent during nighttime, while the dotted green arrows represent the OH• chemistry pathway for ON formation prevalent during daytime.
Although single VOC precursor experiments are helpful in determining the chemical mechanisms of SOA formation, the interactions between the products of different precursors can lead to significant differences in particle composition, volatility, and SOA yields (McFiggans et al., 2019; Voliotis et al., 2021, 2022; Shao et al., 2022). As the VOCs from fossil fuel-related emissions are decreasing, several studies have shown that non-traffic SOA precursors such as volatile chemical products (VCPs) originating from household cleaning and personal care products as well as cooking emissions are becoming increasingly important in urban VOC chemistry (McDonald et al., 2018; Coggon et al., 2021; Gkatzelis et al., 2021; Wernis et al., 2022; Coggon et al., 2024; Rivellini et al., 2024). VCPs and cooking VOCs are expected to increasingly dominate SOA formation from anthropogenic VOCs in the urban environment of industrialized countries.
In summer 2024, the SAPHIR (Simulation of Atmospheric Photochemistry in a Large Reaction Chamber) atmospheric simulation chamber at Forschungszentrum Jülich was used during the “Household Chemicals Amplifying Urban Aerosol Pollution” (CHANEL) campaign to replicate complex urban VOC-NOx chemistry (Wu et al., 2026). This paper focuses on understanding the differences in the yield, average molecular weight, and gas-particle partitioning of organic nitrate formation from different VOC precursor mixtures under various NO levels and oxidation conditions. We identify the ON compounds and their bulk volatility in the selected urban mixture to fill the knowledge gap and enable modelers to improve the simulation of nitrate aerosol formation, transport, and deposition in real-world atmospheric mixtures.
2.1 SAPHIR-CHANEL campaign
The SAPHIR-CHANEL 2024 campaign focused on understanding SOA formation from different co-emitted urban VOC precursors under various NOx emission scenarios and oxidation conditions (Wu et al., 2026). Based on emission inventories from the Atmospheric Emissions and Reactions Observed from Megacities to Marine Area (AEROMMA) 2023 campaign and previous studies (Warneke et al., 2023; Pfannerstill et al., 2024; Stockwell et al., 2025), the major atmospheric chemical conditions in the urban atmospheres of United States and European cities were replicated by oxidizing various VOC mixtures and mixed systems inside the SAPHIR chamber. SAPHIR is an outdoor cylindrical chamber (length=18 m, diameter=5 m, and volume=270 m3) made of double-wall Teflon film that allows investigation of gas phase species oxidation, aerosol formation and chemical transformation with a minor influence from the chamber wall (Rohrer et al., 2005; Bossmeyer et al., 2006; Wegener et al., 2007; Brauers et al., 2007; Apel et al., 2008). The chamber is equipped with a shutter roof system that allows exposure or blocking of sunlight to simulate daytime and nighttime chemistry.
Three variables were controlled for the experiments: VOC composition, NO level, and oxidation conditions, as listed in Table 1. The VOC precursor mixtures representing different urban emission sources used throughout the campaign are shown in Fig. 2 and Tables S1–S5 in the Supplement. These include biogenic and anthropogenic VOCs, such as single-compound experiments of limonene, multi-injection source-specific experiments of VCP, diesel, gasoline, and cooking emissions, as well as complex urban mixtures. The discussion of the VOC composition for each emission source is detailed in Wu et al. (2026). A more complex urban VOC mixture was represented by the Los Angeles anthropogenic emission profile, which combines VCPs, cooking emissions, traffic emissions (100 % gasoline) (Coggon et al., 2024; Stockwell et al., 2025). We further investigated the SOA formation by combining the Los Angeles anthropogenic mixture with biogenic VOC (BVOC) emissions to replicate a real-world emission profile (Pfannerstill et al., 2024). We also replicated a global city scenario where we have different traffic emission profile (50 % gasoline, 50 % diesel) representing European and global cities following Scholz et al. (2025). Lastly, we performed an experimental scenario for future cities, where there is more influence from biogenic emissions and less from traffic (no traffic emissions and low NO) compared to the current day Los Angeles and global city emission profile. The experiments explored in this paper do not cover all the experiments performed during the SAPHIR-CHANEL campaign.
Table 1List of experiments in the SAPHIR-CHANEL 2024 campaign included in this paper, grouped based on VOC precursors. The average photolysis rate coefficient of NO2 (, in s−1) is also provided for each experiment under daytime conditions; nighttime experiments assume . All experiments were run at initially 60 % relative humidity (RH), unless indicated otherwise.
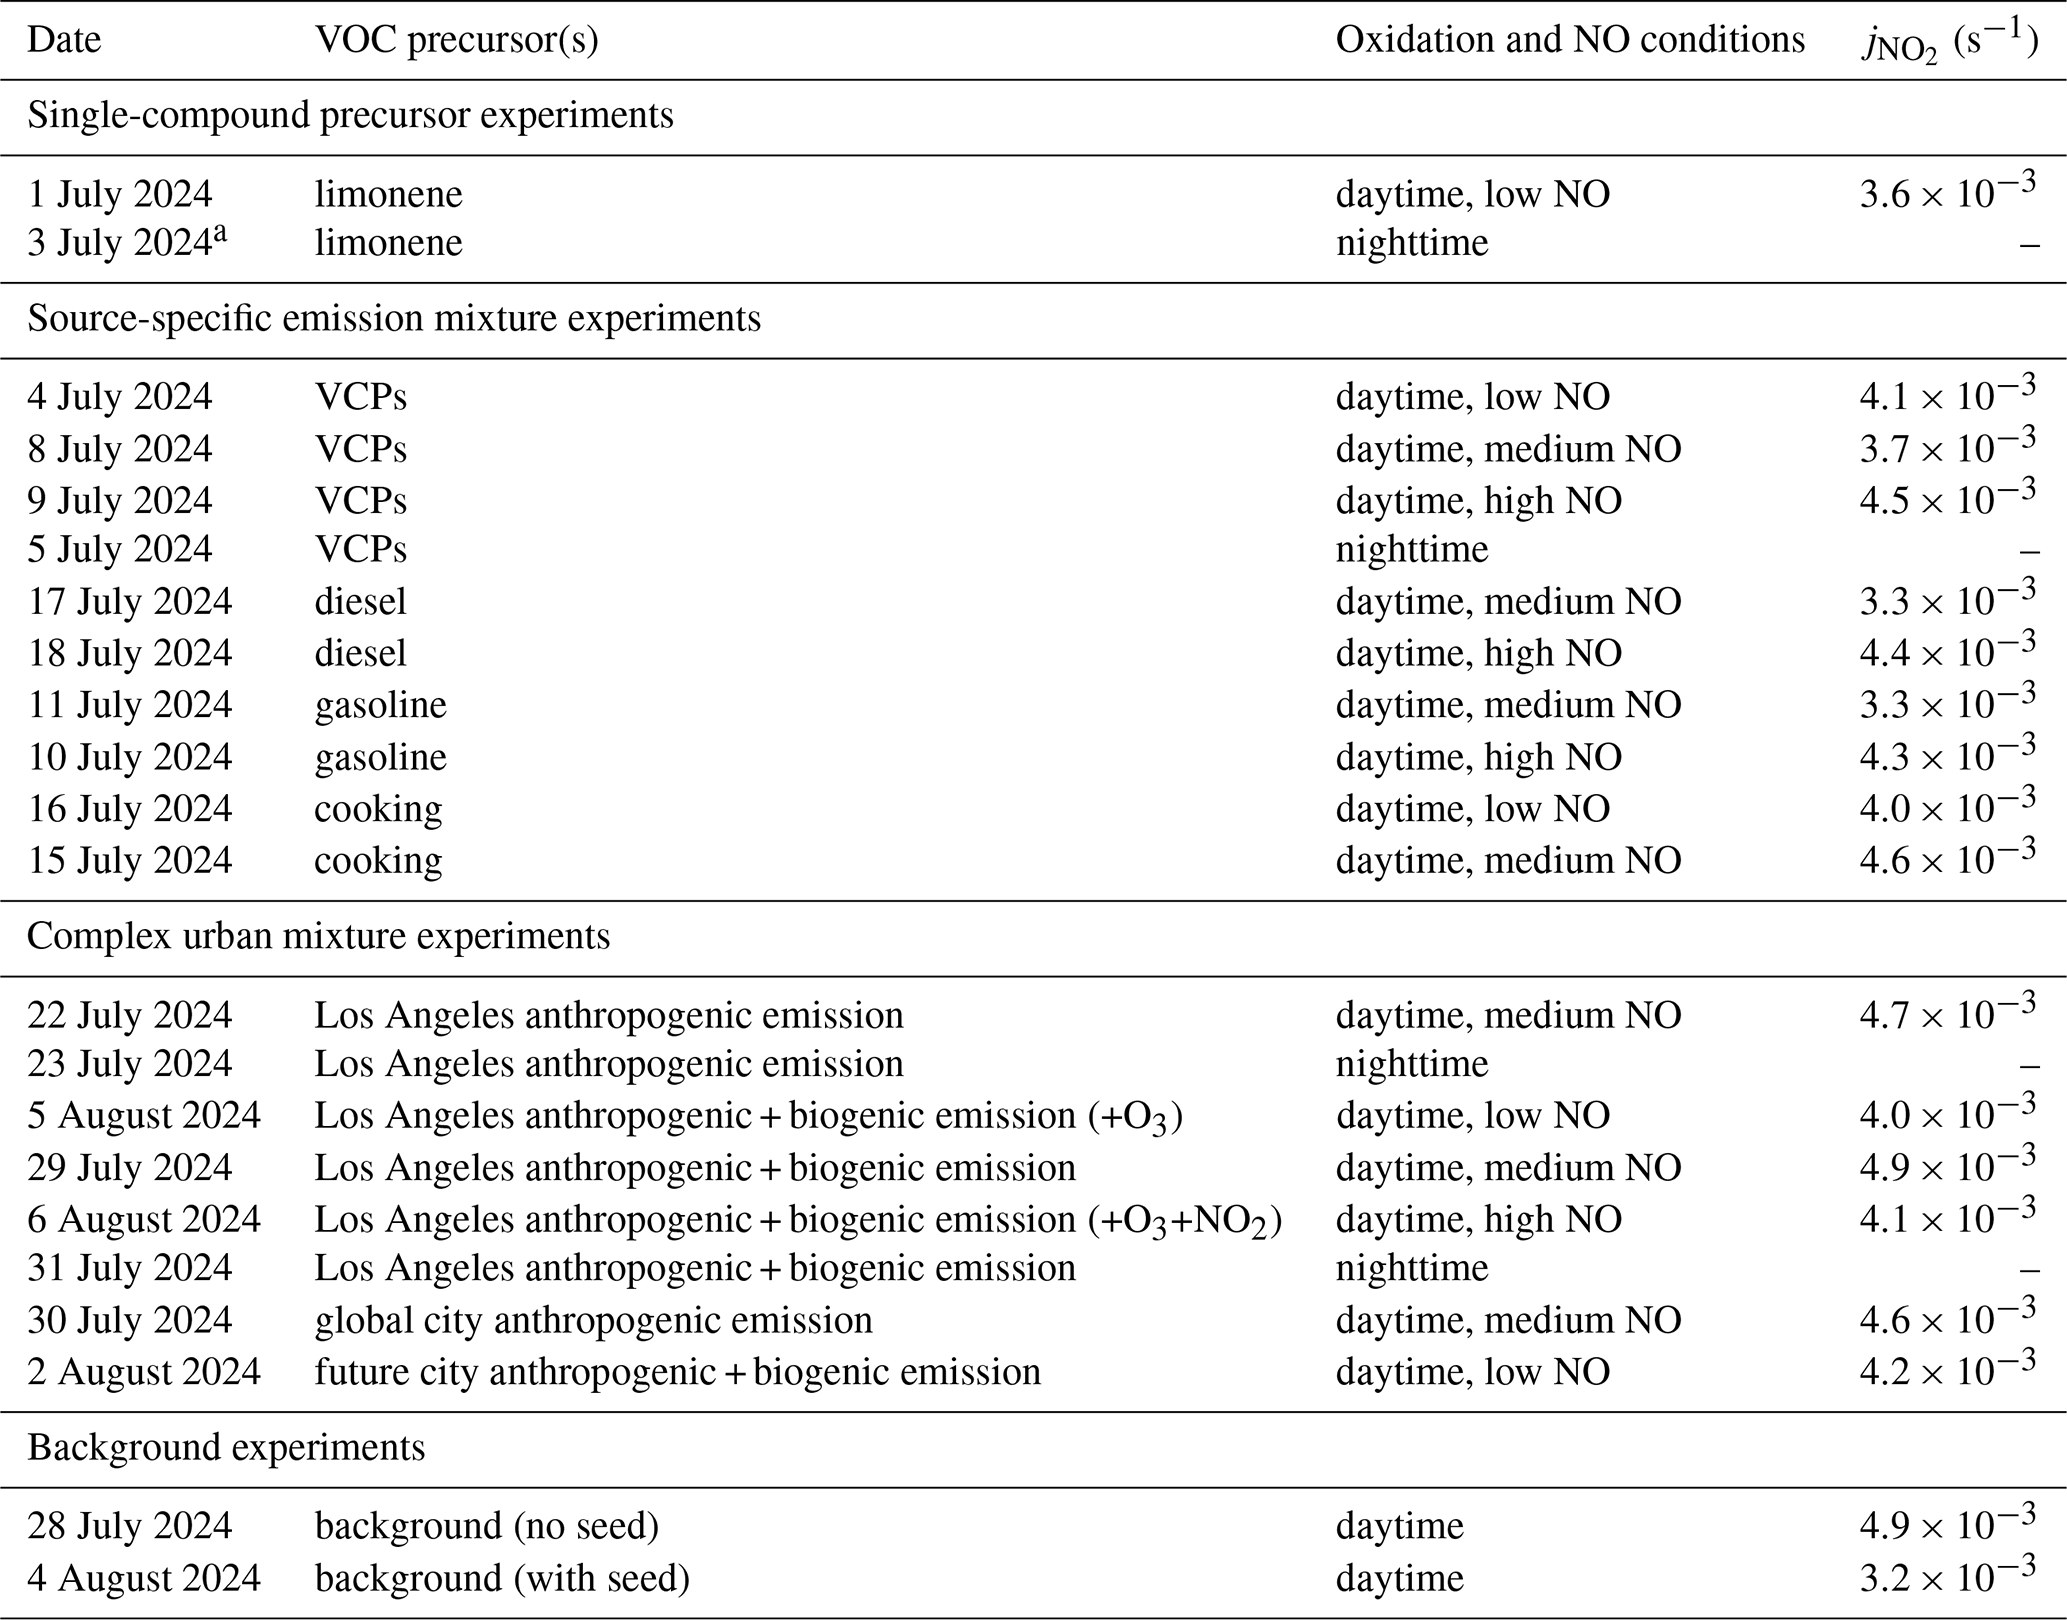
a Initial RH 20 %.
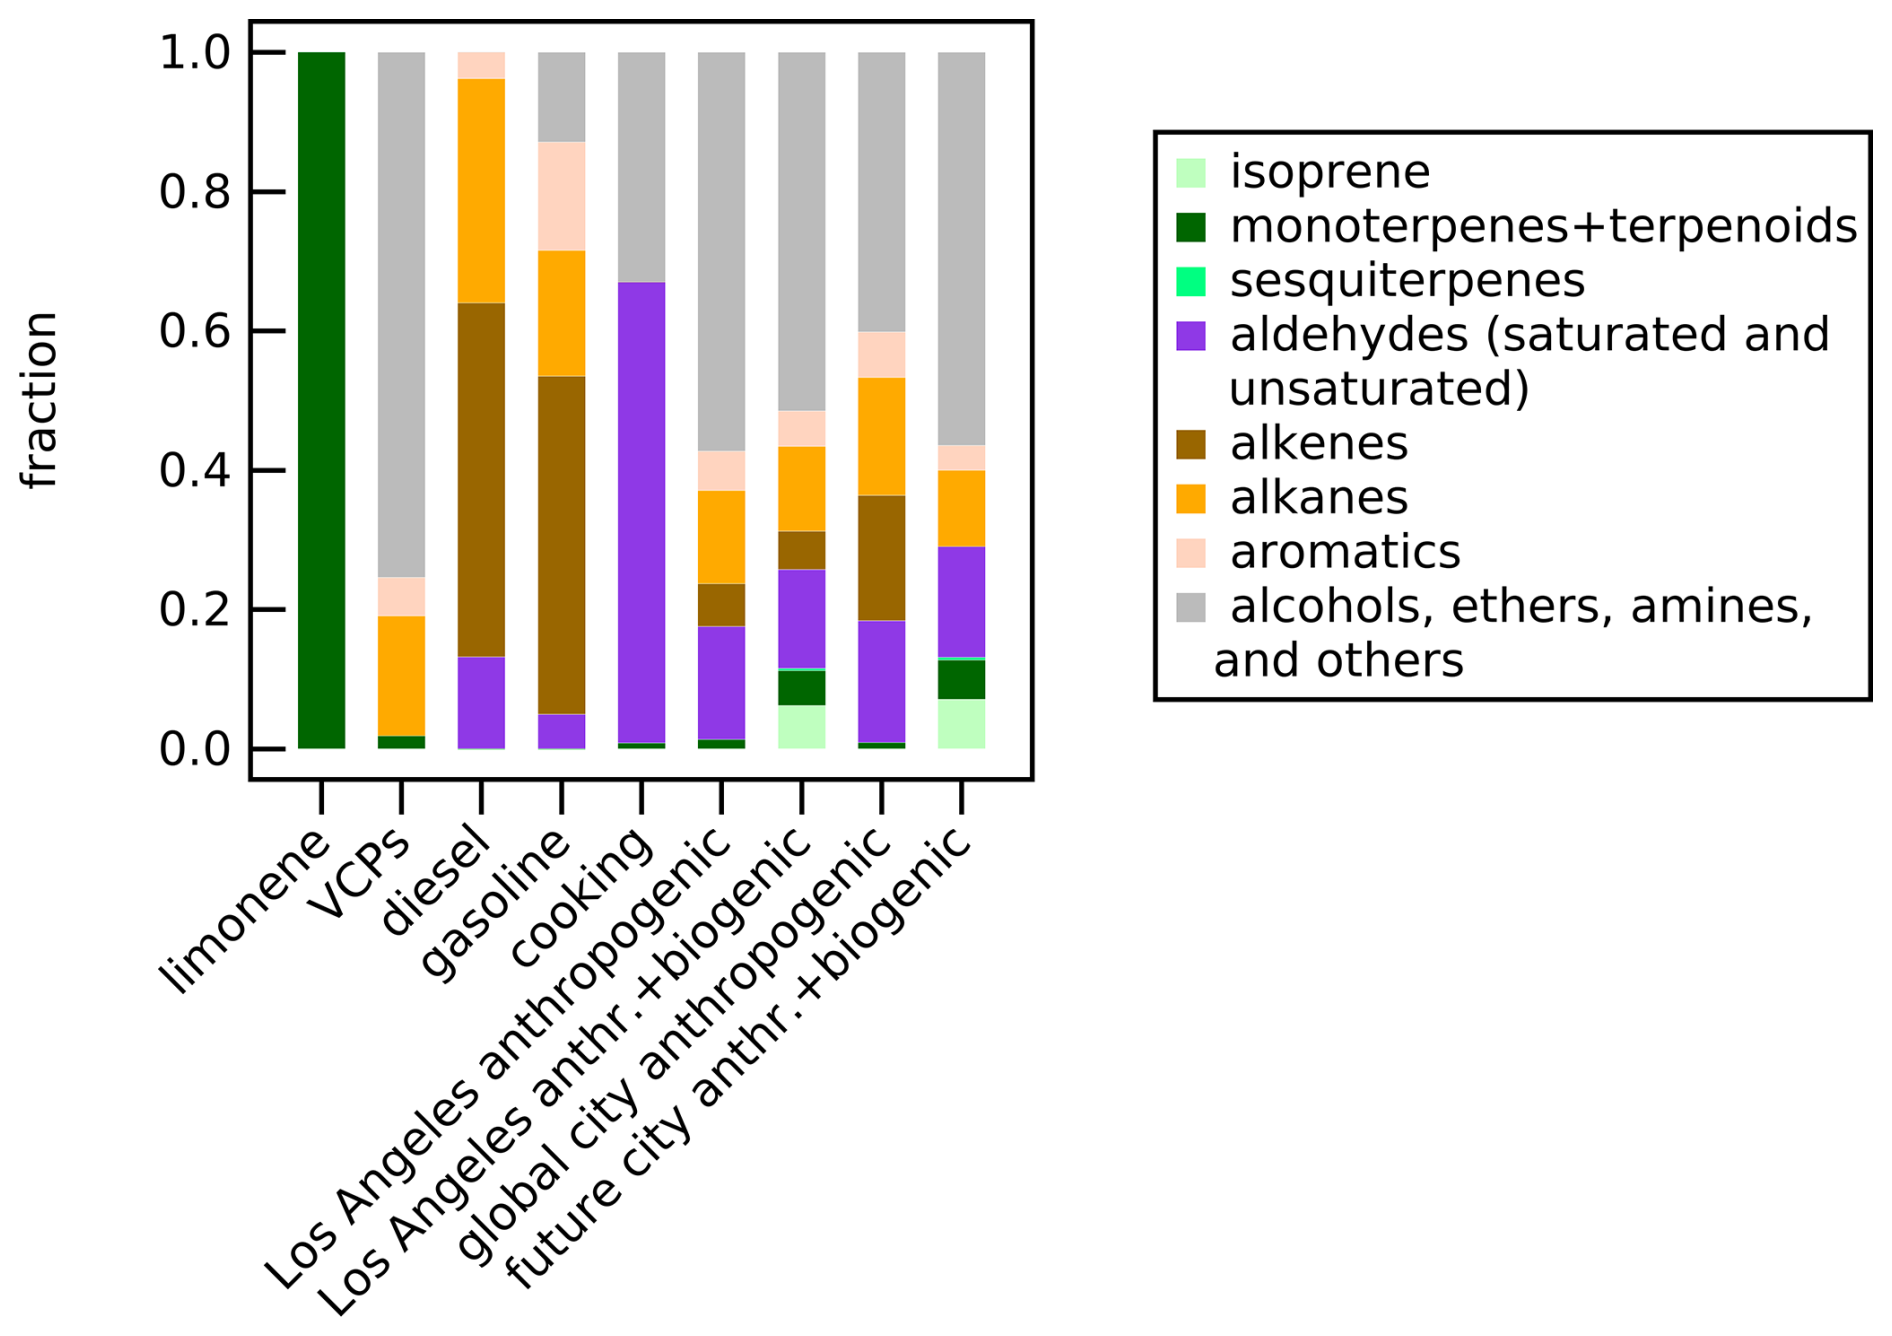
Figure 2Relative VOC composition (calculated using mixing ratios) categorized by compound family for each urban VOC mixture injected into the SAPHIR chamber during the SAPHIR-CHANEL 2024 campaign. The composition is based on the fingerprint compounds in the adjusted emission inventories of urban United States and European emissions (see the details in Tables S1–S5).
The scenario of changing NOx emissions and oxidation conditions was achieved by changing the NO condition for each VOC precursor mixture, and whether the roof of the SAPHIR chamber was opened or closed. Under daytime conditions, three NO conditions were used: low, medium, and high.
The low NO condition was accomplished by producing NOx only from the photolysis of HONO produced inside the chamber from the Teflon film (Rohrer et al., 2005). NO concentrations were further suppressed by injecting additional ozone (O3) up to 100 ppb. This resulted in an average mixing ratio (after the roof was opened until it was closed) of 0.07–0.19 ppb of NO, 1.03–2.21 ppb of NO2, and 67–115 ppb of O3 across experiments.
The medium NO condition was achieved from HONO photolysis with no addition of NO and O3 to the chamber. This leads to 0.15–0.31 ppb of NO, 1.08–1.65 ppb of NO2, and 24–58 ppb of O3 across experiments; only slightly higher NO than for the low NO conditions.
To obtain high NO conditions, NO was added before exposing the chamber air to sunlight, reaching mixing ratios of 0.23–1.05 ppb of NO, 2.82–4.29 ppb of NO2, and 62–105 ppb of O3 across experiments. Under this condition, NO was only enhanced for a short time interval (∼0.5 h) after opening the chamber's roof, since it was converted into NO2 by the photochemically produced O3 and RO2•.
Lastly, the nighttime oxidation condition was achieved by adding NO2 and O3 to the chamber air and keeping the chamber's roof closed to block the sunlight, leading to 10–17 ppb of NO2 and 7–14 ppb of O3 across experiments and favoring NO3• accumulation. The average NO, NO2, and O3 mixing ratios corresponding to each experiment are listed in Table S6 in the Supplement.
The typical sequences of SAPHIR-CHANEL chamber experiments are shown in Fig. S1 in the Supplement. A chamber experiment was started by humidifying the air with a flow rate of 200–300 m3 h−1 until ∼60 % relative humidity (RH) was reached, except for the limonene experiment under nighttime conditions, where RH was ∼20 %. After about an hour, ammonium sulfate ((NH4)2SO4) was introduced as particle seeds (concentration of ∼10 µg m−3 and diameter of ∼100 nm) to encourage condensation into the particle phase. RH and seed type were kept constant across experiments to ensure the same initial aerosol conditions. One hour after the introduction of seeds, the different VOC precursors in a given emission profile were added in sequential injections. Subsequently, the desired oxidation conditions were introduced to the chamber (i.e., the addition of NO and O3 followed by immediately opening the roof, or the addition of NO2 and O3 while keeping the roof closed). In the limonene experiments, the oxidation condition was established first, followed by several injections of limonene at three distinct times with 1–1.5 h intervals. At the end of each experiment, the chamber is flushed with clean synthetic air (N2, O2, purity >99.9999 %) at a flow rate of 150–250 m3 h−1 overnight to reach mixing ratio of parts per trillion (ppt) level of various gas species (e.g., NOx, O3, VOCs).
2.2 Instrumentation
2.2.1 Aerosol mass loadings and chemical composition measurements using high-resolution time-of-flight aerosol mass spectrometer (HR-ToF-AMS)
Non-refractory submicron aerosol components speciated into organics (Org), nitrate (NO3), sulfate (SO4), ammonium (NH4), and chloride (Cl) were measured using a high-resolution time-of-flight aerosol mass spectrometer (HR-ToF-AMS) with a standard vaporizer. The operating principles of the instrument, including the aerodynamic lens system, vaporizer, and electron impact ionization, are described in detail by Canagaratna et al. (2007). Aerosols were sampled through a 5 m long ( in. or 6.4 mm outer diameter and 0.065 in. or 1.7 mm wall thickness) stainless steel tube at a total flow of 580 mL min−1. The HR-ToF-AMS was operated in V-mode throughout the campaign, providing chemical composition data at a time resolution of 1 min. The detection limit of the instrument from the baseline measurements at 2 min time averaging was 0.03 µg m−3, with a typical measurement uncertainty of 20 %.
Calibration of the HR-ToF-AMS was performed weekly using size-selected 350 nm dry NH4NO3 particles to determine the ionization efficiency (IE). In addition, the relative IE for SO4 was assessed using (NH4)2SO4 particles. For Org, the relative IE was set to the default value of 1.4, while for NH4 and SO4, it was determined to be 4.4 and 1.3. The total aerosol mass concentrations are calculated from the sum mass of Org, NO3, SO4, NH4, and Cl species. Data analysis was conducted using the PIKA 1.24 software toolkit, applying high-resolution peak fitting for chemical speciation.
To divide the total nitrate signal measured by AMS into particulate ammonium nitrate (NH4NO3) and particulate organic nitrate (pON), the ratio method was applied (Farmer and Jimenez, 2010; Day et al., 2022; Takeuchi et al., 2024). This method has been shown to successfully analyze organic nitrate composition in several studies (Fry et al., 2013; Pye et al., 2015; Kiendler-Scharr et al., 2016; Ng et al., 2017; Fry et al., 2018; Huang et al., 2019a, b; Brownwood et al., 2021; Day et al., 2022). The method is described in Sect. S2.1 in the Supplement.
2.2.2 Total NOy measurements
A chemiluminescence NOx monitor (Thermo 42iQTL) equipped with a modified NOy inlet was deployed to measure the total NOy concentration in the experiments. The instrument and the custom inlet setup have been described in detail in previous work (Marsavin et al., 2023). The chamber air is sampled through a 1.6 m long Teflon tube ( in. or 6.4 mm outer diameter, 4.0 mm inner diameter), as short as possible to prevent wall losses of adsorbed NOy species (Neuman et al., 1999). The sampled air then enters the external NOy inlet box, which consists of a NO2-to-NO molybdenum converter scavenged from another instrument (Thermo 17i) and a temperature controller (Omega CN616A) to adjust the converter temperature. Through the converter, the NOy species are reduced to NO by means of heat and reaction with the molybdenum (Mo) before being transported through a longer inlet line to the chemiluminescence detector. The external converter is operated at 350 °C, the same as in Marsavin et al. (2023), to maximize the conversion of ONs. The sampled air then goes through the downstream inlet line (approximately 3 m of Teflon tubing) and passes through a filter paper (PTFE, TE 38, Whatman™) to avoid any residual particles entering the main instrument. The air at a flow rate of 1 L min−1 is drawn into the instrument using an external pump. The chemiluminescence NOx instrument measures NOy as NO with 1 min time resolution. The instrument was calibrated with and without the NOy inlet using a standard NOx cylinder, where the instrument's sensitivity remains relatively stable (±7 %). The detection limit of the instrument is ∼50 ppt.
The conversion efficiency of NH4NO3, (NH4)2SO4, and 2-ethylhexylnitrate (a RONO2 compound, González-Sánchez et al., 2021) to NO by the heated NOy converter at 350 °C was tested using simultaneous mass spectrometer measurements. The detailed procedure is shown in Sect. S2.2 in the Supplement. The conversion efficiency was (104 ± 5) % for RONO2, (94 ± 2) % for NH4NO3, and (0 ± 1) % for (NH4)2SO4. These results are comparable to the numbers reported in other studies (Winer et al., 1974; Baylon et al., 2015) and confirm that the converter decomposes all pNO3 but not NH3 or . The conversion efficiency of HNO3 was not characterized, but Baylon et al. (2015) shows 95 % efficiency using the same converter condition. The detection of HNO3 also depends on the inlet line because the species is often absorbed by the tubing (Neuman et al., 1999; Day et al., 2002; Keehan et al., 2020), which was minimized by making the inlet line as short as possible. We therefore assume that there is negligible loss of HNO3 in the inlet line.
To extract the gON concentration (CgON) from the total NOy measurements, we subtracted the total NOy mixing ratio with the simultaneous measurements of NOx, HONO, HNO3, and total pNO3 (all in ppb) as expressed in Eq. (1).
The NOx mixing ratio was measured using the Ecophysics CLD-780 TR, which operates on the principle of chemiluminescence detection, widely used in laboratory and field studies, and long-term monitoring (Clough and Thrush, 1967; Fontijn et al., 1970; Drummond et al., 1985). The HONO measurements were made using the Airyx ICAD 200L, which used an iterative cavity-enhanced differential optical absorption spectroscopy (ICAD) method (Platt et al., 1979, 2009; Horbanski et al., 2019). The HNO3 concentrations were obtained from the multi-reagent chemical ionization mass spectrometer (MR-CIMS) measurements and the total pNO3 concentrations were from the HR-ToF-AMS. We assume that other NOz species that are not included in the subtraction are negligible.
2.2.3 Gas and particle phase chemical species measurements using gas chromatography (GC) system and chemical ionization mass spectrometers (CIMS)
An online gas chromatography (GC) system, coupled to a flame ionization detector (FID) and mass spectrometer (MS), and four online chemical ionization mass spectrometers (CIMS) were deployed to measure chemical compounds during the campaign. Each instrument has the ability to measure different types of compounds in the gas phase and particle phase. The details of how each instrument was operated during the campaign can be found in Sect. S2 in the Supplement.
The GC system has a thermal desorption unit and is coupled to a dual flame ionization and mass spectrometric detection (GC-TD-FID/MS; Markes TT24-7xr with Kori-xr units, Agilent 8890 GC, Agilent 5977B MS). The system allows for cryogenic preconcentration, chromatographic separation, and dual detection to measure alkanes, alkenes, alkynes, aromatics, and monoterpenes. FID targets the detection of light hydrocarbons and MS for heavier or structurally complex species.
The multi-reagent CIMS (MR-CIMS, Vocus B2, Tofwerk AG, Switzerland), a newly designed instrument equipped with bipolar ToF, is used to simultaneously measure cations and anions without inner interference. MR-CIMS operates with four different reagent ions (i.e., iodide, bromide, acetone dimer, benzene). In this work, we obtain the HNO3 mixing ratio (sensitivity=9.3 ncps pptv−1) from the iodide channel (I−) and the VOC species measurements such as isoprene, aldehydes, aromatics, and monoterpenes (as signal intensity in ncps) from the benzene channel (). The design and geometric structure of the ion-molecular reactor of MR-CIMS (i.e., Vocus AIM IMR) has been discussed in detail elsewhere (Riva et al., 2024).
The amine-ToF used an Eisele type inlet for chemical ionization and coupled to an atmospheric pressure interface time-of-flight mass spectrometer (CI-APi-ToF-MS). The precursor for the primary ion in the chemical ionization was propylamine, and the generated reagent ions selectively ionize oxygenated organic compounds by forming adducts with neutral molecules. The operating principles and instrument configuration are detailed in previous works (Eisele and Tanner, 1993; Junninen et al., 2010; Berndt, 2021).
A Vocus long time-of-flight mass spectrometer (Tofwerk AG, Switzerland) was operated with ammonium reagent ions (-Vocus), allowing measurements of VOCs and oxygenated VOCs. The detailed operating principles and instrument setup have been described elsewhere (Krechmer et al., 2018; Xu et al., 2022; Roska et al., 2026).
A Wall-Free Particle Evaporator (WALL-E) interface was coupled to an atmospheric pressure chemical ionization inlet (Riva et al., 2019, 2020) connected to a high-resolution orbitrap mass spectrometer (Q-Exactive, Thermo Fisher Scientific). The system includes a gas-phase denuder, a thermal desorption unit with sheath flow, a ceramic spacer for thermal isolation, and a dilution/cooling unit (Gao et al., 2025). The instrument used bromide ions (Br−) as reagent ions to measure organic species in the particle phase.
The signal intensities of different organic compounds in the gas phase (∼ 280 species from amine-ToF and ∼ 900 species from -Vocus) and in the particle phase (∼ 1000 species from WALL-E) from various mass-to-charge ratio () in the observation were visualized as ON composition profile plots. The signals were summed from the signal intensity of compounds containing at least one nitrogen and three oxygens (). This criterion was chosen because it represents the minimum number of nitrogen and oxygen atoms for an ON species, but is not limited to ONs because it may also include other organic nitrogen compounds such as oxygenated amines and nitro aromatic compounds.
The ON composition profiles were characterized separately for each instrument, as each detected species may have a different sensitivity in each instrument. The sensitivity of selected organic compounds is presented in Sect. S2.4 (MR-CIMS), and Sect. S2.6 (-Vocus) in the Supplement as a comparison. A 15 % systematic uncertainty was obtained from the calibration of MR-CIMS and we assume similar uncertainties for other gas-phase CIMS instruments. Gao et al. (2025) has described that the signal contribution of dimers of WALL-E is a factor of 2 higher compared to its mass contribution in the particle phase, and we use a 50 % uncertainty to account for this discrepancy. The ON composition distribution is an estimate of how the ON species signal is distributed across carbon and oxygen atom numbers, rather than the actual mass distribution of molecular composition.
2.3 Determination of organic nitrate yields
The ON molar yield in each chamber experiment was calculated by determining the ratio of the mixing ratio of total ON formed in both the gas phase and the particle phase (ΔCON,tot) to the mixing ratio of VOC consumed (ΔCVOC,tot). The ON molar yield () is expressed in Eq. (2).
The total ON formed was calculated by subtracting the total ON prior the VOC injection from the total ON concentration when the maximum SOA concentration has been reached (assumed to represent steady state). A visualization of these periods is shown in Fig. S5 in the Supplement. The percentage of VOC concentration that was consumed was calculated by observing the signal intensity difference of various VOCs detected by the MR-CIMS- or -Vocus measurements between the moment of VOC injection and the steady state. The expected injected concentration of each VOC was then multiplied by the decrease in signal intensity for each compound (or compound family) to obtain the mixing ratio of consumed VOCs. The expected mixing ratios of injected and consumed VOCs are not verified by calibrated concentration measurements.
ΔCON,tot: mixing ratio of total ON formed in the gas phase and particle phase. ΔCVOC,tot: mixing ratio of consumed VOCs.
Presumably, ON species with different volatilities, and whether they are in the gas phase or the particle phase, would have different losses. Lower volatility compounds are more likely to remain absorbed to the walls after collision than higher volatility compounds. Here, we acknowledge this challenge which can lead to potential uncertainties in the calculation. Measured gON and pON mixing ratios are treated as bulk species. To calculate the yields, the bulk pON and bulk gON mixing ratios were corrected for dilution and wall loss. In this work, the particle phase concentrations are corrected for wall loss and dilution by using the equation , based on the observed (NH4)2SO4 decay. Gas phase wall losses are known to be negligible (except for highly oxygenated molecules (HOMs), see Zhao et al., 2018), and thus, we only applied dilution correction to the gas phase mixing ratios. The gas phase concentrations were corrected for a dilution ranging from to min−1 (chamber volume of 270 m3 and inflow rate of 7–10 m3 h−1 depending on the experiment).
We estimate the uncertainty (as one standard deviation) of the ON molar yield by propagating the uncertainties from the determination of the mixing ratio of the total ON. The uncertainties include the half of detection limits of instruments measuring NOy (±25 ppt), NOx (±40 ppt), and HONO (±40 ppt), the uncertainty from calibration of HNO3 measured by MR-CIMS (±15 %), the uncertainty of pNO3 determination from AMS (±20 %), the uncertainty from ratio method to obtain pON from AMS (±23 %, Takeuchi et al., 2024), and the uncertainty from VOC signal decrease (±15 %, assuming the maximum uncertainty is similar to MR-CIMS). The description of the uncertainty propagation is detailed in Sect. S3.1 in the Supplement.
2.4 Determination of molecular weight and SOA mass fraction of particulate organic nitrates
The molecular weight of bulk particulate RONO2 (MW, includes organic moiety and nitrate functional group of pON) for each experiment was determined using the signal intensity of compounds detected by WALL-E. Similar to the approach in the previous section, only peaks with chemical formula containing at least one nitrogen and three oxygen atoms () were included. The percentage or ratio of the signal of each peak to the summed signal intensity is multiplied by the corresponding nominal mass of each peak, and then summed for all peaks to obtain the molecular weight of bulk pON (see Eq. 3).
: average molecular weight of bulk particulate organic nitrate as pRONO2 (g mol−1). Ak: signal intensity of compound k. : total signal intensity of organic compounds with formula . MWk: nominal mass of the compound k (g mol−1).
This approach, however, used signal fraction rather than mass fraction of WALL-E observations to calculate the molecular weight. We used 50 % uncertainty to our bulk pRONO2 molecular weight estimate to consider uncertainty of representing mass fraction contribution from signal intensity of WALL-E. Additionally, this approach may also include other organic nitrogen compounds such as nitro aromatic compounds, which are also detected by WALL-E. However, we assume that their contribution is minimal due to the low percentages of aromatic VOCs in the precursor mixture (0 %–16 %).
Using this bulk molecular weight, we can calculate the contribution of pON to the total organic aerosol (OA), which is expressed as the mass fraction of the concentration of formed pRONO2 () to the total concentration of formed OA (ΔCOA). The pRONO2 mass fraction is expressed in Eq. (5). The mass concentration of pRONO2, which includes both organic and nitrate moiety of ON, is calculated from CpON using the molecular weight of bulk organic nitrate (MW, in g mol−1) in each experiment using Eq. (4). The total mass of OA includes the concentrations of AMS Org and pON (as −NO2, not −ONO2 since one of the oxygen is accounted as the AMS Org mass; see Takeuchi et al., 2024).
: concentration of pON as RONO2 (µg m−3). CpON: concentration of pON as −ONO2 (µg m−3). : molecular weight of bulk organic nitrate (g mol−1). : total concentration of formed pON as RONO2 (µg m−3). ΔCOA: total concentration of formed Org, and formed pON as −NO2 (µg m−3).
We estimate the uncertainty (as one standard deviation) of the pRONO2 mass fraction from the uncertainty of the determination of pNO3 and Org in AMS (each contributes ±20 %), the ratio method to obtain pON from AMS (±23 %, Takeuchi et al., 2024), and the uncertainty of MW (±50 %). The description of the uncertainty propagation is detailed in Sect. S3.2 in the Supplement.
2.5 Gas-particle partitioning of organic nitrates
Every compound in the atmosphere can partition between the gas and particle phase according to its properties (e.g., chemical structure, volatility, functional groups). This partitioning reaches an equilibrium or steady state for a given compound at a given temperature and a given total aerosol mass. Therefore, calculating the bulk equilibrium partitioning in an atmospheric mixture can help us understand the average bulk organic species that are produced in the atmosphere.
The partitioning of a compound i between the gas and particle phases can be described by the sorption of organic compounds into existing particles, which leads to the condensation of low-volatility compounds into the particle phase. The phase partitioning of a compound i can be expressed as the effective saturation concentration (). The effective saturation concentration describes the saturation concentration of a vapor over a liquid. Volatility can also be defined using the partitioning coefficient driven by the volatility of the compound i (Kp,i), as expressed in Eq. (6) (Pankow, 1994; Pankow and Asher, 2008). It is proportional to the particle-to-gas concentration ratio () and inversely proportional to the total absorptive mass (mtot); Kp,i thus inverse of .
Kp,i: gas-particle partitioning coefficient driven by volatility (m3 µg−1). Cp,i: concentration of i in the particle phase. Cg,i: concentration of i in the gas phase. mtot: total absorptive mass concentration, measured by HR-ToF-AMS (µg m−3). : effective saturation concentration (µg m−3).
In this study, we characterize the bulk ON in the gas phase and the particle phase under equilibrium conditions using the particle-to-gas ratio of ON (), the effective saturation concentration of ON (), and the gas-particle partitioning coefficient of ON (Kp,ON). The equilibrium condition refers to the state in which the rate of mass transfer of a compound from the gas phase to the particle phase is equal to the reverse rate. We identify this equilibrium condition as when the maximum SOA concentration is reached and remains stable over time (ranging from 0.5–5 h, with average standard deviation of ±0.3 µg m−3), based on the AMS measurements. There is minimal net exchange between the two phases under this condition, and thus the system can be considered in steady state. Further reactions within the particle phase and thermal decomposition, however, are not considered in this assumption. For limonene and nighttime Los Angeles experiments, we also describe the partitioning that happens just before a new injection is performed in the chamber (when SOA is still increasing) to compare it with the equilibrium condition.
To determine , , and Kp,ON, we performed two sets of calculations, using the loss corrected concentrations and the instantaneous measured concentrations (not loss corrected). We compare the results from the two calculation methods, but the calculation using the instantaneous measured concentrations is the main result presented in this article, since they represent the actual equilibrium occurring in the chamber. Furthermore, we also need to consider the uncertainty of and Kp,ON (as one standard deviation). This uncertainty is propagated from CpON, CgON, and mtot, detailed in Sect. S3.3 in the Supplement. Finally, we evaluated the trend in ON partitioning by differentiating the chamber experiments by daytime and nighttime conditions, as well as different VOC precursor mixtures.
2.5.1 Two-dimensional volatility basis set (2D-VBS) mapping
The two-dimensional volatility basis set (2D-VBS) framework describes organic aerosol volatility using and oxygenation level, thus mapping organic aerosol volatility independently from chemical structures. The oxygenation level is described by the ratio of oxygen number to carbon number ratio or O:C ratio (). The 2D-VBS mapping is visualized by plotting the O:C ratio on the y axis against the logarithm of () on the x axis at 300 K (Donahue et al., 2011). The organic aerosol composition based on the carbon number () and effective oxygen number () is shown to describe organic aerosol volatility as isopleths. These isopleths are calculated for saturation concentrations over a pure liquid (), using the non-linear expression of the group contribution method for the logarithm of () in Eq. (7).
We use the parameterization of group contribution method from Stolzenburg et al. (2018) to calculate the isopleths, which takes the volatility of nitrate functional group into account. The carbon number of volatility reference () is 25 (pentacosane used as reference), the carbon-carbon interaction term (bC) is 0.475, the oxygen-oxygen interaction term (bO) is 1.4, and the carbon-oxygen non-ideality (bCO) is −0.3. The log() spectrum is divided into semi-volatile organic compounds (SVOC) and intermediate-volatility organic compounds (IVOC) where SVOC have and IVOC have .
The observed saturation concentrations of bulk organic nitrate () are superposed on the 2D-VBS mapping. The O:C ratio is obtained from nitrogen-containing masses signal detected by WALL-E. As the volatility of the nitrate functional group (−ONO2) is similar to the volatility of the hydroxyl group (−OH) according to Pankow and Asher (2008), we count one −ONO2 as one −OH to obtain the effective O for volatility calculations. Since the chemical formula derived from the detected masses in WALL-E cannot be used to distinguish whether the nitrogen present in the compound is nitrate or non-nitrate, the O:C ratio calculated here assumes that every nitrogen in the compound is present as −ONO2 and contributes to one oxygen atom in the group contribution method. Thus, for a chemical mass formula of CxHyOzNk, the O:C ratio is equal to . The uncertainty for O:C ratio from WALL-E is approximated to be 50 %, to take into account the use of signal intensity instead of sensitivity-corrected mass to calculate the contribution of O and C.
2.5.2 Comparison with theoretical gas-particle partitioning
The theoretical value for Kp,i is a function of the average temperature (T) and the vapor pressure of i at a given T (), as well as of the composition of the organic matter (expressed as the molecular weight, MWom) and the activity coefficient (ζ), which is assumed to be 1 (see Eq. 8). By estimating the pure liquid vapor pressure of i with a given MWom and ζ, Kp,i can be theoretically calculated for a given chemical structure using a group contribution method, for example, SIMPOL.1 from Pankow and Asher (2008). The theoretically derived value of Kp,i calculated for different organic compound structures can be compared to the observed bulk value of Kp,i to deduce the average volatility of the organic compounds formed (thus related to some possible chemical structures) and to characterize the bulk properties of the SOA mixture (Brownwood et al., 2021).
R: ideal gas constant (0.082 ). T: average temperature (K). fom: absorptive organic fraction of the PM. MWom: average molecular weight of the organic matter (g mol−1). ζ: activity coefficient of compound i in the organic fraction of the PM (assumed to be 1). : pure liquid vapor pressure of i at T (atm). Conversion factors: 760 Torr atm−1 and 106 µg g−1.
We compare the observed values of Kp,ON (calculated using Eq. 6), to the theoretical values of Kp,ON for various ON structures at a given chamber temperature (calculated using Eq. 8). The chemical structures are interpreted based on the key identified by gas phase and particle phase CIMS. Through this comparison, we can assess whether the gas-particle partitioning of the bulk ON reflects the ON composition formed from each experiment.
Furthermore, we characterized the influence of temperature (T) using the enthalpy of vaporization (ΔHvap) of bulk organic nitrates from Clausius-Clapeyron equation (see Eq. 9). To determine whether any observed Kp,ON differences between two experimental conditions (e.g., daytime vs. nighttime) are purely due the temperature differences, the observed ΔHvap can be compared with the expected ΔHvap for organic nitrates or SOA from other studies; 30–150 kJ mol−1 for a volatility range of organic compounds (Pankow and Asher, 2008; Epstein et al., 2010). A discrepancy between the observed ΔHvap and expected ΔHvap suggests that the observed Kp,ON offset is influenced by parameters other than temperature, such as chemical composition (observed ΔHvap > expected ΔHvap) or kinetic limitations (observed ΔHvap < expected ΔHvap).
Kp,ON;N: gas-particle partitioning coefficient of organic nitrates under nighttime conditions (m3 µg−1). Kp,ON;D: gas-particle partitioning coefficient of organic nitrates under daytime conditions (m3 µg−1). ΔHvap: enthalpy of vaporization (kJ mol−1). R: ideal gas constant ( . TN: temperature under nighttime conditions (K). TD: temperature under daytime conditions (K).
3.1 Estimating organic nitrate yields
The consumed VOC mixing ratio in each chamber experiment is presented in Table 2. A detailed list of the consumed VOCs are provided in Tables S1–S5. In general, we observed a higher consumption of VOCs under daytime conditions compared to nighttime conditions from the signal intensity-based observations of GC and various CIMS. We observed a decrease by 96 % in average of isoprene signal/concentration under daytime conditions and 61 % under nighttime conditions. For monoterpenes, limonene is completely consumed (98 %–100 %) for both daytime and nighttime conditions, while the consumption of α-pinene and β-pinene varied from 63 % up to 100 %. Saturated and unsaturated aldehydes (carbon number ≥5; i.e., pentenal, hexadienal, heptanal, octenal, nonanal, decanal) showed a decrease of signal/concentration by 20 % to 99 % under daytime conditions and by 22 % to 59 % under nighttime conditions. Aromatic VOCs (i.e., toluene and xylenes) were consumed from 39 % to 87 % under daytime conditions and 22 % to 51 % under nighttime conditions.
Table 2List of ON yields and their uncertainty from experiments in the SAPHIR-CHANEL 2024 campaign included in this work, which were grouped based on volatile organic compound (VOC) precursors and arranged in ascending order from low NO to high NO levels, including nighttime conditions. The yields are presented as the molar ratio of total ON formed in the gas and particle phases to the expected consumed VOC concentrations (, in %). The molecular weight estimate of pRONO2 (MW, in g mol−1) and pRONO2 mass fraction to the total organic aerosol mass (OA) (, in %), including their uncertainties, are also listed. The particle phase concentrations are wall loss and dilution corrected, while the gas phase concentrations are dilution corrected.
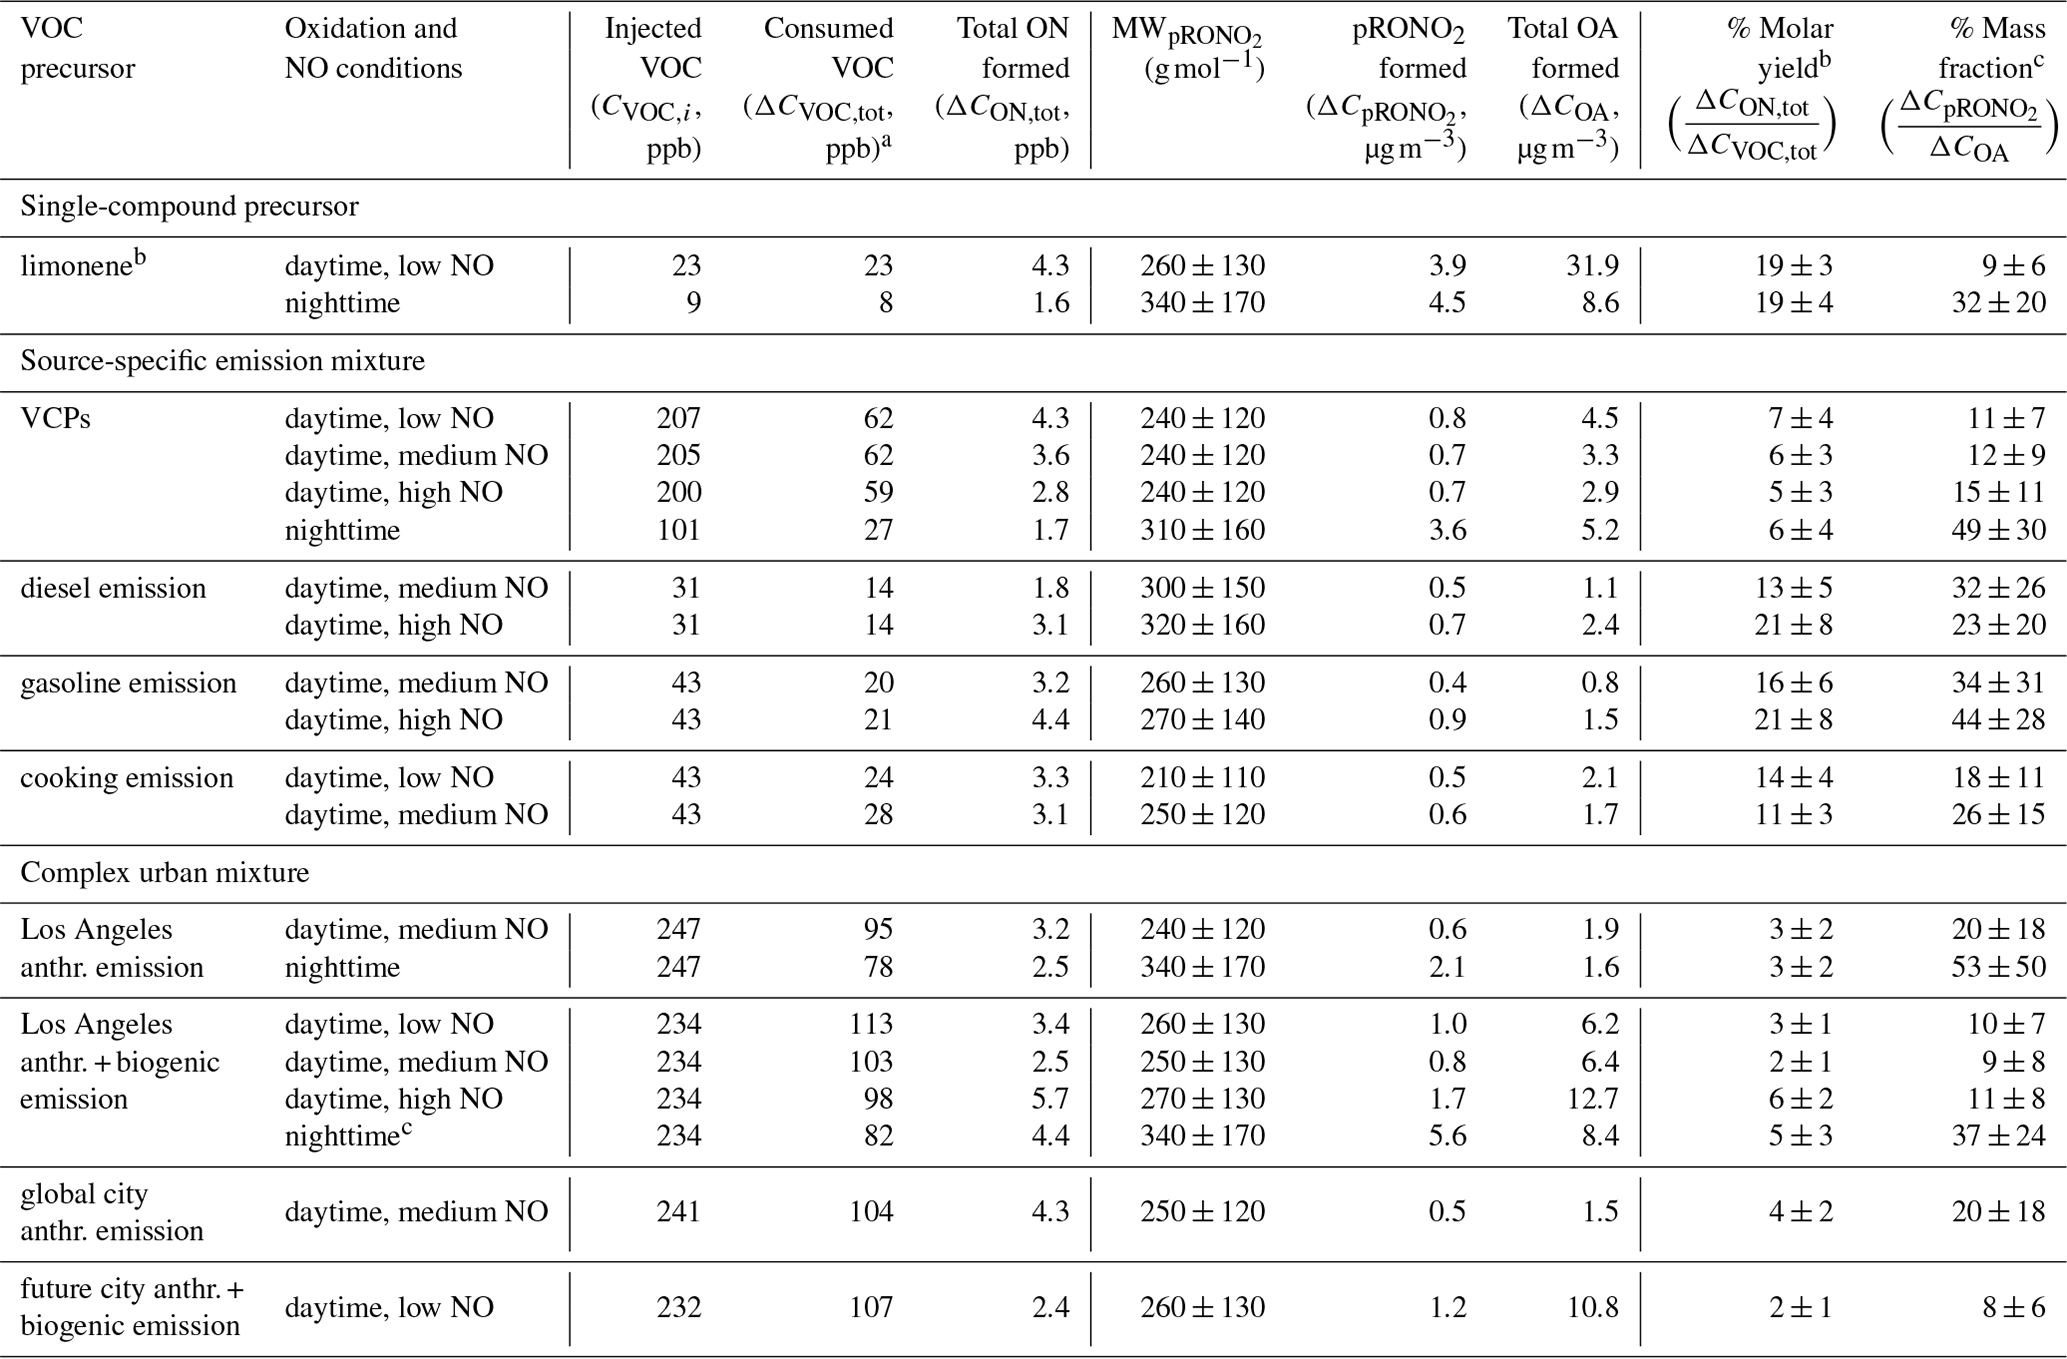
a The consumed VOC mixing ratio is calculated based on the percentage of signal decrease of individual precursor compound, observed by various instruments, multiplied by the expected injected VOC mixing ratio (see Tables S1–S5).
b Limonene was injected several times at three distinct time period (interval 1–1.5 h each).
c NO2 + O3 were added at two distinct times (interval 4 h).
With the percentage of VOCs consumed varying depending on the compound and the oxidation conditions (daytime vs. nighttime), the ON molar yields range between 2 %–21 % (see Table 2). The uncertainty propagation related to the yield value is detailed in Sect. 2.3 and in Sect. S3.1. These yields are derived from the calibrated observations of total NOy, NOx, HONO, MR-CIMS and AMS for ΔCON,tot, and from the signal intensity-based observations of GC and various CIMS instruments for ΔCVOC,tot. Higher yields are observed for the experiments using only limonene and source-specific emission profiles as precursors (i.e., cooking, gasoline, diesel). The source-specific emission profiles contain a high percentage of unsaturated compounds such as isoprene, monoterpenes, sesquiterpenes, unsaturated aldehydes, and alkenes (see Fig. 2), which are susceptible to addition reactions. Electrophilic oxidants like OH•, NO3•, and O3 add to the carbon-carbon double bonds in unsaturated compounds. Under daytime oxidation, OH• or O3 addition produces a carbon radical that immediately forms RO2•, which can react with NOx to form organic nitrate compounds. Under nighttime oxidation, the carbon-carbon double bonds react with NO3• to form directly organic nitrates. The presence of unsaturated compounds thereby increasing the likelihood of ON formation.
The daytime limonene experiment shows (19 ± 3) % yield of organic nitrate from the total consumed limonene. A similar daytime limonene experiment conducted by Pang et al. (2022) reported 34 % yield from OH•-initiated RO2• + NO reaction, which takes into account that only 60 % of total limonene reacted. If the yield includes the other 30 % of total limonene reacted via O3 pathway, the yield is likely to be lower since O3 requires secondary reactions to produce RO2• that can react with NO to form ON. The nighttime limonene experiment shows (19 ± 4) % ON yield, similar to the 15 % total ON yield from nighttime limonene experiment reported by Fry et al. (2011) when taking into account limonene consumed by NO3• (50 %) and O3 (50 %). The cooking emission replicas show 14 % and 11 % yield for low and medium NO conditions, respectively. The traffic-related emission replicas show a yield range of 13 %–21 %. The range of NO conditions in this study (0.07–1.05 ppb) is found to have no significant influence on the ON molar yield, as shown by the similar results from the low, medium, and high NO conditions of the VCP and Los Angeles anthropogenic + biogenic emission replicas.
In contrast, experiments replicating VCPs and more complex urban emission profiles (i.e., the replica of Los Angeles city, global city, and future city emission profiles) have 2 %–7 % ON molar yields, lower compared to the experiments replicating other source-specific emission profiles. Since complex urban emission replicas also contain VCPs, we suggest that VCP emissions may drive the suppression of ON yields. They contain a higher percentage of lighter VOCs that do not contribute significantly to the mass of ON formed in these experiments. Lower amounts of consumed VOCs are observed for these compounds from compound families such as alkanes (e.g., 17 %–36 % for isobutane) and alcohols (e.g., 17 %–38 % for ethanol and 24 %–32 % for isopropyl alcohol).
3.2 Estimating molecular weight and mass fraction of particulate organic nitrate
Although the VOCs consumed under daytime conditions are higher than those under nighttime conditions, the ON molar yields are not higher for the daytime experiments compared to their nighttime counterparts. The different chemical mechanism of ON formation under daytime conditions (OH• chemistry is prevalent) compared to nighttime conditions (NO3• chemistry is prevalent) likely explains this difference. The impact of the difference in chemistry is observed on the molecular weights of bulk pON as shown in Fig. 3a for composition when the SOA formation has peaked. The summary of the molecular weight estimates can be found in Table 2. The molecular weight estimate is based on WALL-E observations assuming the same sensitivity for all masses detected (50 % uncertainty included). It is rather a comparative approach between different experiments so the discussion below is not affected by the fact that the WALL-E results are not mass quantitative. An average molecular weight of 330 ± 80 g mol−1 (mean ± weighted standard deviation) is observed for nighttime experiments, higher compared to the average molecular weight of 250 ± 30 g mol−1 for daytime experiments. We hypothesize that the increase in dimerization of RO2• from long-chain unsaturated VOCs (formation of C≥10 compounds) and less fragmentation or nitrate formation from short-chain RO2• (formation of C≤5 compounds) under nighttime conditions accounts for this difference. In Fig. 3b, we see higher contributions of heavier compounds with C>10 (e.g., dimers) to the bulk pON under nighttime conditions, 56 % for the single-compound limonene experiment, 36 % for the VCP experiment, 51 % for the Los Angeles anthropogenic emission replica experiment, and 57 % for the Los Angeles anthropogenic + biogenic emission replica. On the other hand, experiments under daytime conditions only report 0 %–22 % contribution of C>10 compounds.
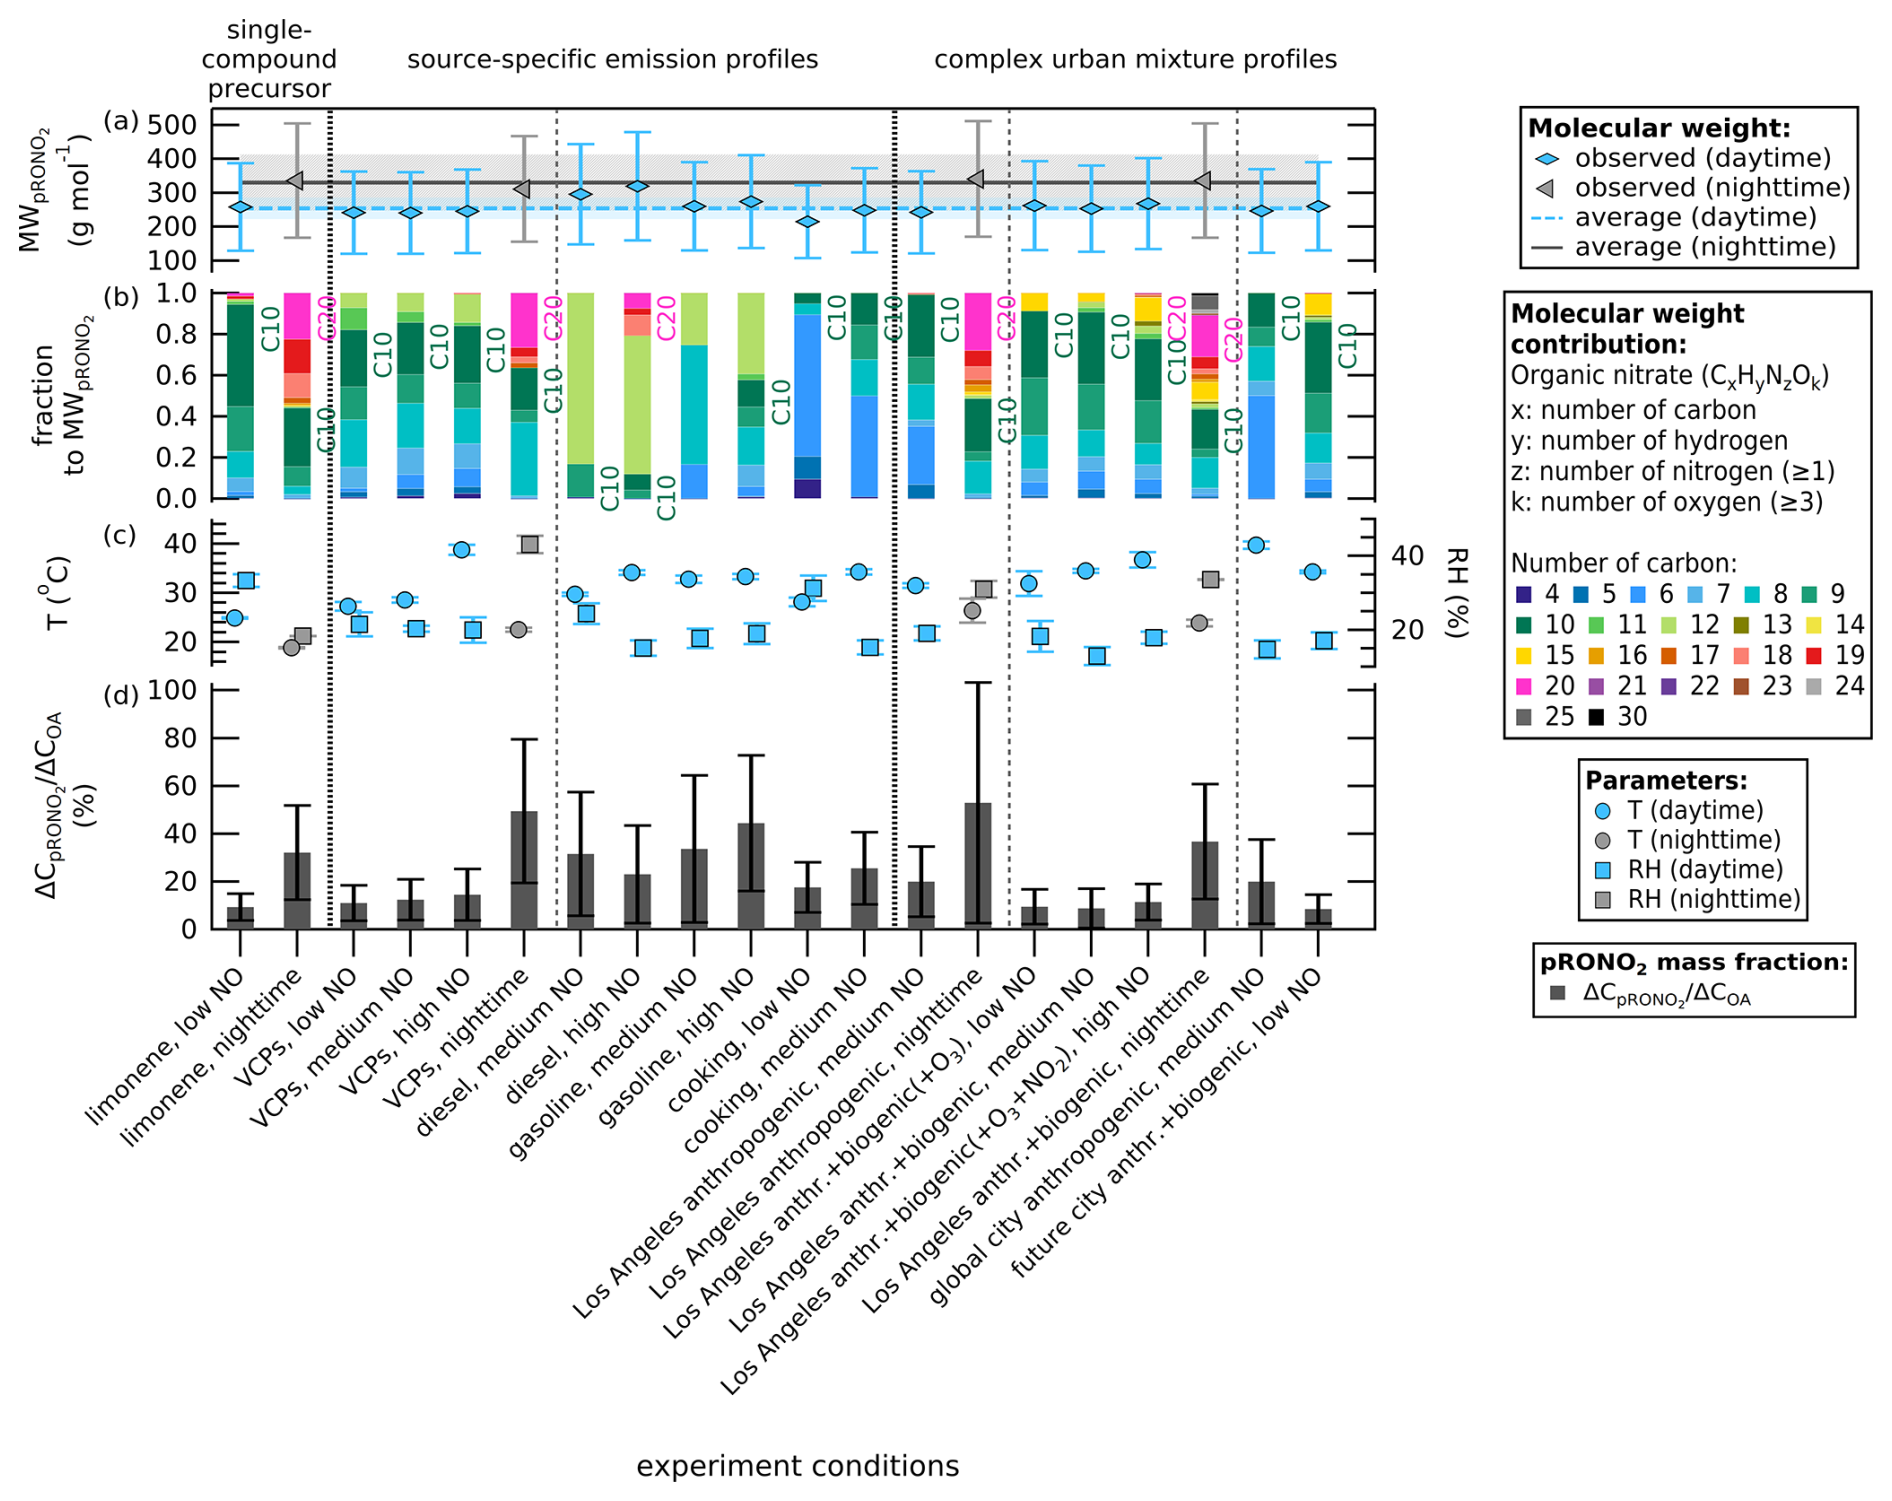
Figure 3(a) Molecular weights of bulk pON as pRONO2 (g mol−1) determined using signals from WALL-E measurements when the SOA formation has peaked, sorted first by daytime versus nighttime conditions, and then by the complexity of the VOC precursor mixture. The whiskers represent 50 % uncertainty from using WALL-E signal intensity instead of sensitivity-corrected mass concentration. The plot shows an average of 330 ± 80 g mol−1 for nighttime experiments and an average of 250 ± 30 g mol−1 for daytime experiments (color shading represents one weighted standard deviation of the mean). (b) Contribution fraction based on WALL-E signal intensity of organic compounds color coded by the carbon atom number to the molecular weight of bulk pON. (c) Mean temperature (left y axis, in °C) and mean relative humidity (RH, right y axis, in %) when the SOA formation has peaked, color coded by daytime and nighttime conditions. The whiskers represent one standard deviation of the mean (0.1–2.5 °C for temperature and 0 %–4 % for RH). (d) Values of pRONO2 mass fraction over total OA (left y axis, bars in %). The whiskers represent the uncertainty of the mass fraction (one standard deviation).
To further show the contribution of ON to the total organic species, we determine the pRONO2 mass fraction to the total OA of each chamber experiment in Table 2 and visualize them in Fig. 3c. We observe that the nighttime conditions for each VOC-NOx mixture have a higher pRONO2 mass fraction compared to their daytime counterparts. The percentage of pRONO2 mass fraction under NO3• oxidation at nighttime conditions varies from 32 %–53 %, a factor of 2.6 to 4.5 higher than its daytime counterparts (9 %–20 %). VOCs from traffic and cooking emissions show varying pRONO2 mass fractions ranging from 18 %–44 %. The difference can be partially explained by lower temperature and higher RH during nighttime experiments, which promote the condensation of ON that increases its mass fraction. Lower temperature increases the particle partitioning of semivolatile species, and higher RH increases the aerosol liquid water content, which enhances the absorptive capacity of the particle phase for soluble organic nitrates. It also enables aqueous-phase and heterogeneous chemistry that facilitates the formation of low-volatility dimers, increasing pRONO2 mass fraction in the organic aerosol phase. This change in chemistry affects the pRONO2 molecular weight. Nighttime NO3• chemistry results in higher ON production with heavier compounds compared to daytime OH• chemistry, thus converting a larger fraction of the organic precursor to organonitrates, leading to a higher contribution of pRONO2 to the total SOA mass concentration. This shows that despite larger VOCs consumption under OH• chemistry, more ON is formed in the particle phase under NO3• chemistry. This could also be caused by the reduction in SOA formation due to interactions between the products of different VOC precursors present in complex urban mixtures under OH• chemistry (McFiggans et al., 2019).
3.3 Trends of gas-particle partitioning of bulk organic nitrate
3.3.1 Influence of daytime vs. nighttime oxidation conditions
The particle-to-gas ratio of ON at equilibrium conditions can be used to compare the volatility of the bulk ON aerosol produced from different VOC precursor compositions in a reaction mixture under daytime vs. nighttime oxidation conditions, regardless of the total absorptive mass. We show in Fig. S7 in the Supplement that differences in partitioning are not driven by differences in aerosol mass, since total solvating aerosol mass only varies between 13–38 µg m−3 (typical concentrations of an urban environment). A summary of the concentrations and mixing ratios used for the calculation can be found in Tables S6 and S7 in the Supplement. We show only the results calculated using instantaneous observed gas and particle phase concentrations to represent the actual equilibrium in the chamber. The wall loss and dilution corrected concentrations have similar partitioning behavior compared to the instantaneous concentrations. They are found to systematically increase by 0.001–0.021, and systematically decrease Kp,ON by up to m3 µg−1 (see Table S7).
For visualization, we use a particle-to-gas ratio scatter plot (see Fig. 4), where the y axis is CpON (obtained using ratio method from calibrated AMS observation) and the x axis is CgON (obtained from calibrated total NOy, NOx, HONO, MR-CIMS and AMS observations). Scatter points falling on a line drawn from the origin point (0,0) to any coordinate () in the plot (shown as dashed grey lines) will have the same slope, and thus a similar profile but differ in concentrations. Scatter points falling on a larger slope have larger , and thus higher species concentration in the particle phase. The plot shows the experiments classified based on the presence of light (daytime, light blue) and absence of light (nighttime, dark grey) conditions.
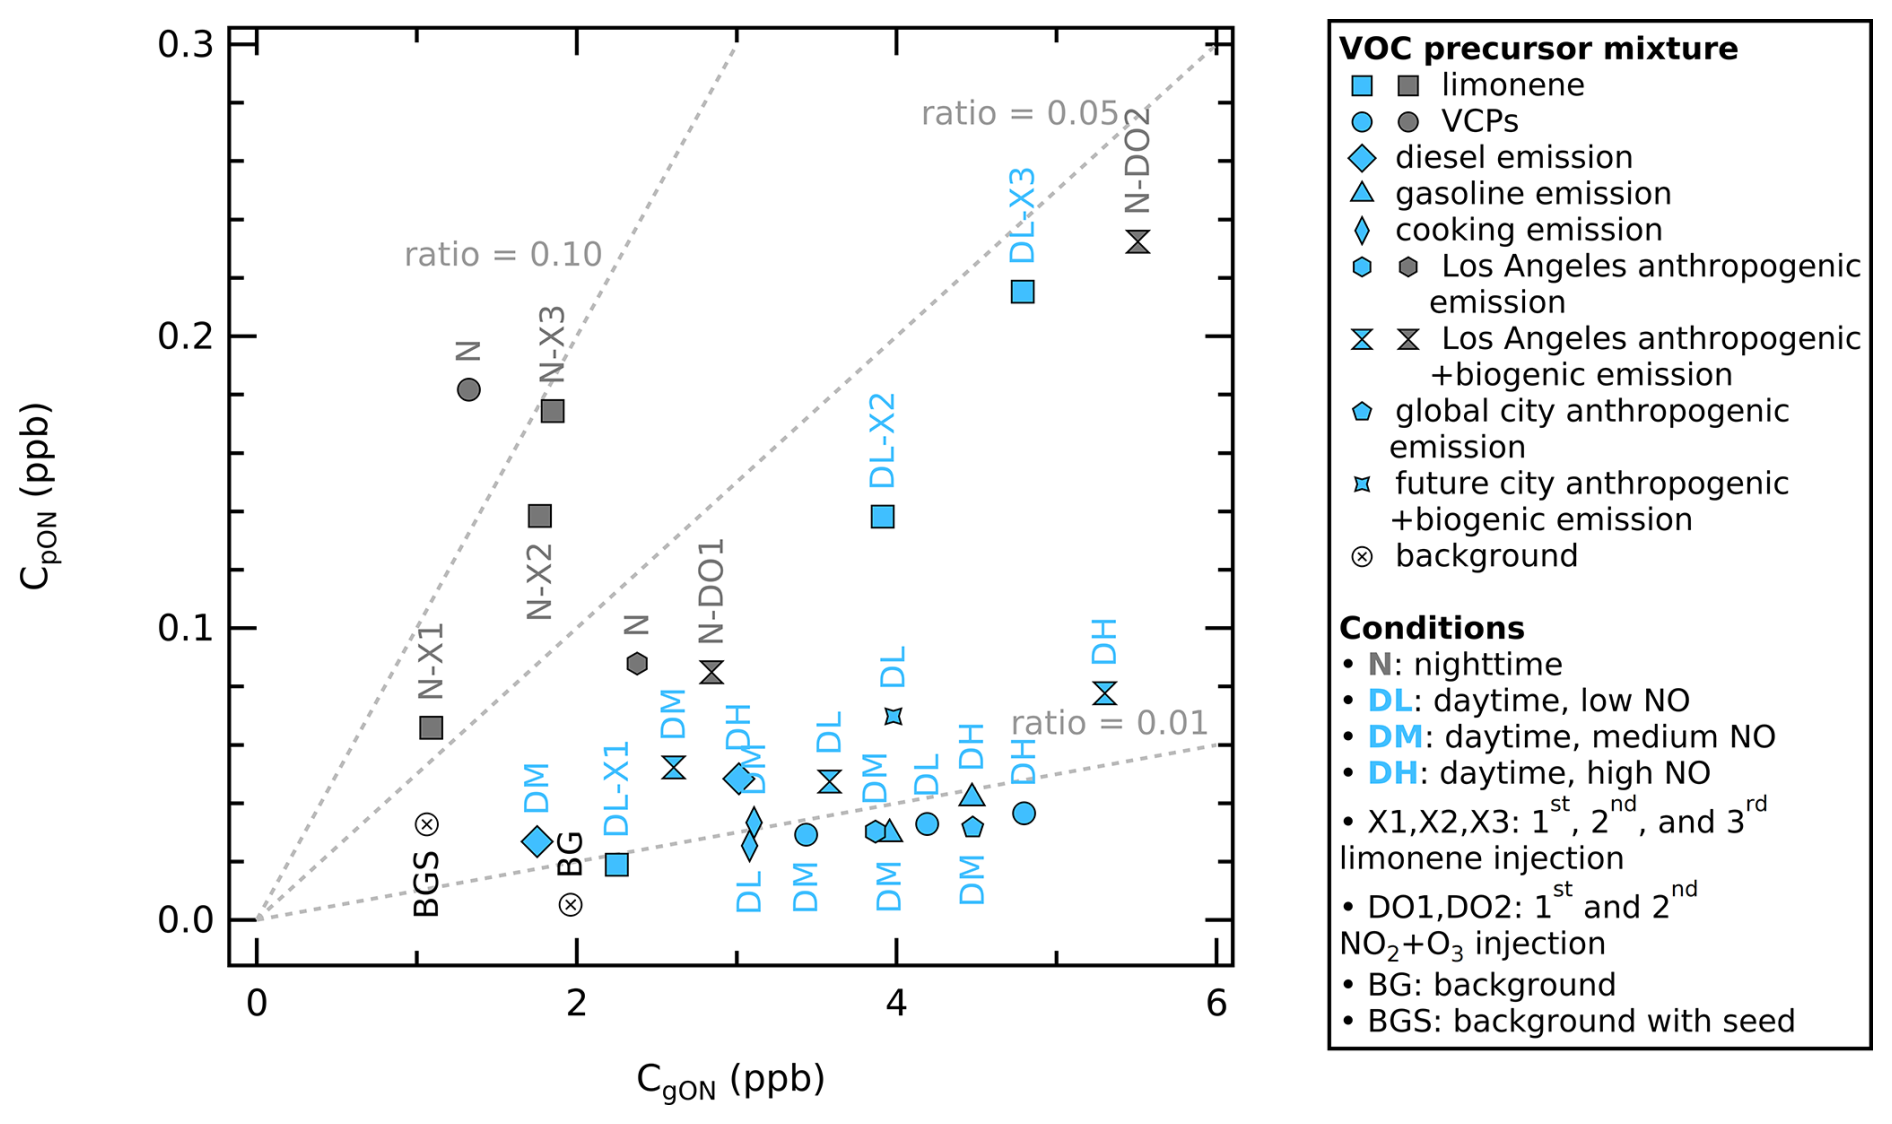
Figure 4Scatter plot of particle phase ON (y axis) vs. gas phase ON (x axis) mixing ratio in ppb from different VOC-NOx mixtures, color-coded by daytime conditions (light blue) and nighttime conditions (dark grey). The total absorptive mass of each experiment at equilibrium varies from 13 to 38 µg m−3. The concentrations are the averages under equilibrium conditions. The dotted lines visualize different values (0.01, 0.05, and 0.10).
We observe that SOA formation under nighttime conditions is characterized by larger values (0.030–0.137) than under daytime conditions (0.007–0.045). This daytime and nighttime difference can be partially explained by the temperature and RH differences in the chamber. The temperature during nighttime experiments was systematically lower (18–26 °C) compared to the daytime experiments (24–40 °C) after SOA formation has been reached, which is also representative of real-world temperatures. This temperature drop also affected the nighttime RH (18 %–51 %) versus the daytime RH (13 %–42 %); see Table S7 for details. Lower temperatures and higher RHs in this study are likely associated with higher values, which promote the condensation of low-volatility compounds into the particle phase to form SOA.
The availability of light also modifies the oxidation mechanism of organic species in the chamber. The presence of sunlight in daytime experiments enhances photolytic reactions that lead to OH• formation, promoting oxidation reactions of organic compounds into RO2•, forming ON (if terminated with NOx) and non-ON species. In contrast, the absence of light favors a longer lifetime of the NO3• formed from NO2 and O3, which results in the nighttime NO3• oxidation of organic compounds that will lead to the formation of ON. This is in line with several laboratory and chamber studies, which have shown that SOA yield from NO3• oxidation of BVOCs is larger compared to SOA formed from OH• or O3 oxidation (Hallquist et al., 1997; Griffin et al., 1999; Spittler et al., 2006; Ng et al., 2008; Fry et al., 2009, 2011; Rollins et al., 2009; Boyd et al., 2015; Ng et al., 2017). Ozonolysis reactions also contribute to SOA formation during daytime and nighttime conditions, but we expect the differences are produced by the differences in OH• and NO3• chemistry.
The different values are thus inferred to be related to differences in temperature and RH in the daytime and nighttime conditions, as well as different ON volatilities in SOA formation caused by daytime OH• versus nighttime NO3• chemistry. A higher value implies a preference for species to condense into the particle phase, which is associated with lower-volatility species. The daytime and nighttime difference in average molecular weight is also consistent with the different chemical mechanisms and species volatility. However, the NO condition in this study does not seem to influence the particle-to-gas ratio of ON. This suggests that changes in the average NO mixing ratio in the chamber (0.07–1.05 ppb) do not modify the chemical mechanism of ON formation and the volatility distribution of bulk ON.
The difference in values between daytime and nighttime can be confirmed using 2D-VBS mapping, which illustrates the composition independently of temperature effects. The 2D-VBS mapping (Fig. 5) shows that the bulk organic nitrate falls within the volatility range of (SVOC and IVOC). This volatility range corresponds to the volatility range of C5 to C10 compounds with 4–6 effective oxygen atoms (6–8 oxygen atoms if one of the oxygen atoms represents one −ONO2). We observe that the nighttime experiments (grey colored markers) produce lower volatility organic nitrates compared to the experiments under daytime conditions (light blue colored markers). The average volatility of nighttime organic nitrates matches heavier C10 compounds compared to daytime organic nitrates, which explains the higher values for nighttime experiments as larger compounds condense more easily to the particle phase than smaller compounds, increasing the particle-phase ON concentration.
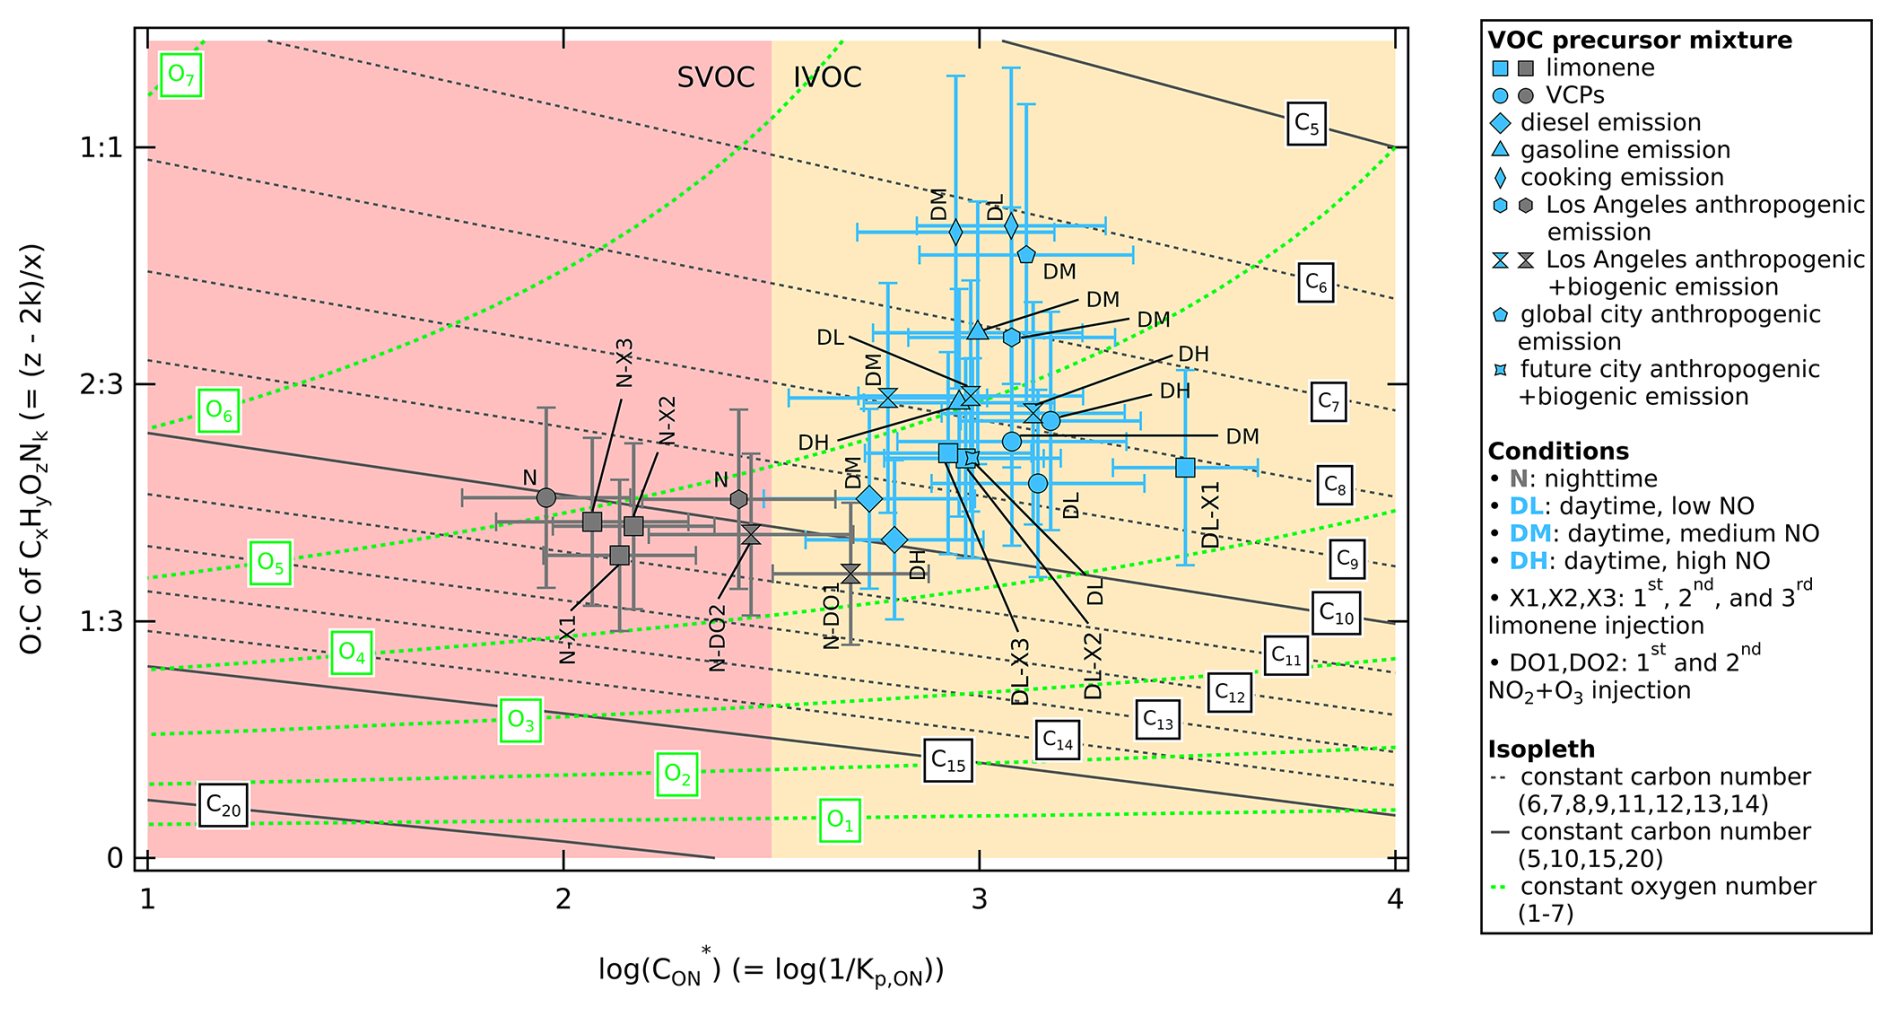
Figure 5Two-dimensional volatility basis set mapping expressed as logarithm of effective saturation concentration of organic nitrate () in a 2D space with on the x axis and O:C ratio of CxHyOzNk () on the y axis. The values of during SAPHIR-CHANEL campaigns for various urban VOC-NOx mixture experiments are shown color-coded by daytime (light blue) and nighttime (dark grey) conditions. The horizontal whiskers represent the uncertainty of (see Sect. S3.3 for uncertainty propagation). The vertical whiskers represent the uncertainty from using WALL-E signal as an indication of concentration (estimated to be 50 %). Organic composition from the group contribution method based on the carbon number () and oxygen number () are shown to describe organic aerosol volatility as isopleths at 300 K following Donahue et al. (2011), with parameterizations following Stolzenburg et al. (2018) as described in Sect. 2.5.1. The dark grey lines represent carbon number isopleths and the light green curves represent oxygen number isopleths. The volatility range of semi-volatile organic compounds (SVOC) and intermediate-volatility organic compounds (IVOC) are highlighted red and yellow, respectively.
3.3.2 Relationship between VOC precursor, particle-to-gas ratio, and ON composition distribution
We observe the clustering of certain urban VOC-NOx mixtures in the particle-to-gas ratio scatter plot in Fig. 4 (see Fig. S6 in the Supplement for the same plot but color-coded by the VOC precursor mixture). The VOC-NOx mixtures from VCPs, cooking emission, diesel emission, and gasoline emission under daytime conditions have some of the lowest values (0.007–0.016) compared to other experiments. VCPs and limonene VOC-NOx mixtures under nighttime conditions have values (0.061–0.137) up to 10 times higher than in the other experiments. The rest of the experiments are scattered in low and moderate values (between 0.007–0.042), which are mainly complex urban VOC-NOx mixtures (i.e., the Los Angeles emission, global city emission, and future city emission).
The differences in across ON formation with different VOC precursors can be explained by looking further at the specific ON compounds measured in the bulk gas and particle phases. Each VOC precursor mixture contains different compounds with varying reactivities (i.e., functional groups, number of carbon atoms, hydrocarbon saturation; see Fig. 2), which affect the ON species formed in gas and particle phases. In Fig. 6, we plot the signal intensity of organic compounds containing at least one nitrogen and three oxygens (which is the minimum number for an ON species), detected by various CIMS instruments in the gas phase (by -Vocus and amine-ToF) and in the particle phase (by WALL-E) detected as signal intensity, to show the ON composition. We choose to show the ON composition from the experiment of limonene for the single-compound precursor, the experiment with VCP mixture for the urban emission mixture, and the experiment of Los Angeles anthropogenic + biogenic emission replica for the complex urban mixture. Profiles for experiments with other VOC precursors are shown in Fig. S6.
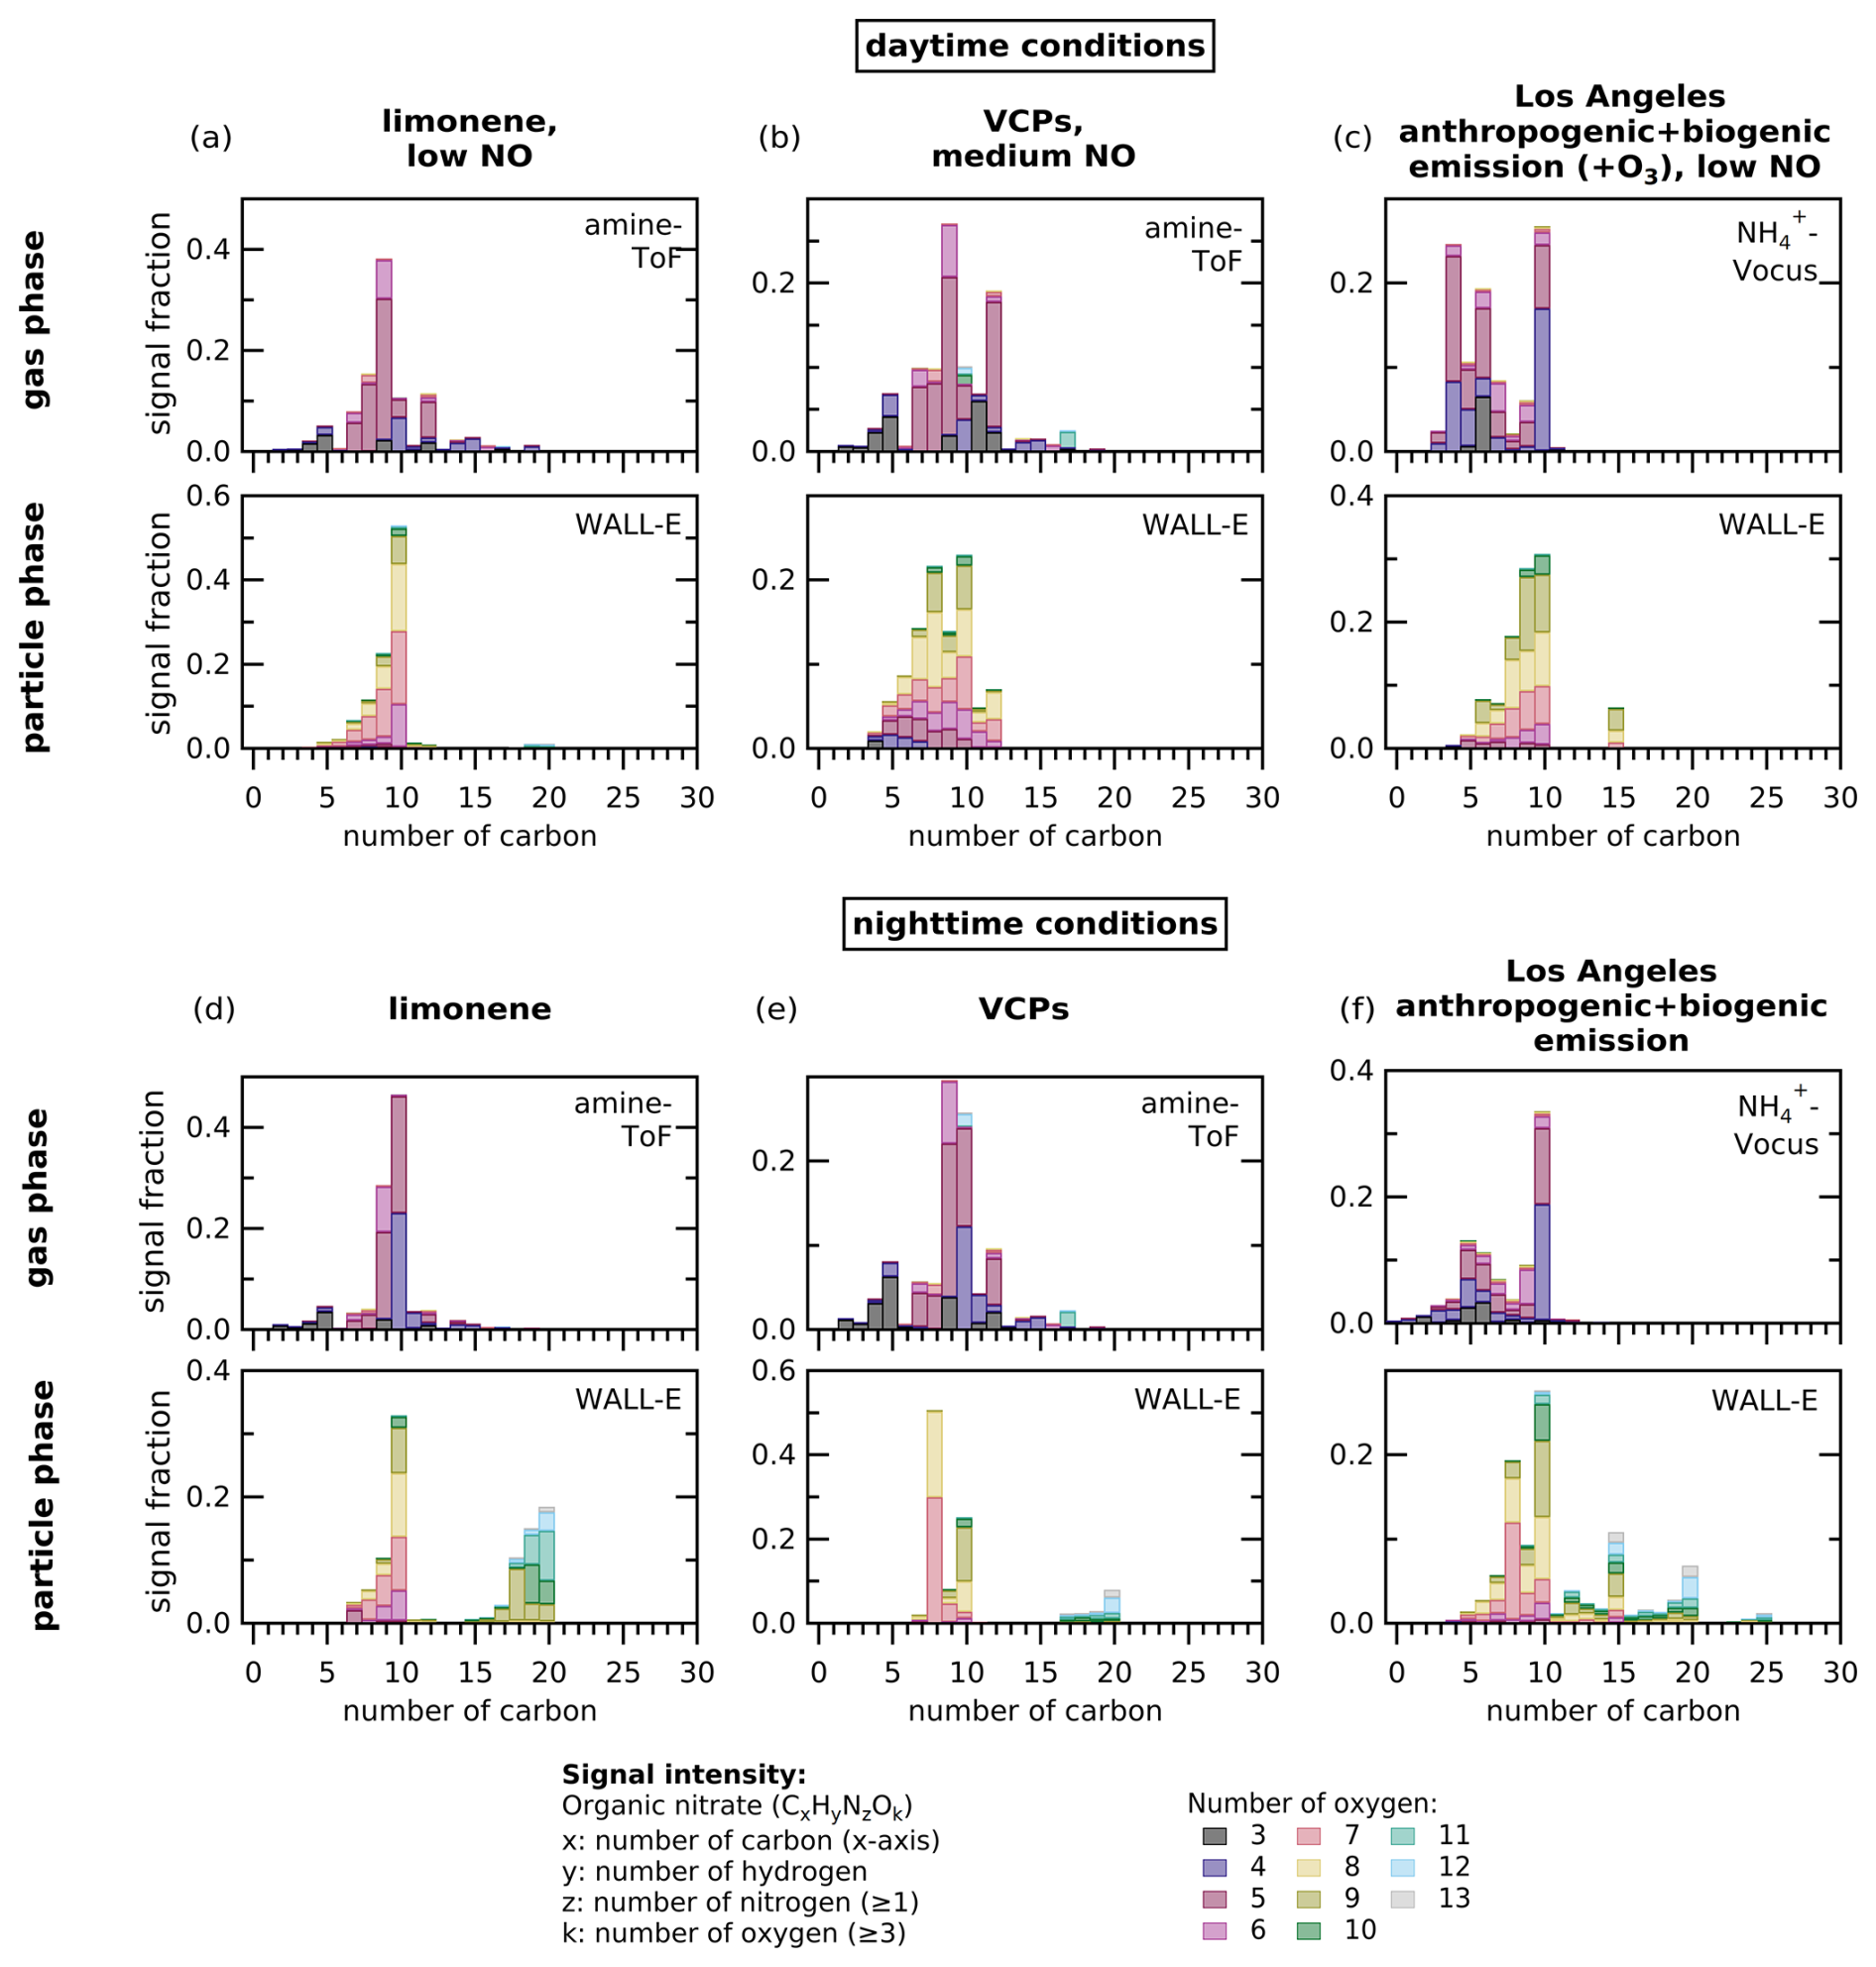
Figure 6(a–f) The ON composition profiles in the gas phase and particle phase for selected chamber experiments (i.e., limonene, VCPs, and Los Angeles anthropogenic + biogenic emission experiments in daytime and nighttime conditions) when SOA formation has been reached. Figure S6 shows other VOC mixtures. The profiles show the signal fraction from the total signal intensity of detected species (y axis) from either amine-ToF or -Vocus measurements in the gas phase and WALL-E measurements in the particle phase as function of the number of carbon (x axis). The plots only include compounds with at least one nitrogen atom and three oxygen atoms. The color of the bars represents the signal fraction of compounds with a given number of oxygen atoms for each carbon number to all considered species in an individual experiment.
The ON composition distribution shown here is an estimate of how the ON species signal is distributed across carbon and oxygen atom numbers, rather than the actual concentrations, as each detected species may have a different sensitivity in each instrument. In general, both in Figs. 6 and S6, we see that ON species are formed across varying numbers of carbon atoms in the gas phase. However, the distribution of carbon number of ON in the particle phase does not always match that in the gas phase. The ON species in the particle phase tend to be compounds with carbon numbers skewed around 10 (6–10) and 20 (15–20), which are largely associated with the carbon backbone of monoterpenes (either whole or fragmented into smaller compounds) and their dimers. In terms of oxygen atom number, ON tends to have fewer oxygen atoms (3–8) in the gas phase, while ON tends to be more oxygenated (more than 6 atoms) in the particle phase. This is intuitive from the point of view of volatility-driven gas-particle partitioning, where more oxygenated species have lower volatility and are therefore more likely to partition to the particle phase than less oxygenated species. The further oxidation of the ON species starting from the gas phase until they condense into the particle phase is part of SOA formation and aerosol aging, which shapes the ON composition distribution. We note, however, that the composition profile may include other organic nitrogen compounds such as oxygenated amines or nitro compounds.
The difference between the ON profiles of the daytime experiments (Figs. 6a–c and S6d) and the nighttime experiments (Figs. 6d–f and S6e) of limonene precursor, VCP mixtures, Los Angeles anthropogenic emission, Los Angeles anthropogenic + biogenic emission, and future city anthropogenic + biogenic emission profile is the most recognizable for the particle phase profile. In addition to species related to monoterpene compounds (carbon number 6–10), substantial signal fraction is observed for monoterpene dimers (carbon number 15–20) in the particle phase, where it represents 15 %–48 % of the total signal. A recent study shows that the mass fraction contribution of dimers is about a factor of 2 lower compared to its signal fraction (Gao et al., 2025).
This result shows that photooxidation promotes the formation of monoterpene nitrates with lower carbon atom numbers (6–10), while oxidation processes under nighttime conditions in the chamber may favor RO2• production that leads to more dimer formation. Under daytime conditions, it is likely that on top of long-chain unsaturated VOCs (e.g., compounds with C≥10 like monoterpenes) in the VOC mixtures, the short-chain unsaturated VOCs (e.g., alkenes with C≤5) also react with OH• to form short-chain RO2•. Short-chain RO2• later reacts with NOx to produce lower molecular weight ON compounds. Shorter-chain RO2• also means that the OH•-initiated oxidation is less likely to produce compounds with high carbon atom numbers when they undergo dimerization. Under nighttime conditions, the most abundant RO2• are likely to be from long-chain saturated VOCs because short-chain alkenes are less likely to react with NO3• to produce short-chain RO2•. These long-chain RO2• can form organic nitrate with high carbon atom numbers through dimerization. Since dimers have lower volatility than their monomer counterparts, they are more likely to condense into the particle phase, possibly driving the higher values for the nighttime experiments. Furthermore, NO3• may react with first-generation oxidation products, further oxidize low-oxygenated molecules into highly oxygenated nitrates with lower volatility, which then condense onto particles (Guo et al., 2022).
In contrast, the daytime experiments using VOC precursors from diesel, gasoline, and cooking emissions show less species diversity in the particle phase (Fig. S6a–c). These VOC precursor mixtures do not contain any or only trace amounts of biogenic compounds (2 % or less), and instead more anthropogenic VOCs from the alkane, alkenes, aromatic, and/or aldehyde compound family. This suggests that although these compounds may react to form ON in the gas phase and in the particle phase, they mostly produce high-volatility compounds that are less likely to condense into the particle phase and form SOA.
These interpretations require further analysis, as the ratio between the signals can change dramatically depending on the sensitivity of each compound or , and how they fragment. Additionally, thermal decomposition may also affect the measured particle phase, and thus the species distribution profile of ON. Nevertheless, these findings give some insight that even in a very complex urban emission and changing urban emission composition (for instance Los Angeles anthropogenic + biogenic emission scenario vs. future city anthropogenic + biogenic emission scenario), terpenes (either coming from biogenic sources or anthropogenic sources like VCPs) have a large impact shaping the ON species distribution in the bulk aerosol composition.
3.3.3 Observed vs. theoretical gas-particle partitioning coefficient (Kp,ON)
We compare the observed Kp,ON at equilibrium (calculated using Eq. 6) for the different chamber experiments as a function of the average temperature in the chamber under equilibrium conditions (Teq,avg) in Fig. 7. We visualize the results in this way because Kp,ON depends on temperature. The value of Kp,ON is calculated based on the calibrated measurements of total NOy, NOx, HONO, HNO3 (MR-CIMS), and pNO3 (AMS). A summary of Kp,ON values, concentrations, and temperatures used for the calculations for all experiments can be found in Tables S6 and S7.
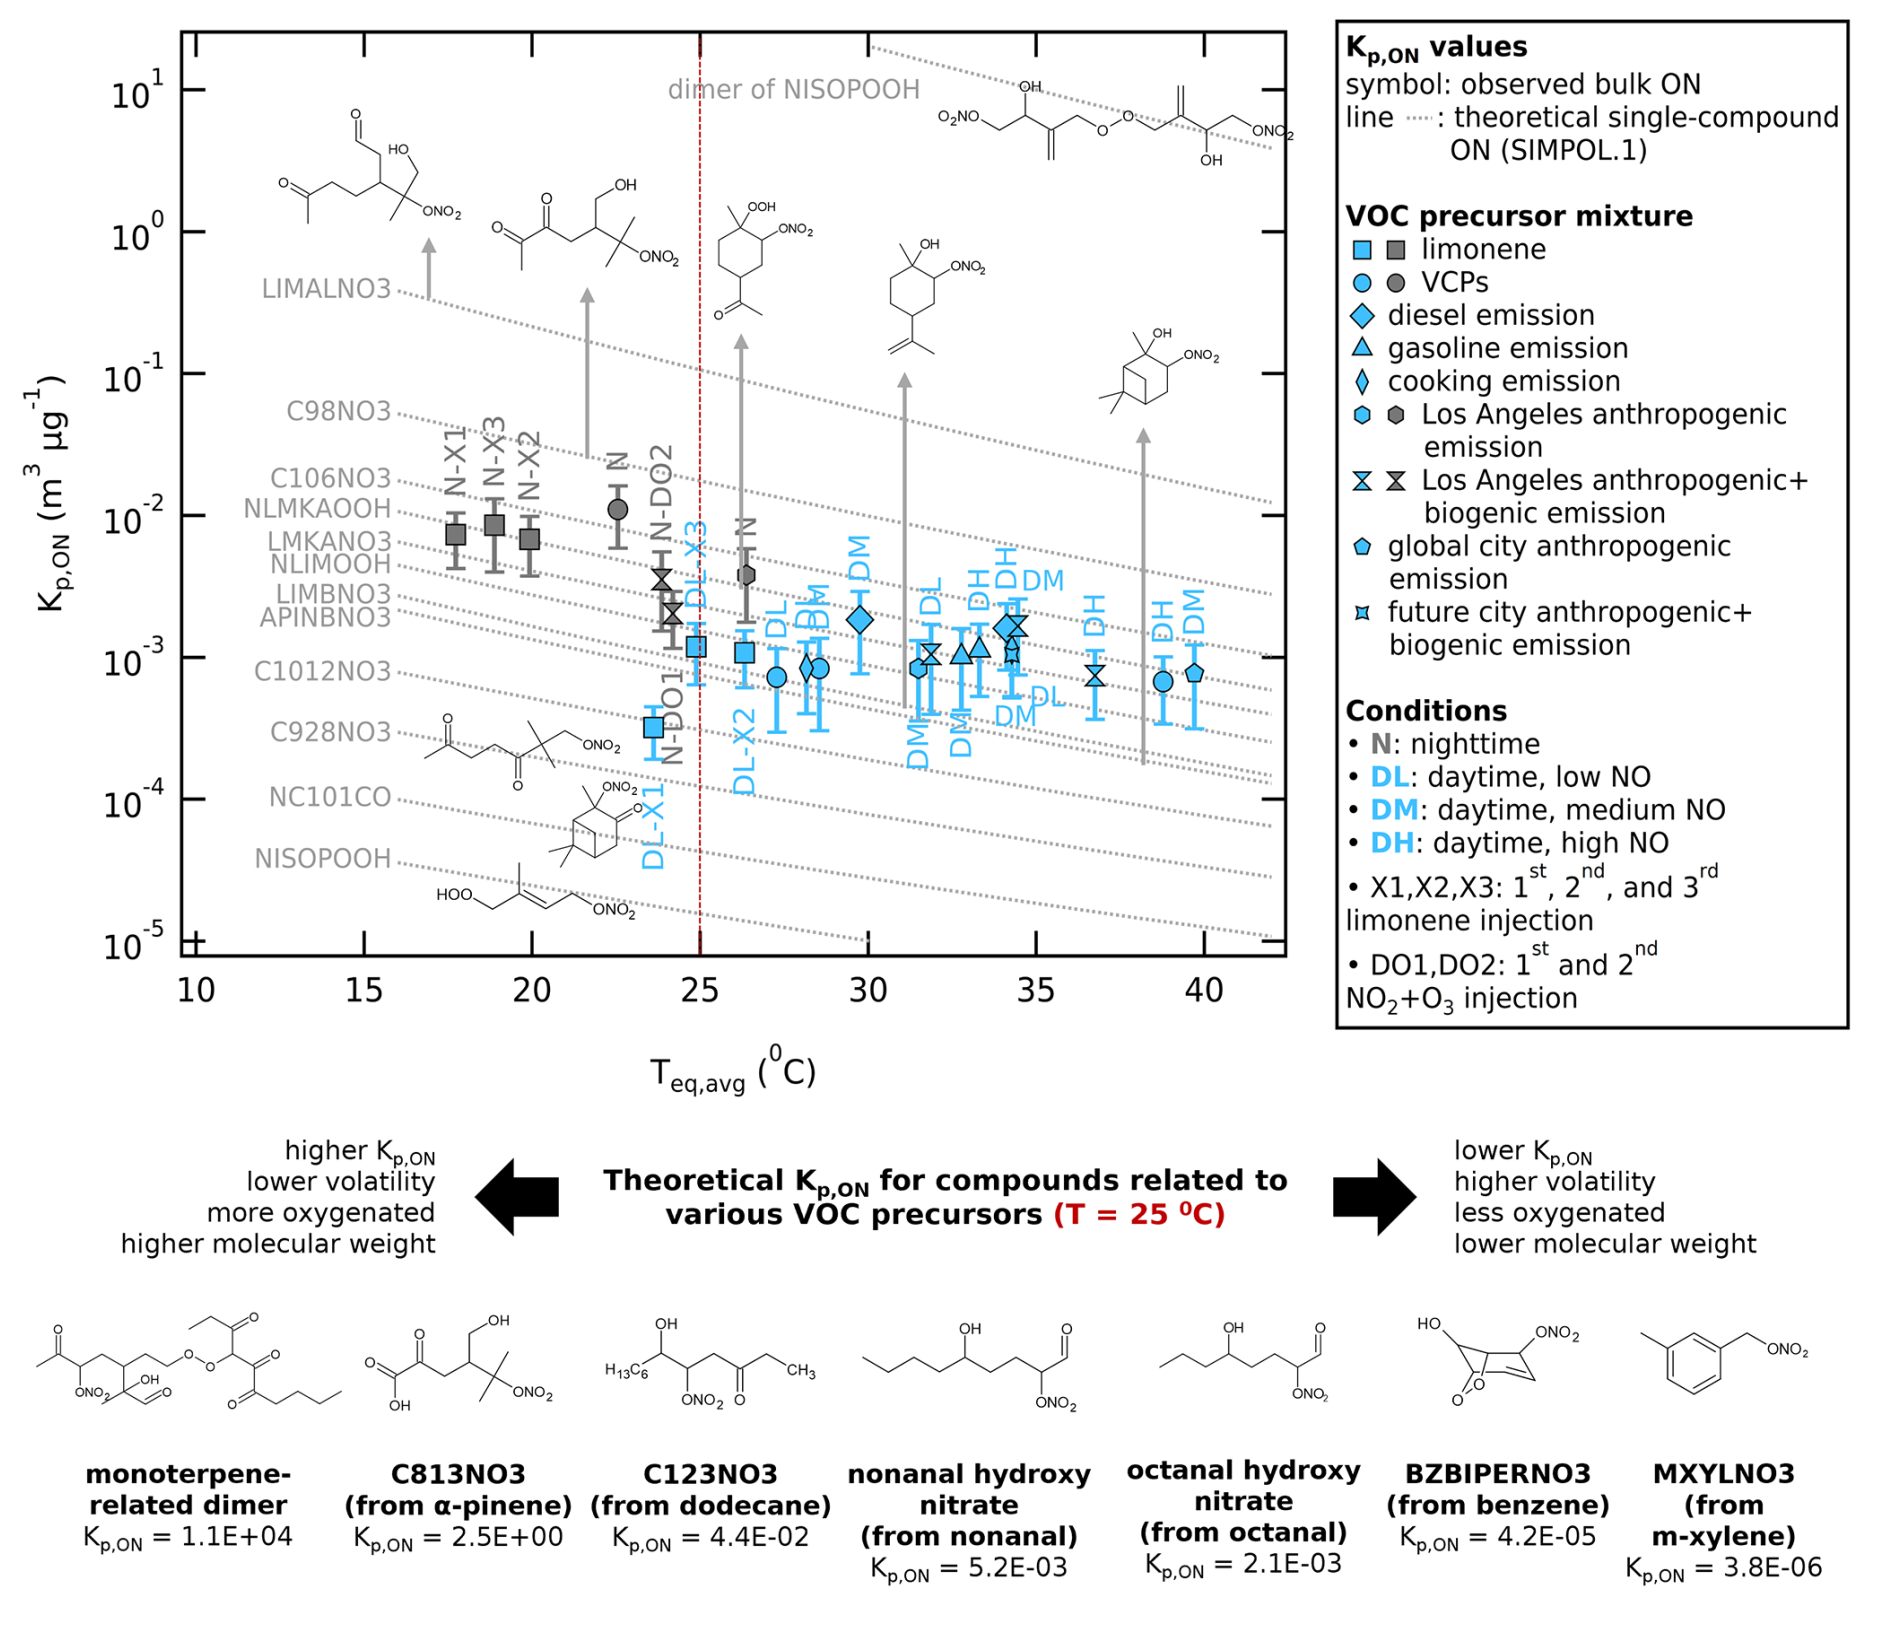
Figure 7Scatter plot of Kp,ON against the average chamber temperature at equilibrium (Teq,avg) for various urban VOC-NOx mixture experiments, color-coded by daytime and nighttime conditions. The whiskers represent ±46 % uncertainty (one standard deviation) of the bulk Kp,ON. The grey dashed lines show temperature-dependent theoretical Kp,ON calculated using SIMPOL.1 method for various ON compounds, mostly from isoprene (e.g., NISOPOOH and dimer of NISOPOOH), α-pinene (e.g., NC101CO, APINBNO3), and limonene (e.g., C928NO3, C1012NO3, LIMBNO3, NLIMOOH, LMKANO3, NLMKAOOH). The chemical structures are not observed from the measurements but based on the detected by the instruments as comparison to the observed bulk Kp,ON. Chemical structures of selected ON compounds (representative) are shown in and below the plot.
We found that the nighttime experiments of limonene precursor, VCP mixtures, Los Angeles emission profile, and Los Angeles anthropogenic + biogenic emission profile have higher mean Kp,ON values, m3 µg−1 at T=295 ± 3 K (mean ± standard deviation) compared to the daytime experiments with the same precursor, m3 µg−1 at T=303 ± 5 K). Similarly to the trend of the particle-to-gas ratio, lower chamber temperatures and higher RHs under nighttime conditions enhance the condensation of chemical species to the particle phase.
This may seem biased since the daytime experiments are never done at lower temperature (and vice versa). However, because nighttime temperatures are lower than daytime temperatures in the real world, these results represent realistic scenarios. The Clausius-Clapeyron sensitivity analysis using Kp,ON values under daytime and nighttime conditions of the same VOC precursor mixtures suggests that the daytime-nighttime Kp,ON difference is not solely due to temperature. The daytime-nighttime Kp,ON difference, if solely driven by temperature, would produce a ΔHvap of ∼170 kJ mol−1. This value is higher than the range of ΔHvap values for semi-volatile organic compounds, 70–120 kJ mol−1 for the volatility range of (Pankow and Asher, 2008; Epstein et al., 2010). This confirms that the daytime-nighttime Kp,ON differences are not driven solely by vaporization thermodynamics, but rather due to different particle chemical composition. Under nighttime conditions, the particles contain much less volatile nitrates and higher molecular weight compounds compared to daytime conditions that modify the physical properties of the aerosol phase, decreasing its volatility and thus increasing the nighttime Kp,ON. This daytime-nighttime ΔHvap and Kp,ON offsets is consistent with WALL-E observations showing higher signal contribution from dimers in the particle phase in the nighttime experiments (Fig. 6).
Furthermore, when we examine the Kp,ON values at temperatures between 24 and 27 °C, for which both daytime and nighttime experiments were conducted, we see that the trend of higher Kp,ON for nighttime experiments compared to daytime experiments still holds for similar temperatures. The uncertainty range also overlaps minimally between the Kp,ON values. This reiterates that the difference in Kp,ON between nighttime and daytime conditions is due not only to temperature differences, but also to actual differences in chemical pathways.
Under daytime conditions, NO concentrations are relatively high, and small alkenes and other short-chain VOCs react with OH• to form short-chain RO2•. As a result, the long-chain RO2• + RO2• pathway is likely minor relative to reactions of long-chain RO2• with short-chain RO2•, NO, and HO2•. Even in the daytime limonene experiment, where we have only C10 as precursor, C10 RO2• is more likely to react with NOx to form ON than to undergo dimerization (see Fig. 6a), leading to fewer high-molecular-weight ON compounds, thus resulting in lower Kp,ON.
In contrast, the nighttime RO2• formation in the Los Angeles VOC precursor mixture is likely to be produced mainly from high-carbon unsaturated VOCs (e.g., monoterpenes), which can produce long-chain RO2• that undergo dimerization under near-zero NO conditions (Fig. 6f). However, these dimers are not observed in the gas phase, possibly because they rapidly condense into particles or are lost during sampling. Oxidation by NO3• also may occur with primary oxidation products to form more oxidized organic nitrates with lower volatility (Guo et al., 2022), which also increases Kp,ON.
The ON species shown in Fig. 7 to calculate the theoretical Kp,ON values using the SIMPOL.1 group contribution method (Eq. 8) are chosen as a comparison with the observed Kp,ON (calculated using Eq. 6). It should be noted that the ON compounds presented in Fig. 7 could not be specifically identified with the analytical techniques employed in this study; but are associated with the predominant values detected by the instruments (see Fig. 6). Most of the chemical structures were taken from the Master Chemical Mechanism, MCM v3.3.1 (Jenkin et al., 1997; Saunders et al., 2003; Jenkin et al., 2003; Bloss et al., 2005; Jenkin et al., 2015), via https://www.mcm.york.ac.uk (last access: 30 October 2025). Higher Kp,ON values are typically associated with more oxygenated compounds and higher molecular weight, which lowers the compound's volatility. The purpose of showing the compounds is to contextualize the types of chemical structures consistent with observed Kp,ON values, and their typical oxygen number and molecular weights. The estimation of volatility to calculate Kp,ON using group contribution methods is not without uncertainty, as different computational methods provide a wide range of vapor pressures (Kurtén et al., 2016; Peräkylä et al., 2020). Kurtén et al. (2016) pointed out the limited ability of group contribution methods to distinguish between positional isomers, since the model only takes into account the presence of functional groups in the structure. The volatility of compounds with a larger number of functional groups is likely to be overestimated (Peräkylä et al., 2020; Räty et al., 2021); increasing oxygenation of organic compounds was found to correspond to a more gradual decrease in volatility than expected based on many existing models, such as SIMPOL.
The range of observed Kp,ON of the bulk ON is found to be in the same magnitude as theoretical Kp,ON values calculated using the SIMPOL.1 method for many ON species formed from monoterpenes (e.g., LIMALNO3, C98NO3, C106NO3, NLMKAOOH, LMKANO3, NLIMOOH, LIMBNO3, C1012NO3, C928NO3, APINBNO3; notations from MCM) and ON species formed from long-chain aldehydes such as octanal and nonanal (e.g., octanal hydroxy nitrate, nonanal hydroxy nitrate), known to also be an important urban VOC precursor (Bowman et al., 2003; Coggon et al., 2024). These compounds have Kp,ON values that range between those of isoprene-related species (e.g., NISOPOOH, more volatile) and their dimers (e.g., dimer of NISOPOOH, less volatile).
The match between the observed Kp,ON values and the theoretical bulk ON structure is especially clear for the single-compound experiment using limonene, as limonene nitrate products are expected (see their ON profiles in Fig. 6a and d). The nighttime limonene experiment shows higher average Kp,ON values compared to the daytime limonene experiment due to monoterpene dimers that have higher Kp,ON values. In experiments with cooking emission profile, the observed Kp,ON values of the bulk ON are similar to the theoretical Kp,ON values for the long-chain aldehyde nitrates and the monoterpene nitrates. This likely occurs because the replicated VOC mixture from cooking emission contains 66 % of aldehydes and 1 % of limonene, which are oxidized into ON compounds.
The Kp,ON values for the bulk ON in the experiments with VOCs originating from gasoline and diesel emissions are also comparable to that of monoterpene-related ON species. This is interesting since these emission profiles do not contain any monoterpenes in the VOC precursor mixture (∼50 % is alkene, and alkanes are the second highest component). Figure S6a and b also shows that the ON profiles of the experiment with diesel and gasoline emission replicas do not match the ON profiles of the limonene precursor experiment. Thus, the bulk Kp,ON is most likely determined by the mixture of higher volatility ON species (e.g., MXYLNO3 from m-xylene, BZBIPERNO3 from benzene) and lower volatility ON species (e.g., C123NO3 from dodecane) that average to a volatility similar to monoterpene nitrates.
The ON profiles of VCP mixture and complex urban mixtures (Los Angeles emission replicas; see Figs. 6b, c, e, f and S6e, f) resemble more the ON profile from the limonene experiments despite having only 1 %–6 % monoterpenes in the precursor mixture. This can be related to the high reactivity of limonene and α-pinene in the mixture. A higher contribution from C8 compounds can also be observed in the nighttime ON profiles of these experiments (see Figs. 6e, f and S6f). This increase could be attributed to the secondary oxidation products of pinene with very low volatility (e.g., C813NO3), formed from pinene precursors that are present exclusively in VCPs and complex urban precursor mixtures.
Although WALL-E observations suggest that the C>10 compounds represent higher fraction of the total signal in the particle phase in the nighttime experiments, the observed nighttime Kp,ON values do not approach theoretical Kp,ON values of dimers, likely due to the mass dominance of monomer nitrates. The dimer contribution fraction from WALL-E in this study is based on the total signal intensity, while the values of Kp,ON are determined based on calibrated mass concentrations from total NOy and AMS instruments. A structure- and temperature-independent volatility estimation using 2D-VBS mapping (Fig. 5) also showed that the nighttime experiments indeed formed lower volatile compounds.
The above results indicate that the bulk volatility of total ON broadly agrees with the individually detected chemical species using high-resolution chemical ionization mass spectrometers. With the calibration and determination of compounds' sensitivity for each instrument, it may be possible to directly validate the agreement between the bulk partitioning and a weighted average of the partitioning coefficients calculated for the major species. These results underscore the importance of monoterpenes in the formation of pON during SOA formation in a complex urban mixture, where the bulk volatility of ON behaves similar to monoterpenes.
We have presented the molar yield, molecular weight estimate, and the gas-particle partitioning of bulk organic nitrate in different VOC-NOx precursor mixtures in the SAPHIR-CHANEL chamber experiments. We observe the importance of unsaturated VOCs (e.g., monoterpenes, isoprene, aldehydes, alkenes) in modifying the organic nitrate molar yield, where higher yields are found in experiments with a higher percentage of unsaturated VOC precursors in the precursor mixture. The yield is found to be 19 % for experiments using limonene precursor, 11 %–21 % for experiments using VOCs from traffic and cooking emission, and 2 %–7 % for experiments with VCPs and complex urban mixture as precursors.
Regarding the particle phase organic nitrate, the characterization of the molecular weight of bulk particulate organic nitrate based on signal intensity of chemical ionization mass spectrometer shows that the average molecular weight is 250 g mol−1 under daytime conditions and 330 g mol−1 under nighttime conditions. This difference is mainly caused by the higher contribution of heavier compounds such as dimers and lower contribution of lighter compounds during nighttime organic nitrate formation. The mass fraction of particulate organic nitrate to the total organic aerosol is enhanced by nighttime conditions (32 %–53 %) when the nitrate radical chemistry is dominant, a factor of 2.6 to 4.5 higher compared to daytime conditions (9 %–20 %) when the hydroxyl radical chemistry is dominant. The ozonolysis chemistry may also have influence on these differences, but we expect the observed daytime vs. nighttime differences are mainly due to contrasting hydroxyl radical and nitrate radical chemistry. Overall, this finding provides new insights in the average molecular weight of organic nitrate and its contribution to SOA formation in realistic urban atmospheric mixtures. However, further analysis is required that considers the instrument's sensitivity across different organic nitrate compounds when determining the precise composition and molecular weight of bulk particulate organic nitrate.
In gas-particle partitioning, we observe that the nighttime conditions (lower temperature, high relative humidity, and nitrate radical chemistry) enhance the formation of low-volatility organic nitrates that partition to the particle phase, which has been observed in previous studies (Hallquist et al., 1997; Griffin et al., 1999; Spittler et al., 2006; Ng et al., 2008; Fry et al., 2009, 2011; Rollins et al., 2009; Boyd et al., 2015; Ng et al., 2017). This is represented by higher particle-to-gas ratios for experiments under nighttime conditions (0.030–0.137) compared to daytime conditions (0.007–0.045). The two-dimensional volatility basis set shows that the volatility of organic nitrates ranges between and matches the volatility of C5 to C10 compounds, where the volatility of ON from experiments under nighttime conditions are less volatile (more similar to C10 compounds). From the organic nitrate profiles, we highlight that organic nitrate formation occurs across a wide range of gas phase species for every VOC precursor mixture, mainly with lower oxygenation (3–8 oxygen atoms). However, only species with a volatility similar to or lower than that of monoterpene nitrates mainly with higher oxygenation (>6 oxygen atoms) are observed to partition into the particle phase. The observed gas-particle partitioning coefficient, when treated as a bulk compound at equilibrium, shows that the bulk organic nitrate is comparable to the calculated values of monoterpene-related species using SIMPOL.1 method (Kp,ON from 10−4 to 10−2 m3 µg−1 at 18–40 °C), regardless of the complexity of the mixture. Nighttime oxidation produces bulk ON with lower O:C ratio and volatility (lower , higher Kp,ON) due to the higher degree of dimerization compared to the daytime oxidation. However, future studies should further investigate the specific particulate organic nitrate composition. The observed partitioning does not consider the thermal decomposition of organic nitrate compounds, and the chemical speciation measurements by the chemical ionization mass spectrometers only report signal intensity, not the concentration (sensitivity of each compound is uncertain). The group contribution method also typically overestimates the volatilities of compounds with higher oxygen numbers and is unable to distinguish positional isomers.
This work highlights the importance of biogenic VOCs and nighttime chemistry in shaping the molecular weight and bulk volatility of ON in complex urban mixtures with changing emission profiles (comparing Los Angeles, global cities, and future city emission scenario). In general, these findings can help us to model organic nitrate aerosol in complex urban atmospheres. This work provides the empirical information regarding the diurnal contrast of bulk organic nitrate yield, molecular weight, SOA mass fraction, and volatility, which can improve the accuracy of chemical transport models. This information is needed for better predictions of how nitrogen reservoir species will respond to a warming climate, which can affect urban air quality and nitrate deposition on ecosystems.
| AEROMMA | Atmospheric Emissions and Reactions Observed from Megacities to Marine Areas |
| amine-ToF | amine-reagent chemical ionization time-of-flight mass spectrometer |
| bC | carbon-carbon interaction term |
| bO | oxygen-oxygen interaction term |
| bCO | carbon-oxygen non-ideality |
| Cg,i | concentration/mixing ratio of species i in the gas phase |
| CgON | concentration/mixing ratio of organic nitrate in the gas phase |
| CHANEL | Household Chemicals Amplifying Urban Aerosol Pollution |
| CON,tot | concentration/mixing ratio of total organic nitrate (gas phase and particle phase) |
| Cp,i | concentration/mixing ratio of species i in the particle phase |
| particle-to-gas ratio of species i | |
| CpON | concentration/mixing ratio of organic nitrate in the particle phase (nitrate moiety) |
| particle-to-gas ratio of organic nitrate | |
| concentration of organic nitrate in the particle phase (organic + nitrate moiety) | |
| effective saturation concentration | |
| saturation concentration over a pure liquid | |
| -D | experiment label for daytime conditions |
| -DH | experiment label for daytime high NO condition |
| -DL | experiment label for daytime low NO condition |
| -DM | experiment label for daytime medium NO condition |
| EHN | 2-ethylhexyl nitrate |
| fom | absorptive organic fraction of the PM |
| FID | flame ionization detector |
| GC | gas chromatography |
| gON | gas phase organic nitrate |
| HNO3 | nitric acid |
| HO2• | hydroperoxyl radical |
| HOM | highly oxygenated molecule |
| HONO | nitrous acid |
| HR-ToF-AMS | high-resolution time-of-flight aerosol-mass-spectrometer |
| IE | ionization efficiency |
| IVOC | intermediate-volatility organic compound |
| photolysis rate coefficient of NO2 | |
| Kp,i | gas-particle partitioning coefficient of species i |
| Kp,ON | gas-particle partitioning coefficient of organic nitrate |
| Mo | molybdenum |
| MR-CIMS | multi-reagent chemical ionization mass spectrometer |
| MR-CIMS- | MR-CIMS with benzene-reagent ions |
| MR-CIMS-I− | MR-CIMS with iodide-reagent ions |
| mtot | total absorptive mass of particulate matter |
| MWom | average molecular weight of the organic matter |
| MW | molecular weight of bulk particulate organic nitrate as pRONO2 |
| mass-to-charge ratio | |
| mass resolution | |
| -N | experiment label for nighttime conditions or NO3• chemistry |
| -N-DO | experiment label for nighttime conditions with NO2 + O3 injections at multiple times |
| carbon number of a 1 µg m−3 alkane | |
| carbon number | |
| effective oxygen number | |
| oxygen-to-carbon ratio, or O:C ratio | |
| N2O5 | nitrogen pentoxide |
| NH3 | ammonia |
| ammonium | |
| -Vocus | ammonium-reagent Vocus chemical ionization mass spectrometer |
| NH4NO3 | ammonium nitrate |
| (NH4)2SO4 | ammonium sulfate |
| NO | nitrogen monoxide |
| NO2 | nitrogen dioxide |
| NO3 | nitrate (as functional group) |
| inorganic nitrate (in the particle phase) | |
| NO3• | nitrate radical |
| NOx | nitrogen oxides |
| ratio | -to-NO+ signal ratio in AMS |
| NOy | total odd nitrogen species |
| NOz | nitrogen reservoir species |
| O3 | ozone |
| OH• | hydroxy radical |
| ON | organic nitrate |
| Org | organic species (measured by AMS) |
| PEEK | polyetheretherketone |
| PM | particulate matter |
| PM2.5 | particulate matter with size <2.5 µm |
| pNO3 | particulate nitrate |
| pON | particulate organic nitrate (only nitrate moiety) |
| pRONO2 | particulate organic nitrate (organic and nitrate moiety) |
| pure liquid vapor pressure of i at given temperature | |
| RH | relative humidity |
| RHeq,avg | average relative humidity at equilibrium |
| RONO2 | alkyl nitrate (or organic nitrate in general) |
| RO2• | organic peroxy radical |
| SAPHIR | Simulation of Atmospheric PHotochemistry In a large Reaction Chamber |
| SOA | secondary organic aerosol |
| SVOC | semi-volatile organic compounds |
| T | temperature |
| Teq,avg | average chamber temperature at equilibrium |
| ToF | time-of-flight |
| VCPs | volatile chemical products |
| VOCs | volatile organic compounds |
| -X | experiment label for limonene precursor injection at multiple times |
| ΔCOA | concentration of total organic aerosol formed (Org + pON) |
| ΔCON,tot | total concentration of organic nitrate formed(gas and particle phases) |
| ΔCVOC,tot | total concentration/mixing ratio of consumed VOCs |
| molar yield of organic nitrate to the total consumed VOCs | |
| concentration of particulate organic nitrate (organic + nitrate moiety) formed | |
| mass fraction of pRONO2 to the total organic aerosol formed | |
| ΔHvap | enthalpy of vaporization |
| ζ | activity coefficient |
The data set from the SAPHIR-CHANEL campaign is available at https://doi.org/10.26165/JUELICH-DATA/SYIRWS (Gkatzelis et al., 2026).
The supplement related to this article is available online at https://doi.org/10.5194/acp-26-8425-2026-supplement.
Georgios I. Gkatzelis designed and coordinated the CHANEL campaign. Juliane L. Fry and Farhan R. Nursanto designed the analysis strategy. Farhan R. Nursanto analyzed the combined data set and led the paper writing. Yizhen Wu, Ralf Tillmann, Kelvin H. Bates, Matthew M. Coggon, and Chelsea E. Stockwell designed the urban emission fingerprint. Eva Y. Pfannerstill designed the biogenic emission fingerprints. Anna Novelli designed the limonene experiments. Juliane L. Fry and Matthieu Riva designed the nighttime experiments. Christian Wesolek and Ralf Tillmann designed the VOC inlet. Franz Rohrer was in charge of the data management. Farhan R. Nursanto, Sophia van de Wouw, and Juliane L. Fry maintained the NOy instrument. Farhan R. Nursanto, Willem S. J. Kroese, and Rupert Holzinger characterized the NOy instrument. Quanfu He, Annika Zanders, and Thorsten Hohaus maintained the AMS instrument. Robert Wegener, Max Gerrit Adam, Benjamin Winter, René Dubus, Lukas Kesper, and Franz Rohrer maintained the NOx, O3, and HONO monitors. Andrea Carolina Marcillo Lara and Achim Grasse maintained the TD-GC-FID/MS instrument. Yuwei Wang, Emily Matthews, Aristeidis Voliotis, Thomas J. Bannan, Gordon McFiggans, and Hugh Coe maintained the MR-CIMS instrument. Yizhen Wu, Milan Roska, Manjula Canagaratna, Mitch Alton, Matthew M. Coggon, Chelsea E. Stockwell, and Kelvin H. Bates maintained the -Vocus instrument. Sören R. Zorn and Hui Wang maintained the amine-ToF instrument. Matthieu Riva, Sebastien Perrier, Milan Roska, Boxing Yang, and Lu Liu maintained the WALL-E instrument. All co-authors reviewed and edited the paper.
The authors have the following competing interests: At least one of the (co-)authors is a member of the editorial board of Atmospheric Chemistry and Physics.
Publisher's note: Copernicus Publications remains neutral with regard to jurisdictional claims made in the text, published maps, institutional affiliations, or any other geographical representation in this paper. The authors bear the ultimate responsibility for providing appropriate place names. Views expressed in the text are those of the authors and do not necessarily reflect the views of the publisher.
The authors acknowledge the SAPHIR team for technical support and operation of the chamber during the SAPHIR-CHANEL campaign, which also include Andreas Wahner (FZJ), Carsten Warneke (NOAA), Steve Brown (NOAA), Birger Bohn (FZJ), and Sergej Wedel (FZJ). We thank Wendy Beekman-Lukassen (Laboratory AEW-WUR), Frits Gillissen (Laboratory AEW-WUR), and Reinder Ronda (KNMI, formerly MAQ-WUR) for providing help in obtaining chemicals for the NOy instrument characterization. We also thank Henk Snellen (WUR), Han Scaf (DCMR), Hugo Bison (DCMR), and Özgür Erdogan (FZJ) for helping with the NOy instrument calibration support. Finally, artificial intelligence tools were used for coding assistance and editorial support to improve text clarity and phrasing. The authors take full responsibility for the scientific content and interpretation of the results.
This campaign is supported by the European Research Council (ERC) under the European Union's Horizon Europe research and innovation program through the Starting Grant CHANEL (grant no. 101076276), which provided the primary funding for the CHANEL campaign. Additional support for SAPHIR chamber operations was provided by the European Commission (EC) ATMO-ACCESS Transnational Access program (grant no. 101008004). We also acknowledge funding from ERC Starting Grant MAARvEL (grant no. 852161) and Wageningen University.
This paper was edited by Ivan Kourtchev and reviewed by three anonymous referees.
Adams, P. J., Seinfeld, J. H., and Koch, D. M.: Global concentrations of tropospheric sulfate, nitrate, and ammonium aerosol simulated in a general circulation model, J. Geophys. Res.-Atmos., 104, 13791–13823, https://doi.org/10.1029/1999JD900083, 1999. a
Adams, P. J., Seinfeld, J. H., Koch, D., Mickley, L., and Jacob, D.: General circulation model assessment of direct radiative forcing by the sulfate-nitrate-ammonium-water inorganic aerosol system, J. Geophys. Res.-Atmos., 106, 1097–1111, https://doi.org/10.1029/2000JD900512, 2001. a
Apel, E. C., Brauers, T., Koppmann, R., Bandowe, B., Boßmeyer, J., Holzke, C., Tillmann, R., Wahner, A., Wegener, R., Brunner, A., Jocher, M., Ruuskanen, T., Spirig, C., Steigner, D., Steinbrecher, R., Gomez Alvarez, E., Müller, K., Burrows, J. P., Schade, G., Solomon, S. J., Ladstätter-Weißenmayer, A., Simmonds, P., Young, D., Hopkins, J. R., Lewis, A. C., Legreid, G., Reimann, S., Hansel, A., Wisthaler, A., Blake, R. S., Ellis, A. M., Monks, P. S., and Wyche, K. P.: Intercomparison of oxygenated volatile organic compound measurements at the SAPHIR atmosphere simulation chamber, J. Geophys. Res.-Atmos., 113, 2008JD009865, https://doi.org/10.1029/2008JD009865, 2008. a
Bauer, S. E., Koch, D., Unger, N., Metzger, S. M., Shindell, D. T., and Streets, D. G.: Nitrate aerosols today and in 2030: a global simulation including aerosols and tropospheric ozone, Atmos. Chem. Phys., 7, 5043–5059, https://doi.org/10.5194/acp-7-5043-2007, 2007. a, b
Baylon, P., Jaffe, D., Wigder, N., Gao, H., and Hee, J.: Ozone enhancement in western US wildfire plumes at the Mt. Bachelor Observatory: The role of NOx, Atmos. Environ., 109, 297–304, https://doi.org/10.1016/j.atmosenv.2014.09.013, 2015. a, b
Berndt, T.: Peroxy Radical Processes and Product Formation in the OH Radical-Initiated Oxidation of α-Pinene for Near-Atmospheric Conditions, J. Phys. Chem. A, 125, 9151–9160, https://doi.org/10.1021/acs.jpca.1c05576, 2021. a
Bian, H., Chin, M., Hauglustaine, D. A., Schulz, M., Myhre, G., Bauer, S. E., Lund, M. T., Karydis, V. A., Kucsera, T. L., Pan, X., Pozzer, A., Skeie, R. B., Steenrod, S. D., Sudo, K., Tsigaridis, K., Tsimpidi, A. P., and Tsyro, S. G.: Investigation of global particulate nitrate from the AeroCom phase III experiment, Atmos. Chem. Phys., 17, 12911–12940, https://doi.org/10.5194/acp-17-12911-2017, 2017. a
Bloss, C., Wagner, V., Jenkin, M. E., Volkamer, R., Bloss, W. J., Lee, J. D., Heard, D. E., Wirtz, K., Martin-Reviejo, M., Rea, G., Wenger, J. C., and Pilling, M. J.: Development of a detailed chemical mechanism (MCMv3.1) for the atmospheric oxidation of aromatic hydrocarbons, Atmos. Chem. Phys., 5, 641–664, https://doi.org/10.5194/acp-5-641-2005, 2005. a
Bossmeyer, J., Brauers, T., Richter, C., Rohrer, F., Wegener, R., and Wahner, A.: Simulation chamber studies on the NO3 chemistry of atmospheric aldehydes, Geophys. Res. Lett., 33, 2006GL026778, https://doi.org/10.1029/2006GL026778, 2006. a
Bowman, J. H., Barket, D. J., and Shepson, P. B.: Atmospheric Chemistry of Nonanal, Environ. Sci. Technol., 37, 2218–2225, https://doi.org/10.1021/es026220p, 2003. a
Boyd, C. M., Sanchez, J., Xu, L., Eugene, A. J., Nah, T., Tuet, W. Y., Guzman, M. I., and Ng, N. L.: Secondary organic aerosol formation from the β-pinene + NO3 system: effect of humidity and peroxy radical fate, Atmos. Chem. Phys., 15, 7497–7522, https://doi.org/10.5194/acp-15-7497-2015, 2015. a, b
Brauers, T., Bossmeyer, J., Dorn, H.-P., Schlosser, E., Tillmann, R., Wegener, R., and Wahner, A.: Investigation of the formaldehyde differential absorption cross section at high and low spectral resolution in the simulation chamber SAPHIR, Atmos. Chem. Phys., 7, 3579–3586, https://doi.org/10.5194/acp-7-3579-2007, 2007. a
Brownwood, B., Turdziladze, A., Hohaus, T., Wu, R., Mentel, T. F., Carlsson, P. T. M., Tsiligiannis, E., Hallquist, M., Andres, S., Hantschke, L., Reimer, D., Rohrer, F., Tillmann, R., Winter, B., Liebmann, J., Brown, S. S., Kiendler-Scharr, A., Novelli, A., Fuchs, H., and Fry, J. L.: Gas-Particle Partitioning and SOA Yields of Organonitrate Products from NO3-Initiated Oxidation of Isoprene under Varied Chemical Regimes, ACS Earth and Space Chemistry, 5, 785–800, https://doi.org/10.1021/acsearthspacechem.0c00311, 2021. a, b
Canagaratna, M., Jayne, J., Jimenez, J., Allan, J., Alfarra, M., Zhang, Q., Onasch, T., Drewnick, F., Coe, H., Middlebrook, A., Delia, A., Williams, L., Trimborn, A., Northway, M., DeCarlo, P., Kolb, C., Davidovits, P., and Worsnop, D.: Chemical and microphysical characterization of ambient aerosols with the aerodyne aerosol mass spectrometer, Mass Spectrom. Rev., 26, 185–222, https://doi.org/10.1002/mas.20115, 2007. a
Clough, P. N. and Thrush, B. A.: Mechanism of chemiluminescent reaction between nitric oxide and ozone, T. Faraday Soc., 63, 915, https://doi.org/10.1039/tf9676300915, 1967. a
Coggon, M. M., Gkatzelis, G. I., McDonald, B. C., Gilman, J. B., Schwantes, R. H., Abuhassan, N., Aikin, K. C., Arend, M. F., Berkoff, T. A., Brown, S. S., Campos, T. L., Dickerson, R. R., Gronoff, G., Hurley, J. F., Isaacman-VanWertz, G., Koss, A. R., Li, M., McKeen, S. A., Moshary, F., Peischl, J., Pospisilova, V., Ren, X., Wilson, A., Wu, Y., Trainer, M., and Warneke, C.: Volatile chemical product emissions enhance ozone and modulate urban chemistry, P. Natl. Acad. Sci. USA, 118, https://doi.org/10.1073/pnas.2026653118, 2021. a
Coggon, M. M., Stockwell, C. E., Xu, L., Peischl, J., Gilman, J. B., Lamplugh, A., Bowman, H. J., Aikin, K., Harkins, C., Zhu, Q., Schwantes, R. H., He, J., Li, M., Seltzer, K., McDonald, B., and Warneke, C.: Contribution of cooking emissions to the urban volatile organic compounds in Las Vegas, NV, Atmos. Chem. Phys., 24, 4289–4304, https://doi.org/10.5194/acp-24-4289-2024, 2024. a, b, c
Day, D. A., Wooldridge, P. J., Dillon, M. B., Thornton, J. A., and Cohen, R. C.: A thermal dissociation laser-induced fluorescence instrument for in situ detection of NO2, peroxy nitrates, alkyl nitrates, and HNO3, J. Geophys. Res.-Atmos., 107, ACH 4-1–ACH 4-14, https://doi.org/10.1029/2001JD000779, 2002. a
Day, D. A., Campuzano-Jost, P., Nault, B. A., Palm, B. B., Hu, W., Guo, H., Wooldridge, P. J., Cohen, R. C., Docherty, K. S., Huffman, J. A., de Sá, S. S., Martin, S. T., and Jimenez, J. L.: A systematic re-evaluation of methods for quantification of bulk particle-phase organic nitrates using real-time aerosol mass spectrometry, Atmos. Meas. Tech., 15, 459–483, https://doi.org/10.5194/amt-15-459-2022, 2022. a, b
Donahue, N. M., Epstein, S. A., Pandis, S. N., and Robinson, A. L.: A two-dimensional volatility basis set: 1. organic-aerosol mixing thermodynamics, Atmos. Chem. Phys., 11, 3303–3318, https://doi.org/10.5194/acp-11-3303-2011, 2011. a, b
Drugé, T., Nabat, P., Mallet, M., and Somot, S.: Model simulation of ammonium and nitrate aerosols distribution in the Euro-Mediterranean region and their radiative and climatic effects over 1979–2016, Atmos. Chem. Phys., 19, 3707–3731, https://doi.org/10.5194/acp-19-3707-2019, 2019. a
Drummond, J. W., Volz, A., and Ehhalt, D. H.: An optimized chemiluminescence detector for tropospheric NO measurements, J. Atmos. Chem., 2, 287–306, https://doi.org/10.1007/BF00051078, 1985. a
Eisele, F. L. and Tanner, D. J.: Measurement of the gas phase concentration of H2SO4 and methane sulfonic acid and estimates of H2SO4 production and loss in the atmosphere, J. Geophys. Res.-Atmos., 98, 9001–9010, https://doi.org/10.1029/93JD00031, 1993. a
Epstein, S. A., Riipinen, I., and Donahue, N. M.: A Semiempirical Correlation between Enthalpy of Vaporization and Saturation Concentration for Organic Aerosol, Environ. Sci. Technol., 44, 743–748, https://doi.org/10.1021/es902497z, 2010. a, b
Erisman, J. W., Galloway, J., Seitzinger, S., Bleeker, A., and Butterbach-Bahl, K.: Reactive nitrogen in the environment and its effect on climate change, Curr. Opin. Env. Sust., 3, 281–290, https://doi.org/10.1016/j.cosust.2011.08.012, 2011. a
Farmer, D. K. and Jimenez, J. L.: Real-time Atmospheric Chemistry Field Instrumentation, Anal. Chem., 82, 7879–7884, https://doi.org/10.1021/ac1010603, 2010. a
Feng, Y. and Penner, J. E.: Global modeling of nitrate and ammonium: Interaction of aerosols and tropospheric chemistry, J. Geophys. Res.-Atmos., 112, 2005JD006404, https://doi.org/10.1029/2005JD006404, 2007. a
Fontijn, A., Sabadell, A. J., and Ronco, R. J.: Homogeneous chemiluminescent measurement of nitric oxide with ozone. Implications for continuous selective monitoring of gaseous air pollutants, Anal. Chem., 42, 575–579, https://doi.org/10.1021/ac60288a034, 1970. a
Fry, J. L., Kiendler-Scharr, A., Rollins, A. W., Wooldridge, P. J., Brown, S. S., Fuchs, H., Dubé, W., Mensah, A., dal Maso, M., Tillmann, R., Dorn, H.-P., Brauers, T., and Cohen, R. C.: Organic nitrate and secondary organic aerosol yield from NO3 oxidation of β-pinene evaluated using a gas-phase kinetics/aerosol partitioning model, Atmos. Chem. Phys., 9, 1431–1449, https://doi.org/10.5194/acp-9-1431-2009, 2009. a, b
Fry, J. L., Kiendler-Scharr, A., Rollins, A. W., Brauers, T., Brown, S. S., Dorn, H.-P., Dubé, W. P., Fuchs, H., Mensah, A., Rohrer, F., Tillmann, R., Wahner, A., Wooldridge, P. J., and Cohen, R. C.: SOA from limonene: role of NO3 in its generation and degradation, Atmos. Chem. Phys., 11, 3879–3894, https://doi.org/10.5194/acp-11-3879-2011, 2011. a, b, c
Fry, J. L., Draper, D. C., Zarzana, K. J., Campuzano-Jost, P., Day, D. A., Jimenez, J. L., Brown, S. S., Cohen, R. C., Kaser, L., Hansel, A., Cappellin, L., Karl, T., Hodzic Roux, A., Turnipseed, A., Cantrell, C., Lefer, B. L., and Grossberg, N.: Observations of gas- and aerosol-phase organic nitrates at BEACHON-RoMBAS 2011, Atmos. Chem. Phys., 13, 8585–8605, https://doi.org/10.5194/acp-13-8585-2013, 2013. a
Fry, J. L., Brown, S. S., Middlebrook, A. M., Edwards, P. M., Campuzano-Jost, P., Day, D. A., Jimenez, J. L., Allen, H. M., Ryerson, T. B., Pollack, I., Graus, M., Warneke, C., de Gouw, J. A., Brock, C. A., Gilman, J., Lerner, B. M., Dubé, W. P., Liao, J., and Welti, A.: Secondary organic aerosol (SOA) yields from NO3 radical + isoprene based on nighttime aircraft power plant plume transects, Atmos. Chem. Phys., 18, 11663–11682, https://doi.org/10.5194/acp-18-11663-2018, 2018. a
Gao, L., Zgheib, I., Stergiou, E., Carstens, C., Sari Doré, F., Dupanloup, M., Bourgain, F., Perrier, S., and Riva, M.: Characterization of the newly designed wall-free particle evaporator (WALL-E) for online measurements of atmospheric particles, Atmos. Meas. Tech., 18, 5087–5101, https://doi.org/10.5194/amt-18-5087-2025, 2025. a, b, c
Gkatzelis, G., Wu, Y., Tillmann, R., Pfannerstill, E., Khare, P., Marcillo, A., Grasse, A., Rohrer, F., Depp, C., Roska, M., Adam, M., Albertin, S., Asgher, R., Bannan, T., Barua, S., Bates, K., Bell, D., Bohn, B., Buchholz, A., Chen, Y., Coe, H., Coggon, M., Färber, M., Farhoudian, S., Fry, J., Fuchs, H., Graus, M., El Haddad, I., He, Q., Hohaus, T., Iyer, S., Kumar, A., Leiminger, M., Liu, L., Matthews, E., McFiggans, G., Middlebrook, A., Müller, M., Nissinen, A., Novelli, A., Nursanto, F., Perrier, S., Prévôt, A., Pullinen, I., Pusfitasari, E. D., Reinecke, T., Rissanen, M., Riva, M., Schobesberger, S., Stockwell, C., Top, J., Vinkvist, N., Voliotis, A., Wahner, A., Wang, Y., Wang, Y., Wegener, R., Yang, B., and Nölscher, A.: SAPHIR CHANEL 2024 Campaign, Jülich DATA, V1 [data set], https://doi.org/10.26165/JUELICH-DATA/SYIRWS, 2026. a
Gkatzelis, G. I., Coggon, M. M., McDonald, B. C., Peischl, J., Gilman, J. B., Aikin, K. C., Robinson, M. A., Canonaco, F., Prevot, A. S. H., Trainer, M., and Warneke, C.: Observations Confirm that Volatile Chemical Products Are a Major Source of Petrochemical Emissions in U.S. Cities, Environ. Sci. Technol., 55, 4332–4343, https://doi.org/10.1021/acs.est.0c05471, 2021. a
González-Sánchez, J. M., Brun, N., Wu, J., Morin, J., Temime-Roussel, B., Ravier, S., Mouchel-Vallon, C., Clément, J.-L., and Monod, A.: On the importance of atmospheric loss of organic nitrates by aqueous-phase •OH oxidation, Atmos. Chem. Phys., 21, 4915–4937, https://doi.org/10.5194/acp-21-4915-2021, 2021. a
González-Sánchez, J. M., Brun, N., Wu, J., Ravier, S., Clément, J.-L., and Monod, A.: On the importance of multiphase photolysis of organic nitrates on their global atmospheric removal, Atmos. Chem. Phys., 23, 5851–5866, https://doi.org/10.5194/acp-23-5851-2023, 2023. a
Griffin, R. J., Cocker, D. R., Flagan, R. C., and Seinfeld, J. H.: Organic aerosol formation from the oxidation of biogenic hydrocarbons, J. Geophys. Res.-Atmos., 104, 3555–3567, https://doi.org/10.1029/1998JD100049, 1999. a, b
Guo, Y., Shen, H., Pullinen, I., Luo, H., Kang, S., Vereecken, L., Fuchs, H., Hallquist, M., Acir, I.-H., Tillmann, R., Rohrer, F., Wildt, J., Kiendler-Scharr, A., Wahner, A., Zhao, D., and Mentel, T. F.: Identification of highly oxygenated organic molecules and their role in aerosol formation in the reaction of limonene with nitrate radical, Atmos. Chem. Phys., 22, 11323–11346, https://doi.org/10.5194/acp-22-11323-2022, 2022. a, b
Hallquist, M., Wängberg, I., and Ljungström, E.: Atmospheric Fate of Carbonyl Oxidation Products Originating from α-Pinene and Δ3-Carene: Determination of Rate of Reaction with OH and NO3 Radicals, UV Absorption Cross Sections, and Vapor Pressures, Environ. Sci. Technol., 31, 3166–3172, https://doi.org/10.1021/es970151a, 1997. a, b
Horbanski, M., Pöhler, D., Lampel, J., and Platt, U.: The ICAD (iterative cavity-enhanced DOAS) method, Atmos. Meas. Tech., 12, 3365–3381, https://doi.org/10.5194/amt-12-3365-2019, 2019. a
Huang, W., Saathoff, H., Shen, X., Ramisetty, R., Leisner, T., and Mohr, C.: Chemical Characterization of Highly Functionalized Organonitrates Contributing to Night-Time Organic Aerosol Mass Loadings and Particle Growth, Environ. Sci. Technol., 53, 1165–1174, https://doi.org/10.1021/acs.est.8b05826, 2019a. a
Huang, W., Saathoff, H., Shen, X., Ramisetty, R., Leisner, T., and Mohr, C.: Seasonal characteristics of organic aerosol chemical composition and volatility in Stuttgart, Germany, Atmos. Chem. Phys., 19, 11687–11700, https://doi.org/10.5194/acp-19-11687-2019, 2019b. a
Jenkin, M. E., Saunders, S. M., and Pilling, M. J.: The tropospheric degradation of volatile organic compounds: a protocol for mechanism development, Atmos. Environ., 31, 81–104, https://doi.org/10.1016/S1352-2310(96)00105-7, 1997. a
Jenkin, M. E., Saunders, S. M., Wagner, V., and Pilling, M. J.: Protocol for the development of the Master Chemical Mechanism, MCM v3 (Part B): tropospheric degradation of aromatic volatile organic compounds, Atmos. Chem. Phys., 3, 181–193, https://doi.org/10.5194/acp-3-181-2003, 2003. a
Jenkin, M. E., Young, J. C., and Rickard, A. R.: The MCM v3.3.1 degradation scheme for isoprene, Atmos. Chem. Phys., 15, 11433–11459, https://doi.org/10.5194/acp-15-11433-2015, 2015. a
Junninen, H., Ehn, M., Petäjä, T., Luosujärvi, L., Kotiaho, T., Kostiainen, R., Rohner, U., Gonin, M., Fuhrer, K., Kulmala, M., and Worsnop, D. R.: A high-resolution mass spectrometer to measure atmospheric ion composition, Atmos. Meas. Tech., 3, 1039–1053, https://doi.org/10.5194/amt-3-1039-2010, 2010. a
Keehan, N. I., Brownwood, B., Marsavin, A., Day, D. A., and Fry, J. L.: A thermal-dissociation–cavity ring-down spectrometer (TD-CRDS) for the detection of organic nitrates in gas and particle phases, Atmos. Meas. Tech., 13, 6255–6269, https://doi.org/10.5194/amt-13-6255-2020, 2020. a
Kenagy, H. S., Sparks, T. L., Ebben, C. J., Wooldrige, P. J., Lopez-Hilfiker, F. D., Lee, B. H., Thornton, J. A., McDuffie, E. E., Fibiger, D. L., Brown, S. S., Montzka, D. D., Weinheimer, A. J., Schroder, J. C., Campuzano-Jost, P., Day, D. A., Jimenez, J. L., Dibb, J. E., Campos, T., Shah, V., Jaeglé, L., and Cohen, R. C.: NOx Lifetime and NOy Partitioning During WINTER, J. Geophys. Res.-Atmos., 123, 9813–9827, https://doi.org/10.1029/2018JD028736, 2018. a
Kiendler-Scharr, A., Mensah, A. A., Friese, E., Topping, D., Nemitz, E., Prevot, A. S. H., Äijälä, M., Allan, J., Canonaco, F., Canagaratna, M., Carbone, S., Crippa, M., Dall Osto, M., Day, D. A., De Carlo, P., Di Marco, C. F., Elbern, H., Eriksson, A., Freney, E., Hao, L., Herrmann, H., Hildebrandt, L., Hillamo, R., Jimenez, J. L., Laaksonen, A., McFiggans, G., Mohr, C., O'Dowd, C., Otjes, R., Ovadnevaite, J., Pandis, S. N., Poulain, L., Schlag, P., Sellegri, K., Swietlicki, E., Tiitta, P., Vermeulen, A., Wahner, A., Worsnop, D., and Wu, H.: Ubiquity of organic nitrates from nighttime chemistry in the European submicron aerosol, Geophys. Res. Lett., 43, 7735–7744, https://doi.org/10.1002/2016GL069239, 2016. a, b
Krechmer, J., Lopez-Hilfiker, F., Koss, A., Hutterli, M., Stoermer, C., Deming, B., Kimmel, J., Warneke, C., Holzinger, R., Jayne, J., Worsnop, D., Fuhrer, K., Gonin, M., and De Gouw, J.: Evaluation of a New Reagent-Ion Source and Focusing Ion–Molecule Reactor for Use in Proton-Transfer-Reaction Mass Spectrometry, Anal. Chem., 90, 12011–12018, https://doi.org/10.1021/acs.analchem.8b02641, 2018. a
Kroll, J. H. and Seinfeld, J. H.: Chemistry of secondary organic aerosol: Formation and evolution of low-volatility organics in the atmosphere, Atmos. Environ., 42, 3593–3624, https://doi.org/10.1016/j.atmosenv.2008.01.003, 2008. a
Kurtén, T., Tiusanen, K., Roldin, P., Rissanen, M., Luy, J.-N., Boy, M., Ehn, M., and Donahue, N.: α-Pinene Autoxidation Products May Not Have Extremely Low Saturation Vapor Pressures Despite High O:C Ratios, The Journal of Physical Chemistry A, 120, 2569–2582, https://doi.org/10.1021/acs.jpca.6b02196, 2016. a, b
Lange, K., Richter, A., and Burrows, J. P.: Variability of nitrogen oxide emission fluxes and lifetimes estimated from Sentinel-5P TROPOMI observations, Atmos. Chem. Phys., 22, 2745–2767, https://doi.org/10.5194/acp-22-2745-2022, 2022. a
Liao, H., Adams, P. J., Chung, S. H., Seinfeld, J. H., Mickley, L. J., and Jacob, D. J.: Interactions between tropospheric chemistry and aerosols in a unified general circulation model, J. Geophys. Res.-Atmos., 108, AAC 1-1–AAC 1-23, https://doi.org/10.1029/2001JD001260, 2003. a, b
Lu, Z., Liu, X., Zaveri, R. A., Easter, R. C., Tilmes, S., Emmons, L. K., Vitt, F., Singh, B., Wang, H., Zhang, R., and Rasch, P. J.: Radiative Forcing of Nitrate Aerosols From 1975 to 2010 as Simulated by MOSAIC Module in CESM2-MAM4, J. Geophys. Res.-Atmos., 126, e2021JD034809, https://doi.org/10.1029/2021JD034809, 2021. a
Marsavin, A., Van Gageldonk, R., Bernays, N., May, N. W., Jaffe, D. A., and Fry, J. L.: Optical properties of biomass burning aerosol during the 2021 Oregon fire season: comparison between wild and prescribed fires, Environmental Science: Atmospheres, 3, 608–626, https://doi.org/10.1039/D2EA00118G, 2023. a, b
McDonald, B. C., De Gouw, J. A., Gilman, J. B., Jathar, S. H., Akherati, A., Cappa, C. D., Jimenez, J. L., Lee-Taylor, J., Hayes, P. L., McKeen, S. A., Cui, Y. Y., Kim, S.-W., Gentner, D. R., Isaacman-VanWertz, G., Goldstein, A. H., Harley, R. A., Frost, G. J., Roberts, J. M., Ryerson, T. B., and Trainer, M.: Volatile chemical products emerging as largest petrochemical source of urban organic emissions, Science, 359, 760–764, https://doi.org/10.1126/science.aaq0524, 2018. a
McFiggans, G., Mentel, T. F., Wildt, J., Pullinen, I., Kang, S., Kleist, E., Schmitt, S., Springer, M., Tillmann, R., Wu, C., Zhao, D., Hallquist, M., Faxon, C., Le Breton, M., Hallquist, Å. M., Simpson, D., Bergström, R., Jenkin, M. E., Ehn, M., Thornton, J. A., Alfarra, M. R., Bannan, T. J., Percival, C. J., Priestley, M., Topping, D., and Kiendler-Scharr, A.: Secondary organic aerosol reduced by mixture of atmospheric vapours, Nature, 565, 587–593, https://doi.org/10.1038/s41586-018-0871-y, 2019. a, b
Metzger, S.: Gas/aerosol partitioning 2. Global modeling results, J. Geophys. Res., 107, 4313, https://doi.org/10.1029/2001JD001103, 2002. a
Mohr, C., DeCarlo, P. F., Heringa, M. F., Chirico, R., Slowik, J. G., Richter, R., Reche, C., Alastuey, A., Querol, X., Seco, R., Peñuelas, J., Jiménez, J. L., Crippa, M., Zimmermann, R., Baltensperger, U., and Prévôt, A. S. H.: Identification and quantification of organic aerosol from cooking and other sources in Barcelona using aerosol mass spectrometer data, Atmos. Chem. Phys., 12, 1649–1665, https://doi.org/10.5194/acp-12-1649-2012, 2012. a
Neuman, J. A., Huey, L. G., Ryerson, T. B., and Fahey, D. W.: Study of Inlet Materials for Sampling Atmospheric Nitric Acid, Environ. Sci. Technol., 33, 1133–1136, https://doi.org/10.1021/es980767f, 1999. a, b
Ng, N. L., Kwan, A. J., Surratt, J. D., Chan, A. W. H., Chhabra, P. S., Sorooshian, A., Pye, H. O. T., Crounse, J. D., Wennberg, P. O., Flagan, R. C., and Seinfeld, J. H.: Secondary organic aerosol (SOA) formation from reaction of isoprene with nitrate radicals (NO3), Atmos. Chem. Phys., 8, 4117–4140, https://doi.org/10.5194/acp-8-4117-2008, 2008. a, b
Ng, N. L., Brown, S. S., Archibald, A. T., Atlas, E., Cohen, R. C., Crowley, J. N., Day, D. A., Donahue, N. M., Fry, J. L., Fuchs, H., Griffin, R. J., Guzman, M. I., Herrmann, H., Hodzic, A., Iinuma, Y., Jimenez, J. L., Kiendler-Scharr, A., Lee, B. H., Luecken, D. J., Mao, J., McLaren, R., Mutzel, A., Osthoff, H. D., Ouyang, B., Picquet-Varrault, B., Platt, U., Pye, H. O. T., Rudich, Y., Schwantes, R. H., Shiraiwa, M., Stutz, J., Thornton, J. A., Tilgner, A., Williams, B. J., and Zaveri, R. A.: Nitrate radicals and biogenic volatile organic compounds: oxidation, mechanisms, and organic aerosol, Atmos. Chem. Phys., 17, 2103–2162, https://doi.org/10.5194/acp-17-2103-2017, 2017. a, b, c
Nunnermacker, L. J., Kleinman, L. I., Imre, D., Daum, P. H., Lee, Y., Lee, J. H., Springston, S. R., Newman, L., and Gillani, N.: NOy lifetimes and O3 production efficiencies in urban and power plant plumes: Analysis of field data, J. Geophys. Res.-Atmos., 105, 9165–9176, https://doi.org/10.1029/1999JD900753, 2000. a
Nursanto, F. R., Meinen, R., Holzinger, R., Krol, M. C., Liu, X., Dusek, U., Henzing, B., and Fry, J. L.: What chemical species are responsible for new particle formation and growth in the Netherlands? A hybrid positive matrix factorization (PMF) analysis using aerosol composition (ACSM) and size (SMPS), Atmos. Chem. Phys., 23, 10015–10034, https://doi.org/10.5194/acp-23-10015-2023, 2023. a
Nursanto, F. R., Day, D. A., Meinen, R., Holzinger, R., Saathoff, H., Fu, J., Mulder, J., Dusek, U., and Fry, J. L.: Development and validation of a ratio method for the quantitative separation of inorganic and organic nitrate aerosol using a unit-mass-resolution time-of-flight aerosol chemical speciation monitor equipped with a capture vaporizer (CV-UMR-ToF-ACSM), Atmos. Meas. Tech., 18, 3051–3072, https://doi.org/10.5194/amt-18-3051-2025, 2025. a
Pandolfi, M., Querol, X., Alastuey, A., Jimenez, J. L., Jorba, O., Day, D., Ortega, A., Cubison, M. J., Comerón, A., Sicard, M., Mohr, C., Prévôt, A. S. H., Minguillón, M. C., Pey, J., Baldasano, J. M., Burkhart, J. F., Seco, R., Peñuelas, J., Van Drooge, B. L., Artiñano, B., Di Marco, C., Nemitz, E., Schallhart, S., Metzger, A., Hansel, A., Lorente, J., Ng, S., Jayne, J., and Szidat, S.: Effects of sources and meteorology on particulate matter in the Western Mediterranean Basin: An overview of the DAURE campaign, J. Geophys. Res.-Atmos., 119, 4978–5010, https://doi.org/10.1002/2013JD021079, 2014. a
Pang, J. Y. S., Novelli, A., Kaminski, M., Acir, I.-H., Bohn, B., Carlsson, P. T. M., Cho, C., Dorn, H.-P., Hofzumahaus, A., Li, X., Lutz, A., Nehr, S., Reimer, D., Rohrer, F., Tillmann, R., Wegener, R., Kiendler-Scharr, A., Wahner, A., and Fuchs, H.: Investigation of the limonene photooxidation by OH at different NO concentrations in the atmospheric simulation chamber SAPHIR (Simulation of Atmospheric PHotochemistry In a large Reaction Chamber), Atmos. Chem. Phys., 22, 8497–8527, https://doi.org/10.5194/acp-22-8497-2022, 2022. a
Pankow, J. F.: An absorption model of gas/particle partitioning of organic compounds in the atmosphere, Atmos. Environ., 28, 185–188, https://doi.org/10.1016/1352-2310(94)90093-0, 1994. a
Pankow, J. F. and Asher, W. E.: SIMPOL.1: a simple group contribution method for predicting vapor pressures and enthalpies of vaporization of multifunctional organic compounds, Atmos. Chem. Phys., 8, 2773–2796, https://doi.org/10.5194/acp-8-2773-2008, 2008. a, b, c, d, e
Paulot, F., Ginoux, P., Cooke, W. F., Donner, L. J., Fan, S., Lin, M.-Y., Mao, J., Naik, V., and Horowitz, L. W.: Sensitivity of nitrate aerosols to ammonia emissions and to nitrate chemistry: implications for present and future nitrate optical depth, Atmos. Chem. Phys., 16, 1459–1477, https://doi.org/10.5194/acp-16-1459-2016, 2016. a
Peräkylä, O., Riva, M., Heikkinen, L., Quéléver, L., Roldin, P., and Ehn, M.: Experimental investigation into the volatilities of highly oxygenated organic molecules (HOMs), Atmos. Chem. Phys., 20, 649–669, https://doi.org/10.5194/acp-20-649-2020, 2020. a, b
Pfannerstill, E. Y., Arata, C., Zhu, Q., Schulze, B. C., Ward, R., Woods, R., Harkins, C., Schwantes, R. H., Seinfeld, J. H., Bucholtz, A., Cohen, R. C., and Goldstein, A. H.: Temperature-dependent emissions dominate aerosol and ozone formation in Los Angeles, Science, 384, 1324–1329, https://doi.org/10.1126/science.adg8204, 2024. a, b
Platt, U., Perner, D., and Pätz, H. W.: Simultaneous measurement of atmospheric CH2O, O3, and NO2 by differential optical absorption, J. Geophys. Res.-Oceans, 84, 6329–6335, https://doi.org/10.1029/JC084iC10p06329, 1979. a
Platt, U., Meinen, J., Pöhler, D., and Leisner, T.: Broadband Cavity Enhanced Differential Optical Absorption Spectroscopy (CE-DOAS) – applicability and corrections, Atmos. Meas. Tech., 2, 713–723, https://doi.org/10.5194/amt-2-713-2009, 2009. a
Pye, H. O. T., Luecken, D. J., Xu, L., Boyd, C. M., Ng, N. L., Baker, K. R., Ayres, B. R., Bash, J. O., Baumann, K., Carter, W. P. L., Edgerton, E., Fry, J. L., Hutzell, W. T., Schwede, D. B., and Shepson, P. B.: Modeling the Current and Future Roles of Particulate Organic Nitrates in the Southeastern United States, Environ. Sci. Technol., 49, 14195–14203, https://doi.org/10.1021/acs.est.5b03738, 2015. a
Räty, M., Peräkylä, O., Riva, M., Quéléver, L., Garmash, O., Rissanen, M., and Ehn, M.: Measurement report: Effects of NOx and seed aerosol on highly oxygenated organic molecules (HOMs) from cyclohexene ozonolysis, Atmos. Chem. Phys., 21, 7357–7372, https://doi.org/10.5194/acp-21-7357-2021, 2021. a
Riva, M., Ehn, M., Li, D., Tomaz, S., Bourgain, F., Perrier, S., and George, C.: CI-Orbitrap: An Analytical Instrument To Study Atmospheric Reactive Organic Species, Anal. Chem., 91, 9419–9423, https://doi.org/10.1021/acs.analchem.9b02093, 2019. a
Riva, M., Brüggemann, M., Li, D., Perrier, S., George, C., Herrmann, H., and Berndt, T.: Capability of CI-Orbitrap for Gas-Phase Analysis in Atmospheric Chemistry: A Comparison with the CI-APi-TOF Technique, Anal. Chem., 92, 8142–8150, https://doi.org/10.1021/acs.analchem.0c00111, 2020. a
Riva, M., Pospisilova, V., Frege, C., Perrier, S., Bansal, P., Jorga, S., Sturm, P., Thornton, J. A., Rohner, U., and Lopez-Hilfiker, F.: Evaluation of a reduced-pressure chemical ion reactor utilizing adduct ionization for the detection of gaseous organic and inorganic species, Atmos. Meas. Tech., 17, 5887–5901, https://doi.org/10.5194/amt-17-5887-2024, 2024. a
Rivellini, L.-H., Jorga, S., Wang, Y., Lee, A. K., Murphy, J. G., Chan, A. W., and Abbatt, J. P.: Sources of Wintertime Atmospheric Organic Pollutants in a Large Canadian City: Insights from Particle and Gas Phase Measurements, ACS ES&T Air, 1, 690–703, https://doi.org/10.1021/acsestair.4c00039, 2024. a
Rodriguez, M. A. and Dabdub, D.: IMAGES-SCAPE2: A modeling study of size- and chemically resolved aerosol thermodynamics in a global chemical transport model, J. Geophys. Res.-Atmos., 109, 2003JD003639, https://doi.org/10.1029/2003JD003639, 2004. a
Rohrer, F., Bohn, B., Brauers, T., Brüning, D., Johnen, F.-J., Wahner, A., and Kleffmann, J.: Characterisation of the photolytic HONO-source in the atmosphere simulation chamber SAPHIR, Atmos. Chem. Phys., 5, 2189–2201, https://doi.org/10.5194/acp-5-2189-2005, 2005. a, b
Rollins, A. W., Kiendler-Scharr, A., Fry, J. L., Brauers, T., Brown, S. S., Dorn, H.-P., Dubé, W. P., Fuchs, H., Mensah, A., Mentel, T. F., Rohrer, F., Tillmann, R., Wegener, R., Wooldridge, P. J., and Cohen, R. C.: Isoprene oxidation by nitrate radical: alkyl nitrate and secondary organic aerosol yields, Atmos. Chem. Phys., 9, 6685–6703, https://doi.org/10.5194/acp-9-6685-2009, 2009. a, b
Romer, P. S., Duffey, K. C., Wooldridge, P. J., Allen, H. M., Ayres, B. R., Brown, S. S., Brune, W. H., Crounse, J. D., de Gouw, J., Draper, D. C., Feiner, P. A., Fry, J. L., Goldstein, A. H., Koss, A., Misztal, P. K., Nguyen, T. B., Olson, K., Teng, A. P., Wennberg, P. O., Wild, R. J., Zhang, L., and Cohen, R. C.: The lifetime of nitrogen oxides in an isoprene-dominated forest, Atmos. Chem. Phys., 16, 7623–7637, https://doi.org/10.5194/acp-16-7623-2016, 2016. a
Roska, M., Stockwell, C. E., Coggon, M. M., Bates, K. H., Xu, L., Womack, C. C., Chace, W. S., Taylor, R., Wu, Y., Tillmann, R., Wesolek, C., Pfannerstill, E. Y., Rohrer, F., Tsimpidi, A. P., Karydis, V. A., Fuchs, H., Novelli, A., Stansby, A., Canagaratna, M., Alton, M. W., Warneke, C., Brown, S. S., Wahner, A., and Gkatzelis, G. I.: Beyond Targeted Calibrations: Comprehensive Quantification of Oxygenated Organic Compounds in Urban Atmospheres, Environ. Sci. Technol., in review, 2026. a
Ryerson, T. B., Buhr, M. P., Frost, G. J., Goldan, P. D., Holloway, J. S., Hübler, G., Jobson, B. T., Kuster, W. C., McKeen, S. A., Parrish, D. D., Roberts, J. M., Sueper, D. T., Trainer, M., Williams, J., and Fehsenfeld, F. C.: Emissions lifetimes and ozone formation in power plant plumes, J. Geophys. Res.-Atmos., 103, 22569–22583, https://doi.org/10.1029/98JD01620, 1998. a
Saunders, S. M., Jenkin, M. E., Derwent, R. G., and Pilling, M. J.: Protocol for the development of the Master Chemical Mechanism, MCM v3 (Part A): tropospheric degradation of non-aromatic volatile organic compounds, Atmos. Chem. Phys., 3, 161–180, https://doi.org/10.5194/acp-3-161-2003, 2003. a
Schaap, M., van Loon, M., ten Brink, H. M., Dentener, F. J., and Builtjes, P. J. H.: Secondary inorganic aerosol simulations for Europe with special attention to nitrate, Atmos. Chem. Phys., 4, 857–874, https://doi.org/10.5194/acp-4-857-2004, 2004. a, b
Schlag, P., Kiendler-Scharr, A., Blom, M. J., Canonaco, F., Henzing, J. S., Moerman, M., Prévôt, A. S. H., and Holzinger, R.: Aerosol source apportionment from 1-year measurements at the CESAR tower in Cabauw, the Netherlands, Atmos. Chem. Phys., 16, 8831–8847, https://doi.org/10.5194/acp-16-8831-2016, 2016. a
Scholz, S. M. C., Karydis, V. A., Gkatzelis, G. I., Fuchs, H., Pandis, S. N., and Tsimpidi, A. P.: Incorporation of lumped IVOC emissions into the ORACLE model (V1.1): a multi-product framework for assessing global SOA formation from internal combustion engines, Geosci. Model Dev., 18, 10119–10142, https://doi.org/10.5194/gmd-18-10119-2025, 2025. a
Shao, Y., Voliotis, A., Du, M., Wang, Y., Pereira, K., Hamilton, J., Alfarra, M. R., and McFiggans, G.: Chemical composition of secondary organic aerosol particles formed from mixtures of anthropogenic and biogenic precursors, Atmos. Chem. Phys., 22, 9799–9826, https://doi.org/10.5194/acp-22-9799-2022, 2022. a
Singh, H. B.: Reactive nitrogen in the troposphere, Environ. Sci. Technol., 21, 320–327, https://doi.org/10.1021/es00158a001, 1987. a
Spittler, M., Barnes, I., Bejan, I., Brockmann, K., Benter, T., and Wirtz, K.: Reactions of NO3 radicals with limonene and α-pinene: Product and SOA formation, Atmos. Environ., 40, 116–127, https://doi.org/10.1016/j.atmosenv.2005.09.093, 2006. a, b
Stockwell, C. E., Coggon, M. M., Schwantes, R. H., Harkins, C., Verreyken, B., Lyu, C., Zhu, Q., Xu, L., Gilman, J. B., Lamplugh, A., Peischl, J., Robinson, M. A., Veres, P. R., Li, M., Rollins, A. W., Zuraski, K., Baidar, S., Liu, S., Kuwayama, T., Brown, S. S., McDonald, B. C., and Warneke, C.: Urban ozone formation and sensitivities to volatile chemical products, cooking emissions, and NOx upwind of and within two Los Angeles Basin cities, Atmos. Chem. Phys., 25, 1121–1143, https://doi.org/10.5194/acp-25-1121-2025, 2025. a, b
Stolzenburg, D., Fischer, L., Vogel, A. L., Heinritzi, M., Schervish, M., Simon, M., Wagner, A. C., Dada, L., Ahonen, L. R., Amorim, A., Baccarini, A., Bauer, P. S., Baumgartner, B., Bergen, A., Bianchi, F., Breitenlechner, M., Brilke, S., Buenrostro Mazon, S., Chen, D., Dias, A., Draper, D. C., Duplissy, J., El Haddad, I., Finkenzeller, H., Frege, C., Fuchs, C., Garmash, O., Gordon, H., He, X., Helm, J., Hofbauer, V., Hoyle, C. R., Kim, C., Kirkby, J., Kontkanen, J., Kürten, A., Lampilahti, J., Lawler, M., Lehtipalo, K., Leiminger, M., Mai, H., Mathot, S., Mentler, B., Molteni, U., Nie, W., Nieminen, T., Nowak, J. B., Ojdanic, A., Onnela, A., Passananti, M., Petäjä, T., Quéléver, L. L. J., Rissanen, M. P., Sarnela, N., Schallhart, S., Tauber, C., Tomé, A., Wagner, R., Wang, M., Weitz, L., Wimmer, D., Xiao, M., Yan, C., Ye, P., Zha, Q., Baltensperger, U., Curtius, J., Dommen, J., Flagan, R. C., Kulmala, M., Smith, J. N., Worsnop, D. R., Hansel, A., Donahue, N. M., and Winkler, P. M.: Rapid growth of organic aerosol nanoparticles over a wide tropospheric temperature range, P. Natl. Acad. Sci. USA, 115, 9122–9127, https://doi.org/10.1073/pnas.1807604115, 2018. a, b
Takeuchi, M., Wang, Y., Nault, B. A., Chen, Y., Canagaratna, M. R., and Ng, N. L.: Evaluating the response of the Aerodyne aerosol mass spectrometer to monoterpene- and isoprene-derived organic nitrate standards, Aerosol Sci. Tech., 58, 1371–1388, https://doi.org/10.1080/02786826.2024.2389183, 2024. a, b, c, d
Valin, L. C., Russell, A. R., and Cohen, R. C.: Variations of OH radical in an urban plume inferred from NO2 column measurements, Geophys. Res. Lett., 40, 1856–1860, https://doi.org/10.1002/grl.50267, 2013. a
Vasilakos, P., Russell, A., Weber, R., and Nenes, A.: Understanding nitrate formation in a world with less sulfate, Atmos. Chem. Phys., 18, 12765–12775, https://doi.org/10.5194/acp-18-12765-2018, 2018. a
Voliotis, A., Wang, Y., Shao, Y., Du, M., Bannan, T. J., Percival, C. J., Pandis, S. N., Alfarra, M. R., and McFiggans, G.: Exploring the composition and volatility of secondary organic aerosols in mixed anthropogenic and biogenic precursor systems, Atmos. Chem. Phys., 21, 14251–14273, https://doi.org/10.5194/acp-21-14251-2021, 2021. a
Voliotis, A., Du, M., Wang, Y., Shao, Y., Alfarra, M. R., Bannan, T. J., Hu, D., Pereira, K. L., Hamilton, J. F., Hallquist, M., Mentel, T. F., and McFiggans, G.: Chamber investigation of the formation and transformation of secondary organic aerosol in mixtures of biogenic and anthropogenic volatile organic compounds, Atmos. Chem. Phys., 22, 14147–14175, https://doi.org/10.5194/acp-22-14147-2022, 2022. a
Warneke, C., Schwantes, R. H., Veres, P. R., Rollins, A., Baidar, S., Brewer, W. A., Senff, C., Langford, A., Aikin, K., Frost, G., Fahey, D., Judd, L., Lefer, B., Pierce, R. B., Kondragunta, S., Stockwell, C., Gentner, D., Lambe, A. T., Millet, D. B., Farmer, D., Ng, N. L., Kaiser, J., Young, C., Mak, J. E., Wolfe, G. M., Sullivan, J., Mueller, K., Karion, A., Valin, L., Witte, M., Russel, L. M., Ren, X., Dickerson, R., DeCarlo, P., McDonald, B., and Brown, S. S.: The AEROMMA 2023 experiment (Atmospheric Emissions and Reactions Observed from Megacities to Marine Areas), https://csl.noaa.gov/projects/aeromma/whitepaper.pdf (last access: 15 June 2026), 2023. a
Wegener, R., Brauers, T., Koppmann, R., Rodríguez Bares, S., Rohrer, F., Tillmann, R., Wahner, A., Hansel, A., and Wisthaler, A.: Simulation chamber investigation of the reactions of ozone with short-chained alkenes, J. Geophys. Res.-Atmos., 112, 2006JD007531, https://doi.org/10.1029/2006JD007531, 2007. a
Wernis, R. A., Kreisberg, N. M., Weber, R. J., Drozd, G. T., and Goldstein, A. H.: Source apportionment of VOCs, IVOCs and SVOCs by positive matrix factorization in suburban Livermore, California, Atmos. Chem. Phys., 22, 14987–15019, https://doi.org/10.5194/acp-22-14987-2022, 2022. a
Westervelt, D. M., Horowitz, L. W., Naik, V., Golaz, J.-C., and Mauzerall, D. L.: Radiative forcing and climate response to projected 21st century aerosol decreases, Atmos. Chem. Phys., 15, 12681–12703, https://doi.org/10.5194/acp-15-12681-2015, 2015. a
Winer, A. M., Peters, J. W., Smith, J. P., and Pitts, J. N.: Response of commercial chemiluminescent nitric oxide-nitrogen dioxide analyzers to other nitrogen-containing compounds, Environ. Sci. Technol., 8, 1118–1121, https://doi.org/10.1021/es60098a004, 1974. a
Wu, Y., Tillmann, R., Pfannerstill, E. Y., Khare, P., Marcillo Carolina, A., Grasse, A., Rohrer, F., Depp, C., Roska, M., Adam, M. G., Albertin, S., Asgher, R., Bannan, T. J., Barua, S., Bates, K. H., Bell, D. M., Bohn, B., Brown, S., Buchholz, A., Chen, Y., Cho, C., Coe, H., Coggon, M. M., Färber, M., Farhoudian, S., Fry, J. L., Fuchs, H., Graus, M., El Haddad, I., He, Q., Hohaus, T., Iyer, S., Karydis, V. A., Kumar, A., Leiminger, M., Liu, L., Matthews, E., McFiggans, G., Middlebrook, A. M., Müller, M., Nissine, A., Nölscher, A. C., Novelli, A., Nursanto, F. R., Perrier, S., Prévôt, A. S. H., Pullinen, I., Pusfitasari, E. D., Reinecke, T., Rissanen, M., Riva, M., Robinson, M. A., Schobesberger, S., Stockwell, C. E., Top, J., Tsimpidi, A. P., Vinkvist, N., Voliotis, A., Wahner, A., Wang, Y., Wang, Y., Warneke, C., Wegener, R., Yang, B., and Gkatzelis, G. I.: Recreating the breath of cities in the atmospheric simulation chamber SAPHIR, Environ. Sci. Technol., in review, 2026. a, b, c
Xu, L., Coggon, M. M., Stockwell, C. E., Gilman, J. B., Robinson, M. A., Breitenlechner, M., Lamplugh, A., Crounse, J. D., Wennberg, P. O., Neuman, J. A., Novak, G. A., Veres, P. R., Brown, S. S., and Warneke, C.: Chemical ionization mass spectrometry utilizing ammonium ions ( CIMS) for measurements of organic compounds in the atmosphere, Atmos. Meas. Tech., 15, 7353–7373, https://doi.org/10.5194/amt-15-7353-2022, 2022. a
Xu, W., Takeuchi, M., Chen, C., Qiu, Y., Xie, C., Xu, W., Ma, N., Worsnop, D. R., Ng, N. L., and Sun, Y.: Estimation of particulate organic nitrates from thermodenuder–aerosol mass spectrometer measurements in the North China Plain, Atmos. Meas. Tech., 14, 3693–3705, https://doi.org/10.5194/amt-14-3693-2021, 2021. a
Yu, X., Li, Q., Liao, K., Li, Y., Wang, X., Zhou, Y., Liang, Y., and Yu, J. Z.: New measurements reveal a large contribution of nitrogenous molecules to ambient organic aerosol, npj Climate and Atmospheric Science, 7, 72, https://doi.org/10.1038/s41612-024-00620-6, 2024. a
Zhao, D., Schmitt, S. H., Wang, M., Acir, I.-H., Tillmann, R., Tan, Z., Novelli, A., Fuchs, H., Pullinen, I., Wegener, R., Rohrer, F., Wildt, J., Kiendler-Scharr, A., Wahner, A., and Mentel, T. F.: Effects of NOx and SO2 on the secondary organic aerosol formation from photooxidation of α-pinene and limonene, Atmos. Chem. Phys., 18, 1611–1628, https://doi.org/10.5194/acp-18-1611-2018, 2018. a