the Creative Commons Attribution 4.0 License.
the Creative Commons Attribution 4.0 License.
 | 19 Jan 2026
Emission factors and optical properties of black and brown carbon emitted at a mixed-conifer forest prescribed burn
James D. A. Butler
Afsara Tasnia
Deep Sengupta
Nathan Kreisberg
Kelley C. Barsanti
Allen H. Goldstein
Chelsea V. Preble
Rebecca A. Sugrue
Thomas W. Kirchstetter
Prescribed burning is a fuel management practice employed globally that emits carbonaceous aerosols that affect human health and perturb the global climate system. Fuel-based black and brown carbon (BC and BrC) emission factors were calculated from ground and aloft smoke during prescribed burns at a mixed-conifer, montane forest site in the Sierra Nevada in California. BC emission factors were 0.52 ± 0.42 and 1.0 ± 0.48 g kg−1 for the smoldering and flaming combustion phases. Modified combustion efficiency is a poor predictor of BC emission factor, in this study and published literature. We discuss limitations of using generalized BC to PM2.5 mass emission ratios to generate emission inventories; using BC emission factors measured in this study, we recommend BC to PM2.5 ratios of 0.7 % and 9.5 % for the smoldering and flaming combustion in mixed conifer prescribed burns. We apportioned the measured aerosol spectral absorption between BrC and BC and calculated absorption Ångström exponents (AAE) of 6.26 and 0.67, respectively. Using a BrC-specific absorption cross-section, we estimated BC concentrations and a smoldering combustion BrC emission factor of 7.0 ± 2.7 g kg−1, nearly 14 and 7 times greater than the smoldering and flaming BC emission factors. Furthermore, we estimate that BrC would account for 23 % and 82 %, respectively, of the solar radiation absorbed by the smoldering smoke in the atmosphere integrated over the solar spectrum (300–2500 nm) and in the UV spectrum (300–400 nm), indicating that BrC affects tropospheric photochemistry in addition to atmospheric warming.
- Article
(830 KB) - Full-text XML
-
Supplement
(3100 KB) - BibTeX
- EndNote


Prescribed burns are controlled burns that consume excess and dead fuel in an ecosystem, like the duff, shrubs and dead biomass in the forest understory, or floor. In contrast, wildfires are uncontrolled burns that may consume both the understory and overstory, or canopy, of a forest and may spread to nearby property, endangering the homes and lives of people in the wildland urban interface. Routine prescribed burns, or other fuel management practices like mechanical thinning, reduce the risk and severity of wildfire ignition in forest ecosystems and increase the resistance to ecosystem transition (i.e., conversion of forest to shrubland) caused by wildfires (Steel et al., 2021; Wu et al., 2023).
Prescribed burns and wildfires emit fine particulate matter (PM2.5), carbon monoxide (CO), carbon dioxide (CO2), volatile organic compounds, and nitrogen oxides (Andreae, 2019; Urbanski, 2014; Urbanski et al., 2008; Wiedinmyer et al., 2006). Emitted PM2.5 includes organic aerosol, some of which is light-absorbing brown carbon (BrC), and black carbon (BC). Whereas BC absorbs solar radiation broadly across the visible spectrum, BrC light absorption is highly wavelength dependent and strongest in the near-UV spectral region (Bond et al., 2004; Kirchstetter et al., 2004; Laskin et al., 2015). Due to their perturbation of the radiative balance of the atmosphere and short atmospheric residence time compared to CO2, BC and BrC are considered short-lived climate forcers (Feng et al., 2013; Kirchstetter and Thatcher, 2012; Zhang et al., 2020). Additionally, BC and BrC surface deposition in snowy climates reduces the solar reflectance of snow and may accelerate snow melt (Chelluboyina et al., 2024; Hadley and Kirchstetter, 2012; Kaspari et al., 2015; Yang et al., 2015). Human exposure to carbonaceous aerosols also has detrimental health effects including cardiovascular disease, lung cancer, adverse birth outcomes, and premature mortality (Dong et al., 2023; Grahame et al., 2014; Janssen et al., 2011). Wildland fires are a major source of pollution relevant to human exposure and account for one third of total PM2.5 emissions in the US, with roughly equal contributions from prescribed burns and wildfires (Larkin et al., 2020).
Wildland fire modeling frameworks, or smoke models, estimate the amount of smoke emitted during burn events to create input emissions necessary for climate modeling, air pollution modeling, and health impact assessments (California Air Resources Board, 2020; Connolly et al., 2024; Cruz Núñez et al., 2014; Maji et al., 2024). Smoke emissions from wildland fires are estimated with fuel consumption models like Burnup, part of the First-Order Fire Effects Model (FOFEM), and CONSUME, part of the BlueSky Smoke Modeling Framework (Keane and Lutes, 2018; BlueSky Modeling Framework, 2024). Both smoke models compute total emissions of a pollutant by multiplying pollutant emission factors by the mass of fuel consumed during both the high intensity and low intensity stages of a burn event, which roughly correspond to the flaming and smoldering phases of a wildland fire.
The differences in fuel mass consumption and temperature in these phases affect the emission rate of pollutants, sometimes by an order of magnitude. In the flaming phase, fuel mass consumption and temperature are highest and combustion is more complete, while both are lower in the smoldering phase that is characterized by incomplete combustion (Urbanski, 2014). Flaming combustion generally has a higher emission rate of BC and a lower emission rate of BrC compared with smoldering combustion, while smoldering combustion is marked by higher emissions of CO and BrC (Chen et al., 2007). Experiments designed to quantify pollutant emissions must consider the placement of sampling instrumentation to capture these distinct combustion phases of a burn, with aerial sampling platforms more likely to capture a mixture of flaming and smoldering combustion due to the convective lofting of smoke caused by flaming combustion (Aurell et al., 2021). Ground-level smoke, on the other hand, tends to be dominated from smoldering combustion (Aurell and Gullett, 2013).
In this study, we conducted field sampling of pollutant emissions from prescribed burning of a mixed-conifer understory and computed BC emission factors, BrC emission factors, and aerosol absorption properties with ground and aerial sampling platforms. We investigate the relationship between BC emission factors and combustion conditions and, finding that the modified combustion efficiency (MCE) is a poor predictor of BC emission factor, propose a framework to aggregate emission factors by either flaming or smoldering conditions to convey the average value and variability of emission factors within these combustion regimes in fuel consumption models. We report BC PM2.5 ratios, or speciation profiles, for a mixed-conifer understory prescribed burn. We then discuss how applying an incorrect BC PM2.5 ratio in wildland fire modeling frameworks may lead to large errors in BC emissions, using the ecosystem studied in this work as an example. We compute the absorption Ångström exponent (AAE) for the prescribed burn smoke aerosols, demonstrating that AAE is sensitive to the wavelengths used in its calculation, and present estimates of AAE separately for BC and BrC to estimate their contributions the solar radiation absorbed by the smoldering smoke in the atmosphere.
2.1 Field Measurements
Field measurements were made at the Blodgett Forest Research Station (38.915224, −120.662420), located 1370 m above sea level on the western slope of the Sierra Nevada, 21 km east of Georgetown, CA. Prescribed burns were conducted in a mixed conifer forest, typical of montane ecosystems of the Sierra Nevada (North et al., 2016). Three forest units were burned in consecutive days in April 2021, as shown in Fig. S1 in the Supplement. The prescribed burn on the first day escaped the designated unit (A) and the burn was terminated early. The remainder of unit A was burned on the second day and units B and C were burned on the third and fourth days, respectively.
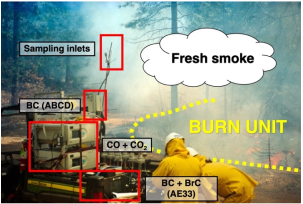
Prescribed burn smoke was measured using both a ground and an aerial sampling platform. The ground platform consisted of pollutant analyzers secured to a utility task vehicle stationed immediately downwind of the fire to capture fresh smoke two meters above ground level (see Fig. S2). The ground platform was moved once each day as the burns progressed and winds shifted to be on service roads nearby the highest intensity burn activity and the aerial platform takeoff/landing location. Across the four days, there were nine ground sampling sessions: at two locations on each day, plus one “next-day” smoldering sample on the second day for burn unit A before ignition of the remaining unit. For the aerial platform, pollutant analyzers were attached to the unmanned aerial vehicle, a DJI Matrice 600 Pro hexacopter. Concurrent with ground sampling, the unmanned aerial vehicle was flown 23 times across the four days with at least five flights each day and a maximum of 10 flights on the third day. The aerial platform was flown in the densest smoke plumes to intercept the bulk of the prescribed burn smoke and hovered within these plumes to capture fresh emissions representative of the event. The average elevation of aerial platform throughout sampling was 29 m, with an average sampling elevation range of 16–42 m across all flights.
BC, CO, and CO2 were measured on both the ground and aerial sampling platforms. BC was measured using two filter-based aerosol absorption photometers: the Aerosol Magee Scientific aethalometer model AE33 with a 2.5 µm cyclone on the inlet on the ground platform and the custom-built Aerosol Black Carbon Detector (ABCD) on both the ground and aerial platforms (Caubel et al., 2018; Sugrue et al., 2024). These instruments estimate BC concentrations from measured aerosol light absorption and wavelength-specific absorption cross section. The ABCD estimates BC concentration based on aerosol optical attenuation at 880 nm wavelength (λ). The AE33 also measures BC at λ=880 nm, in addition to aerosol optical attenuation at six other wavelengths. In particular, the AE33 reports the mass concentration UV-absorbing aerosol (UVPM) based on the optical attenuation at 370 nm. BrC concentration was estimated from these data as described below in Sect. 2.2. Filter-based aerosol absorption photometry has well known limitations due to the interactions of the collected aerosol particles and filter media. Corrections for these sampling artifacts are detailed in the Supplement.
Collocating the AE33 with the ABCD on the ground enabled an analysis to express BC measured with the ABCD in terms of AE33 equivalence, also described below. CO and CO2 were measured by non-dispersive infrared (NDIR) absorption photometry on the ground platform using Horiba models APMA370 and APCA370, respectively(Tasnia et al., 2025) CO and CO2 were measured on the aerial platform with an electrochemical cell (Alphasense CO-B4) and NDIR sensor (PP Systems SBA-5), respectively. All instruments reported pollutant concentrations at 1 Hz frequency. Data were post-processed and validated prior to analysis using the quality assurance and control measures described in the Supplement, including pollutant concentration time-series alignment and loading artifact correction of BC concentrations measured with the ABCD.
2.2 Calculations
Light absorption by carbonaceous aerosols increases with decreasing wavelength, a trend that is often modeled as a power-law:
AAE was calculated by an ordinary least squares linear regression of the natural log transformation of λ and babs(λ). Here, babs(λ) (m−1) was calculated by multiplying the wavelength-dependent, loading artifact-corrected, light-absorbing aerosol concentration reported by the AE33 by the wavelength-dependent mass absorption cross-section of BC on a filter (m2 g−1). Aerosol absorption was calculated per second and then averaged per minute with a 90 % data completeness threshold applied at seven wavelengths measured by the ground aethalometer.
The Delta-C method has been used to estimate BrC concentrations with a multi-wavelength aethalometer (Harrison et al., 2013; Huang et al., 2011; Stampfer et al., 2020; Wagstaff et al., 2022; Wang et al., 2010, 2011a, b), where BrC is the difference between UVPM and BC concentrations in units of µg m−3:
The AE33 aethalometer assumes light absorption at 880 nm is entirely due to BC and UVPM is the mass concentration of all light absorbing aerosol at 370 nm. The AE33 further assumes that UVPM has the same absorption cross-section as BC (i.e., 18.47 m2 g−1at 370 nm). Thus, a direct application of Eq. (2) implicitly assumes that BrC has the same absorption cross-section as BC.
In this study, we improve upon this method to estimate BrC concentrations. We first determine the contribution of BrC to total aerosol absorption at 370 nm:
We estimate BC absorption at 370 nm, babs,BC(370 nm), by extrapolating the measured aerosol light absorption at 880 assuming AAEBC = 0.67. Whereas AAEBC = 1 is a commonly used value that is consistent with Mie theory (i.e., uncoated, ideal spherical particles with wavelength-independent refractive index) (Liu et al., 2018), the value 0.67 was estimated based on the optical properties of the smoke measured in this study, as described below in Sect. 3.3. We then calculate BrC concentration by dividing babs,BrC(370 nm) by the current best estimate of the BrC mass absorption cross-section empirically determined by Ivančič et al. (2022) (4.5 m2 g−1 at 370 nm) rather than assuming BrC and BC have the same absorption cross-section. In doing so, our BrC concentrations are equivalent to those reported by the newest model of the aethalometer (i.e., the AE36) (Aerosol Magee Scientific, 2024).
Following the approach presented in Kirchstetter and Thatcher (2012), we computed the contribution of BrC to smoldering smoke aerosol absorption of solar radiation. The contribution of BrC to spectral absorption in each smoke sample, babs,BrC(λ), is determined by subtracting the BC absorption from the total absorption with Eq. (3). Based on the apportionment of spectral absorption to BC and BrC, we compute the fraction of spectral radiation for smoldering smoke at each wavelength in the solar spectrum that would be absorbed by BrC:
Last, we compute the fraction of solar radiation that BrC in the smoldering smoke would absorb in the atmosphere:
where i(λ) is the clear sky air mass one global horizontal solar spectrum at the earth's surface (Levinson et al., 2010). We evaluate FBrC using two sets of integration bounds (λ1, λ2): (1) across the full solar irradiance spectrum from 300–2500 nm that is meaningful for atmospheric warming and (2) in the near-UV from 300–400 nm that is more relevant to tropospheric photochemistry (Li and Li, 2023; Mok et al., 2016).
The modified combustion efficiency (MCE) is typically used to assess the combustion completeness during biomass burning and was calculated as the mass fraction of fuel C emitted as CO2 compared to CO2 and CO (Ward and Radke, 1993):
Background-subtracted concentrations ΔCO and ΔCO2 were calculated as the difference between measured concentrations and background concentrations, the latter of which were established separately for each of the four days of sampling (listed in Table S2 in the Supplement). MCE is unitless, and a value of 0.9 is commonly used as a threshold to distinguish between flaming-dominated (MCE>0.9) and smoldering-dominated (MCE<0.9) combustion (Selimovic et al., 2018).
Fuel-based BC and BrC emission factors (EFi) in units of grams BC and BrC emitted per kilogram fuel consumed (g kg−1) were calculated by the carbon balance method:
where ΔCi is the background-subtracted BC or BrC concentration (µg m−3), wc=0.5 is the weight fraction of carbon in conifer forest fuels (Thomas and Martin, 2012), Vm is the molar volume of air and equal to 0.024 m3 mol−1, MWc is the molar mass of carbon and equal to 12 g mol−1, and ΔCO and ΔCO2 are mixing ratios (ppm) (Akagi et al., 2011). In Eq. (7), the carbon balance method assumes that all fuel carbon is emitted as either CO or CO2, given 90 %–98 % of total emitted carbon is emitted as these gases (Akagi et al., 2011; Binte Shahid et al., 2024; Nelson Jr., 1982; Yokelson et al., 2013). Emission factors were calculated by integration of the background-subtracted pollutant concentrations over different time intervals. The integration bounds for the aerial emission factors were the start and end times of each flight, with a temporal basis equal to the total flight duration, or t1−t0 in Eq. (4). Flight durations ranged from 4–22 min. For the ground emission factors, the start time (t0) was when the aethalometer began collecting samples on a new filter spot and the attenuation (ATN) was zero. The end time (t1) was when the filter became saturated at an ATN of 100. At that point, the aethalometer advanced its filter tape. These integration bounds resulted in a ground sample temporal basis that corresponded to the ATN cycle of the aethalometer, which ranged from 2–36 min. A detailed discussion of the representativeness and chosen temporal basis of the emission factors is provided in the Supplement.
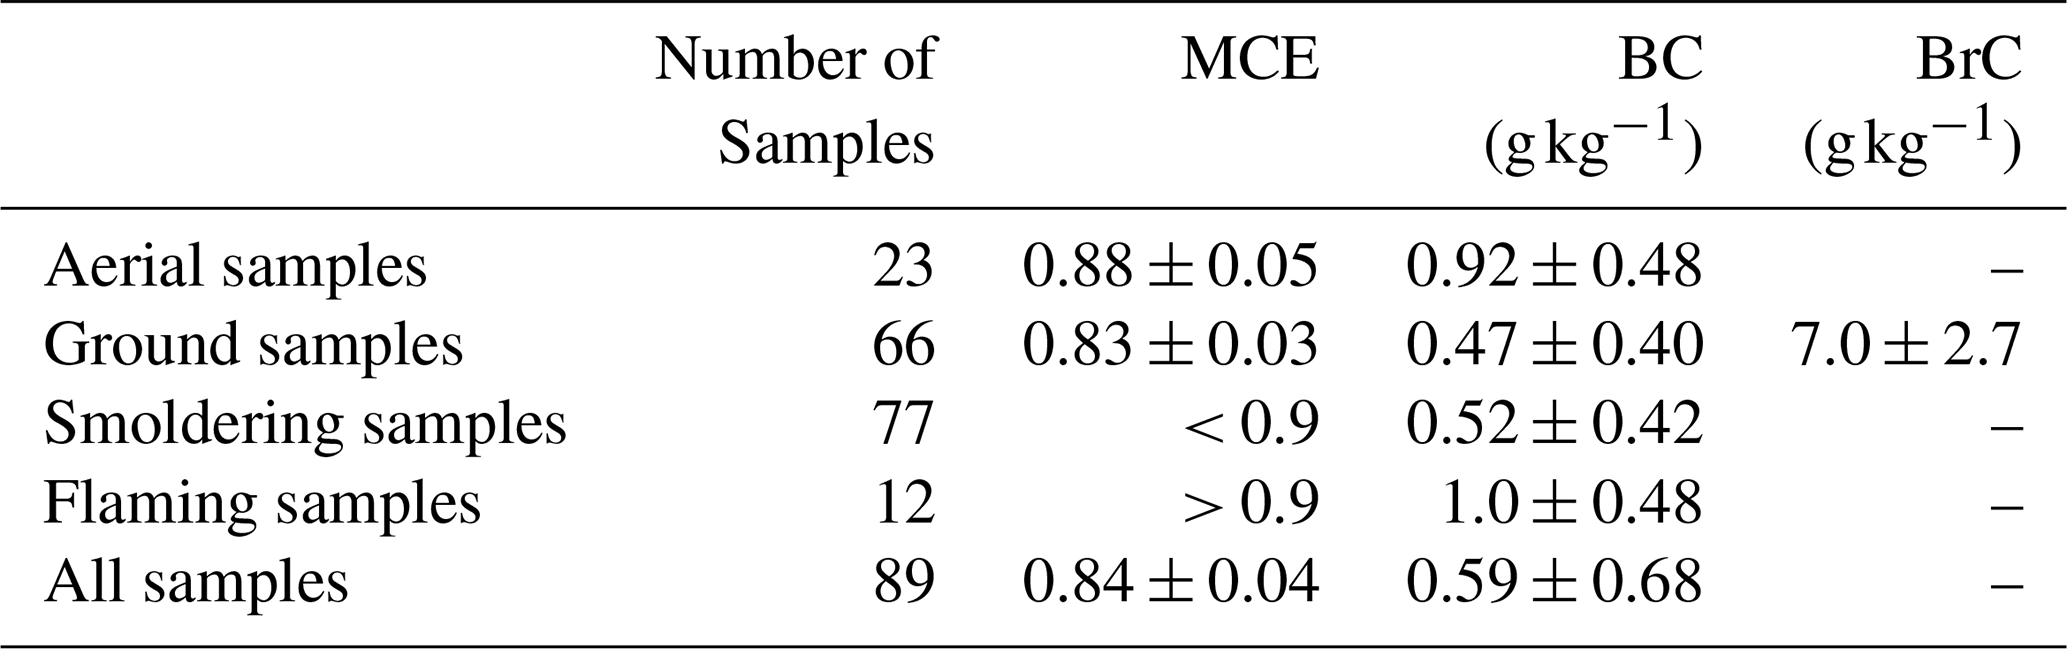
3.1 Emission Factors
BC and BrC emission factors measured on the ground and aloft are presented in Table 1. Overall, the aerial platform measured smoke characterized by a higher modified combustion efficiency (MCEaerial = 0.88 ± 0.05, average ± standard deviation) and nearly 2 times higher BC emission factor (EFBC,aerial = 0.92 ± 0.48 g kg−1) than the smoke measured on the ground (MCEground = 0.83 ± 0.03; EFBC,ground = 0.47 ± 0.40 g kg−1).
Table 1Summary Statistics of Carbonaceous Aerosol Emission Factors and MCE (average ± standard deviation).
BC emission factors are plotted against MCE in Fig. 1. Individual ground platform samples are plotted as orange circles and aerial samples are plotted as blue squares. Nearly all the smoke samples collected from the ground platform (64 of 66 ATN cycles) were associated with smoldering combustion (MCE < 0.9). A roughly equal number smoke samples collected aloft were associated with flaming-dominant combustion (10 flights) and smoldering-dominant combustion (13 flights). BC emission factors demonstrated a weak positive linear correlation (solid black line, r2 = 0.11) against MCE values, with BC emission factors spanning an order of magnitude (0.11–1.70 g kg−1) and MCE vales ranging from 0.76–0.96. This relationship is similar to the weak positive linear trend reported by McMeeking et al. (2009) for a laboratory study (r2 = 0.09), shown as a dashed black line in Fig. 1. In contrast, another laboratory study by Hosseini et al. (2013) reported a weak negative linear trend (dotted black line, r2 = 0.10). The application of linear regression models to emission factor data would allow these field and laboratory studies to be scaled in fuel consumption models as a function of combustion conditions and/or fire intensity (Burling et al., 2011; May et al., 2014; Ottmar, 2014; Selimovic et al., 2018; Urbanski, 2014). However, given the very low coefficients of determination from this work and previous laboratory studies (r2 < 0.15), MCE is not a strong predictor of the BC emission factor for smoke model estimates.
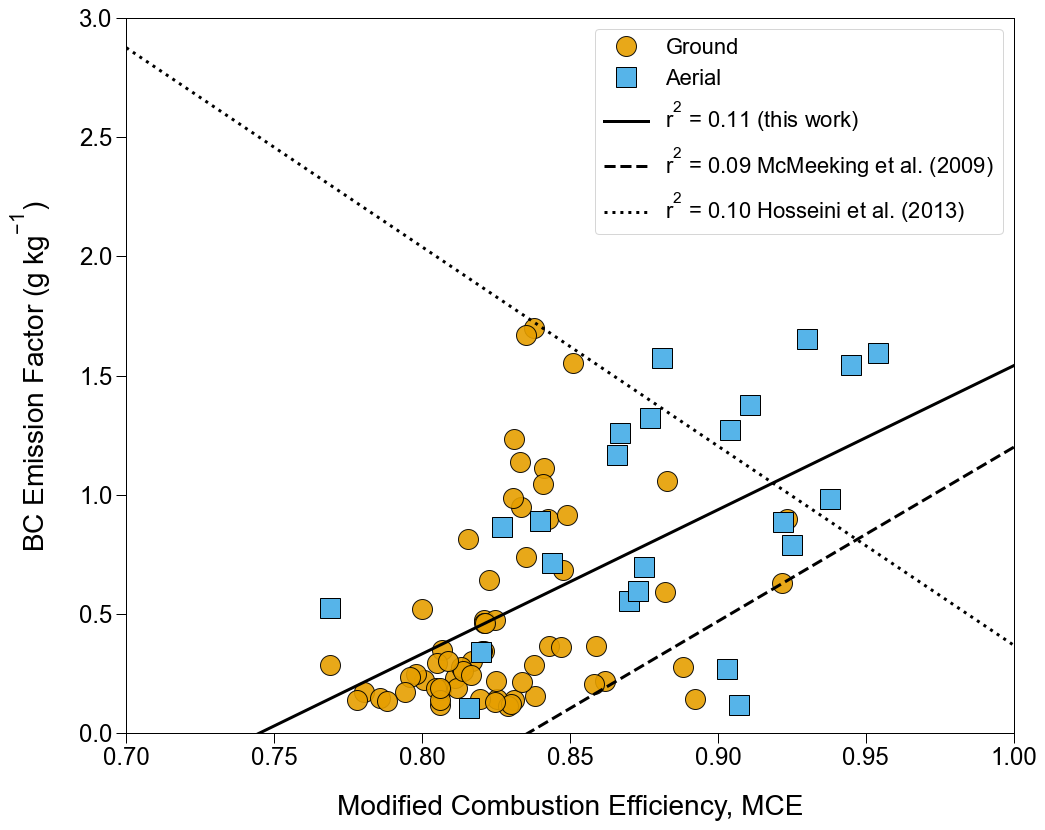
Figure 1BC emission factors plotted against modified combustion efficiency for all samples. Symbology designates the ground (circles) and aerial (squares) measurement platforms. All samples fit with a linear regression model and compared to previous laboratory linear models of BC emission factors as a function of MCE (Hosseini et al., 2013; McMeeking et al., 2009).
3.2 Emissions Modeling in Fuel Consumption Models
BC emission factor distributions for flaming (MCE > 0.9) and smoldering (MCE < 0.9) conditions are presented in Fig. 2. These combustion categories were chosen to match how smoke models calculate emissions, often with combustion-phase dependent emission factors. Fuel consumption models (e.g., Burnup, CONSUME) compute the total fuel consumed separately during flaming and smoldering combustion phases of a burn. Smoke models then apply the appropriate EFs, with either one EF for flaming combustion and one EF for smoldering combustion (e.g., FOFEM), or using a linear model like that presented in Fig. 1 where the calculated MCE in the fuel consumption model is used to obtain the corresponding EF. The average BC emission factors measured during flaming combustion conditions in this study were nearly 2 times greater than those measured during smoldering conditions: EFBC,flaming = 1.0 ± 0.48 g kg−1 versus EFBC,smoldering = 0.52 ± 0.42, with similar magnitude as the average emissions factors for aerial and ground samples reported above.
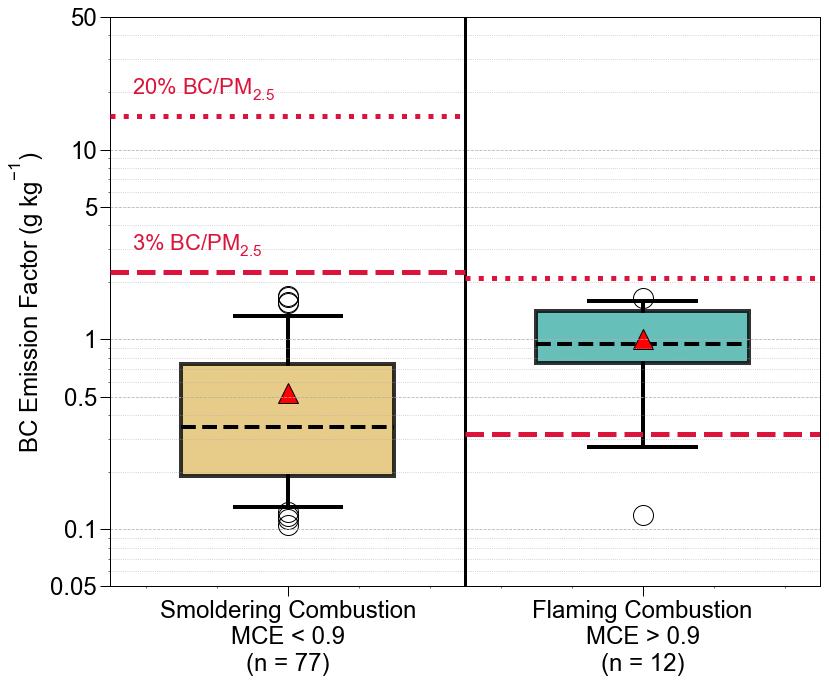
Figure 2BC emission factors categorized into smoldering combustion (MCE < 0.9) and flaming combustion (MCE > 0.9) phases for input into fuel consumption. Boxes represent the interquartile range and tails the 5th and 95th percentile. The median is provided as the black dashed line across the box, the average as a red triangle, and outliers as open circles. Speciation profile-derived BC emission factors for 3 % and 20 % BC PM2.5 for each combustion phase are plotted as red horizontal dashed and dotted lines, respectively. Note the logarithmic scale on the y axis.
Also included in Fig. 2 are BC emission factors calculated with the FOFEM methodology as a fraction of PM2.5 emission factors from Burling et al. (2011) for a mixed-conifer understory prescribed burn (Burling et al., 2011; Lutes, 2020). These BC emission factors are plotted as horizontal lines across each combustion regime in Fig. 2 and represent values assumed in the most recent federal and California BC inventories. The 2020 National Emissions Inventory (dashed line) assumes a 3 % BC PM2.5 mass ratio for all wildland fire sources, including prescribed burns and wildfires (US Environmental Protection Agency, 2023). The 2013 California BC Emissions Inventory (dotted line) assumes a 20 % BC PM2.5 mass ratio for prescribed burns (California Air Resources Board, 2016). These BC PM2.5 mass ratios, or BC speciation profiles, are known to be highly uncertain (Chow et al., 2011). For example, in the EPA SPECIATE v5.3 database, prescribed burn BC PM2.5 mass ratios vary from 3 %–11 % and for uncontrolled forest fire or forest fuel types between 0.8 %–80 % (SPECIATE, 2025).
The difference between the average flaming and smoldering BC emission factors measured in this study and the BC emission factors estimated from BC PM2.5 ratios reveals the current limitation in using the latter methodology in wildland fire modeling frameworks to estimate BC emissions. PM2.5 emission rates for mixed-conifer forests and many other ecosystems are higher under smoldering combustion than under flaming combustion, the opposite of BC emission rates (Burling et al., 2011; Chen et al., 2007). As a result, BC emission rates are erroneously predicted to be greater under smoldering combustion. The speciation profiles assumed in the federal and California inventories overestimate BC emission factors under smoldering combustion for this type of burn by a factor 4 and 29, respectively. Under flaming combustion, the California inventory overestimates BC emission rates by a factor of 2, whereas the federal inventory underestimates by 0.3. Dividing the average field BC emission factors in this study by the PM2.5 emission factor from Burling et al. (2011) indicates that a more appropriate BC speciation profile for a mixed-conifer understory prescribed burn would be 0.7 % and 9.5 % for the smoldering and flaming combustion phases, respectively.
3.3 Optical Properties and Apportionment of Aerosol Solar Radiation Absorption
BrC emission factors were computed based on ground-level smoke measurements with the multiwavelength aethalometer, most of which (64 of 66 samples) were during smoldering-dominated combustion. There as a very weak positive linear relationship (r2 = 0.06) between BrC emission factors and MCE (Fig. 3). The study average BrC emission factor was 7.0 ± 2.7 g kg−1. It is worth noting that this BrC emission factor, computed as described in Sect. 2.2 based on an absorption cross-section specific to BrC, is 4.4 times greater than the emission factor calculated using the more traditional Delta-C method, where the absorption-cross section of BrC is operationally defined as equal to the absorption cross-section of BC.
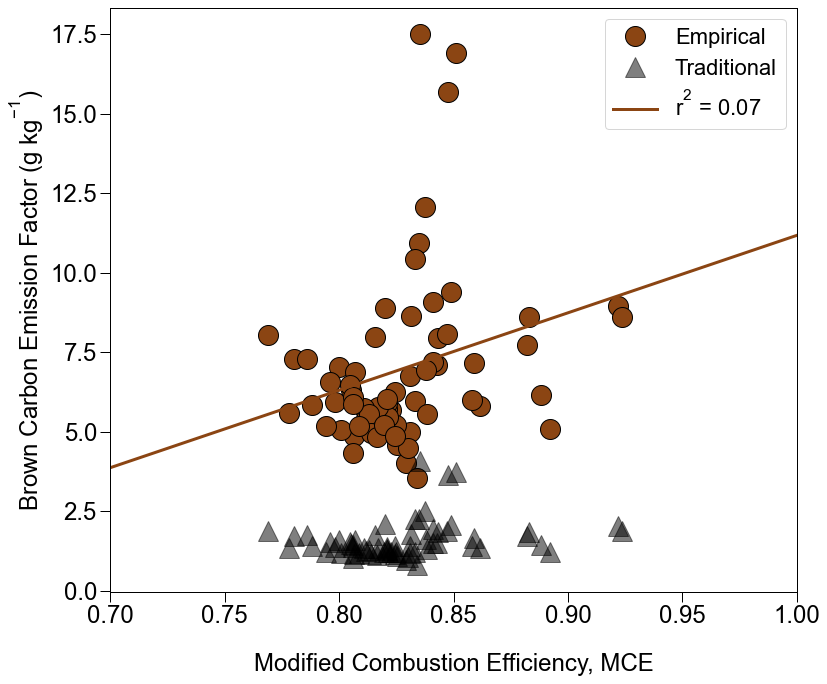
Figure 3Ground BrC emission factors computed using the Delta-C method with a BrC-specific mass absorption cross-section (denoted as Empirical and shown with brown circles) and the more traditional approach using an operationally defined BrC mass absorption cross-section equal to that of BC (denoted as Traditional and shown with grey triangles) plotted against modified combustion efficiency. The solid brown line shows the linear regression for the BrC emission factors calculated with the empirical approach.

Figure 4Average 1 min absorption at seven wavelengths measured by the ground aethalometer plotted as red hexagons, with error bars representing 95 % confidence intervals. (a) Power-law fit of the average absorption curve at all wavelengths with an AAE = 2.32 (solid curve) and 95 % confidence interval AAE values displayed as the bounding dashed curves. (b) Power-law fit of the BrC average absorption curve (λ = 370, 470, 520, 590, and 660 nm; blue circles) with an AAEBrC = 6.26 (solid brown curve) with 95 % confidence interval AAE values displayed as the bounding dashed curves and the BC average absorptions (λ = 880, 950 nm; red hexagons) with an AAEBC = 0.67 (solid black curve).
Study-average spectral absorption curves are plotted in Fig. 4. A power-law fit to the data over all aethalometer wavelengths from 370–950 nm is shown in Fig. 4a. The absorption data are fit with two trend lines in Fig. 4b: an extrapolation of the power law fit to the near-IR data at 880 and 950 nm to illustrate the BC contribution to total absorption, babs,BC(λ), and a power law fit of the BrC contribution to absorption, babs,BrC(λ), which extends from mid-visible wavelengths to the near-UV, calculated using Eq. (3). The AAE given by the power law exponent reported in Fig. 4a is 2.32 (1.35, 3.29; 95 % confidence interval), indicating a significant contribution of BrC to total absorption. The power law fits in Fig. 4b yield AAEBrC = 6.26 (5.37,7.13) and AAEBC = 0.67. For comparison, El Asmar et al. (2024) found similar overall AAE = 1.89 (range of 1.31–3.32) and a lower average AAEBrC = 5.00 (range of 3.19–7.43) for prescribed burns in southeastern US measured 0–8 h downwind with the same model multiwavelength aethalometer used in this study. The AAEBrC for western wildfires measured with a photoacoustic spectrometer by Zeng et al. (2022) was also comparable (2.07 ± 1.01; average ± standard deviation). Mie theory predicts that AAEBC = 1 for particle diameters less than 10 nm and AAEBC < 1 for particle diameters greater than ∼ 0.2 µm (Wang et al., 2016), suggesting that the bulk of sampled aerosols had a diameter greater than 0.2 µm and less than 2.5 µm, since a PM2.5 cyclone was placed on the sampling inlet.
Whereas the absorption cross-section of BrC is much lower than that of BC over the near-IR to near-UV portion of the solar spectrum, smoldering smoke emits much more BrC than BC: 7.0 ± 2.7 g BrC kg−1 versus 0.52 ± 0.42 g BC kg−1. Consequently, using Eq. (5) and shown in Fig. S10, we estimate that BrC and BC would account for 23 % and 77 % of incoming solar radiation absorbed by the smoldering smoke in the atmosphere (integrated from 300–2500 nm). Furthermore, BrC would contribute 82 % of the aerosol absorption of solar radiation at wavelengths below 400 nm and, therefore, may affect tropospheric photochemistry. Similarly, Chakrabarty et al. (2023) found BrC contributes 66 %–86 % of total aerosol absorption at 405 nm in wildfire smoke emitted in the western United States.
AAE values reported in the literature are computed using different approaches. For example, AAE is commonly derived from data at only two wavelengths and those wavelengths differ from study to study, which makes direct comparison among studies challenging. To illustrate this point, we calculated AAE values on 1 min absorption data from the current study using three wavelength pairs that approximate prior work. Table 2 reports power law fitting of (i) 370 and 880 nm to approximate the wavelengths in a photoacoustic extinctiometer, (ii) 470 and 660 nm to approximate a continuous light absorption photometer, and (iii) 470 and 880 nm to approximate the satellite based AERONET.
Table 2Measured and Nearest Aethalometer Wavelengths to Calculate the Absorption Ångström Exponent (AAE).
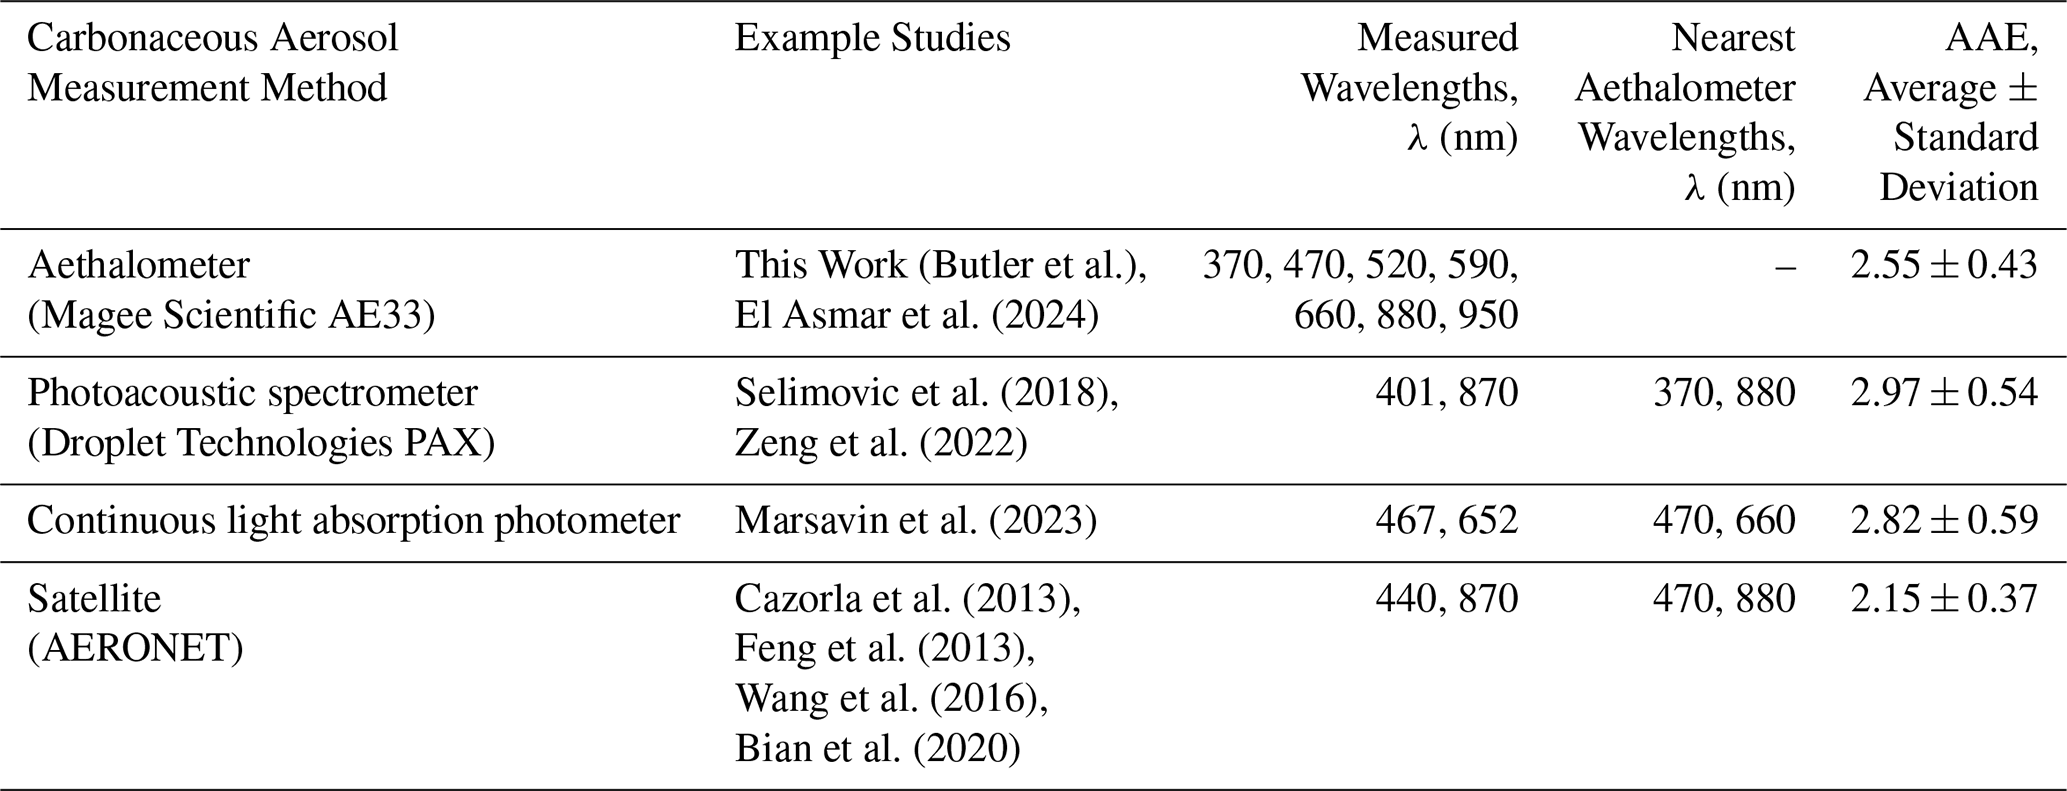
The 1 min average AAE for the three wavelength pairs are listed in the rightmost column of Table 2. The 370, 880 and 470, 660 wavelength pairs have a 16 % and 11 % greater value than the seven-wavelength power law fit in this work, whereas the 470, 880 wavelength pair a 16 % lesser value. These differences in average AAE indicate the uncertainty in interstudy comparison is approximately ±15 %. Distributions of the coefficient of determination (r2) for each approach are also presented in Fig. S11. A power law fit of 1 min average data at all seven wavelengths (AAE7λ) yielded the highest average coefficient of determination (r2 = 0.88), followed closely by fitting data at only 370 and 880 nm (r2 = 0.87). The lower average r2 values for power law fitting of data at 470 and 660 nm (r2 = 0.71) and 470 and 880 nm (r2 = 0.60) suggest that the AAE values determined from these approaches are not as certain.
Fuel-based BC and BrC emission factors were calculated by the carbon balance method with semi-continuous monitoring of a BC, CO, and CO2 on ground and aerial platforms for four days of prescribed burns. Aerial platform BC emission factors were measured under both flaming and smoldering combustion, whereas ground platform BC and BrC emission factors skewed towards almost entirely under smoldering combustion conditions. AAE, an aerosol optical property, was similarly quantified for smoldering combustion. BC emission factors were found to be poorly represented by a linear regression model based on MCE and were 2 times higher under flaming combustion than smoldering combustion. In addition, BC emission factors may be used in smoke models to improve wildland fire emissions inventories. BrC emission factors, estimated using a BrC-specific absorption cross-section, were nearly 14 times greater than smoldering BC emission factors and 7 times greater flaming BC emission factors. The study-average AAEs indicated significant BrC absorption, especially in the near-UV spectrum, indicating that BrC is a significant contributor to biomass smoke absorption of solar radiation. A fraction of this BrC absorption may be attributable to so-called tar balls, which may comprise 5 %–30 % of total PM2.5 in wildfire smoke in the western United States (Adachi et al., 2024; Chakrabarty et al., 2023).
In future work, deployment of a multiwavelength aethalometer on the aerial platform, would allow for Delta-C and AAE analyses to estimate BrC emission factors and optical properties under flaming combustion. Multiwavelength aerosol absorption measurements on an aerial platform across a wide range of combustion conditions would yield more representative BrC emission factors and AAE values, which would inform how to model BrC emissions during different combustion phases in fuel consumption models. Studies that quantify health impacts of prescribed burn smoke with a chemical transport model will benefit from fuel-based emission factors in this work and could determine the exposure concentrations of BC and BrC in PM2.5. The overall radiative effects of BC and BrC remains uncertain due to large uncertainties in global emissions inventories from wildland fires sources (Bond et al., 2013). Further improvements in bottom-up carbonaceous aerosol emissions inventories would constrain satellite retrievals of aerosol optical depth used to model aerosol scattering and absorption in global climate models.
Further partnership between government agencies, private land owners, and tribal nations will likely increase the frequency of prescribed burns, and thus possible health effects on downwind communities (Miller et al., 2020). Continued field measurements of emission factors with state-of-the-science platforms should focus on characterizing emission factors and optical properties for ecosystems commonly burned in the western United States, like the mixed-conifer forests studied here, Ponderosa pine forests, coastal forests, chaparral shrublands, and oak savannas. Carbonaceous aerosol emission factors for each of these ecosystems remain understudied, especially for BrC, and likely vary across ecosystems depending on fuel moisture content, fuel types, and combustion efficiency of the burn. In parallel, future studies could also investigate the toxicity of BC and BrC emitted by prescribed burns, which may vary depending on combustion conditions and fuels burned.
Datasets available at https://doi.org/10.5281/zenodo.17604670 (Butler et al., 2025) with associated Jupyter notebooks available in a GitHub repository (https://github.com/BAAQMD-jbutler/rx-burn, Butler, 2025).
The supplement related to this article is available online at https://doi.org/10.5194/acp-26-839-2026-supplement.
JDAB: conceptualization, data curation, formal analysis, investigation, methodology, resources, visualization, writing – original draft, writing – review and editing. AT: data curation, investigation, methodology, resources, writing – review and editing. deep sengupta: data curation, investigation, methodology, resources. NK: data curation, investigation, methodology, resources, writing – review and editing. KCB: conceptualization, funding acquisition, methodology, project administration, supervision, writing – review and editing. AHG: conceptualization, funding acquisition, methodology, project administration, supervision, writing – review and editing. CVP: conceptualization, methodology, resources, writing – review and editing. RAS: resources, writing – review and editing. TWK: conceptualization, funding acquisition, methodology, writing – original draft, writing – review and editing.
At least one of the (co-)authors is a member of the editorial board of Atmospheric Chemistry and Physics. The peer-review process was guided by an independent editor, and the authors also have no other competing interests to declare.
The statements and conclusions herein are those of the authors and do not necessarily reflect the views of the project sponsors.
Publisher's note: Copernicus Publications remains neutral with regard to jurisdictional claims made in the text, published maps, institutional affiliations, or any other geographical representation in this paper. While Copernicus Publications makes every effort to include appropriate place names, the final responsibility lies with the authors. Views expressed in the text are those of the authors and do not necessarily reflect the views of the publisher.
We thank Ariel Roughton, Rob York, John Battles, Scott Stephens and the staff of the Blodgett Forest Research Station for their work to conduct the prescribed burns, feed and house the research team, and ensure safety when taking field measurements; Coty Jen for her feedback on early analyses; Drew Hill for his assistance on the Delta-C methodology; Adam Wise for development of the photographs in Key Figure, Figs. S2, and S9 in the Supplement; and Robert Harley for his review of early drafts.
This research has been supported by the California Air Resources Board (grant no. 19RD008) and the Lawrence Berkeley National Laboratory (grant no.: DEAC02-05CH11231).
This paper was edited by Stefania Gilardoni and reviewed by two anonymous referees.
Adachi, K., Dibb, J. E., Katich, J. M., Schwarz, J. P., Guo, H., Campuzano-Jost, P., Jimenez, J. L., Peischl, J., Holmes, C. D., and Crawford, J.: Occurrence, abundance, and formation of atmospheric tarballs from a wide range of wildfires in the western US, Atmos. Chem. Phys., 24, 10985–11004, https://doi.org/10.5194/acp-24-10985-2024, 2024.
Aerosol Magee Scientific: Aethalometer(R) – AE36s: Expand the fronteirs of aerosol Science with cutting-edge Black Carbon instrument, Aerosol Magee Scientific, Ljubljana, Slovenia, https://aerosolmageesci.com/webdocuments/AE36s_WP_March2024.pdf (last access: 29 December 2025), 2024.
Akagi, S. K., Yokelson, R. J., Wiedinmyer, C., Alvarado, M. J., Reid, J. S., Karl, T., Crounse, J. D., and Wennberg, P. O.: Emission factors for open and domestic biomass burning for use in atmospheric models, Atmos. Chem. Phys., 11, 4039–4072, https://doi.org/10.5194/acp-11-4039-2011, 2011.
Andreae, M. O.: Emission of trace gases and aerosols from biomass burning – an updated assessment, Atmos. Chem. Phys., 19, 8523–8546, https://doi.org/10.5194/acp-19-8523-2019, 2019.
Aurell, J. and Gullett, B. K.: Emission Factors from Aerial and Ground Measurements of Field and Laboratory Forest Burns in the Southeastern U. S.: PM2.5, Black and Brown Carbon, VOC, and PCDD/PCDF, Environ. Sci. Technol., 47, 8443–8452, https://doi.org/10.1021/es402101k, 2013.
Aurell, J., Gullett, B., Holder, A., Kiros, F., Mitchell, W., Watts, A., and Ottmar, R.: Wildland fire emission sampling at Fishlake National Forest, Utah using an unmanned aircraft system, Atmos. Environ., 247, 118193, https://doi.org/10.1016/j.atmosenv.2021.118193, 2021.
Bian, Q., Ford, B., Pierce, J. R., and Kreidenweis, S. M.: A Decadal Climatology of Chemical, Physical, and Optical Properties of Ambient Smoke in the Western and Southeastern United States, J. Geophys. Res.-Atmos., 125, e2019JD031372, https://doi.org/10.1029/2019JD031372, 2020.
Binte Shahid, S., Lacey, F. G., Wiedinmyer, C., Yokelson, R. J., and Barsanti, K. C.: NEIVAv1.0: Next-generation Emissions InVentory expansion of Akagi et al. (2011) version 1.0, Geosci. Model Dev., 17, 7679–7711, https://doi.org/10.5194/gmd-17-7679-2024, 2024.
Bond, T. C., Streets, D. G., Yarber, K. F., Nelson, S. M., Woo, J.-H., and Klimont, Z.: A technology-based global inventory of black and organic carbon emissions from combustion, J. Geophys. Res.-Atmos., 109, https://doi.org/10.1029/2003JD003697, 2004.
Bond, T. C., Doherty, S. J., Fahey, D. W., Forster, P. M., Berntsen, T., DeAngelo, B. J., Flanner, M. G., Ghan, S., Kärcher, B., Koch, D., Kinne, S., Kondo, Y., Quinn, P. K., Sarofim, M. C., Schultz, M. G., Schulz, M., Venkataraman, C., Zhang, H., Zhang, S., Bellouin, N., Guttikunda, S. K., Hopke, P. K., Jacobson, M. Z., Kaiser, J. W., Klimont, Z., Lohmann, U., Schwarz, J. P., Shindell, D., Storelvmo, T., Warren, S. G., and Zender, C. S.: Bounding the role of black carbon in the climate system: A scientific assessment, J. Geophys. Res.-Atmos., 118, 5380–5552, https://doi.org/10.1002/jgrd.50171, 2013.
Burling, I. R., Yokelson, R. J., Akagi, S. K., Urbanski, S. P., Wold, C. E., Griffith, D. W. T., Johnson, T. J., Reardon, J., and Weise, D. R.: Airborne and ground-based measurements of the trace gases and particles emitted by prescribed fires in the United States, Atmos. Chem. Phys., 11, 12197–12216, https://doi.org/10.5194/acp-11-12197-2011, 2011.
Butler, J.: rx-burn, Github Repository [code], https://github.com/BAAQMD-jbutler/rx-burn, last access: 29 December 2025.
Butler, J., Tasnia, A., Sengupta, D., Kreisberg, N., Barsanti, K., Goldstein, A., Preble, C., Sugrue, R., and Kirchstetter, T.: Datasets for Emission Factors and Optical Properties of Black and Brown Carbon Emitted at a Mixed-Conifer Prescribed Burn, Version v1, Zenodo [data set], https://doi.org/10.5281/zenodo.17604670, 2025.
California Air Resources Board: California's Black Carbon Emission Inventory – Technical Support Document, California Air Resources Board, Sacramento, CA, https://ww2.arb.ca.gov/sites/default/files/classic/cc/inventory/slcp/doc/bc_inventory_tsd_20160411.pdf (last access: 29 December 2025), 2016.
California Air Resources Board: Greenhouse Gas Emissions of Contemporary Wildfire, Prescribed Fire, and Forest Management Activities, California Air Resources Board, Sacramento, CA, https://ww2.arb.ca.gov/sites/default/files/classic/cc/inventory/pubs/ca_ghg_wildfire_forestmanagement.pdf (last access: 29 December 2025), 2020.
Caubel, J. J., Cados, T. E., and Kirchstetter, T. W.: A new black carbon sensor for dense air quality monitoring networks, Sensors, 18, 738, https://doi.org/10.3390/s18030738, 2018.
Cazorla, A., Bahadur, R., Suski, K. J., Cahill, J. F., Chand, D., Schmid, B., Ramanathan, V., and Prather, K. A.: Relating aerosol absorption due to soot, organic carbon, and dust to emission sources determined from in-situ chemical measurements, Atmos. Chem. Phys., 13, 9337–9350, https://doi.org/10.5194/acp-13-9337-2013, 2013.
Chakrabarty, R. K., Shetty, N. J., Thind, A. S., Beeler, P., Sumlin, B. J., Zhang, C., Liu, P., Idrobo, J. C., Adachi, K., Wagner, N. L., Schwarz, J. P., Ahern, A., Sedlacek, A. J., Lambe, A., Daube, C., Lyu, M., Liu, C., Herndon, S., Onasch, T. B., and Mishra, R.: Shortwave absorption by wildfire smoke dominated by dark brown carbon, Nat. Geosci., 16, 683–688, https://doi.org/10.1038/s41561-023-01237-9, 2023.
Chelluboyina, G. S., Kapoor, T. S., and Chakrabarty, R. K.: Dark brown carbon from wildfires: a potent snow radiative forcing agent?, npj Clim. Atmos. Sci., 7, 1–10, https://doi.org/10.1038/s41612-024-00738-7, 2024.
Chen, L.-W. A., Moosmüller, H., Arnott, W. P., Chow, J. C., Watson, J. G., Susott, R. A., Babbitt, R. E., Wold, C. E., Lincoln, E. N., and Hao, W. M.: Emissions from Laboratory Combustion of Wildland Fuels: Emission Factors and Source Profiles, Environ. Sci. Technol., 41, 4317–4325, https://doi.org/10.1021/es062364i, 2007.
Chow, J. C., Watson, J. G., Lowenthal, D. H., Antony Chen, L.-W., and Motallebi, N.: PM2.5 source profiles for black and organic carbon emission inventories, Atmos. Environ., 45, 5407–5414, https://doi.org/10.1016/j.atmosenv.2011.07.011, 2011.
Connolly, R., Marlier, M. E., Garcia-Gonzales, D. A., Wilkins, J., Su, J., Bekker, C., Jung, J., Bonilla, E., Burnett, R. T., Zhu, Y., and Jerrett, M.: Mortality attributable to PM2.5 from wildland fires in California from 2008 to 2018, Sci. Adv., 10, eadl1252, https://doi.org/10.1126/sciadv.adl1252, 2024.
Cruz Núñez, X., Villers Ruiz, L., and Gay García, C.: Black carbon and organic carbon emissions from wildfires in Mexico, Atmósfera, 27, 165–172, https://doi.org/10.1016/S0187-6236(14)71107-5, 2014.
Dong, Q., Meng, X., Gong, J., and Zhu, T.: A review of advances in black carbon exposure assessment and health effects, CSB, 69, 703–716, https://doi.org/10.1360/TB-2023-0409, 2023.
El Asmar, R., Li, Z., Tanner, D. J., Hu, Y., O'Neill, S., Huey, L. G., Odman, M. T., and Weber, R. J.: A multi-site passive approach to studying the emissions and evolution of smoke from prescribed fires, Atmos. Chem. Phys., 24, 12749–12773, https://doi.org/10.5194/acp-24-12749-2024, 2024.
Feng, Y., Ramanathan, V., and Kotamarthi, V. R.: Brown carbon: a significant atmospheric absorber of solar radiation?, Atmos. Chem. Phys., 13, 8607–8621, https://doi.org/10.5194/acp-13-8607-2013, 2013.
Grahame, T. J., Klemm, R., and Schlesinger, R. B.: Public health and components of particulate matter: The changing assessment of black carbon, JAPCA J. Air Waste Ma., 64, 620–660, https://doi.org/10.1080/10962247.2014.912692, 2014.
Hadley, O. L. and Kirchstetter, T. W.: Black-carbon reduction of snow albedo, Nat. Clim. Change, 2, 437–440, https://doi.org/10.1038/nclimate1433, 2012.
Harrison, R. M., Beddows, D. C. S., Jones, A. M., Calvo, A., Alves, C., and Pio, C.: An evaluation of some issues regarding the use of aethalometers to measure woodsmoke concentrations, Atmos. Environ., 80, 540–548, https://doi.org/10.1016/j.atmosenv.2013.08.026, 2013.
Hosseini, S., Urbanski, S. P., Dixit, P., Qi, L., Burling, I. R., Yokelson, R. J., Johnson, T. J., Shrivastava, M., Jung, H. S., Weise, D. R., Miller, J. W., and Cocker III, D. R.: Laboratory characterization of PM emissions from combustion of wildland biomass fuels, J. Geophys. Res.-Atmos., 118, 9914–9929, https://doi.org/10.1002/jgrd.50481, 2013.
Huang, J., Hopke, P. K., Choi, H.-D., Laing, J. R., Cui, H., Zananski, T. J., Chandrasekaran, S. R., Rattigan, O. V., and Holsen, T. M.: Mercury (Hg) emissions from domestic biomass combustion for space heating, Chemosphere, 84, 1694–1699, https://doi.org/10.1016/j.chemosphere.2011.04.078, 2011.
Ivančič, M., Gregorič, A., Lavrič, G., Alföldy, B., Ježek, I., Hasheminassab, S., Pakbin, P., Ahangar, F., Sowlat, M., Boddeker, S., and Rigler, M.: Two-year-long high-time-resolution apportionment of primary and secondary carbonaceous aerosols in the Los Angeles Basin using an advanced total carbon–black carbon (TC-BC(λ)) method, Sci. Total Environ., 848, 157606, https://doi.org/10.1016/j.scitotenv.2022.157606, 2022.
Janssen, N. A. H., Hoek, G., Simic-Lawson, M., Fischer, P., van Bree, L., ten Brink, H., Keuken, M., Atkinson, R. W., Anderson, H. R., Brunekreef, B., and Cassee, F. R.: Black carbon as an additional indicator of the adverse health effects of airborne particles compared with PM10 and PM2.5, Environ Health Perspect, 119, 1691–1699, https://doi.org/10.1289/ehp.1003369, 2011.
Kaspari, S., McKenzie Skiles, S., Delaney, I., Dixon, D., and Painter, T. H.: Accelerated glacier melt on Snow Dome, Mount Olympus, Washington, USA, due to deposition of black carbon and mineral dust from wildfire, J. Geophys. Res.-Atmos., 120, 2793–2807, https://doi.org/10.1002/2014JD022676, 2015.
Keane, R. E. and Lutes, D.: First-Order Fire Effects Model (FOFEM), in: Encyclopedia of Wildfires and Wildland-Urban Interface (WUI) Fires, edited by: Manzello, S. L., Springer International Publishing, Cham, 1–5, https://doi.org/10.1007/978-3-319-51727-8_74-1, 2018.
Kirchstetter, T. W. and Thatcher, T. L.: Contribution of organic carbon to wood smoke particulate matter absorption of solar radiation, Atmos. Chem. Phys., 12, 6067–6072, https://doi.org/10.5194/acp-12-6067-2012, 2012.
Kirchstetter, T. W., Novakov, T., and Hobbs, P. V.: Evidence that the spectral dependence of light absorption by aerosols is affected by organic carbon, J. Geophys. Res.-Atmos., 109, https://doi.org/10.1029/2004JD004999, 2004.
Larkin, N. K., Raffuse, S. M., Huang, S., Pavlovic, N., Lahm, P., and Rao, V.: The Comprehensive Fire Information Reconciled Emissions (CFIRE) inventory: Wildland fire emissions developed for the 2011 and 2014 U. S. National Emissions Inventory, JAPCA J. Air Waste Ma., 70, 1165–1185, https://doi.org/10.1080/10962247.2020.1802365, 2020.
BlueSky Modeling Framework: https://www.airfire.org/data/bluesky, last access: 12 November 2024.
Laskin, A., Laskin, J., and Nizkorodov, S. A.: Chemistry of Atmospheric Brown Carbon, Chem. Rev., 115, 4335–4382, https://doi.org/10.1021/cr5006167, 2015.
Levinson, R., Akbari, H., and Berdahl, P.: Measuring solar reflectance – Part I: Defining a metric that accurately predicts solar heat gain, Sol. Energy, 84, 1717–1744, https://doi.org/10.1016/j.solener.2010.04.018, 2010.
Li, J. and Li, Y.: Ozone deterioration over North China plain caused by light absorption of black carbon and organic carbon, Atmos. Environ., 313, 120048, https://doi.org/10.1016/j.atmosenv.2023.120048, 2023.
Liu, C., Chung, C. E., Yin, Y., and Schnaiter, M.: The absorption Ångström exponent of black carbon: from numerical aspects, Atmos. Chem. Phys., 18, 6259–6273, https://doi.org/10.5194/acp-18-6259-2018, 2018.
Lutes, D. C.: FOFEM 6.7 User Guide, United States Forest Service, 2020.
Maji, K. J., Li, Z., Vaidyanathan, A., Hu, Y., Stowell, J. D., Milando, C., Wellenius, G., Kinney, P. L., Russell, A. G., and Odman, M. T.: Estimated Impacts of Prescribed Fires on Air Quality and Premature Deaths in Georgia and Surrounding Areas in the US, 2015–2020, Environ. Sci. Technol., https://doi.org/10.1021/acs.est.4c00890, 2024.
Marsavin, A., Gageldonk, R. van, Bernays, N., May, N. W., Jaffe, D. A., and Fry, J. L.: Optical properties of biomass burning aerosol during the 2021 Oregon fire season: comparison between wild and prescribed fires, Environ. Sci.: Atmos., 3, 608–626, https://doi.org/10.1039/D2EA00118G, 2023.
May, A. A., McMeeking, G. R., Lee, T., Taylor, J. W., Craven, J. S., Burling, I., Sullivan, A. P., Akagi, S., Collett, J. L., Flynn, M., Coe, H., Urbanski, S. P., Seinfeld, J. H., Yokelson, R. J., and Kreidenweis, S. M.: Aerosol emissions from prescribed fires in the United States: A synthesis of laboratory and aircraft measurements, J. Geophys. Res.-Atmos., 119, 11826–11849, https://doi.org/10.1002/2014JD021848, 2014.
McMeeking, G. R., Kreidenweis, S. M., Baker, S., Carrico, C. M., Chow, J. C., Collett, J. L., Hao, W. M., Holden, A. S., Kirchstetter, T. W., Malm, W. C., Moosmüller, H., Sullivan, A. P., and Wold, C. E.: Emissions of trace gases and aerosols during the open combustion of biomass in the laboratory, J. Geophys. Res.-Atmos., 114, https://doi.org/10.1029/2009JD011836, 2009.
Miller, R. K., Field, C. B., and Mach, K. J.: Barriers and enablers for prescribed burns for wildfire management in California, Nat. Sustain, 3, 101–109, https://doi.org/10.1038/s41893-019-0451-7, 2020.
Mok, J., Krotkov, N. A., Arola, A., Torres, O., Jethva, H., Andrade, M., Labow, G., Eck, T. F., Li, Z., Dickerson, R. R., Stenchikov, G. L., Osipov, S., and Ren, X.: Impacts of brown carbon from biomass burning on surface UV and ozone photochemistry in the Amazon Basin, Sci. Rep.-UK, 6, 36940, https://doi.org/10.1038/srep36940, 2016.
Nelson Jr., R. M.: An evaluation of the carbon balance technique for estimating emission factors and fuel consumption in forest fires, Res. Pap. SE-231. Asheville, NC: U. S. Department of Agriculture, Forest Service, Southeastern Forest Experiment Station, 231, 9, https://doi.org/10.2737/SE-RP-231, 1982.
North, M., Collins, B., Safford, H., and Stephenson, N.: Montane Forests, in: Ecosystems of California, University of California Press, 553–578, ISBN 978-0-520-27880-6, 2016.
Ottmar, R. D.: Wildland fire emissions, carbon, and climate: Modeling fuel consumption, Forest Ecol. Manag., 317, 41–50, https://doi.org/10.1016/j.foreco.2013.06.010, 2014.
Selimovic, V., Yokelson, R. J., Warneke, C., Roberts, J. M., de Gouw, J., Reardon, J., and Griffith, D. W. T.: Aerosol optical properties and trace gas emissions by PAX and OP-FTIR for laboratory-simulated western US wildfires during FIREX, Atmos. Chem. Phys., 18, 2929–2948, https://doi.org/10.5194/acp-18-2929-2018, 2018.
Stampfer, O., Austin, E., Ganuelas, T., Fiander, T., Seto, E., and Karr, C. J.: Use of low-cost PM monitors and a multi-wavelength aethalometer to characterize PM2.5 in the Yakama Nation reservation, Atmos. Environ., 224, 117292, https://doi.org/10.1016/j.atmosenv.2020.117292, 2020.
Steel, Z. L., Foster, D., Coppoletta, M., Lydersen, J. M., Stephens, S. L., Paudel, A., Markwith, S. H., Merriam, K., and Collins, B. M.: Ecological resilience and vegetation transition in the face of two successive large wildfires, J. Ecol., 109, 3340–3355, https://doi.org/10.1111/1365-2745.13764, 2021.
Sugrue, R. A., Preble, C. V., Butler, J. D. A., Redon-Gabel, A. J., Marconi, P., Shetty, K. D., Hill, L. A. L., Amezcua-Smith, A. M., Lukanov, B. R., and Kirchstetter, T. W.: The value of adding black carbon to community monitoring of particulate matter, Atmos. Environ., 325, 120434, https://doi.org/10.1016/j.atmosenv.2024.120434, 2024.
Tasnia, A., Lara, G., Foster, D., Sengupta, D., Butler, J. D. A., Kirchstetter, T. W., York, R., Kreisberg, N. M., Goldstein, A. H., Battles, J. J., and Barsanti, K. C.: Comprehensive Fuel and Emissions Measurements Highlight Uncertainties in Smoke Production Using Predictive Modeling Tools, ACS EST Air, 2, 982–997, https://doi.org/10.1021/acsestair.4c00142, 2025.
Thomas, S. C. and Martin, A. R.: Carbon Content of Tree Tissues: A Synthesis, Forests, 3, 332–352, https://doi.org/10.3390/f3020332, 2012.
Urbanski, S.: Wildland fire emissions, carbon, and climate: Emission factors, Forest Ecol. Manag., 317, 51–60, https://doi.org/10.1016/j.foreco.2013.05.045, 2014.
Urbanski, S. P., Hao, W. M., and Baker, S.: Chapter 4 Chemical Composition of Wildland Fire Emissions, in: Developments in Environmental Science, edited by: Bytnerowicz, A., Arbaugh, M. J., Riebau, A. R., and Andersen, C., vol. 8, Elsevier, 79–107, https://doi.org/10.1016/S1474-8177(08)00004-1, 2008.
US Environmental Protection Agency: 2020 National Emissions Inventory Technical Support Document: Fires –Wild, Prescribed, and Agricultural Field Burning, US Environmental Protection Agency, Research Triangle Park, NC, https://www.epa.gov/air-emissions-inventories/2020-national-emissions-inventory-nei-technical-support-document-tsd (last access: 29 December 2025), 2023.
SPECIATE: https://www.epa.gov/air-emissions-modeling/speciate-0, last access: 16 January 2025.
Wagstaff, M., Henderson, S. B., McLean, K. E., and Brauer, M.: Development of methods for citizen scientist mapping of residential woodsmoke in small communities, J. Environ. Manage., 311, 114788, https://doi.org/10.1016/j.jenvman.2022.114788, 2022.
Wang, X., Heald, C. L., Sedlacek, A. J., de Sá, S. S., Martin, S. T., Alexander, M. L., Watson, T. B., Aiken, A. C., Springston, S. R., and Artaxo, P.: Deriving brown carbon from multiwavelength absorption measurements: method and application to AERONET and Aethalometer observations, Atmos. Chem. Phys., 16, 12733–12752, https://doi.org/10.5194/acp-16-12733-2016, 2016.
Wang, Y., Huang, J., Zananski, T. J., Hopke, P. K., and Holsen, T. M.: Impacts of the Canadian Forest Fires on Atmospheric Mercury and Carbonaceous Particles in Northern New York, Environ. Sci. Technol., 44, 8435–8440, https://doi.org/10.1021/es1024806, 2010.
Wang, Y., Hopke, P. K., Rattigan, O. V., Xia, X., Chalupa, D. C., and Utell, M. J.: Characterization of Residential Wood Combustion Particles Using the Two-Wavelength Aethalometer, Environ. Sci. Technol., 45, 7387–7393, https://doi.org/10.1021/es2013984, 2011a.
Wang, Y., Hopke, P. K., and Utell, M. J.: Urban-scale Spatial–temporal Variability of Black Carbon and Winter Residential Wood Combustion Particles, Aerosol Air Qual. Res., 11, 473–481, https://doi.org/10.4209/aaqr.2011.01.0005, 2011b.
Ward, D. E. and Radke, L. F.: Emissions Measurements from Vegetation Fires: A Comparative Evaluation of Methods and Results, in: Fire in the Environmentl: The Ecological, Atmospheric, and Climatic Importance of Vegetation Fires, John Wiley & Sons Ltd., 53–76, 1993.
Wiedinmyer, C., Quayle, B., Geron, C., Belote, A., McKenzie, D., Zhang, X., O'Neill, S., and Wynne, K. K.: Estimating emissions from fires in North America for air quality modeling, Atmos. Environ., 40, 3419–3432, https://doi.org/10.1016/j.atmosenv.2006.02.010, 2006.
Wu, X., Sverdrup, E., Mastrandrea, M. D., Wara, M. W., and Wager, S.: Low-intensity fires mitigate the risk of high-intensity wildfires in California's forests, Sci. Adv., 9, eadi4123, https://doi.org/10.1126/sciadv.adi4123, 2023.
Yang, S., Xu, B., Cao, J., Zender, C. S., and Wang, M.: Climate effect of black carbon aerosol in a Tibetan Plateau glacier, Atmos. Environ., 111, 71–78, https://doi.org/10.1016/j.atmosenv.2015.03.016, 2015.
Yokelson, R. J., Burling, I. R., Gilman, J. B., Warneke, C., Stockwell, C. E., de Gouw, J., Akagi, S. K., Urbanski, S. P., Veres, P., Roberts, J. M., Kuster, W. C., Reardon, J., Griffith, D. W. T., Johnson, T. J., Hosseini, S., Miller, J. W., Cocker III, D. R., Jung, H., and Weise, D. R.: Coupling field and laboratory measurements to estimate the emission factors of identified and unidentified trace gases for prescribed fires, Atmos. Chem. Phys., 13, 89–116, https://doi.org/10.5194/acp-13-89-2013, 2013.
Zeng, L., Dibb, J., Scheuer, E., Katich, J. M., Schwarz, J. P., Bourgeois, I., Peischl, J., Ryerson, T., Warneke, C., Perring, A. E., Diskin, G. S., DiGangi, J. P., Nowak, J. B., Moore, R. H., Wiggins, E. B., Pagonis, D., Guo, H., Campuzano-Jost, P., Jimenez, J. L., Xu, L., and Weber, R. J.: Characteristics and evolution of brown carbon in western United States wildfires, Atmos. Chem. Phys., 22, 8009–8036, https://doi.org/10.5194/acp-22-8009-2022, 2022.
Zhang, A., Wang, Y., Zhang, Y., Weber, R. J., Song, Y., Ke, Z., and Zou, Y.: Modeling the global radiative effect of brown carbon: a potentially larger heating source in the tropical free troposphere than black carbon, Atmos. Chem. Phys., 20, 1901–1920, https://doi.org/10.5194/acp-20-1901-2020, 2020.