the Creative Commons Attribution 4.0 License.
the Creative Commons Attribution 4.0 License.
 | 16 Jan 2026
Measurement report: Altitudinal shift of ozone regimes in a mountainous background region
Yuan Yang
Haibo Li
Hao Zhang
Zhou Yang
Xiangwen Hou
Dan Yao
Hong Hu
Keyong Zhu
Ya Xiong
Li Lai
Dengmei Chen
Peisong Feng
Elevated background ozone (O3) poses significant challenges for regional air quality management. Understanding the vertical distribution of O3 and its precursors is critical, yet remains poorly characterized in Southwest China. This study presents the first comprehensive altitudinal gradient analysis (550, 1774, 2119 m above sea level – a.s.l.) in the Fanjingshan National Nature Reserve, a remote high-altitude site on the Yunnan-Guizhou Plateau. Continuous measurements (March–August 2024) revealed a marked positive gradient in O3 (14.8 ± 15.2 ppb at mountain foot to 40.2 ± 14.7 ppb at mountaintop), contrasting with declining precursor concentrations. Random Forest–SHAP analysis identified relative humidity and NOx as dominant controls at the mountain foot, whereas temperature and reactive VOCs governed O3 variability aloft. Chemical box modeling (OBM-MCM v3.3.1) demonstrated net O3 destruction at mountain foot (−1.93 ppb h−1) due to NO titration, shifting to net production at mountainside (0.35 ppb h−1) and mountaintop (0.29 ppb h−1). While O3 formation remained NOx-limited across all sites, sensitivity to anthropogenic hydrocarbons increased with altitude (RIR: −0.12 mountain foot to 0.51 mountaintop). Transport analysis indicated O3 accumulation at mountain foot via regional transport, contrasting with mountainside and mountaintop, which function as net source regions. These findings necessitate altitude-specific O3 control: prioritizing NOx reduction at lower elevations while coordinating NOx and VOC controls at higher altitudes. Expanding high-altitude monitoring, especially in under-monitored areas like Southwest China, is crucial for characterizing regional background pollution. Future studies require vertical monitoring with improved models to assess transboundary impacts and changing emissions.
- Article
(4915 KB) - Full-text XML
-
Supplement
(2738 KB) - BibTeX
- EndNote


Ozone (O3) within the atmospheric boundary layer results from the disruption of fundamental NO-NO2-O3 photochemical cycles. This disruption occurs through radical generation and transport processes under combined thermodynamic and dynamic factors (Atkinson and Arey, 2003; Carter, 2012). O3 significantly influences biogeochemical cycles, vegetation productivity, climate forcing, air quality, and human health (Feng et al., 2022; Tong et al., 2023; Feng et al., 2015; Wang et al., 2020, 2014). Although regulating precursor emissions along the EKMA curve can mitigate photochemical pollution, control measures may fail if they neglect the influence of horizontal transport and vertical exchange on O3 and its precursors. Conventional ground-based air quality monitoring stations cannot fully capture the spatial distribution of O3 in three dimensions, limiting their utility for forecasting and policy formulation. In key regions and megacities, vertical profiles of O3 and precursors have been obtained using platforms such as tethered balloons, aircraft, and meteorological towers (Dieu Hien et al., 2019; Li et al., 2022; Mo et al., 2022; Xue et al., 2011a). These studies have advanced our understanding of anthropogenic influences on large-scale atmospheric processes and tropospheric chemistry (Wang et al., 2025; Andreae et al., 2015; He et al., 2023; Shtabkin et al., 2020; Shi et al., 2019). However, none of these platforms can fully resolve the three-dimensional distribution of O3 pollution or reliably reflect regional pollution dynamics.
High-altitude mountain atmospheres are less influenced by surrounding ground-level pollution sources, making them suitable for studying pollutant transport and the exchange between the atmospheric boundary layer and the free troposphere. Observations from these sites better reflect regional pollution levels and their variations (Kanaya et al., 2013), while also serving as ideal locations for diagnosing and quantifying the impact of stratosphere-troposphere exchange on lower tropospheric O3. To date, intensive observational studies have been carried out at several high-altitude mountain stations, such as Mt. Kenya, Mt. Waliguan, Mt. Abu, Mt. Happo, Mt. Bachelor Observatory, Sonnblick, Tanah Rata, Kislovodsk, Krvavec, Arosa, and Pico Mountain Observatory (Okamoto and Tanimoto, 2016). These studies focus on background concentrations of O3 and its precursors, as well as temporal variations in long-range transport, and meteorological mechanisms. Regarding O3 background concentrations, measurements from dozens of global observation stations indicate that near-surface O3 levels in the Northern Hemisphere range between 20–60 ppbv, with specific concentrations varying by geographic location, altitude, and anthropogenic influence (Gaudel et al., 2020). Temporally, regional background and high-altitude stations exhibit increasing trends in mean O3 concentrations, peak values, exceedance frequencies, and durations of high-O3 episodes (Cooper et al., 2020). In summary, high-altitude observational campaigns employing multi-platform measurements, coupled with comprehensive analysis and modeling, have advanced our systematic understanding of upper lower-tropospheric air pollution and atmospheric chemistry. These efforts have enhanced knowledge of O3 and precursors background concentrations, trends, and long-range transport dynamics. However, existing high-altitude stations are unevenly distributed globally, with most located in mid-latitudes. Expanding the global observational network through additional high-altitude stations will be crucial to improving O3 and precursors monitoring and modeling capabilities. Since the 1990s, China has successively established regional atmospheric background monitoring stations at Longfengshan, Lin'an, Mt. Waliguan, Mt. Tai, Mt. Huang, Mt. Hua, and Mt. Heng, obtaining systematic observational datasets with regional characteristics (Kanaya et al., 2013; Xue et al., 2013; Xue et al., 2011b; Yang et al., 2017; Li et al., 2020). During the summer of 2006, Japanese and domestic researchers collaborated on a comprehensive atmospheric chemistry campaign (MTX2006) at Mt. Tai, providing in-depth insights into photochemical pollution, aerosol physicochemical properties, and the contributions of biomass burning and biogenic emissions to regional pollution (Kanaya et al., 2013). Additionally, Chinese and Japanese researchers conducted continuous measurements of O3 and CO at Mt. Huang and Mt. Hua, employing observational and modeling approaches to study photochemical pollution in eastern China (Wang et al., 2006). Despite recent advances, critical observational gaps persist, including a sparse high-altitude monitoring network-particularly sparse over southwestern China compared to global standards, a predominance of near-surface measurements of ozone and its precursors with scarce data in the crucial 1000–2000 m layer, and a general lack of vertically resolved analyses of these species. Therefore, it is helpful to establish gradient observation stations at high altitudes of more than 2000 m on the plateau to carry out gradient observation research on O3 and its precursors, which can help to accurately formulate regional background photochemical pollution control strategies.
Mt. Fanjing is the highest peak in the transitional slope between the Yunnan-Guizhou Plateau and the western Hunan hills, located in northeastern Guizhou Province, China. The summit reaches an elevation of 2570 m a.s.l., while the lowest point is at 500 m a.s.l., resulting in a topographic relief of over 2000 m. This area is influenced by both the Pacific Southeast Monsoon and the Indian Ocean Southwest Monsoon, creating a climatic convergence zone. The fluctuating temperature-humidity regimes provide critical conditions for the overlapping distribution of flora from different biogeographic regions. To investigate the influence of latitudinal zonality, vertical zonality, and slope aspect on meteorological conditions, as well as to comprehensively monitor meteorological dynamics under varying geographic conditions, the Mt. Fanjing Administration established and upgraded a multi-parameter observation network between 2012 and 2013. Due to its remoteness from anthropogenic pollution sources, Mt. Fanjing excellent environmental quality and serves as a relatively “clean area”. The protection and study of this pristine environment will provide valuable insights into atmospheric chemistry in background regions and support air pollution control strategies. However, to date, no project has investigated the vertical gradient characteristics of O3 and its precursors. Despite the establishment of meteorological networks on Mt. Fanjing, a systematic investigation into the vertical gradient characteristics of O3 and its precursors has not yet been conducted. To fill this knowledge gap and better understand the driving mechanisms of vertical O3 distribution in mountainous background regions, this study leverages the three-dimensional meteorological monitoring system of Mt. Fanjing to establish a gradient observation platform for O3 and its precursors at the mountain foot, mountainside, and mountaintop. The main aim of this study is to better understanding the altitudinal gradient variations of O3 production rates and sensitives. The findings will provide scientific support for the management of regional photochemical pollution and the conservation of ecological integrity in protected areas at the national level.
2.1 Sampling location description
In March 2024, leveraging automated weather stations in the core zone of the Fanjingshan National Nature Reserve, we established observation sites for O3 and its precursors at Heiwanhe (mountain foot observatory: 27°50′45′′ N, 108°46′3.87′′ E; 550 m a.s.l.), Huixiangping (mountainside observatory: 27°54′6.46′′ N, 108°42′14.33′′ E; 1774 m a.s.l.), and the upper cable car station (mountaintop observatory: 27°54′36.59′′ N, 108°41′44.50′′ E; 2119 m a.s.l.) (Fig. 1). Although the monitoring sites are located within a national nature reserve, the mountain foot and mountaintop stations are situated near low-intensity tourist infrastructure. The mountain foot site is adjacent to an eco-friendly sightseeing vehicle route (served by electric and gasoline-powered shuttles), as well as homestays and dining facilities. The mountaintop station is within 200 m of minor service facilities including small restaurants and shops. While these may introduce intermittent local emissions of CO, NOx and VOCs, several measures were taken to ensure data representativeness of regional background conditions: (1) Data periods with clear pollution plumes from nearby sources were identified via wind direction analysis and excluded from long-term trend assessments; (2) Diurnal spikes in CO, NOx and VOCs synchronized with tourist activity peaks were filtered; (3) Statistical outliers likely associated with transient local emissions were removed. The systematic evaluation revealed a negligible influence of these low-intensity local activities on the observed regional altitudinal gradients in O3 and its precursors. Therefore, the data presented here reliably represent the general altitudinal distribution patterns of O3 and its precursors in the background region of the Yunnan-Guizhou Plateau. From 1 March to 31 August 2024, continuous measurements were conducted for O3, NOx, CO, 57 VOCs species, and meteorological parameters.
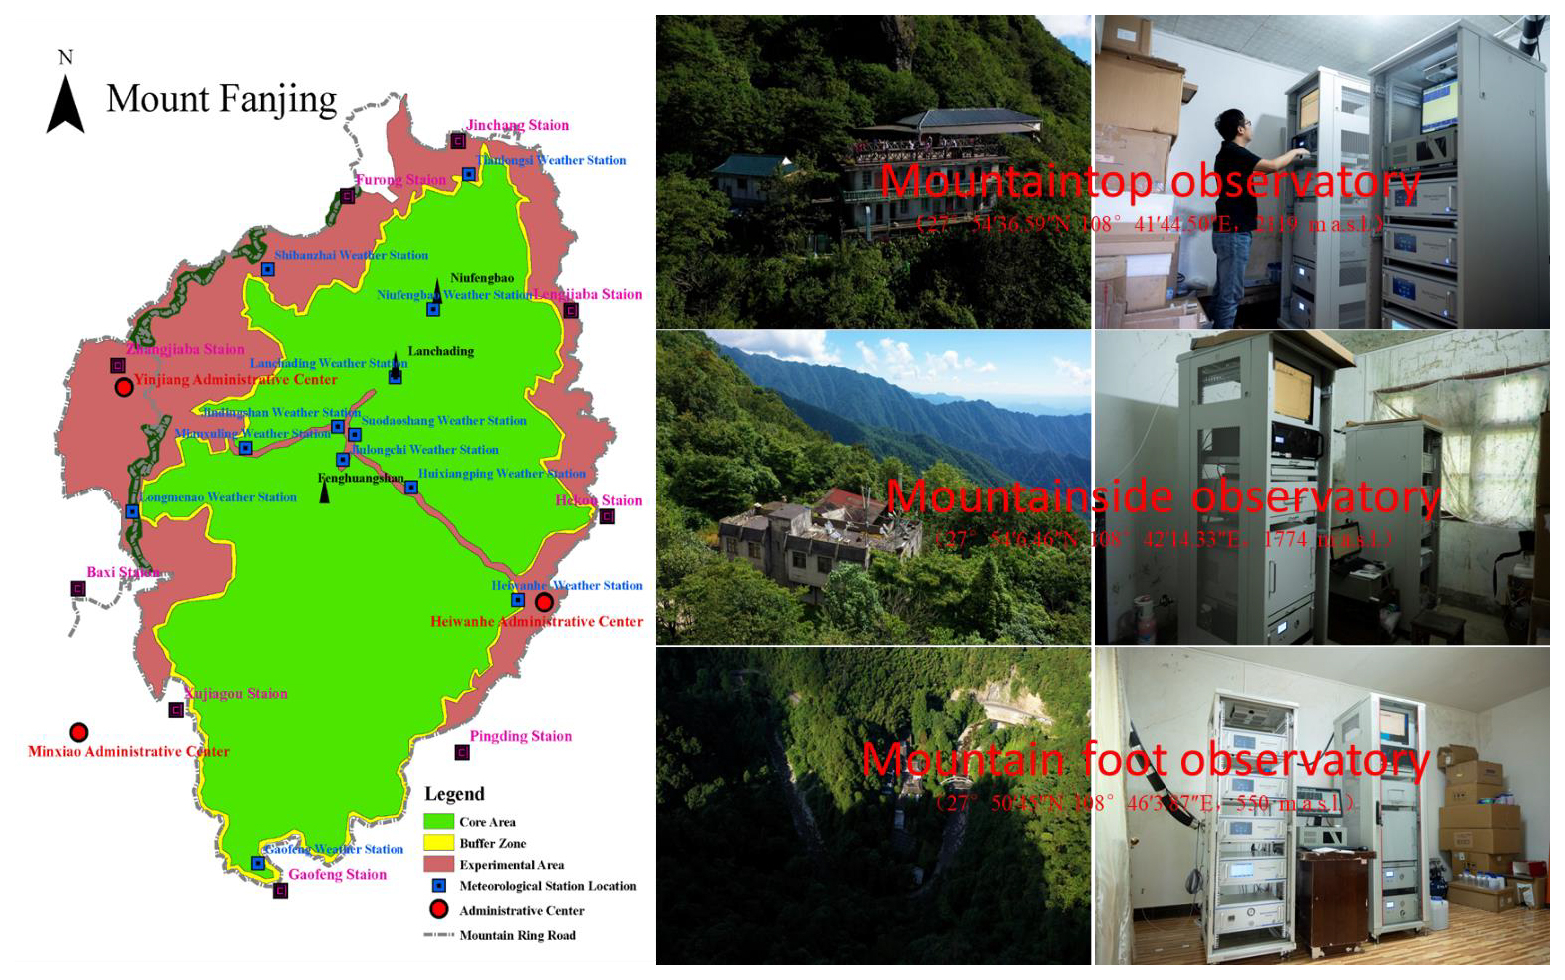
Figure 1Left panel: Distribution of automatic weather stations within the core zone of the Fanjingshan National Nature Reserve. Numbers adjacent to stations denote elevation (image credit: Administration of Guizhou Fanjingshan National Nature Reserve). Right panel: External settings and instrumental configurations of O3 and precursor monitoring stations at the mountain foot (Heiwanhe), mountainside (Huixiangping), and mountaintop (upper cable car station) (image credit: Colorful Guizhou, photographed on 24 July 2024).
2.2 In-situ synchronous observations of O3 and its precursors
O3 concentrations were quantified employing a ultraviolet (UV) absorption spectrometer (EAQM-3000; Jiangsu Skyray Instrument Co., Ltd., Jiangsu, China), a gold-standard technique recognized for its exceptional precision in tropospheric ozone monitoring. NO and NO2 were detected using a high-resolution chemiluminescence analyzer (EAQM-2000; Jiangsu Skyray Instrument Co., Ltd., Jiangsu, China), specifically optimized for precise measurement of trace atmospheric constituents. CO levels were determined via a non-dispersive infrared photometer (EAQM-4000; Jiangsu Skyray Instrument Co., Ltd., Jiangsu, China) incorporating gas filter correlation technology, significantly improving molecular specificity and minimizing cross-interference from other atmospheric gases. All analytical instruments were subjected to rigorous calibration procedures. The experimental design and analytical methodology strictly adhered to China's National Environmental Protection Standards, with all QA/QC protocols implemented in accordance with Class I monitoring station requirements as stipulated by the Ministry of Ecology and Environment of China. Meteorological parameters, including ambient temperature, relative humidity, atmospheric pressure, wind speed and wind direction, were continuously monitored and recorded using an automated weather station (WZZ-M6; Jiangsu Weizhihuan Energy Technology Co., Ltd., Jiangsu, China).
VOCs were measured in real time using an Ntrace VsCMS6500 VOCs automated monitoring system (Ntrace VsCMS6500; Nutech (China) Co., Ltd., Changsha, China). The instrument employs a unique “dual-column separation + center cutting + single FID” design, enabling comprehensive separation and analysis of VOCs compounds. Ambient air or calibration gas is introduced at a constant flow rate into the sampling system, where interfering substances are removed via cryogenic trapping, followed by enrichment of target analytes. Subsequently, the enriched compounds are thermally desorbed, separated by gas chromatography (GC), and quantified using a hydrogen flame ionization detector (FID). External standard calibration was applied for quantification. A series of standard gases (0.5, 2, 4, 6, 8, and 10 nmol mol−1) were analyzed in triplicate from low to high concentrations. Calibration curves were constructed using least-squares regression, with target compound concentrations as the abscissa and peak areas as the ordinate. The correlation coefficients (R2) of all calibration curves were ≥ 0.98. The relative error between the measured and reference values at the lowest calibration point was ≤ 15 %. Method detection limit (MDL): ≤ 0.1 nmol mol−1 for 90 % of the species. In summary, the system enables continuous sampling, processing, and detection of ambient VOCs, providing reliable quantification of 57 photochemical precursors. To ensure transparency and reproducibility, detailed VOC speciation data-including R2, relative errors, MDL, and mixing ratios (mean ± standard deviation) for each compound at all three altitudes-are provided in Table S1 in the Supplement.
2.3 Random forest modeling and SHAP-based interpretation
Random Forest (RF), an ensemble learning algorithm, improves predictive accuracy and robustness by aggregating predictions from multiple decision trees (Breiman, 2001; Zhang et al., 2025). The method employs bootstrap sampling and random feature selection to generate diverse trees, reducing overfitting while remaining applicable to both classification and regression tasks. Feature importance is quantified via two primary metrics: (1) the mean decrease in impurity (e.g., Gini index or entropy) at nodes where a feature splits data, or (2) the reduction in out-of-bag accuracy upon feature permutation. We implemented RF to evaluate meteorological and precursor drivers of O3 variability using the R packages “randomForest”, “rfPermute”, and “A3”. A fixed random seed (123) ensured reproducibility. Initial parameter optimization used a 7 : 3 training-validation split, with the final model trained on the full dataset (parameters: importance = TRUE, ntree = 500, nrep = 1000). Model significance and cross-validated R2 were assessed via 1000 permutation tests. To elucidate the sensitivity and response dynamics between predictor variables and outcomes within the RF model, we applied SHAP (Shapley Additive Explanations), which provide both local and global insights, elucidating nonlinear predictor-response relationships in complex models like RF (Lundberg et al., 2020). The RF-SHAP approach was chosen over traditional linear correlation analysis for several reasons. First, O3 formation involves complex, non-linear interactions between meteorological and chemical variables (e.g., humidity-dependent radical chemistry, temperature-sensitive reaction rates), which are inherently captured by ensemble tree-based models. Second, RF provides a robust ranking of feature importance that is less affected by multicollinearity than correlation coefficients, thereby offering a more reliable assessment of driver contributions. Finally, SHAP values enable both global and local interpretation, revealing not only which variables are important overall but also how they influence O3 concentrations across different observational contexts. This interpretability extends beyond what a covariance matrix or correlation plot can provide, offering deeper mechanistic insight into the altitudinal dependence of O3 controls.
2.4 Concentration-Weighted Trajectory CWT model
The Concentration-Weighted Trajectory (CWT) model has been widely employed to evaluate the regional transport of air pollutants by integrating backward trajectory analysis with observed chemical concentration data (Xing et al., 2024; Wu et al., 2025; Zhu et al., 2023; Jain et al., 2023; Seibert et al., 1994). Prior to conducting CWT analyses, backward trajectories were computed for each sampling site. The requisite meteorological input datasets for the HYSPLIT model (v4.9 Hybrid Single-Particle Lagrangian Integrated Trajectory) were obtained from the National Oceanic and Atmospheric Administration (NOAA) Global Data Assimilation System (GDAS) archive (available at ftp://arlftp.arlhq.noaa.gov/pub/archives/gdas1; last access: 25 May 2025). For the backward trajectory analysis, 36 h air masses arriving at each monitoring site during the sampling period were simulated, with 24 hourly initiations per day (from 00:00 to 23:00 UTC) at a temporal resolution of 1 h. For CWT analysis, we employed the widely-used “openair” R package, which provides a user-friendly interface for comprehensive air quality data analysis. Additional technical specifications pertaining to the CWT methodology are available in previously published works (Zheng et al., 2019, 2018).
2.5 Observation-based chemical box model
To comprehensively analyze in-situ ozone (O3) production and loss pathways and diagnose the O3 formation regime, we employed an observation-based model (OBM) framework coupled with the Master Chemical Mechanism (MCM v3.3.1), hereafter referred to as OBM-MCM. The detailed chemical mechanism, obtained from the MCM repository (http://mcm.york.ac.uk, last access: 19 May 2025), includes an extensive network of approximately 17 000 elementary reactions among > 5800 chemical species. Photolysis rate coefficients (J-values) were parameterized as a function of solar zenith angle and altitude using high-resolution lookup tables pre-calculated with the Tropospheric Ultraviolet and Visible (TUV) radiative transfer model (Wolfe et al., 2016). The model accounted for boundary layer dilution via a time-dependent mixing rate coefficient (kdil) that varied with planetary boundary layer height, following the approach of Xue et al. (2014). This dilution term, which ranged from 0.1 h−1 at night to 0.5 h−1 at midday, was applied only to unconstrained radical species (OH, HO2, RO2) and intermediate products, while measured species (NO, NO2, CO, VOCs) were constrained to observational data. As a zero-dimensional (0-D) formulation, the model explicitly excluded both vertical and horizontal advective transport processes (Edwards et al., 2013; Lenschow et al., 2016). These physical processes, along with deposition and any chemistry not represented in the mechanism, are collectively reflected in the residual term when comparing modeled chemical production/loss with observed O3 changes. Although this limits the direct quantification of individual transport pathways, the method remains effective for assessing the relative importance of in situ photochemistry versus the aggregate of physical influences (Liu et al., 2021; Xue et al., 2014). Model inputs consisted of high-temporal-resolution observations of O3, NOx, CO, speciated VOCs, meteorological parameters (temperature, relative humidity, pressure), and photochemically derived . To minimize initialization artifacts, a 72 h spin-up period was applied prior to formal analysis to establish robust chemical steady-state conditions, particularly for unmeasured reactive intermediates such as hydroxyl radicals (OH).
Within this framework, in situ O3 formation and consumption kinetics were explicitly calculated. To avoid confounding effects from NO-driven O3 titration, we analyzed the net formation rate of odd oxygen (O3 + NO2) rather than O3 alone. The relative roles of local photochemistry and physical transport were analytically separated using the relation: , where Rmeas is the observed O3 change rate, Rchem is the chemically driven O3 formation rate derived from the model, and Rtrans represents the net flux due to all non-photochemical processes. These include: (1) horizontal advection of O3 and its precursors, (2) vertical exchange through mountain–valley circulations and entrainment from the free troposphere, (3) dry deposition to surfaces, and (4) any chemical pathways not included in MCM v3.3.1. In mountainous regions, thermally driven slope flows can make vertical transport particularly significant (Henne et al., 2005; Wagner et al., 2014). Positive Rtrans values indicate net O3 import via transport exceeding deposition losses, whereas negative values imply net export or deposition exceeding import. For quantifying O3 production and loss pathways, the model was constrained only by measured precursor concentrations and meteorological parameters; O3 itself was left unconstrained. This allowed the model to independently simulate gross chemical production and destruction rates. The discrepancy between modeled and observed O3 then provided insight into the net effect of physical transport processes (Rtrans). Further details on the computational chemistry methodology are described in prior studies (Zhou et al., 2024; Zhong et al., 2025; Liu et al., 2022; Chen et al., 2020; Xue et al., 2014). Mechanistic analysis indicated that O3 production was dominated by NOx oxidation via peroxy radicals (HO2 + RO2), while major loss pathways included photolytic decomposition and reactions with NO2, OH, HO2, and unsaturated VOCs. Although MCM v3.3.1 is among the most comprehensive chemical mechanisms available, it may not capture all O3-forming routes-particularly those involving unmeasured VOC species or complex oxidation products. Recent studies suggest that MCM may underestimate O3 production by 10 %–20 % in some environments due to omitted chemistry of larger alkanes, sesquiterpenes, and oxygenated VOCs (Wang et al., 2018; Jenkin et al., 2019).
The O3–precursor relationship was evaluated using two complementary methods: (1) Relative Incremental Reactivity (RIR) – a diagnostic metric quantifying the sensitivity of O3 production to changes in precursor concentrations, defined as the ratio of the change in O3 production rate to the change in precursor concentration (Liu et al., 2020; Lu et al., 2019; Guo et al., 2017; Wang et al., 2017). (2) Empirical Kinetics Modeling Approach (EKMA)-used to systematically map O3–NOx–VOC response surfaces and identify optimal emission control strategies. For sensitivity analyses and EKMA isopleth construction, baseline conditions were defined using campaign-averaged diurnal profiles of precursors. Model scenarios were then performed with NOx and VOC concentrations systematically varied from 0 % to 200 % of baseline in 10 % increments. Each simulation included a 72 h spin-up to reach pseudo-steady state. Maximum daily O3 concentrations from each scenario were used to generate EKMA isopleths. This unconstrained approach ensures that the O3 response genuinely reflects photochemical sensitivity to precursor changes, free from artificial constraints imposed by observations.
3.1 Observational overview
Mt. Fanjing exhibits a steep vertical meteorological gradient, manifesting as distinct conditions across altitudes: typically sunny conditions mountain foot, fog enveloping mountainside, and frequent rainfall at mountaintop (Figs. S1–S3 in the Supplement). Observational data revealed inverse altitudinal gradients for both wind speed and atmospheric pressure relative to temperature. Measured temperatures were 22.4 ± 5.1, 16.8 ± 4.2, and 15.0 ± 3.9 °C at mountain foot, mountainside, and mountaintop, respectively (Fig. 2A). Corresponding atmospheric pressures were 945 ± 4.5, 819 ± 2.8, and 783 ± 2.6 hPa (Fig. 2D), while corresponding wind speeds were 0.6 ± 0.4, 0.7 ± 0.6, and 1.4 ± 1.4 m s−1 (Fig. 2B). Relative humidity peaked at mountainside (91.7 ± 9.7 %), followed by the mountaintop (90.1 ± 9.7 %), and was lowest at mountain foot (86.5 ± 12.2 %) (Fig. 2C). These observed vertical gradients in meteorological parameters may govern O3 dynamics through modulation of both in-situ photochemical processes and advective transport mechanisms.
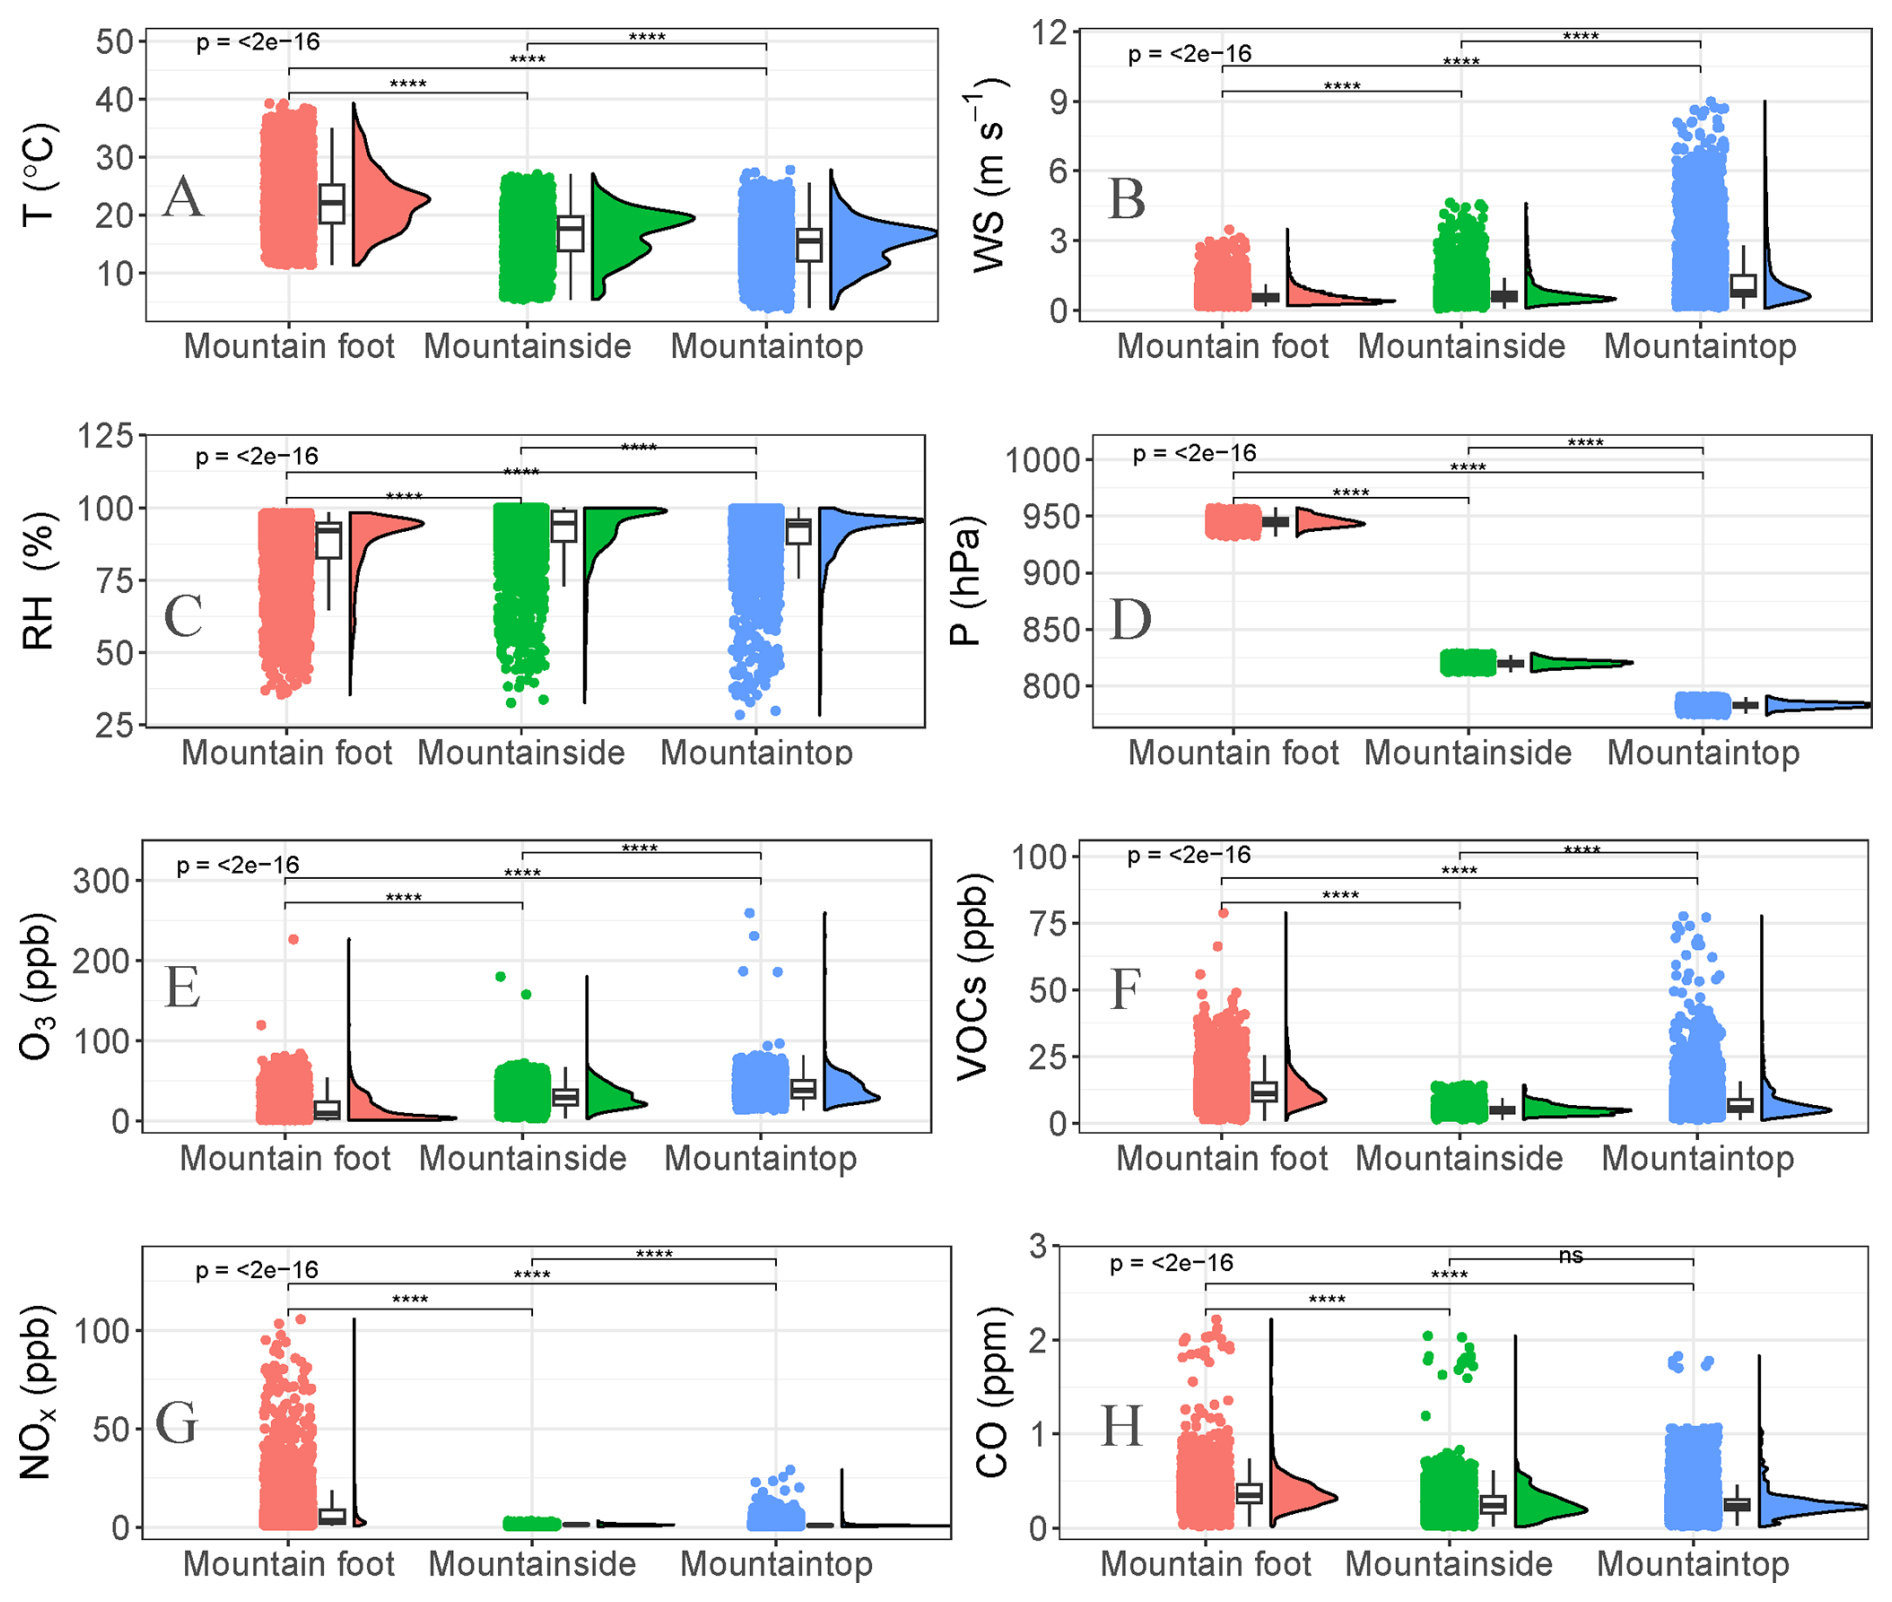
Figure 2Altitudinal distributions of O3, its precursors (VOCs, NOx, CO), and meteorological parameters (temperature, wind speed, relative humidity, pressure) at the mountain foot, mountainside, and mountaintop during the observation period. A detailed description of the plot elements is provided in Sect. S1 in the Supplement.
The campaign-averaged O3 concentrations at mountain foot, mountainside, and mountaintop were 14.8 ± 15.2, 30.4 ± 13.4, and 40.2 ± 14.7 ppb, respectively, demonstrating a pronounced positive altitudinal gradient (Fig. 2E). The measurements revealed significantly lower O3 concentrations at mountain foot and mountainside relative to corresponding elevations on Mt. Tai (Xue et al., 2022; Wu et al., 2024) and Mt. Hua (Wu et al., 2025), underscoring the differential influence of regional pollution background and local photochemical processes on mountain atmospheric composition. The O3 concentration measured at mountaintop was closely comparable to the national average background O3 concentration (40.3 ± 11.9 ppb) (Chen et al., 2025). This alignment indicates that the high-altitude atmospheric environment at this site functions as an effective regional receptor for well-mixed tropospheric air masses, minimally influenced by proximal emission sources. As shown in Fig. 3, the O3 concentrations at mountaintop was significantly lower than the highest recorded value (Mt. Tai, North China Plain: 86 ppb) (Sun et al., 2016) and below the median range of the dataset (approximately 51–52 ppb, near sites like Yellowstone NP and Mondy) (Okamoto and Tanimoto, 2016). It was also lower than other Chinese mountain sites such as SNJ in Central China (55.9 ppb) (Lyu et al., 2021) and Nanling in Southern China (53.5 ppb) (Gong et al., 2018). The concentration was similar to another eastern Chinese site, Mt. Huang (40.4 ppb) (Gao et al., 2017). Compared to the high-altitude background site on the Qinghai-Tibet Plateau (WLG, 49 ppb at 3816 m a.s.l.) (Xu et al., 2016), Mt. Fanjing's reading was notably lower. The 40.2 ppb level at Mt. Fanjing suggests a relatively clean atmospheric environment regarding O3 pollution, especially when compared to heavily polluted regions like the North China Plain. However, it was not among the very lowest globally (e.g., Tanah Rata, Malaysia: 23.4 ppb; Mt. Kenya: 30.8 ppb) (Okamoto and Tanimoto, 2016). The data did not show a simple, consistent correlation between altitude and O3 concentration (Fig. S4). While some of the highest sites like Nepal Pyramid (5079 m, 63.6 ppb) and Jungfraujoch (3580 m, 59.2 ppb) have high concentrations, others at similar high elevations show moderate levels (e.g., WLG at 3816 m has 49 ppb, Mt. Kenya at 3678 m has only 30.8 ppb). Mt. Fanjing's concentration of 40.2 ppb was notably lower than many global sites at comparable or even lower elevations. This reinforces the finding from the concentration-sorted list that Mt. Fanjing represents a relatively clean atmospheric environment with respect to ozone pollution. The primary driver of its ozone level appears to be its regional setting on the Yunnan-Guizhou Plateau-characterized by lower anthropogenic influence-rather than its absolute altitude alone. It occupies a middle ground, not as pristine as some remote tropical highlands (e.g., Mt. Kenya, Tanah Rata) but significantly cleaner than many mountain sites downwind of industrialized regions.
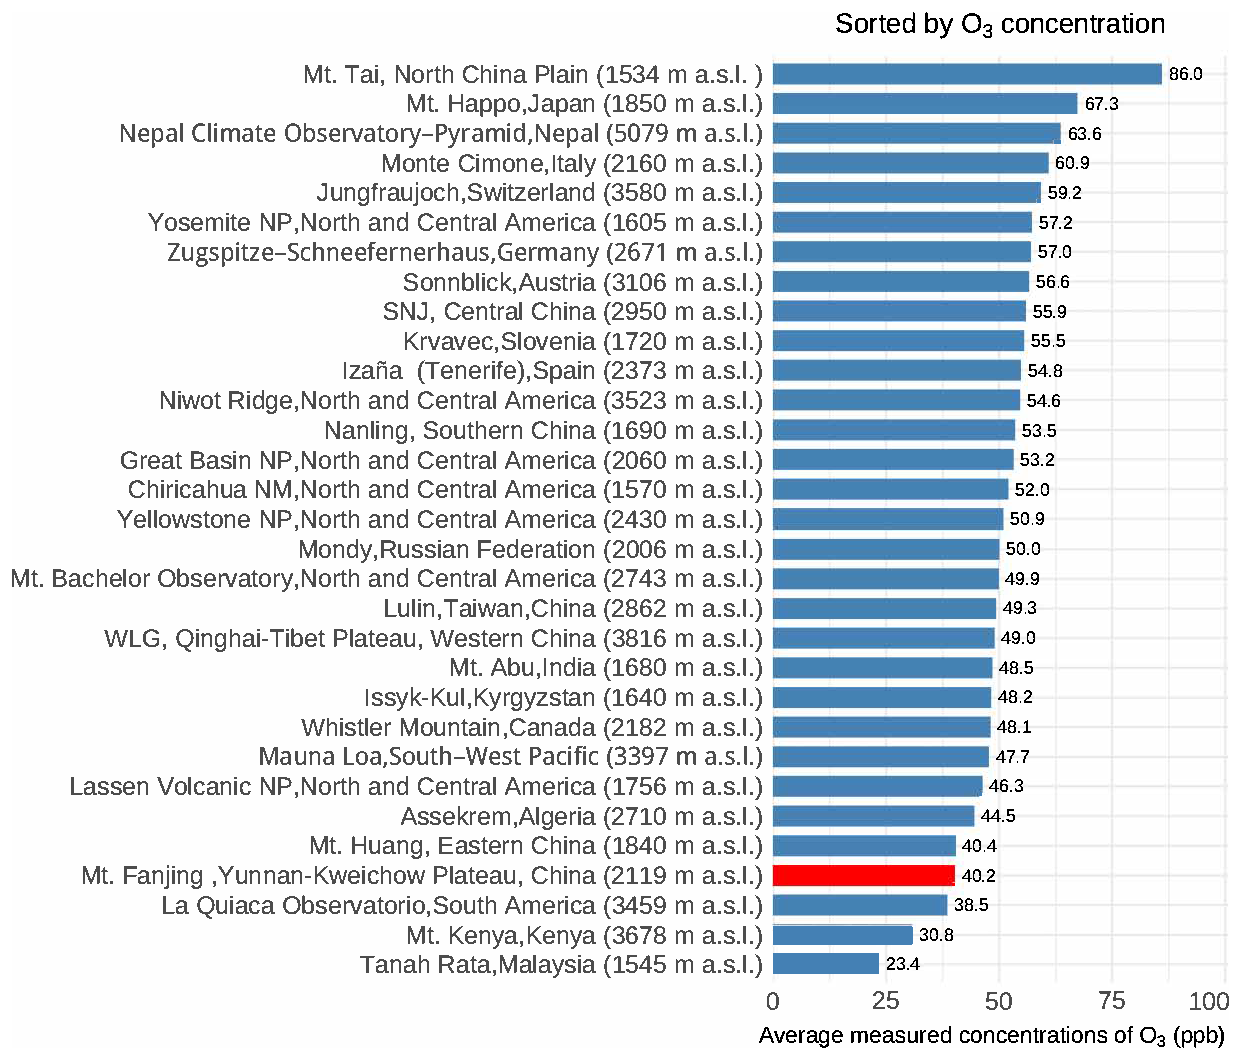
Figure 3Comparison of O3 concentrations at the summit of Mt. Fanjing (March–August 2024) with those recorded at mountain sites worldwide. The sites are arranged in descending order of O3 concentration, with each entry including the elevation in meters above sea level (m a.s.l.). All average values are reported in ppb. Data were compiled from published literature (Okamoto and Tanimoto, 2016; Li et al., 2007; Lyu et al., 2021; Xu et al., 2016; Gong et al., 2018; Sun et al., 2016). Most values correspond to summer or annual averages for the specific study periods cited. Despite inherent inter-annual variability, this comparison provides a useful context for positioning Mt. Fanjing within the global range of high-altitude background O3 levels.
In contrast to O3, concentrations of precursors demonstrated a pronounced negative altitudinal gradient, declining progressively from the mountain foot to the mountainside, and mountaintop. Measured concentrations were as follows: VOCs (12.8 ± 8.3, 5.1 ± 1.9, 9.4 ± 25.4 ppb) (Fig. 2F), NOx (8.0 ± 11.8, 1.2 ± 3.8, 1.3 ± 1.7 ppb) (Fig. 2G), and CO (0.4 ± 0.2, 0.3 ± 0.5, 0.3 ± 0.2 ppm) (Fig. 2H) at mountain foot, mountainside, and mountaintop, respectively. The CO concentrations at mountaintop were significantly higher than those recorded at Mt. Happo, Izaña, Zugspitze-Gipfel (Okamoto and Tanimoto, 2016), but marginally lower than levels observed at Mt. Tai (Wu et al., 2024; Kanaya et al., 2013). This pattern underscores the interplay between localized human activities, geographic context, and chemical processes in mountain environments. The atmospheric reactivity of VOCs reflects each species's ability to participate in chemical reactions. The total calculated OH reactivity were 4.4, 1.5, and 2.0 s−1 at mountain foot, mountainside, and mountaintop, respectively (Fig. S5A). The OH reactivity in this study was significantly lower than values observed at comparable altitudes of Mt. Tai (Wu et al., 2024) and in major Chinese cities including Beijing, Shanghai, Guangzhou, Chongqing, and Xianghe (Yang et al., 2020; Tan et al., 2019). While alkanes constituted the major fraction of VOCs concentrations-accounting for 43 %, 57 %, and 51 % at mountain foot, mountainside, and mountaintop, respectively (Fig. S6A–C) – they drove only 8 %, 13 %, and 16 % of the total OH reactivity at these elevations (Figs. S5B and S6D–F). In contrast, isoprene contributed minimally to VOCs concentrations (3 %, 3 %, and 1 % at mountain foot, mountainside, and mountaintop), yet dominated OH reactivity, accounting for 26 %, 46 %, and 31 % respectively (Figs. S5D and S6D–F), revealing a striking decoupling between concentration abundance and chemical reactivity. Alkenes and aromatics contributed 41 % and 25 %, respectively, to the OH reactivity at the mountain foot; 13 % and 28 % at mountainside; and 28 % and 25 % at mountaintop (Figs. S5B, E and S6D–F). Altitudinal variations in reactive VOCs species may drive corresponding differences in photochemical O3 production.
To assess potential seasonal influences during the observation period, we conducted a preliminary analysis by dividing the data into spring (March–May) and summer (June–August). The results revealed clear seasonal differences in O3 and precursor concentrations. As shown in Fig. S7, for example, the mean O3 concentration at the mountaintop site was 50.4 ± 14.0 ppb in spring compared to 33.1 ± 10.4 ppb in summer. Similarly, VOCs concentrations were notably higher in spring (e.g., 16.9 ± 7.1 ppb at the mountain foot in spring vs. 9.6 ± 3.6 ppb in summer). Differences in NOx and CO were less pronounced and not consistently directional across sites. Crucially, however, these seasonal differences are substantially smaller than the pronounced altitudinal gradients reported in this study-for instance, O3 increased from approximately 14.8 ppb at the foot to about 40.2 ppb at the summit. Moreover, the observed seasonal variations do not alter the core altitudinal gradients or the mechanistic insights that are the focus of this work. Given that the primary objective of the study is to elucidate altitude-dependent mechanisms rather than to detail seasonal cycles, and because the altitudinal signals remain strong and consistent across seasons, we present campaign-mean results to highlight the systematic elevation-dependent behavior.
Meteorological parameters at both mountainside and mountaintop exhibited similarly attenuated diurnal variations, characterized by minimal daytime increases in temperature and slight decreases in wind speed and relative humidity (Fig. 4A–C). The diurnal temperature ranges (difference between daytime and nighttime) were 6.8 % and 10.8 % for the mountainside and mountaintop, respectively (Fig. 4A). Corresponding diurnal changes in wind speed were −2.0 % and −0.4 % (Fig. 4B), and for relative humidity, −1.3 % and −3.2 % (Fig. 4C). Contrastively, significant diurnal variations were observed in temperature, wind speed and relative humidity at mountain foot, with amplitudes of 16 %, 47 % and −11 %, respectively (Fig. 4A–C).
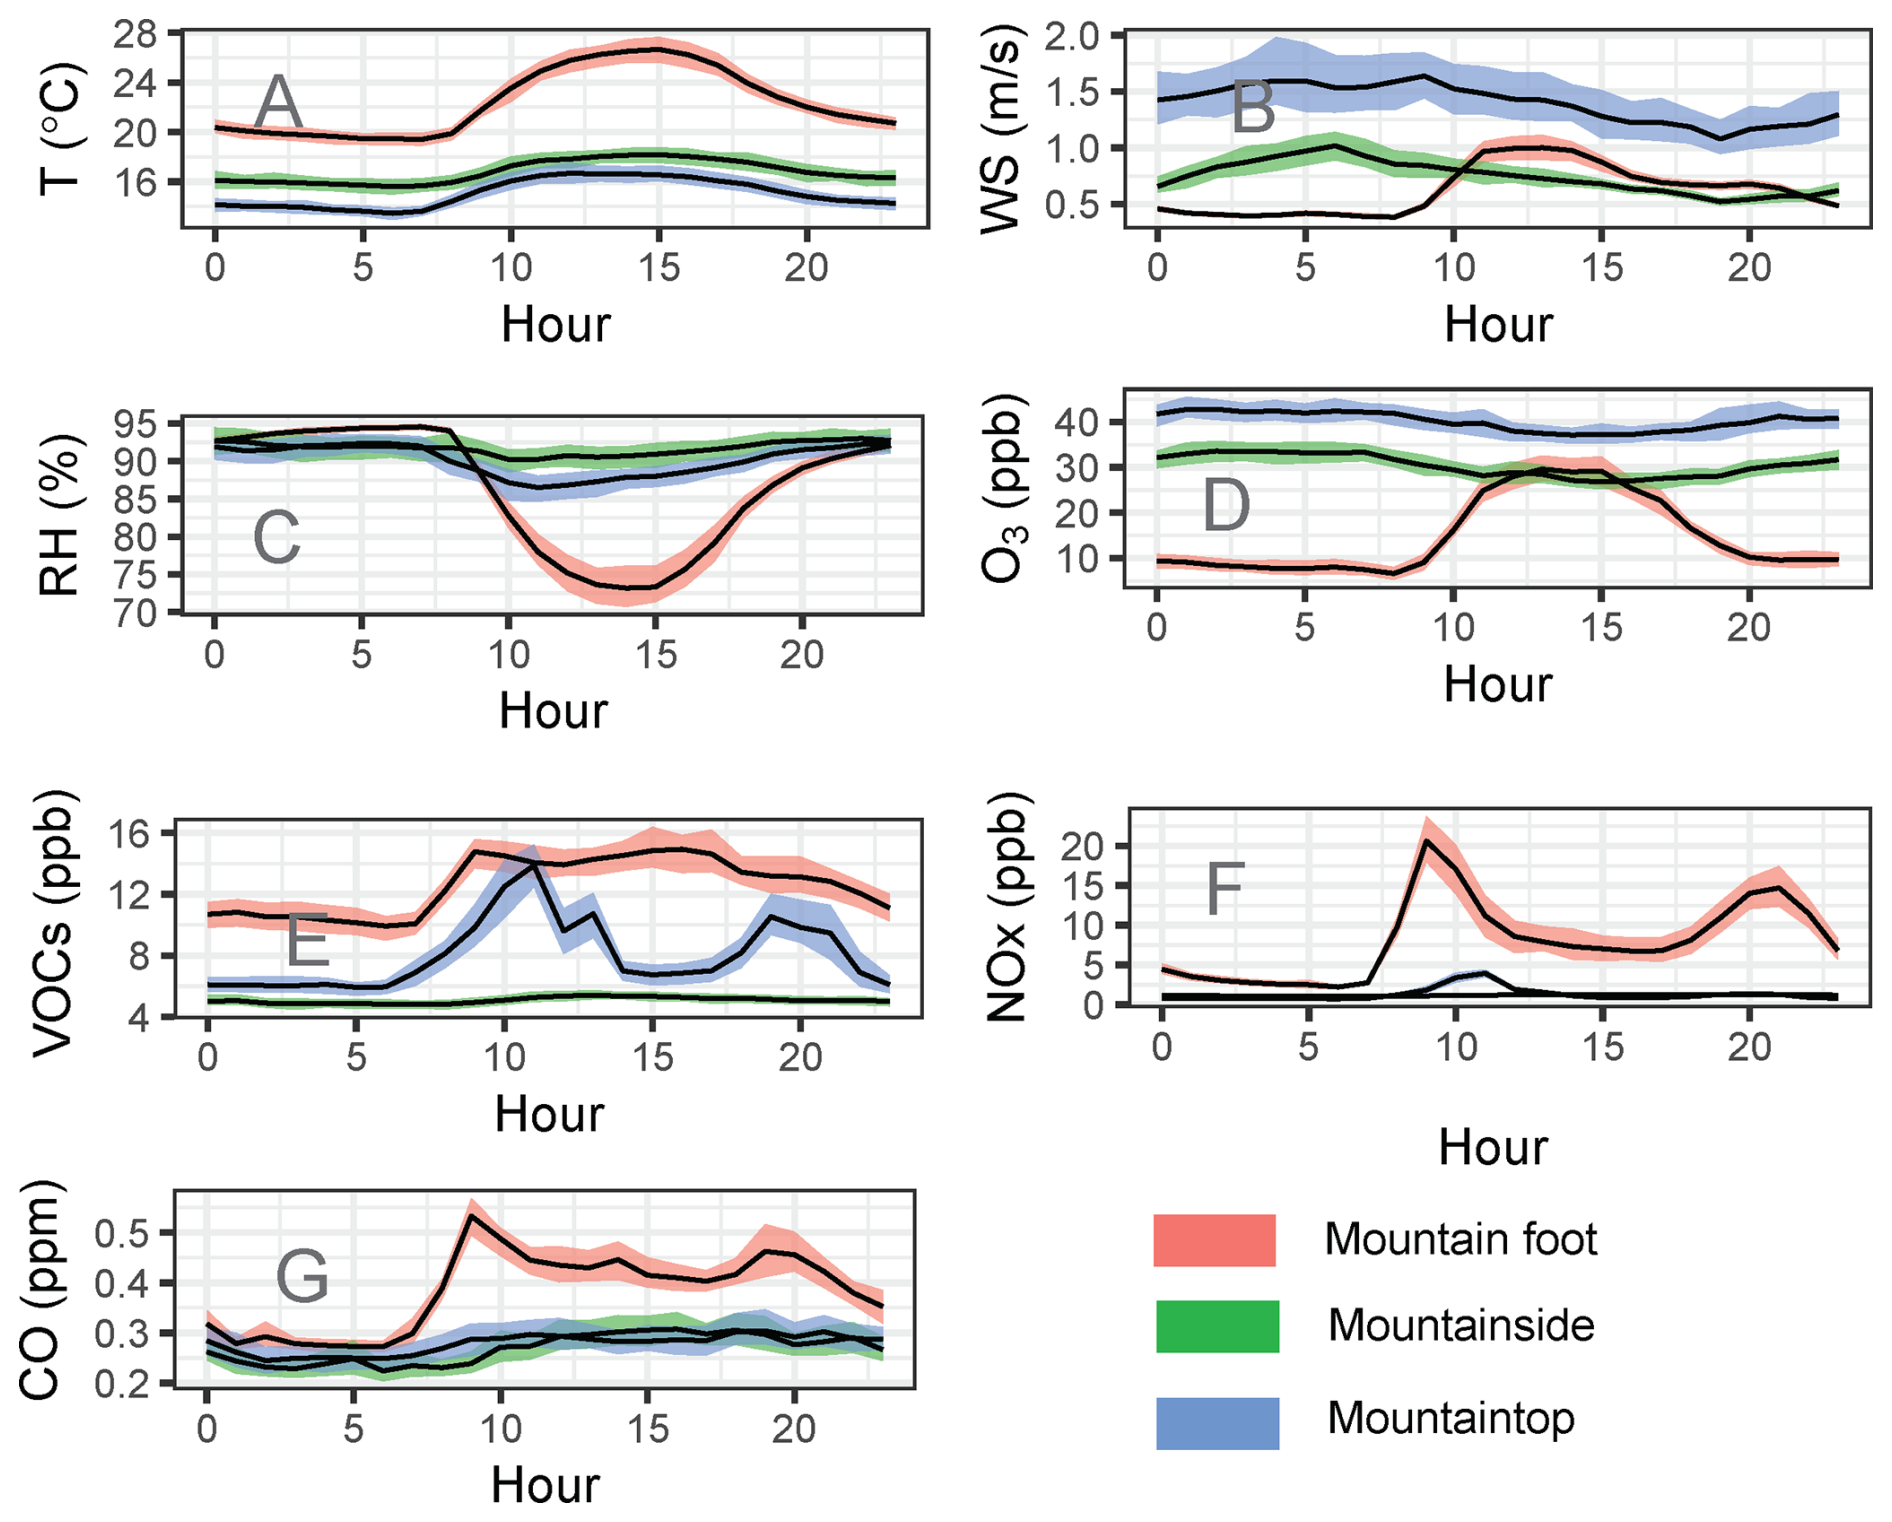
Figure 4Diurnal variations in O3 and its precursors, and meteorological parameters across the respective elevation sites throughout the observational period. Hourly means are represented by solid lines, with shaded areas denoting 95 % confidence intervals.
O3 concentrations revealed pronounced diurnal heterogeneity across altitudinal gradients, characterized by elevated daytime levels at mountain foot contrasting with nocturnal maxima at mountainside and mountaintop (Fig. 4D). At mountain foot, O3 concentrations exhibited a unimodal diurnal cycle with concentrations rising steadily from 08:00 local time, peaking at 13:00, maintaining stability until 15:00, then declining to morning baseline levels. In contrast, mountainside and mountaintop O3 concentrations remained relatively stable with synchronous diurnal cycles: gradual depletion commencing at 08:00, reaching minima near 15:00, followed by progressive recovery to morning concentrations. Notably, during the 12:00–16:00 interval, mountainside minima approached peak concentrations observed at mountain foot, while mountaintop levels significantly exceeded those at both lower elevations. These observed heterogeneities in spatiotemporal O3 patterns are intrinsically linked to corresponding variations in its precursor species. O3 precursors exhibited a pronounced bimodal diurnal pattern at the mountain foot (Fig. 4E–G), with a primary peak during 08:00–09:00 and a secondary peak at 19:00–20:00, closely synchronized with tourist influx. A temporal offset was observed at higher altitudes, as the morning peak in VOCs concentrations at the mountaintop lagged the mountain foot peak by approximately 1–2 h, suggesting delayed pollutant accumulation via boundary layer transport. The mountainside, experiencing minimal anthropogenic disturbance, displayed significantly attenuated diurnal variations in precursor concentrations.
The observed nonuniform diurnal variations in O3 and its precursors across elevational gradients reflect emergent phenomena driven by elevation-dependent shifts in precursor sources, spatially heterogeneous photochemical modulation, and complex mountain boundary-layer dynamics. This can be mechanistically interpreted through the interplay between altitude-dependent OH reactivity and precursor diurnal dynamics. At the mountain foot, elevated OH reactivity (4.4 s−1), driven by higher concentrations of NOx and VOCs, enhances daytime O3 destruction via NO titration and peroxy radical termination, resulting in a unimodal O3 peak in the early afternoon followed by rapid depletion. In contrast, the lower OH reactivity at mountainside (1.5 s−1) and mountaintop (2.0 s−1) reflects a shift towards increasing VOC-sensitive chemistry, where isoprene and other reactive VOCs dominate OH reactivity despite their low mixing ratios. This facilitates net O3 production during daytime at higher elevations, coupled with nocturnal accumulation due to suppressed titration and stable boundary layers. The diurnal patterns of VOCs and NOx further modulate O3 cycles. At the mountain foot, bimodal peaks in VOCs and NOx-synchronized with tourist activity-intensify O3 titration and peroxy radical conversion to nitrates, thereby suppressing daytime O3. At mountainside and mountaintop, weaker diurnal variations in precursors allow photochemical production to dominate, with O3 levels sustained by transport from lower elevations and in-situ chemistry under low-NOx conditions. These findings underscore how altitude-specific OH reactivity and precursor dynamics jointly govern the diurnal evolution of O3 in mountainous background regions.
3.2 Feature Importance Affecting O3
The feature importance ranking for O3 as the dependent variable is presented in Fig. 5A–C. The top five features were: relative humidity, NOx, wind speed, temperature, and pressure at mountain foot (Fig. 5A); temperature, relative humidity, VOCs, CO, and NOx at mountainside (Fig. 5B); and temperature, relative humidity, wind speed, VOCs, and wind direction at mountaintop (Fig. 5C). Overall, meteorological factors exerted a consistently greater overall influence than chemical factors, underscoring the significance of meteorological factors in O3 variability across the elevation gradient. Figure 5D–F displays SHAP summary plots for key features within the random forest model, corresponding to the mountain foot, mountainside, and mountaintop, respectively. These plots characterize the relative influence magnitude, feature prevalence, and effect direction of each variable on predicted O3 concentrations. SHAP values farther from zero denote stronger feature importance; positive values indicate a positive association with O3 levels, whereas negative values reflect an inverse relationship. For instance, elevated relative humidity corresponds to diminished SHAP values, indicating an inverse correlation between relative humidity and O3 concentration. This likely arises from the complex interplay of physical and chemical processes, such as cloud–radiation interactions, air mass transport, and aqueous-phase chemistry (Liu et al., 2025; Luo et al., 2025).
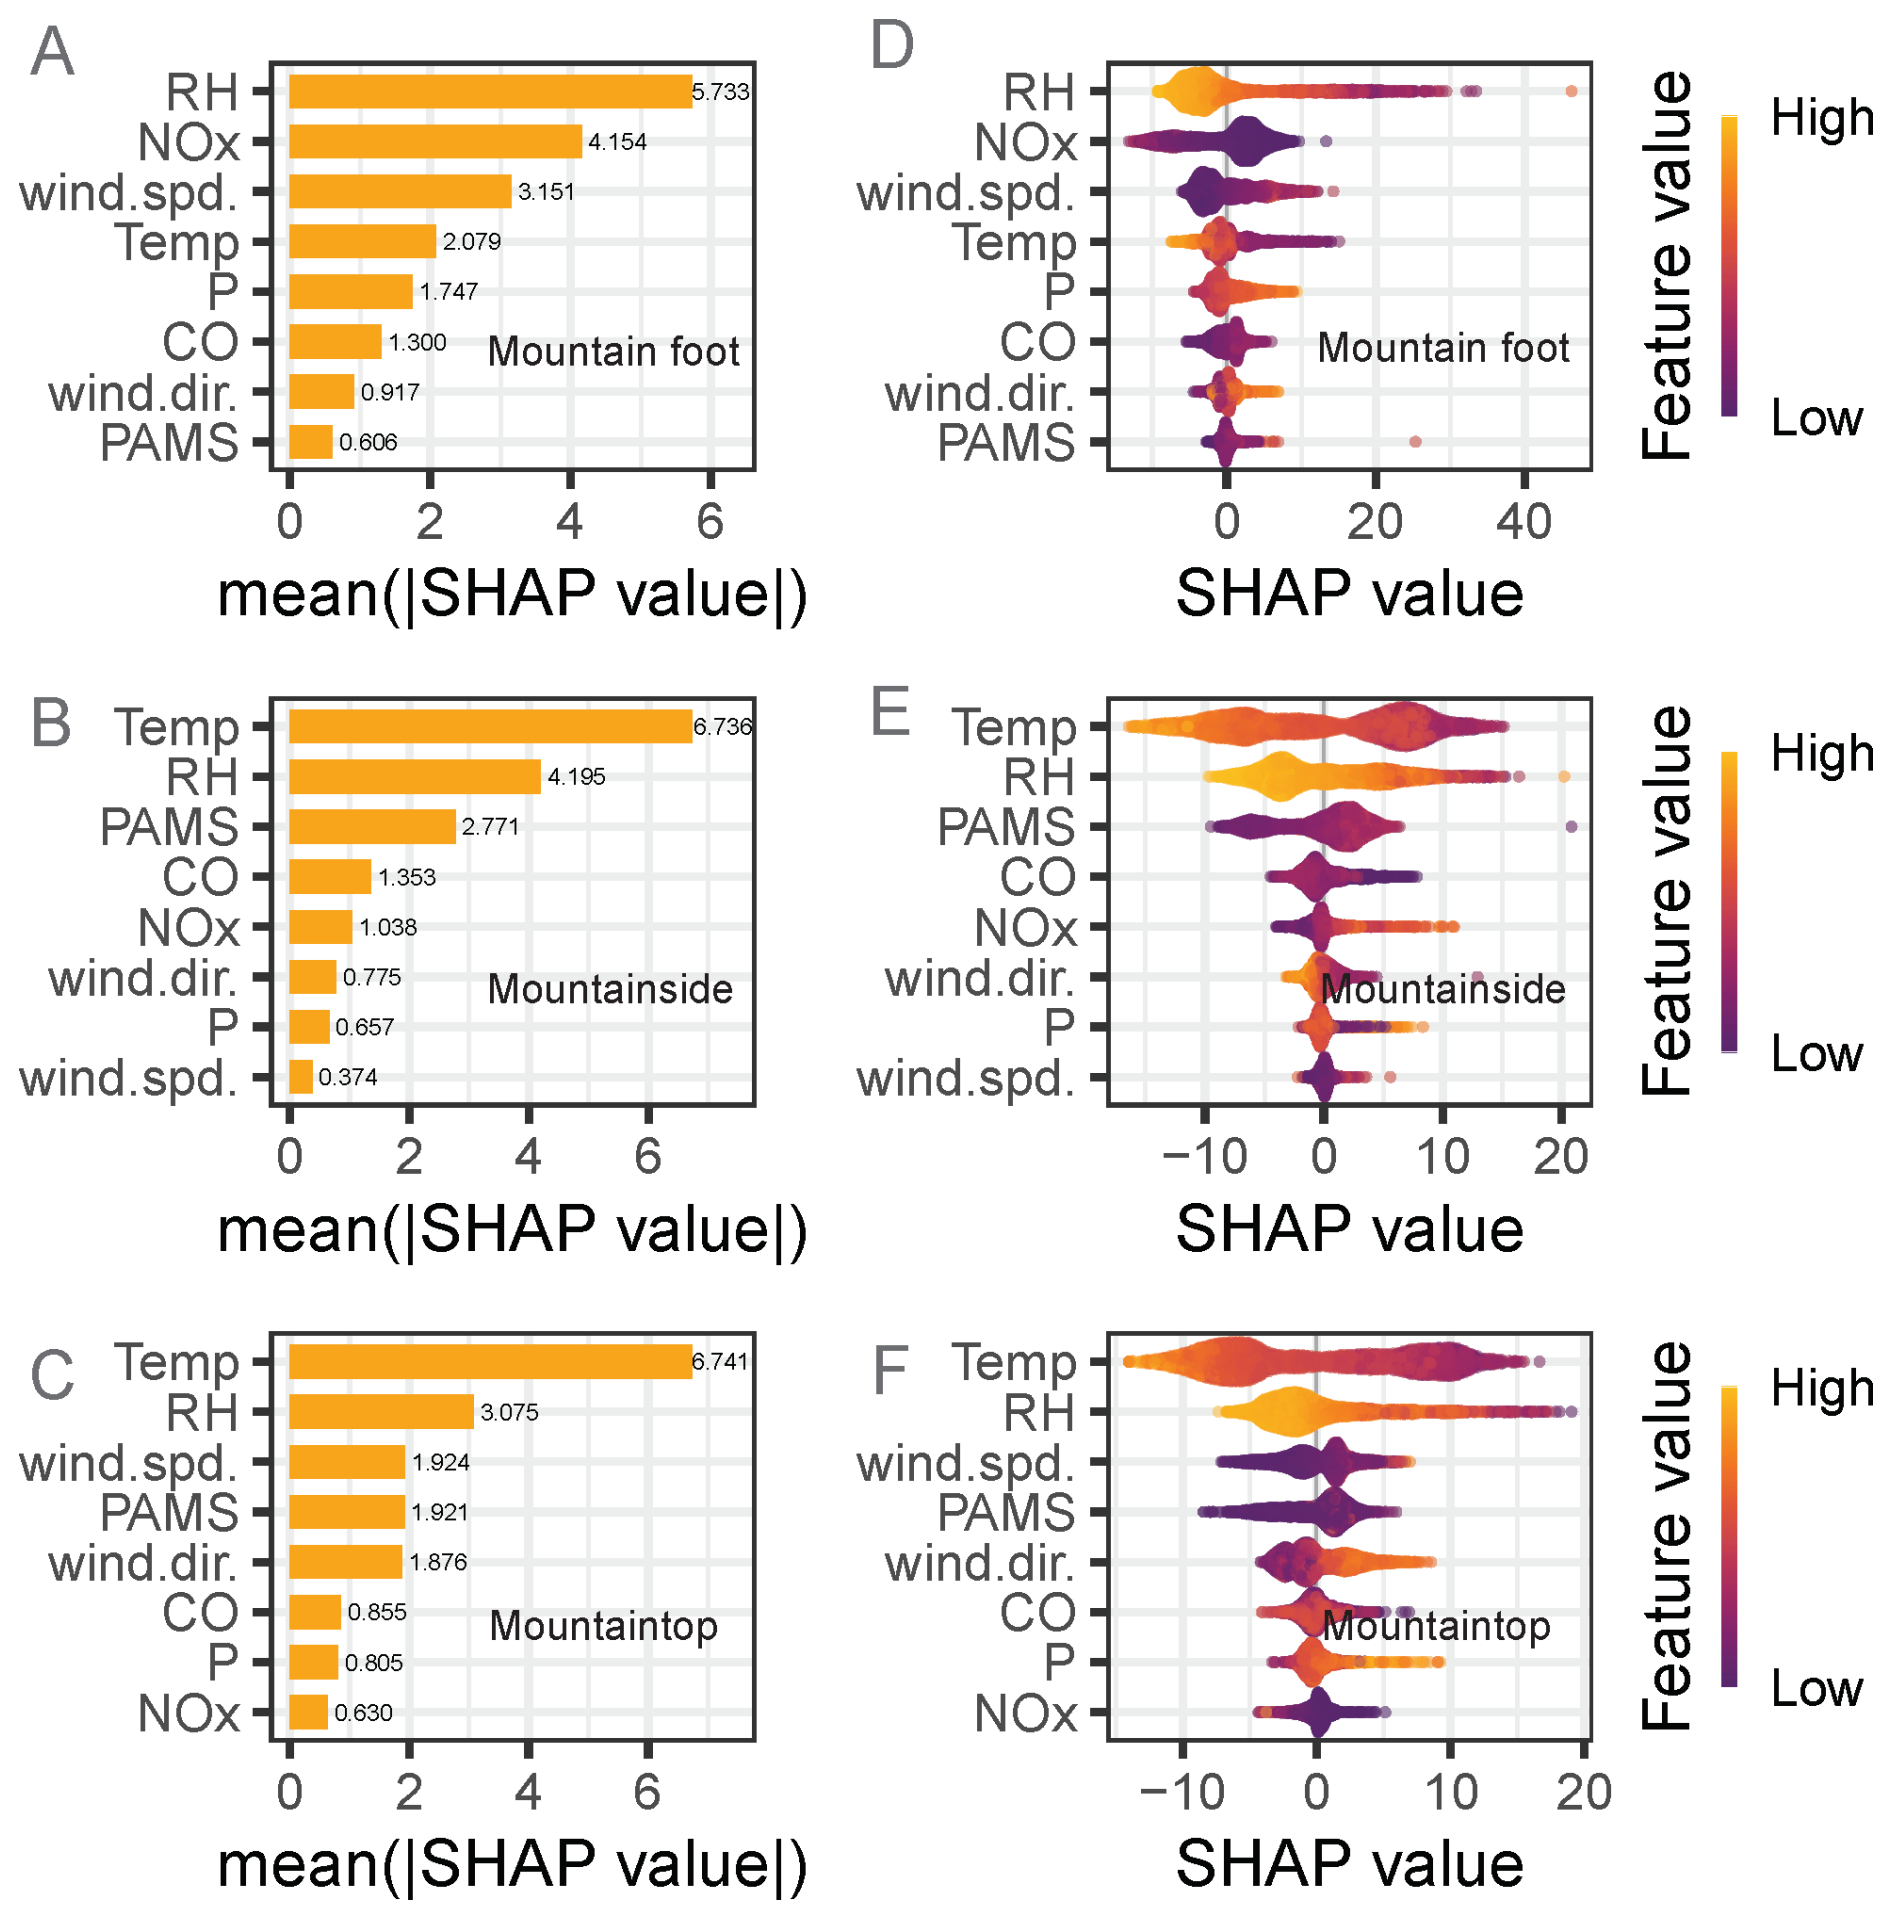
Figure 5(A–C) The mean absolute SHAP (|SHAP|) values of the variables, computed using the SHapley Additive exPlanation (SHAP) method, quantify the relative importance of each feature in influencing O3 concentrations within the random forest regression model at the respective elevation sites. The relative importance of each feature is quantified by computing the mean absolute SHAP value for each feature across the entire dataset. A higher mean absolute SHAP value indicates greater relative contribution of the corresponding feature to the model's predictions. (D–E) Feature importance analysis of the random forest regression model, with O3 concentration as the dependent variable, was performed using the SHAP method across different elevation sites. In the summary plot, the absolute magnitude of a feature's SHAP value deviation from zero provides a robust metric for assessing its relative contribution to the model's predictive output. Positive SHAP values indicate features that positively influence the target variable, whereas negative values reflect inhibitory or adverse effects.
Dependence analysis further quantifies the effects of varying input features on O3 levels (Figs. S8–S10). Relative humidity was determined to be the key feature at mountain foot. Specifically, O3 concentrations exhibited a nonlinear inverse relationship with relative humidity, with notably enhanced O3 levels under low-relative humidity conditions. Substantially elevated SHAP values further confirmed this relationship when relative humidity fell below approximately 80 % at mountain foot (Fig. S8A), and below 90 % at both mountainside (Fig. S9B) and mountaintop (Fig. S10B). The relative humidity threshold for O3 perturbation identified in this study was substantially higher than values reported for Hangzhou (∼ 70 %) (Zhang et al., 2024b) and Nanjing (∼ 75 %) (Zhang et al., 2024a). As relative humidity increased from 60 % to 80 %, the corresponding SHAP value diminished from approximately 15 ppb to near zero, indicating a reduction in the influence of relative humidity on O3 concentration of ∼ 15 ppb at mountain foot, which was approximately twofold higher than that reported in Haikou (∼ 7.5 ppb) (Liu et al., 2025). At higher elevations (mountainside and mountaintop), the same relative humidity increase resulted in a smaller SHAP value decrease, from ∼ 10 to ∼ 5 ppb, corresponding to an influence reduction of ∼ 5 ppb, which remained lower than those recorded. This negative correlation was attributable primarily to the suppression of O3 formation under elevated RH, which reduced air temperature, shortened peroxy radical chain lengths, diminished NO2 cycling via aerosol liquid water enhancement, and catalytically destroyed existing O3 through vapor-phase hydrolysis (Qiu et al., 2025; Yu, 2019; Zhang et al., 2024a, b). Temperature emerged as the predominant feature at both mountainside and mountaintop, with a notable nonlinear negative correlation (Figs. S9A and S10A). Temperature exhibited threshold-and elevation-dependent effects on O3 concentration variations, with critical thresholds of 20 °C (Fig. S8D), 18 °C (Fig. S9A), and 15 °C (Fig. S10A) at mountain foot, mountainside, and mountaintop, respectively. This contrasted with positive temperature-O3 correlations in urban plains, underscoring the critical role of mountain-specific processes (e.g., valley winds and cloud shading) in modulating O3 dynamics. Wind speed and direction, collectively explained 21.3 % of the O3 concentration variability at mountaintop, exceeding their explanatory power at mountain foot and mountainside. Particularly, prevailing westerly winds (270° ± 30°) consistently elevated O3 levels (positive SHAP values), whereas easterly flows (90° ± 30°) suppressed concentrations. This distinct pattern stems from divergent air mass origins: westerlies transported dry, warm air masses enriched with anthropogenic precursors from the industrialized regions of Guizhou, while easterlies originated from the cleaner Wuling Mountains, thereby inhibiting photochemical O3 production.
Regarding precursor species, O3 variability was governed predominantly by NOx at mountain foot, whereas at mountainside and mountaintop, O3 levels were regulated primarily by VOCs species. Situated within the direct influence zone of near-ground pollution sources, the mountain foot site exhibits elevated NOx emissions and consequently high atmospheric NOx concentrations. These increased NOx levels directly deplete O3 through titration. Concurrently, high NOx concentrations promote the conversion of peroxy radicals to nitrate, thereby suppressing O3 production. Consequently, variations in NOx concentration-particularly the titration effect of NO-play a major role in driving the observed O3 concentration variability. However, with increasing elevation, anthropogenic NOx emissions intensity diminishes markedly. Concurrently, specific VOCs-reactive precursors and their oxidation products-influenced by enhanced biogenic emissions and transport-can exhibit greater efficiency for O3 production under low-NOx conditions. In brief, this systematic shift in precursor contribution with increasing elevation fundamentally reflects the dynamics shaped by photochemical regimes, source-sink distribution patterns, boundary layer physics, and key meteorological drivers within complex mountainous terrain.
3.3 Unveiling the O3 formation mechanism
Reaction rates substantially influencing O3 production or destruction are summarized in Table 1 on a daily average basis. O3 production rates peaked at mountain foot (12.83 ppb h−1), significantly exceeding values observed at mountainside (2.29 ppb h−1) and mountaintop (2.92 ppb h−1). This vertical gradient arises primarily from variations in NO concentrations, with significantly higher NO emission intensities at mountain foot-driven by anthropogenic activities-compared to mountainside and mountaintop. Elevated NO concentrations accelerate HO2 and RO2 reactions with NO, thereby promoting radical cycling rates and consequently amplifying O3 production (Wu et al., 2024; Ma et al., 2002). The HO2 + NO reaction dominated O3 production pathways across all sites, with mean rates of 6.09 ppb h−1 (47.5 %), 1.23 ppb h−1 (53.8 %), and 1.48 ppb h−1 (50.8 %) at mountain foot, mountainside and mountaintop, respectively. The RO2 + NO and CH3O2 + NO reactions constituted the secondary pathways. Corresponding mean rates were 3.80 and 2.94 ppb h−1 (29.6 % and 22.9 %) at mountain foot, 0.71 and 0.35 ppb h−1 (31.1 % and 15.1 %) at mountainside, and 0.98 and 0.46 ppb h−1 (33.4 % and 15.8 %) at mountaintop. The O3 removal rate reached 14.77 ppb h−1 at mountain foot, significantly higher than rates observed at mountainside (1.94 ppb h−1) and mountaintop (2.64 ppb h−1) (Table 1). The dominant removal pathway at mountain foot was the reaction of O3 with NO2 (7.14 ppb h−1), accounting for 48.3 % of the total removal. This was followed by reactions with 2-Butene (2.79 ppb h−1, 18.9 %) and photolysis (O3 + hν, 1.36 ppb h−1, 9.2 %). In marked contrast, O3 + hν was the primary removal mechanism at both mountainside and mountaintop, with mean daily rates of 0.43 ppb h−1 (22.3 %) and 0.54 ppb h−1 (20.4 %), respectively. Secondary pathways included O3 + NO2 (0.36 ppb h−1, 18.4 % at mountainside; 0.43 ppb h−1, 16.3 % at mountaintop) and O3 + 1,2-Dimethylethylene (0.32 ppb h−1, 16.4 % at mountainside; 0.38 ppb h−1, 14.5 % at mountaintop). This vertical variation is primarily attributed to altitudinal gradients in meteorological parameters (temperature, and solar irradiation) and precursor concentrations. Figure 8 depicts the campaign-mean diurnal cycle of O3 production, destruction, and net rates at mountain foot, mountainside, and mountaintop. One can see that both O3 production and destruction occur concurrently during the daytime, peaking around solar noon. At mountain foot, O3 destruction exceeded production, resulting in net O3 destruction with a rate of 1.93 ppb h−1 (Fig. 6A and Table 1), contrasting with net O3 production at mountainside (0.35 ppb h−1) (Fig. 6B and Table 1) and mountaintop (0.29 ppb h−1) (Fig. 6C and Table 1). These values were significantly lower than those recorded at Mount Tai (7.4 ppb h−1 at mountain foot, 5.6 ppb h−1 at mountainside and 6.4 ppb h−1 at mountaintop) (Kanaya et al., 2009; Wu et al., 2024), comparable to measurements at Jungfraujoch for midday in winter, spring, and summer (from −0.05 to +0.4 ppb h−1) (Parker et al., 2009; Zanis et al., 2003), but substantially higher than the data obtained from Mt. Cimone in June (2–3 ppb d−1) (Fischer et al., 2003) and Mauna Loa for four seasons (from −0.8 to −0.4 ppb d−1) (Cantrell et al., 1996). The peak net O3 production at mountain foot occurred around 08:00 (4.4 ppb h−1), approximately 2–3 h earlier than that observed at mountainside (3.4 ppb h−1) and mountaintop (7.3 ppb h−1), respectively. This temporal offset may be linked to differences in the timing of precursor accumulation driven by boundary-layer development and tourist activity.
Table 1Daily-averaged chemical reaction rates governing O3 budget.
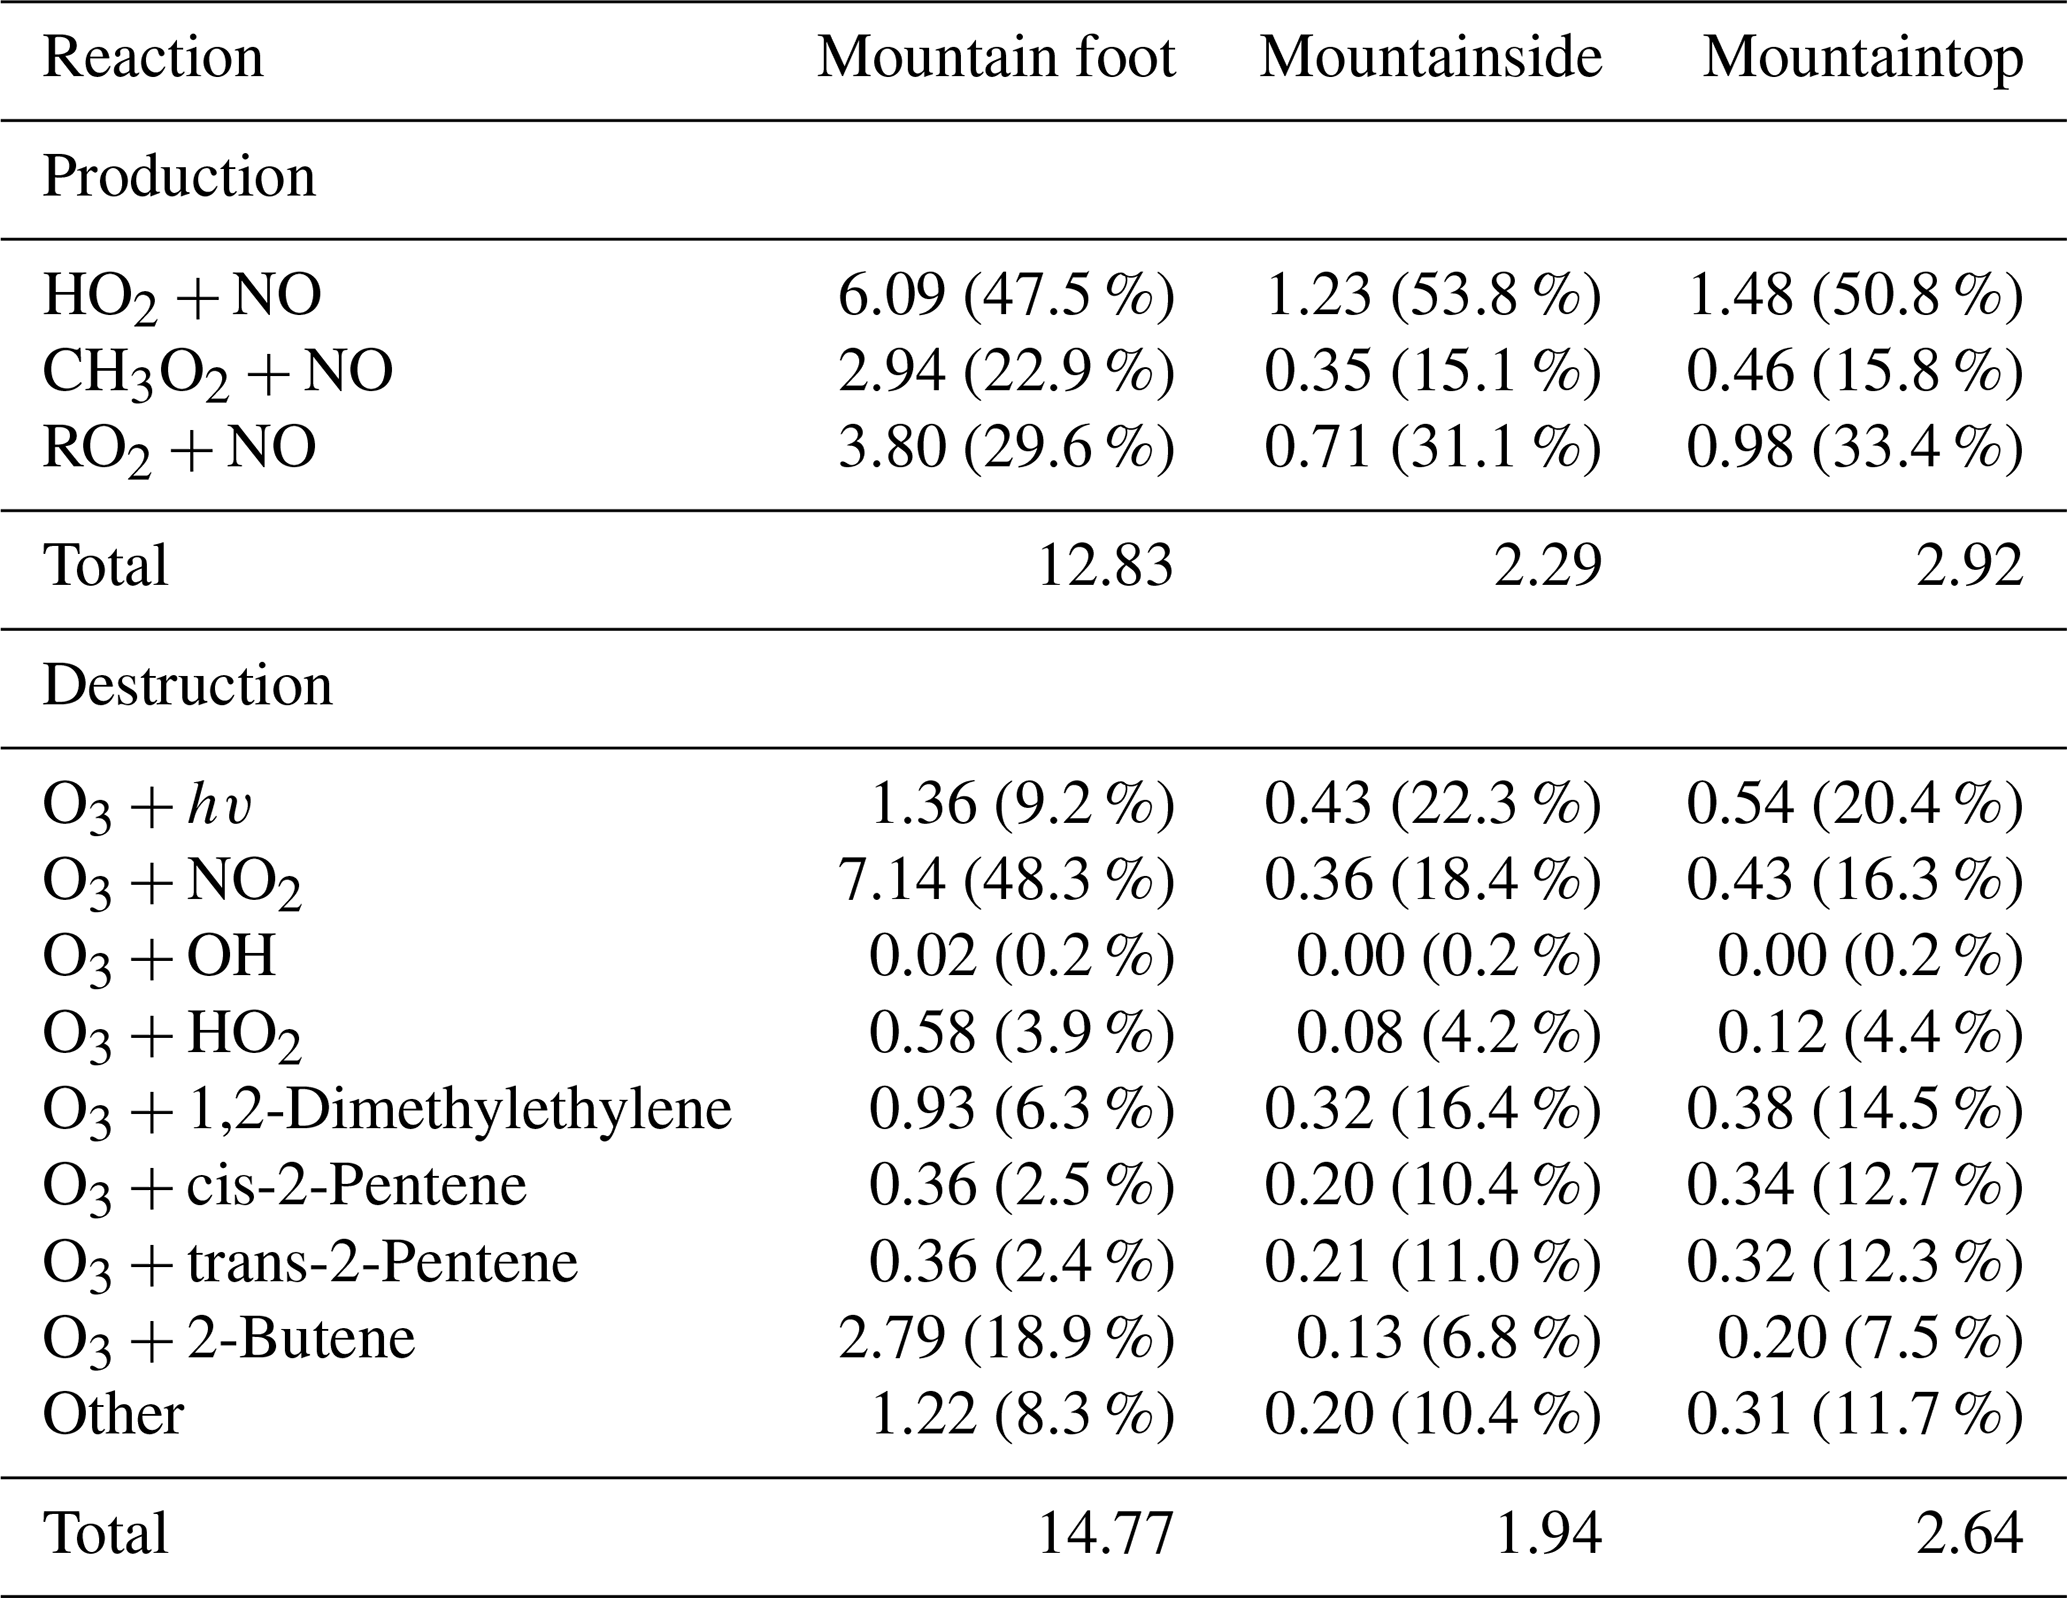
Note: The values represent production rates in ppb h−1, with relative percentage contributions provided in parentheses.
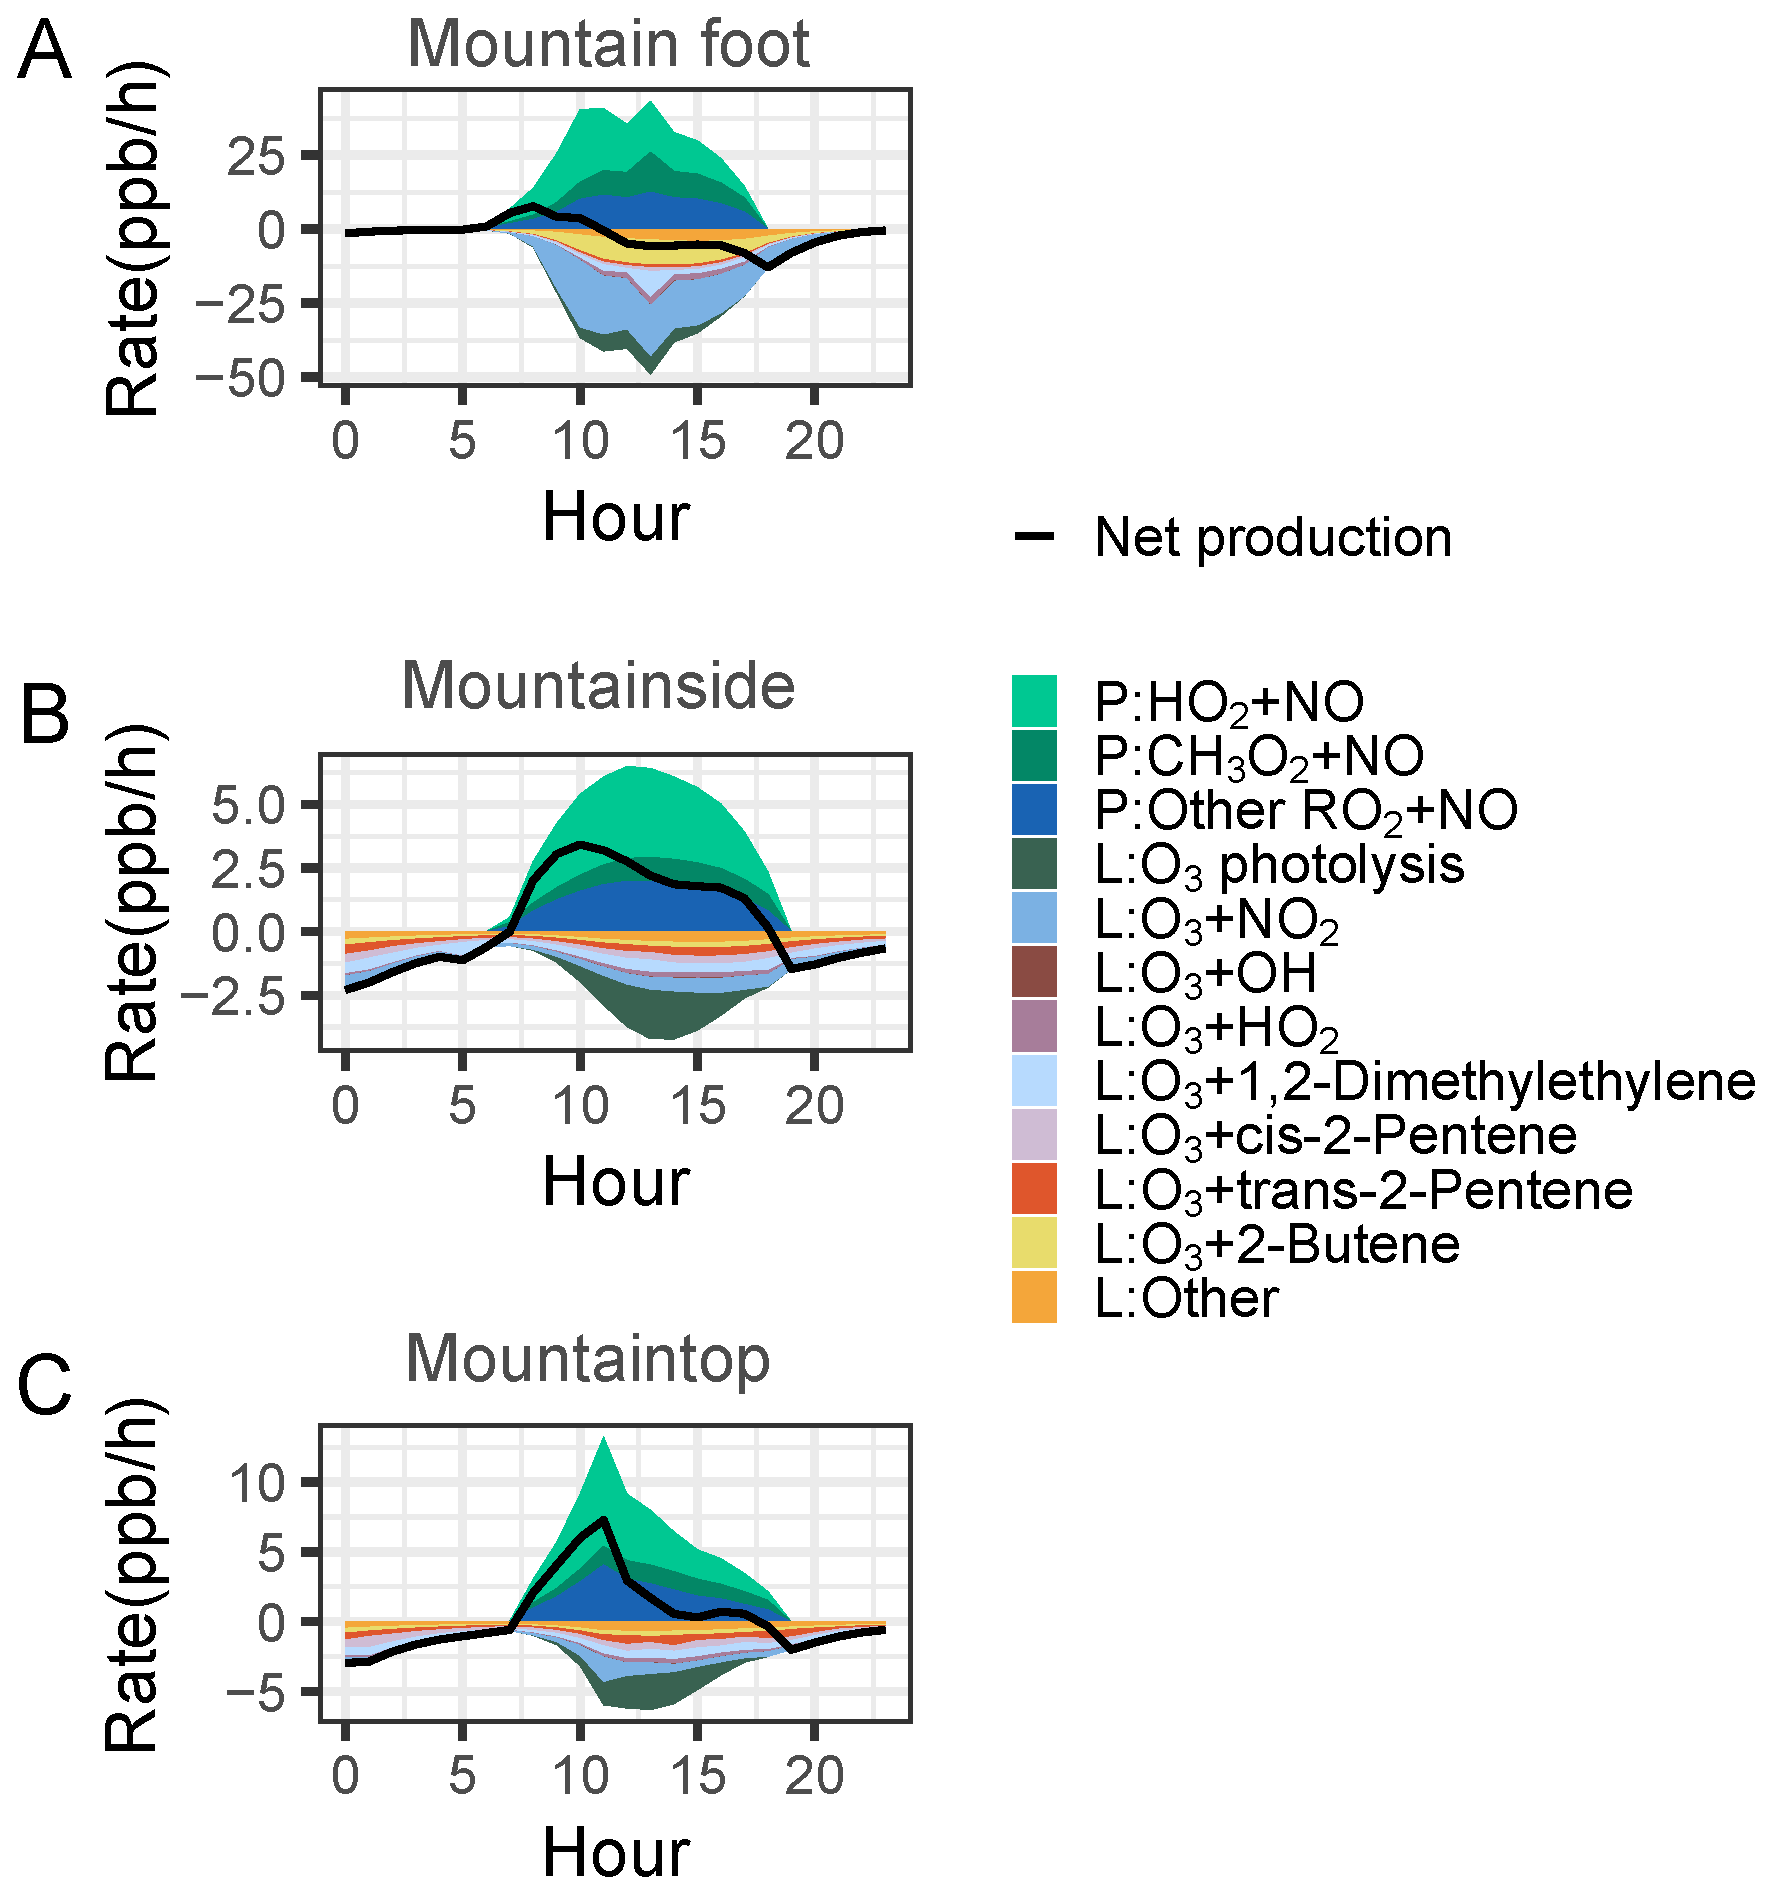
Figure 6Mean diurnal profiles delineating the simulated contributions of individual pathways to O3 production and destruction rates are presented, accompanied by corresponding net O3 production rates across altitudinal gradients.
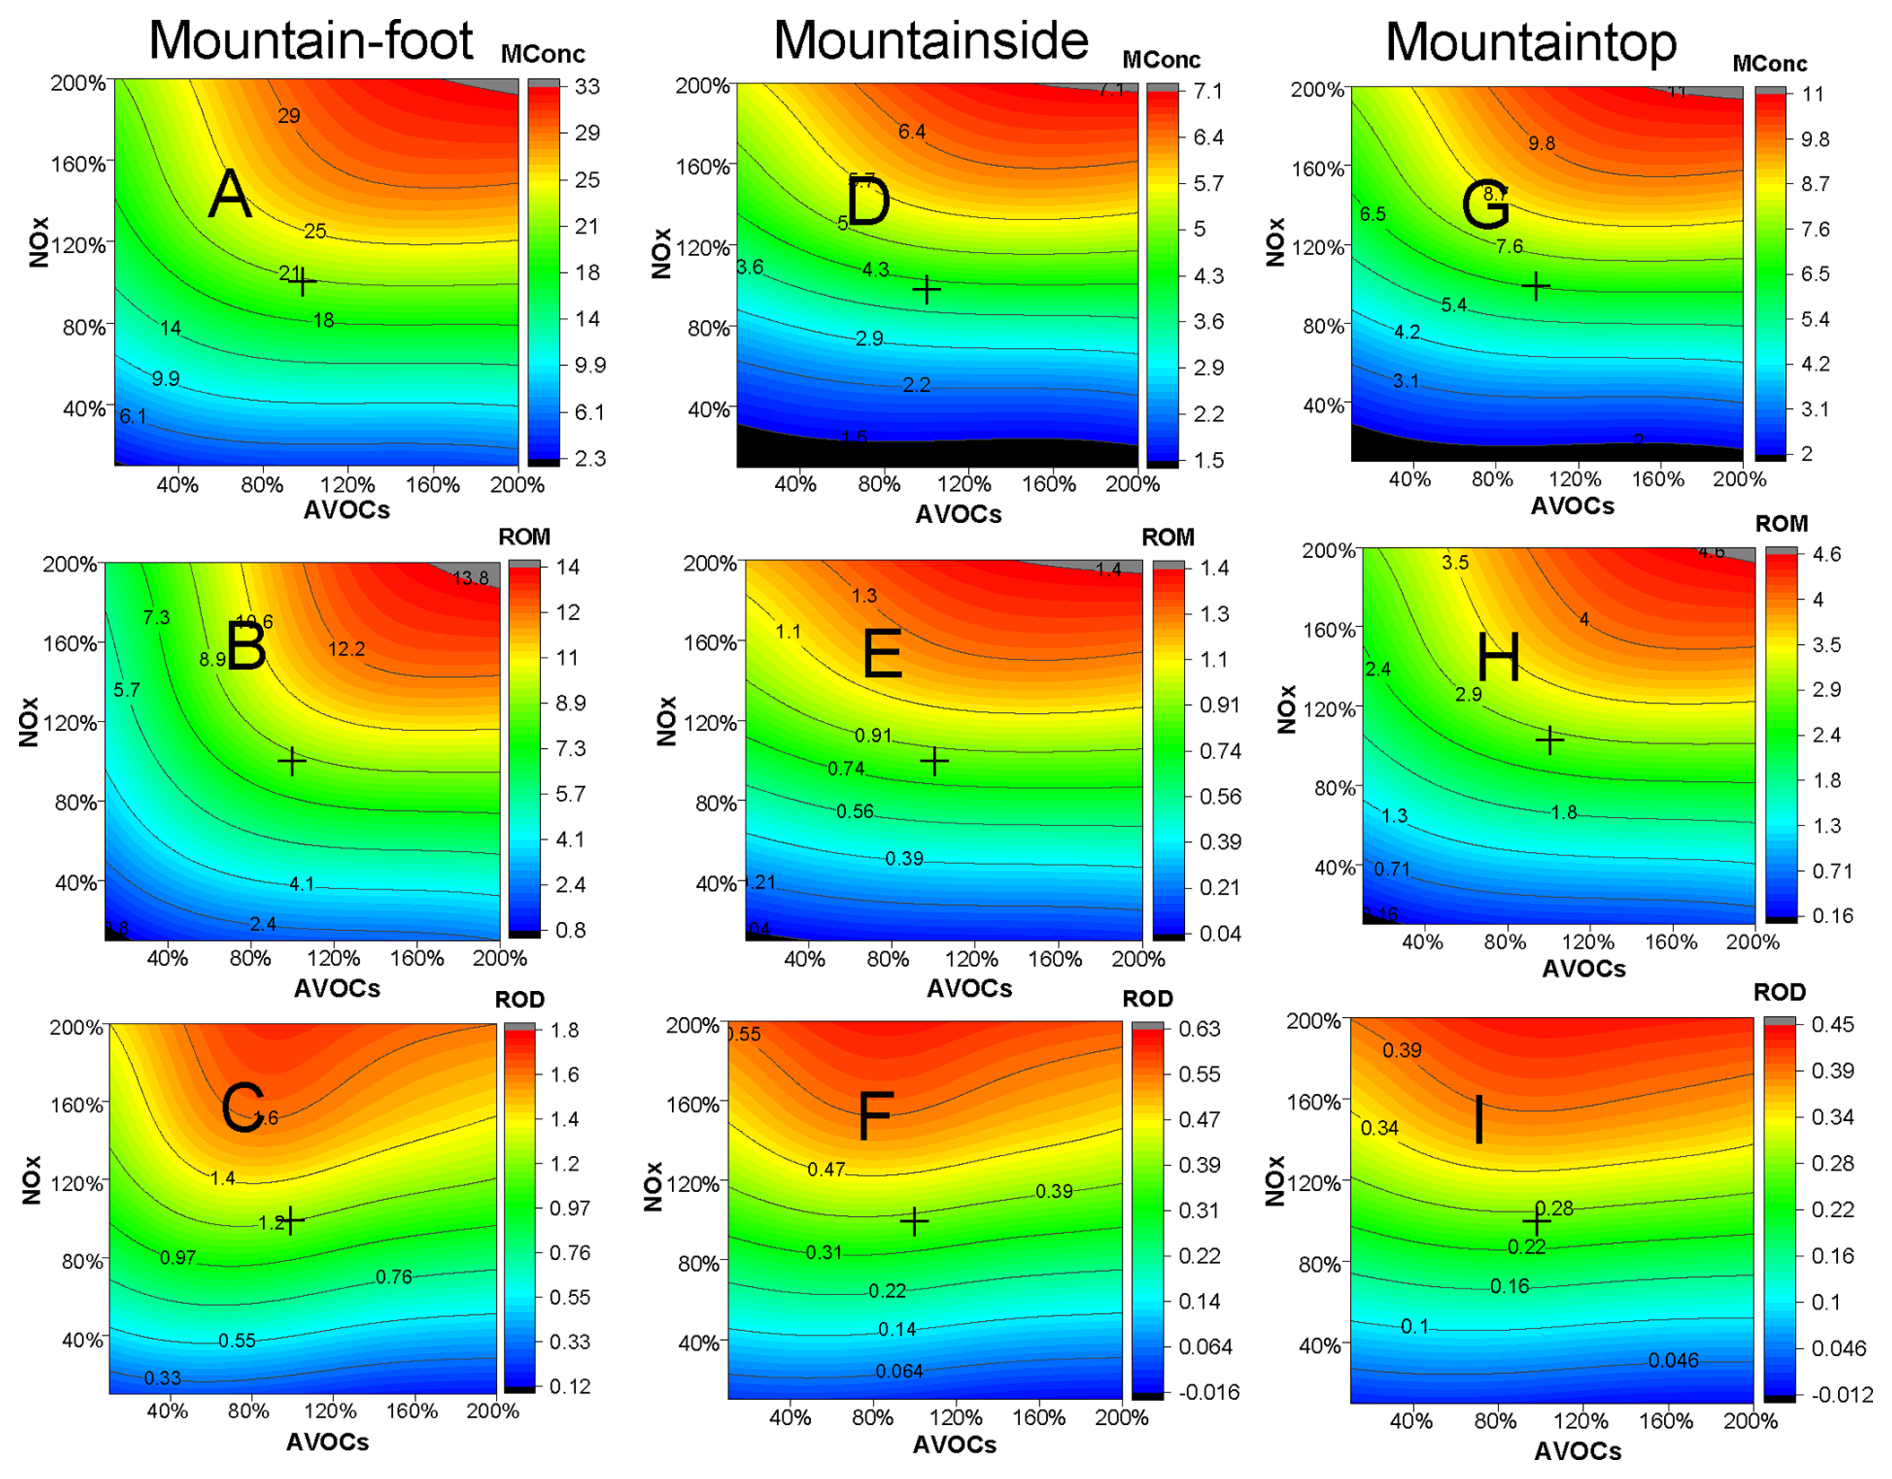
Figure 7The isopleths of the daily maximum hourly O3 concentration (MConc) (units: ppb), daily maximum net O3 production rate (ROM) (units: ppb h−1), and daily average net O3 production rate (ROD) (units: ppb h−1) as a function of the relative changes in anthropogenic VOCs (AVOCs) and NOx across varying elevation sites during the entire observational period. The black cross represents at point 1,1 represents modelled Mconc, ROM and ROD at observed VOC and NOx concentrations.
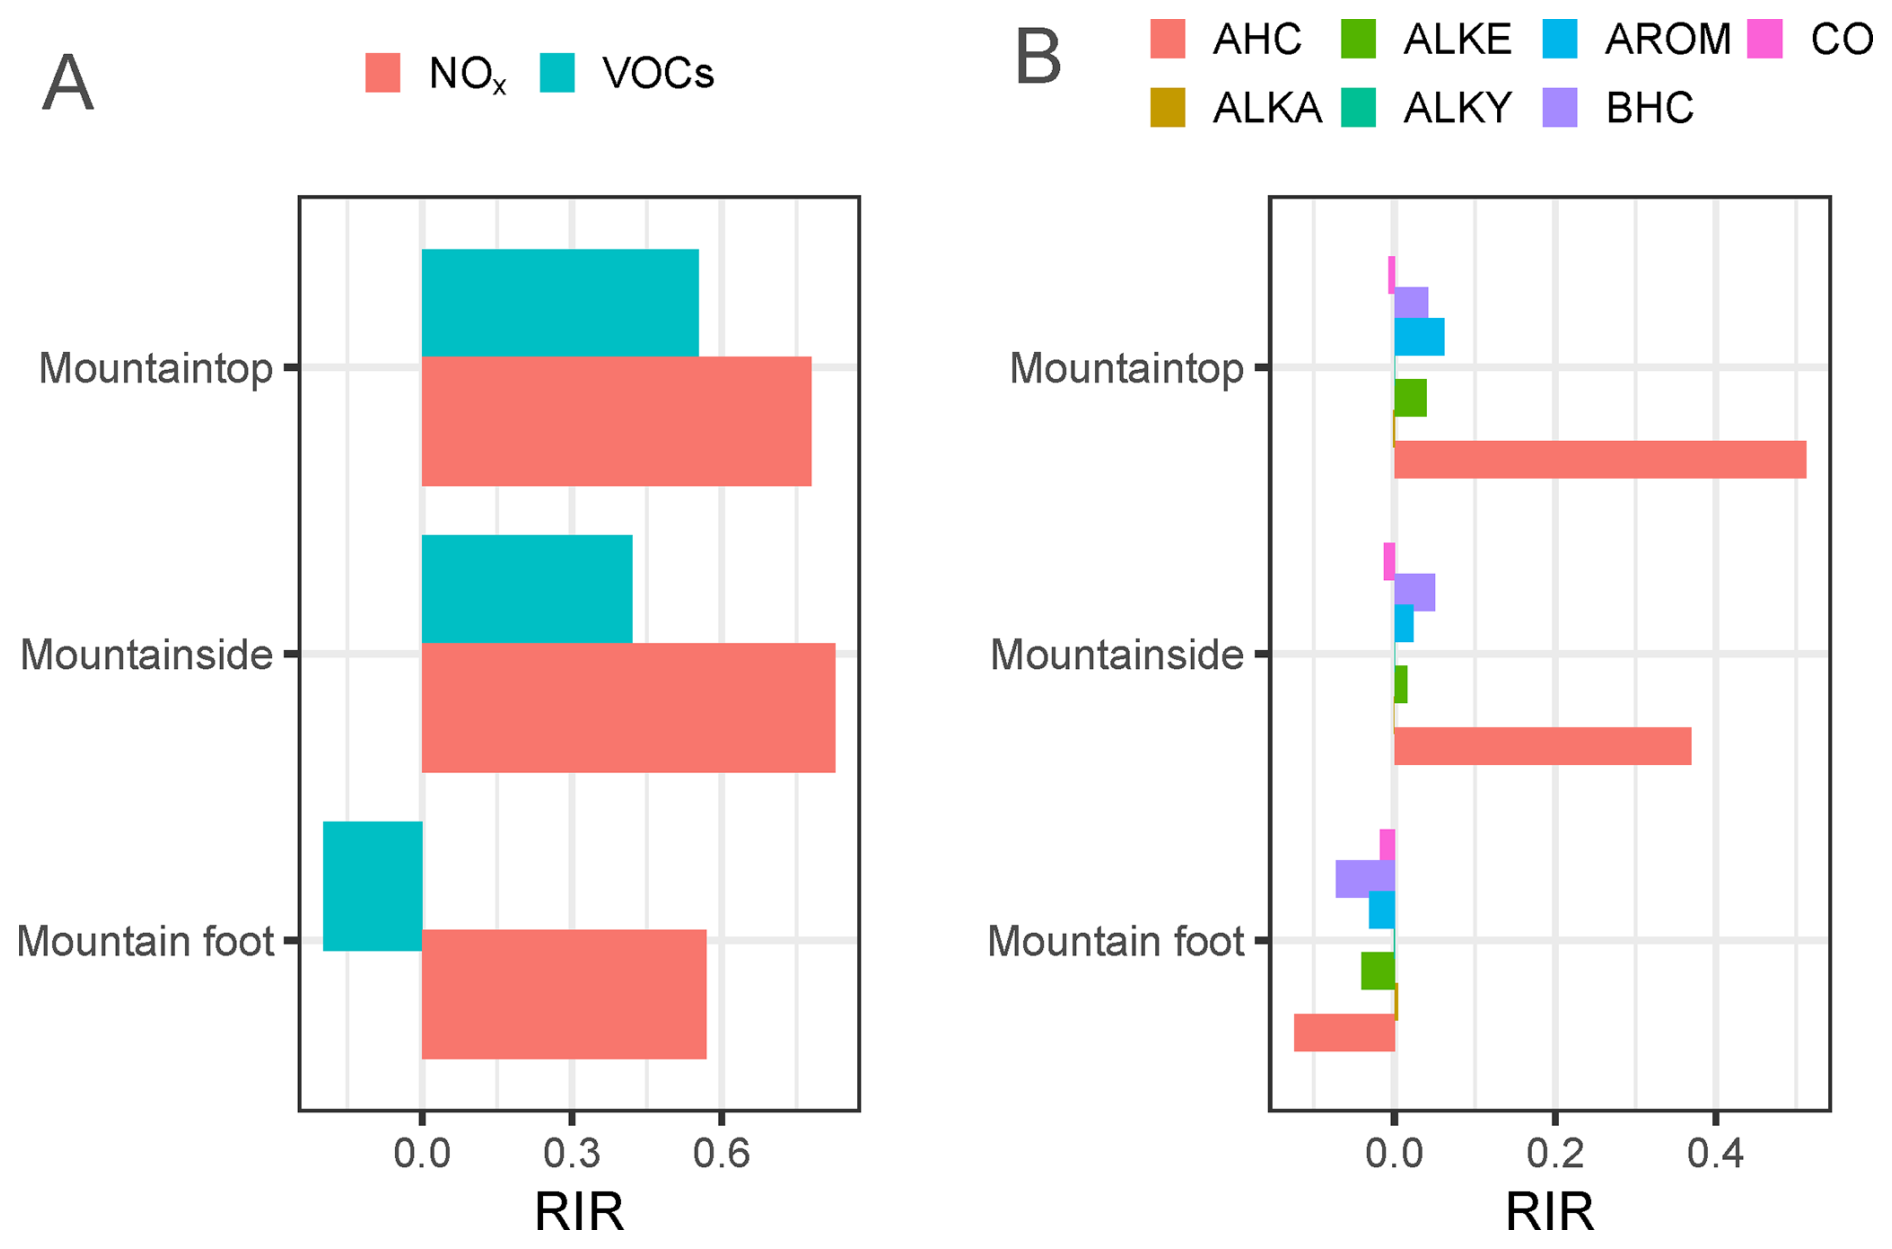
Figure 8Model-calculated relative incremental reactivity (RIR) distributions for (A) major O3 precursor groups and (B) VOCs sub-groups across altitudinal gradients during the observational campaign. Key to abbreviations: AHC, anthropogenic hydrocarbons; ALKA, alkanes; ALKE, alkenes; ALKY, acetylene; AROM, reactive aromatics; BHC, biogenic hydrocarbons.
To evaluate O3 control strategies, we conducted a suite of sensitivity simulations quantifying responses of three O3 metrics-daily maximum hourly concentration (MConc), daily maximum net production rate (ROM), and daily average net production rate (ROD)-to precursor emissions. Analysis of Empirical Kinetic Modeling Approach (EKMA) curves and relative incremental reactivity (RIR) revealed that O3 formation at mountain foot, mountainside, and mountaintop was predominantly NOx-limited (Fig. 7), with corresponding RIR values of 0.57, 0.83, and 0.78 (Fig. 8A). However, a progressive shift towards increasing VOC sensitivity was observed with increasing altitude. RIR values for VOCs were −0.2, 0.42, and 0.55 at mountain foot, mountainside, and mountaintop, respectively, especially anthropogenic hydrocarbons-sensitive (RIR: −0.12 to 0.51), followed by reactive aromatics (−0.03 to 0.06) and alkenes (−0.04 to 0.04) (Fig. 8B). This indicates that the availability and reactivity of anthropogenic hydrocarbons, reactive aromatics and alkenes become increasingly critical rate-limiting factors for O3 production at higher elevations. The contrasting roles of isoprene and anthropogenic hydrocarbons revealed by OH reactivity and RIR metrics underscore the distinction between oxidative capacity and O3 production sensitivity under low-NOx conditions. Isoprene dominated OH reactivity at the mountaintop (31 %) due to its high per-carbon reaction rate with OH, reflecting its strong influence on local radical cycling and overall atmospheric oxidation potential. However, its RIR contribution remained modest because isoprene-driven O3 formation is highly nonlinear and often saturated under low-NOx regimes, where the availability of NOx becomes the limiting factor for converting peroxy radicals to NO2. In contrast, anthropogenic hydrocarbons-particularly aromatics-exhibited higher RIR values because they generate more multi-step oxidation pathways and longer-lived peroxy radicals, thereby enhancing the O3 yield per carbon under low-NOx conditions. This decoupling between OH reactivity and RIR emphasizes that while biogenic VOCs control the radical budget, anthropogenic VOCs can exert a disproportionate leverage on net O3 production in high-altitude, low-NOx environments. Thus, emission control strategies targeting anthropogenic hydrocarbons may yield greater O3 reduction benefits per unit mass, even in regions where biogenic species dominate local reactivity. Negative RIR values for VOCs at the mountain foot (Fig. 8A) indicate that O3 formation is under a strong NOx-limited regime (Fig. 7). In this regime, situated on the right side of the ridge line on a classical EKMA diagram, reducing VOCs can paradoxically increase O3 production. This occurs because VOC reduction slows the oxidation of NO to NO2 by peroxy radicals, leading to a higher ratio and thus greater O3 loss via titration (O3 + NO). With increasing elevation, NOx concentrations decreased more rapidly due to greater distance from emission sources and enhanced dilution. On the sensitivity curve, as NOx concentrations decline to a certain level, variations in VOCs concentrations exert a proportionally greater influence on the O3 formation, even when the system remains predominantly within the NOx-limited regime. This finding underscores the necessity of accounting for spatial heterogeneity in atmospheric chemical processes induced by elevation when evaluating O3 pollution control strategies in complex terrains, such as high mountains. While lower elevations remain primarily NOx-controlled, higher elevations exhibit transitional characteristics marked by enhanced VOCs sensitivity. Consequently, implementing altitude-specific precursor reduction strategies-either differentiated or coordinated controls targeting both NOx and specific VOCs-may prove more effective than uniform regional mitigation measures.
The variations in O3 mixing ratios are governed predominantly by chemical and physical processes. As depicted in Fig. 9, a distinct altitudinal gradient in O3 transport dynamics occurred. During daytime, net O3 transport at mountain foot was characterized by predominantly inward (convergent) fluxes, which contributed to the accumulation of observed daytime O3 concentration (Fig. 9A). This suggests that the foothill area acts as a receptor for O3 or its precursors, likely influenced by upslope flows advecting air masses from the surrounding lower terrain or valley regions. CWT analysis revealed that O3 influx predominantly occurs via northeasterly transport pathways (Fig. S11A), while precursor species are primarily influenced by southwesterly advective transport (Fig. S11B–D). Conversely, at mountainside and mountaintop, the dominant pattern shifts to outward (divergent) fluxes of O3, which resulted in slight daytime O3 decreases at these elevations (Fig. 9B–C). This signifies that these higher elevation sites function as net sources of O3 within the local atmospheric column during the day. The efflux is potentially driven by several factors: (1) intensified turbulent mixing and venting within the mountain boundary layer facilitating vertical export, (2) horizontal advection away from the mountain peak by prevailing winds aloft, and/or (3) local photochemical production exceeding titration or deposition losses at these altitudes under strong solar insolation. This vertical divergence in O3 transport regimes-convergence at the base and divergence aloft-highlights the complex interplay between mountain-induced meteorology (e.g., thermally driven circulations, boundary layer development), atmospheric mixing processes, and photochemistry in governing the spatial distribution and fate of O3 in mountainous terrain.
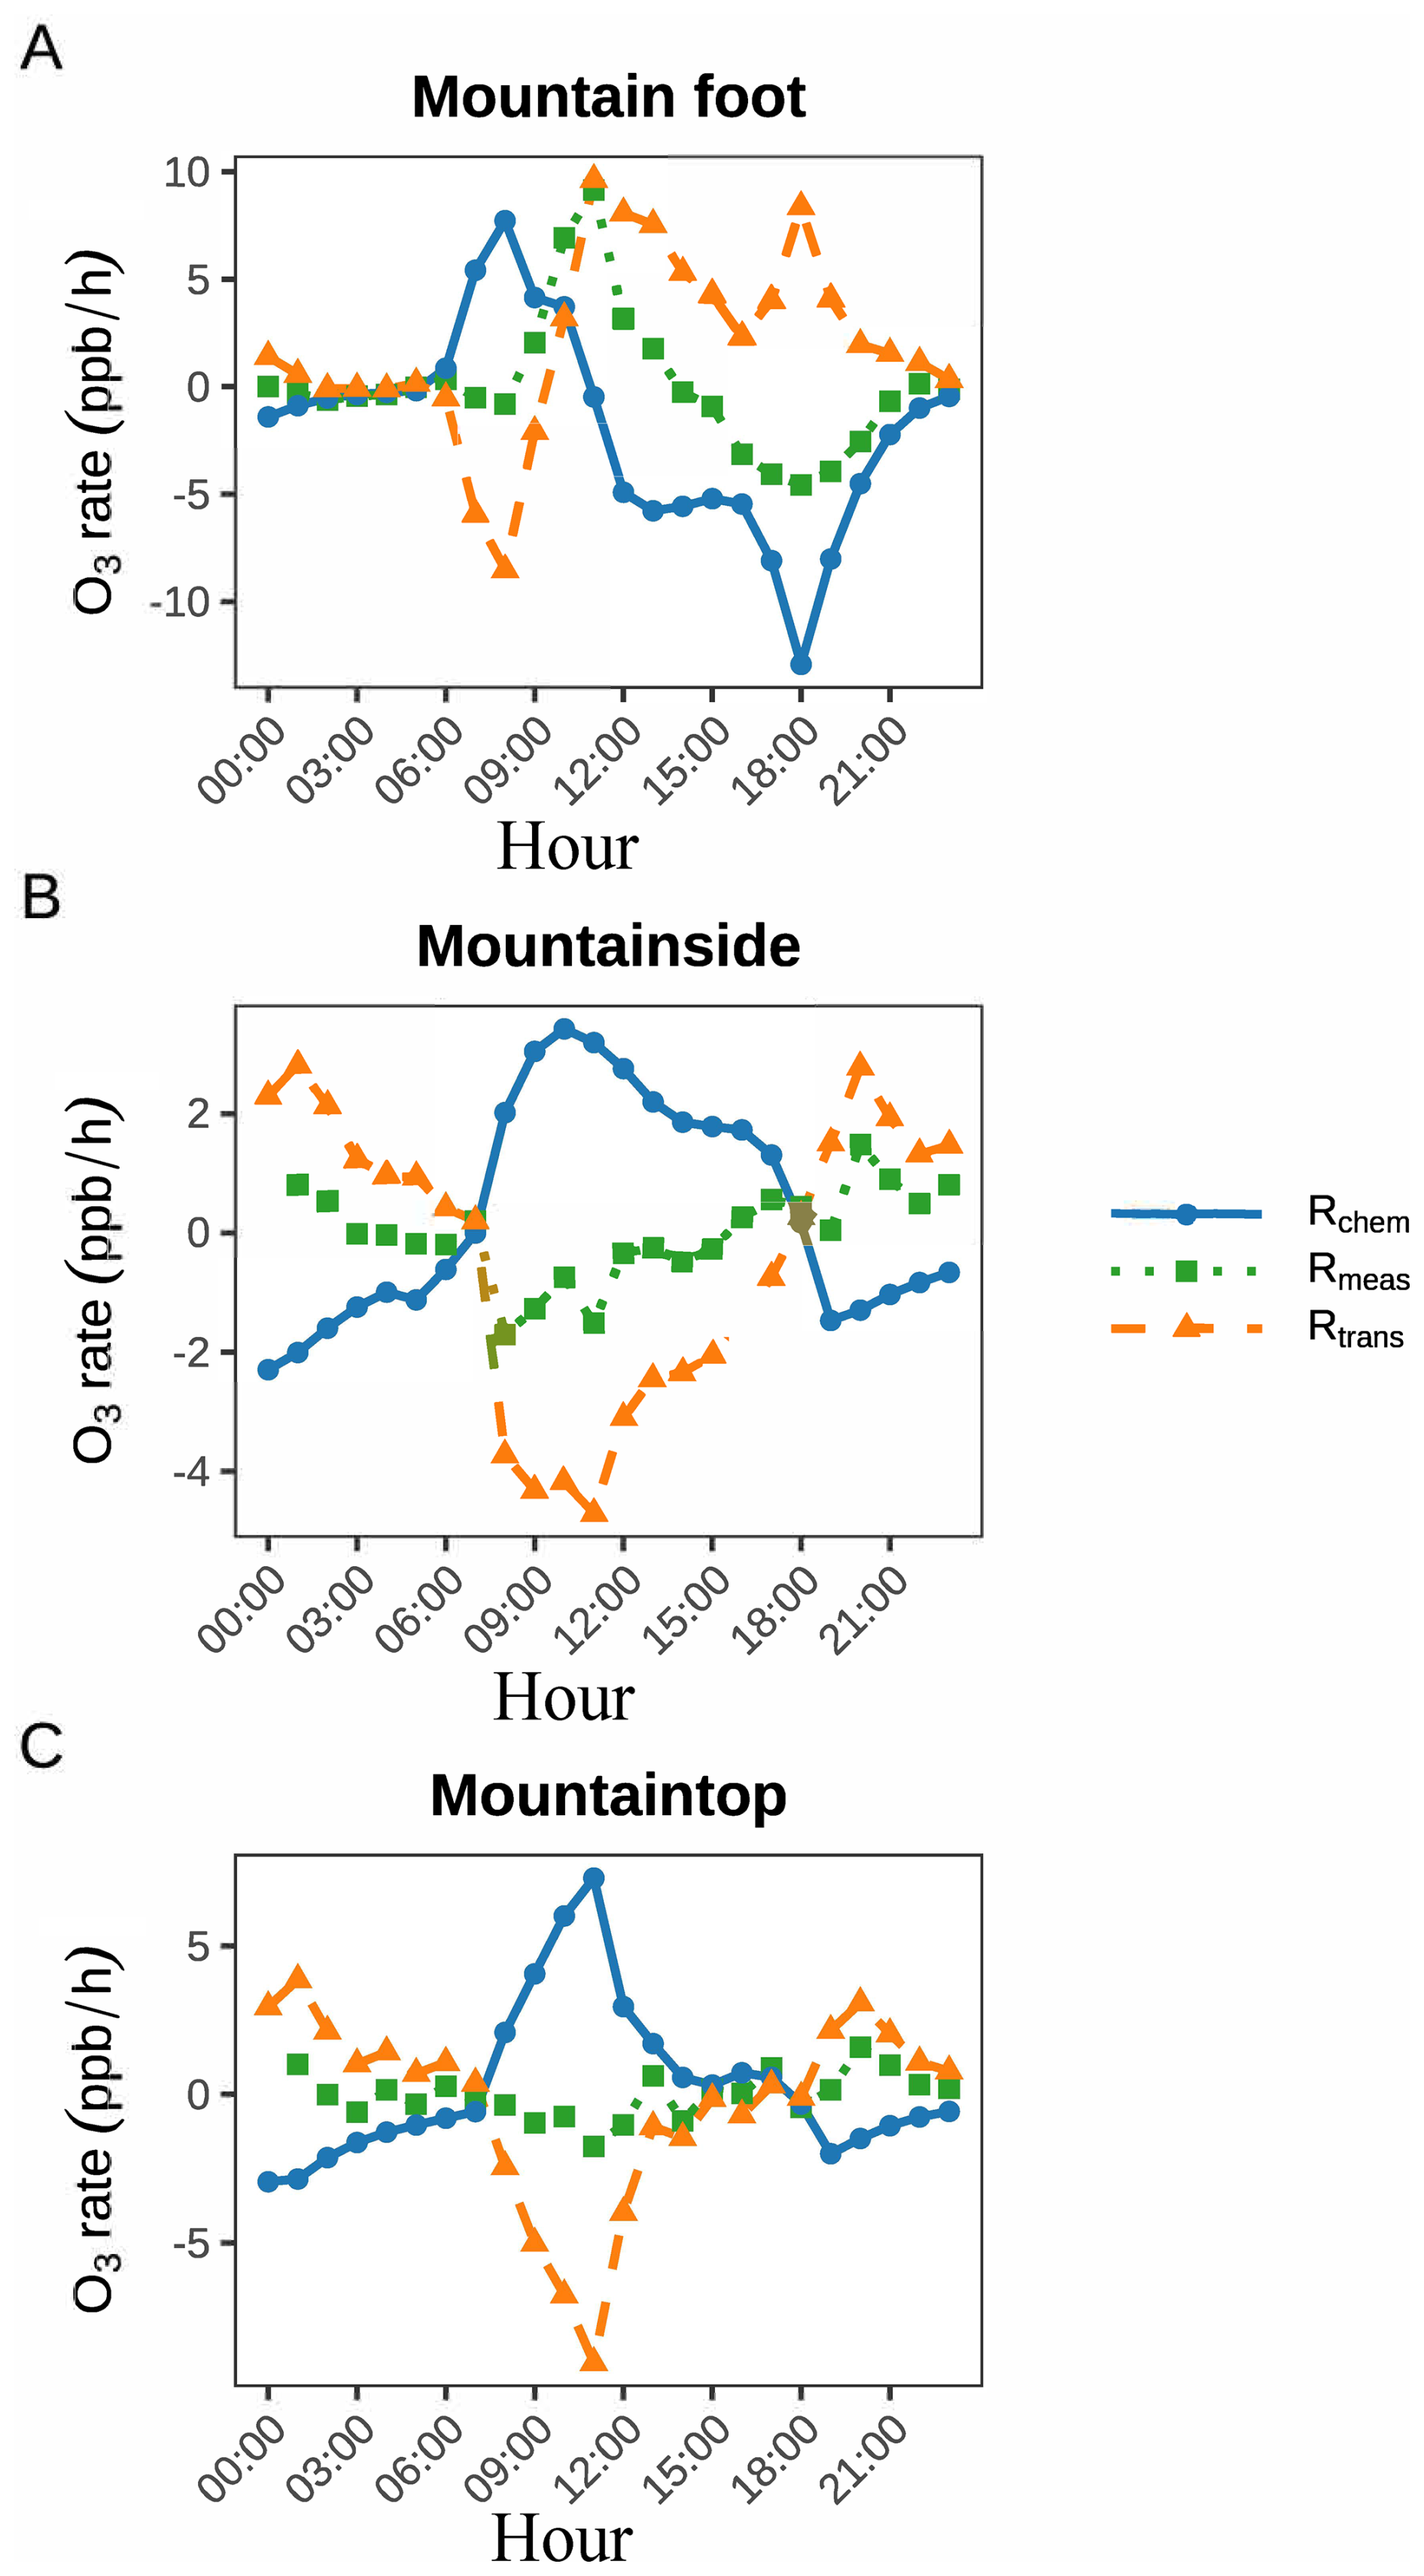
Figure 9The accumulation of O3 arises from both local photochemical production and regional transport processes across altitudinal gradients. In the legend, Rchem, Rtran, and Rmeas denote the local O3 photochemical production rate, regional transport contribution, and observed O3 formation rate, respectively.
Several caveats should be considered when interpreting OBM-MCM results: (1) The 0-D framework cannot resolve spatial heterogeneity or explicitly simulate advection, potentially leading to misattribution between local chemistry and transport; (2) the well-mixed assumption may not hold in complex terrain with strong vertical gradients; (3) unmeasured reactive intermediates rely on model-calculated steady-state concentrations, which may deviate from actual values; (4) heterogeneous chemistry on aerosol surfaces is not accounted for, though it may be significant under high-humidity conditions; and (5) deposition velocities are not explicitly calculated but are instead lumped into the residual term. Despite these limitations, the OBM-MCM remains valuable for diagnosing the relative contributions of chemical versus physical processes and identifying photochemical regimes, provided results are interpreted within these constraints. The 0-D assumption is particularly challenging in mountainous environments, where complex topography drives three-dimensional flows such as valley breezes, slope flows, and mountain venting (Wekker and Kossmann, 2015). Future studies would benefit from coupling detailed chemical mechanisms with mesoscale meteorological models to explicitly resolve transport processes and better partition contributions from local chemistry versus various transport pathways.
Based on comprehensive vertical gradient observations and modeling analyses at Mount Fanjing, this study elucidates the characteristics and governing mechanisms of O3 and its precursors in the high-altitude background atmosphere of the Yunnan–Guizhou Plateau. The results reveal a pronounced positive altitudinal gradient in O3 concentrations, with values of 14.8 ± 15.2 ppb at 550 m, 30.4 ± 13.4 ppb at 1774 m, and 40.2 ± 14.7 ppb at 2119 m, contrasting with the decreasing trends of precursors such as VOCs, NOx, and CO. A clear shift in the dominant factors controlling O3 variability was observed along the elevation gradient. At the mountain foot, O3 levels were governed mainly by NOx and RH, with high RH (>80 %) suppressing O3 through lowered temperatures, shortened radical chain lengths, and enhanced aqueous-phase loss. In contrast, temperature and VOCs species became the primary drivers at the mountainside and summit.
O3 formation regimes also exhibited elevation dependence. Net O3 destruction prevailed at the mountain foot (−1.93 ppb h−1), dominated by O3 + NO2 reactions (48.3 % of loss). Conversely, the mountainside and mountaintop showed net production (+0.35 and +0.29 ppb h−1), primarily through reactions (>80 % of production), with photolysis as the major loss pathway. Chemically, all elevations fell under NOx-limited conditions, but VOCs sensitivity increased with altitude, with anthropogenic hydrocarbons dominating VOCs reactivity aloft, underscoring their growing importance under low-NOx conditions. Transport mechanisms further shaped O3 distribution: daytime convergent flow at lower elevations imported O3 and precursors via northeasterly winds, while divergent fluxes at higher levels exported O3 from the mountainside and summit due to turbulent venting and advection. These patterns highlight the critical role of mountain-induced meteorology in regional O3 dynamics. Our findings underscore the necessity of altitude-specific O3 mitigation strategies and advocate for expanded high-altitude monitoring to better represent regional background pollution in understudied areas.
The datasets generated and/or analyzed during this study, including those underpinning the main figures and Supplement, are available at https://doi.org/10.5281/zenodo.17239121 (Yang et al., 2025).
The supplement related to this article is available online at https://doi.org/10.5194/acp-26-789-2026-supplement.
Y.Y., H.Z and Y.H.W. conceived and designed the study. Y.Y., H.H, Y.H.W., H.B.L, and X.W.H. conducted the experimental measurements. Y.Y. and H.Z. analyzed the data and drafted the manuscript. H.Z., Z.Y, and Y.Y. performed the box model simulations. All authors contributed to the interpretation of the findings and provided critical feedback on the manuscript.
The contact author has declared that none of the authors has any competing interests.
Publisher's note: Copernicus Publications remains neutral with regard to jurisdictional claims made in the text, published maps, institutional affiliations, or any other geographical representation in this paper. The authors bear the ultimate responsibility for providing appropriate place names. Views expressed in the text are those of the authors and do not necessarily reflect the views of the publisher.
All supplementary figures and tables referenced in this study are provided in the Supplement. The authors gratefully acknowledge Nutech (China) Co., Ltd. for providing three sets of Ntrace VsCMS6500 VOCs online monitoring systems. We also thank Jiangsu Skyray Instrument Co., Ltd. for supplying three sets of online analyzers for O3, NOx, and CO. Appreciation is extended to Guizhou Zhitan Yunqing Technology Co., Ltd. for their assistance with the construction of the observation station infrastructure. Finally, we acknowledge Tianjin Winner Technology Co., Ltd. for their technical support in the operation and maintenance of the gradient observation station.
This work was supported by the National Natural Science Foundation of China (grant nos. 42307149, 42567016 and 42205098) and the Science and Technology Program of Guizhou Province (grant no. Qian Kehe Support 2024 General 139).
This paper was edited by James Lee and reviewed by two anonymous referees.
Andreae, M. O., Acevedo, O. C., Araùjo, A., Artaxo, P., Barbosa, C. G. G., Barbosa, H. M. J., Brito, J., Carbone, S., Chi, X., Cintra, B. B. L., da Silva, N. F., Dias, N. L., Dias-Júnior, C. Q., Ditas, F., Ditz, R., Godoi, A. F. L., Godoi, R. H. M., Heimann, M., Hoffmann, T., Kesselmeier, J., Könemann, T., Krüger, M. L., Lavric, J. V., Manzi, A. O., Lopes, A. P., Martins, D. L., Mikhailov, E. F., Moran-Zuloaga, D., Nelson, B. W., Nölscher, A. C., Santos Nogueira, D., Piedade, M. T. F., Pöhlker, C., Pöschl, U., Quesada, C. A., Rizzo, L. V., Ro, C.-U., Ruckteschler, N., Sá, L. D. A., de Oliveira Sá, M., Sales, C. B., dos Santos, R. M. N., Saturno, J., Schöngart, J., Sörgel, M., de Souza, C. M., de Souza, R. A. F., Su, H., Targhetta, N., Tóta, J., Trebs, I., Trumbore, S., van Eijck, A., Walter, D., Wang, Z., Weber, B., Williams, J., Winderlich, J., Wittmann, F., Wolff, S., and Yáñez-Serrano, A. M.: The Amazon Tall Tower Observatory (ATTO): overview of pilot measurements on ecosystem ecology, meteorology, trace gases, and aerosols, Atmospheric Chemistry and Physics, 15, 10723–10776, https://doi.org/10.5194/acp-15-10723-2015, 2015.
Atkinson, R. and Arey, J.: Atmospheric Degradation of Volatile Organic Compounds, Chemical Reviews, 103, 4605–4638, https://doi.org/10.1021/cr0206420, 2003.
Breiman, L.: Random Forests, Machine Learning, 45, 5–32, https://doi.org/10.1023/A:1010933404324, 2001.
Cantrell, C. A., Shetter, R. E., Gilpin, T. M., Calvert, J. G., Eisele, F. L., and Tanner, D. J.: Peroxy radical concentrations measured and calculated from trace gas measurements in the Mauna Loa Observatory Photochemistry Experiment 2, Journal of Geophysical Research: Atmospheres, 101, 14653–14664, https://doi.org/10.1029/95JD03613, 1996.
Carter, W. P. L.: Development of Ozone Reactivity Scales for Volatile Organic Compounds, Journal of the Air and Waste Management Association, 44, 881–899, https://doi.org/10.1080/1073161x.1994.10467290, 2012.
Chen, C., Chen, W., Guo, L., Wu, Y., Duan, X., Wang, X., and Shao, M.: A comprehensive review of tropospheric background ozone: definitions, estimation methods, and meta-analysis of its spatiotemporal distribution in China, Atmospheric Chemistry and Physics, 25, 15145–15169, https://doi.org/10.5194/acp-25-15145-2025, 2025.
Chen, T., Xue, L., Zheng, P., Zhang, Y., Liu, Y., Sun, J., Han, G., Li, H., Zhang, X., Li, Y., Li, H., Dong, C., Xu, F., Zhang, Q., and Wang, W.: Volatile organic compounds and ozone air pollution in an oil production region in northern China, Atmospheric Chemistry and Physics, 20, 7069–7086, https://doi.org/10.5194/acp-20-7069-2020, 2020.
Cooper, O. R., Schultz, M. G., Schröder, S., Chang, K.-L., Gaudel, A., Benítez, G. C., Cuevas, E., Fröhlich, M., Galbally, I. E., Molloy, S., Kubistin, D., Lu, X., McClure-Begley, A., Nédélec, P., O'Brien, J., Oltmans, S. J., Petropavlovskikh, I., Ries, L., Senik, I., Sjöberg, K., Solberg, S., Spain, G. T., Spangl, W., Steinbacher, M., Tarasick, D., Thouret, V., and Xu, X.: Multi-decadal surface ozone trends at globally distributed remote locations, Elementa: Science of the Anthropocene, 8, https://doi.org/10.1525/elementa.420, 2020.
Dieu Hien, V. T., Lin, C., Thanh, V. C., Kim Oanh, N. T., Thanh, B. X., Weng, C.-E., Yuan, C.-S., and Rene, E. R.: An overview of the development of vertical sampling technologies for ambient volatile organic compounds (VOCs), Journal of Environmental Management, 247, 401–412, https://doi.org/10.1016/j.jenvman.2019.06.090, 2019.
Edwards, P. M., Evans, M. J., Furneaux, K. L., Hopkins, J., Ingham, T., Jones, C., Lee, J. D., Lewis, A. C., Moller, S. J., Stone, D., Whalley, L. K., and Heard, D. E.: OH reactivity in a South East Asian tropical rainforest during the Oxidant and Particle Photochemical Processes (OP3) project, Atmospheric Chemistry and Physics, 13, 9497–9514, https://doi.org/10.5194/acp-13-9497-2013, 2013.
Feng, Z., Hu, E., Wang, X., Jiang, L., and Liu, X.: Ground-level O3 pollution and its impacts on food crops in China: A review, Environmental Pollution, 199, 42–48, https://doi.org/10.1016/j.envpol.2015.01.016, 2015.
Feng, Z., Xu, Y., Kobayashi, K., Dai, L., Zhang, T., Agathokleous, E., Calatayud, V., Paoletti, E., Mukherjee, A., Agrawal, M., Park, R. J., Oak, Y. J., and Yue, X.: Ozone pollution threatens the production of major staple crops in East Asia, Nature Food, 3, 47–56, https://doi.org/10.1038/s43016-021-00422-6, 2022.
Fischer, H., Kormann, R., Klüpfel, T., Gurk, Ch., Königstedt, R., Parchatka, U., Mühle, J., Rhee, T. S., Brenninkmeijer, C. A. M., Bonasoni, P., and Stohl, A.: Ozone production and trace gas correlations during the June 2000 MINATROC intensive measurement campaign at Mt. Cimone, Atmospheric Chemistry and Physics, 3, 725–738, https://doi.org/10.5194/acp-3-725-2003, 2003.
Gao, J., Zhu, B., Xiao, H., Kang, H., Hou, X., Yin, Y., Zhang, L., and Miao, Q.: Diurnal variations and source apportionment of ozone at the summit of Mount Huang, a rural site in Eastern China, Environmental Pollution, 222, 513–522, https://doi.org/10.1016/j.envpol.2016.11.031, 2017.
Gaudel, A., Cooper, O. R., Chang, K.-L., Bourgeois, I., Ziemke, J. R., Strode, S. A., Oman, L. D., Sellitto, P., Nédélec, P., Blot, R., Thouret, V., and Granier, C.: Aircraft observations since the 1990s reveal increases of tropospheric ozone at multiple locations across the Northern Hemisphere, Science Advances, 6, eaba8272, https://doi.org/10.1126/sciadv.aba8272, 2020.
Gong, D., Wang, H., Zhang, S., Wang, Y., Liu, S. C., Guo, H., Shao, M., He, C., Chen, D., He, L., Zhou, L., Morawska, L., Zhang, Y., and Wang, B.: Low-level summertime isoprene observed at a forested mountaintop site in southern China: implications for strong regional atmospheric oxidative capacity, Atmospheric Chemistry and Physics, 18, 14417–14432, https://doi.org/10.5194/acp-18-14417-2018, 2018.
Guo, H., Ling, Z. H., Cheng, H. R., Simpson, I. J., Lyu, X. P., Wang, X. M., Shao, M., Lu, H. X., Ayoko, G., Zhang, Y. L., Saunders, S. M., Lam, S. H. M., Wang, J. L., and Blake, D. R.: Tropospheric volatile organic compounds in China, Science of the Total Environment, 574, 1021–1043, https://doi.org/10.1016/j.scitotenv.2016.09.116, 2017.
He, G., He, C., Wang, H., Lu, X., Pei, C., Qiu, X., Liu, C., Wang, Y., Liu, N., Zhang, J., Lei, L., Liu, Y., Wang, H., Deng, T., Fan, Q., and Fan, S.: Nighttime ozone in the lower boundary layer: insights from 3-year tower-based measurements in South China and regional air quality modeling, Atmospheric Chemistry and Physics, 23, 13107–13124, https://doi.org/10.5194/acp-23-13107-2023, 2023.
Henne, S., Furger, M., and Prévôt, A. H.: Climatology of Mountain Venting–Induced Elevated Moisture Layers in the Lee of the Alps, Journal of Applied Meteorology, 44, 620–633, https://doi.org/10.1175/JAM2217.1, 2005.
Jain, V., Tripathi, N., Tripathi, S. N., Gupta, M., Sahu, L. K., Murari, V., Gaddamidi, S., Shukla, A. K., and Prevot, A. S. H.: Real-time measurements of non-methane volatile organic compounds in the central Indo-Gangetic basin, Lucknow, India: source characterisation and their role in O3 and secondary organic aerosol formation, Atmospheric Chemistry and Physics, 23, 3383–3408, https://doi.org/10.5194/acp-23-3383-2023, 2023.
Jenkin, M. E., Khan, M. A. H., Shallcross, D. E., Bergström, R., Simpson, D., Murphy, K. L. C., and Rickard, A. R.: The CRI v2.2 reduced degradation scheme for isoprene, Atmospheric Environment, 212, 172–182, https://doi.org/10.1016/j.atmosenv.2019.05.055, 2019.
Kanaya, Y., Pochanart, P., Liu, Y., Li, J., Tanimoto, H., Kato, S., Suthawaree, J., Inomata, S., Taketani, F., Okuzawa, K., Kawamura, K., Akimoto, H., and Wang, Z. F.: Rates and regimes of photochemical ozone production over Central East China in June 2006: a box model analysis using comprehensive measurements of ozone precursors, Atmospheric Chemistry and Physics, 9, 7711–7723, https://doi.org/10.5194/acp-9-7711-2009, 2009.
Kanaya, Y., Akimoto, H., Wang, Z.-F., Pochanart, P., Kawamura, K., Liu, Y., Li, J., Komazaki, Y., Irie, H., Pan, X.-L., Taketani, F., Yamaji, K., Tanimoto, H., Inomata, S., Kato, S., Suthawaree, J., Okuzawa, K., Wang, G., Aggarwal, S. G., Fu, P. Q., Wang, T., Gao, J., Wang, Y., and Zhuang, G.: Overview of the Mount Tai Experiment (MTX2006) in central East China in June 2006: studies of significant regional air pollution, Atmospheric Chemistry and Physics, 13, 8265–8283, https://doi.org/10.5194/acp-13-8265-2013, 2013.
Lenschow, D. H., Gurarie, D., and Patton, E. G.: Modeling the diurnal cycle of conserved and reactive species in the convective boundary layer using SOMCRUS, Geoscientific Model Development, 9, 979–996, https://doi.org/10.5194/gmd-9-979-2016, 2016.
Li, J., Wang, Z., Akimoto, H., Gao, C., Pochanart, P., and Wang, X.: Modeling study of ozone seasonal cycle in lower troposphere over east Asia, Journal of Geophysical Research: Atmospheres, 112, https://doi.org/10.1029/2006JD008209, 2007.
Li, J., Zhu, C., Chen, H., Zhao, D., Xue, L., Wang, X., Li, H., Liu, P., Liu, J., Zhang, C., Mu, Y., Zhang, W., Zhang, L., Herrmann, H., Li, K., Liu, M., and Chen, J.: The evolution of cloud and aerosol microphysics at the summit of Mt. Tai, China, Atmospheric Chemistry and Physics, 20, 13735–13751, https://doi.org/10.5194/acp-20-13735-2020, 2020.
Li, X.-B., Yuan, B., Wang, S., Wang, C., Lan, J., Liu, Z., Song, Y., He, X., Huangfu, Y., Pei, C., Cheng, P., Yang, S., Qi, J., Wu, C., Huang, S., You, Y., Chang, M., Zheng, H., Yang, W., Wang, X., and Shao, M.: Variations and sources of volatile organic compounds (VOCs) in urban region: insights from measurements on a tall tower, Atmospheric Chemistry and Physics, 22, 10567–10587, https://doi.org/10.5194/acp-22-10567-2022, 2022.
Liu, H., Meigen, Z., and and Han, X.: A review of surface ozone source apportionment in China, Atmospheric and Oceanic Science Letters, 13, 470–484, https://doi.org/10.1080/16742834.2020.1768025, 2020.
Liu, J., Chen, M., Chu, B., Chen, T., Ma, Q., Wang, Y., Zhang, P., Li, H., Zhao, B., Xie, R., Huang, Q., Wang, S., and He, H.: Assessing the Significance of Regional Transport in Ozone Pollution through Machine Learning: A Case Study of Hainan Island, ACS ES&T Air, 2, 416–425, https://doi.org/10.1021/acsestair.4c00297, 2025.
Liu, T., Hong, Y., Li, M., Xu, L., Chen, J., Bian, Y., Yang, C., Dan, Y., Zhang, Y., Xue, L., Zhao, M., Huang, Z., and Wang, H.: Atmospheric oxidation capacity and ozone pollution mechanism in a coastal city of southeastern China: analysis of a typical photochemical episode by an observation-based model, Atmospheric Chemistry and Physics, 22, 2173–2190, https://doi.org/10.5194/acp-22-2173-2022, 2022.
Liu, Y., Wang, T., Stavrakou, T., Elguindi, N., and Brasseur, G. P.: Diverse response of surface ozone to COVID-19 lockdown in China, Science of the Total Environment, 789, 147739, https://doi.org/10.1016/j.scitotenv.2021.147739, 2021.
Lu, H., Lyu, X., Cheng, H., Ling, Z., and Guo, H.: Overview on the spatial-temporal characteristics of the ozone formation regime in China, Environmental Science-Processes & Impacts, 21, 916–929, https://doi.org/10.1039/c9em00098d, 2019.
Lundberg, S. M., Erion, G., Chen, H., DeGrave, A., Prutkin, J. M., Nair, B., Katz, R., Himmelfarb, J., Bansal, N., and Lee, S.-I.: From local explanations to global understanding with explainable AI for trees, Nature Machine Intelligence, 2, 56–67, https://doi.org/10.1038/s42256-019-0138-9, 2020.
Luo, Z., Peng, L., Lv, Z., Zhao, J., He, T., Yi, W., Wang, Y., He, K., and Liu, H.: Impacts of shipping emissions on ozone pollution in China, Atmospheric Chemistry and Physics, 25, 13635–13649, https://doi.org/10.5194/acp-25-13635-2025, 2025.
Lyu, X., Guo, H., Zhang, W., Cheng, H., Yao, D., Lu, H., Zhang, L., Zeren, Y., Liu, X., Qian, Z., and Wang, S.: Ozone and its precursors in a high-elevation and highly forested region in central China: Origins, in-situ photochemistry and implications of regional transport, Atmospheric Environment, 259, 118540, https://doi.org/10.1016/j.atmosenv.2021.118540, 2021.
Ma, J., Tang, J., Zhou, X., and Zhang, X.: Estimates of the Chemical Budget for Ozone at Waliguan Observatory, Journal of Atmospheric Chemistry, 41, 21–48, https://doi.org/10.1023/A:1013892308983, 2002.
Mo, Z., Huang, S., Yuan, B., Pei, C., Song, Q., Qi, J., Wang, M., Wang, B., Wang, C., and Shao, M.: Tower-based measurements of NMHCs and OVOCs in the Pearl River Delta: Vertical distribution, source analysis and chemical reactivity, Environmental Pollution, 292, 118454, https://doi.org/10.1016/j.envpol.2021.118454, 2022.
Okamoto, S. and Tanimoto, H.: A review of atmospheric chemistry observations at mountain sites, Progress in Earth and Planetary Science, 3, https://doi.org/10.1186/s40645-016-0109-2, 2016.
Parker, A. E., Monks, P. S., Wyche, K. P., Balzani-Lööv, J. M., Staehelin, J., Reimann, S., Legreid, G., Vollmer, M. K., and Steinbacher, M.: Peroxy radicals in the summer free troposphere: seasonality and potential for heterogeneous loss, Atmospheric Chemistry and Physics, 9, 1989–2006, https://doi.org/10.5194/acp-9-1989-2009, 2009.
Qiu, Y., Li, X., Chai, W., Liu, Y., Song, M., Tian, X., Zou, Q., Lou, W., Zhang, W., Li, J., and Zhang, Y.: Insights into ozone pollution control in urban areas by decoupling meteorological factors based on machine learning, Atmospheric Chemistry and Physics, 25, 1749–1763, https://doi.org/10.5194/acp-25-1749-2025, 2025.
Seibert, P., Kromp-Kolb, H., Baltensperger, U., Jost, D. T., and Schwikowski, M.: Trajectory Analysis of High-Alpine Air Pollution Data, in: Air Pollution Modeling and Its Application X, edited by: Gryning, S.-E. and Millán, M. M., Springer US, Boston, MA, 595–596, https://doi.org/10.1007/978-1-4615-1817-4_65, 1994.
Shi, Z., Vu, T., Kotthaus, S., Harrison, R. M., Grimmond, S., Yue, S., Zhu, T., Lee, J., Han, Y., Demuzere, M., Dunmore, R. E., Ren, L., Liu, D., Wang, Y., Wild, O., Allan, J., Acton, W. J., Barlow, J., Barratt, B., Beddows, D., Bloss, W. J., Calzolai, G., Carruthers, D., Carslaw, D. C., Chan, Q., Chatzidiakou, L., Chen, Y., Crilley, L., Coe, H., Dai, T., Doherty, R., Duan, F., Fu, P., Ge, B., Ge, M., Guan, D., Hamilton, J. F., He, K., Heal, M., Heard, D., Hewitt, C. N., Hollaway, M., Hu, M., Ji, D., Jiang, X., Jones, R., Kalberer, M., Kelly, F. J., Kramer, L., Langford, B., Lin, C., Lewis, A. C., Li, J., Li, W., Liu, H., Liu, J., Loh, M., Lu, K., Lucarelli, F., Mann, G., McFiggans, G., Miller, M. R., Mills, G., Monk, P., Nemitz, E., O'Connor, F., Ouyang, B., Palmer, P. I., Percival, C., Popoola, O., Reeves, C., Rickard, A. R., Shao, L., Shi, G., Spracklen, D., Stevenson, D., Sun, Y., Sun, Z., Tao, S., Tong, S., Wang, Q., Wang, W., Wang, X., Wang, X., Wang, Z., Wei, L., Whalley, L., Wu, X., Wu, Z., Xie, P., Yang, F., Zhang, Q., Zhang, Y., Zhang, Y., and Zheng, M.: Introduction to the special issue “In-depth study of air pollution sources and processes within Beijing and its surrounding region (APHH-Beijing)”, Atmospheric Chemistry and Physics, 19, 7519–7546, https://doi.org/10.5194/acp-19-7519-2019, 2019.
Shtabkin, Y. A., Moiseenko, K. B., Skorokhod, A. I., Berezina, E. V., and Vasileva, A. V.: Sources and variations of tropospheric ozone in central Siberia: observations and model simulations, IOP Conference Series: Earth and Environmental Science, 606, 012058, https://doi.org/10.1088/1755-1315/606/1/012058, 2020.
Sun, L., Xue, L., Wang, T., Gao, J., Ding, A., Cooper, O. R., Lin, M., Xu, P., Wang, Z., Wang, X., Wen, L., Zhu, Y., Chen, T., Yang, L., Wang, Y., Chen, J., and Wang, W.: Significant increase of summertime ozone at Mount Tai in Central Eastern China, Atmospheric Chemistry and Physics, 16, 10637–10650, https://doi.org/10.5194/acp-16-10637-2016, 2016.
Tan, Z., Lu, K., Jiang, M., Su, R., Wang, H., Lou, S., Fu, Q., Zhai, C., Tan, Q., Yue, D., Chen, D., Wang, Z., Xie, S., Zeng, L., and Zhang, Y.: Daytime atmospheric oxidation capacity in four Chinese megacities during the photochemically polluted season: a case study based on box model simulation, Atmospheric Chemistry and Physics, 19, 3493–3513, https://doi.org/10.5194/acp-19-3493-2019, 2019.
Tong, M., Xu, H., Wang, R., Liu, H., Li, J., Li, P., Qiu, X., Gong, J., Shang, J., Zhu, T., and Xue, T.: Estimating birthweight reduction attributable to maternal ozone exposure in low- and middle-income countries, Science Advances, 9, eadh4363, https://doi.org/10.1126/sciadv.adh4363, 2023.
Wagner, J. S., Gohm, A., and Rotach, M. W.: The Impact of Horizontal Model Grid Resolution on the Boundary Layer Structure over an Idealized Valley, Monthly Weather Review, 142, 3446–3465, https://doi.org/10.1175/MWR-D-14-00002.1, 2014.
Wang, H., Lu, K., Chen, X., Zhu, Q., Wu, Z., Wu, Y., and Sun, K.: Fast particulate nitrate formation via N2O5 uptake aloft in winter in Beijing, Atmospheric Chemistry and Physics, 18, 10483–10495, https://doi.org/10.5194/acp-18-10483-2018, 2018.
Wang, T., Xue, L., Brimblecombe, P., Lam, Y. F., Li, L., and Zhang, L.: Ozone pollution in China: A review of concentrations, meteorological influences, chemical precursors, and effects, Science of the Total Environment, 575, 1582–1596, https://doi.org/10.1016/j.scitotenv.2016.10.081, 2017.
Wang, Y., Gao, W., Wang, S., Song, T., Gong, Z., Ji, D., Wang, L., Liu, Z., Tang, G., Huo, Y., Tian, S., Li, J., Li, M., Yang, Y., Chu, B., Petäjä, T., Kerminen, V.-M., He, H., Hao, J., Kulmala, M., Wang, Y., and Zhang, Y.: Contrasting trends of PM2.5 and surface-ozone concentrations in China from 2013 to 2017, National Science Review, 7, 1331–1339, https://doi.org/10.1093/nsr/nwaa032, 2020.
Wang, Y., Yao, N., Liu, Y., Li, S., Ma, P., Liao, Z., Ren, X., Li, S., Chu, B., Ma, Q., Xin, J., Ma, Y., Quan, J., and He, H.: Campaign for Direct In Situ Study of Residual Layer Chemistry in Urban Beijing, Bulletin of the American Meteorological Society, 106, E625–E641, https://doi.org/10.1175/BAMS-D-24-0127.1, 2025.
Wang, Y. H., Hu, B., Ji, D. S., Liu, Z. R., Tang, G. Q., Xin, J. Y., Zhang, H. X., Song, T., Wang, L. L., Gao, W. K., Wang, X. K., and Wang, Y. S.: Ozone weekend effects in the Beijing–Tianjin–Hebei metropolitan area, China, Atmospheric Chemistry and Physics, 14, 2419–2429, https://doi.org/10.5194/acp-14-2419-2014, 2014.
Wang, Z., Li, J., Wang, X., Pochanart, P., and Akimoto, H.: Modeling of Regional High Ozone Episode Observed at Two Mountain Sites (Mt. Tai and Huang) in East China, Journal of Atmospheric Chemistry, 55, 253–272, https://doi.org/10.1007/s10874-006-9038-6, 2006.
Wekker, S. F. J. D. and Kossmann, M.: Convective Boundary Layer Heights Over Mountainous Terrain – A Review of Concepts, Frontiers in Earth Science, 3, 77, https://doi.org/10.3389/feart.2015.00077, 2015.
Wolfe, G. M., Marvin, M. R., Roberts, S. J., Travis, K. R., and Liao, J.: The Framework for 0-D Atmospheric Modeling (F0AM) v3.1, Geoscientific Model Development, 9, 3309–3319, https://doi.org/10.5194/gmd-9-3309-2016, 2016.
Wu, C., Chen, Y., Sun, Y., Zhang, H., Zhang, S., Cao, C., Li, J., and Wang, G.: Effects of anthropogenic pollutants on biogenic secondary organic aerosol formation in the atmosphere of Mt. Hua, China, Atmospheric Chemistry and Physics, 25, 11975–11989, https://doi.org/10.5194/acp-25-11975-2025, 2025.
Wu, W., Ge, Y., Wang, Y., Su, J., Wang, X., Zhou, B., and Chen, J.: Vertical ozone formation mechanisms resulting from increased oxidation on the mountainside of Mount Tai, China, PNAS Nexus, 3, https://doi.org/10.1093/pnasnexus/pgae347, 2024.
Xing, C., Liu, C., Ye, C., Xue, J., Wu, H., Ji, X., Ou, J., and Hu, Q.: Observations of the vertical distributions of summertime atmospheric pollutants in Nam Co: OH production and source analysis, Atmospheric Chemistry and Physics, 24, 10093–10112, https://doi.org/10.5194/acp-24-10093-2024, 2024.
Xu, W., Lin, W., Xu, X., Tang, J., Huang, J., Wu, H., and Zhang, X.: Long-term trends of surface ozone and its influencing factors at the Mt Waliguan GAW station, China – Part 1: Overall trends and characteristics, Atmospheric Chemistry and Physics, 16, 6191–6205, https://doi.org/10.5194/acp-16-6191-2016, 2016.
Xue, C., Ye, C., Kleffmann, J., Zhang, W., He, X., Liu, P., Zhang, C., Zhao, X., Liu, C., Ma, Z., Liu, J., Wang, J., Lu, K., Catoire, V., Mellouki, A., and Mu, Y.: Atmospheric measurements at Mt. Tai – Part II: HONO budget and radical (ROx + NO3) chemistry in the lower boundary layer, Atmospheric Chemistry and Physics, 22, 1035–1057, https://doi.org/10.5194/acp-22-1035-2022, 2022.
Xue, L., Wang, T., Simpson, I. J., Ding, A., Gao, J., Blake, D. R., Wang, X., Wang, W., Lei, H., and Jin, D.: Vertical distributions of non-methane hydrocarbons and halocarbons in the lower troposphere over northeast China, Atmospheric Environment, 45, 6501–6509, https://doi.org/10.1016/j.atmosenv.2011.08.072, 2011a.
Xue, L. K., Wang, T., Zhang, J. M., Zhang, X. C., Deliger, Poon, C. N., Ding, A. J., Zhou, X. H., Wu, W. S., Tang, J., Zhang, Q. Z., and Wang, W. X.: Source of surface ozone and reactive nitrogen speciation at Mount Waliguan in western China: New insights from the 2006 summer study, Journal of Geophysical Research: Atmospheres, 116, https://doi.org/10.1029/2010JD014735, 2011b.
Xue, L. K., Wang, T., Guo, H., Blake, D. R., Tang, J., Zhang, X. C., Saunders, S. M., and Wang, W. X.: Sources and photochemistry of volatile organic compounds in the remote atmosphere of western China: results from the Mt. Waliguan Observatory, Atmospheric Chemistry and Physics, 13, 8551–8567, https://doi.org/10.5194/acp-13-8551-2013, 2013.
Xue, L. K., Wang, T., Gao, J., Ding, A. J., Zhou, X. H., Blake, D. R., Wang, X. F., Saunders, S. M., Fan, S. J., Zuo, H. C., Zhang, Q. Z., and Wang, W. X.: Ground-level ozone in four Chinese cities: precursors, regional transport and heterogeneous processes, Atmospheric Chemistry and Physics, 14, 13175–13188, https://doi.org/10.5194/acp-14-13175-2014, 2014.
Yang, X., Xue, L., Yao, L., Li, Q., Wen, L., Zhu, Y., Chen, T., Wang, X., Yang, L., Wang, T., Lee, S., Chen, J., and Wang, W.: Carbonyl compounds at Mount Tai in the North China Plain: Characteristics, sources, and effects on ozone formation, Atmospheric Research, 196, 53–61, https://doi.org/10.1016/j.atmosres.2017.06.005, 2017.
Yang, Y., Wang, Y., Zhou, P., Yao, D., Ji, D., Sun, J., Wang, Y., Zhao, S., Huang, W., Yang, S., Chen, D., Gao, W., Liu, Z., Hu, B., Zhang, R., Zeng, L., Ge, M., Petäjä, T., Kerminen, V.-M., Kulmala, M., and Wang, Y.: Atmospheric reactivity and oxidation capacity during summer at a suburban site between Beijing and Tianjin, Atmospheric Chemistry and Physics, 20, 8181–8200, https://doi.org/10.5194/acp-20-8181-2020, 2020.
Yang, Y., Li, H., Wang, Y., Zhang, H., Yang, Z., Hou, X., Yao, D., Hu, H., Zhu, K., Xiong, Y., Lai, L, Chen, D., and Feng, P.: Measurement report: Altitudinal Shift of Ozone Regimes in a Mountainous Background Region, Zenodo [data set], https://doi.org/10.5281/zenodo.17239121, 2025.
Yu, S.: Fog geoengineering to abate local ozone pollution at ground level by enhancing air moisture, Environmental Chemistry Letters, 17, 565–580, https://doi.org/10.1007/s10311-018-0809-5, 2019.
Zanis, P., Monks, P. S., Green, T. J., Schuepbach, E., Carpenter, L. J., Mills, G. P., Rickard, A. R., Brough, N., and Penkett, S. A.: Seasonal variation of peroxy radicals in the lower free troposphere based on observations from the FREE Tropospheric EXperiments in the Swiss Alps, Geophysical Research Letters, 30, https://doi.org/10.1029/2003GL017122, 2003.
Zhang, C., Xie, Y., Shao, M., and Wang, Q.: Application of machine learning to analyze ozone sensitivity to influencing factors: A case study in Nanjing, China, Science of the Total Environment, 929, 172544, https://doi.org/10.1016/j.scitotenv.2024.172544, 2024a.
Zhang, L., Wang, L., Ji, D., Xia, Z., Nan, P., Zhang, J., Li, K., Qi, B., Du, R., Sun, Y., Wang, Y., and Hu, B.: Explainable ensemble machine learning revealing the effect of meteorology and sources on ozone formation in megacity Hangzhou, China, Science of the Total Environment, 922, 171295, https://doi.org/10.1016/j.scitotenv.2024.171295, 2024b.
Zhang, Y., Liu, Y., Ma, W., Hua, C., Zheng, F., Lian, C., Wang, W., Xia, M., Zhao, Z., Li, J., Xie, J., Wang, Z., Wang, Y., Chen, X., Zhang, Y., Feng, Z., Yan, C., Chu, B., Du, W., Kerminen, V. M., Bianchi, F., Petaja, T., Worsnop, D., and Kulmala, M.: Changing aerosol chemistry is redefining HONO sources, Nature Communications, 16, 5238, https://doi.org/10.1038/s41467-025-60614-7, 2025.
Zheng, H., Kong, S., Xing, X., Mao, Y., Hu, T., Ding, Y., Li, G., Liu, D., Li, S., and Qi, S.: Monitoring of volatile organic compounds (VOCs) from an oil and gas station in northwest China for 1 year, Atmospheric Chemistry and Physics, 18, 4567–4595, https://doi.org/10.5194/acp-18-4567-2018, 2018.
Zheng, H., Kong, S., Wu, F., Cheng, Y., Niu, Z., Zheng, S., Yang, G., Yao, L., Yan, Q., Wu, J., Zheng, M., Chen, N., Xu, K., Yan, Y., Liu, D., Zhao, D., Zhao, T., Bai, Y., Li, S., and Qi, S.: Intra-regional transport of black carbon between the south edge of the North China Plain and central China during winter haze episodes, Atmospheric Chemistry and Physics, 19, 4499–4516, https://doi.org/10.5194/acp-19-4499-2019, 2019.
Zhong, B., Jiang, B., Zhou, J., Zhang, T., Chen, D., Zhai, Y., Luo, J., Deng, M., Xiao, M., Jiang, J., Li, J., and Shao, M.: Why observed and modelled ozone production rates and sensitives differ, a case study at rural site in China, EGUsphere [preprint], https://doi.org/10.5194/egusphere-2025-1618, 2025.
Zhou, J., Zhang, C., Liu, A., Yuan, B., Wang, Y., Wang, W., Zhou, J.-P., Hao, Y., Li, X.-B., He, X., Song, X., Chen, Y., Yang, S., Yang, S., Wu, Y., Jiang, B., Huang, S., Liu, J., Peng, Y., Qi, J., Deng, M., Zhong, B., Huangfu, Y., and Shao, M.: Measurement report: Vertical and temporal variability in the near-surface ozone production rate and sensitivity in an urban area in the Pearl River Delta region, China, Atmospheric Chemistry and Physics, 24, 9805–9826, https://doi.org/10.5194/acp-24-9805-2024, 2024.
Zhu, S., Zhou, M., Qiao, L., Huang, D. D., Wang, Q., Wang, S., Gao, Y., Jing, S., Wang, Q., Wang, H., Chen, C., Huang, C., and Yu, J. Z.: Evolution and chemical characteristics of organic aerosols during wintertime PM2.5 episodes in Shanghai, China: insights gained from online measurements of organic molecular markers, Atmospheric Chemistry and Physics, 23, 7551–7568, https://doi.org/10.5194/acp-23-7551-2023, 2023.