
the Creative Commons Attribution 4.0 License.
the Creative Commons Attribution 4.0 License.
 | 28 May 2026
Microphysical and Compositional Differences Between Saharan and Middle Eastern Dust Revealed by UAS Observations
Alkistis Papetta
Konrad Kandler
Claire L. Ryder
Andreas Leonidou
Christos Keleshis
Chris Stopford
Troy Thornberry
Rodanthi-Elisavet Mamouri
Jean Sciare
Franco Marenco
The rising frequency of mineral dust events in the eastern Mediterranean underscores the need for high-resolution observations to better characterize their properties and impacts. This study reports results from the Cyprus Fall Campaign 2021, which aimed to test and validate a new cost-effective methodology for quantitative dust measurements using Giant Particle Collector(GPaC), Portable Optical Particle Spectrometer(POPS), and Universal Cloud and Aerosol Sounding System(UCASS) sensors on-board Uncrewed Aerial Systems(UAS). The Cyprus Fall Campaign 2021 captured the microphysical characteristics of dust particles from two major global sources: North Africa (NA) and the Middle East (ME). The campaign was conducted from 18 October to 18 November 2021 and comprised 36 UAS flights. This work represents the first intensive UAS-based dust characterization campaign in Cyprus and the wider Mediterranean region during the autumn season. Remote-sensing and back-trajectory analyses revealed NA dust layers up to 7 (above sea level) over Cyprus, compared to 3.8 km for ME dust. Impactor sampling demonstrated a near-1 collection efficiency for particles between 4–14 µm, highlighting its effectiveness onboard the UAS. Particle volume size distributions showed a fine-mode peak at 0.25 µm in both cases, and distinct coarse-mode peaks at 2.2 and 4.8 µm for NA and ME dust, respectively. High-altitude impactor samples showed two distinct dust signatures: NA dust enriched in kaolinite-like and Ca-bearing phases, and ME dust dominated by illite/muscovite and Fe-rich components, indicating contrasting source characteristics influenced by granulometry, transport, and atmospheric processing. This study showcases the capability of high-resolution UAS sampling to characterize atmospheric dust and improve understanding of its regional and climatic impacts.
- Article
(7738 KB) - Full-text XML
- BibTeX
- EndNote


Mineral dust is a key constituent of the Earth's system, affecting the radiative balance, cloud properties, and precipitation (Teller et al., 2012; Boucher et al., 2013; Kok et al., 2017). It also has an effect on oceanic and terrestrial biogeochemical processes and atmospheric chemistry. Dust aerosols are mobilised by saltation and sandblasting of soil grains. It can be transported over thousands of kilometres throughout the free troposphere (Ginoux et al., 2001; Engelstaedter et al., 2006; Kok et al., 2012; Ginoux et al., 2012). To understand and quantify the impact of mineral dust on the Earth system, more information is required on height-resolved size distributions, number concentrations, and composition of airborne mineral dust particles (Weinzierl et al., 2009; Formenti et al., 2011; Ryder et al., 2013).
The Eastern Mediterranean basin, due to its proximity to the arid areas of North Africa (NA) and the Middle East (ME), experiences frequent dust episodes throughout the year (Kaskaoutis et al., 2019). The total incidence of days of dust in the Eastern Mediterranean has exhibited a significant upward trend, with the average rate increasing by 2.7 d decade−1 (Ganor et al., 2010). Dust activity in the region is heavily influenced by weather conditions and climate perturbations (Hoerling et al., 2012; Achilleos et al., 2020; Shaheen et al., 2021; Zittis et al., 2022). The main cyclogenesis zones in the Mediterranean basin are characterized by dust uplift and transport throughout the region (Alpert et al., 1990; Karam et al., 2010). Correlation maps associate dust-rich years with high cyclonic activity in the Mediterranean (Dayan et al., 2008). Intense dust episodes over the Eastern Mediterranean are typically associated with phenomena such as the Cyprus Low (Dayan et al., 2008; Kalkstein et al., 2020) and the Sharav cyclones (Karam et al., 2010). These phenomena, transport dust from the Arabian and northern Sahara deserts to the Eastern Mediterranean basin (Nisantzi et al., 2015; Mamouri et al., 2016).
Cyprus, located at the crossroads of the transport pathways, is affected by an increasing number of dust episodes (Achilleos et al., 2014, 2020). Dust transport episodes exhibit significant seasonal and yearly variations, with spring highlighted as the peak period over Cyprus (Kallos et al., 2006; Camps et al., 2015; Papadimas et al., 2017). Cyprus continues to experience dust events in autumn, primarily from ME air masses (Nisantzi et al., 2015; Achilleos et al., 2020). Given that fall dust events were comparatively less studied than those in other seasons (Ganor et al., 2010; Kallos et al., 2014), the present work aims to characterize the dust transported during autumn from different source regions, with particular emphasis on the vertical distribution and the microphysics of the layers, including vertically-resolved particle size distribution and mineralogy.
Height-resolved observations of mineral dust particles can be conducted using remote-sensing instrumentation (Mona et al., 2012; Sugimoto and Zhongwei, 2014; Mamouri and Ansmann, 2015; Toledano et al., 2019) as well as airborne means, such as sensors deployed on-board balloons (Kezoudi et al., 2021b), aircraft (Ryder et al., 2015; Weinzierl et al., 2017; Liu et al., 2018; Marenco et al., 2018) and Uncrewed Aerial Systems (UAS) (Mamali et al., 2018; Rohi et al., 2020; Kezoudi et al., 2021a). UAS offer cost-effective vertically-resolved in-situ atmospheric observations within the lower troposphere, complementary to ground-based remote-sensing and in-situ observations. UAS are also well suited for measuring dust in areas inaccessible to crewed aircraft (e.g. during volcanic eruptions or other extreme events), with the added advantage of safe and easy payload recovery post-flight (Thomas et al., 2018; Manfreda et al., 2018; Lee et al., 2020).
The Unmanned Systems Research Laboratory (USRL; https://usrl.cyi.ac.cy, last access: 12 May 2026) of the Cyprus Institute, part of the EU Aerosol, Clouds and Trace Gases Research Infrastructure (ACTRIS), provides mobile UAS-sensor solutions for deployment across Europe and beyond. Through a transnational access scheme, it supports research, innovation, and training within the European Union Aviation Safety Agency's (EASA) drone regulations. The USRL airfield in Orounda is strategically located 6.5 km from the Cyprus Atmospheric Observatory at Agia Marina Xyliatou (CAO-AMX; https://cao.cyi.ac.cy/agia-marina-xyliatou, last access: 12 May 2026). CAO-AMX provides air pollutant observations using numerous ground-based in-situ and remote-sensing instruments. It serves as the reference rural background station for the national air quality network and is part of the European networks ACTRIS and the European Monitoring and Evaluation Programme (EMEP). Another CAO station with similar instrumentation is located at the Cyprus Institute premises (CAO-Nicosia), at a distance of 28 km from USRL airfield, and is classified as an urban background station.
The data presented in this study were collected during the Cyprus Fall Campaign 2021, which had two primary scientific objectives: (i) to investigate the microphysical properties of airborne dust particles from different source regions over Cyprus during autumn period, and (ii) to establish a UAS-based framework for the optimized in-situ characterization of atmospheric dust. This campaign spanned one month, running from 18 October to 18 November 2021. Throughout the campaign, measurements were continuously collected by ground-based remote-sensing instrumentation at CAO-AMX and CAO-Nicosia, complementing the scientific UAS flights. A total of 36 UAS flights were conducted during two distinct week-long dust events. During most of the days when UAS flights were performed, the daily-averaged Aerosol Optical Depth (AOD) exceeded 0.2 over Nicosia. This paper represents the first study in Cyprus and the broader Mediterranean region dedicated to the results of an intensive campaign using UAS-based sensors amidst dust episodes occurring during the fall season. The structure of this paper is as follows: Sect. 2 provides an overview of the instrumentation and methods employed. The findings are elaborated on and discussed in Sect. 3. Concluding remarks and summary are presented in Sect. 4.
2.1 Ground-based Remote-Sensing instruments
2.1.1 Lidars
A CE376 dual-wavelength polarization lidar (CIMEL company, France) was continuously operated at CAO-Nicosia during the campaign. This compact system uses laser diode and Nd:YAG technology, emitting at 808 and 532 nm with a 4.7 kHz repetition rate. It features one reception channel for the infrared and two for green (co-polar and cross-polar). It records height signals every 15 m from 0.1 to 30 km, with a 1 s integration time. Raw CIMEL lidar data undergo pre-processing to correct detection errors and eliminate ambient background noise across all three channels before being used for depolarization characterization, as described in Papetta et al. (2024).
A second lidar system, the multi-wavelength PollyXT, was also continuously operated at the CARO-LIM NF site during the campaign. This advanced lidar enables high-resolution profiling of aerosol backscatter, extinction, and depolarization properties, providing comprehensive insight into aerosol optical characteristics throughout the atmospheric column (Mamouri et al., 2023).
2.1.2 Ceilometer
The Vaisala Ceilometer CL51 is a fully automated lidar system designed for continuous operation in all weather conditions Münkel et al. (2007). Utilising pulsed diode laser technology, it emits short powerful laser pulses vertically or near-vertically to report attenuated backscatter profiles. It covers a vertical range of up to 15 km. By analysing backscatter caused by clouds, precipitation and aerosols, it accurately determines cloud base and boundary layer height. Two CL51 units were operational during the campaign, one at CAO-Nicosia, and another one at the CAO-AMX.
2.1.3 Sun-photometers
During the campaign, three sun and sky scanning spectral radiometers from the AErosol RObotic NEt-work (AERONET; Holben et al.,1998) were employed for measurements. A lunar/sun-sky-photometer CE318T was at CAO-Nicosia, and two CE318 was at CAO-AMX and at CARO-LIM NF. The CIMEL model used at both locations is capable of direct-sun and diffuse sky measurements across eight spectral bands ranging from 340 to 1020 nm. The output of the AERONET network includes columnar-integrated aerosol property parameters such as AOD and Angstrom exponent, alongside other properties derived from inversions of sky radiance observations. In this study, the AOD information is used as complementary context to characterize the overall intensity of the dust events throughout the campaign. It provides a physically independent measure on the total aerosol loading within the atmospheric column. The typical AOD uncertainty remains within the range of ± 0.01–0.02, contingent upon the specific wavelength and prevailing atmospheric conditions.
2.2 Back-trajectories Model
The Hybrid Single-Particle Lagrangian Integrated Trajectory model (HYSPLIT; Stein et al., 2015; Rolph et al., 2017) ran with Global Data Assimilation System (GDAS) meteorological reanalysis fields at approximately 50 km resolution to investigate the origins of observed airmasses over Cyprus. For each UAS flight, we specifically computed 5 d backward trajectories ending at the Orounda airfield. These trajectories were calculated for arrival heights ranging between 1.0 and 5.0 (above sea level), depending on the height of the dust layer for each case. This approach allowed us to infer the atmospheric pathways leading to the study area, providing insights into the source regions and movement of air masses during the campaign period.
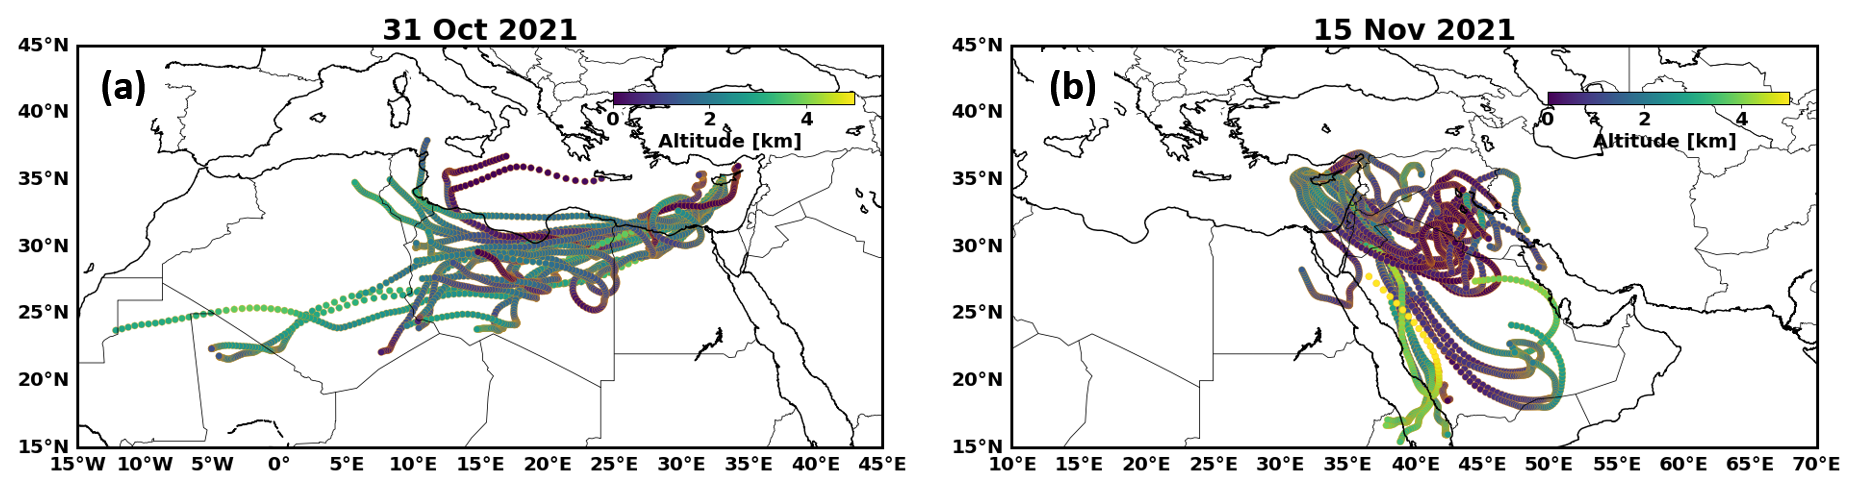
Figure 1HYSPLIT backward trajectories used for the sensitivity analysis for two dust events on 31 October 2021 (13:00 UTC, arriving at 2.5 ) and 15 November 2021 (13:00 UTC, arriving at 2.0 and 2.5 ) over Orounda. Multiple trajectories were initiated from the same endpoint using small spatial offsets in the meteorological grid to assess variability. These cases are representative examples of the dust events analyzed in this study.
To assess the sensitivity of the backward trajectories, we used the grid ensemble approach see e.g. Marenco et al., 2006 within HYSPLIT. Trajectories are automatically computed around a 3-dimensional cube centred around the ending point. The 3-dimensional cube consists of 27 points on 3 planes of 9 trajectories, each plane at ± 250 m altitude. The 9 trajectories on each plane have a horizontal grid spacing of 1° latitude by 1° longitude (120 km). Notably, the final positions of the trajectories are left constant, with only the meteorological data points associated with each trajectory being offset. This ensures that all trajectories originate from the same geographical point. Figure 1 illustrates two examples of this sensitivity analysis.
2.3 The UAS used for this campaign
This study utilized two UAS models, the I-Soar and Skywalker-2015, as presented by Kezoudi et al. (2021a). Both UAS are fixed-wing aircraft, primarily made of foam with plywood reinforcements. The I-SOAR has a wingspan of 2.5 m, a Maximum Take-Off Weight (MTOW) of 6.5 kg, can carry a payload of up to 2 kg, and is capable of flying for up to 110 min. The Skywalker-2015 features a 1.83 m wingspan, a MTOW of 4.2 kg and is capable of carrying a payload of up to 1.5 kg, with a flight endurance of 90 min.
Equipped with a datalogging system, and GPS, these UAS were remotely operated via a Ground Control Station (GCS). The UAS were equipped with meteorological sensors and a pitot-tube, which continuously collect data at a rate of 1 Hz. These sensors provided measurements of relative humidity, temperature, air pressure and airspeed, enriching the dataset and facilitating a comprehensive understanding of atmospheric conditions.
The flight pattern consisted of linear vertical profiles, with the aircraft climbing and descending along segments of 1.5–2 km at rates of 2–3 m s−1. Flight duration typically ranged from 50 to 80 min, primarily constrained by battery capacity and weather conditions. The UAS missions aimed to obtain high-resolution vertical profiles through coordinated ascents and descents between waypoints, with representative profiles derived by averaging data from both phases. Flight timing and altitude targets for UAS operations were determined using real-time lidar backscatter products. Elevated dust layers were defined based on a synergistic approach: lidar signal quicklooks provided the initial vertical extent for sampling, while volume depolarization ratios > 0.1 confirmed the presence of non-spherical mineral dust. This classification was independently validated by chemical and morphological analysis of the impactor samples.
2.4 Instruments on-board UAS
2.4.1 Optical Particle Counters
Two Optical Particle Counters (OPCs) were deployed on-board the two different UAS for this experiment, with approximately one hour interval between their take-off times. The Portable Optical Particle Spectrometer (POPS; Gao et al., 2016), is a small light-weight and high sensitivity OPC, manufactured by Handix Scientific. The POPS was deployed on-board the I-Soar UAS (Kezoudi et al., 2021a). The instrument operates a 405 nm laser diode with a sampling frequency of 1 Hz, and a calibrated Mie theory calculation is used to determine the particle size based on the intensity of scattered light. POPS collects light scattered by individual particles in an angular range between 38 and 142°. The diameter of the inlet tube is 1 mm and the sample flow rate is around 3 cm3 s−1, yielding a flow velocity of 3.8 m s−1. The sampling inlet of the POPS maintains isokinetic conditions during flight, a performance verified by wind tunnel experiments confirming that inlet flow velocity matches the platform's free-stream velocity. POPS measures the particle number size distributions in an optical size range of 0.13–3 µm (Pilz et al., 2022; Pohorsky et al., 2024).
To extend the size range of measured particles towards coarser sizes, the Universal Cloud and Aerosol Sounding System (UCASS; Smith et al., 2019) was integrated below the wings of the Skywalker 2015 UAS (Kezoudi et al., 2021a). The UCASS is a lightweight open-path OPC developed by the University of Hertfordshire, and designed for deployment as a balloon-borne instrument (Kezoudi et al., 2021b), as a dropsonde, or on board a UAS (Girdwood et al., 2022). The geometry of the instrument minimizes particle losses and droplet shattering at the inlet. It uses a 658 nm laser diode to detect light scattered by particles between 16 and 104°, with a sampling frequency of 1 Hz. Computational Fluid Dynamics (CFD) simulations confirm that integrating the UCASS beneath the wings enables its airflow measurements to align with those obtained from the UAS nose-mounted pitot tube for an angle-of-attack range of ± 10° (Girdwood et al., 2022).
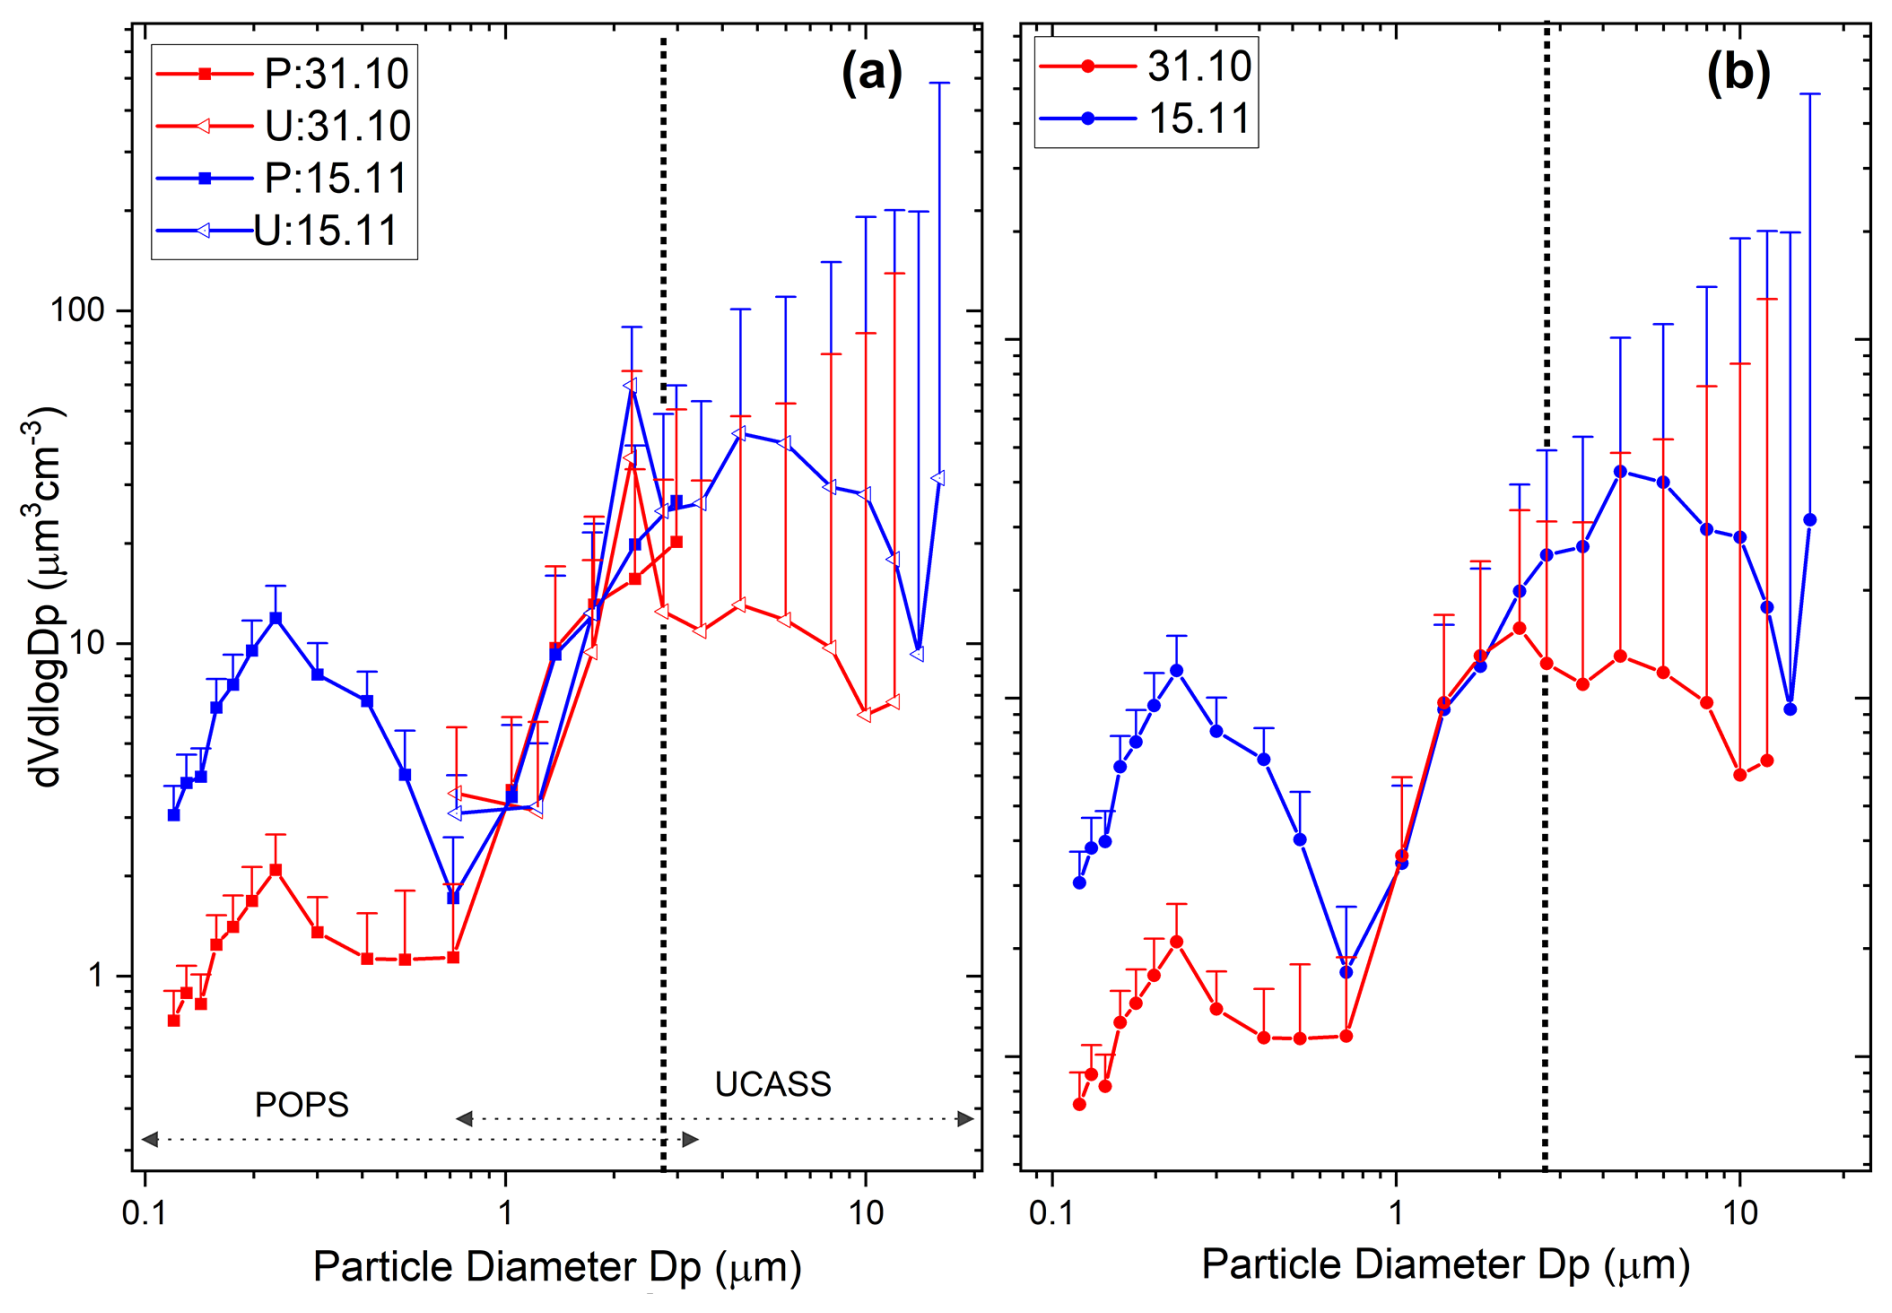
Figure 2Volume size distribution of (a) POPS (square points) and UCASS (triangle points) as derived for the UAS measurements on 31 October (red) and 15 November 2021 (blue); and (b) combined POPS and UCASS for the same cases. The vertical dashed line shows the size bin where UCASS data are merged with POPS. For clarity only upper error bounds are shown.
For the analysis, the OPC data were aggregated onto a vertical grid with a resolution of 20 m, which defines the effective vertical resolution of the presented profiles. Particle size distributions in this study were calculated using the formulas provided in Kezoudi et al. (2021b). Specifically, raw particle counts C for each size bin i were used to calculate the particle number concentration per size bin , per unit volume (v), per second over the covered size range. Summing ni across all size bins yields the total number concentration N. Assuming spherical particles, the particle number (1) and volume (2) size distributions are calculated using the sum of the number and volume concentration, respectively, for each bin together with the logarithmic bin centre and width , where Di are the bin edge diameters, by
To achieve a complete particle size distribution for both POPS and UCASS, the size bins of the two instruments were combined. For the size range between 0.1 and 2.3 µm, POPS data were solely utilized in the analysis. For particle sizes exceeding 2.3 µm, UCASS data were employed. This cutoff diameter was chosen based on prior research that indicated possible artifacts of size around 2.2µm of ambient measurements within this size range when using UCASS (Kezoudi, 2020). Figure 2 shows the combined volume size distributions averaged over the observed dust layers, as obtained with POPS and UCASS UAS flights on 31 October and 15 November 2021. Figure 2a includes the size distributions in the full size range of the two instruments, which demonstrates good resemblance in the overlap size section of POPS and UCASS. Figure 2b depicts the volume size distribution in the combined size range of the two OPCs, as described above. The error bars shown in the figure represent the standard deviation of the measurements over the whole flight, indicating the variability of the data collected within the dust layers.
Estimation of aerosol mass concentration relies on the assumption that the particles are spherical, allowing simplified volumetric calculations to be applied. Given an assumed particle density (ρ) and an assumed size distribution, the mass concentration (M) can be derived from the particle volume concentration (V) as:
where V is obtained from the particle size distribution using an appropriate integration approach (i.e., a lognormal distribution). This approach is commonly used in remote sensing and in-situ aerosol studies to convert optical or number concentration data into mass concentration estimates (Dubovik et al., 2002; Kahn et al., 2005)).
A representative density of 1.6 g cm−3 was adopted for fine/submicron aerosols for mass-from-volume conversions, consistent with commonly used methodological assumptions and measured densities reported in the literature (McMurry et al., 2002; Li et al., 2021). In contrast, coarse-mode aerosols, particularly those dominated by mineral dust from sources such as the Sahara, exhibit higher densities around 2.6 g cm−3 (Maring et al., 2003). This density assumption aligns with the compositional analyses of Saharan dust, which consists mainly of silicates, iron oxides, and other mineral components (Formenti et al., 2011). These density values are widely used in climate modeling and atmospheric aerosol retrieval algorithms, particularly in satellite-based assessments and aerosol transport simulations (Koffi et al., 2016; Kok et al., 2017). However, variations in aerosol composition and mixing state can introduce uncertainties in mass concentration estimates, necessitating further validation through in-situ measurements. In this study, the fine mode was defined as the size range from 0.1 to 0.7 µm with particle density of 1.6 g cm−3. For particles larger than 0.7 µm, a density of 2.6 g cm−3 was used. The threshold of 0.7 µm was chosen based on the measurements, as it corresponds to the minimum between the fine and coarse mode, observed during most of the flights.
2.4.2 OPC calibration and associated uncertainties
The UCASS units deployed in this study were calibrated by the University of Hertfordshire using polystyrene latex (PSL) spheres in combination with Mie scattering calculations, in which the instrument optical configuration was taken into account, to establish the instrument response function. The calibration framework incorporates laboratory measurements and assumes a refractive index of 1.52+0.002i, representative of mineral dust. This refractive index is consistent with values reported in the literature for Saharan and Middle Eastern mineral dust and ensures that the resulting size bin definition is appropriate for dust-dominated environments (e.g., Nisantzi et al., 2015; Kezoudi et al., 2021b). Sensitivity tests performed by perturbing the real and imaginary parts of the assumed dust refractive index resulted in changes of less than 1 % in the simulated extinction coefficient, indicating a negligible impact on the derived optical properties (Papetta et al., 2026). Scattering intensities computed using Mie theory are linked to particle optical diameters through comparison with laboratory reference measurements, thereby establishing instrument-specific response functions that define the UCASS size bins. For the units deployed in this study, the vertical resolution of sampled size range where the calibration is considered reliable spans 0.5–21.0 µm. The defined size bins corresponding to this dust-specific calibration were applied directly in the present analysis. While uncertainties associated with refractive index variability remain inherent to all OPC-based measurements, the applied calibration minimizes systematic bias for mineral dust and is appropriate for the conditions encountered in this study and is consistent with previous UCASS deployments in dust-dominated environments (Kezoudi et al., 2021b).
The POPS OPC was calibrated by the manufacturer using PSL spheres and dioctyl sebacate (DOS), with refractive indices of for PSL and for DOS (Gao et al., 2016). The impact of refractive index differences between the PSL-based POPS calibration and dust conditions using Mie scattering calculations at the POPS operating wavelength and angular range was assessed. Assuming a dust-representative refractive index (), the resulting diameter adjustment is approximately 4 % (Papetta et al., 2026). In absolute terms, this corresponds to shifts of < 0.05 µm for particle diameters below 1.22 µm and up to ∼ 0.1 µm for larger particles. These differences are small relative to the POPS size bin widths (> 10 %) and therefore do not significantly affect the combined size distributions. For this reason, no correction was applied. Given the small magnitude of this correction and its minor impact on derived volume concentrations, the refractive index adjustment was not applied to the POPS data. The associated uncertainty is therefore considered negligible within the context of this study. Nonetheless, uncertainties related to refractive index assumptions were explicitly evaluated and are now acknowledged in the revised manuscript.
To quantify the uncertainty associated with particle non-sphericity, we performed a sensitivity analysis using MOPSMAP simulations (Gasteiger and Wiegner, 2018; Papetta et al., 2026) in which the particle aspect ratio was varied. The shape configuration included spheres, as well as spheroids with aspect ratios of 1.45, 2 and 3, as shown in Appendix A. Increasing the aspect ratio from 1 to 2, corresponding to more elongated particles, resulted in an approximately 2 % change in the simulated extinction coefficient. Because extinction scales approximately with the square of particle diameter, this variation translates to an estimated 1 % shift in the inferred optical-equivalent diameter. Given that typical OPC size-bin widths are substantially larger, such a small diameter perturbation remains well below the instrumental resolution. Consequently, realistic dust particle shape variations introduce a minor systematic bias in the retrieved size distribution and do not affect the study's main conclusions. The extinction is governed by the extinction efficiency according to previous studies exhibits relatively weak sensitivity to particle shape for modest deviations from sphericity. For example, Gasteiger and Wiegner (2018) show in their Fig. 2a that the extinction efficiency curves for spheres and prolate spheroids with an aspect ratio (ε) of 1.4 are nearly indistinguishable over a broad size parameter range. Furthermore, their Table 3 indicates that even for ε=2, the differences between spherical and spheroidal particles remain relatively small and are of the same order as the 2 % in our study.
2.4.3 Particle sampling with the Giant Particle Collector
A miniaturized and 3D-printed version of the Giant Particle Collector (GPaC; Kezoudi et al., 2021a), a body impactor shown in Fig. 3, has been designed for UAS applications (Lieke et al., 2011). In principle, there is no strict upper cut-off diameter for dust collection on the adhesive substrate. In practice, however, the effective limit is set by the sticking efficiency, which decreases for larger particles due to their higher inertia and tendency to rebound. In this manuscript, the investigated size range is up to 21 µm particle diameter, identical to the UCASS size range. In this study, particles down to approximately 1 µm diameter could efficiently be sampled with the system.
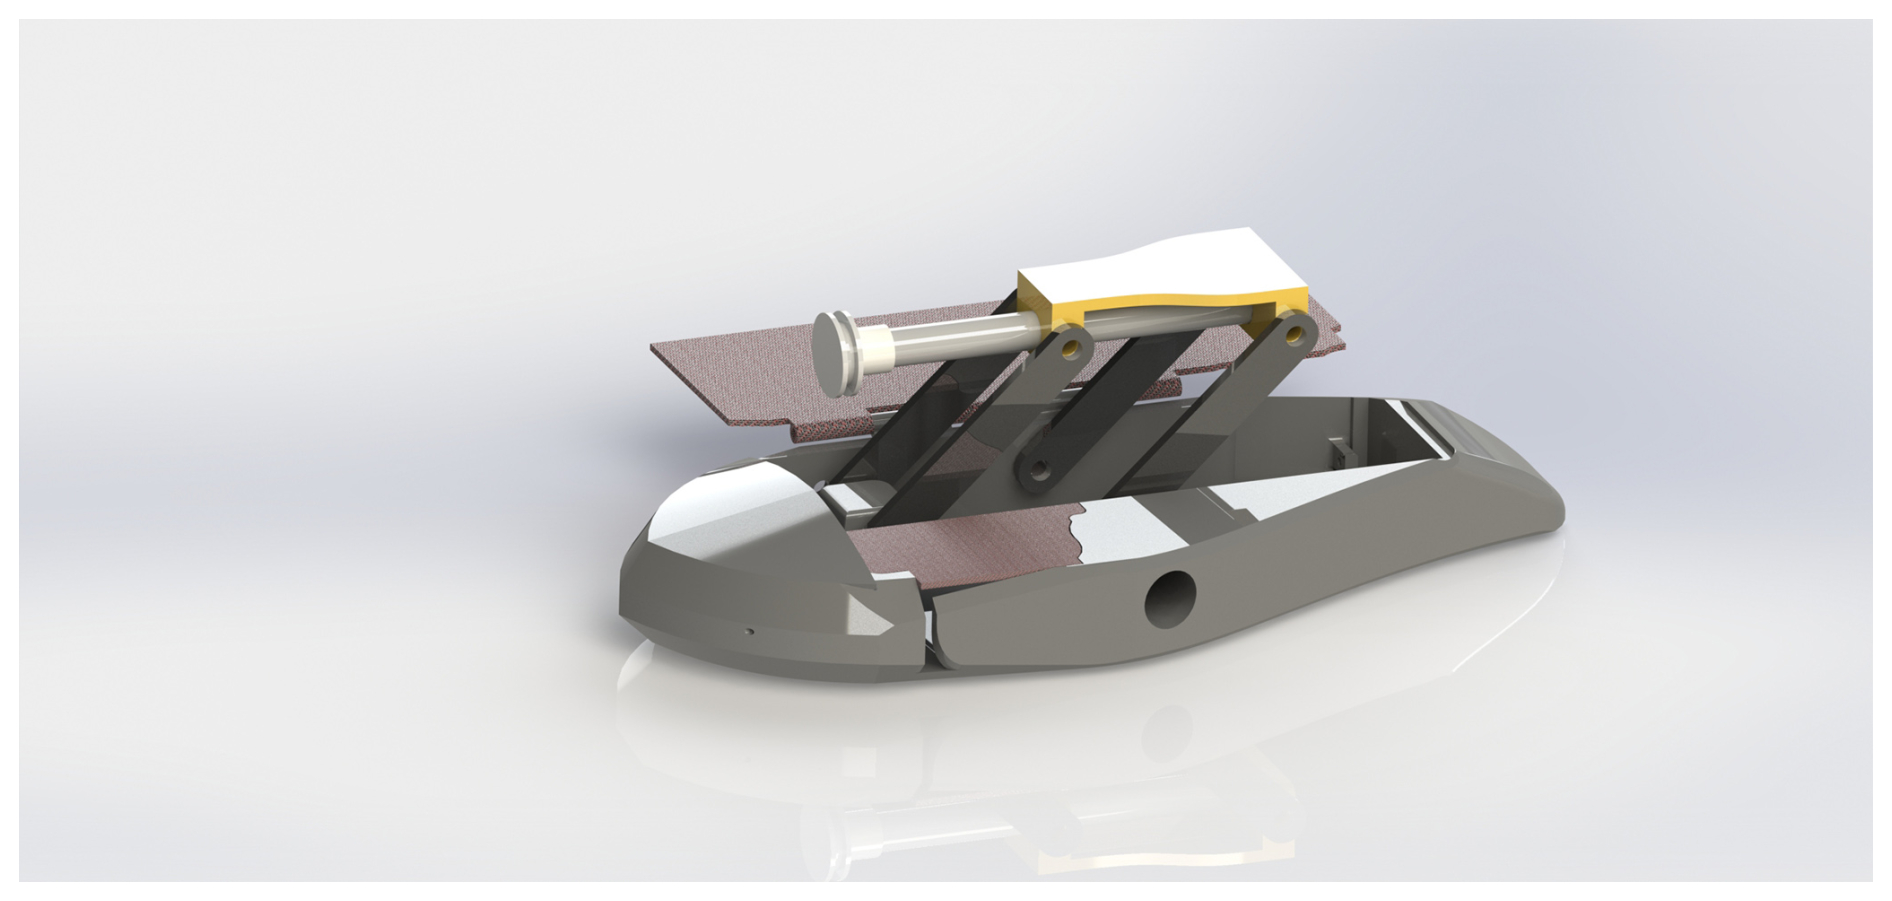
Figure 3Design of the GPAC in the open configuration. Following sampling, the substrate holder is retracted into its protective cover to prevent contamination.
Two GPaC samplers (Fig. 3) were integrated beneath the wings of the Skywalker 2015 UAS, alongside the UCASS units, to facilitate airborne dust collection. Each sampler holds a pure carbon adhesive substrate (12.5 mm diameter, SpectroTab, Plano GmbH, Wetzlar, Germany) mounted on a standard Single-particle Electron Microscopy (SEM) aluminium stub at the tip of the GPaC system. Before each flight, the substrates were mounted, and during flight, the pilot could manually expose a substrate to the airstream at a predetermined altitude and for a specified duration. After sampling, the holder retracted the substrate back into its protective cover, and the same procedure was repeated for the second substrate to sample a second atmospherifc layer. At the end of the flight, both samples were dismounted and stored for offline analysis.
For SEM, optimal particle spacing is important; there must be enough particles for statistical relevance, but not so many that they overlap on the substrate (Kandler et al., 2018). A typical ideal spacing on the substrate is 20–50 µm. Because particle collection efficiency depends on both the effective sampling path length and the aerosol concentration – parameters that cannot be precisely determined before sampling – the required flight path length must be established using representative or anticipated atmospheric conditions. During flight, the identification of distinct atmospheric layers and the timing of the opening and closing of the two impactors were guided by real-time lidar observations, which allowed for the detection of dust layers, and were further supported by the vertical structure obtained from UAS profiling flights conducted earlier on the same day, when available. However, each sample represents an integration over the sampling period and thus does not resolve vertical variability within the atmospheric column. If the actual concentration during flight deviates significantly from these expectations, the collected sample may be unsuitable for analysis. Accordingly, in the present study, only 16 of the 22 collected samples provided adequate coverage for analysis. The remaining six samples, affected by either insufficient particle loading or contamination introduced during handling, were excluded from further consideration.
The particle size derived from the collected samples corresponds to a geometric diameter obtained from SEM images, defined as the equivalent circular diameter (i.e., the diameter of a circle with the same projected area as the particle), following the methodology of Kandler et al. (2009, 2011). This represents a physical particle dimension and does not correspond to an aerodynamic or optical-equivalent diameter. In contrast, POPS and UCASS report optical-equivalent diameters based on light scattering, which depend on particle refractive index, shape, and orientation. Differences between SEM-derived and optically derived sizes are therefore expected, particularly for irregular mineral dust particles, although they remain broadly comparable within the uncertainties of the respective techniques.
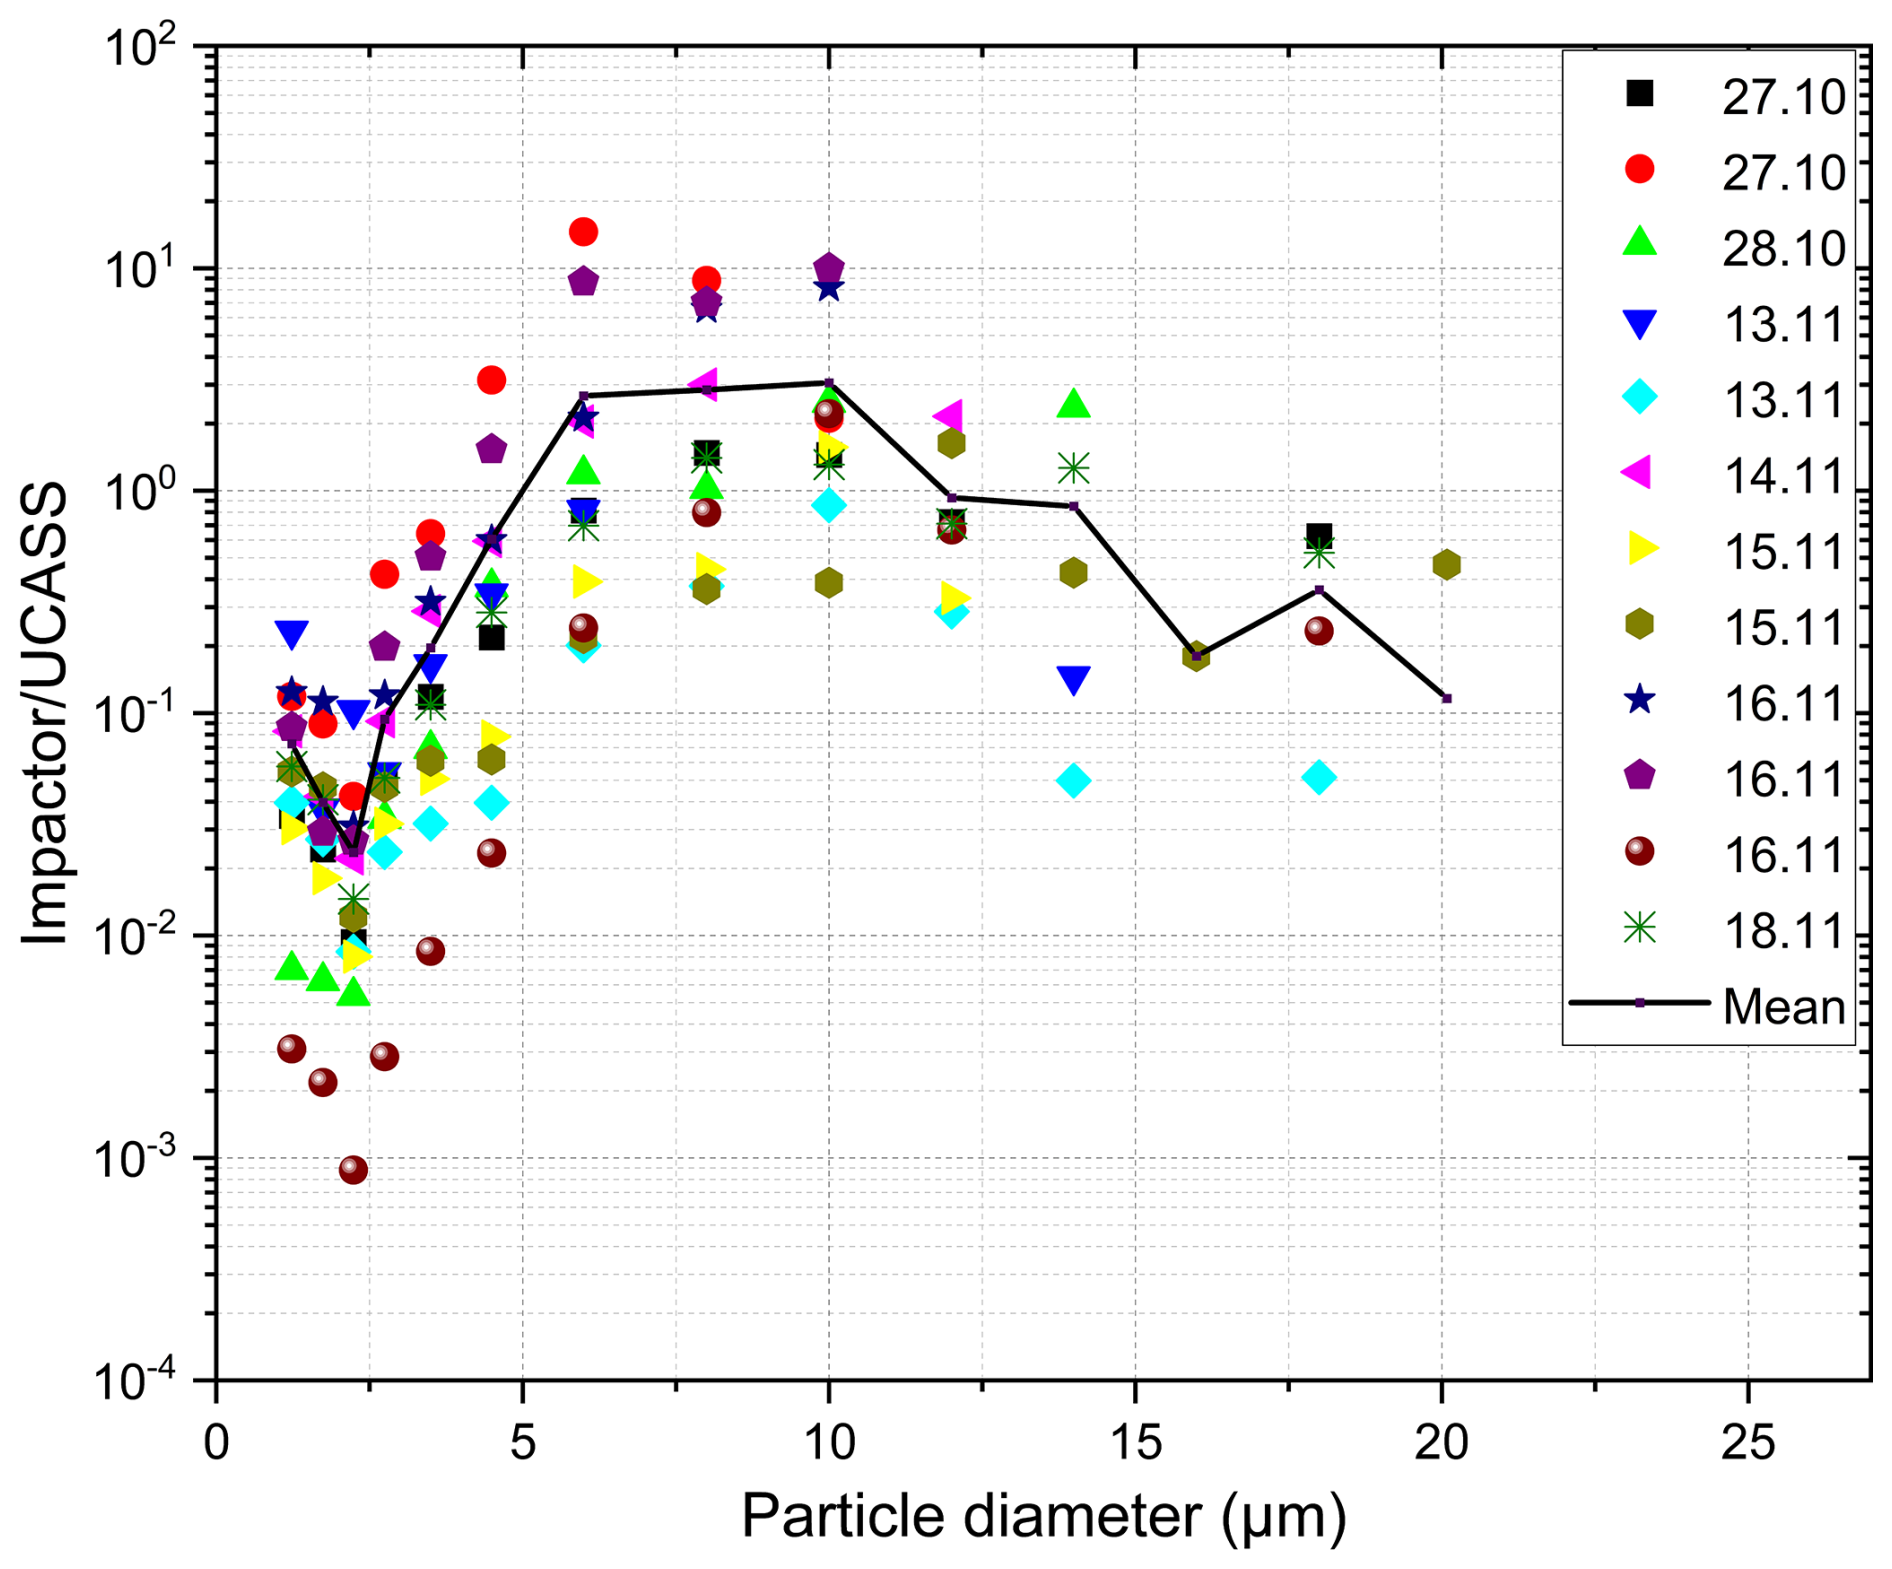
Figure 4The apparent collection efficiency of particles collected by GPaC relative to those measured by UCASS during dust events across the campaign period. Solid line represents the mean values.
Particle concentrations from the GPAC were determined based on the particle number per sample, sampling duration, and UAS airspeed. The total concentration for each sample was obtained by summing all values corresponding to the individual particles. Figure 4 shows the collection efficiency of particles collected by the GPaC relative to those measured by the UCASS during the campaign. The apparent collection efficiency for particle size at around 1 µm was found to be 0.1. A notable decrease in efficiency occurred at approximately 2.5 µm, corresponding to a slight artifact in the UCASS, as discussed in Sect. 2. The average collection efficiency increased to nearly 1 for particles sized between 4 and 14 µm. The efficiency decreased again to about 50 % for particles larger than 15 µm. The figure demonstrates the generally comparable values between the GPaC and the UCASS, indicating suitable performance of the methodology across the particle size range.
2.4.4 Single particle electron microscopy
Automated SEM analysis was performed on the collected samples using a FEI Quanta400F microscope (FEI, Eindhoven, The Netherlands). Non-carbonaceous particles were identified by their brighter backscatter electron signal relative to the carbon substrate and segmented from the background using image analysis (Kandler et al., 2018). For the present work, a total of 16 200 particles were analyzed. The particle sizes were calculated from the projected area visible in the electron microscope with a set of corrections outlined in Kandler et al., 2018.
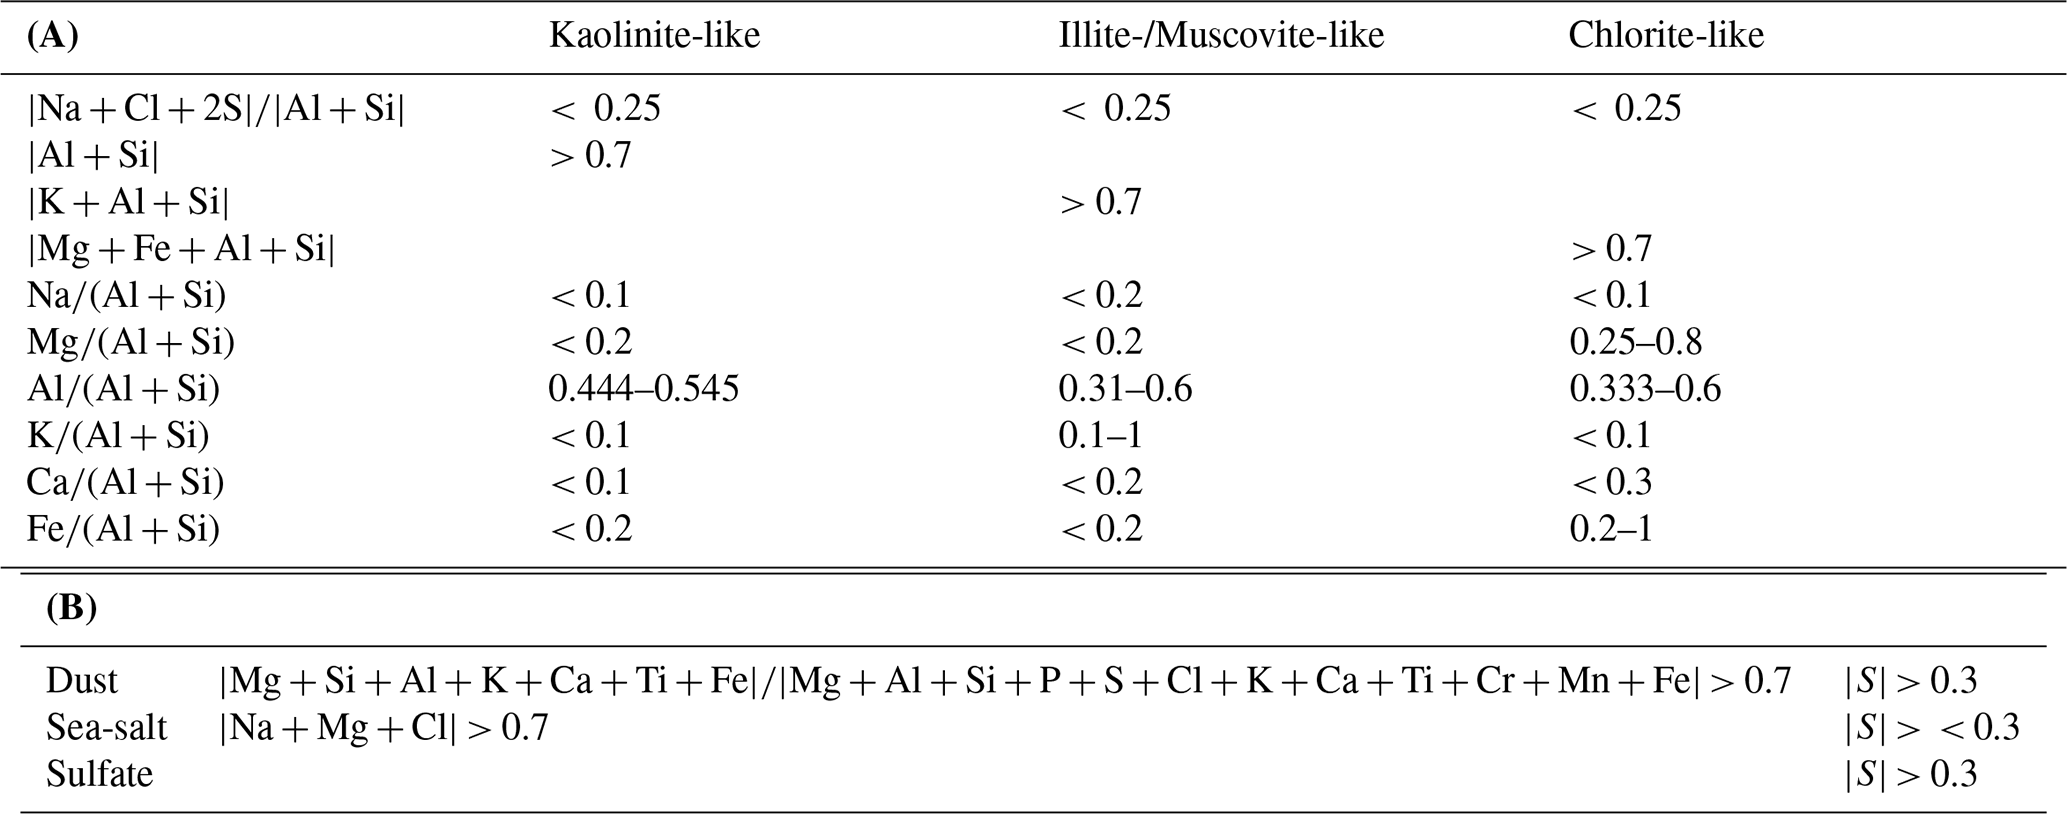
Based on chemical quantification, particles were classified into compositional groups. This study adopts the classification framework of Kandler et al. (2020), with an adaptation in the classification limits to ease an over-representation of kaolinite-like particles. All data shown are reprocessed with the new scheme (see Appendix A1). In addition, a simplified scheme was employed to distinguish dust from non-dust particles, using the combined concentrations of Ca, Si, Al, Ti, and Fe versus those of Na, Cl, and S. The specific classification criteria are provided in Table B1 in the appendix. It should be noted that SEM with Energy-Dispersive X-ray analysis yields elemental compositions rather than definitive mineralogical identifications; therefore, classified particles are referred to as “mineral-like.”
The central 95 % confidence intervals for the average sample composition and the number of particles per class were estimated by bootstrapping (DiCiccio and Efron, 1996; Virtanen et al., 2020). Data from previous campaigns used for comparison are available in public data repositories: Morocco (Panta et al., 2023), Tenerife (Waza et al., 2019), Barbados (Kandler et al., 2018), Tajikistan (Kandler et al., 2019a) and Svalbard (Kandler et al., 2019b).
2.5 Campaign Overview
The Cyprus Fall Campaign 2021 aimed to study the microphysical properties of mineral dust transported to Cyprus using airborne and ground-based observations. An intensive UAS campaign was conducted at the USRL private runway in Orounda from 18 October to 18 November 2021. The UAS were fitted with a suite of instruments dedicated to in-situ particle measurements, comprising two Optical Particle Counters (OPCs), two Compact Optical Backscatter Aerosol Detectors (COBALDs), and impactors designed for particle collection within dust layers. Continuous ground-based remote-sensing measurements, incorporating lidars, ceilometers, and sun-photometers, were performed at the CAO-AMX and CAO-Nicosia atmospheric stations and at the Cyprus Atmospheric Remote Sensing ACTRIS National Facility (CARO-LIM NF) of the ERATOSTHENES Centre of Excellent in Limassol.
Table 1Details on the conditions during the UAS flights of the Cyprus Fall Campaign 2021, including date (green colour: no dust observed with UASs, orange colour: dust observed with UASs), UAS Take-off Time (ToT), AOD during the flight from the sun-photometer in AMX, altitude range of dust layer from lidar, top of the Boundary Layer (BL) from the ceilometer in AMX, UAS flight ceiling altitude, dust elevated layer from the UAS flight, the source region of the observed UAS elevated dust layers. P stands for POPS and U for UCASS. All altitudes are given in
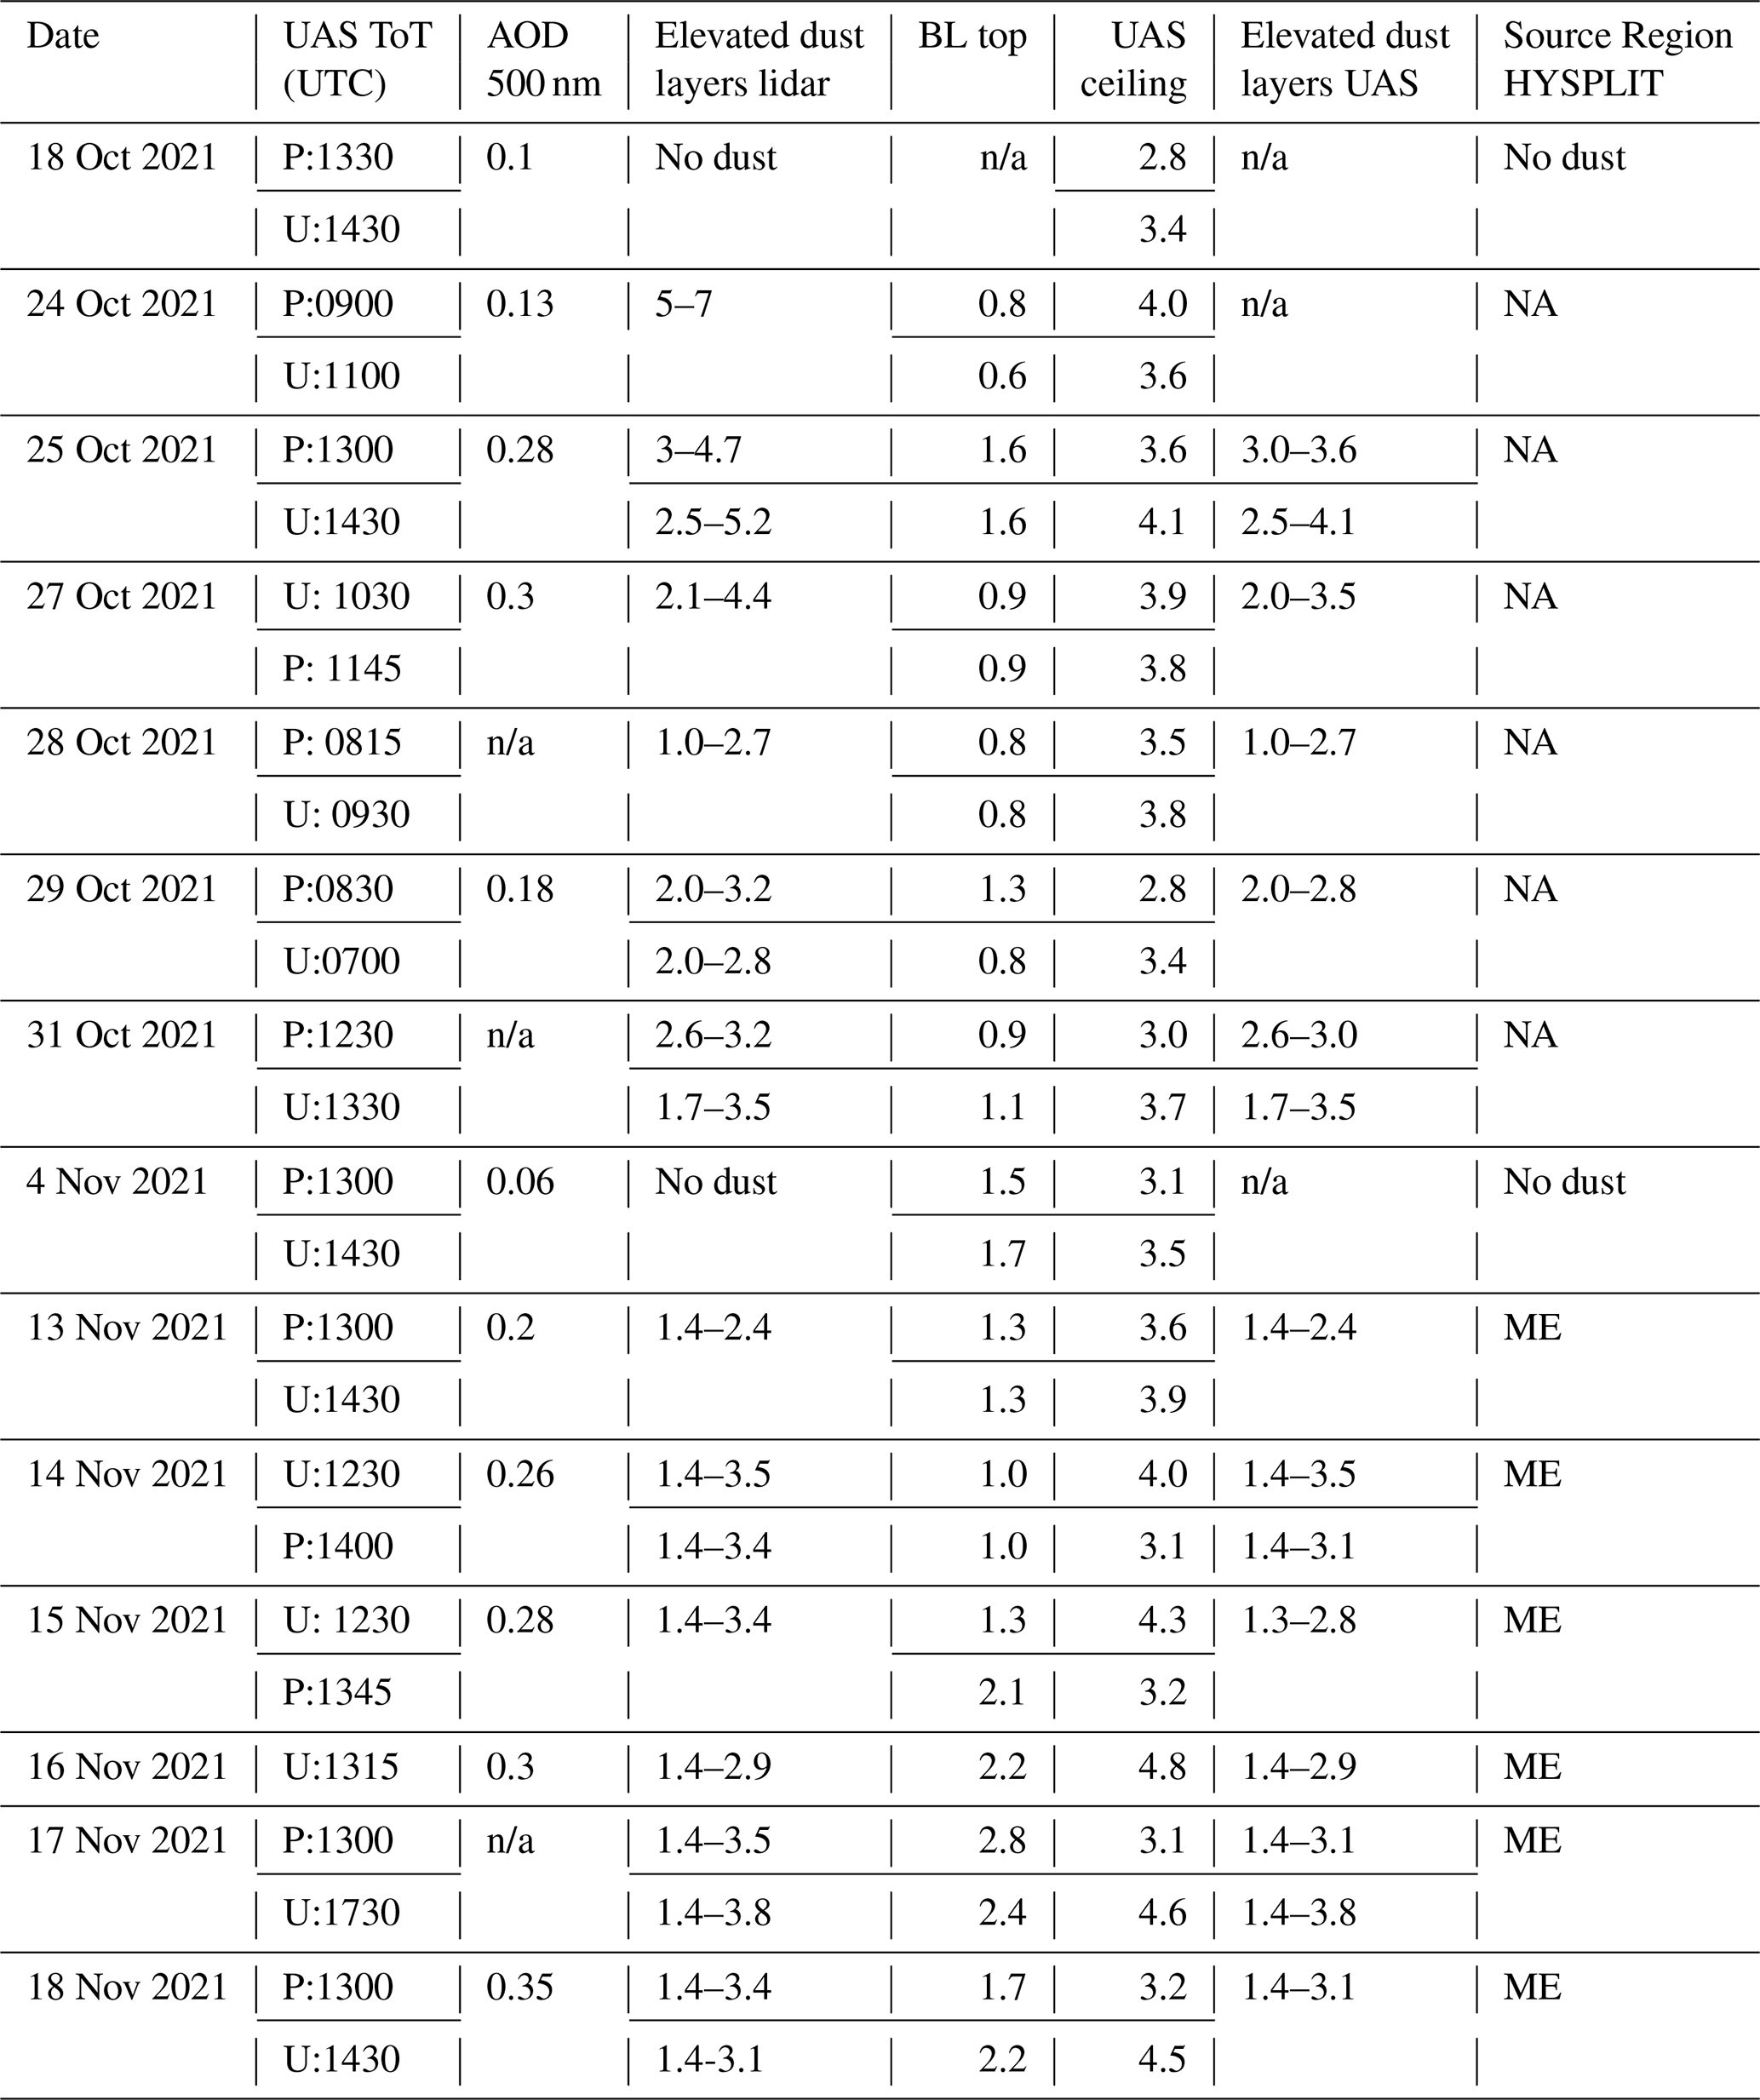
NA: North Africa; n/a: not available.
To identify dust events and effectively plan UAS flight operations, we utilised forecasts from several dust models, i.e. Copernicus Atmosphere Monitoring Service (CAMS) and SKIRON (Inness et al., 2019; Nickovic et al., 2001), complemented by real-time observations from ground-based remote-sensing instruments described in Sect. 2.1. Two distinct dust events were identified. The first event occurring between 25 October and 1 November, with daily-averaged columnar AODs observed by the sun-photometer reaching up to 0.3, and air mass originated from NA as determined by the Hybrid Single-Particle Lagrangian Integrated Trajectory model (HYSPLIT; Stein et al., 2015). The second event occurred between 13 and 18 November and the primary source of air masses was traced back to the ME or Levant region. Height-resolved particle size distributions and concentrations, as well as backscatter signals for each dust event were captured using daily UAS-based OPCs and continuous ground-based lidar observations. These instruments provided detailed information on the evolution of aerosol properties throughout the atmospheric column.
Table 1 presents an overview of the UAS flights conducted during the campaign, detailing the conditions and observed dust layers as reported by the full suite of airborne and ground-based instruments deployed. This includes the take-off time (ToT) of the UAS, the AOD during the flight from the AMX sun-photometer. In addition, it provides information on the elevated dust layers captured by the UAS and their source region retrieved from back trajectories over Orounda. The predominant origin of air masses during the dusty days is distinguished between the two deserts, NA and ME.
3.1 Remote Sensing Observations
Figure 5 shows the daily averaged AODs (Level-2) measured by the sun-photometers at the CAO-Nicosia and CAO-AMX stations, alongside the corresponding UAS flying days, indicated with the icon of an aircraft. A gradual increase in AOD is observed from 24 October showing the arrival of the dust plume. The daily averaged AODs over AMX and Nicosia remained relatively stable, staying above 0.15 from 24 October to 1 November. AODs at AMX decreased to below 0.1 from 2 to 10 November, while slightly larger values were observed by the Nicosia sun-photometer during this period, which can be explained by local sources. A gradual increase in AODs is noted at both stations from 11 November onwards. The highest values of daily-averaged AODs, approximately 0.42 and 0.40 were recorded on 17 and 19 November over Nicosia, and 0.35 over AMX.
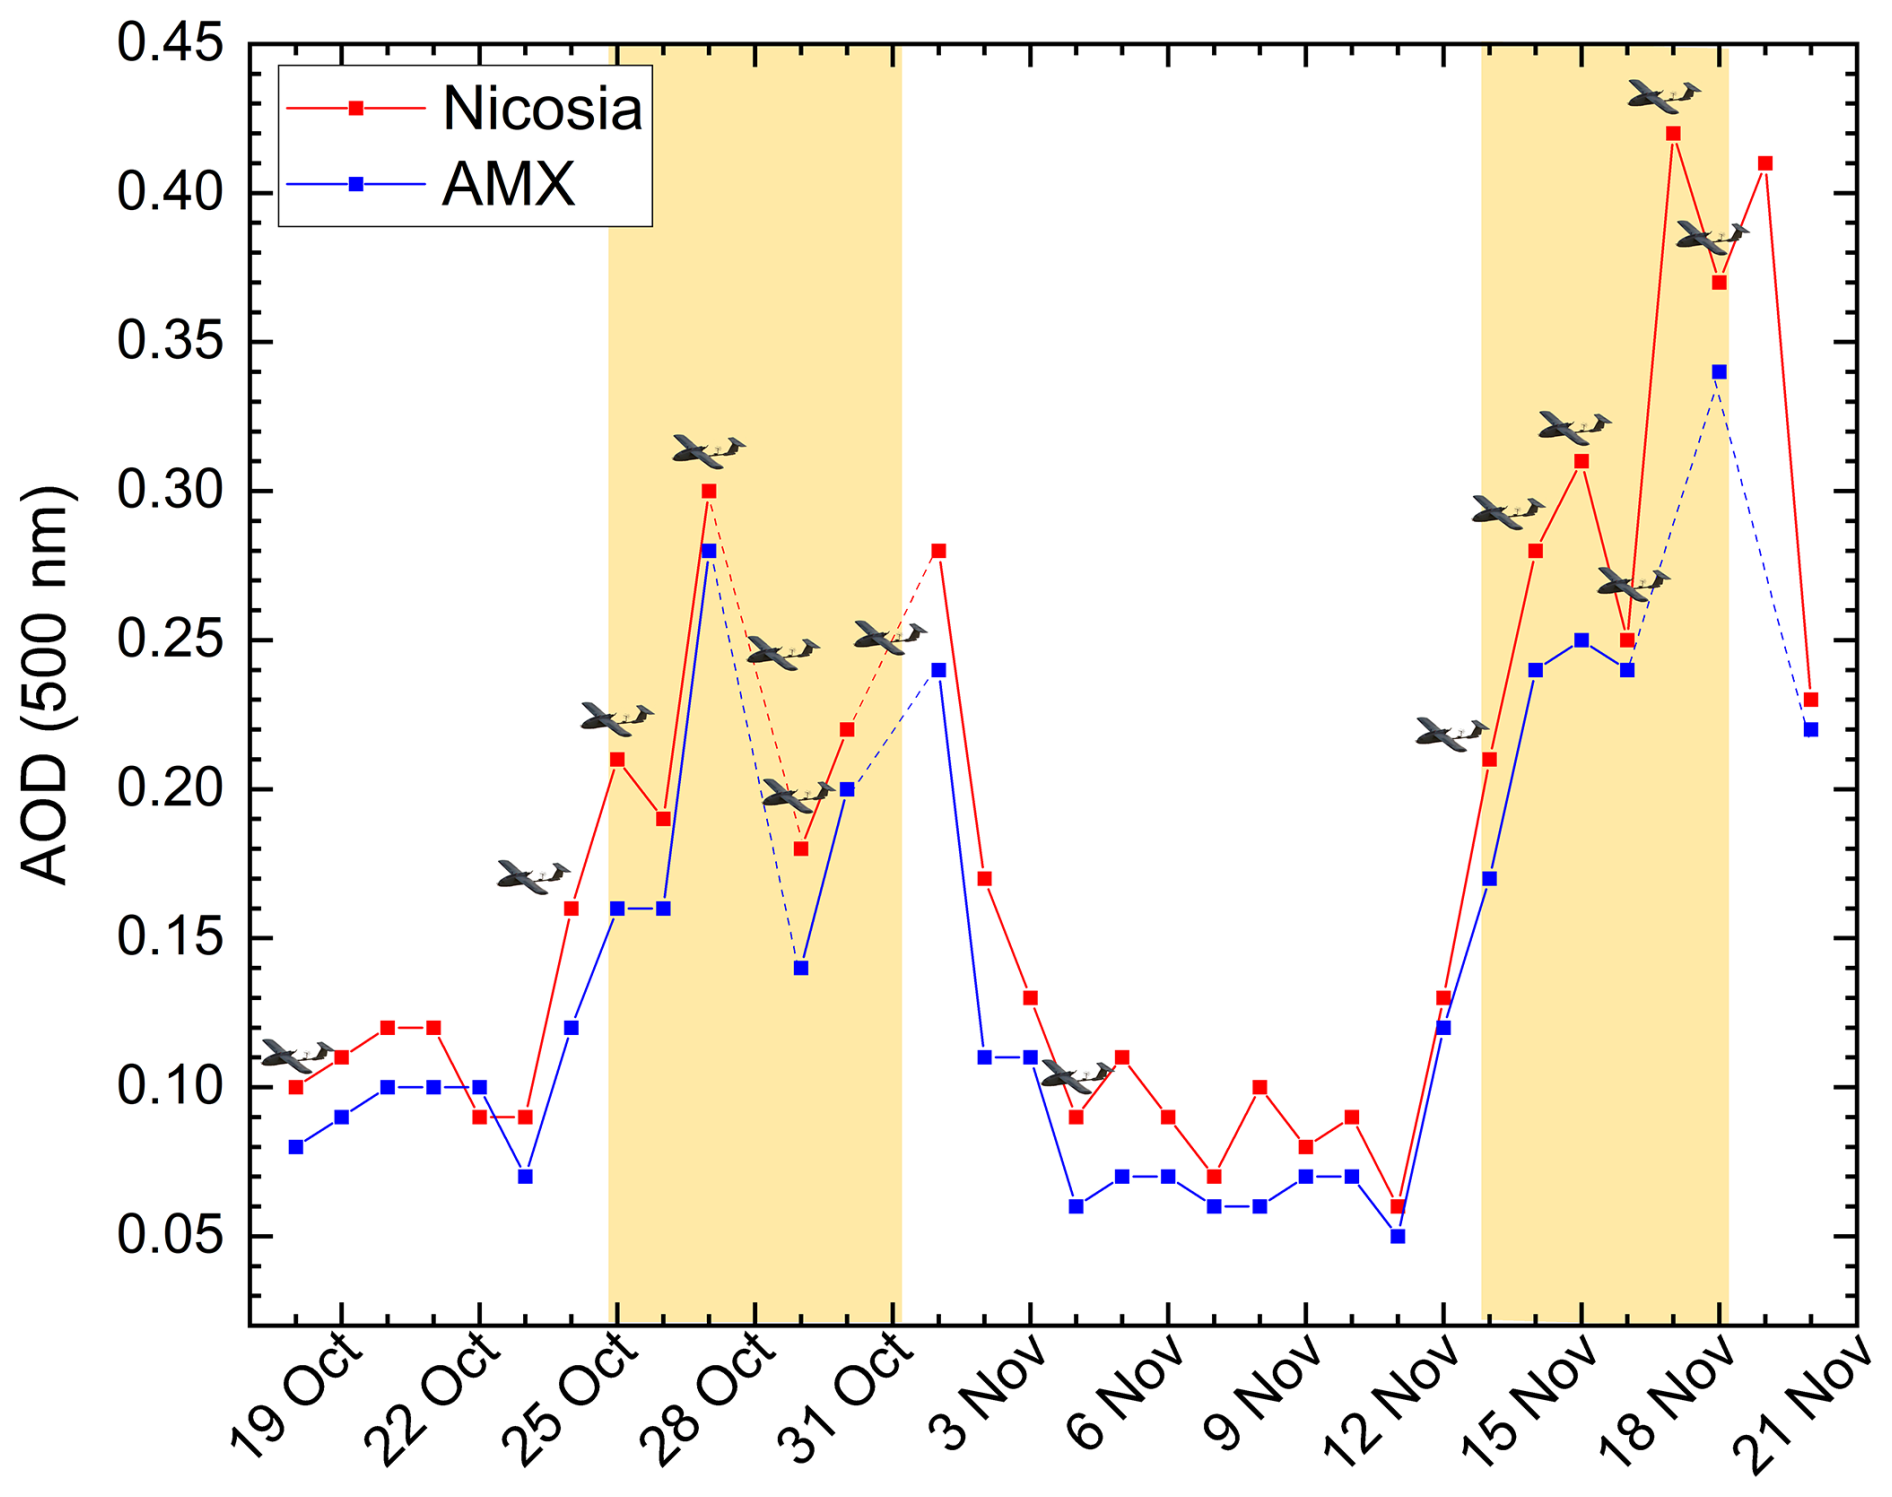
Figure 5Overview of daily-averaged AOD at Agia Marina Xyliatou (AMX) and Nicosia during the 1-month campaign period from 18 October to 18 November 2021, obtained from AERONET sun-photometer observations. Flying days are indicated with the image of an airplane. Yellow-shaded area indicates the dust event period where UAS flights were performed. Dashed lines indicate absence of data for a specific day.
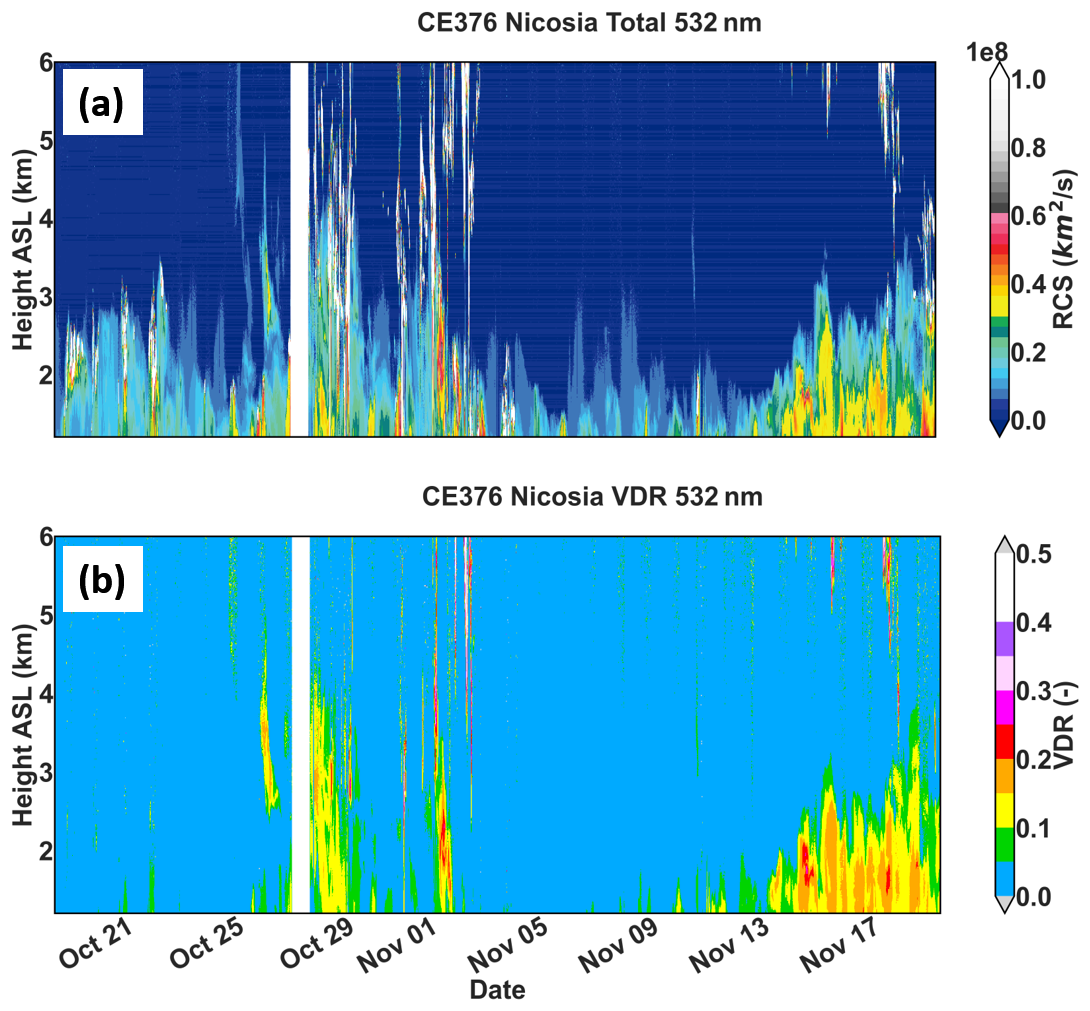
Figure 6Time evolution of the range-corrected signal of the 532 nm Total (a) and volume depolarization ratio (b) from the lidar in Nicosia during the Fall Campaign period. Profiles are shown above the overlap region of the lidar. Clouds have a large RCS and therefore shown in grey-white colour in panel (a). A gap on the data is seen between 14:00 UTC on 26 October and 05:00 UTC on 27 October due to technical issues.
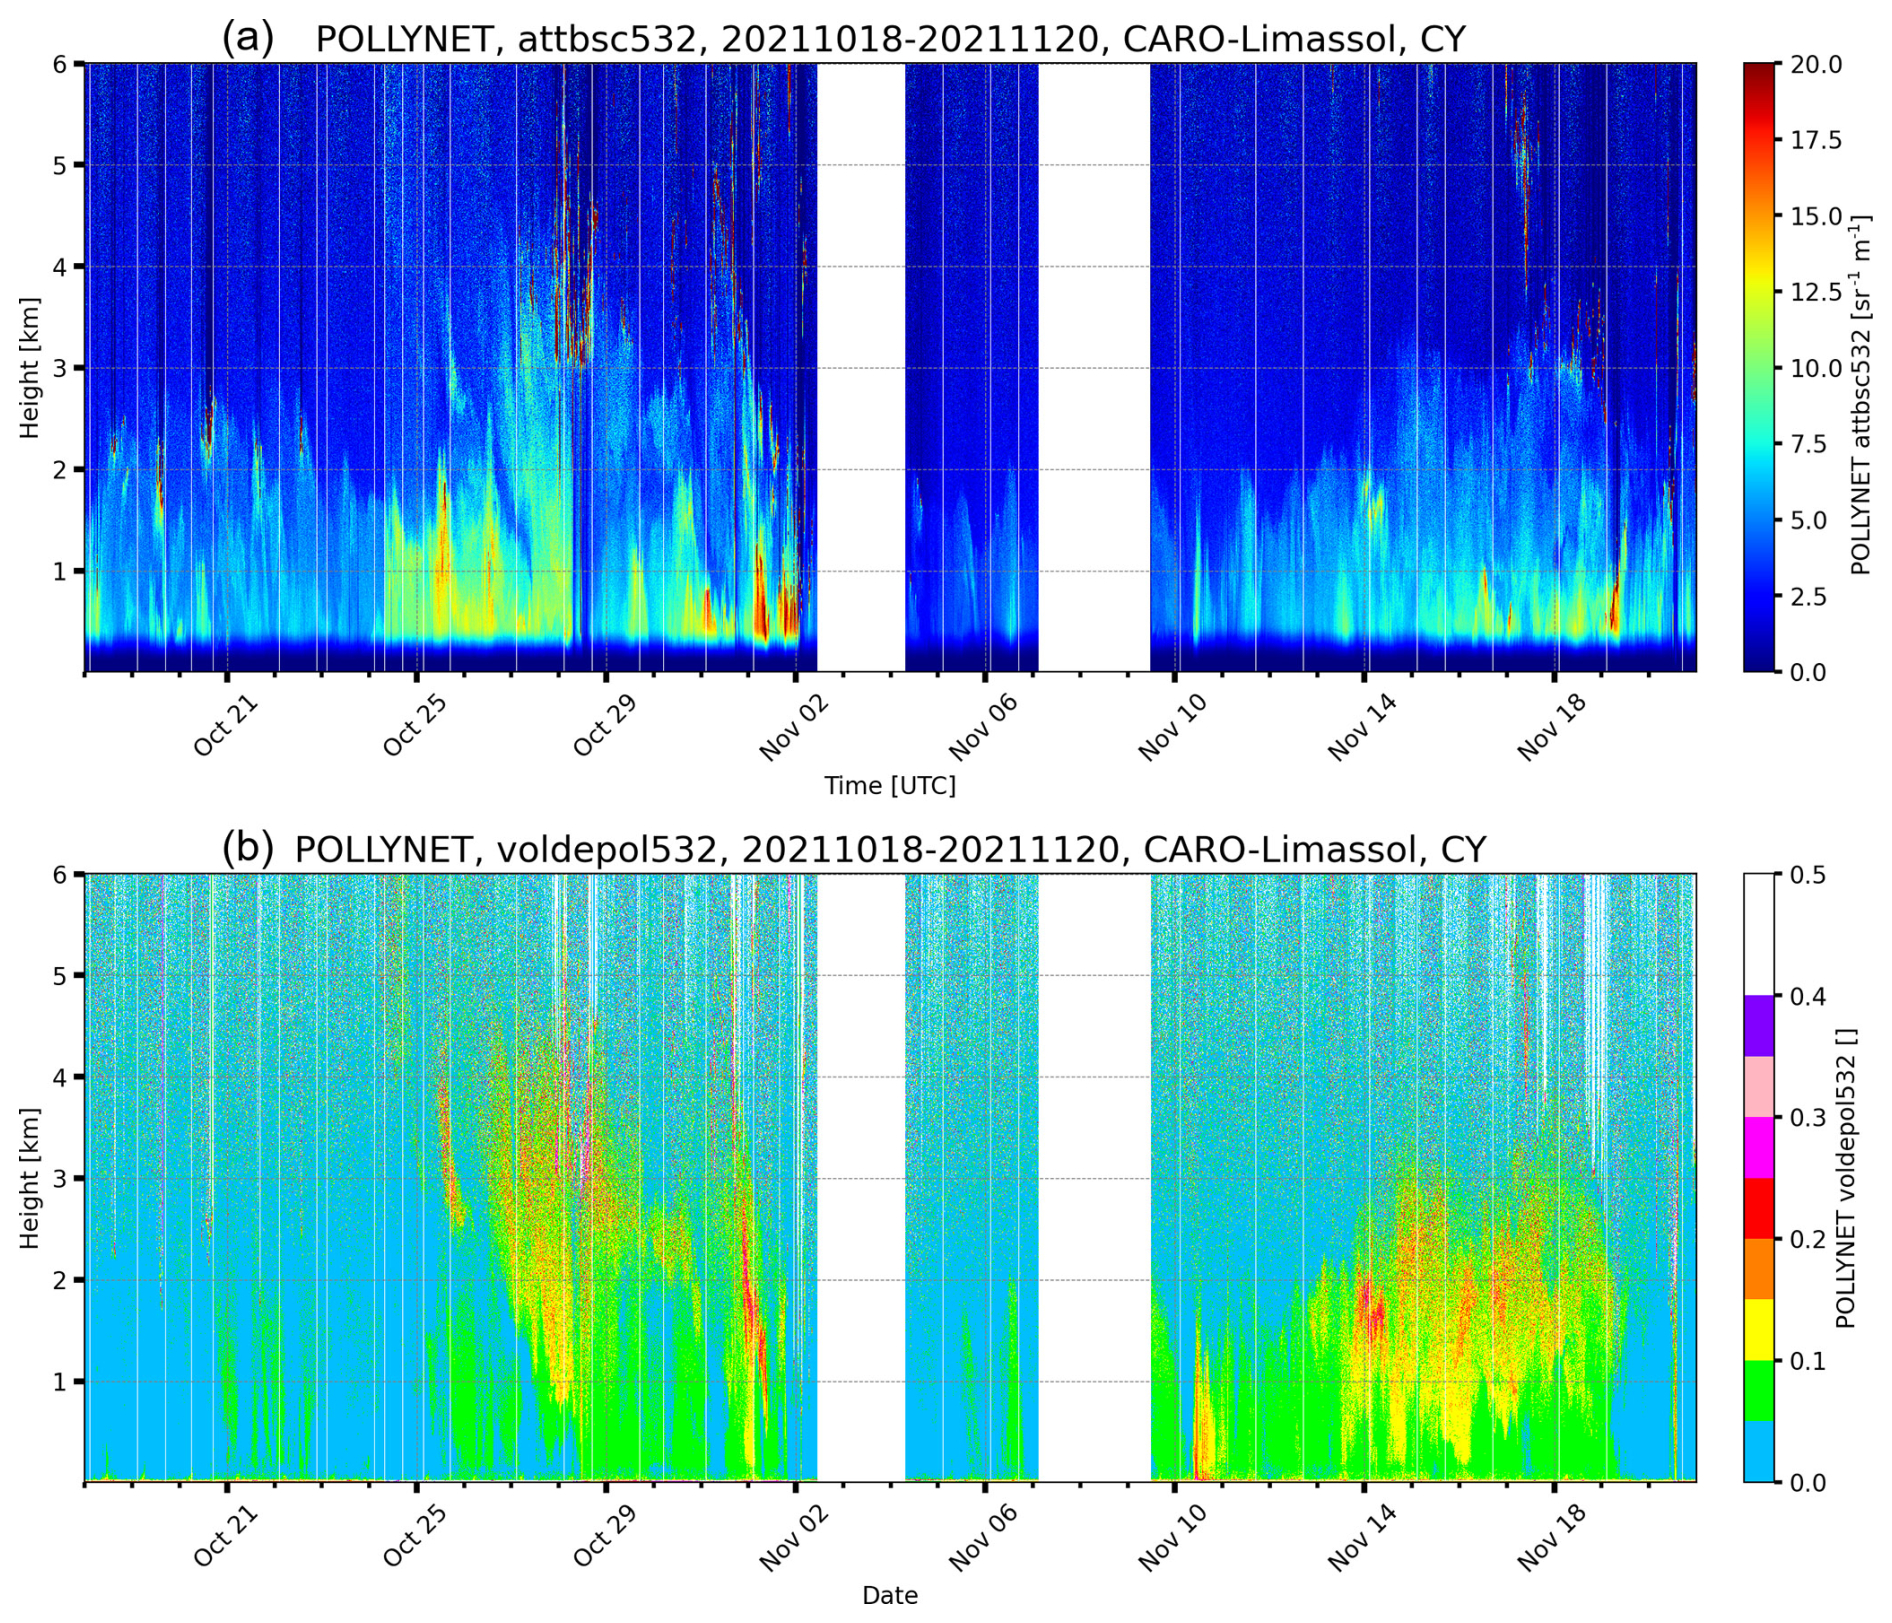
Figure 7Time evolution of the attenuated backscatter of the 532 nm Total (a) and volume depolarization ratio (b) from the PollyXT-CYP lidar of CARO-LIM NF in Limassol, during the Fall Campaign period. Profiles are shown above the overlap region of the lidar. A gap on the data is seen between 3 and 4, and 7 and 9 November 2021 due to technical issues.
Figure 6 presents a comprehensive overview of the vertical structure of aerosol layers over Nicosia from the lidar measurements between 18 October and 19 November 2021. This is derived from the height-resolved observations of the Range Corrected Signal (RCS) in the green channel and volume depolarization ratio recorded by the CE376 Cimel aerosol lidar. The first days of the campaign were characterised by minimal dust presence, as evidenced by the observed Volume Depolarization Ratio (VDR) levels consistently below 0.05. This suggests that the increased backscatter signal within a range of 3 from 18 to 25 October is likely attributed to local pollution within the boundary layer. Similar atmospheric conditions were observed by the PollyXT lidar in Limassol (Fig. 7).
The first dust intrusion, classified as moderate, persisted for about one week between 26 October and 2 November, observed simultaneously at both sites. Thin layers of dust were detected by both lidars on 25 and 26 October, coinciding with an increase in the VDR to 0.2 in the height layer between 2.5 and 4 By 27 and 28 October, the depolarising layer extended from surface to 4.2 , as shown in Figs. 6b and 7b. The VDR peaked at 0.2 on the last day of the event (2 November) at 2.3 Starting from 2 November, dust-free conditions prevailed again, with observed VDR levels dropping below 0.05, which is an indication that the backscatter signal up to 2 km is associated with local pollution (Illingworth et al., 2014).
The second dust event started with faint traces on 13 November 2021, followed by the main plume's arrival between 1 and 3 km altitude ASL on 14 November. The lidar shows a homogeneous dust layer in the volume depolarisation ratio, fluctuating between 0.15 and 0.2 from 13th to 18 November and with variable layer top between 2 and 4 km. This event was characterised by greater homogeneity in the vertical structure and higher VDR and AOD compared to the first dust event.
3.2 Airborne observations – OPCs
During the first dust event, the initial traces of the dust plume were detected from the lidar between 5 and 7 km altitude ASL, in the morning of 24 October (Fig. 6). However, the ceiling altitude of the UAS flights that day were limited to 4 km, owing to battery limitations, thereby preventing the observation of the dust layers. Throughout the first dust event, UAS flights intersected the elevated dust layer, as confirmed by lidar observations, on four occasions: 25, 27, 29, and 31 October. These instances coincided with air masses originating from NA. As shown in Fig. 6 and Table 1, during the second dust event, the elevated dust layers ranged between 1.4 and 3.8 km altitude ASL, all of which were effectively captured by the UAS observations.
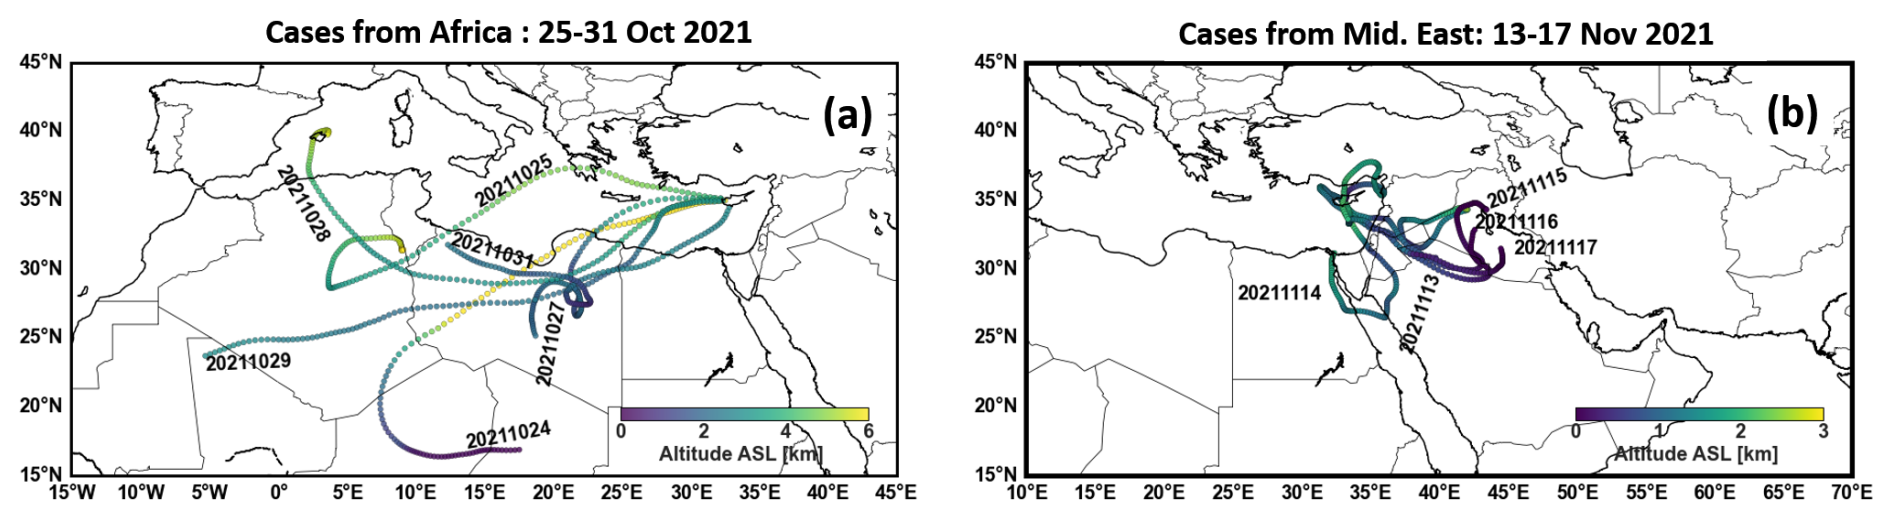
Figure 8The 120 h HYSPLIT backward trajectories starting over Orounda from the elevated dust layers observed at the ToT of the UAS and shown in Table 1 during the Cyprus Fall Campaign 2021. Colour coding refers to the height of the trajectories. The dates in the plot depict the arrival date of the air mass over the island at the arrival height corresponding to the dates given in Table 1.
Figure 8 shows the 120 h backward trajectories of air masses arriving at the elevated dust layers observed over Orounda, corresponding to the specific UAS flight times noted in Table 1. The trajectories associated with the first dust event indicate that these air parcels originated from dust-source regions in North and Central Africa. Subsequently, they traversed the Mediterranean and arrived in Cyprus in a span of 3 d. The trajectories linked to the second dust event reveal that these air parcels originated from dust sources within the ME basin, particularly from counties such as Iraq, Syria, and Jordan. It appears that these air masses were initially uplifted from near ground level and then advected, reaching Cyprus at altitudes ranging between 1.5 and 2.8
Figure 9 shows the vertical profiles of aerosol volume concentration for the fine- and coarse-mode throughout the campaign. Elevated concentrations are observed on nearly all sampling days, highlighting the persistent influence of dust during the study period. In the fine-mode, concentrations are generally highest within the lower 1–2 km and decrease with altitude, indicating strong near-surface contributions and progressive dilution aloft. Several cases (e.g., 18 November) exhibit enhanced fine-mode concentrations extending above 2 km, suggesting long-range transport of dust-laden air masses. In contrast, 4 November displays comparatively lower fine-mode concentrations throughout the atmospheric column, consistent with the absence of dust on that date.
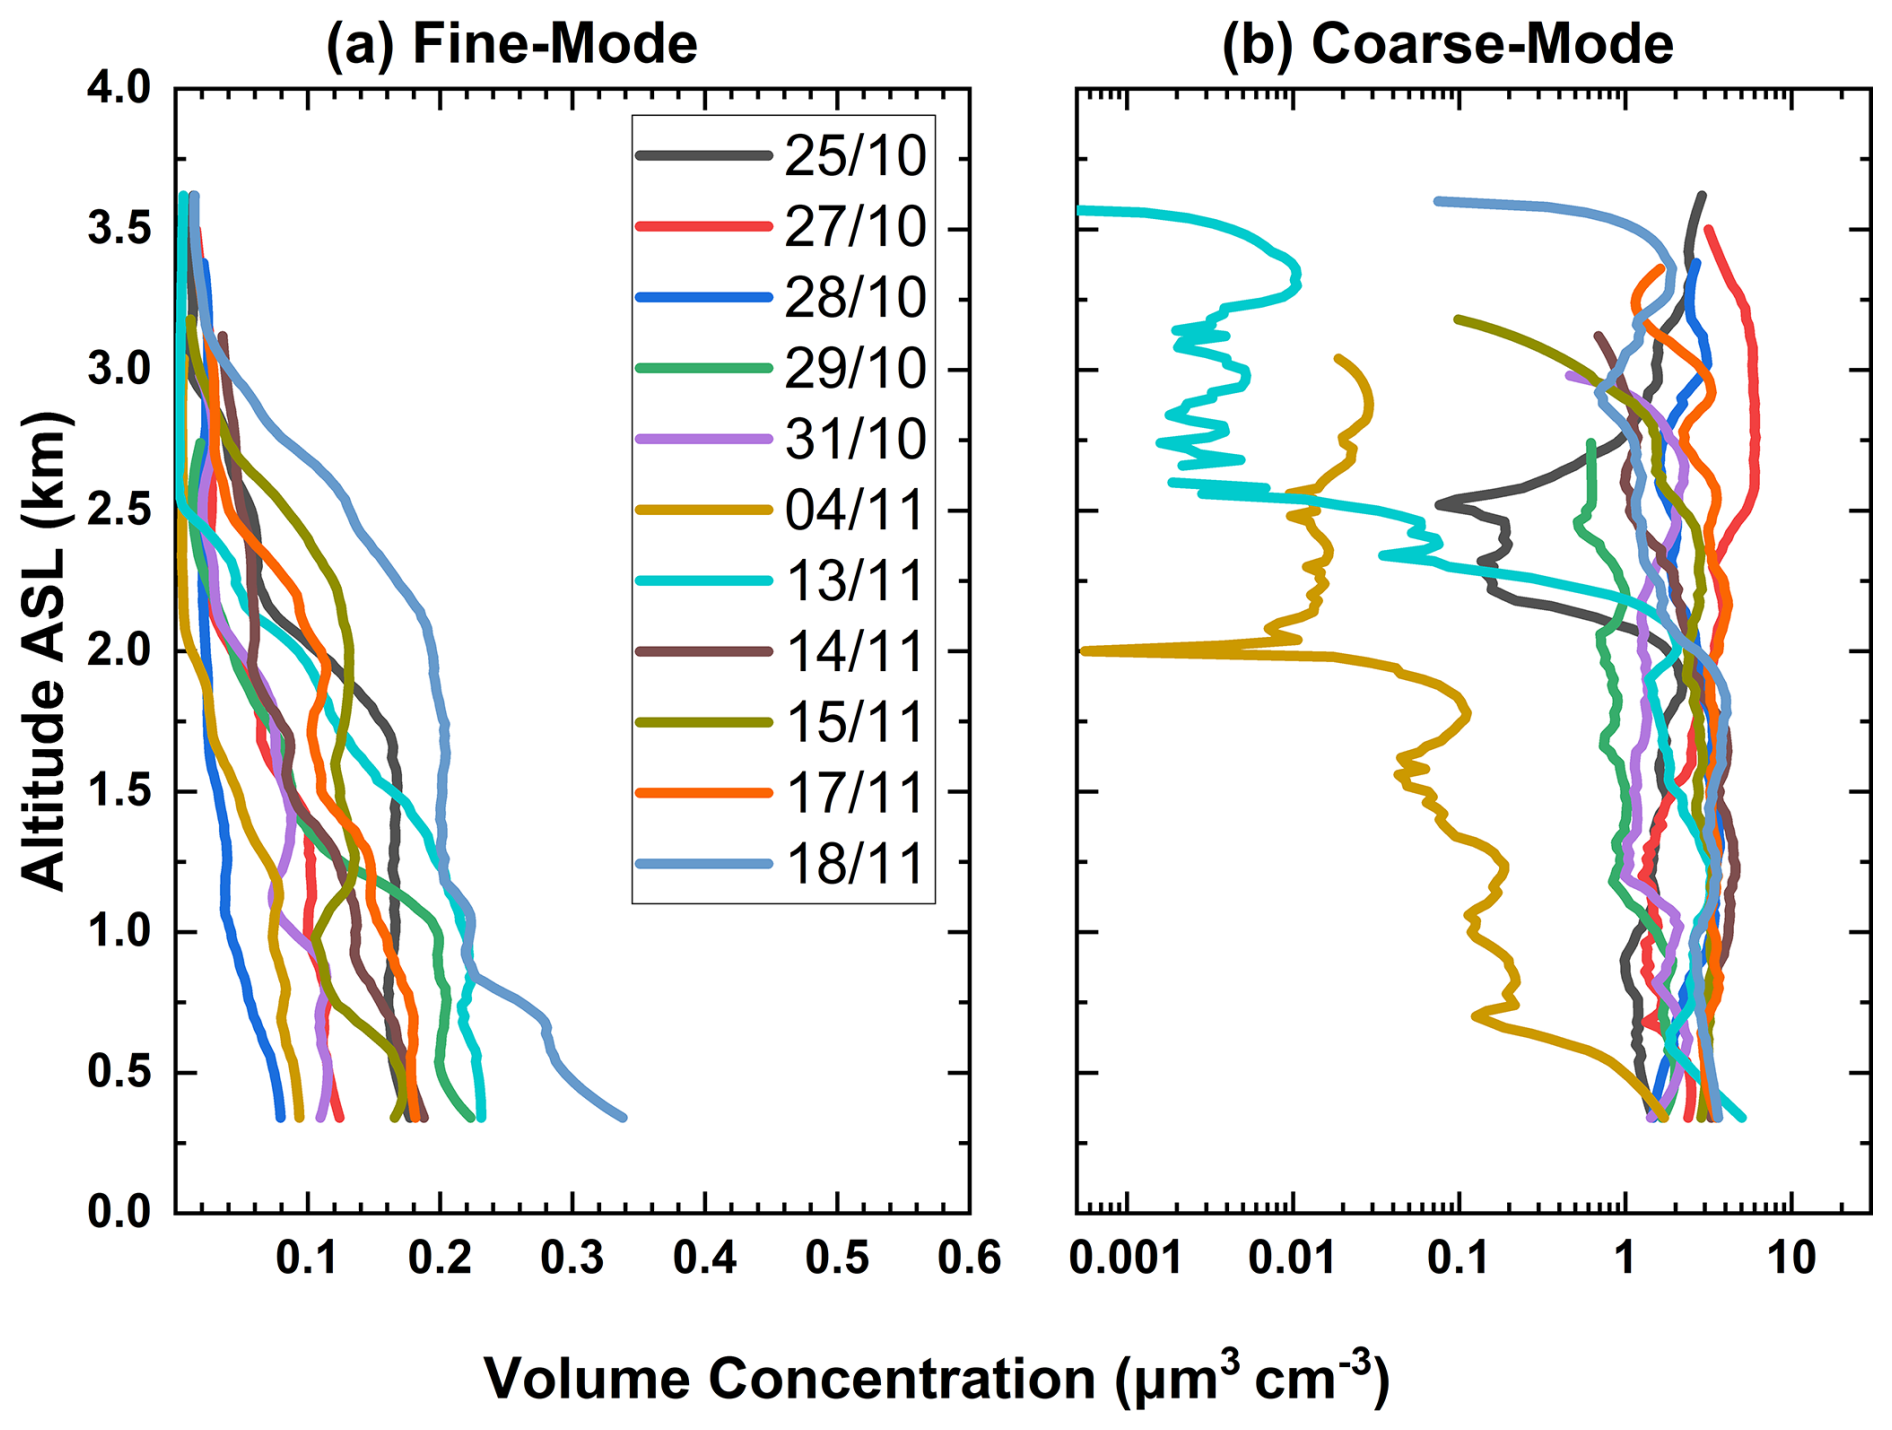
Figure 9Vertical profiles of fine-mode (a) and coarse-mode (b) aerosol volume concentration during the campaign.
The coarse mode exhibits a more pronounced dust signature. With the exception of 4 November, coarse-mode concentrations are substantially elevated, particularly below approximately 2 km, confirming the prevalence of dust particles on nearly all observation days. Several profiles show distinct maxima between approximately 1 and 3 km, indicative of long-range transport of dust particles. The strongest enhancements reveal coarse-mode concentrations exceeding 1 µm3 cm−3 and reaching up to approximately 10 µm3 cm−3 at certain altitudes during most of the cases. Conversely, 4 November exhibits markedly reduced coarse concentrations across the atmospheric column, further corroborating the absence of dust influence. Although fine-mode particles are persistently present, they contribute less to the total aerosol volume compared to the coarse fraction, which is consistent with the typical dominance of mineral dust in the coarse size range.
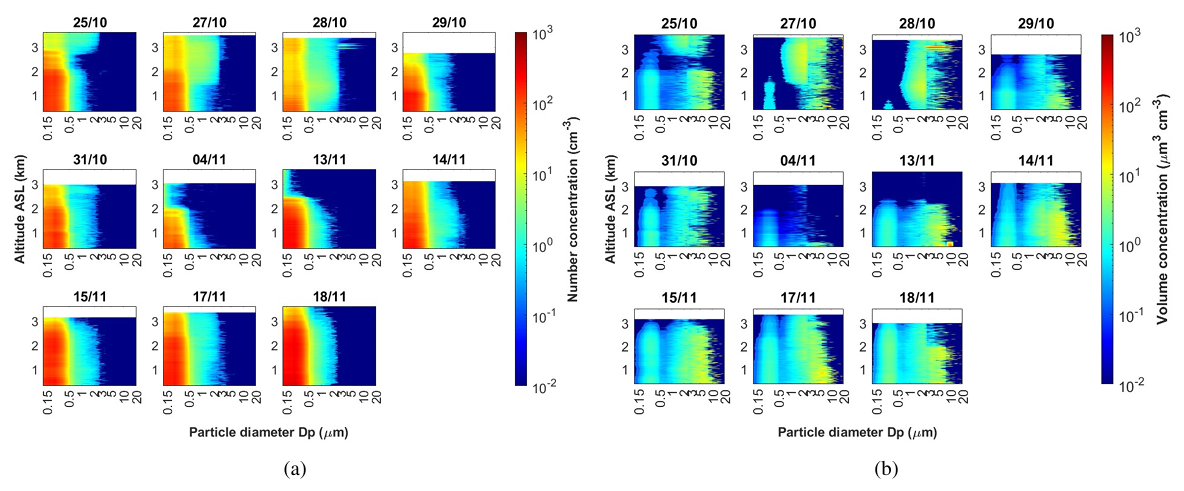
Figure 10Height-resolved particle number (a) and volume (b) size distributions for the campaign period, covering common altitudes obtained by both POPS and UCASS flights.
Figure 10a shows height-resolved particle number size distributions for the campaign period, covering common altitudes obtained by both POPS and UCASS flights. Across most days, enhanced number concentrations (102–103 cm−3) are consistently observed at small particle diameters (Dp≤ 0.5 µm), particularly below 1.5–2 Elevated concentrations frequently extend up to 2.5–3 km during strong dust episodes (e.g., 25 October, 27 October, 14 November, 15 November, and 18 November), indicating well-developed dust layers. In contrast, larger diameters (Dp≥ 2–3 µm) exhibit substantially lower number concentrations (≤ 1–10 cm−3), with sporadic enhancements mainly confined below ∼ 2 km. Day-to-day variability is evident in both vertical extent and intensity. For instance, on 13 November a pronounced elevated layer is visible between 1 and 2.5 km, characterized by high number concentrations in the submicron range, while 4 November shows a comparatively shallower and weaker structure. In several cases (e.g., 28 October and 17 November), enhanced concentrations extend nearly uniformly from the surface to 3 km, suggesting vertically homogeneous dust conditions.
Figure 10b shows the corresponding height-resolved particle volume size distributions for the same dates and altitude range as Fig. 10a. In contrast to the number distributions, the volume concentrations (10−2–103 µm3 cm−3) are strongly dominated by coarse particles (Dp≳ 1–2 µm), with peak intensities typically occurring between ∼ 2 and 10 µm. Pronounced dust layers are evident on several days (27 October, 14 November, 15 November and 18 November), where high volume concentrations (101–102 µm3 cm−3) extend from the surface up to ∼ 2.5–3 , indicating substantial coarse-mode dust loading throughout the lower troposphere. On some cases (e.g., 13 November), the volume maximum is found in an elevated layer between ∼ 1 and 2 km, consistent with lofted dust transport above a comparatively cleaner near-surface layer. Conversely, the dust-free case on 4 November exhibits lower overall volume concentrations and reduced vertical extent. A slight vertical discontinuity is visible in the aerosol profiles at approximately 2–3 µm, which corresponds to the merging diameter between the two OPC instruments. This artifact arises from the integration of independent OPC measurements and does not represent a physical change in atmospheric layering.
The strong contrast between the number and volume distributions highlights the characteristic signature of mineral dust, where although fine particles dominate in number, the coarse fraction governs the aerosol volume and thus the mass. Together, these height-resolved observations demonstrate the temporal variability and vertical structure of mineral dust intrusions during the campaign period.
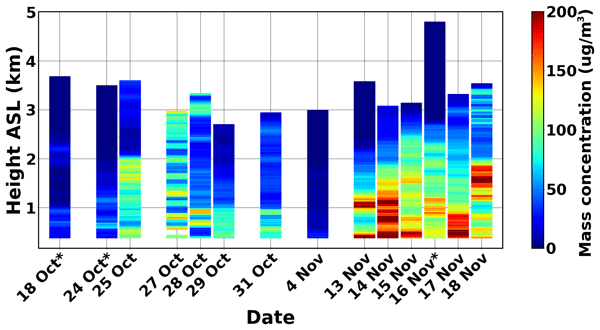
Figure 11 shows the vertical structure of mass concentrations derived from combined OPC observations during the campaign. The profiles are characterised by similar structure as the lidar overview (Fig. 6). During 18 and 24 October, calculated mass concentrations remained below 50 µg m−3 along the flying height column. On 25 October, mass concentration increased up to 150 µg m−3 from ground up to 2 , extending to 3 by 27 October.
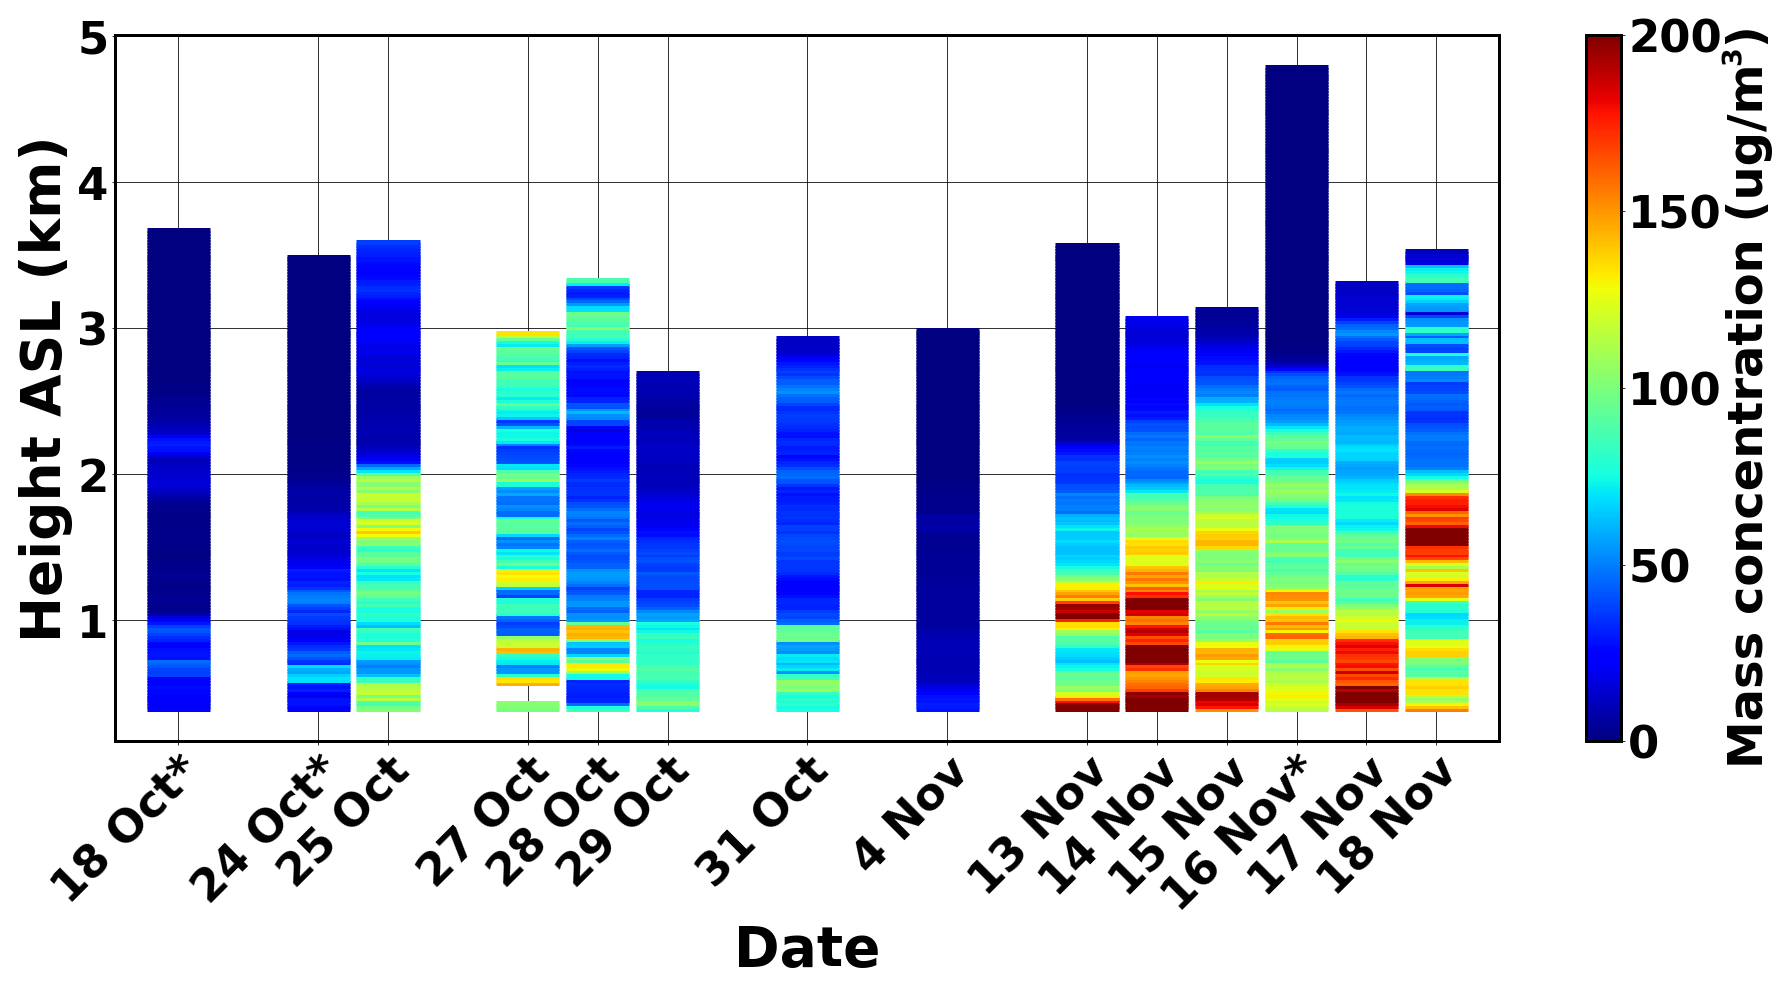
Figure 11Mass concentration profiles derived from UAS-OPC observations during the campaign period. Asterisks (∗) denote profiles calculated exclusively from UCASS observations, as no POPS measurements were conducted on those days.
On 27 October 2021, two layers of mass concentration up to 150 µg m−3 were observed. The first layer was found at 0.5 , and the second between 2.5 and 3 , which was dominated by coarse-mode particles larger than 3.4 µm.
On 28 October, an aerosol layer of particles smaller than 3.4 µm and mass up to 40 µg m−3 was found between 3 and 3.5 , whereas this layer was gradually descended to lower altitudes along with an increase on the concentration of small particles up to 80 µg m−3 in the following days. On 4 November, the atmosphere was aerosol-free, with low concentration of particles smaller than 3.4 µm, and almost no particles larger than 3.4 µm.
From 14 to 18 November, the mass concentrations of particles smaller than 3.4 µm was ranging between 20 and 50 µg m−3 from ground up to 3 km, while mass concentration of coarser particles reached up to 180 µg m−3. Overall, the second event was characterised with higher concentration of coarse-mode particles than the first dust event.
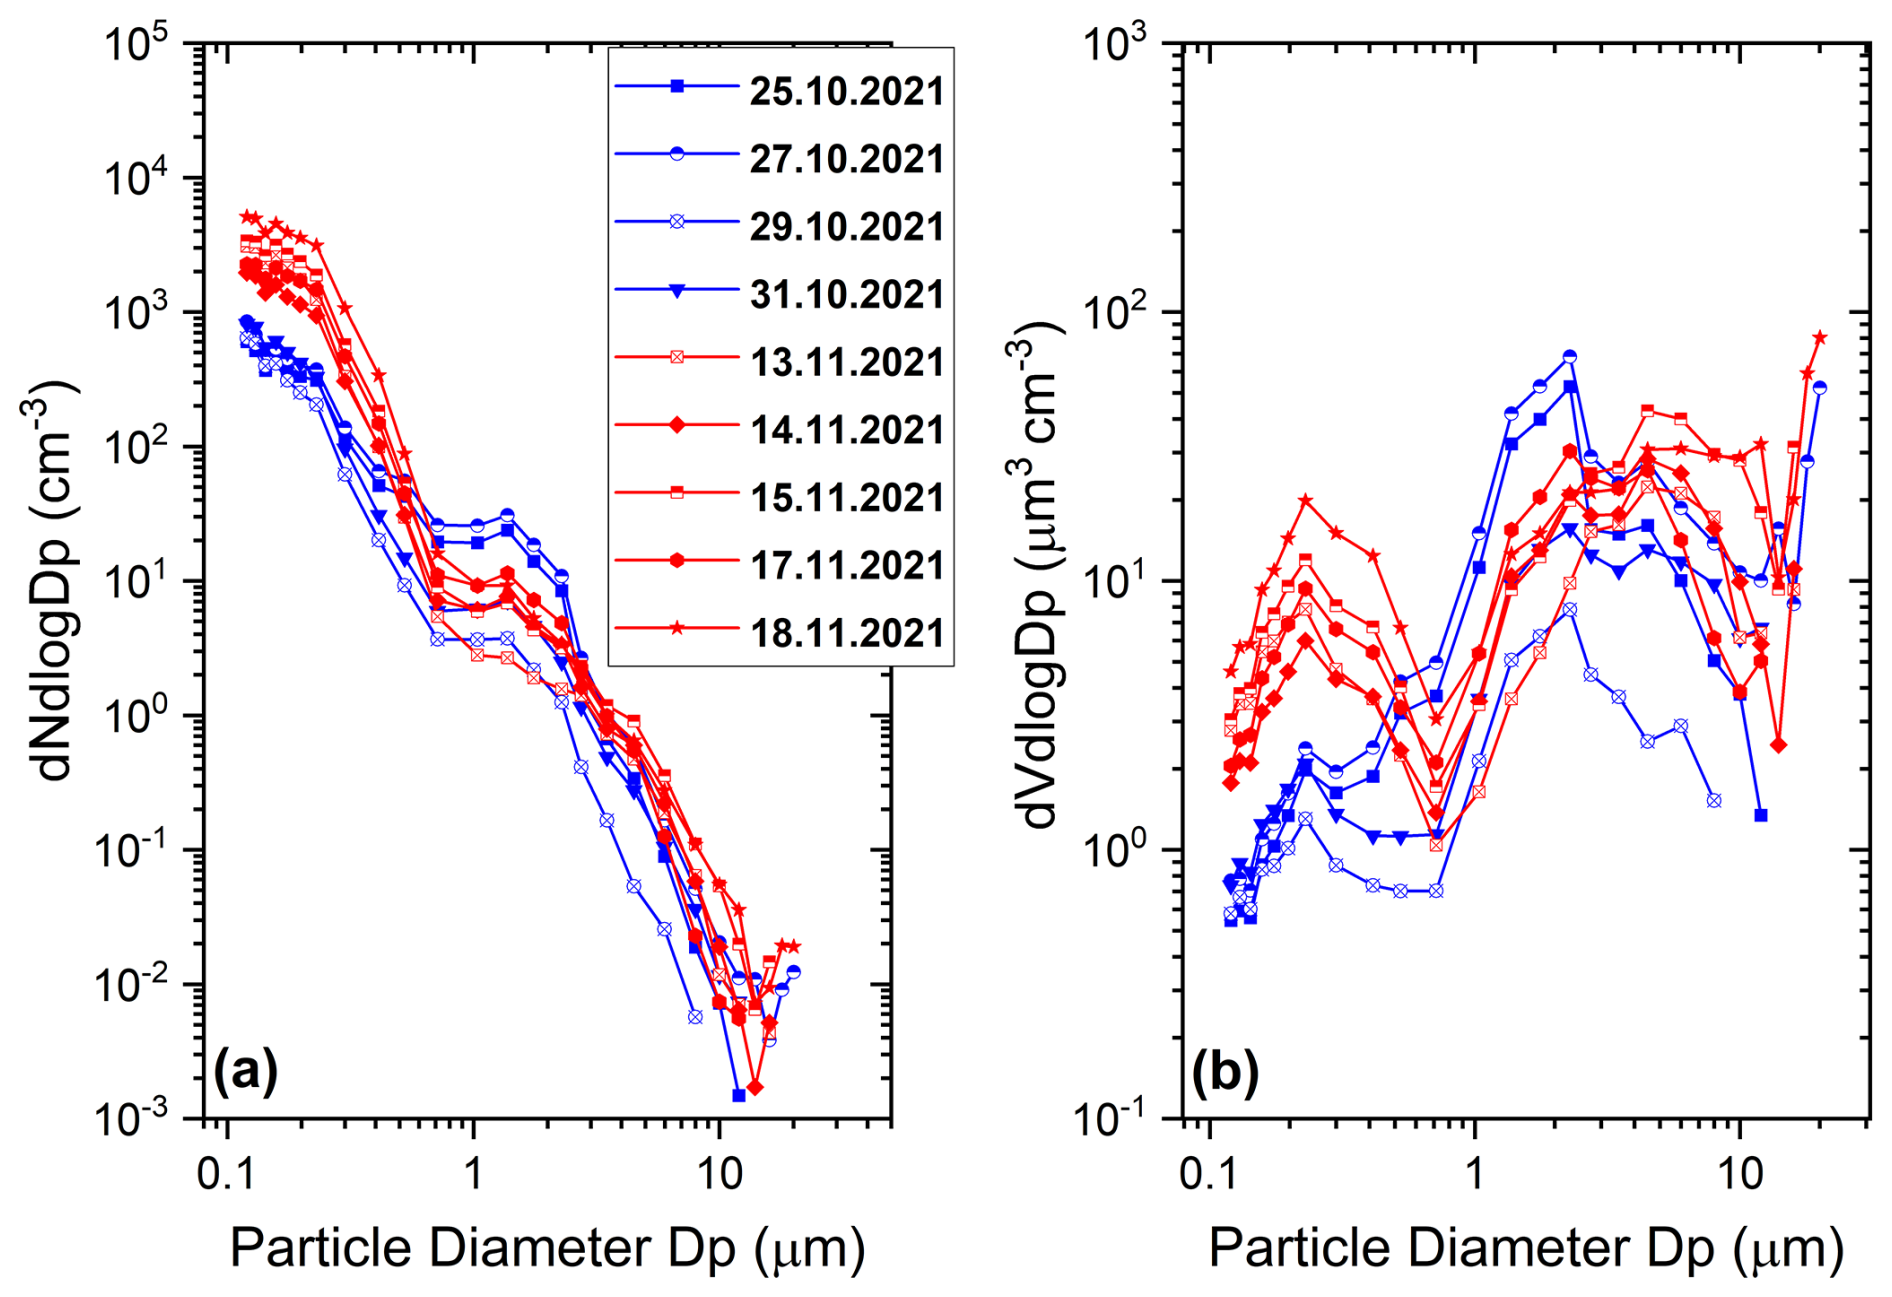
Figure 12Particle number and volume size distribution within the elevated dust layers shown in Table 1, as calculated by OPC flights during the campaign period. The blue lines represent measurements from the first dust event from NA, and red lines from the second dust event from ME.
Figure 12 shows the particle number (Fig. 12a) and volume (Fig. 12b) size distributions within elevated dust layers referenced in Table 1, measured during the campaign. The layers characterized by Relative Humidity exceeding 90% were intentionally excluded from these computations to minimize the influence of high relative humidity and cloud presence on the dust layers.
Overall, the particle number size distributions exhibit similar patterns, but display distinct regional characteristics. A clear separation between fine and coarse particles is evident around 0.7 µm. The NA dust cases are characterized by lower concentrations in the fine fraction and a well-defined coarse-mode peak between approximately 1.5 and 3.0 µm. In contrast, the ME dust cases display higher fine-mode concentrations and a broader, more extended coarse mode reaching up to about 10 µm.
In cases of NA dust, a prominent peak is often observed in the coarse mode, typically between 1.5 and 3.0 µm in diameter. Conversely, in cases associated with dust episodes from the ME, a consistent feature is the presence of a minimum value in the volume size distribution at 0.7 µm. This specific value is indicative of a clear differentiation between the two modes, suggesting distinct fine and coarse aerosol components.
In the volume size distributions, the ME cases also exhibit a distinct minimum near 0.7 µm, marking the transition between fine and coarse particles. This minimum indicates the presence of two clearly separated dust size regimes, reflecting differences in source characteristics and transport history. The broader coarse-mode distribution in the ME dust indicates a wider range of particle sizes and potentially greater variability in source characteristics, whereas the narrower and more sharply peaked coarse mode in the NA dust points to a more uniform particle population and different source or transport influences. Some ME cases show an upward trend in the coarse tail up to 20 µm, potentially indicating contributions from large, near-source dust particles with minimal atmospheric processing (e.g., Ryder et al. (2013); Weinzierl et al. (2017); Denjean et al. (2016), a feature less evident in the more NA cases.
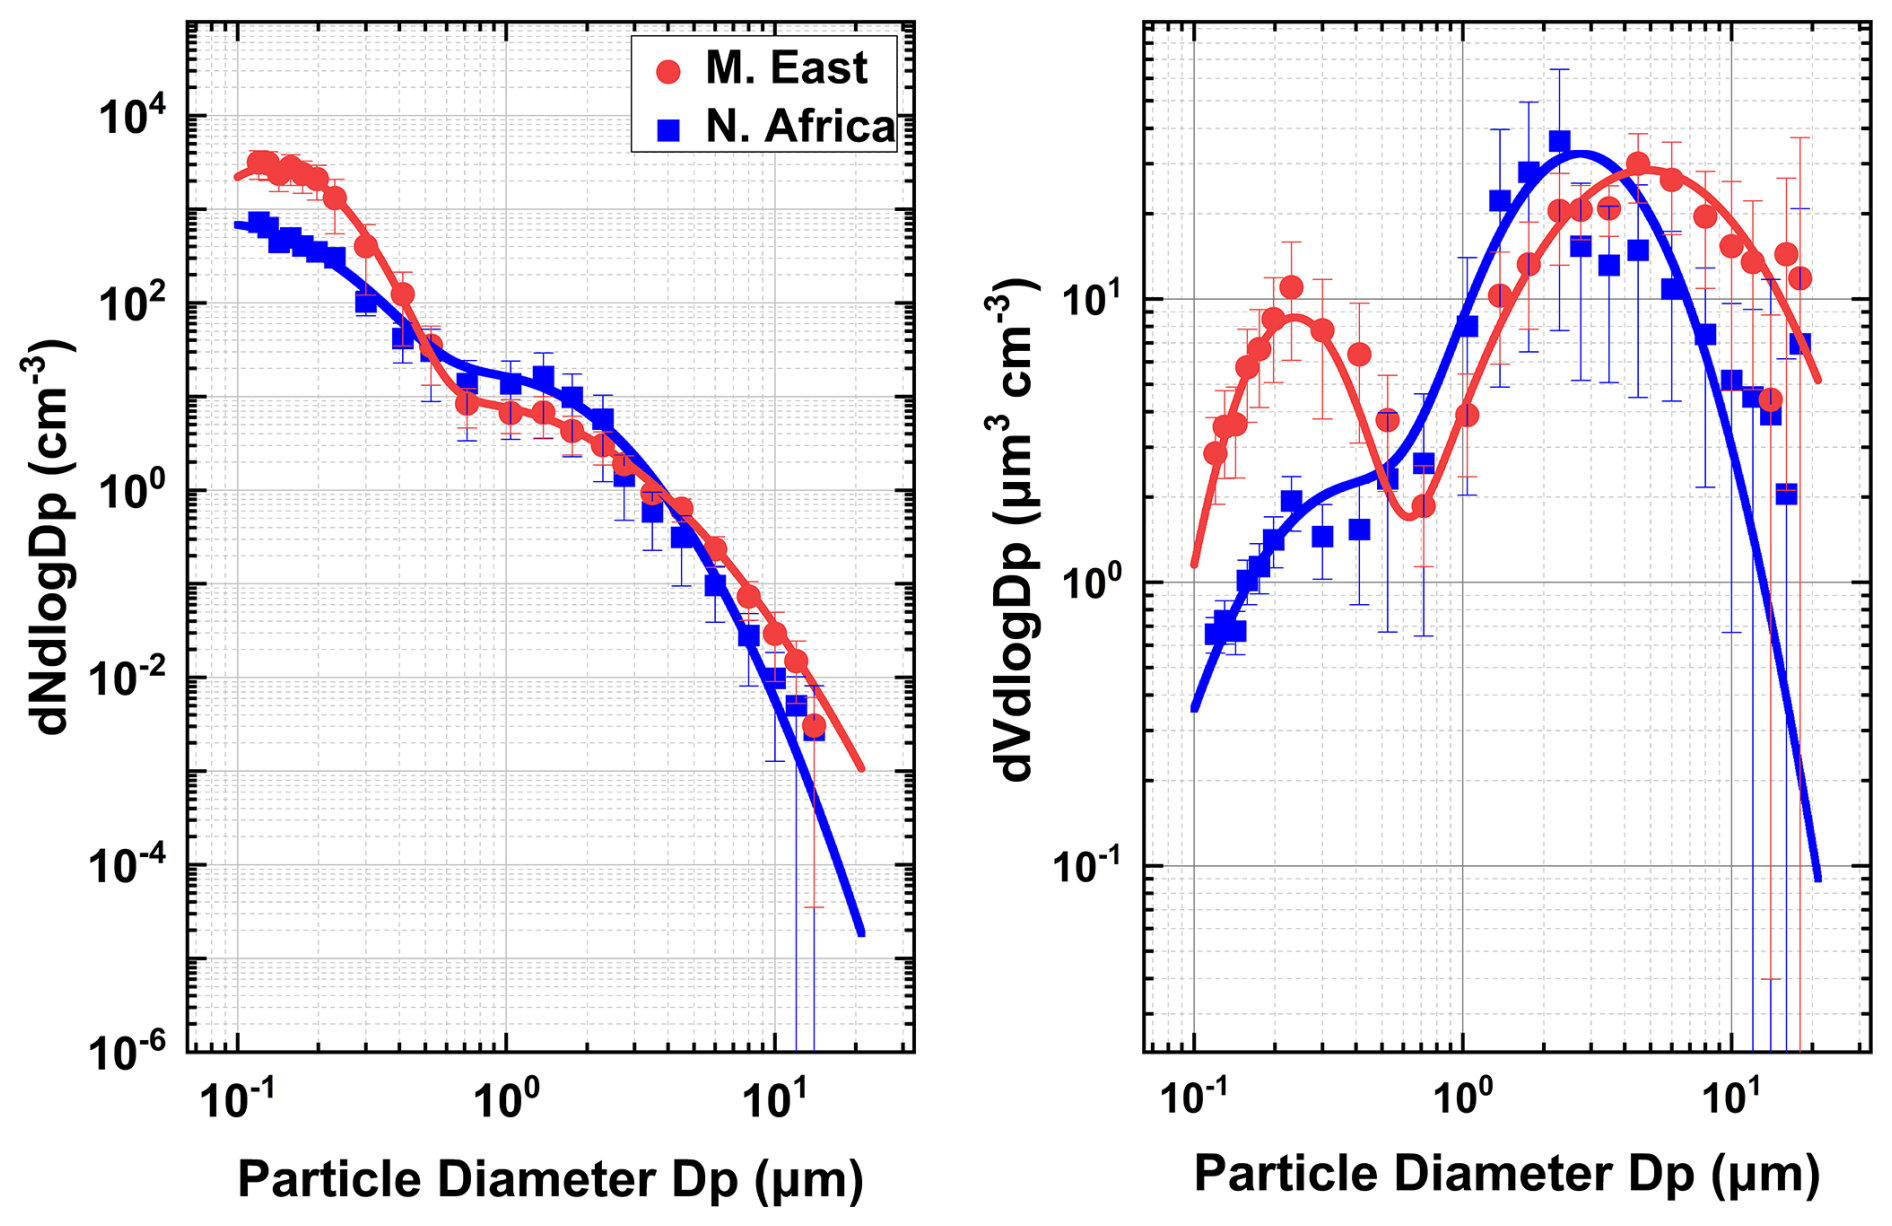
Figure 13Particle number (left panel) and volume (right panel) size distribution within the elevated dust layers shown in Table 1, as calculated by OPC flights during the Cyprus Fall Campaign. The data are averaged and classified based on their origin, distinguishing between cases originating from NA and the ME. A lognormal distribution is fitted to the data, shown in dashed line.
Figure 13 shows the average particle number and volume size distributions along with the lognormal fitting for the two regions, NA and ME, based on all cases presented in Fig. 12. The normalized root mean square error (NRMSE) for the lognormal fitting of the number size distribution () was 3.8 % for the ME case and 4.3 % for the NA case, indicating a reasonably good fit in both cases. The NRMSE for the lognormal fitting of the volume size distribution () was 10 % for the ME case and 13 % for the NA case.
In episodes originating from NA, the volume size distribution exhibits a distinct fine-mode peak with a geometric mean diameter (GMD) of 0.23 µm and a geometric standard deviation (GSD) of 1.44, while the coarse mode shows a more pronounced peak at a GMD of 2.2 µm with a GSD of 1.9. For cases originating from the ME, a fine-mode peak is evident at 0.25 µm with a GSD at 1.5, accompanied by a broader peak in the coarse-mode with a GMD of 4.8 µm and a GSD of 2.5. This difference in size distribution reflects the differing aerosol composition and sources between the two regions. The pronounced peak in the fine-mode observed during ME cases indicates a higher concentration of smaller aerosols. Conversely, the broad coarse-mode peak suggests a substantial contribution from larger particles, which may arise from differences in emission sources and atmospheric transport processes relative to NA. Nevertheless, the present analysis does not allow for a clear attribution of these effects or their relative importance. These findings underscore the complexity of aerosol characteristics in the region and the varied sources driving particle emissions (Pikridas et al., 2018).
Particles smaller than 1 µm exhibit concentrations approximately one order of magnitude higher in the ME relative to NA. This observation aligns with findings of Christodoulou et al. (2023); Bimenyimana et al. (2025), which highlight the substantial contribution of ME emissions, with peak of the optical equivalent diameter between 0.18 and 0.35 µm. The coarse-mode of the particle volume size distributions observed over Cyprus are broadly consistent with previous measurements from major desert dust field campaigns. During ME events, the coarse-mode peaks around 4.8 µm and extends up to approximately 10 µm, indicating the presence of larger particles and a broad size range. This is comparable to source-region observations from campaigns such as Fennec and SAMUM-1, where coarse-mode peaks typically occur between 5–8 µm (Ryder et al., 2018; Weinzierl et al., 2009). In contrast, dust originating from NA exhibits a sharper coarse-mode peak near 2.2 µm, consistent with size distributions observed in transported dust during campaigns such as SAMUM-2, AER-D, and SALTRACE, where peaks were found between 3–4 µm due to gravitational settling during long-range transport (Weinzierl et al., 2017; Ryder et al., 2019; Formenti et al., 2011). These results suggest that the broader coarse-mode volume size distributions observed in ME cases reflects the influence of more proximal or freshly resuspended dust sources, while the narrower NA distributions represent more aged, atmospherically processed dust arriving from distant Saharan sources.
Table 2Details on the GPaC samples collected on-board the UAS, including sampling ID name, date, altitude range where the impactor was open, sampling period, UAS average airspeed during the sampling duration, total number of particles that were analysed under SEM, and origin region of the sampling layers based on HYSPLIT back-trajectory analysis.
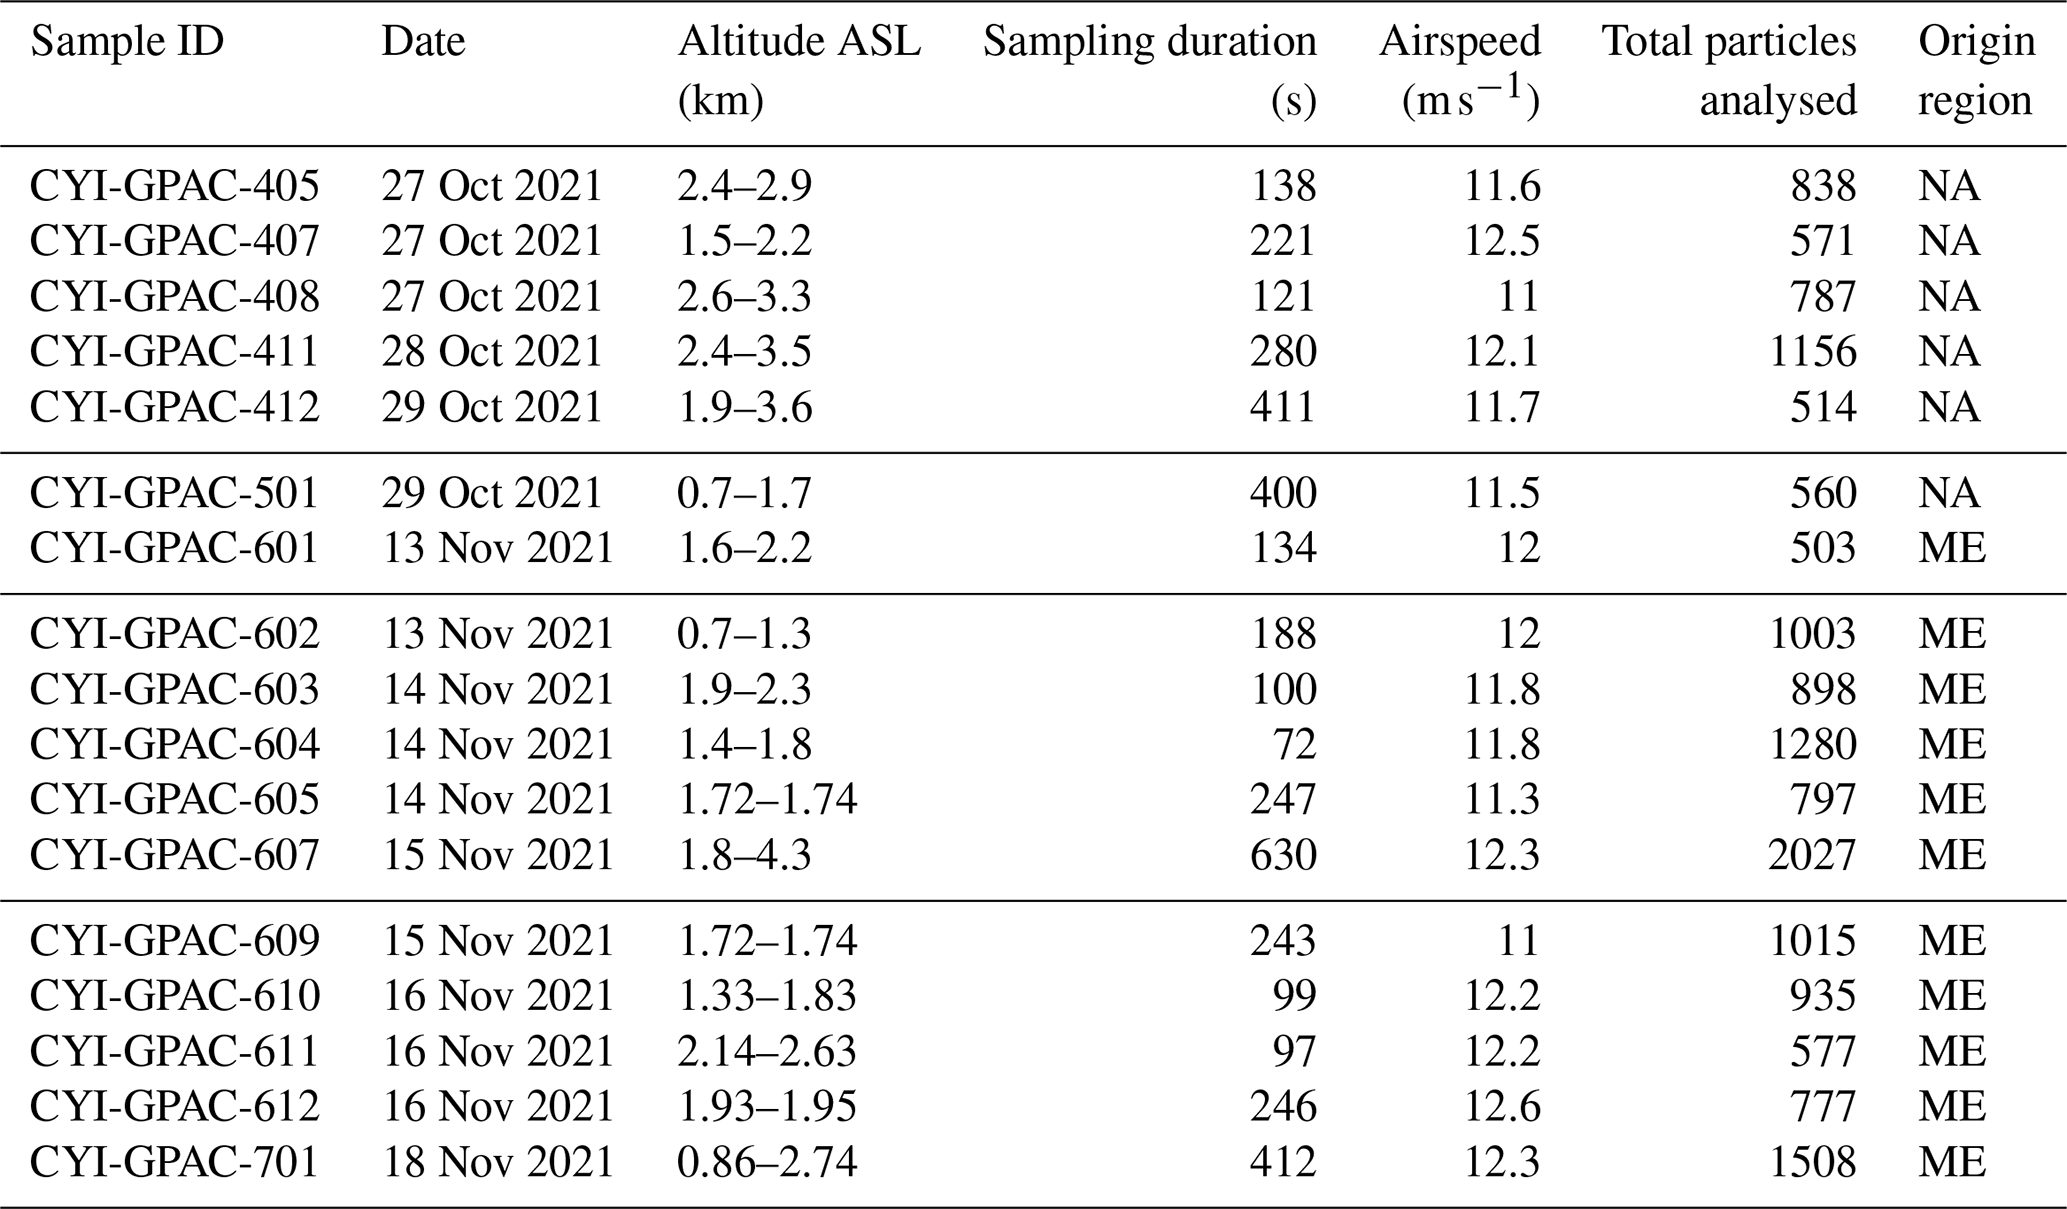
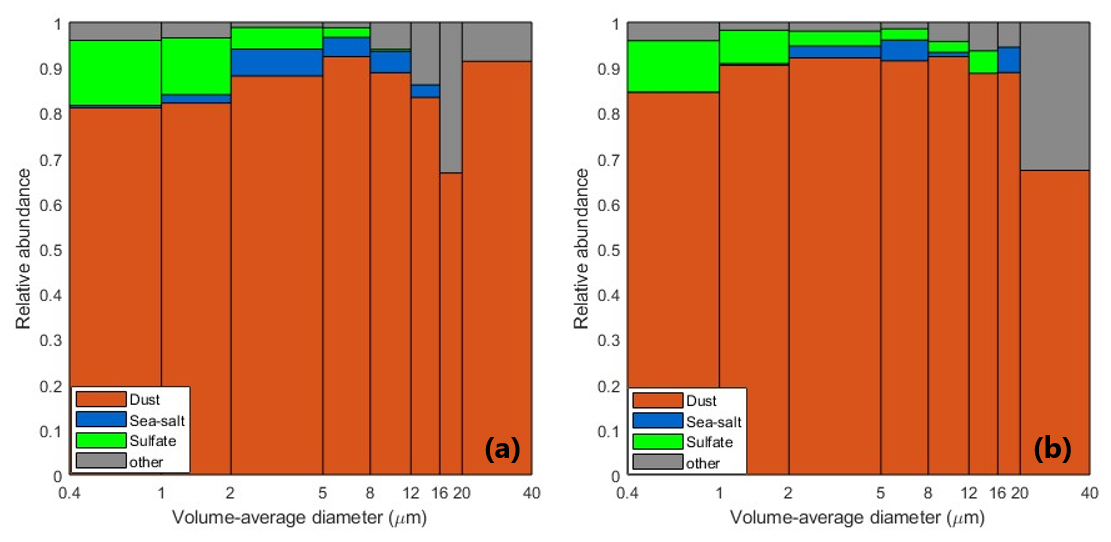
Figure 14Relative abundance of aerosol of particles collected on GPaC as averaged for ME (left) and NA (right) samples. The relative abundance (y-axis) denotes the fraction of particles in each sample that are dominated by the indicated composition.
3.3 Airborne observations – Impactors
In addition to the height-resolved measurements acquired through UAS-based OPCs, impactors were deployed to collect airborne dust samples across different altitudes. Subsequently, these samples were analyzed using SEM, providing complementary information on the morphological and chemical characteristics of the collected particles. This dual approach improves the overall understanding of the vertical dust distribution and its composition, contributing valuable insights into atmospheric aerosol dynamics. Table 2 provides details on the altitude range of the collected particles, on the sampling duration, the airspeed, the total analysed particles and their origin source as revealed by the back-trajectories. A total of five samples were collected during the first dust event, which originated from NA, and eleven samples were obtained during the second event, from the ME. The average sampling duration of the successful samples was 238 ± 147 s.
Figure 14 shows the mean relative abundance of aerosol types as a function of particle size for the ME and NA sample sets. In both regions, mineral dust dominates the composition, accounting for more than 80 % of total particle abundance across most size ranges. The relative contribution of dust slightly decreases to about 70 % in one coarse-mode bin for each region. Sulfate- and sea-salt-rich particles contribute modestly, primarily in the submicron and fine-mode size ranges (below 2 µm). The NA samples exhibit a slightly higher proportion of sulfate compared to ME samples. “Other” particles are mainly mixtures of the three dominant types but also include non-classified substances. Conversely, the ME samples show a marginally larger fraction of coarse “other” particles at diameters exceeding 10 µm. Overall, both datasets confirm that mineral dust is the dominant aerosol type, with subtle regional differences.
Figure 15 shows the particle number size distribution averaged and classified based on their origin, distinguished between cases originating from NA and the ME. The comparison shows that the ME sample set consistently contains more particles than the NA set, especially in the fine particle range. From submicron to 3 µm optical equivalent diameter, ME concentrations are about 2–3 times higher than NA, with the largest enhancement near 0.8 µm. Beyond 10 µm, the difference diminishes, and the two distributions converge. This indicates that ME primarily enhances the smaller particle population, while coarse particles remain similar between the two sets.
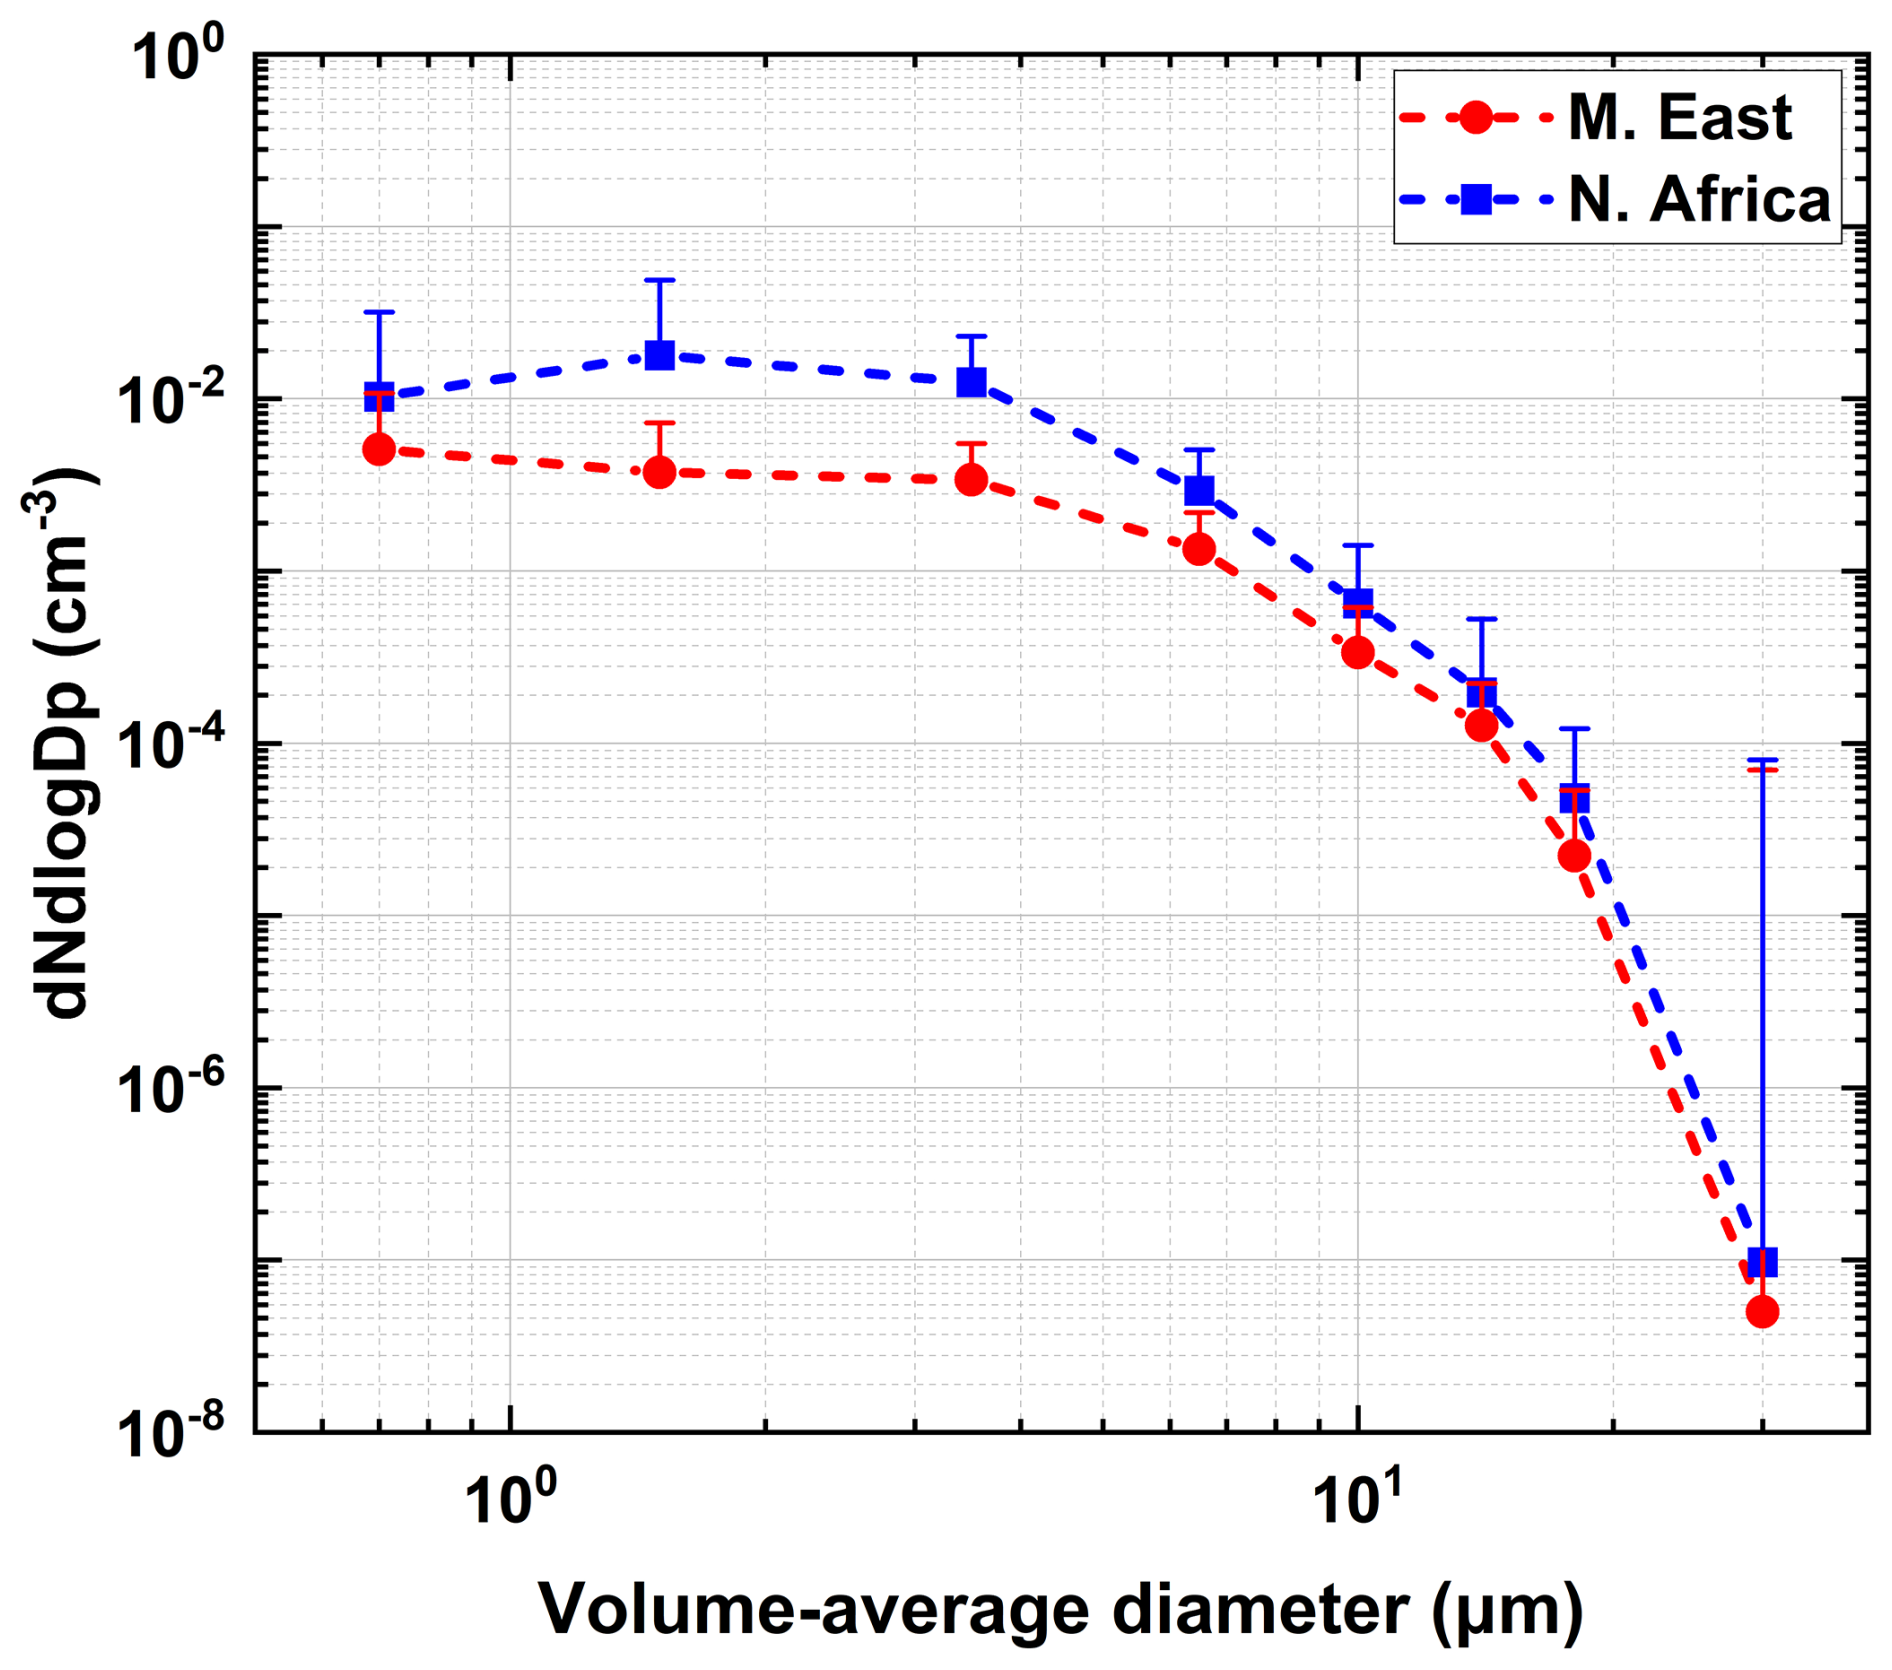
Figure 15Averaged particle number size distribution within the elevated dust layers shown in Table 2, as calculated by the GPAC samples during the Cyprus Fall Campaign. The data are averaged and classified based on their origin, distinguishing between cases originating from NA and the ME. Error bars refer to the standard deviation of the measurements. For visualisation purposes, only positive error bars are shown.
The GPAC (Fig. 15) and OPC (Fig. 13) number size distributions show overall good agreement, despite differences in technique and resolution. However, the GPAC derived size distribution lacks sufficient resolution below 0.42 µm to confirm the fine-mode peak observed in the OPC data. GPAC tends to report slightly higher concentrations from the submicron to 2 µm optical equivalent diameter, but at larger diameters (> 5–10 µm) the slope and magnitude align closely between the two datasets. Importantly, both instruments consistently distinguish regional contrasts, with the ME exhibiting higher number concentrations than NA across the size spectrum. This strong cross-instrument consistency, particularly in the coarse-mode particles, reinforces confidence in the reliability of the measurements and demonstrates that GPAC and OPC provide complementary insights into the particle number size distributions.
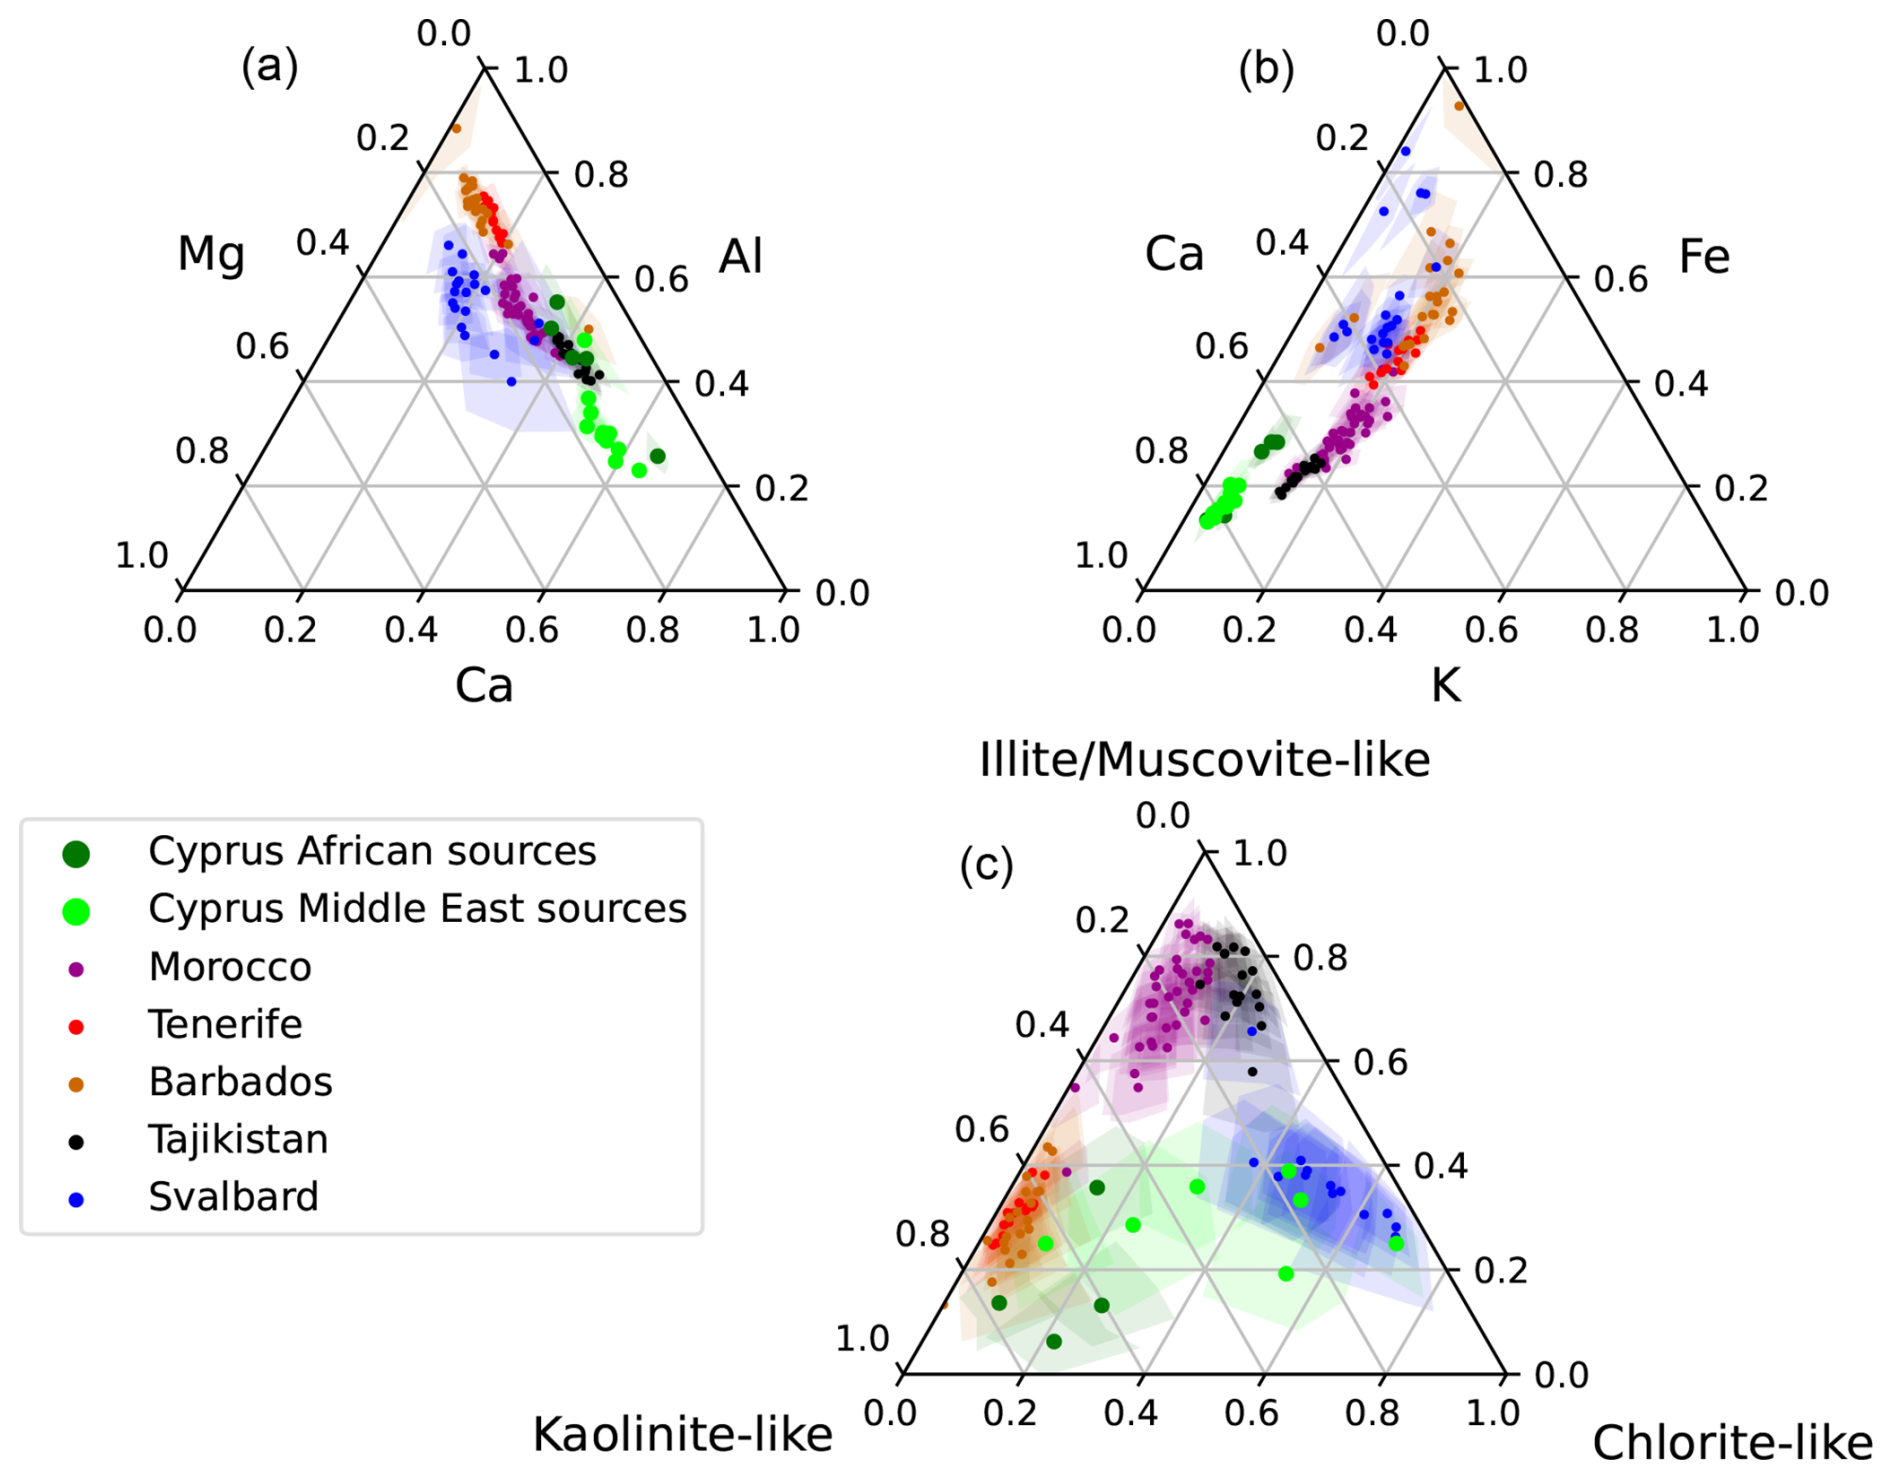
Figure 16(a, b) Ternary diagrams showing the mean single-particle atomic composition of the dust fraction from different samples collected during the Cyprus Fall Campaign (green symbols), along with data from previous campaigns reported by Kandler et al. (2020). Shaded regions denote bootstrapped 95 % confidence intervals of the mean composition. The bottom panel illustrates the mean number contribution of particles resembling the indicated clay mineral classes; color coding and confidence intervals are consistent with panel (a).
Figure 16 shows ternary plots of the mean single-particle elemental composition. The NA and ME samples collected over Cyprus can be differentiated from the other source regions in the Ca–Al–Mg and K–Ca–Fe ternary plots. In the Ca–Al–Mg ternary diagram, dust of ME origin observed over Cyprus exhibits a distinct shift toward the Ca-rich vertex, whereas NA samples align more closely with previously reported Saharan measurements (Kandler et al., 2020), where the same analytical procedure was applied. This pattern likely reflects intrinsic differences in the mineralogical composition and soil structure of the respective source regions. A similar trend is observed in the K–Fe–Ca ternary diagram, where Ca enrichment again serves as a distinguishing feature between the sources; however, the Saharan samples collected during the campaign exhibit relatively higher Fe and lower K contents compared to previously reported Saharan dust. Overall, both NA and ME samples collected over Cyprus show slightly lower inter-particle variability than those from other regions, as indicated by the reduced extent of the statistical confidence envelope.
Figure 16c shows the relative abundance of particles with elemental compositions resembling common clay minerals. Distinct regional fingerprints are evident, where samples originating from NA exhibit mineralogical patterns closely matching those observed for Saharan dust collected on Tenerife, whereas the ME samples do not correspond clearly to any previously defined compositional group. The NA samples are characterized by elevated proportions of kaolinite-like minerals and calcium-rich phases, consistent with more weathered, carbonate-bearing source soils typical of NA dust (Rodríguez-Navarro et al., 2018; Kandler et al., 2020). In contrast, the ME samples display signatures dominated by illite and muscovite, indicative of less weathered, aluminosilicate-rich material. These compositional differences provide a clear mineralogical distinction between the two dust source regions and underscore the potential of single-particle elemental analyses to trace the provenance of airborne mineral dust reaching Cyprus.
This study demonstrates the effectiveness of a novel, cost-efficient methodology for quantitative characterization of airborne dust particles using a sensor package that integrates OPCs and impactors deployed on UAS. This approach enables high-resolution vertical profiling and detection of coarse particles within elevated dust layers. Such measurements are essential for improving the reliability of satellite observations and air quality assessments. Beyond refining remote-sensing retrievals, these results enhance understanding of how regional dust transport influences weather patterns, visibility, and climate, while showcasing the value of small, flexible aerial system for atmospheric research.
UAS-based measurements and remote-sensing observations were performed between 18 October and 18 November 2021, in the Nicosia basin in Cyprus. Two distinct dust episodes were observed, originating from NA and the ME, respectively. Each event exhibited a unique signature in terms of layer altitude, particle size distribution, and chemical composition. Together, they offer a valuable opportunity to investigate the atmospheric transport mechanisms and physical–chemical properties of dust aerosols in the region.
Throughout the campaign, a total of 36 UAS atmospheric flights were conducted, in conjunction with ground-based remote-sensing observations. The mean daily-averaged AOD measured by local sun-photometers during the NA dust event was approximately 0.22, compared to about 0.27 for the ME event. A 120 h HYSPLIT back-trajectory analysis conducted during the Cyprus Fall Campaign shows that the air masses associated with dust events originate from two primary regions. During Saharan dust intrusions, the trajectories trace back to NA, -specifically Algeria, Libya, Egypt, and Mauritania- while during ME dust outbreaks, the sources are primarily Syria, Iraq, Jordan, and Saudi Arabia. Dust layers originating from NA were observed at altitudes that reached up to 7 km, while those transported from the ME typically reached lower altitudes, with maxima around 3.8 km.
Fine-mode aerosol volume concentrations were generally enhanced within the lower 1–2 km and decreased with altitude, with occasional elevated layers above 2 km indicating the transport of dust-laden air masses. In contrast, the coarse mode dominated the aerosol volume throughout the campaign, exhibiting pronounced enhancements below 2 km and distinct elevated layers up to 3 km, reflecting the strong presence and vertical structure of mineral dust.
NA dust episodes exhibit lower fine-mode concentrations compared to ME cases, although both show volume size distribution peaks around 0.25 µm. In coarse mode, NA cases exhibit a sharply peaked distribution with a maximum near 2.2 µm, whereas ME cases display a broader distribution peaking around 4.8 µm and extending up to 10 µm. Notably, the ME coarse-mode PSD is extremely broad, while the NA distribution declines rapidly beyond its peak. The GPaC collection efficiency reaches nearly 1 for particles between 4 and 14 µm, with lower efficiency outside this range (around 50 %), highlighting the promising capability of the GPaC method across the particle size spectrum compared to the UCASS.
Variations in particle size distribution are attributed to differences in the mineralogy and chemical composition of dust originating from different source regions. In this study, the combined OPC and GPAC approach deployed on UAS proved highly effective for identifying mode-specific composition and aerosol type. The GPAC measurements enabled verification of the particle composition associated with the observed OPC bi-modal particle size distribution – most evident in the ME samples – demonstrating that both fine- and coarse-mode particles were predominantly composed of dust.
Overall, this study reveals two distinct compositional fingerprints for Cyprus dust. NA-sourced samples show higher kaolinite-like and Ca-rich signatures, while ME sources are shifted toward illite/muscovite- and Fe-enriched compositions. This separation highlights Cyprus as a unique receptor where contrasting mineralogical regimes converge, allowing clear discrimination of source-dependent microphysical and chemical properties.
Table A1Details from MOPSMAP analysis including: (i) the input parameters used in the MOPSMAP simulations (refractive index = 1.52+0.002i, wavelength = 532 nm, and shape parameterization = spheroids with AR = 1.0, 1.45, 2 and 3), and (ii) the corresponding simulation results as supplementary material.

Table B1Classification criteria value ranges in terms of elemental ratios for classifying particles into a certain class. (A) for clay-mineral like groups. (B) for distinguishing dust from other particles. Note that = , the element symbol representing the atomic (molar) concentration of that element. Due to its occurrence in dust as well as in sea-salt, Na is not regarded for the dust disambiguation. All conditions have to be met for a positive classification. Unmatched particles are classified as “other”.
All data can be provided by the corresponding authors upon request. Data can also be found in Zenodo at https://doi.org/10.5281/zenodo.17723607 (Kezoudi, 2025).
MK: Conceptualization, participation in field campaigns and data acquisition, data analysis and interpretation, writing–original draft; FM: Conceptualization, supervision, participation in field campaigns and data acquisition, theoretical background, placing the subject matter in the wider context; AP: Lidar observations in Nicosia, participation in field campaigns and data acquisition.; KK: SEM analysis on samples; CLR, FM, JS: Critical review of scientific content; AL, CK: Coordination of UAS flights; CS: Provision of calibration data of the UCASS; TT: Provision of technical support for the POPS; REM: Lidar observations in Limassol; All authors have contributed by writing, reviewing and editing.
The contact author has declared that none of the authors has any competing interests.
Publisher's note: Copernicus Publications remains neutral with regard to jurisdictional claims made in the text, published maps, institutional affiliations, or any other geographical representation in this paper. The authors bear the ultimate responsibility for providing appropriate place names. Views expressed in the text are those of the authors and do not necessarily reflect the views of the publisher.
The CARO-LIM NF operation is supported by the “EXCELSIOR” project funded by the European Union's Horizon 2020 research and innovation programme under Grant Agreement No 857510, from the Government of the Republic of Cyprus through the Directorate General for the European Programmes, Coordination and Development and the Cyprus University of Technology. REM also acknowledge the ATARRI project funded by the European Union's Horizon Europe Twinning Call (HORIZON-WIDERA-2023-ACCESS-02) under the grant agreement No 101160258.
This research has been financially supported by the EMME-CARE project which has received funding from the European Union’s Horizon 2020 research and innovation programme under grant agreement No. 856612 and the Cyprus Government.
This paper was edited by Stelios Kazadzis and reviewed by two anonymous referees.
Achilleos, S., Evans, J. S., Yiallouros, P. K., Kleanthous, S., Schwartz, J., and Koutrakis, P.: PM10 concentration levels at an urban and background site in Cyprus: the impact of urban sources and dust storms, J. Air Waste Manage., 64, 1352–1360, https://doi.org/10.1080/10962247.2014.923061, 2014. a
Achilleos, S., Mouzourides, P., Kalivitis, N., Katra, I., Kloog, I., Kouis, P., Middleton, N., Mihalopoulos, N., Neophytou, M., Panayiotou, A., Papatheodorou, S., Savvides, C., Tymvios, F., Vasiliadou, E., Yiallouros, P., and Koutrakis, P.: Spatio-temporal variability of desert dust storms in Eastern Mediterranean (Crete, Cyprus, Israel) between 2006 and 2017 using a uniform methodology, Sci. Total Environ., 714, 136693, https://doi.org/10.1016/j.scitotenv.2020.136693, 2020. a, b, c
Alpert, P., Neeman, B. U., and Shay-el, Y.: Climatological analysis of Mediterranean cyclones using ECMWF data, Tellus A, 42, 65–77, https://doi.org/10.3402/tellusa.v42i1.11860, 1990. a
Bimenyimana, E., Sciare, J., Oikonomou, K., Iakovides, M., Pikridas, M., Vasiliadou, E., Savvides, C., and Mihalopoulos, N.: Cross-validation of methods for quantifying the contribution of local (urban) and regional sources to PM2.5 pollution: Application in the Eastern Mediterranean (Cyprus), Atmos. Environ., 343, 120975, https://doi.org/10.1016/j.atmosenv.2024.120975, 2025. a
Boucher, O., Randall, D., Artaxo, P., Bretherton, C., Feingold, G., Forster, P., Kerminen, V.-M., Kondo, Y., Liao, H., Lohmann, U., Rasch, P., Satheesh, S. K., Sherwood, S., Stevens, B., and Zhang, X. Y.: Clouds and aerosols, in: Climate Change 2013: The Physical Science Basis. Contribution of Working Group I to the Fifth Assessment Report of the Intergovernmental Panel on Climate Change, edited by: Stocker, T. F., Qin, D., Plattner, G.-K., Tignor, M., Allen, S. K., Boschung, J., Nauels, A., Xia, Y., Bex, V., and Midgley, P. M., Cambridge University Press, Cambridge, United Kingdom and New York, NY, USA, 571–658, https://doi.org/10.1017/CBO9781107415324.016, 2013. a
Camps, A., Lopez, R., Morera, S., Rodríguez, S., Yousif, M., Stathopoulou, E., Papanastasiou, D., and Papadopoulos, A.: Dust and Air Quality in the Eastern Mediterranean Region: A Review, J. Environ. Manage., 154, 179–191, https://doi.org/10.1016/j.jenvman.2015.02.020, 2015. a
Christodoulou, A., Stavroulas, I., Vrekoussis, M., Desservettaz, M., Pikridas, M., Bimenyimana, E., Kushta, J., Ivančič, M., Rigler, M., Goloub, P., Oikonomou, K., Sarda-Estève, R., Savvides, C., Afif, C., Mihalopoulos, N., Sauvage, S., and Sciare, J.: Ambient carbonaceous aerosol levels in Cyprus and the role of pollution transport from the Middle East, Atmos. Chem. Phys., 23, 6431–6456, https://doi.org/10.5194/acp-23-6431-2023, 2023. a
Dayan, U., Ziv, B., Shoob, T., and Enzel, Y.: Suspended dust over southeastern Mediterranean and its relation to atmospheric circulations, Int. J. Climatol., 28, 915–924, https://doi.org/10.1002/joc.1587, 2008. a, b
Denjean, C., Cassola, F., Mazzino, A., Triquet, S., Chevaillier, S., Grand, N., Bourrianne, T., Momboisse, G., Sellegri, K., Schwarzenbock, A., Freney, E., Mallet, M., and Formenti, P.: Size distribution and optical properties of mineral dust aerosols transported in the western Mediterranean, Atmos. Chem. Phys., 16, 1081–1104, https://doi.org/10.5194/acp-16-1081-2016, 2016. a
DiCiccio, T. J. and Efron, B.: Bootstrap confidence intervals, Statist. Sci., 11, 189–228, https://doi.org/10.1214/ss/1032280214, 1996. a
Dubovik, O., Holben, B. N., Eck, T. F., Smirnov, A., Kaufman, Y. J., King, M. D., Tanré, D., and Slutsker, I.: Accuracy assessments of aerosol optical properties retrieved from AERONET sun and sky radiance measurements, J. Geophys. Res.-Atmos., 107, AAC 23–1–AAC 23–17, https://doi.org/10.1029/2000JD900040, 2002. a
Engelstaedter, S., Tegen, I., and Washington, R.: North African dust emissions and transport, Earth-Sci. Rev., 79, 73–100, 2006. a
Formenti, P., Schütz, L., Balkanski, Y., Desboeufs, K., Ebert, M., Kandler, K., Petzold, A., Scheuvens, D., Weinbruch, S., and Zhang, D.: Recent progress in understanding physical and chemical properties of African and Asian mineral dust, Atmos. Chem. Phys., 11, 8231–8256, https://doi.org/10.5194/acp-11-8231-2011, 2011. a, b, c
Ganor, E., Osetinsky, I., Stupp, A., and Alpert, P.: Increasing trend of African dust, over 49 years, in the eastern Mediterranean, J. Geophys. Res.-Atmos., 115, 1–7, https://doi.org/10.1029/2009JD012500, 2010. a, b
Gao, R. S., Telg, H., McLaughlin, R. J., Ciciora, S. J., Watts, L. A., Richardson, M. S., Schwarz, J. P., Perring, A. E., Thornberry, T. D., Rollins, A. W., Markovic, M. Z., Bates, T. S., Johnson, J. E., and Fahey, D. W.: A light-weight, high-sensitivity particle spectrometer for PM2.5 aerosol measurements, Aerosol Sci. Tech., 50, 88–99, https://doi.org/10.1080/02786826.2015.1131809, 2016. a, b
Gasteiger, J. and Wiegner, M.: MOPSMAP v1.0: a versatile tool for the modeling of aerosol optical properties, Geosci. Model Dev., 11, 2739–2762, https://doi.org/10.5194/gmd-11-2739-2018, 2018. a, b
Ginoux, P., Chin, M., Tegen, I., Prospero, J. M., Holben, B., Dubovik, O., and Lin, S.-J.: Sources and distributions of dust aerosols simulated with the GOCART model, J. Geophys. Res.-Atmos., 106, 20255–20273, 2001. a
Ginoux, P., Prospero, J. M., Gill, T. E., Hsu, N. C., and Zhao, M.: Global-scale attribution of anthropogenic and natural dust sources and their emission rates based on MODIS Deep Blue aerosol products, Rev. Geophys., 50, RG3005, https://doi.org/10.1029/2012RG000388, 2012. a
Girdwood, J., Stanley, W., Stopford, C., and Brus, D.: Simulation and field campaign evaluation of an optical particle counter on a fixed-wing UAV, Atmos. Meas. Tech., 15, 2061–2076, https://doi.org/10.5194/amt-15-2061-2022, 2022. a, b
Hoerling, M., Eischeid, J., Perlwitz, J., Quan, X., Zhang, T., and Pegion, P.: On the increased frequency of mediterranean drought, J. Climate, 25, 2146–2161, https://doi.org/10.1175/JCLI-D-11-00296.1, 2012. a
Holben, B., Eck, T., Slutsker, I., Tanré, D., Buis, J., Setzer, A., Vermote, E., Reagan, J., Kaufman, Y., Nakajima, T., Lavenu, F., Jankowiak, I., and Smirnov, A.: AERONET – A federated instrument network and data archive for aerosol characterization, Remote Sens. Environ., 66, 1–16, https://doi.org/10.1016/S0034-4257(98)00031-5, 1998. a, b
Illingworth, S., Allen, G., Percival, C., Hollingsworth, P., Gallagher, M., Ricketts, H., Hayes, H., Ladosz, P., Crawley, D., and Roberts, G.: Measurement of boundary layer ozone concentrations on-board a Skywalker unmanned aerial vehicle, Atmos. Sci. Lett., 15, 252–258, https://doi.org/10.1002/asl2.496, 2014. a
Inness, A., Ades, M., Agustí-Panareda, A., Barré, J., Benedictow, A., Blechschmidt, A.-M., Dominguez, J. J., Engelen, R., Eskes, H., Flemming, J., Huijnen, V., Jones, L., Kipling, Z., Massart, S., Parrington, M., Peuch, V.-H., Razinger, M., Remy, S., Schulz, M., and Suttie, M.: The CAMS reanalysis of atmospheric composition, Atmos. Chem. Phys., 19, 3515–3556, https://doi.org/10.5194/acp-19-3515-2019, 2019. a
Kahn, R., Nelson, D., Garay, M., Levy, R., Bull, M., Diner, D., Martonchik, J., Paradise, S., Hansen, J., and Remer, L.: Multiangle Imaging Spectroradiometer (MISR) global aerosol optical depth validation based on 2 years of coincident Aerosol Robotic Network (AERONET) observations, J. Geophys. Res.-Atmos., 110, D10S04, https://doi.org/10.1029/2004JD004706, 2005. a
Kalkstein, A. J., Rudich, Y., Raveh-Rubin, S., Kloog, I., and Novack, V.: A closer look at the role of the Cyprus low on dust events in the negev desert, Atmosphere, 11, 1–15, https://doi.org/10.3390/atmos11101020, 2020. a
Kallos, G., Papadopoulos, A., Kourtidis, K., Laza, M., Bartzokas, A., and Mavrakou, T.: Saharan Dust Transport to the Eastern Mediterranean: A Study Using a Regional Climate Model, Atmos. Environ., 40, 5202–5214, https://doi.org/10.1016/j.atmosenv.2006.04.019, 2006. a
Kallos, G., Solomos, S., Kushta, J., Mitsakou, C., Spyrou, C., Bartsotas, N., and Kalogeri, C.: Natural and anthropogenic aerosols in the Eastern Mediterranean and Middle East: possible impacts, Sci. Total Environ., 488–489, 389–397, https://doi.org/10.1016/j.scitotenv.2014.02.035, 2014. a
Kandler, K., Schütz, L., Deutscher, C., Ebert, M., Hofmann, H., Jäckel, S., Jaenicke, R., Knippertz, P., Lieke, K., Massling, A., Petzold, A., Schladitz, A., Weinzierl, B., Wiedensohler, A., Zorn, S., and Weinbruch, S.: Size distribution, mass concentration, chemical and mineralogical composition and derived optical parameters of the boundary layer aerosol at Tinfou, Morocco, during SAMUM 2006, Tellus B, 61, 32–50, https://doi.org/10.1111/j.1600-0889.2008.00385.x, 2009. a
Kandler, K., Lieke, K., Benker, N., Emmel, C., Küpper, M., Müller-Ebert, D., Ebert, M., Scheuvens, D., Schladitz, A., Schütz, L., and Weinbruch, S.: Electron microscopy of particles collected at Praia, Cape Verde, during the Saharan Mineral Dust Experiment: particle chemistry, shape, mixing state and complex refractive index, Tellus B, 63, 475–496, https://doi.org/10.1111/j.1600-0889.2011.00550.x, 2011. a
Kandler, K., Schneiders, K., Ebert, M., Hartmann, M., Weinbruch, S., Prass, M., and Pöhlker, C.: Composition and mixing state of atmospheric aerosols determined by electron microscopy: method development and application to aged Saharan dust deposition in the Caribbean boundary layer, Atmos. Chem. Phys., 18, 13429–13455, https://doi.org/10.5194/acp-18-13429-2018, 2018. a, b, c, d
Kandler, K.., Althausen, D., Hofer, J., Abdullaev, S. F., and Makhmudov, A. N.: Microphysics and chemical composition of particulate dry deposition measured at Dushanbe, Tajikistan, PANGAEA, https://doi.org/10.1594/PANGAEA.903326, 2019a. a
Kandler, K., Schneiders, K., and Heuser, J.: Microphysics and chemical composition of particulate dry deposition measured in Longyearbyen, Svalbard, Norway, PANGAEA, https://doi.org/10.1594/PANGAEA.903260, 2019b. a
Kandler, K., Schneiders, K., Heuser, J., Waza, A., Aryasree, S., Althausen, D., Hofer, J., Abdullaev, S. F., and Makhmudov, A. N.: Differences and similarities of central Asian, African, and Arctic dust composition from a single particle perspective, Atmosphere, 11, https://doi.org/10.3390/atmos11030269, 2020. a, b, c, d
Karam, D. B., Flamant, C., Cuesta, J., Pelon, J., and Williams, E.: Dust emission and transport associated with a Saharan depression: February 2007 case, J. Geophys. Res. Atmos., 115, 1–19, https://doi.org/10.1029/2009JD012390, 2010. a, b
Kaskaoutis, D. G., Dumka, U. C., Rashki, A., Psiloglou, B. E., Gavriil, A., Mofidi, A., Petrinoli, K., Karagiannis, D., and Kambezidis, H. D.: Analysis of intense dust storms over the eastern Mediterranean in March 2018: Impact on radiative forcing and Athens air quality, Atmos. Environ., 209, 23–39, https://doi.org/10.1016/j.atmosenv.2019.04.025, 2019. a
Kezoudi, M.: Mineral dust profiling with the Universal Cloud and Aerosol Sounding System (UCASS): Measurements and validation, PhD thesis, University of Hertfordshire, Hatfield, United Kingdom, 2020. a
Kezoudi, M.: Cyprus Fall Campaign 2021 Paper Data, Zenodo [data set], https://doi.org/10.5281/zenodo.17723607, 2025. a
Kezoudi, M., Keleshis, C., Biskos, G., Bronz, M., Desservettaz, M., Gao, R.-S., Girdwood, J., Harnetiaux, J., Kandler, K., Liu, Y., Lelieveld, J., Marenco, F., Mihalopoulos, N., Mocnik, G., Neitola, K., Paris, J.-D., Pikridas, M., Sarda-Esteve, R., Stopford, C., Unga, F., Vrekoussis, M., and Sciare, J.: The Unmanned Systems Research Laboratory (USRL): A New Facility for UAV-Based Atmospheric Observations, Atmosphere, 12, https://doi.org/10.3390/atmos12081042, 2021a. a, b, c, d, e
Kezoudi, M., Tesche, M., Smith, H., Tsekeri, A., Baars, H., Dollner, M., Estellés, V., Bühl, J., Weinzierl, B., Ulanowski, Z., Müller, D., and Amiridis, V.: Measurement report: Balloon-borne in situ profiling of Saharan dust over Cyprus with the UCASS optical particle counter, Atmos. Chem. Phys., 21, 6781–6797, https://doi.org/10.5194/acp-21-6781-2021, 2021b. a, b, c, d, e
Koffi, B., Schulz, M., Bréon, F.-M., Dentener, F., Steensen, B. M., Griesfeller, J., Winker, D., Balkanski, Y., Bauer, S. E., Bellouin, N., Berntsen, T. K., Bian, H., Chin, M., Diehl, T., Easter, R. C., Ghan, S. J., Hauglustaine, D. A., Iversen, T., Kirkevåg, A., Liu, X., Lohmann, U., Myhre, G., Rasch, P. J., Seland, Ø., Skeie, R. B., Steenrod, S. D., Stier, P., Tackett, J. L., Takemura, T., Tsigaridis, K., Vuolo, M. R., Yoon, J.-H., and Zhang, K.: Evaluation of the aerosol vertical distribution in global aerosol models through comparison against CALIOP measurements: AeroCom phase II results, J. Geophys. Res.-Atmos., 121, 7254–7283, https://doi.org/10.1002/2015JD024639, 2016. a
Kok, J. F., Parteli, E. J., Michaels, T. I., and Karam, D. B.: The physics of wind-blown sand and dust, Rep. Prog. Phys., 75, 106901, https://doi.org/10.1088/0034-4885/75/10/106901, 2012. a
Kok, J. F., Ridley, D. A., Zhou, Q., Miller, R. L., Zhao, C., Heald, C. L., Ward, D. S., Albani, S., and Haustein, K.: Smaller desert dust cooling effect estimated from analysis of dust size and abundance, Nat. Geosci., 10, 274–278, https://doi.org/10.1038/ngeo2912, 2017. a, b
Lee, S. C., Cheung, C. M. H., and Chan, T. K. K.: Air pollution mapping using UAVs: A new approach for urban air quality monitoring, Urban Climate, 33, 100679, https://doi.org/10.1016/j.uclim.2020.100679, 2020. a
Li, J., Cao, L., Gao, W., He, L., Yan, Y., He, Y., Pan, Y., Ji, D., Liu, Z., and Wang, Y.: Seasonal variations in the highly time-resolved aerosol composition, sources and chemical processes of background submicron particles in the North China Plain, Atmos. Chem. Phys., 21, 4521–4539, https://doi.org/10.5194/acp-21-4521-2021, 2021. a
Lieke, K., Kandler, K., Scheuvens, D., Emmel, C., Glahn, C. V., Petzold, A., Weinzierl, B., Veira, A., Ebert, M., Weinbruch, S., and Schütz, L.: Particle chemical properties in the vertical column based on aircraft observations in the vicinity of Cape Verde Islands, Tellus B, 63, https://doi.org/10.3402/tellusb.v63i4.16242, 2011. a
Liu, D., Taylor, J. W., Crosier, J., Marsden, N., Bower, K. N., Lloyd, G., Ryder, C. L., Brooke, J. K., Cotton, R., Marenco, F., Blyth, A., Cui, Z., Estelles, V., Gallagher, M., Coe, H., and Choularton, T. W.: Aircraft and ground measurements of dust aerosols over the west African coast in summer 2015 during ICE-D and AER-D, Atmos. Chem. Phys., 18, 3817–3838, https://doi.org/10.5194/acp-18-3817-2018, 2018. a
Mamali, D., Marinou, E., Sciare, J., Pikridas, M., Kokkalis, P., Kottas, M., Binietoglou, I., Tsekeri, A., Keleshis, C., Engelmann, R., Baars, H., Ansmann, A., Amiridis, V., Russchenberg, H., and Biskos, G.: Vertical profiles of aerosol mass concentration derived by unmanned airborne in situ and remote sensing instruments during dust events, Atmos. Meas. Tech., 11, 2897–2910, https://doi.org/10.5194/amt-11-2897-2018, 2018. a
Mamouri, R. E. and Ansmann, A.: Estimated desert-dust ice nuclei profiles from polarization lidar: methodology and case studies, Atmos. Chem. Phys., 15, 3463–3477, https://doi.org/10.5194/acp-15-3463-2015, 2015. a
Mamouri, R.-E., Ansmann, A., Nisantzi, A., Solomos, S., Kallos, G., and Hadjimitsis, D. G.: Extreme dust storm over the eastern Mediterranean in September 2015: satellite, lidar, and surface observations in the Cyprus region, Atmos. Chem. Phys., 16, 13711–13724, https://doi.org/10.5194/acp-16-13711-2016, 2016. a
Mamouri, R.-E., Ansmann, A., Ohneiser, K., Knopf, D. A., Nisantzi, A., Bühl, J., Engelmann, R., Skupin, A., Seifert, P., Baars, H., Ene, D., Wandinger, U., and Hadjimitsis, D.: Wildfire smoke triggers cirrus formation: lidar observations over the eastern Mediterranean, Atmos. Chem. Phys., 23, 14097–14114, https://doi.org/10.5194/acp-23-14097-2023, 2023. a
Manfreda, S., McCabe, M. F., Miller, P. E., Lucas, R., Pajuelo Madrigal, V., Mallinis, G., Ben Dor, E., Helman, D., Estes, L., Ciraolo, G., Müllerová, J., Tauro, F., De Lima, M. I., De Lima, J. L. M. P., Maltese, A., Frances, F., Caylor, K., Kohv, M., Perks, M., Ruiz-Pérez, G., Su, Z., Vico, G., and Toth, B.: On the Use of Unmanned Aerial Systems for Environmental Monitoring, Remote Sens., 10, 641, https://doi.org/10.3390/rs10040641, 2018. a
Marenco, F., Bonasoni, P., Calzolari, F., Ceriani, M., Chiari, M., Cristofanelli, P., D'Alessandro, A., Fermo, P., Lucarelli, F., Mazzei, F., Nava, S., Piazzalunga, A., Prati, P., Valli, G., and Vecchi, R.: Characterization of atmospheric aerosols at Monte Cimone, Italy, during summer 2004: Source apportionment and transport mechanisms, J. Geophys. Res.-Atmos., 111, https://doi.org/10.1029/2006JD007145, 2006. a
Marenco, F., Ryder, C., Estellés, V., O'Sullivan, D., Brooke, J., Orgill, L., Lloyd, G., and Gallagher, M.: Unexpected vertical structure of the Saharan Air Layer and giant dust particles during AER-D, Atmos. Chem. Phys., 18, 17655–17668, https://doi.org/10.5194/acp-18-17655-2018, 2018. a
Maring, H., Savoie, D. L., Izaguirre, M. A., Custals, L., and Reid, J. S.: Mineral dust aerosol size distribution change during atmospheric transport, J. Geophys. Res.-Atmos., 108, 8592, https://doi.org/10.1029/2002JD002536, 2003. a
McMurry, P. H., Wang, X., Park, K., and Ehara, K.: The relationship between mass and mobility for atmospheric particles: A new technique for measuring particle density, Aerosol Sci. Tech., 36, 227–238, https://doi.org/10.1080/027868202753504083, 2002. a
Mona, L., Liu, Z., Omar, A., Papayannis, A., Pappalardo, G., Sugimoto, N., and Vaughan, M.: Lidar Measurements for Desert Dust Characterization: An Overview, Adv. Meteorol., 36, 356265, https://doi.org/10.1155/2012/356265, 2012. a
Münkel, C., Eresmaa, N., Räsänen, J., and Karppinen, A.: Retrieval of mixing height and dust concentration with lidar ceilometer, Bound.-Lay. Meteorol., 124, 117–128, https://doi.org/10.1007/s10546-006-9103-3, 2007. a
Nickovic, S., Kallos, G., Papadopoulos, A., and Kakaliagou, O.: Model for prediction of desert dust cycle in the atmosphere, J. Geophys. Res.-Atmos., 106, 18113–18129, https://doi.org/10.1029/2000JD900794, 2001. a
Nisantzi, A., Mamouri, R. E., Ansmann, A., Schuster, G. L., and Hadjimitsis, D. G.: Middle East versus Saharan dust extinction-to-backscatter ratios, Atmos. Chem. Phys., 15, 7071–7084, https://doi.org/10.5194/acp-15-7071-2015, 2015. a, b, c
Panta, A., Kandler, K., Alastuey, A., González-Flórez, C., González-Romero, A., Klose, M., Querol, X., Reche, C., Yus-Díez, J., and Pérez García-Pando, C.: Electron microscopy of particles collected by different techniques from field measurements in the Moroccan Sahara during FRAGMENT 2019, Zenodo, https://doi.org/10.5281/zenodo.7649034, 2023. a
Papadimas, C. D., Anastasopoulou, A., Kallos, G., Dimopoulou, A., Nikolaou, A., Soares, P. M. M., Perez, C., Adame, J. A., Xie, P., Michalopoulou, M., Zhang, Q., and Yi, W.: Analysis of Long-Term Dust Events over Cyprus, 10th International Conference on Air Quality - Science and Application, Environ. Monit. Assess., 189, 1–14, 2017. a
Papetta, A., Marenco, F., Kezoudi, M., Mamouri, R.-E., Nisantzi, A., Baars, H., Popovici, I. E., Goloub, P., Victori, S., and Sciare, J.: Lidar depolarization characterization using a reference system, Atmos. Meas. Tech., 17, 1721–1738, https://doi.org/10.5194/amt-17-1721-2024, 2024. a
Papetta, A., Kezoudi, M., Baars, H., Floutsi, A., Drakaki, E., Kandler, K., Aryasree, S., Louca, E., Christoudias, T., Marinou, E., Stopford, C., Thornberry, T., Amiridis, V., Sciare, J., and Marenco, F.: Volume-to-extinction ratio: an important property of dust, Atmos. Chem. Phys., 26, 2055–2082, https://doi.org/10.5194/acp-26-2055-2026, 2026. a, b, c
Pikridas, M., Vrekoussis, M., Sciare, J., Kleanthous, S., Vasiliadou, E., Kizas, C., Savvides, C., and Mihalopoulos, N.: Spatial and temporal (short and long-term) variability of submicron, fine and sub-10 Μm particulate matter (PM1, PM2.5, PM10) in Cyprus, Atmos. Environ., 191, 79–93, https://doi.org/10.1016/j.atmosenv.2018.07.048, 2018. a
Pilz, C., Düsing, S., Wehner, B., Müller, T., Siebert, H., Voigtländer, J., and Lonardi, M.: CAMP: an instrumented platform for balloon-borne aerosol particle studies in the lower atmosphere, Atmos. Meas. Tech., 15, 6889–6905, https://doi.org/10.5194/amt-15-6889-2022, 2022. a
Pohorsky, R., Baccarini, A., Tolu, J., Winkel, L. H. E., and Schmale, J.: Modular Multiplatform Compatible Air Measurement System (MoMuCAMS): a new modular platform for boundary layer aerosol and trace gas vertical measurements in extreme environments, Atmos. Meas. Tech., 17, 731–754, https://doi.org/10.5194/amt-17-731-2024, 2024. a
Rodriguez-Navarro, C., di Lorenzo, F., and Elert, K.: Mineralogy and physicochemical features of Saharan dust wet deposited in the Iberian Peninsula during an extreme red rain event, Atmos. Chem. Phys., 18, 10089–10122, https://doi.org/10.5194/acp-18-10089-2018, 2018. a
Rohi, G., Ejofodomi, O., and Ofualagba, G.: Autonomous monitoring, analysis, and countering of air pollution using environmental drones, Heliyon, 6, https://doi.org/10.1016/j.heliyon.2020.e03252, 2020. a
Rolph, G., Stein, A., and Stunder, B.: Real-time Environmental Applications and Display sYstem: READY, Environ. Modell. Softw., 95, 210–228, https://doi.org/10.1016/j.envsoft.2017.06.025, 2017. a
Ryder, C. L., Highwood, E. J., Rosenberg, P. D., Trembath, J., Brooke, J. K., Bart, M., Dean, A., Crosier, J., Dorsey, J., Brindley, H., Banks, J., Marsham, J. H., McQuaid, J. B., Sodemann, H., and Washington, R.: Optical properties of Saharan dust aerosol a nd contribution from the coarse mode as measured during the Fennec 2011 aircraft campaign, Atmos. Chem. Phys., 13, 303–325, https://doi.org/10.5194/acp-13-303-2013, 2013. a, b
Ryder, C. L., McQuaid, J. B., Flamant, C., Rosenberg, P. D., Washington, R., Brindley, H. E., Highwood, E. J., Marsham, J. H., Parker, D. J., Todd, M. C., Banks, J. R., Brooke, J. K., Engelstaedter, S., Estelles, V., Formenti, P., Garcia-Carreras, L., Kocha, C., Marenco, F., Sodemann, H., Allen, C. J. T., Bourdon, A., Bart, M., Cavazos-Guerra, C., Chevaillier, S., Crosier, J., Darbyshire, E., Dean, A. R., Dorsey, J. R., Kent, J., O'Sullivan, D., Schepanski, K., Szpek, K., Trembath, J., and Woolley, A.: Advances in understanding mineral dust and boundary layer processes over the Sahara from Fennec aircraft observations, Atmos. Chem. Phys., 15, 8479–8520, https://doi.org/10.5194/acp-15-8479-2015, 2015. a
Ryder, C. L., Marenco, F., Brooke, J. K., Estelles, V., Cotton, R., Formenti, P., McQuaid, J. B., Price, H. C., Liu, D., Ausset, P., Rosenberg, P. D., Taylor, J. W., Choularton, T., Bower, K., Coe, H., Gallagher, M., Crosier, J., Lloyd, G., Highwood, E. J., and Murray, B. J.: Coarse-mode mineral dust size distributions, composition and optical properties from AER-D aircraft measurements over the tropical eastern Atlantic, Atmos. Chem. Phys., 18, 17225–17257, https://doi.org/10.5194/acp-18-17225-2018, 2018. a
Ryder, C. L., Highwood, E. J., Walser, A., Seibert, P., Philipp, A., and Weinzierl, B.: Coarse and giant particles are ubiquitous in Saharan dust export regions and are radiatively significant over the Sahara, Atmos. Chem. Phys., 19, 15353–15376, https://doi.org/10.5194/acp-19-15353-2019, 2019. a
Shaheen, A., Wu, R., Lelieveld, J., Yousefi, R., and Aldabash, M.: Winter AOD trend changes over the Eastern Mediterranean and Middle East region, Int. J. Climatol., 41, 5516–5535, https://doi.org/10.1002/joc.7139, 2021. a
Smith, H. R., Ulanowski, Z., Kaye, P. H., Hirst, E., Stanley, W., Kaye, R., Wieser, A., Stopford, C., Kezoudi, M., Girdwood, J., Greenaway, R., and Mackenzie, R.: The Universal Cloud and Aerosol Sounding System (UCASS): a low-cost miniature optical particle counter for use in dropsonde or balloon-borne sounding systems, Atmos. Meas. Tech., 12, 6579–6599, https://doi.org/10.5194/amt-12-6579-2019, 2019. a
Stein, A. F., Draxler, R. R., Rolph, G. D., Stunder, B. J. B., Cohen, M. D., and Ngan, F.: NOAA’s HYSPLIT Atmospheric Transport and Dispersion Modeling System, B. Am. Meteorol. Soc., 96, 2059–2077, https://doi.org/10.1175/BAMS-D-14-00110.1, 2015. a, b
Sugimoto, N. and Huang, Z.: Lidar methods for observing mineral dust, J. Meteorol. Res., 28, 173–184, https://doi.org/10.1007/s13351-014-3068-9, 2014. a
Teller, A., Xue, L., and Levin, Z.: The effects of mineral dust particles, aerosol regeneration and ice nucleation parameterizations on clouds and precipitation, Atmos. Chem. Phys., 12, 9303–9320, https://doi.org/10.5194/acp-12-9303-2012, 2012. a
Thomas, K. M., McKeon, J. P., and Zick, J. P.: UAVs for aerosol remote sensing and air quality monitoring, J. Atmos. Ocean. Tech., 35, 1345–1358, https://doi.org/10.1175/JTECH-D-17-0196.1, 2018. a
Toledano, C., Torres, B., Velasco-Merino, C., Althausen, D., Groß, S., Wiegner, M., Weinzierl, B., Gasteiger, J., Ansmann, A., González, R., Mateos, D., Farrel, D., Müller, T., Haarig, M., and Cachorro, V. E.: Sun photometer retrievals of Saharan dust properties over Barbados during SALTRACE, Atmos. Chem. Phys., 19, 14571–14583, https://doi.org/10.5194/acp-19-14571-2019, 2019. a
Virtanen, P., Gommers, R., Oliphant, T. E., Haberland, M., Reddy, T., Cournapeau, D., Burovski, E., Peterson, P., Weckesser, W., Bright, J., van der Walt, S. J., Brett, M., Wilson, J., Millman, K. J., Mayorov, N., Nelson, A. R. J., Jones, E., Kern, R., Larson, E., Carey, C. J., Polat, İ., Feng, Y., Moore, E. W., VanderPlas, J., and Laxalde, D.: SciPy 1.0: fundamental algorithms for scientific computing in Python, Nat. Methods, 261–272, https://doi.org/10.1038/s41592-019-0686-2, 2020. a
Waza, A., Schneiders, K., and Kandler, K.: Daily dust deposition fluxes at Izana, Tenerife collected by different techniques: particle size and composition from single particle electron microscopy, PANGAEA, https://doi.org/10.1594/PANGAEA.901413, 2019. a
Weinzierl, B., Sauer, D., Esselborn, M., Petzold, A., Veira, A., Rose, M., and Fiebig, M.: Microphysical and optical properties of dust and tropical biomass burning aerosol layers in the Cape Verde region—an overview of the airborne in situ and lidar measurements during SAMUM-2, Tellus B, 61, 175–189, 2009. a, b
Weinzierl, B., Ansmann, A., Prospero, J. M., Althausen, D., Benker, N., Chouza, F., Dollner, M., Farrell, D., Fomba, W. K., Freudenthaler, V., Gasteiger, J., Groß, S., Haarig, M., Heinold, B., Kandler, K., Kristensen, T. B., Mayol-Bracero, O. L., Müller, T., Reitebuch, O., Sauer, D., Schäfler, A., Schepanski, K., Spanu, A., Tegen, I., Toledano, C., and Walser, A.: The Saharan Aerosol Long-Range Transport and Aerosol–Cloud-Interaction Experiment: Overview and Selected Highlights, B. Am. Meteorol. Soc., 98, 1427–1451, https://doi.org/10.1175/BAMS-D-15-00142.1, 2017. a, b, c
Zittis, G., Almazroui, M., Alpert, P., Ciais, P., Cramer, W., Dahdal, Y., Fnais, M., Francis, D., Hadjinicolaou, P., Howari, F., Jrrar, A., Kaskaoutis, D. G., Kulmala, M., Lazoglou, G., Mihalopoulos, N., Lin, X., Rudich, Y., Sciare, J., Stenchikov, G., Xoplaki, E., and Lelieveld, J.: Climate Change and Weather Extremes in the Eastern Mediterranean and Middle East, Rev. Geophys., 60, https://doi.org/10.1029/2021RG000762, 2022. a