the Creative Commons Attribution 4.0 License.
the Creative Commons Attribution 4.0 License.
 | 15 Jan 2026
Ammonia emissions and depositions over the contiguous United States derived from IASI and CrIS using the directional derivative approach
Zitong Li
Sheng Wang
Bin Peng
Lieven Clarisse
Martin Van Damme
Pierre-François Coheur
Karen Cady-Pereira
Mark W. Shephard
Mark Zondlo
Daniel Moore
Atmospheric ammonia (NH3), primarily emitted from agriculture, poses significant threats to ecosystems, climate, and human health through nitrogen deposition and secondary aerosol formation. NH3 flux estimates remain highly uncertain due to limited direct observations and complex emission–deposition processes. Here, we estimated NH3 fluxes over the contiguous United States using satellite observations from the Infrared Atmospheric Sounding Interferometer (IASI, 2008–2022) and Cross-track Infrared Sounder (CrIS, 2012–2022) by applying a directional derivative approach. Our results highlight major agricultural emission hotspots, including the San Joaquin Valley in California, the Snake River Valley in Idaho, the Texas panhandle, the Great Plains, Southeastern Pennsylvania, and Eastern North Carolina. NH3 removal is predominantly driven by deposition near source areas rather than chemical transformation, with strong sinks in vegetation-dense regions such as forests, grasslands, shrublands, and wetlands. Seasonal flux variations show peaks in warm months and lower values in winter, driven by temperature-dependent volatilization from livestock production and fertilizer application. Compared with bottom-up inventory, satellite-based estimates capture general spatial and seasonal patterns, while also revealing additional insights into key flux hotspots and peak periods. CrIS consistently reports higher fluxes than IASI, especially in spring, reflecting differences in their overpass times. Combining IASI (morning overpass) and CrIS (midday overpass) observations enables a better understanding of diurnal NH3 flux dynamics. These findings provide critical insights into NH3 spatiotemporal variabilities, complementing inventory-based approaches and informing nitrogen management and environmental policy, particularly in regions with limited ground-based monitoring.
- Article
(10916 KB) - Full-text XML
-
Supplement
(5213 KB) - BibTeX
- EndNote


Atmospheric NH3 is the most abundant alkaline gas (Asman et al., 1998; Sutton et al., 2020), and a major component of reactive nitrogen (Galloway et al., 2004). It is removed primarily through two pathways: deposition and chemical transformation. Deposition occurs when atmospheric NH3 is taken up by surfaces via dry or wet processes near its emission sources. Chemical removal involves reactions with sulfuric, nitric, and hydrochloric acids (Loubet et al., 2009), forming particulate ammonium () and secondary pollutants (Behera and Sharma, 2010; Wang et al., 2015). Global NH3 emissions have more than doubled since pre-industrial times (Galloway et al., 2003), driving a cascade of environmental consequences. NH3 deposition and its secondary chemical products contribute to ecosystem eutrophication and soil acidification, disrupting natural nutrient cycles and reducing biodiversity (van Breemen et al., 1982; Heil and Diemont, 1983; Sutton et al., 2008). These processes degrade air quality, threaten human health (Ma et al., 2021), and influence climate through radiative forcing alterations (Erisman et al., 2013; Gong et al., 2024).
NH3 is emitted from various sources, including domestic animals (40 %), synthetic fertilizers (17 %), biomass burning (11 %), natural sources (19 %), crops (7 %) and humans and pets (5 %) (Bouwman et al., 1997). However, large-scale ground-based measurements of NH3 emissions are sparse due to the challenges associated with accurately capturing gaseous NH3. Observations of NH3 fluxes are further constrained by its sharp spatial gradients and short tropospheric lifetime, typically less than 24 h (Adams et al., 2019; Wang et al., 2023). Regional and global NH3 fluxes are often estimated using bottom-up approaches that rely on emission factors and spatial allocation of NH3-emitting activities (Liu et al., 2022). However, these estimates have large uncertainties, reaching up to 50 % (Bouwman et al., 1997). A major source of uncertainty is the lack of reliable statistics on fertilizer use and animal waste production. Regional variations in agricultural practices complicate scaling local observations to global estimates (Luo et al., 2022). Further challenges arise from limited understanding of emissions from natural sources and biomass burning (Dentener and Crutzen, 1994) and the dependence of NH3 volatilization on environmental conditions (Sommer et al., 1991).
Advances in satellite-based atmospheric retrievals have introduced powerful tools for estimating trace gas fluxes, enabling large-scale investigation of gas dynamics. For example, the Infrared Atmospheric Sounding Interferometer (IASI) and the Cross-track Infrared Sounder (CrIS) have identified large NH3 point sources worldwide that were absent from bottom-up inventories (Van Damme et al., 2018; Dammers et al., 2019). Chemical transport models (CTMs) have been widely employed to derive gas fluxes from satellite observations (Cao et al., 2020, 2022; Chen et al., 2021; Marais et al., 2021). However, the computational demands of running CTMs at fine temporal and spatial scales pose significant limitations to fully leverage the coverage and resolutions of new-generation satellite products. To complement CTMs, observational-data-driven approaches have been developed to derive gas emissions directly from satellite Level 2 products. The flux divergence method, for example, has been used to estimate NOx fluxes (Beirle et al., 2019, 2021). Closely related to the flux divergence method, the directional derivative approach (DDA) estimates fluxes with additional agility (Ayazpour et al., 2025; Sun, 2022) and demonstrates broad applicability across various atmospheric species and regions (Lonsdale and Sun, 2023).
In this study, we applied the DDA to estimate NH3 fluxes across the contiguous United States (CONUS). We derived top-down NH3 fluxes at 0.1° resolution using observations from two space-based instruments: the Infrared Atmospheric Sounding Interferometer (IASI) and the Cross-track Infrared Sounder (CrIS). This study addresses the following questions: (1) How accurately can satellite observations from IASI and CrIS be used to estimate NH3 fluxes? (2) What are the spatiotemporal patterns of NH3 fluxes over the CONUS? Our findings aim to enhance the understanding of reactive nitrogen cycling and provide valuable information for environmental and policy applications.
2.1 Data
IASI and CrIS datasets use distinct retrieval approaches, providing two independent datasets and complementary perspectives for analyzing NH3 flux patterns. IASI onboard the Metop-A/B/C meteorological payload was launched by the European Organisation for the Exploitation of Meteorological Satellites (EUMETSAT). Operating in a polar orbit, IASI provides global coverage with two overpass times daily, morning (09:30 local solar time, LST) and at night (21:30 LST). The instrument features a circular footprint on ground of 12 km along the satellite track and a swath width of 2200 km (±48.3°) (Clerbaux et al., 2009). IASI measurements generate vertical column densities (VCDs) of NH3 using machine learning-based retrieval algorithms. We utilized daytime (09:30 LST) NH3 VCD measurements over the CONUS from January 2008–December 2022. The data was sourced from the Level 2 reanalysis product of the ANNI-NH3-v4R dataset (Clarisse et al., 2023) from Metop-A (January 2008–October 2021), Metop-B (March 2013–December 2022) and Metop-C (September 2019–December 2022). Additionally, we excluded Metop-A data after 2019 due to a drift in Metop-A's overpass time towards the end of its operational life. CrIS is onboard the Suomi-NPP, NOAA-20 and NOAA-21 satellites. It also operates in a polar orbit with two overpass times daily, early afternoon (13:30 LST) and after midnight (01:30 LST). CrIS features a swath width identical to IASI (2200 km) and a similar ground pixel resolution (14 km circular pixels at nadir). NH3 VCDs are generated using the fast physical retrieval (CFPR) approach (Shephard and Cady-Pereira, 2015; Shephard et al., 2020). We used daytime (13:30 LST) NH3 VCDs measured by CrIS-NPP (June 2012–May 2021) and CrIS-NOAA-20 (March 2019–December 2022) over the CONUS for the period from June 2012–December 2022. The dataset was derived from the Level 2 CrIS NH3 version 1.6.4 product.
We used gridded monthly NH3 emission inventories from the Harmonized Emissions Component (HEMCO) 3.0 for 2016 with a spatial resolution of 0.1° (Lin et al., 2021). HEMCO converts publicly available emissions data, such as SMOKE outputs, into inputs compatible with atmospheric models like GEOS-Chem. The inventory integrates data from the National Emissions Inventory and includes key NH3 sources such as agriculture, industry, and natural emissions. We use this bottom-up inventory from HEMCO to compare with satellite-derived fluxes, providing insights into their consistency and helping to assess the utility of satellite-based estimates.
We also incorporated additional datasets to support NH3 flux estimation and analysis. Hourly horizontal wind data at 100 and 10 m above the surface was utilized to estimate NH3 fluxes from satellite observations. The data was obtained from the ERA5 reanalysis at a spatial resolution of 0.25° (Hersbach et al., 2020) spanning 2008–2022. The 2021 release of the National Land Cover Database (NLCD) with a resolution of 30 m was used to analyze the spatial patterns of NH3 fluxes across different land cover types. Land and water mask data from the North American Land Data Assimilation System (NLDAS) unified mask were used to exclude water body data due to the larger noise of the satellite retrievals over these areas.
2.2 NH3 flux estimations
2.2.1 Directional derivative approach (DDA)
The estimation of emissions (E) from satellite-observed VCDs (Ω) is grounded in the principle of mass conservation as in Eq. (1), which is in the same form as presented in the previous DDA literature (Sun, 2022; Ayazpour et al., 2025). DDA accounts for horizontal transport, topographic effects, and chemical transformation influencing gas distribution. Three estimators within the DDA framework are labeled in Eq. (1) as DD, DD_topo, and DD_chem, representing the directional derivative of column densities, the directional derivative with consideration of topography, and the directional derivative with consideration of both topography and chemistry. The DD estimator (u⋅(∇Ω)) captures the horizontal advection of NH3, representing the directional derivatives of the VCDs with respect to horizontal wind vectors representing the planetary boundary layer (u, 100 m winds). is the horizontal vector differential operator. Ayazpour et al. (2025) evaluated DD estimators calculated using column amounts and winds at a range of altitudes in an atmospheric model with the model-ingested emission and found that winds from 100–800 m give similar and consistent results. We choose 100 m wind because it has been widely used in previous studies (Goldberg et al., 2022; Lonsdale and Sun, 2023) and is readily available from the ERA5 single-level product. The DD_topo estimator accounts for the topography term (XΩu0⋅(∇z0)), which is driven by the directional derivatives of the surface altitudes (z0, obtained from Level 2 satellite data) relative to near-surface wind vectors (u0, 10 m winds). This component captures the influence of terrain on NH3 movement. For example, variations in elevation can create localized gradients that resemble NH3 fluxes. The DD_chem estimator considers the chemistry term (kΩ), representing chemical interactions between NH3 and atmospheric acids which result in the formation of particulate matter.
Here 〈 〉 denotes the spatiotemporal averaging operator already implemented in the physical oversampling framework (Sun et al., 2018). This method leverages the spatial variability of individual orbits and the data record to reduce noise and smooth spatial gradients in the gridded product. We employed the oversampling approach to aggregate Level 2 satellite data into a gridded Level 3 product at a 0.1° resolution on a daily scale. Data from IASI and CrIS were treated separately, but when multiple IASI and CrIS instruments were available on the same day, their data were merged together. Each Level 2 pixel was inflated spatially by a factor of 2 along both the major and minor axes of the ellipses, effectively filling observational gaps and reducing noise. This is a critical step to enable spatial gradient calculation when data coverage is sparse (e.g., only a single overpass is available). This also limits the spatial resolving power to about twice the pixel size.
X and k represent the inverse scale height and chemical reactivity, in which scale height represents the characteristic height of the species' vertical distribution, and chemical reactivity represents the inverse of average time before the species being removed by chemical reactions. To improve the performance of the flux estimates, we treat the X and k as fundamentally empirical fitting parameters within a data-driven approach to ensure the resultant emission estimator centers around zero where emissions are negligible. Although in theory X and k are tied to physically meaningful quantities, their main purpose is to enhance emission estimators in the presence of topography and chemistry using information contained by satellite observations. As such, the quality of fitted X and k is subject to the quality and quantity of available satellite data. Because of the gaps in individual IASI and CrIS pixels that lead to undersampling of topography, we expect that X cannot fully account for topography effects over complex terrains, an inherent limitation for scanning Fourier Transform Spectrometers like IASI and CrIS.
In regions where emissions are negligible ( , based on bottom-up inventory from HEMCO; see Fig. S1 in the Supplement for spatial distribution), Eq. (1) can be reformulated into a multilinear regression form:
Here β1 is an estimate of −X and β2 is an estimate of −k. β0 and ε account for the offset and random error, in the DD estimator 〈u⋅(∇Ω)〉. We conducted a two-step fitting process to estimate X and k following Lonsdale and Sun (2023). The two fitting processes exclude open water bodies and very rough terrains. The first fitting step focused on β1 since the fitting results for β2 are usually noisy. The first-round fitting for β1 was limited in moderately rough terrains with . Once β1 was determined and then fixed, the second-round fitting for β2 was conducted in flat terrains ( with moderate NH3 VCDs ( mol m−2) and minimal emissions ( ) to isolate chemical transformation. To address the challenges associated with a low signal-to-noise ratio, the fitting was performed over extended time intervals. Daily flux components, including 〈u⋅(∇Ω)〉, 〈Ωu0⋅(∇z0)〉 and 〈Ω〉, were first calculated at a spatial resolution of 0.1°. These values were then aggregated into six-month intervals to improve signal-to-noise.
We tested different spatial groupings, temporal averaging windows, and stricter maximum emission thresholds to refine the fitted X and k. For X, fitting the entire domain as a single group produces consistently positive and stable values, whereas subdividing the domain often introduces excessive noise (Fig. S2 in the Supplement). Similarly, varying the temporal aggregation affects the stability of the fits (Fig. S3 in the Supplement): shorter intervals produce noisier estimates, while longer intervals yield more robust results. We adopted a six-month aggregation interval as it provides reliable estimates across the entire period while retaining seasonal variability. The same settings were applied to k for consistency, though its performance is largely unaffected by these changes (Figs. S4 and S5 in the Supplement). Stricter emission thresholds for the chemistry term also have little impact (Fig. S6 in the Supplement).
2.2.2 Uncertainty in DD estimator
To estimate the uncertainty in DD estimator, we calculated DD in both the zonal/meridional directions () and the diagonal directions (). The final DD value was determined as the mean of the directional derivatives calculated along the and directions:
The difference between and was used to estimate the random errors (σ) of DD:
We evaluated NH3 fluxes at multiple spatial resolutions, including 0.2, 0.1, and 0.04°. Consistent spatiotemporal patterns are observed across all grid scales (Fig. S7 in the Supplement). A resolution of 0.1° is selected as the optimal balance, ensuring sufficient data coverage while effectively capturing spatial gradients in NH3 fluxes (Wang et al., 2023).
2.3 Spatiotemporal pattern analysis
To analyze the spatial patterns of NH3 fluxes, we focused on the period from September 2019–April 2021. This timeframe was selected because both IASI and CrIS observations of NH3 VCDs provide the most extensive data coverage, enabling a more reliable comparison between the two datasets. We also compared the spatial patterns of satellite-based NH3 fluxes with bottom-up inventory NH3 emissions and land cover types. This comparison allows us to evaluate the consistency of satellite-derived flux estimates with known NH3 sources and their relationship to land use and vegetation cover.
For the temporal pattern analysis, we utilized the full observational periods of the datasets: January 2008–December 2022 for IASI and June 2012–December 2022 for CrIS. This extended temporal coverage allows for a comprehensive understanding of NH3 flux trends over time. To analyze the temporal patterns of NH3 emission/deposition rates across high-flux regions, we calculated regional emission/deposition rates by spatially integrating the fluxes within the source/sink areas of each region. We examined the seasonal patterns of NH3 emission/deposition rates in both source and sink areas. These areas were defined based on the uncertainty in DD estimator quantified in Eq. (6). We classified locations where both IASI- and CrIS-derived NH3 fluxes exceeded 2σ as source regions and locations with both fluxes lower than −2σ as sink regions. Additionally, we investigated the seasonal variations in NH3 emission/deposition rates derived from IASI and CrIS observations. These were compared with seasonal signals in inventory data to evaluate the consistency between top-down and bottom-up approaches.
3.1 NH3 flux estimation
In this study, we used the DD_chem estimator as our NH3 flux estimate. The topography term proves essential for addressing topographic biases in mountainous regions (Fig. S8a and b in the Supplement). Estimated NH3 scale heights generally range from 1–2 km (Fig. S9 in the Supplement), approximating the planetary boundary layer height. Higher scale heights are observed when only one IASI instrument is operational as well as during winter months in CrIS data, possibly due to weak thermal contrast. The chemistry term contributes strongly in regions with high NH3 column densities (Fig. S8c and d), although the fitted chemical reactivities are generally weak (Fig. S9).
Figure 1 shows the random errors, estimated through Eq. (6), in IASI- (a) and CrIS-based (b) fluxes. These random errors were calculated separately over monthly, annual, and total aggregated flux fields and plotted against the mean coverage of Level 2 pixels used in the aggregation. These mean coverage values were denoted by N and roughly correspond to the number of satellite overpasses. Both IASI and CrIS observations demonstrate improved precision (lower random errors) with increasing data coverage. The black lines in Fig. 1 represent the theoretical scaling relationship, , where σ0 is the scaling factor derived from the random errors of the monthly values:
where σi and Ni represent the random errors and mean Level 2 data coverage for month i. If the random errors across different aggregation levels align with the scaling, it suggests that the random errors are independent and random. This alignment in Fig. 1 highlights the importance of extensive spatial and temporal coverage for reliable flux estimation. Additionally, the intercept of the black line with the vertical line at N=1 provides the theoretical precision (σ0) of flux estimated by a single, gap-free overpass of the satellite instrument. IASI shows slightly better single-overpass precision at mol m2 s−1 for IASI, compared with mol m2 s−1 for CrIS. However, the random errors are generally lower for CrIS when aggregated to the same intervals due to its denser Level 2 coverage than IASI.
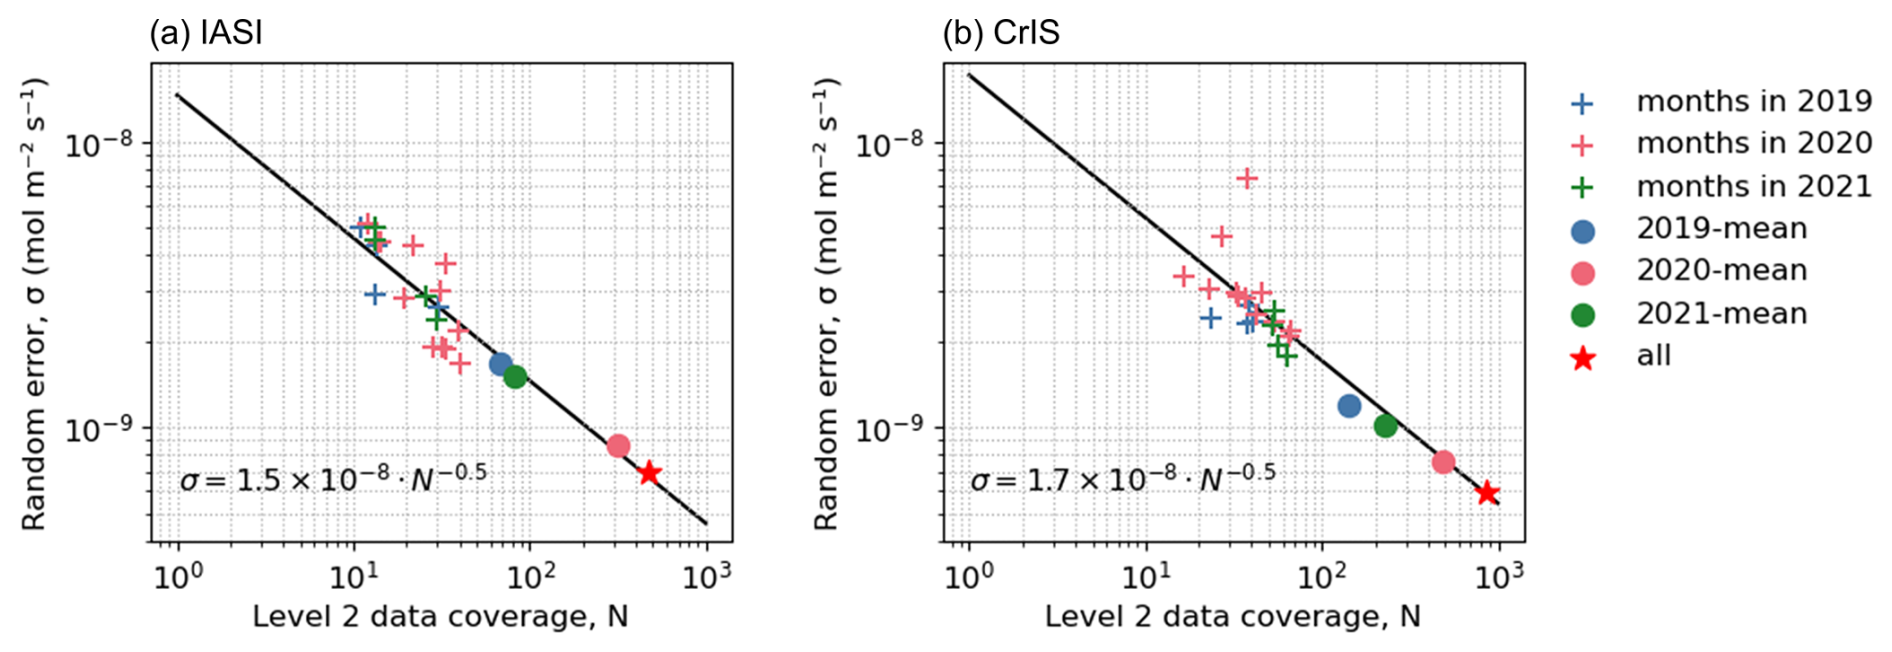
Figure 1The relationship of random error (σ) and data coverage (N) for IASI (a) and CrIS (b) records from September 2019–April 2021. Dots represent random errors at various aggregation levels (monthly, annual, and total). The black lines represent the theoretical scaling relationship, , where σ0 denotes the single-overpass precision.
3.2 Spatiotemporal pattern of NH3 flux over the CONUS
IASI and CrIS observations exhibit consistent hotspot regions in NH3 VCDs and flux (Fig. 2). Spatially continuous hotspots include the San Joaquin Valley in California, the Snake River Valley in Idaho, the Texas panhandle and the Great Plains (Figs. 4–7), all regions known for intensive livestock production and high nitrogen fertilizer use (Liu et al., 2019). Discrete NH3 emission hotspots also occurr in the eastern United States, notably in Southeastern Pennsylvania and Eastern North Carolina (Figs. 8 and 9), where concentrated animal feeding operations (CAFOs) are prevalent. Major NH3 sinks are located near sources, highlighting the localized deposition of NH3 emissions. The primary sources of NH3 emissions from satellite observations show strong consistency with those from bottom-up inventories (Fig. S1), enhancing confidence in the reliability of satellite-based flux estimates for identifying key emission regions.
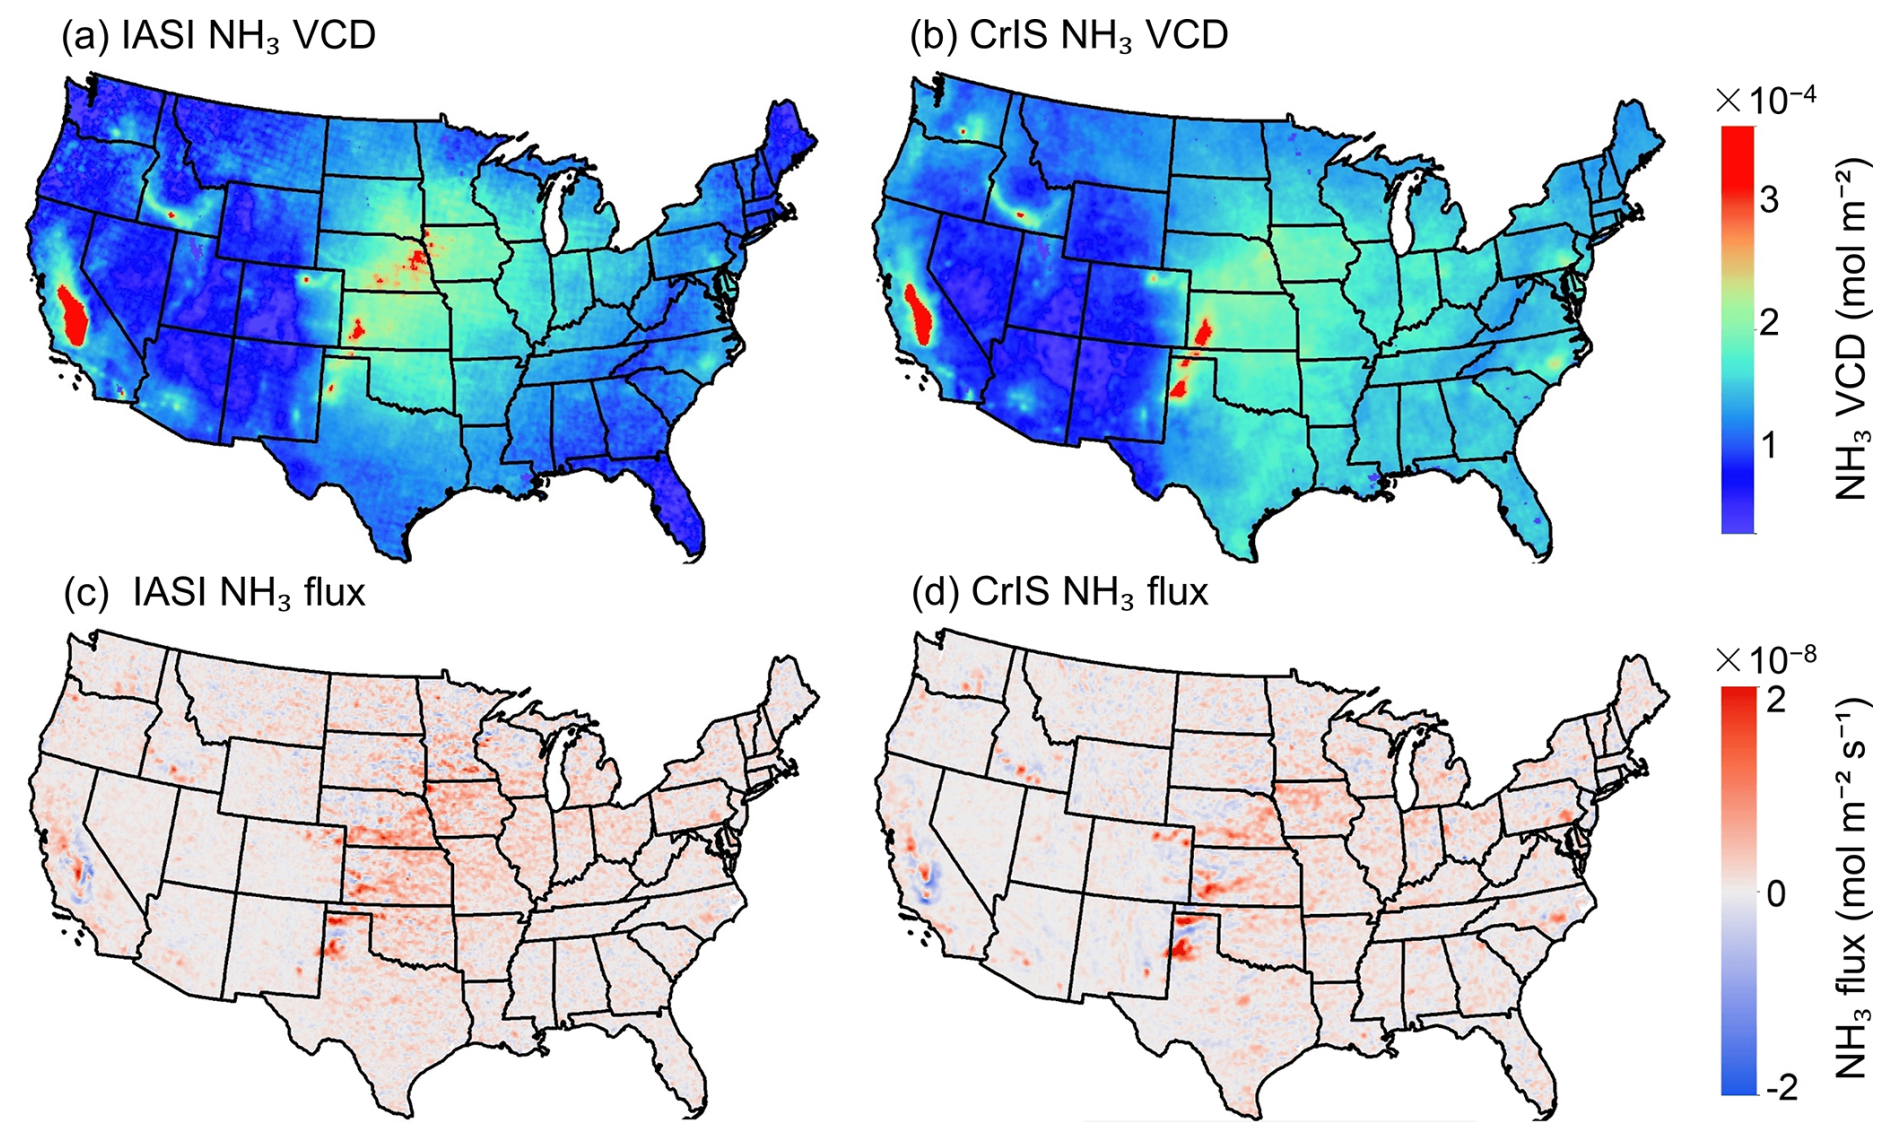
Figure 2IASI- (a, c) and CrIS- (b, d) derived NH3 VCD (a, b) and flux (c, d) averaged from September 2019–April 2021 over the CONUS on a 0.1° grid.
Both NH3 VCDs and flux estimates show significant spatial agreement in IASI and CrIS, with correlation coefficients of R=0.84 for VCDs and R=0.34 for NH3 fluxes (P<0.01; Fig. 3). The VCD comparison reveals systematic differences between IASI and CrIS as different slopes and offsets in different regions (Fig. 3a). These offsets and proportional biases can propagate into flux calculations, where they manifest as amplified variability and reduced correlation (Fig. 3b). The lower correlation in flux estimates compared to VCDs likely reflects compounded noises from derivative-based flux estimates, which relies on external datasets, assumptions, and signal differentiation.
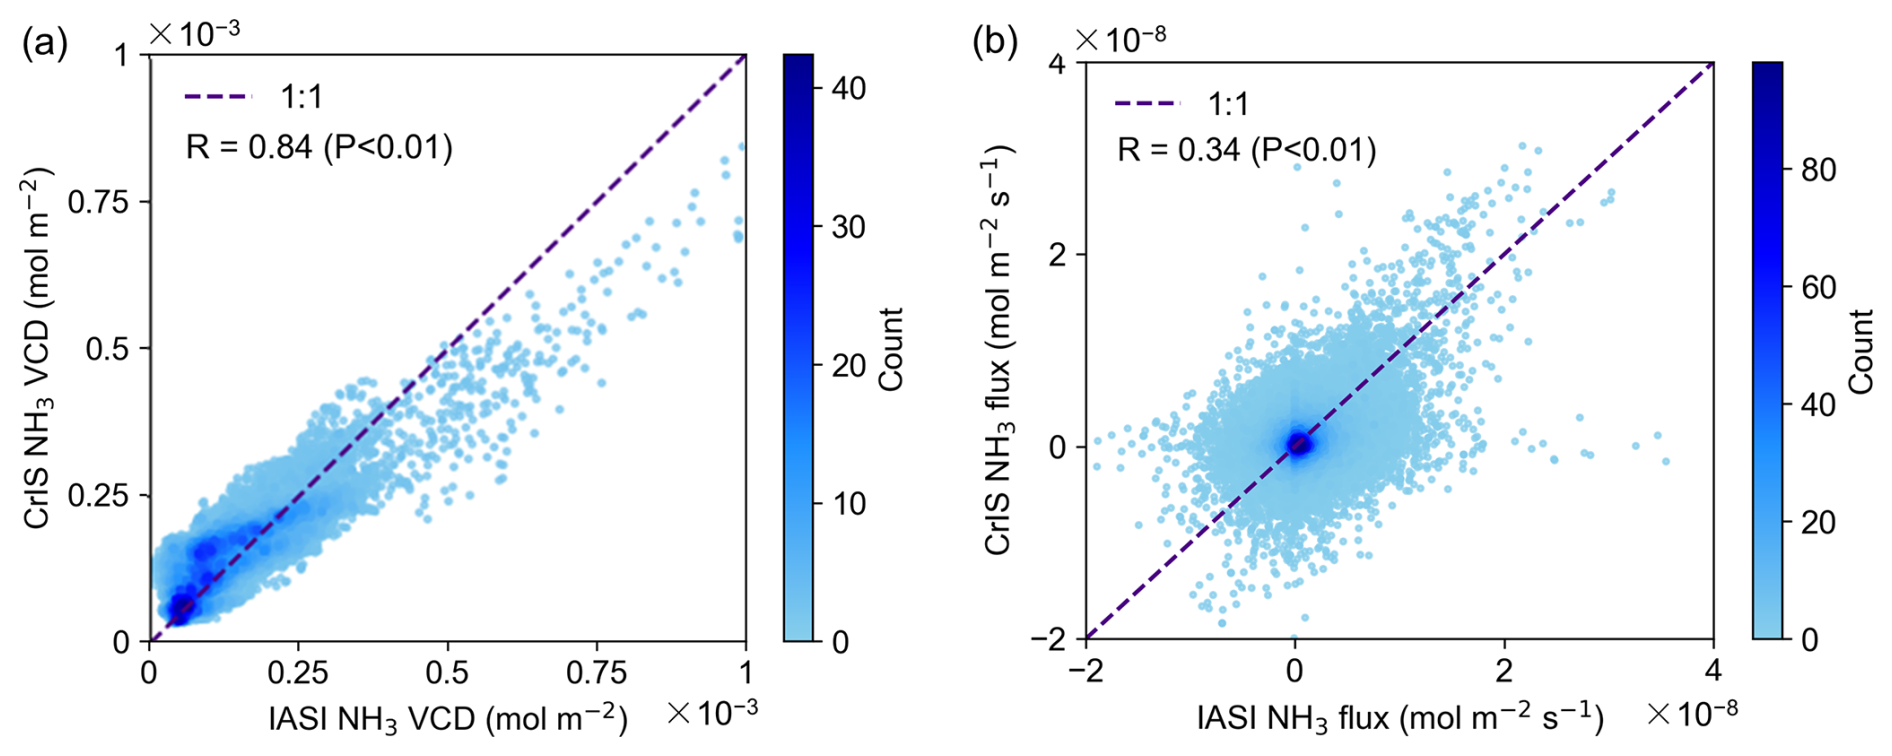
Figure 3Comparison of IASI- and CrIS-derived NH3 VCD (a) and flux (b) averaged from September 2019–April 2021.
3.3 Spatiotemporal pattern of NH3 flux in high-flux regions
Figures 4–9 compare IASI- and CrIS-derived NH3 fluxes with VCDs and bottom-up inventories across six major high-flux regions. Application of the flux estimator substantially sharpens spatial structures relative to VCDs. For instance, in the Snake River Valley (Fig. 5), enhanced VCDs appear as a broad belt, while the corresponding fluxes resolve into alternating hot and cold spots, indicating localized source–sink variability. Similar sharpening is evident in other regions, demonstrating the added value of the estimator in attributing fluxes to specific land cover types.
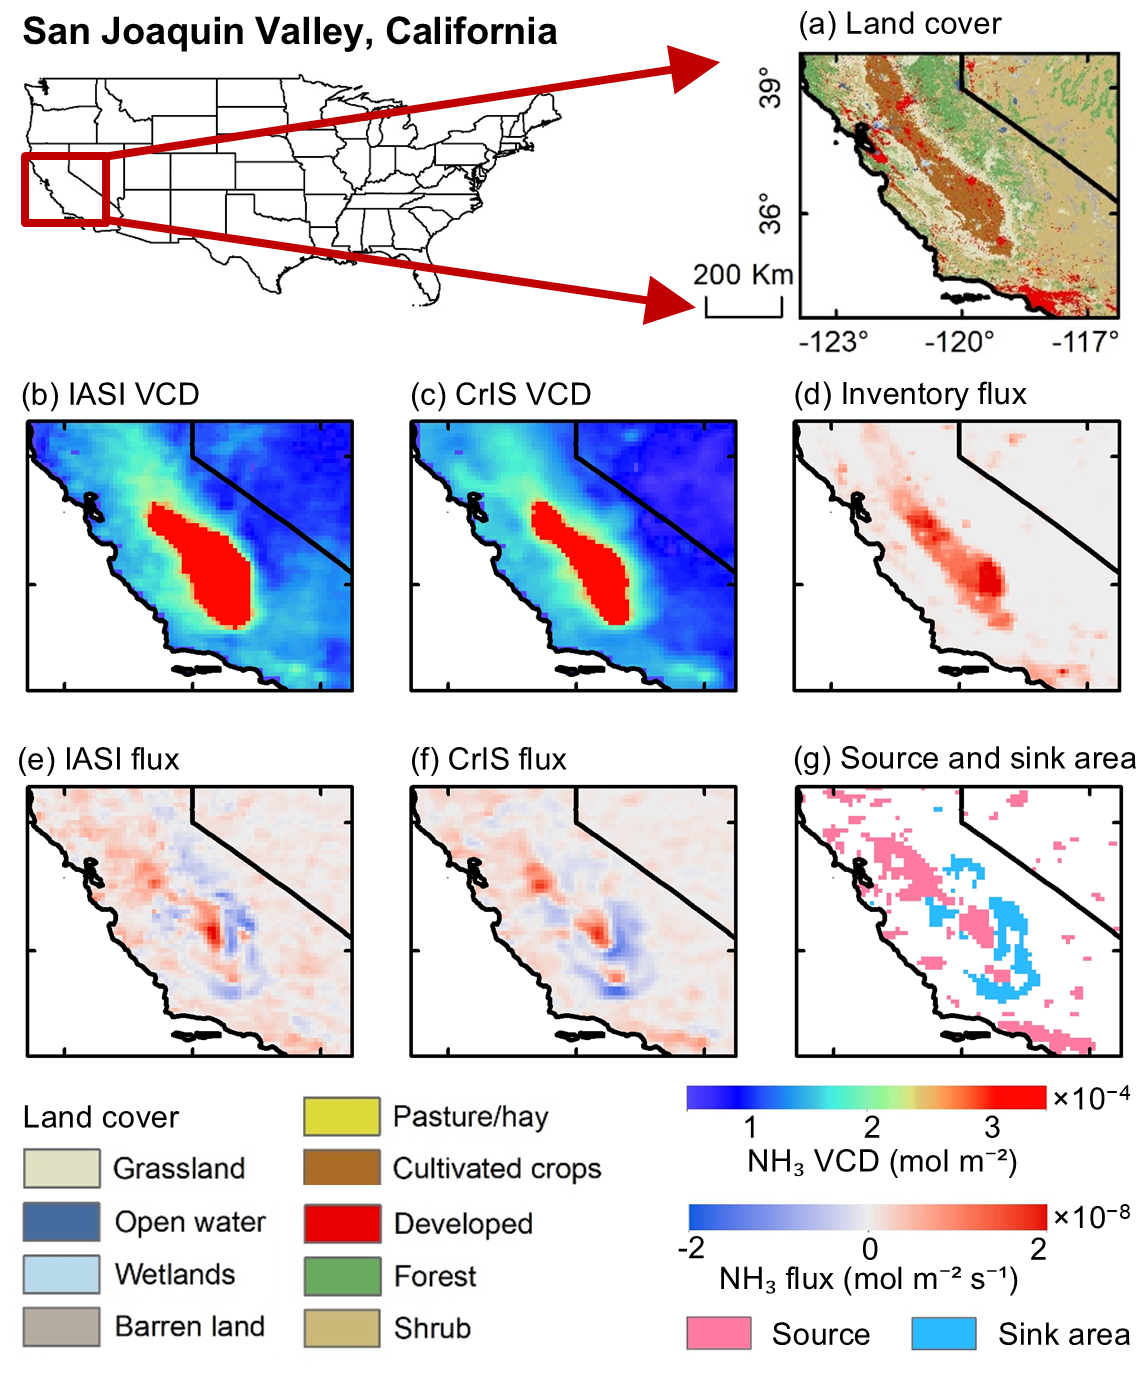
Figure 4(a) Land cover types in the San Joaquin Valley in California. (b, c) VCD and (e, f) flux derived from IASI and CrIS NH3 records. (d) NH3 emission from bottom-up inventory. (g) Source and sink areas of NH3 flux, defined as the outside region of ±2σ of DD from IASI and CrIS.
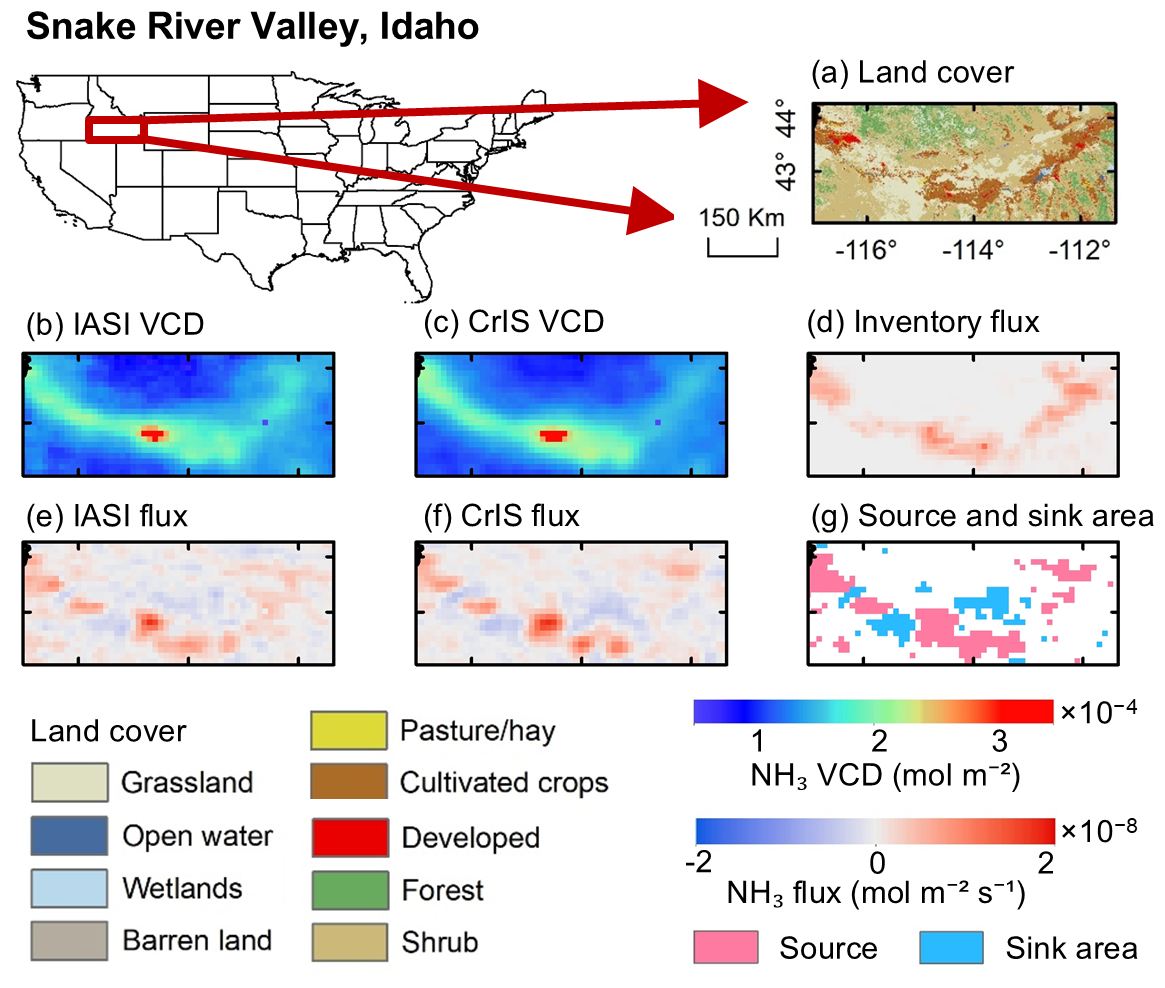
Figure 5(a) Land cover types in the Snake River Valley in Idaho. (b, c) VCD and (e, f) flux derived from IASI and CrIS NH3 records. (d) NH3 emission from bottom-up inventory. (g) Source and sink areas of NH3 flux, defined as the outside region of ±2σ of DD from IASI and CrIS.
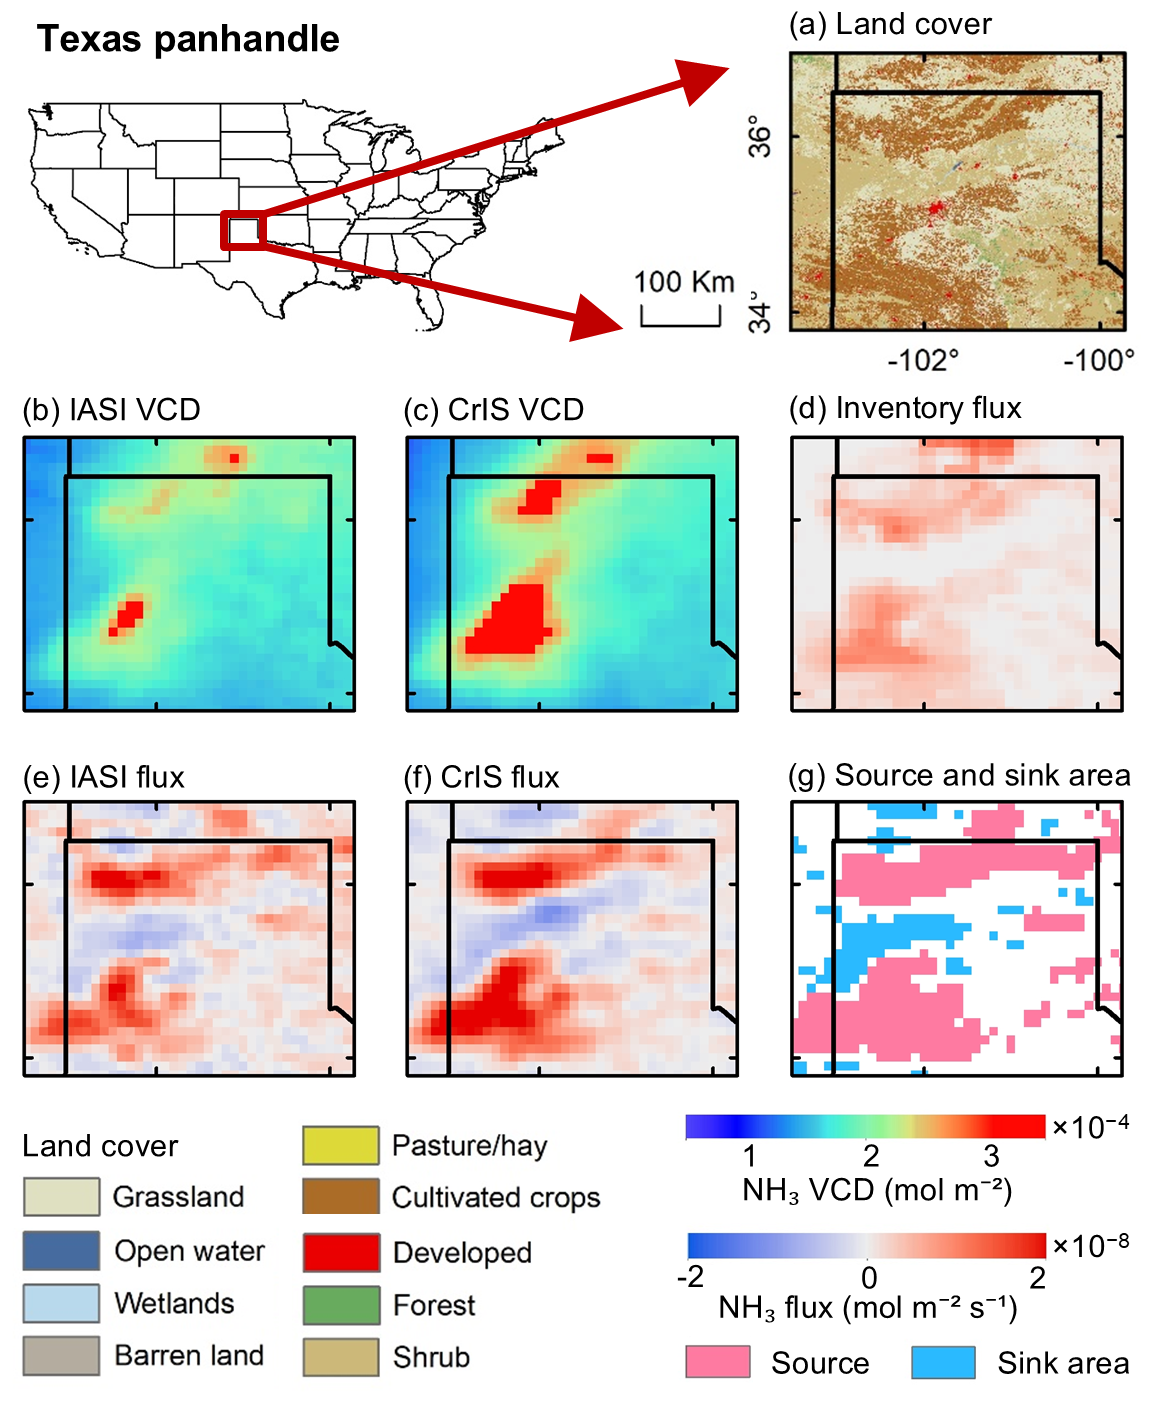
Figure 6(a) Land cover types in the Texas panhandle. (b, c) VCD and (e, f) flux derived from IASI and CrIS NH3 records. (d) NH3 emission from bottom-up inventory. (g) Source and sink areas of NH3 flux, defined as the outside region of ±2σ of DD from IASI and CrIS.
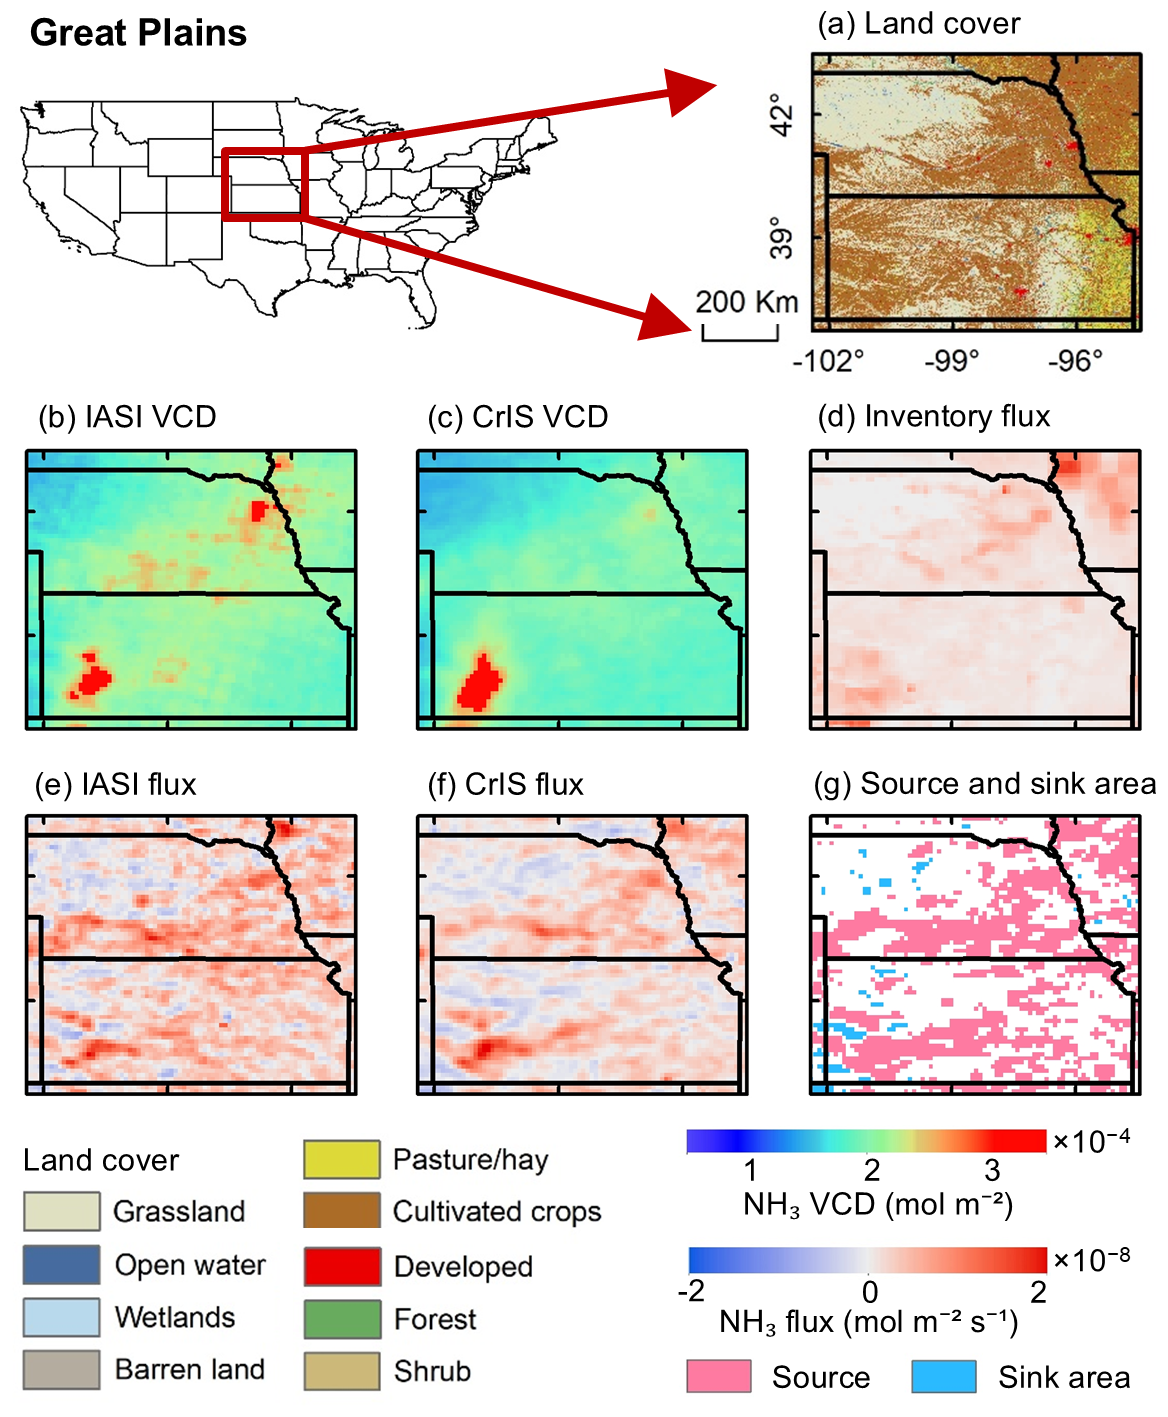
Figure 7(a) Land cover types in the Great Plains. (b, c) VCD and (e, f) flux derived from IASI and CrIS NH3 records. (d) NH3 emission from bottom-up inventory. (g) Source and sink areas of NH3 flux, defined as the outside region of ±2σ of DD from IASI and CrIS.
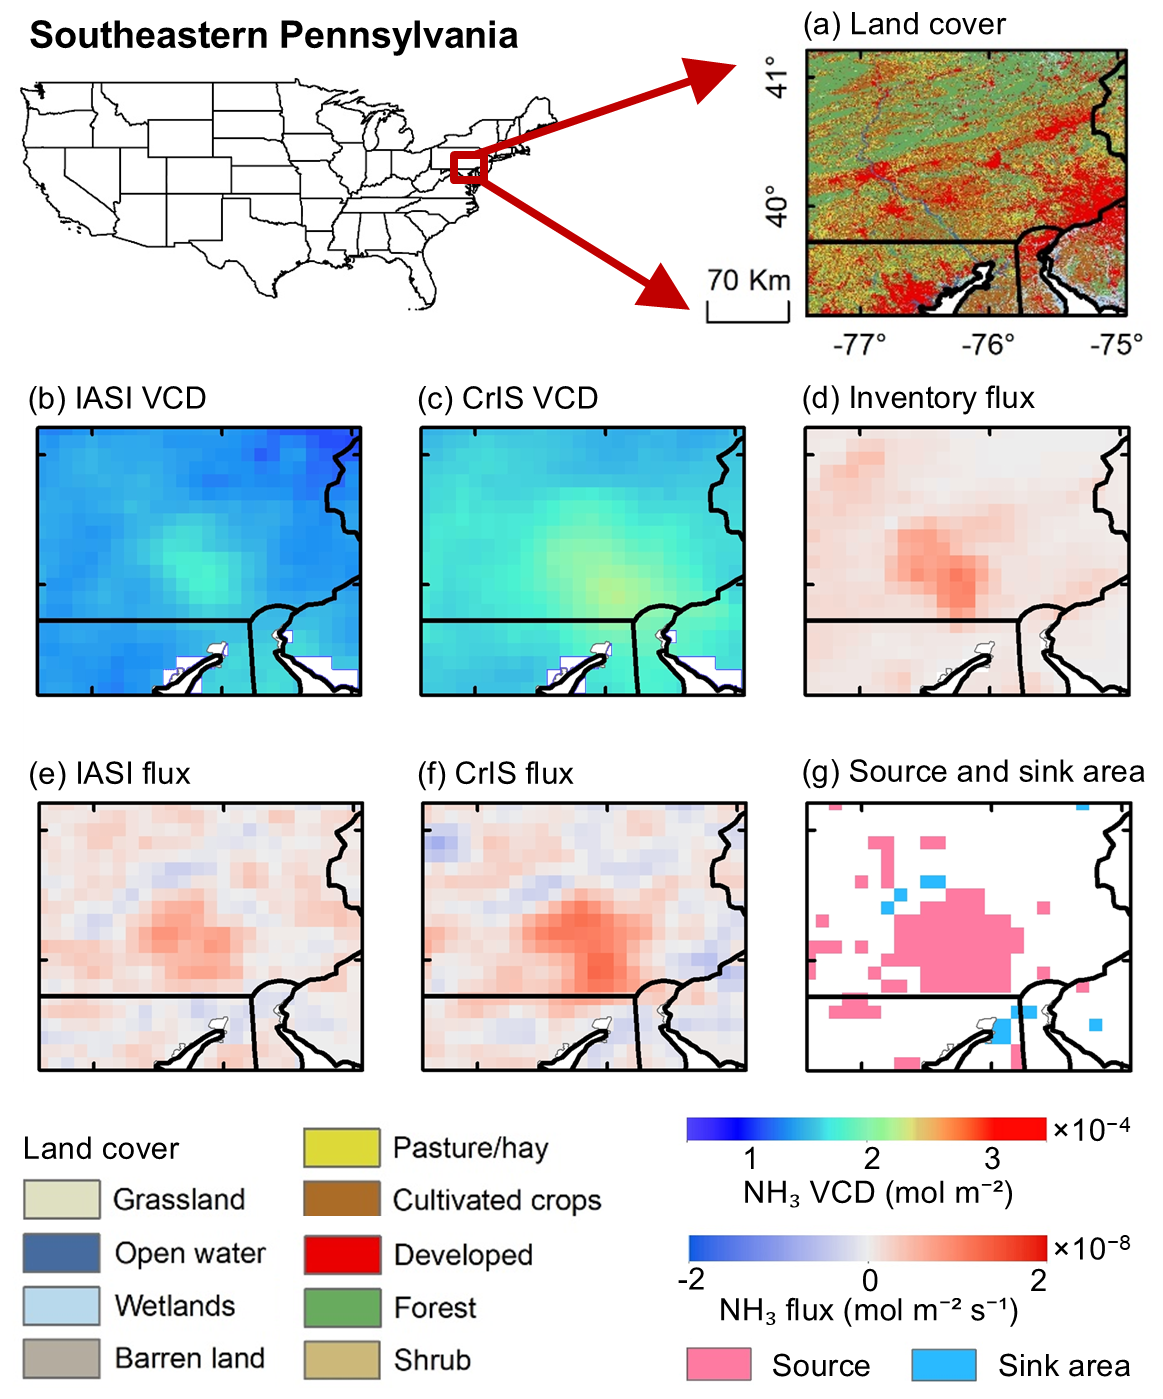
Figure 8(a) Land cover types in Southeastern Pennsylvania. (b, c) VCD and (e, f) flux derived from IASI and CrIS NH3 records. (d) NH3 emission from bottom-up inventory. (g) Source and sink areas of NH3 flux, defined as the outside region of ±2σ of DD from IASI and CrIS.
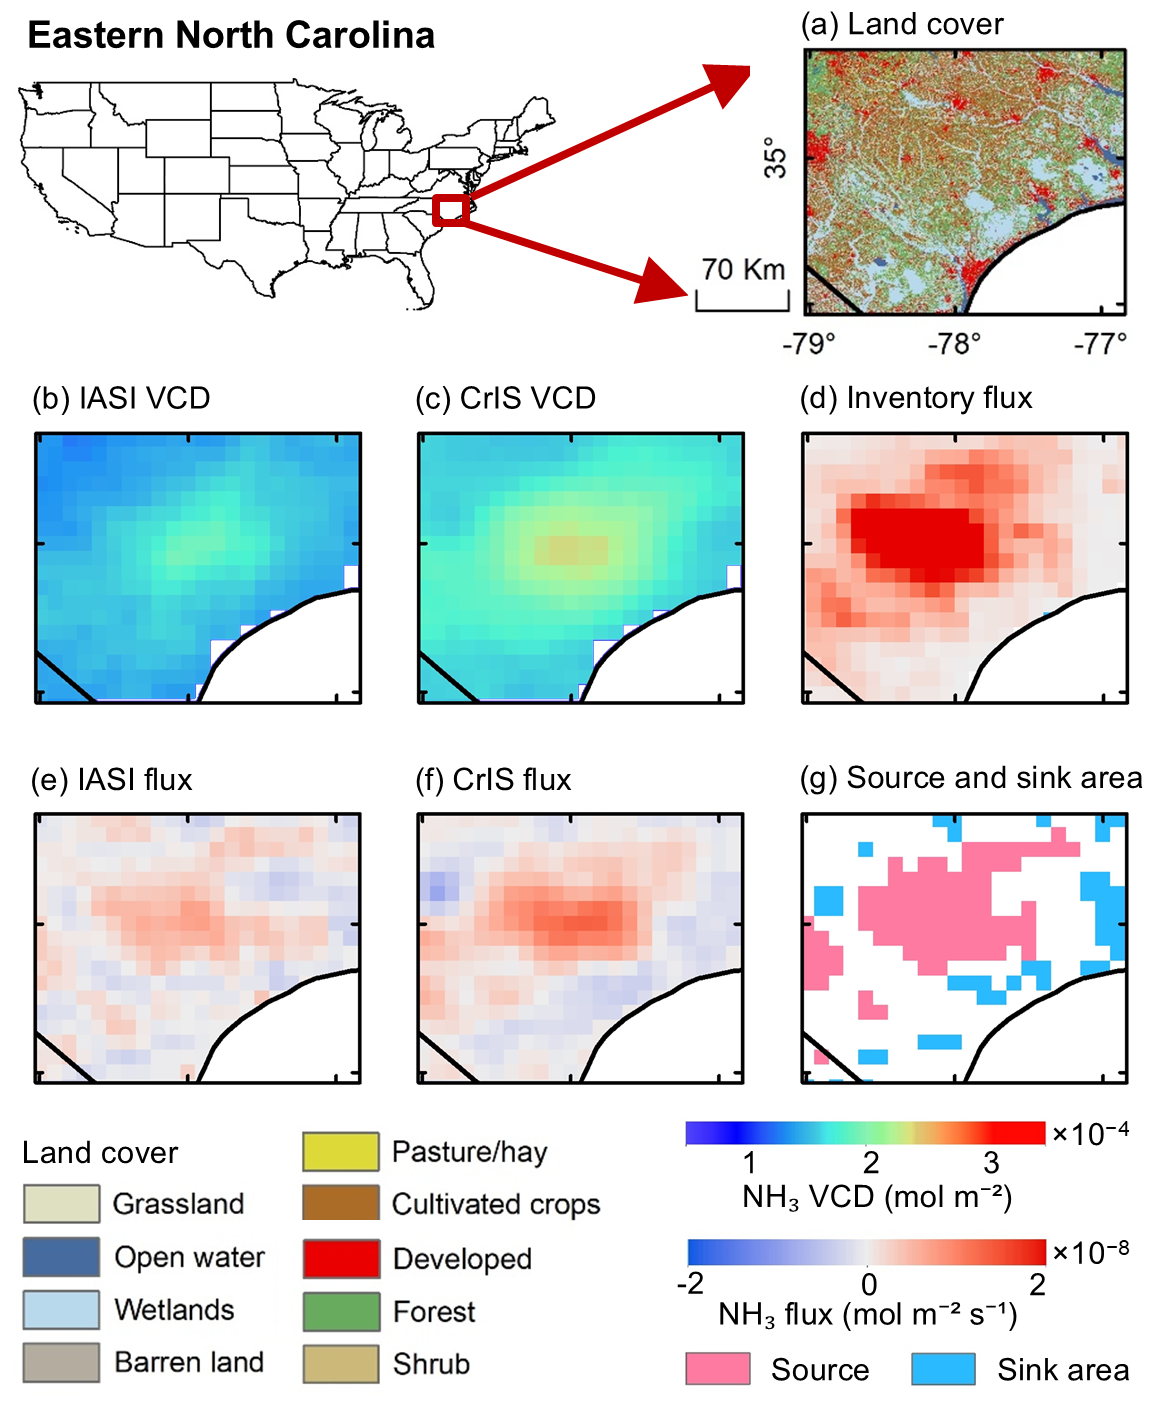
Figure 9(a) Land cover types in Eastern North Carolina. (b, c) VCD and (e, f) flux derived from IASI and CrIS NH3 records. (d) NH3 emission from bottom-up inventory. (g) Source and sink areas of NH3 flux, defined as the outside region of ±2σ of DD from IASI and CrIS.
The two instruments yield broadly consistent spatial patterns of NH3 source and sink, although systematic differences are observed. IASI-derived fluxes tend to resolve finer spatial detail, consistent with its smaller footprint and denser sampling, whereas CrIS-derived fluxes appear smoother but less noisy. These characteristics are complementary and together provide robust evidence for the spatial distribution of NH3 fluxes.
Agricultural lands dominate as NH3 source regions in all cases, with strong fluxes coinciding with intensive cropping and livestock production (e.g., San Joaquin Valley, Texas Panhandle, Great Plains). In contrast, natural and semi-natural landscapes function primarily as sinks. Vegetated landscapes – including forests, shrublands, and grasslands (Figs. 4–8), as well as wetlands (Fig. 9) – show consistent negative fluxes, likely reflecting deposition processes in proximity to nearby sources.
Satellite-derived fluxes also align well with bottom-up inventories, with regional correlation coefficients ranging from 0.08 to 0.86 (Fig. S10 in the Supplement). Agreement is highest in areas with dense agricultural activity (e.g., San Joaquin Valley), whereas discrepancies in regions such as the Great Plains and Snake River Valley suggest that inventories may not capture the full subregional variability evident in satellite observations. These results highlight both the consistency of satellite-derived fluxes with existing inventories and their capability to provide additional spatial detail.
Figures 10 and 11 illustrate the temporal and seasonal patterns of NH3 VCDs and emission/deposition rates across major high-flux regions in the CONUS. Over time, these regions have exhibited upward trends in VCDs (Fig. 10), potentially indicating increasing NH3 emissions. Seasonal cycles in NH3 VCDs are distinct across all regions, with higher values in the warm seasons and lower values in winter, driven by increased agricultural activities, such as livestock operations and fertilizer application, as well as enhanced volatilization during higher temperatures. Observations from CrIS (dark lines) and IASI (light lines) are generally aligned, though CrIS often reports higher VCDs. Differences between CrIS and IASI are largely consistent across seasons, but tend to be more pronounced in the warm months in regions such as the Texas Panhandle and Great Plains (Fig. 10f and h).
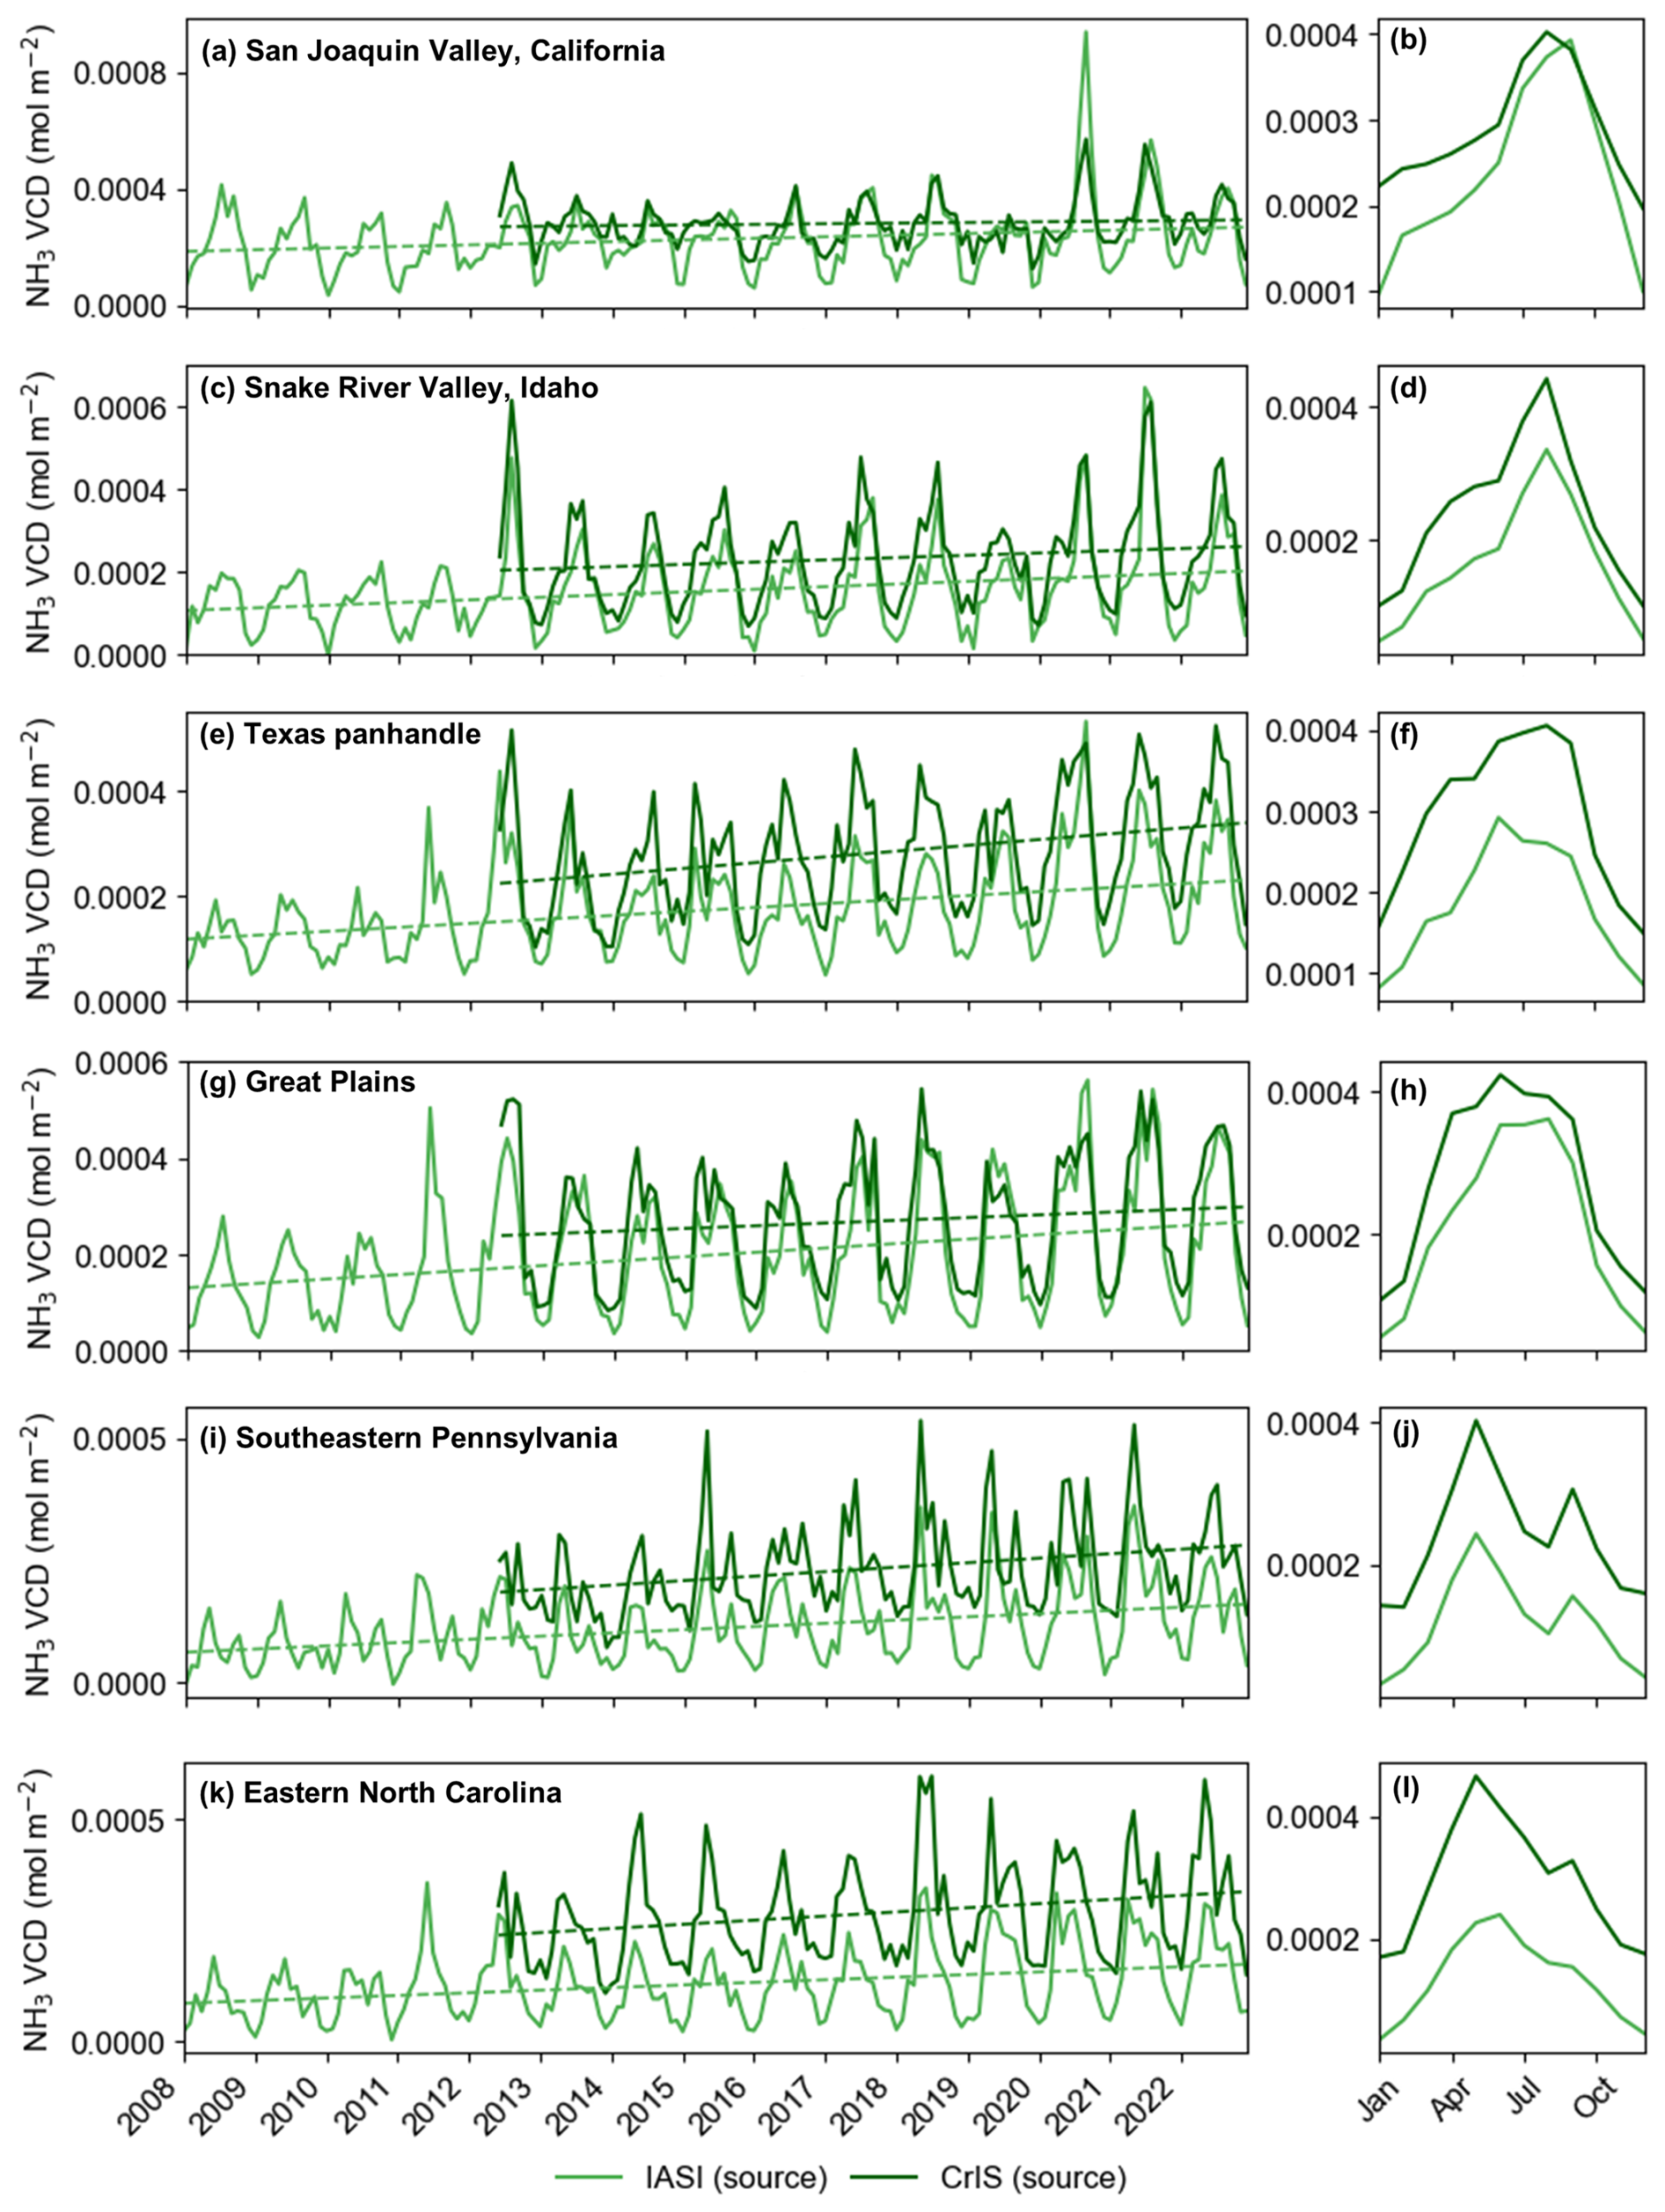
Figure 10Temporal series (a, c, e, g, i, k) and seasonal pattern (b, d, f, h, j, l) of NH3 VCD at source areas from IASI (light lines) and CrIS (dark lines) records in the San Joaquin Valley in California (a, b), Snake River Valley in Idaho (c, d), Texas panhandle (e, f), Great Plains (g, h), Southeastern Pennsylvania (i, j), and Eastern North Carolina (k, l). The dashed lines represent trends derived using linear regression applied to the monthly temporal series data.
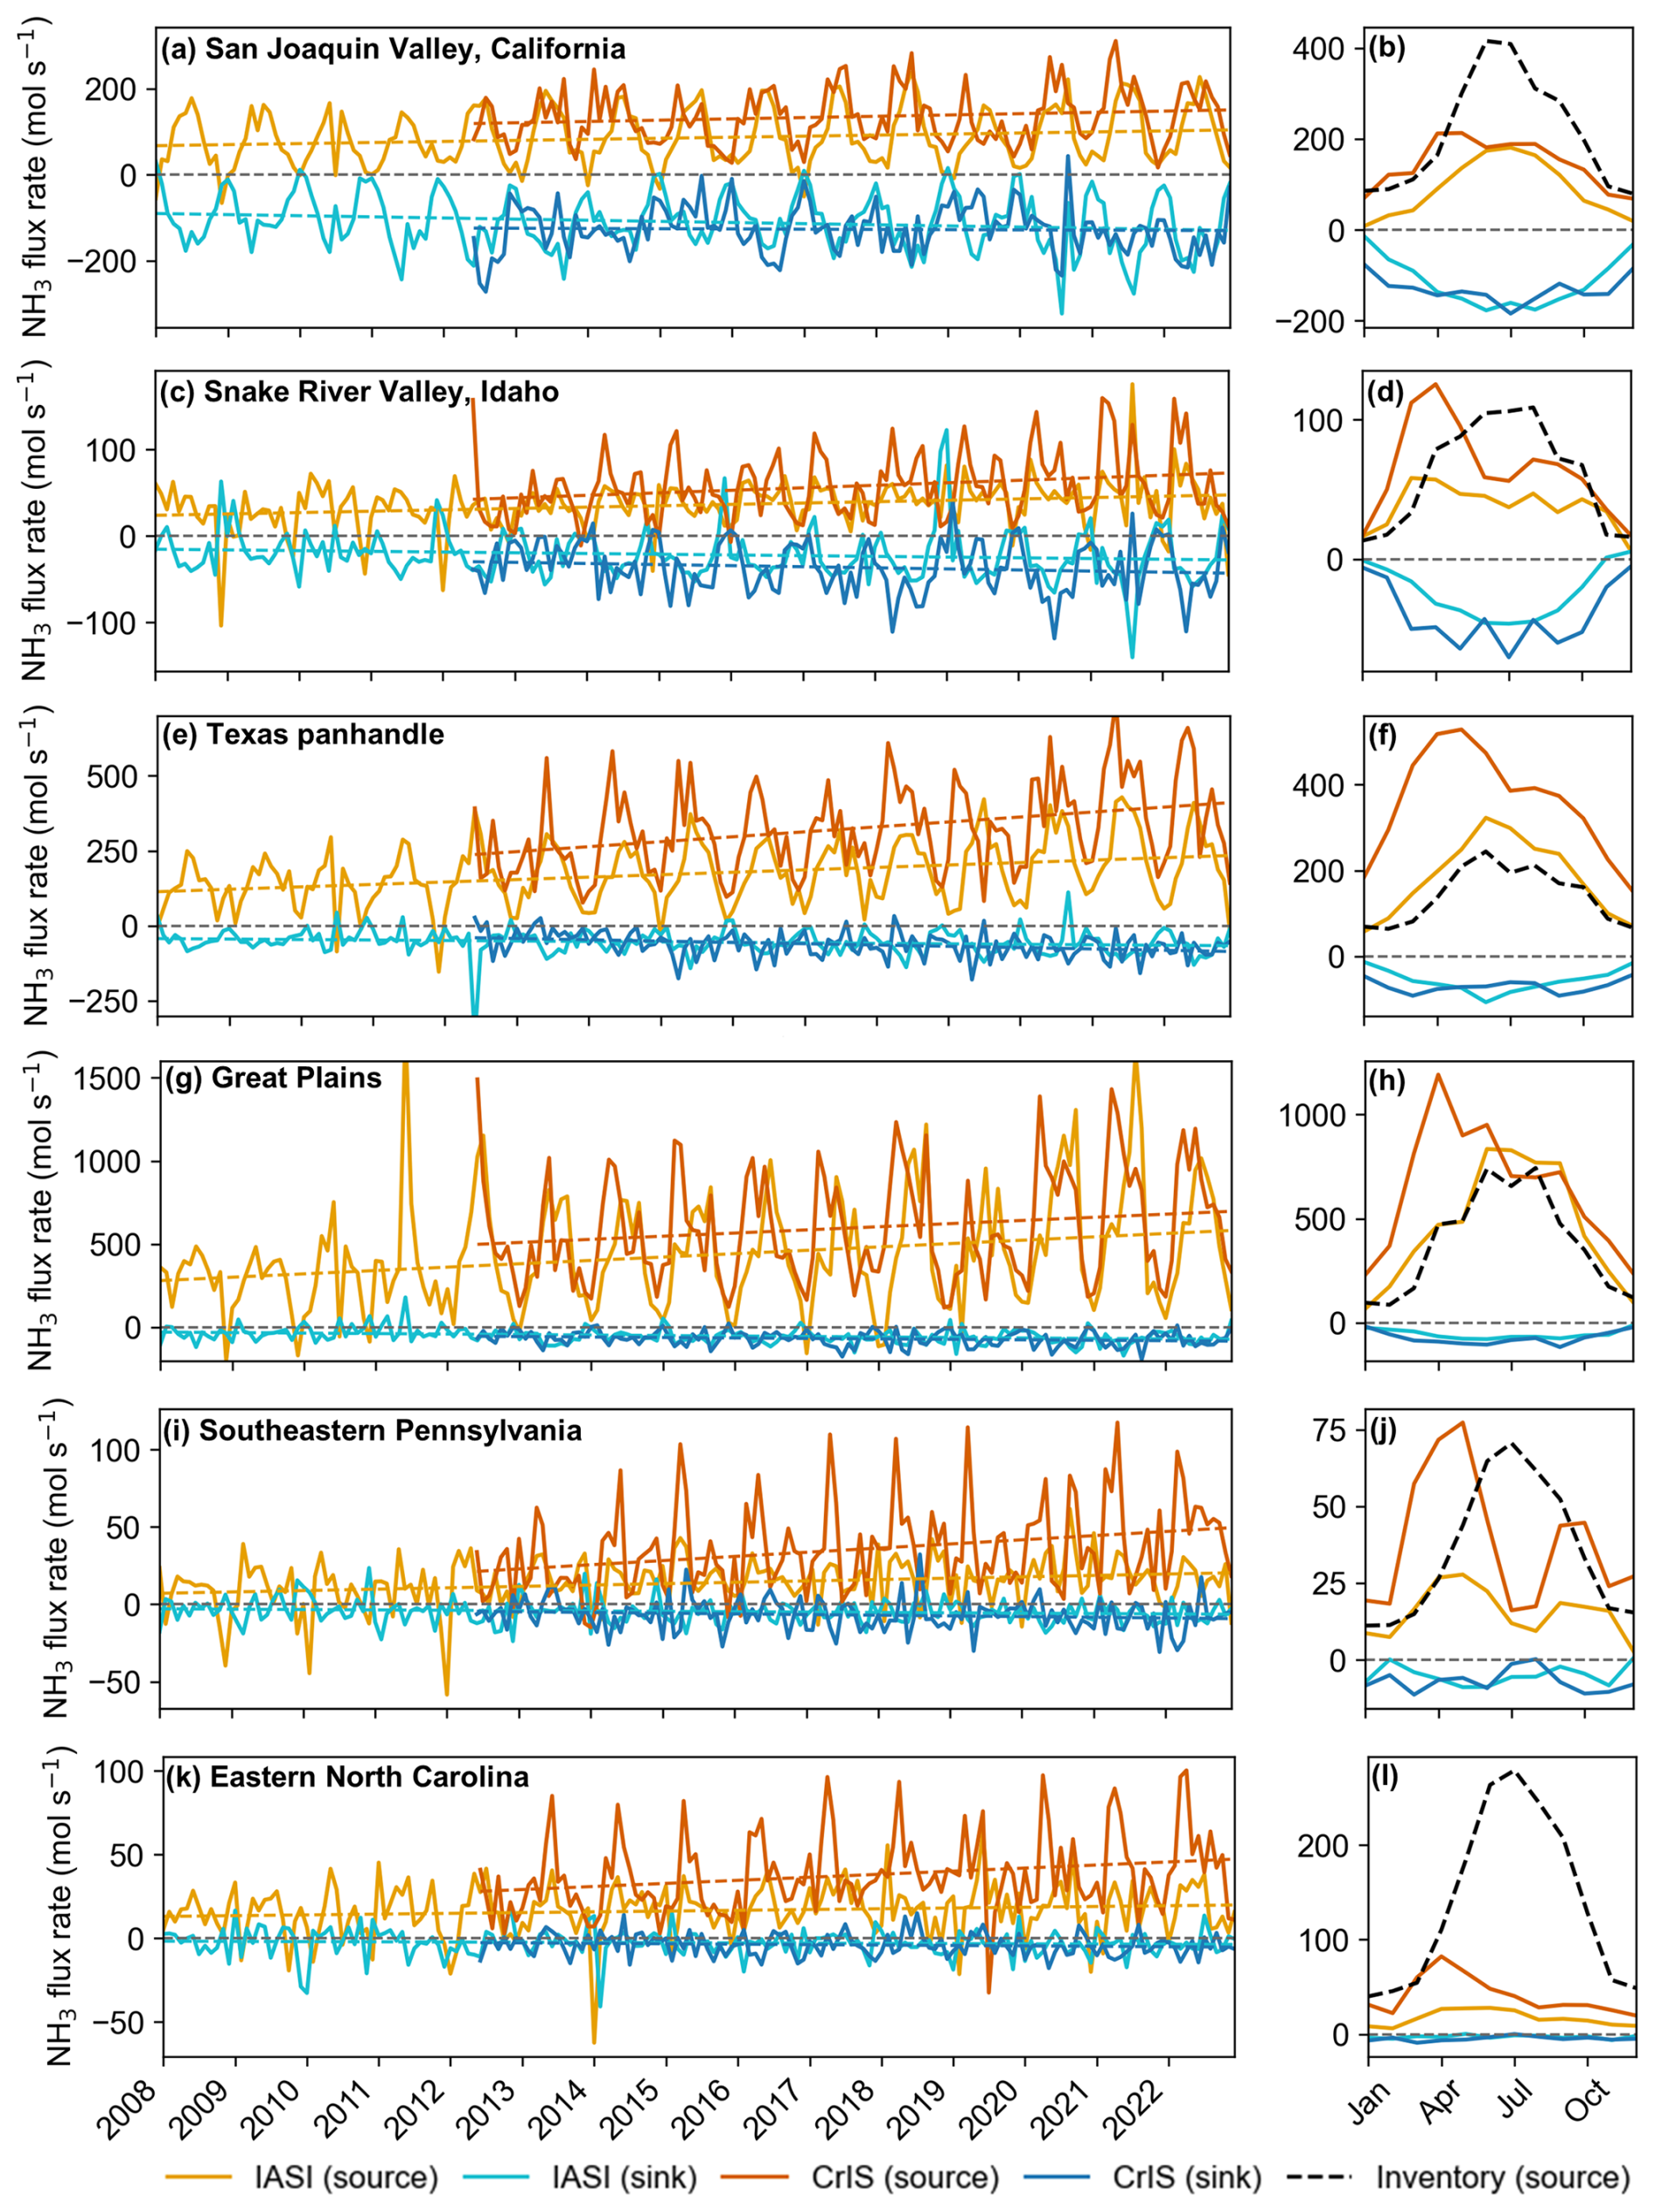
Figure 11Temporal series (a, c, e, g, i, k) and seasonal pattern (b, d, f, h, j, l) of NH3 emission/deposition rate from IASI (light lines) and CrIS (dark lines) records, and NH3 emission rate at source areas from bottom-up inventory (black dashed lines) in the San Joaquin Valley in California (a, b), Snake River Valley in Idaho (c, d), Texas panhandle (e, f), Great Plains (g, h), Southeastern Pennsylvania (i, j), and Eastern North Carolina (k, l).
Satellite-derived NH3 fluxes, including emissions (positive fluxes, yellow lines) and depositions (negative fluxes, blue lines), have exhibited increasing trends over time (Fig. 11). Seasonal patterns in NH3 fluxes reveal mirrored those of VCDs, with emissions peaking in warm months due to heightened agricultural activity and elevated temperatures, while deposition rates also increase during this period, though with smaller magnitudes. This synchronization between emissions and deposition rates suggests that a significant proportion of emitted NH3 is deposited locally. A comparison with bottom-up inventory data reveals key differences. Satellite-based estimates capture diurnal patterns, with IASI observing morning emissions (09:30 LST) and CrIS capturing midday emissions (13:30 LST), whereas inventory data represents modeled averages. In regions like the Texas Panhandle and Great Plains (Fig. 11f and h), satellite observations show higher seasonal emission peaks than inventory models, indicating potential underestimation of seasonal emissions in the inventories. Conversely, inventories overestimate emissions compared to satellite observations in the San Joaquin Valley and Eastern North Carolina (Fig. 11b and l). Seasonality in inventory emissions is consistent with IASI observations in some regions, such as the Texas Panhandle and Great Plains (Fig. 11f and h). However, in the Snake River Valley, Southeastern Pennsylvania, and Eastern North Carolina (Fig. 11d, j, and l), inventory displays entirely different seasonal signals compared to satellite data, underscoring the value of satellite observations in capturing the temporal dynamics of agricultural emissions. CrIS consistently observes larger NH3 emissions than IASI, while deposition differences are smaller. Notably, the difference in CrIS and IASI is most obvious in spring across all the regions. CrIS detects early spring peaks in regions such as the Texas Panhandle and Great Plains (Fig. 11f and h), which are not captured by IASI, highlighting variations in sensitivity between the two instruments.
4.1 Robustness of satellite-based NH3 flux estimates
Our findings underscore the value of satellite observations in advancing the characterization of NH3 fluxes. With the ability to produce flux estimates at relatively fine spatial and temporal scales, satellite datasets can help understand emission and deposition dynamics, thereby providing additional insights into seasonal variability that traditional bottom-up inventories often miss.
A key advancement of this work is the combined use of IASI (morning overpass) and CrIS (midday overpass). By combining these two instruments, it is possible to achieve quasi-diurnal coverage and capture the sub-daily variability of NH3 fluxes that is challenging to discern with a single satellite product. This synergy is especially evident in spring, when the transition from cooler morning to warmer midday conditions can amplify NH3 emissions. CrIS frequently shows an early-spring emission pulse that is less pronounced in IASI data, especially in areas with substantial emissions (Fig. 11). Spring emerges as a critical transitional period, characterized by moderate temperature differences between IASI and CrIS observations (Fig. S11 in the Supplement) and relatively high NH3 fluxes (Fig. 10). This difference may be attributed to the instruments' distinct observational characteristics, such as overpass times, and sensitivities under varying seasonal conditions, and differing detection limits. A further strength of combining different instruments lies in the expanded data coverage. Our error analysis indicates a strong dependence of random errors (Fig. 1), suggesting that the flux uncertainties drop significantly with denser observations (Wang et al., 2023). By merging multiple overpasses and employing spatial smoothing through physical oversampling, we can substantially reduce random errors and enhance flux reliability.
Our satellite-based approach demonstrates some advantages over bottom-up inventories, in which satellite-based observations detect finer-scale fluxes and uncover seasonal patterns not always well represented in inventory data. Previous studies have shown that top-down approaches using satellite observations significantly reduce uncertainties in emission estimates (Byrne et al., 2024; Evangeliou et al., 2021). Each method has unique strengths, and integrating them offers a robust pathway to make more reliable and comprehensive estimates (Tian et al., 2020). While bottom-up methods provide critical context on local processes such as fertilizer application (Zhang et al., 2018), satellite data can validate or refine emission factors and aid in reconciling regional to continental-scale uncertainties (Chen et al., 2021; Zhu et al., 2013).
Despite their advantages, infrared-based NH3 satellite retrievals have certain limitations. Weak thermal contrast and cooler temperatures, especially in winter, reduce detection efficiency (Clarisse et al., 2010; Sutton et al., 2013), and retrievals are limited to daytime clear-sky conditions, potentially biasing results due to NH3's strong diurnal cycle (Blanes-Vidal et al., 2008). IASI columns differ from ground-based measurements by % (Dammers et al., 2016), with errors highly dependent on thermal contrast (Van Damme et al., 2014). CrIS retrievals show ∼10 %–30 % error in total columns and larger uncertainty at low concentrations (Shephard et al., 2020). While both IASI and CrIS have demonstrated good long-term stability through calibration monitoring and ground-based validation (Clarisse et al., 2023; Van Damme et al., 2015; Chen et al., 2017; Dammers et al., 2017), subtle time-dependent biases cannot be fully excluded. Overcoming these challenges requires ongoing refinements to retrieval algorithms, particularly in cloud screening and thermal contrast corrections. As satellite missions and retrieval techniques continue to improve, we anticipate further reductions in retrieval biases and increases in data coverage, leading to even more reliable, near real-time estimates of NH3 fluxes.
4.2 Spatiotemporal pattern of NH3 flux
Beyond demonstrating robust satellite-based flux estimates, our analysis exposes clear spatial gradients and pronounced seasonality in NH3 sources and sinks across the CONUS. Both IASI- and CrIS-derived fluxes identify consistent emission hotspots (Fig. 2) in the San Joaquin Valley (California), Snake River Valley (Idaho), Texas Panhandle, Great Plains, Southeastern Pennsylvania, and Eastern North Carolina (Figs. 4–9), characterized by intensive livestock operations and fertilizer application, which are consistent with existing maps of VCD hotspots (Chen et al., 2021; Wang et al., 2021) and emission mapping efforts (Evangeliou et al., 2021; Zhang et al., 2012; Sitwell et al., 2022). Other than emissions, our directional derivariate approach can detect sinks in vegetation-dense areas surrounding these emission sources, such as shrublands and scrublands, forests, grasslands, and wetlands, highlighting the role of nearby ecosystems in capturing NH3 through deposition (Pan et al., 2021; Hu et al., 2021; Azouz et al., 2019; Kharol et al., 2018; Loubet et al., 2009). Similar hotspots of deposition downwind of intensive agricultural regions have been reported in model-based studies (Ellis et al., 2013; Hu et al., 2021; Zhang et al., 2012). These hotspots often coincide with high NH3 loadings, large leaf area indices, and micrometeorological conditions favorable for stomatal and cuticular uptake (Sutton et al., 2009). This localized deposition has caused negative effects (e.g., soil acidification, eutrophication, biodiversity loss) in sensitive ecosystems (Krupa, 2003; Pearson and Stewart, 1993). Our results indicate an upward trend in deposition (Fig. 11) that could amplify these impacts in the future.
Our results further indicate that deposition near sources is the predominant NH3 removal pathway, rather than chemical transformation. This pattern is likely reflecting acid-limited conditions that suppress the formation of ammonium particulate matter (Pan et al., 2024). The relatively high dry deposition velocity of NH3 (Hesterberg et al., 1996; Kirchner et al., 2005) and its slow chemical reaction rate with acidic species under acid-limited conditions (Sutton et al., 2009) reinforce the small contribution of chemical pathways to NH3 removal in many agricultural hotspots. Consistent with recent modeling and observational studies (Luo et al., 2022; Warner et al., 2017), our multi-year analysis reveals a gradual but evident increase in NH3 fluxes over time (Fig. 11), raising concerns that expanding agricultural activities may be offsetting air quality gains achieved through reductions in nitrogen oxides (Li et al., 2016).
The seasonality of NH3 fluxes (Fig. 11) is closely linked to meteorological factors and agricultural activities, with enhanced fluxes in warm months due to increased volatilization from livestock production and fertilizer application (Tang et al., 2018; Warner et al., 2017; Nelson et al., 2017) and relatively lower fluxes in winter. These seasonal signals underscore the importance of timely policy by controlling agricultural practices to manage NH3 emissions and subsequent environmental impacts. Successful examples from Western Europe demonstrate that targeted regulations can effectively reduce NH3 emissions (Liu et al., 2022). Furthermore, reducing ammonia emissions proves more cost-effective than controlling nitrogen oxides for mitigating PM2.5 pollution (Gu et al., 2021). These findings emphasize the profound influence of agricultural practices and temperature regimes on NH3 flux dynamics, underscoring the need for integrated strategies to address both local and regional air quality concerns.
This study highlights the utility of the directional derivative approach applied to satellite data for estimating NH3 fluxes across the CONUS. By leveraging IASI and CrIS observations, we addresse challenges related to spatial variability and seasonal signals, providing insights into NH3 emission and deposition dynamics.
Our findings indicate that deposition serves as a significant removal pathway for NH3. NH3 sinks are predominantly located near source regions, particularly in vegetation-dense areas where rapid dry deposition occurs. Major NH3 emission hotspots are identified in agricultural regions, including the San Joaquin Valley in California, the Snake River Valley in Idaho, the Texas Panhandle, the Great Plains, Southeastern Pennsylvania, and Eastern North Carolina. NH3 fluxes exhibite a clear seasonal pattern, peaking during warm months due to increased volatilization from agricultural activities and declining during winter with lower temperatures. Increasing trends in NH3 fluxes highlight the growing impact of intensified agricultural practices, emphasizing the need for improved monitoring and mitigation strategies. While satellite-derived NH3 fluxes strongly align with bottom-up inventories, satellite observations offer additional value by capturing diurnal variabilities.
This study demonstrates the value of satellite observations for high-resolution monitoring of reactive nitrogen cycling, particularly in regions with limited ground-based measurements. These findings offer critical insights for understanding nitrogen loss and deposition processes, supporting enhanced nitrogen management strategies and environmental policy efforts aimed at mitigating ammonia's environmental impacts and managing reactive nitrogen in the atmosphere.
The IASI L2 ammonia satellite observations are available from the AERIS data infrastructure (https://doi.org/10.25326/10, Clarisse et al., 2018). The CrIS L2 ammonia satellite observations can be obtained by request to Mark Shephard (mark.shephard@ec.gc.ca). The ERA5 data are available at https://doi.org/10.24381/cds.adbb2d47 (Hersbach et al., 2023). Code for flux estimation can be found at https://doi.org/10.5281/zenodo.15001466 (Sun, 2025). The annual ammonia flux dataset derived in this study (2008–2022 for IASI and 2012–2022 for CrIS, 0.1° resolution over the CONUS) is publicly available at Figshare (https://doi.org/10.6084/m9.figshare.30229648 (Li et al., 2025)).
The supplement related to this article is available online at https://doi.org/10.5194/acp-26-703-2026-supplement.
KS and KG designed the study and coordinated the paper. LC, MVD and PFC contributed to the IASI ammonia observations. KCP and MWS provided the CrIS ammonia observations. KS wrote the code for the directional derivative approach. ZL performed the estimations and analyses, and wrote the paper. All the authors contributed to the final version of the paper.
The contact author has declared that none of the authors has any competing interests.
Publisher's note: Copernicus Publications remains neutral with regard to jurisdictional claims made in the text, published maps, institutional affiliations, or any other geographical representation in this paper. The authors bear the ultimate responsibility for providing appropriate place names. Views expressed in the text are those of the authors and do not necessarily reflect the views of the publisher.
This research has been supported by NASA's Interdisciplinary Science (IDS) Program (grant no. 80NSSC24K0398), USDA NIFA – Hatch (grant no. 7001159), and NSF CAREER (grant no. AGS 2338758).
This paper was edited by Jeffrey Geddes and reviewed by two anonymous referees.
Adams, C., McLinden, C. A., Shephard, M. W., Dickson, N., Dammers, E., Chen, J., Makar, P., Cady-Pereira, K. E., Tam, N., Kharol, S. K., Lamsal, L. N., and Krotkov, N. A.: Satellite-derived emissions of carbon monoxide, ammonia, and nitrogen dioxide from the 2016 Horse River wildfire in the Fort McMurray area, Atmos. Chem. Phys., 19, 2577–2599, https://doi.org/10.5194/acp-19-2577-2019, 2019
Asman, W. A. H., Sutton, M. A., and Schjørring, J. K.: Ammonia: emission, atmospheric transport and deposition, New Phytologist, 139, 27–48, https://doi.org/10.1046/j.1469-8137.1998.00180.x, 1998.
Ayazpour, Z., Sun, K., Zhang, R., and Shen, H.: Evaluation of the directional derivative approach for timely and accurate satellite-based emission estimation using chemical transport model simulation of nitrogen oxides, J. Geophys. Res., 130, e2024JD042817, https://doi.org/10.1029/2024jd042817, 2025.
Azouz, N., Drouet, J.-L., Beekmann, M., Siour, G., Wichink Kruit, R., and Cellier, P.: Comparison of spatial patterns of ammonia concentration and dry deposition flux between a regional Eulerian chemistry-transport model and a local Gaussian plume model, Air Qual. Atmos. Health, 12, 719–729, https://doi.org/10.1007/s11869-019-00691-y, 2019.
Behera, S. N. and Sharma, M.: Investigating the potential role of ammonia in ion chemistry of fine particulate matter formation for an urban environment, Sci. Total Environ., 408, 3569–3575, https://doi.org/10.1016/j.scitotenv.2010.04.017, 2010.
Beirle, S., Borger, C., Dörner, S., Li, A., Hu, Z., Liu, F., Wang, Y., and Wagner, T.: Pinpointing nitrogen oxide emissions from space, Sci Adv, 5, eaax9800, https://doi.org/10.1126/sciadv.aax9800, 2019.
Beirle, S., Borger, C., Dörner, S., Eskes, H., Kumar, V., de Laat, A., and Wagner, T.: Catalog of NOx emissions from point sources as derived from the divergence of the NO2 flux for TROPOMI, Earth Syst. Sci. Data, 13, 2995–3012, https://doi.org/10.5194/essd-13-2995-2021, 2021.
Blanes-Vidal, V., Hansen, M. N., Pedersen, S., and Rom, H. B.: Emissions of ammonia, methane and nitrous oxide from pig houses and slurry: Effects of rooting material, animal activity and ventilation flow, Agric. Ecosyst. Environ., 124, 237–244, https://doi.org/10.1016/j.agee.2007.10.002, 2008.
Bouwman, A. F., Lee, D. S., Asman, W. A. H., Dentener, F. J., Van Der Hoek, K. W., and Olivier, J. G. J.: A global high-resolution emission inventory for ammonia, Global Biogeochem. Cycles, 11, 561–587, https://doi.org/10.1029/97gb02266, 1997.
Byrne, B., Liu, J., Bowman, K. W., Pascolini-Campbell, M., Chatterjee, A., Pandey, S., Miyazaki, K., van der Werf, G. R., Wunch, D., Wennberg, P. O., Roehl, C. M., and Sinha, S.: Carbon emissions from the 2023 Canadian wildfires, Nature, 633, 835–839, https://doi.org/10.1038/s41586-024-07878-z, 2024.
Cao, H., Henze, D. K., Shephard, M. W., Dammers, E., Cady-Pereira, K., Alvarado, M., Lonsdale, C., Luo, G., Yu, F., Zhu, L., Danielson, C. G., and Edgerton, E. S.: Inverse modeling of NH3 sources using CrIS remote sensing measurements, Environ. Res. Lett., 15, 104082, https://doi.org/10.1088/1748-9326/abb5cc, 2020.
Cao, H., Henze, D. K., Zhu, L., Shephard, M. W., Cady-Pereira, K., Dammers, E., Sitwell, M., Heath, N., Lonsdale, C., Bash, J. O., Miyazaki, K., Flechard, C., Fauvel, Y., Kruit, R. W., Feigenspan, S., Brümmer, C., Schrader, F., Twigg, M. M., Leeson, S., Tang, Y. S., Stephens, A. C. M., Braban, C., Vincent, K., Meier, M., Seitler, E., Geels, C., Ellermann, T., Sanocka, A., and Capps, S. L.: 4D-Var inversion of European NH3 emissions using CrIS NH3 measurements and GEOS-chem adjoint with bi-directional and uni-directional flux schemes, J. Geophys. Res., 127, e2021JD035687, https://doi.org/10.1029/2021JD035687, 2022.
Chen, Y., Han, Y., and Weng, F.: Characterization of long-term stability of Suomi NPP Cross-Track Infrared Sounder spectral calibration, IEEE Trans. Geosci. Remote Sens., 55, 1147–1159, https://doi.org/10.1109/TGRS.2016.2620438, 2017.
Chen, Y., Shen, H., Kaiser, J., Hu, Y., Capps, S. L., Zhao, S., Hakami, A., Shih, J.-S., Pavur, G. K., Turner, M. D., Henze, D. K., Resler, J., Nenes, A., Napelenok, S. L., Bash, J. O., Fahey, K. M., Carmichael, G. R., Chai, T., Clarisse, L., Coheur, P.-F., Van Damme, M., and Russell, A. G.: High-resolution hybrid inversion of IASI ammonia columns to constrain US ammonia emissions using the CMAQ adjoint model, Atmos. Chem. Phys., 21, 2067–2082, https://doi.org/10.5194/acp-21-2067-2021, 2021.
Clarisse, L., Shephard, M. W., Dentener, F., Hurtmans, D., Cady-Pereira, K., Karagulian, F., Van Damme, M., Clerbaux, C., and Coheur, P.-F.: Satellite monitoring of ammonia: A case study of the San Joaquin Valley, Journal of Geophysical Research: Atmospheres, 115, https://doi.org/10.1029/2009JD013291, 2010.
Clarisse, L., Van Damme, M., and Coheur, P.-F.: Standard daily IASI/Metop-A ULB-LATMOS ammonia (NH3) L2 product (total column), AERIS [data set], https://doi.org/10.25326/10, 2018.
Clarisse, L., Franco, B., Van Damme, M., Di Gioacchino, T., Hadji-Lazaro, J., Whitburn, S., Noppen, L., Hurtmans, D., Clerbaux, C., and Coheur, P.: The IASI NH3 version 4 product: averaging kernels and improved consistency, Atmos. Meas. Tech., 16, 5009–5028, https://doi.org/10.5194/amt-16-5009-2023, 2023.
Clerbaux, C., Boynard, A., Clarisse, L., George, M., Hadji-Lazaro, J., Herbin, H., Hurtmans, D., Pommier, M., Razavi, A., Turquety, S., Wespes, C., and Coheur, P.-F.: Monitoring of atmospheric composition using the thermal infrared IASI/MetOp sounder, Atmos. Chem. Phys., 9, 6041–6054, https://doi.org/10.5194/acp-9-6041-2009, 2009.
Dammers, E., Palm, M., Van Damme, M., Vigouroux, C., Smale, D., Conway, S., Toon, G. C., Jones, N., Nussbaumer, E., Warneke, T., Petri, C., Clarisse, L., Clerbaux, C., Hermans, C., Lutsch, E., Strong, K., Hannigan, J. W., Nakajima, H., Morino, I., Herrera, B., Stremme, W., Grutter, M., Schaap, M., Wichink Kruit, R. J., Notholt, J., Coheur, P.-F., and Erisman, J. W.: An evaluation of IASI−NH3 with ground-based Fourier transform infrared spectroscopy measurements, Atmos. Chem. Phys., 16, 10351–10368, https://doi.org/10.5194/acp-16-10351-2016, 2016.
Dammers, E., Shephard, M. W., Palm, M., Cady-Pereira, K., Capps, S., Lutsch, E., Strong, K., Hannigan, J. W., Ortega, I., Toon, G. C., Stremme, W., Grutter, M., Jones, N., Smale, D., Siemons, J., Hrpcek, K., Tremblay, D., Schaap, M., Notholt, J., and Erisman, J. W.: Validation of the CrIS fast physical NH3 retrieval with ground-based FTIR, Atmos. Meas. Tech., 10, 2645–2667, https://doi.org/10.5194/amt-10-2645-2017, 2017.
Dammers, E., McLinden, C. A., Griffin, D., Shephard, M. W., Van Der Graaf, S., Lutsch, E., Schaap, M., Gainairu-Matz, Y., Fioletov, V., Van Damme, M., Whitburn, S., Clarisse, L., Cady-Pereira, K., Clerbaux, C., Coheur, P. F., and Erisman, J. W.: NH3 emissions from large point sources derived from CrIS and IASI satellite observations, Atmos. Chem. Phys., 19, 12261–12293, https://doi.org/10.5194/acp-19-12261-2019, 2019.
Dentener, F. J. and Crutzen, P. J.: A three-dimensional model of the global ammonia cycle, J. Atmos. Chem., 19, 331–369, https://doi.org/10.1007/bf00694492, 1994.
Ellis, R. A., Jacob, D. J., Sulprizio, M. P., Zhang, L., Holmes, C. D., Schichtel, B. A., Blett, T., Porter, E., Pardo, L. H., and Lynch, J. A.: Present and future nitrogen deposition to national parks in the United States: critical load exceedances, Atmos. Chem. Phys., 13, 9083–9095, https://doi.org/10.5194/acp-13-9083-2013, 2013.
Erisman, J. W., Galloway, J. N., Seitzinger, S., Bleeker, A., Dise, N. B., Petrescu, A. M. R., Leach, A. M., and de Vries, W.: Consequences of human modification of the global nitrogen cycle, Philos. Trans. R. Soc. Lond. B Biol. Sci., 368, 20130116, https://doi.org/10.1098/rstb.2013.0116, 2013.
Evangeliou, N., Balkanski, Y., Eckhardt, S., Cozic, A., Van Damme, M., Coheur, P.-F., Clarisse, L., Shephard, M. W., Cady-Pereira, K. E., and Hauglustaine, D.: 10 year satellite-constrained fluxes of ammonia improve performance of chemistry transport models, Atmos. Chem. Phys., 21, 4431–4451, https://doi.org/10.5194/acp-21-4431-2021, 2021.
Galloway, J. N., Aber, J. D., Erisman, J. W., Seitzinger, S. P., Howarth, R. W., Cowling, E. B., and Cosby, B. J.: The nitrogen cascade, Bioscience, 53, 341, https://doi.org/10.1641/0006-3568(2003)053[0341:tnc]2.0.co;2, 2003.
Galloway, J. N., Dentener, F. J., Capone, D. G., Boyer, E. W., Howarth, R. W., Seitzinger, S. P., Asner, G. P., Cleveland, C. C., Green, P. A., Holland, E. A., Karl, D. M., Michaels, A. F., Porter, J. H., Townsend, A. R., and Vöosmarty, C. J.: Nitrogen cycles: Past, present, and future, Biogeochemistry, 70, 153–226, https://doi.org/10.1007/s10533-004-0370-0, 2004.
Goldberg, D. L., Harkey, M., de Foy, B., Judd, L., Johnson, J., Yarwood, G., and Holloway, T.: Evaluating NOx emissions and their effect on O3 production in Texas using TROPOMI NO2 and HCHO, Atmos. Chem. Phys., 22, 10875–10900, https://doi.org/10.5194/acp-22-10875-2022, 2022.
Gong, C., Tian, H., Liao, H., Pan, N., Pan, S., Ito, A., Jain, A. K., Kou-Giesbrecht, S., Joos, F., Sun, Q., Shi, H., Vuichard, N., Zhu, Q., Peng, C., Maggi, F., Tang, F. H. M., and Zaehle, S.: Global net climate effects of anthropogenic reactive nitrogen, Nature, 632, 557–563, https://doi.org/10.1038/s41586-024-07714-4, 2024.
Gu, B., Zhang, L., Van Dingenen, R., Vieno, M., Van Grinsven, H. J., Zhang, X., Zhang, S., Chen, Y., Wang, S., Ren, C., Rao, S., Holland, M., Winiwarter, W., Chen, D., Xu, J., and Sutton, M. A.: Abating ammonia is more cost-effective than nitrogen oxides for mitigating PM2.5 air pollution, Science, 374, 758–762, https://doi.org/10.1126/science.abf8623, 2021.
Heil, G. W. and Diemont, W. H.: Raised nutrient levels change heathland into grassland, Vegetatio, 53, 113–120, https://doi.org/10.1007/bf00043031, 1983.
Hersbach, H., Bell, B., Berrisford, P., Hirahara, S., Horányi, A., Muñoz-Sabater, J., Nicolas, J., Peubey, C., Radu, R., Schepers, D., Simmons, A., Soci, C., Abdalla, S., Abellan, X., Balsamo, G., Bechtold, P., Biavati, G., Bidlot, J., Bonavita, M., De Chiara, G., Dahlgren, P., Dee, D., Diamantakis, M., Dragani, R., Flemming, J., Forbes, R., Fuentes, M., Geer, A., Haimberger, L., Healy, S., Hogan, R. J., Hólm, E., Janisková, M., Keeley, S., Laloyaux, P., Lopez, P., Lupu, C., Radnoti, G., de Rosnay, P., Rozum, I., Vamborg, F., Villaume, S., and Jean-Noël Thépaut: The ERA5 global reanalysis, Quart. J. Roy. Meteor. Soc., 146, 1999–2049, https://doi.org/10.1002/qj.3803, 2020.
Hersbach, H., Bell, B., Berrisford, P., Biavati, G., Horányi, A., Muñoz-Sabater, J., Nicolas, J., Peubey, C., Radu, R., Rozum, I., Schepers, D., Simmons, A., Soci, C., Dee, D., and Thépaut, J.-N.: ERA5 hourly data on single levels from 1940 to present, Climate Data Store [data set], https://doi.org/10.24381/cds.adbb2d47, 2023.
Hesterberg, R., Blatter, A., Fahrni, M., Rosset, M., Neftel, A., Eugster, W., and Wanner, H.: Deposition of nitrogen-containing compounds to an extensively managed grassland in central Switzerland, Environ. Pollut., 91, 21–34, https://doi.org/10.1016/0269-7491(95)00036-q, 1996.
Hu, C., Griffis, T. J., Frie, A., Baker, J. M., Wood, J. D., Millet, D. B., Yu, Z., Yu, X., and Czarnetzki, A. C.: A multiyear constraint on ammonia emissions and deposition within the US corn belt, Geophys. Res. Lett., 48, e2020GL090865, https://doi.org/10.1029/2020gl090865, 2021.
Kharol, S. K., Shephard, M. W., McLinden, C. A., Zhang, L., Sioris, C. E., O'Brien, J. M., Vet, R., Cady-Pereira, K. E., Hare, E., Siemons, J., and Krotkov, N. A.: Dry deposition of reactive nitrogen from satellite observations of ammonia and nitrogen dioxide over north America, Geophys. Res. Lett., 45, 1157–1166, https://doi.org/10.1002/2017gl075832, 2018.
Kirchner, M., Jakobi, G., Feicht, E., Bernhardt, M., and Fischer, A.: Elevated NH3 and NO2 air concentrations and nitrogen deposition rates in the vicinity of a highway in Southern Bavaria, Atmos. Environ. (1994), 39, 4531–4542, https://doi.org/10.1016/j.atmosenv.2005.03.052, 2005.
Krupa, S. V.: Effects of atmospheric ammonia (NH3) on terrestrial vegetation: a review, Environ. Pollut., 124, 179–221, https://doi.org/10.1016/s0269-7491(02)00434-7, 2003.
Lin, H., Jacob, D. J., Lundgren, E. W., Sulprizio, M. P., Keller, C. A., Fritz, T. M., Eastham, S. D., Emmons, L. K., Campbell, P. C., Baker, B., Saylor, R. D., and Montuoro, R.: Harmonized Emissions Component (HEMCO) 3.0 as a versatile emissions component for atmospheric models: application in the GEOS-Chem, NASA GEOS, WRF-GC, CESM2, NOAA GEFS-Aerosol, and NOAA UFS models, Geosci. Model Dev., 14, 5487–5506, https://doi.org/10.5194/gmd-14-5487-2021, 2021.
Liu, L., Zhang, X., Wong, A. Y. H., Xu, W., Liu, X., Li, Y., Mi, H., Lu, X., Zhao, L., Wang, Z., Wu, X., and Wei, J.: Estimating global surface ammonia concentrations inferred from satellite retrievals, Atmos. Chem. Phys., 19, 12051–12066, https://doi.org/10.5194/acp-19-12051-2019, 2019.
Liu, L., Xu, W., Lu, X., Zhong, B., Guo, Y., Lu, X., Zhao, Y., He, W., Wang, S., Zhang, X., Liu, X., and Vitousek, P.: Exploring global changes in agricultural ammonia emissions and their contribution to nitrogen deposition since 1980, Proc. Natl. Acad. Sci. USA, 119, e2121998119, https://doi.org/10.1073/pnas.2121998119, 2022.
Li, Y., Schichtel, B. A., Walker, J. T., Schwede, D. B., Chen, X., Lehmann, C. M. B., Puchalski, M. A., Gay, D. A., and Collett, J. L., Jr.: Increasing importance of deposition of reduced nitrogen in the United States, Proc. Natl. Acad. Sci. USA, 113, 5874–5879, https://doi.org/10.1073/pnas.1525736113, 2016.
Li, Z., Sun, K., Guan, K., Wang, S., Peng, B., Clarisse, L., Van Damme, M., Coheur, P.-F., Cady-Pereira, K., Shephard, M. W., Zondlo, M., and Moore, D.: Ammonia flux over the CONUS derived from IASI and CrIS using the directional derivative approach, Figshare [data set], https://doi.org/10.6084/m9.figshare.30229648, 2025.
Lonsdale, C. R. and Sun, K.: Nitrogen oxides emissions from selected cities in North America, Europe, and East Asia observed by the TROPOspheric Monitoring Instrument (TROPOMI) before and after the COVID-19 pandemic, Atmos. Chem. Phys., 23, 8727–8748, https://doi.org/10.5194/acp-23-8727-2023, 2023.
Loubet, B., Asman, W. A. H., Theobald, M. R., Hertel, O., Tang, Y. S., Robin, P., Hassouna, M., Dämmgen, U., Genermont, S., Cellier, P., and Sutton, M. A.: Ammonia deposition near hot spots: Processes, models and monitoring methods, in: Atmospheric Ammonia, Springer Netherlands, Dordrecht, 205–267, https://doi.org/10.1007/978-1-4020-9121-6_15, 2009.
Luo, Z., Zhang, Y., Chen, W., Van Damme, M., Coheur, P.-F., and Clarisse, L.: Estimating global ammonia (NH3) emissions based on IASI observations from 2008 to 2018, Atmos. Chem. Phys., 22, 10375–10388, https://doi.org/10.5194/acp-22-10375-2022, 2022.
Ma, R., Li, K., Guo, Y., Zhang, B., Zhao, X., Linder, S., Guan, C., Chen, G., Gan, Y., and Meng, J.: Mitigation potential of global ammonia emissions and related health impacts in the trade network, Nat. Commun., 12, 6308, https://doi.org/10.1038/s41467-021-25854-3, 2021.
Marais, E. A., Pandey, A. K., Van Damme, M., Clarisse, L., Coheur, P.-F., Shephard, M. W., Cady-Pereira, K. E., Misselbrook, T., Zhu, L., Luo, G., and Yu, F.: UK ammonia emissions estimated with satellite observations and GEOS-chem, J. Geophys. Res., 126, https://doi.org/10.1029/2021jd035237, 2021.
Nelson, A. J., Koloutsou-Vakakis, S., Rood, M. J., Myles, L., Lehmann, C., Bernacchi, C., Balasubramanian, S., Joo, E., Heuer, M., Vieira-Filho, M., and Lin, J.: Season-long ammonia flux measurements above fertilized corn in central Illinois, USA, using relaxed eddy accumulation, Agric. For. Meteorol., 239, 202–212, https://doi.org/10.1016/j.agrformet.2017.03.010, 2017.
Pan, D., Benedict, K. B., Golston, L. M., Wang, R., Collett, J. L., Jr., Tao, L., Sun, K., Guo, X., Ham, J., Prenni, A. J., Schichtel, B. A., Mikoviny, T., Müller, M., Wisthaler, A., and Zondlo, M. A.: Ammonia dry deposition in an alpine ecosystem traced to agricultural emission hotpots, Environ. Sci. Technol., 55, 7776–7785, https://doi.org/10.1021/acs.est.0c05749, 2021.
Pan, D., Mauzerall, D. L., Wang, R., Guo, X., Puchalski, M., Guo, Y., Song, S., Tong, D., Sullivan, A. P., Schichtel, B. A., Collett, J. L., Jr., and Zondlo, M. A.: Regime shift in secondary inorganic aerosol formation and nitrogen deposition in the rural United States, Nat. Geosci., 17, 617–623, https://doi.org/10.1038/s41561-024-01455-9, 2024.
Pearson, J. and Stewart, G. R.: The deposition of atmospheric ammonia and its effects on plants, New Phytol., 125, 283–305, https://doi.org/10.1111/j.1469-8137.1993.tb03882.x, 1993.
Shephard, M. W. and Cady-Pereira, K. E.: Cross-track Infrared Sounder (CrIS) satellite observations of tropospheric ammonia, Atmos. Meas. Tech., 8, 1323–1336, https://doi.org/10.5194/amt-8-1323-2015, 2015.
Shephard, M. W., Dammers, E., Cady-Pereira, K. E., Kharol, S. K., Thompson, J., Gainariu-Matz, Y., Zhang, J., McLinden, C. A., Kovachik, A., Moran, M., Bittman, S., Sioris, C. E., Griffin, D., Alvarado, M. J., Lonsdale, C., Savic-Jovcic, V., and Zheng, Q.: Ammonia measurements from space with the Cross-track Infrared Sounder: characteristics and applications, Atmos. Chem. Phys., 20, 2277–2302, https://doi.org/10.5194/acp-20-2277-2020, 2020.
Sitwell, M., Shephard, M. W., Rochon, Y., Cady-Pereira, K., and Dammers, E.: An ensemble-variational inversion system for the estimation of ammonia emissions using CrIS satellite ammonia retrievals, Atmos. Chem. Phys., 22, 6595–6624, https://doi.org/10.5194/acp-22-6595-2022, 2022.
Sommer, S. G., Olesen, J. E., and Christensen, B. T.: Effects of temperature, wind speed and air humidity on ammonia volatilization from surface applied cattle slurry, J. Agric. Sci., 117, 91–100, https://doi.org/10.1017/S0021859600079016, 1991.
Sun, K.: Kang-Sun-CfA/Oversampling_matlab: JGR paper (10.1029/2024JD042817), Zenodo [code], https://doi.org/10.5281/zenodo.15001466, 2025.
Sun, K.: Derivation of emissions from satellite-observed column amounts and its application to TROPOMI NO2 and CO observations, Geophys. Res. Lett., 49, https://doi.org/10.1029/2022gl101102, 2022.
Sun, K., Zhu, L., Cady-Pereira, K., Chan Miller, C., Chance, K., Clarisse, L., Coheur, P.-F., González Abad, G., Huang, G., Liu, X., Van Damme, M., Yang, K., and Zondlo, M.: A physics-based approach to oversample multi-satellite, multispecies observations to a common grid, Atmos. Meas. Tech., 11, 6679–6701, https://doi.org/10.5194/amt-11-6679-2018, 2018.
Sutton, M., Reis, S., and Baker, S. (Eds.): Atmospheric Ammonia: Detecting emission changes and environmental impacts. Results of an Expert Workshop under the Convention on Long-range Transboundary Air Pollution, 1st edn., Springer, New York, NY, 464 pp., https://doi.org/10.1007/978-1-4020-9121-6, 2009.
Sutton, M. A., Erisman, J. W., Dentener, F., and Möller, D.: Ammonia in the environment: from ancient times to the present, Environ. Pollut., 156, 583–604, https://doi.org/10.1016/j.envpol.2008.03.013, 2008.
Sutton, M. A., Reis, S., Riddick, S. N., Dragosits, U., Nemitz, E., Theobald, M. R., Tang, Y. S., Braban, C. F., Vieno, M., Dore, A. J., Mitchell, R. F., Wanless, S., Daunt, F., Fowler, D., Blackall, T. D., Milford, C., Flechard, C. R., Loubet, B., Massad, R., Cellier, P., Personne, E., Coheur, P. F., Clarisse, L., Van Damme, M., Ngadi, Y., Clerbaux, C., Skjøth, C. A., Geels, C., Hertel, O., Wichink Kruit, R. J., Pinder, R. W., Bash, J. O., Walker, J. T., Simpson, D., Horváth, L., Misselbrook, T. H., Bleeker, A., Dentener, F., and de Vries, W.: Towards a climate-dependent paradigm of ammonia emission and deposition, Philos. Trans. R. Soc. Lond. B Biol. Sci., 368, 20130166, https://doi.org/10.1098/rstb.2013.0166, 2013.
Sutton, M. A., van Dijk, N., Levy, P. E., Jones, M. R., Leith, I. D., Sheppard, L. J., Leeson, S., Sim Tang, Y., Stephens, A., Braban, C. F., Dragosits, U., Howard, C. M., Vieno, M., Fowler, D., Corbett, P., Naikoo, M. I., Munzi, S., Ellis, C. J., Chatterjee, S., Steadman, C. E., Móring, A., and Wolseley, P. A.: Alkaline air: changing perspectives on nitrogen and air pollution in an ammonia-rich world, Philos. Trans. A Math. Phys. Eng. Sci., 378, 20190315, https://doi.org/10.1098/rsta.2019.0315, 2020.
Tang, Y. S., Braban, C. F., Dragosits, U., Dore, A. J., Simmons, I., van Dijk, N., Poskitt, J., Dos Santos Pereira, G., Keenan, P. O., Conolly, C., Vincent, K., Smith, R. I., Heal, M. R., and Sutton, M. A.: Drivers for spatial, temporal and long-term trends in atmospheric ammonia and ammonium in the UK, Atmos. Chem. Phys., 18, 705–733, https://doi.org/10.5194/acp-18-705-2018, 2018.
Tian, H., Xu, R., Canadell, J. G., Thompson, R. L., Winiwarter, W., Suntharalingam, P., Davidson, E. A., Ciais, P., Jackson, R. B., Janssens-Maenhout, G., Prather, M. J., Regnier, P., Pan, N., Pan, S., Peters, G. P., Shi, H., Tubiello, F. N., Zaehle, S., Zhou, F., Arneth, A., Battaglia, G., Berthet, S., Bopp, L., Bouwman, A. F., Buitenhuis, E. T., Chang, J., Chipperfield, M. P., Dangal, S. R. S., Dlugokencky, E., Elkins, J. W., Eyre, B. D., Fu, B., Hall, B., Ito, A., Joos, F., Krummel, P. B., Landolfi, A., Laruelle, G. G., Lauerwald, R., Li, W., Lienert, S., Maavara, T., MacLeod, M., Millet, D. B., Olin, S., Patra, P. K., Prinn, R. G., Raymond, P. A., Ruiz, D. J., van der Werf, G. R., Vuichard, N., Wang, J., Weiss, R. F., Wells, K. C., Wilson, C., Yang, J., and Yao, Y.: A comprehensive quantification of global nitrous oxide sources and sinks, Nature, 586, 248–256, https://doi.org/10.1038/s41586-020-2780-0, 2020.
van Breemen, N., Burrough, P. A., Velthorst, E. J., van Dobben, H. F., de Wit, T., Ridder, T. B., and Reijnders, H. F. R.: Soil acidification from atmospheric ammonium sulphate in forest canopy throughfall, Nature, 299, 548–550, https://doi.org/10.1038/299548a0, 1982.
Van Damme, M., Clarisse, L., Heald, C. L., Hurtmans, D., Ngadi, Y., Clerbaux, C., Dolman, A. J., Erisman, J. W., and Coheur, P. F.: Global distributions, time series and error characterization of atmospheric ammonia (NH3) from IASI satellite observations, Atmos. Chem. Phys., 14, 2905–2922, https://doi.org/10.5194/acp-14-2905-2014, 2014.
Van Damme, M., Clarisse, L., Dammers, E., Liu, X., Nowak, J. B., Clerbaux, C., Flechard, C. R., Galy-Lacaux, C., Xu, W., Neuman, J. A., Tang, Y. S., Sutton, M. A., Erisman, J. W., and Coheur, P. F.: Towards validation of ammonia (NH3) measurements from the IASI satellite, Atmos. Meas. Tech., 8, 1575–1591, https://doi.org/10.5194/amt-8-1575-2015, 2015.
Van Damme, M., Clarisse, L., Whitburn, S., Hadji-Lazaro, J., Hurtmans, D., Clerbaux, C., and Coheur, P.-F.: Industrial and agricultural ammonia point sources exposed, Nature, 564, 99–103, https://doi.org/10.1038/s41586-018-0747-1, 2018.
Wang, R., Guo, X., Pan, D., Kelly, J. T., Bash, J. O., Sun, K., Paulot, F., Clarisse, L., Van Damme, M., Whitburn, S., Coheur, P.-F., Clerbaux, C., and Zondlo, M. A.: Monthly patterns of ammonia over the contiguous United States at 2 km resolution, Geophys. Res. Lett., 48, https://doi.org/10.1029/2020gl090579, 2021.
Wang, R., Pan, D., Guo, X., Sun, K., Clarisse, L., Van Damme, M., Coheur, P.-F., Clerbaux, C., Puchalski, M., and Zondlo, M. A.: Bridging the spatial gaps of the Ammonia Monitoring Network using satellite ammonia measurements, Atmos. Chem. Phys., 23, 13217–13234, https://doi.org/10.5194/acp-23-13217-2023, 2023.
Wang, S., Nan, J., Shi, C., Fu, Q., Gao, S., Wang, D., Cui, H., Saiz-Lopez, A., and Zhou, B.: Atmospheric ammonia and its impacts on regional air quality over the megacity of Shanghai, China, Sci. Rep., 5, 15842, https://doi.org/10.1038/srep15842, 2015.
Warner, J. X., Dickerson, R. R., Wei, Z., Strow, L. L., Wang, Y., and Liang, Q.: Increased atmospheric ammonia over the world's major agricultural areas detected from space: Global Atmospheric NH3 14 Year Trends, Geophys. Res. Lett., 44, 2875–2884, https://doi.org/10.1002/2016GL072305, 2017.
Zhang, L., Jacob, D. J., Knipping, E. M., Kumar, N., Munger, J. W., Carouge, C. C., van Donkelaar, A., Wang, Y. X., and Chen, D.: Nitrogen deposition to the United States: distribution, sources, and processes, Atmos. Chem. Phys., 12, 4539–4554, https://doi.org/10.5194/acp-12-4539-2012, 2012.
Zhang, L., Chen, Y., Zhao, Y., Henze, D. K., Zhu, L., Song, Y., Paulot, F., Liu, X., Pan, Y., Lin, Y., and Huang, B.: Agricultural ammonia emissions in China: reconciling bottom-up and top-down estimates, Atmos. Chem. Phys., 18, 339–355, https://doi.org/10.5194/acp-18-339-2018, 2018.
Zhu, L., Henze, D. K., Cady-Pereira, K. E., Shephard, M. W., Luo, M., Pinder, R. W., Bash, J. O., and Jeong, G.-R.: Constraining U. S. ammonia emissions using TES remote sensing observations and the GEOS-Chem adjoint model: Inverse Modeling of NH3 Emissions, J. Geophys. Res., 118, 3355–3368, https://doi.org/10.1002/jgrd.50166, 2013.