the Creative Commons Attribution 4.0 License.
the Creative Commons Attribution 4.0 License.
 | 21 May 2026
Technical note: 12 km resolution capability for the global GEOS-Chem model of atmospheric composition
Melissa P. Sulprizio
Yuyao Zhuge
Randall V. Martin
Daniel J. Jacob
We present a new 12 km nested resolution capability in the GEOS-Chem global model of atmospheric composition. This capability can be applied to simulations for any user-selected domain worldwide from March 2021 onward by accessing a new hourly cubed-sphere C720 (approximately 12 × 12 km2 resolution) global wind archive from the NASA GEOS-FP meteorological data assimilation system. We regridded the archive to support rectilinear GEOS-Chem Classic nested grid simulations worldwide at 0.125° × 0.15625° resolution and denote this as the 12 km GEOS-Chem capability. We evaluate this 12 km configuration of GEOS-Chem by comparison with the standard 25 km (0.25° × 0.3125° resolution) nested configuration in simulations of transport tracers, oxidant-aerosol chemistry, and inversions of satellite data using the Integrated Methane Inversion (IMI). The 12 km simulation features stronger vertical transport (up to 20 % lower surface 222Rn concentrations) because it better captures horizontal convergence both spatially and temporally. Aerosol lifetimes against deposition are shorter by a few percent. The 12 km oxidant-aerosol chemistry can better simulate urban observations of NO2, and shows stronger ozone urban titration together with slightly higher surface ozone background due to enhanced vertical transport. 12 km and 25 km inversions using the IMI show highly consistent results on the regional scale, but the 12 km inversion provides greater information and improved spatial detail to resolve emissions from different sectors.
- Article
(7366 KB) - Full-text XML
- BibTeX
- EndNote


GEOS-Chem (http://geos-chem.org, last access: 22 March 2026) is an open-source global 3-D model of atmospheric chemistry originally described by Bey et al. (2001) and used by hundreds of research groups around the world for a wide range of applications. The standard offline configuration of GEOS-Chem is driven by archived Goddard Earth Observing System (GEOS) meteorological data from the NASA Global Modeling and Assimilation Office (GMAO), with no feedback of chemistry on meteorology. GEOS-Chem can also operate online in dynamical coupling with Earth system models (Fritz et al., 2022; Hu et al., 2018; Lu et al., 2020) or the WRF regional model (Lin et al., 2020). Here we introduce the capability to conduct offline GEOS-Chem simulations at 0.125° × 0.15625° (≈12 km × 12 km) resolution by exploiting a new GEOS advection data archive (grid-scale winds) available from March 2021 onward. This enables low-cost, reproducible, high-resolution simulations of atmospheric chemistry and air quality anywhere in the world through the nested capability of GEOS-Chem. In what follows we refer to it as the 12 km capability in GEOS-Chem.
The open-access GEOS global meteorological datasets used to drive GEOS-Chem are produced at GMAO by data assimilation on the cubed-sphere grid of the underlying GEOS Earth system model (ESM) and then archived on a rectilinear latitude-longitude grid for public dissemination. The GEOS-Chem Support Team extracts from these archives the data needed to run GEOS-Chem and distributes them to users as an open dataset library through the Amazon Web Services (AWS) cloud (Zhuang et al., 2019; Martin et al., 2022). GEOS-Chem users may choose from three main datasets: the Modern-Era Retrospective Analysis for Research and Applications, version 2 (MERRA-2; 1980–present) at 0.5° × 0.625° resolution, the GEOS Forward Processing (GEOS-FP; 2014–present) at 0.25° × 0.3125° resolution, and the GEOS for Instrument Teams (GEOS-IT; 1998–present) at 0.5° × 0.625° or native cubed-sphere C180 resolution (180 grid cells per cubed-sphere side, approximately 50 km × 50 km resolution). MERRA-2 provides a long stable record with fixed physics and data assimilation algorithms, GEOS-IT is the next-generation stable record with updated physics and data assimilation, and GEOS-FP is the operational product generated in near real time using the latest validated GEOS system. GEOS-FP operates at native C720 resolution (approximately 12 km × 12 km) but the data archive was previously made available only at 0.25° × 0.3125° resolution. Since March 2021, GMAO has been producing a native-resolution hourly C720 GEOS-FP advection archive specifically to serve GEOS-Chem needs, and this is what we use to enable the 12 km capability in GEOS-Chem.
GEOS-Chem operates in two modes, Classic (GC-Classic) and High-Performance (GCHP) (Martin et al., 2022). GC-Classic is designed for easy use on the rectilinear longitude-latitude grid and operates on single-node mode with shared-memory parallelization. GCHP enables high-resolution simulations using distributed-memory parallelization (MPI) on the cubed-sphere grid with efficient multi-node scalability extending to thousands of cores (Eastham et al., 2018). Both GC-Classic and GCHP can use the original rectilinear GEOS archive available at resolutions down to 0.25° × 0.3125°, with GCHP converting these inputs to its cubed-sphere grid at runtime. They can also operate at coarser resolutions for computational economy using regridded GEOS data archived on AWS as part of the GEOS-Chem input dataset library. Global GC-Classic simulations thus typically use 2° × 2.5° or 4° × 5° GEOS data. GC-Classic includes a one-way nested capability to conduct regional simulations over limited domains with archived dynamic boundary conditions from a coarse-resolution simulation (Wang et al., 2004). GCHP includes a stretched-grid capability to enable higher-resolution two-way nesting over target regions (Bindle et al., 2021). Emission and surface type information are generally available at 0.1° × 0.1° resolution from the GEOS-Chem input dataset library, from which they are regridded on the fly within GEOS-Chem at the desired resolution using the HEMCO software tool (Lin et al., 2021). The one-way nested GC-Classic capability at GEOS-FP 0.25° × 0.3125° (referred to as 25 km) resolution is widely used for air quality applications (Kim et al., 2015; Zhang et al., 2015) and for inversions of greenhouse gas data to infer surface fluxes (Varon et al., 2022).
Here, we implement the GEOS-FP native C720 advection archive for use in GC-Classic nested-grid simulations. This 12 km capability can be applied over any user-selected domain worldwide, and for any period from March 2021 onward. It has been released in GEOS-Chem 14.6.0 (https://doi.org/10.5281/zenodo.15243271; The International GEOS-Chem User Community, 2025). We describe the 12 km capability in Sect. 2 and compare its transport to the standard 25 km nested GC-Classic configuration in Sect. 3. We then demonstrate its application to a full-chemistry simulation over the North China Plain (Sect. 4) and to the inversion of satellite observations using the Integrated Methane Inversion (IMI) framework (Sect. 5).
Table 1GEOS-FP meteorological data archives available for driving GEOS-Chem at 0.125° × 0.15625° (12 km) and 0.25° × 0.3125° (25 km) resolutions.a
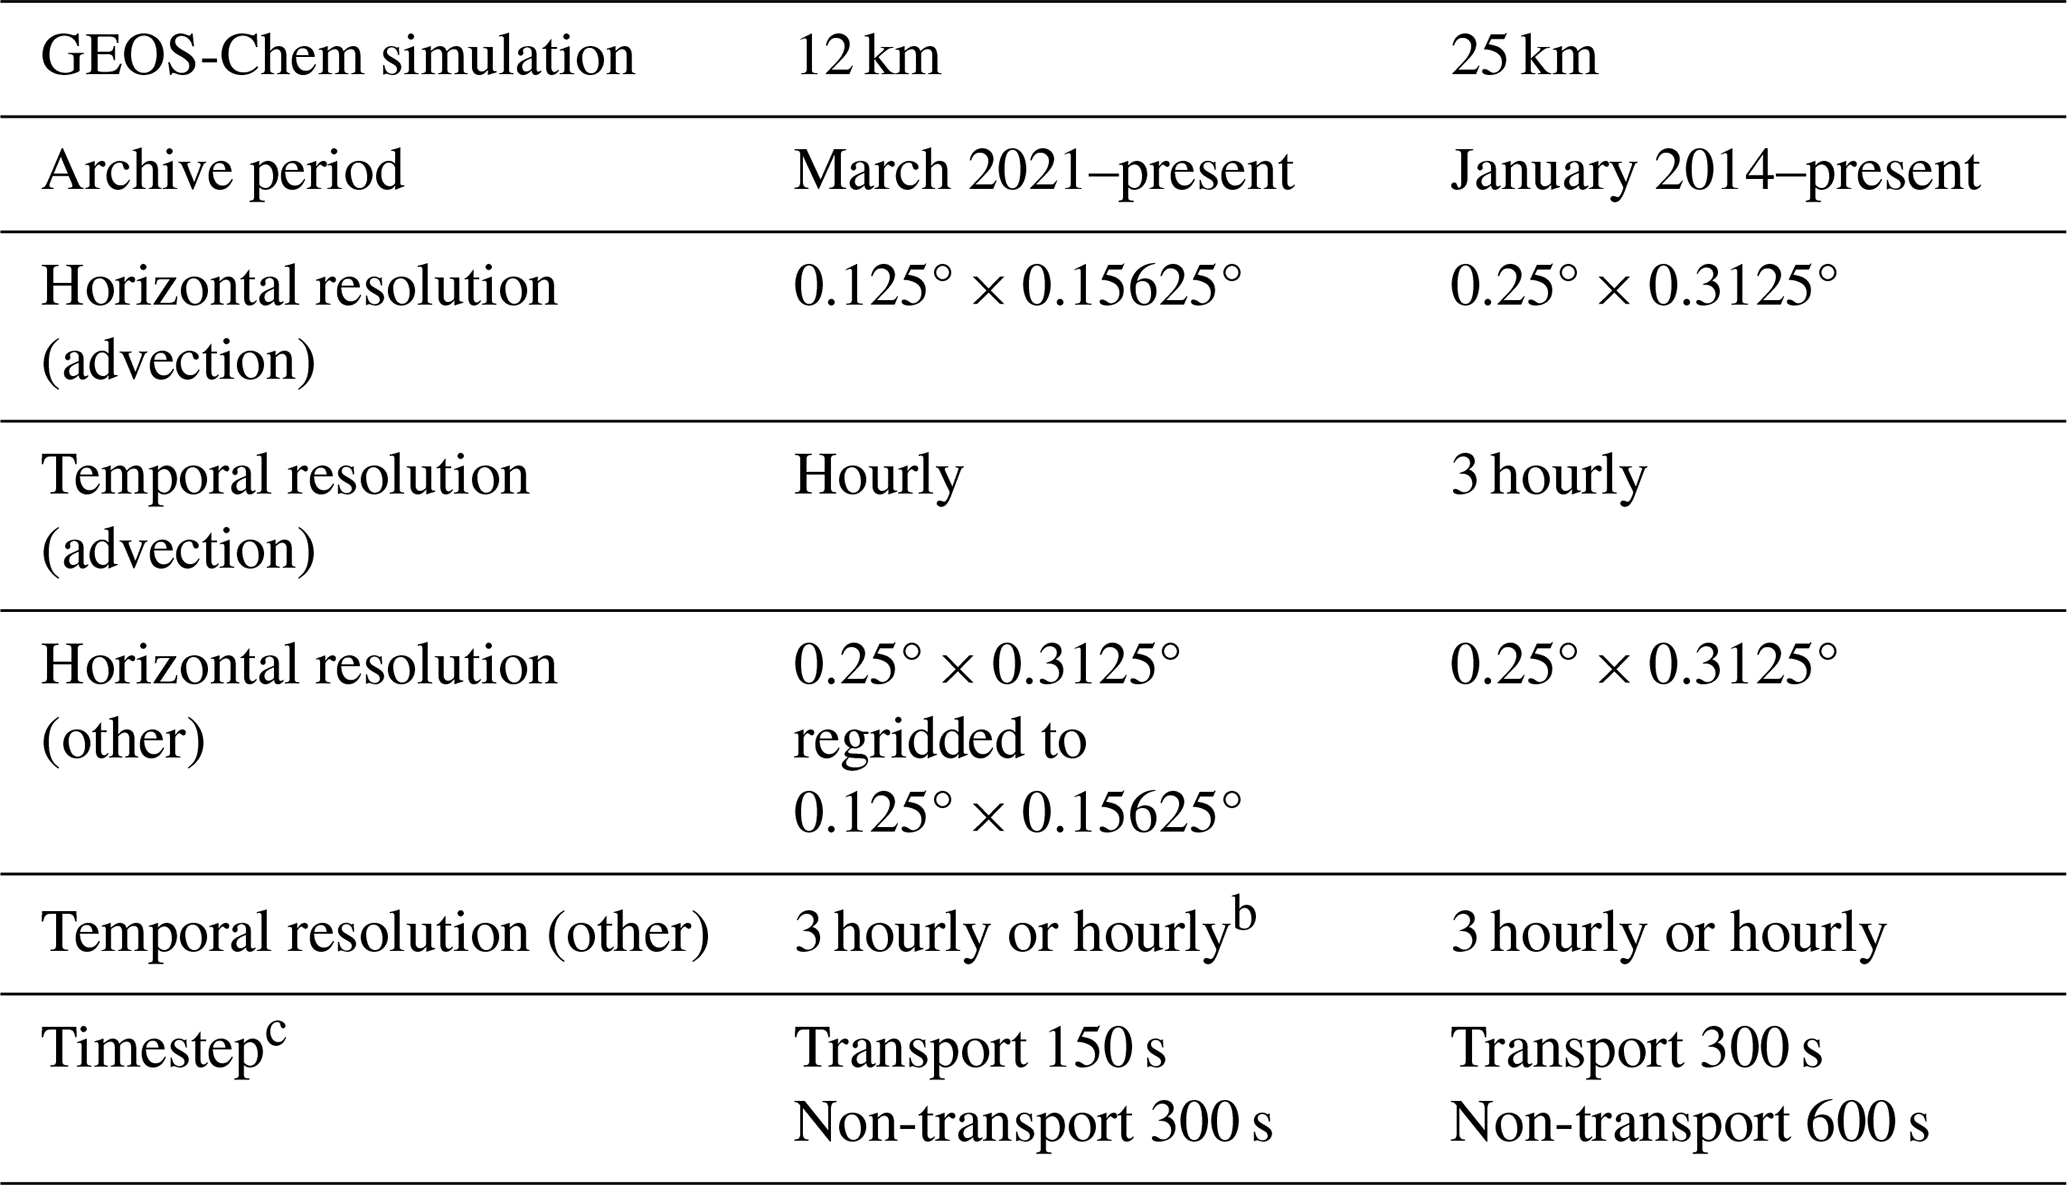
a For GC-Classic simulations at 0.125° × 0.15625° and 0.25° × 0.3125° resolutions with 72 hybrid sigma-pressure vertical levels extending up to 0.01 hPa. GEOS-FP meteorological data used as GEOS-Chem input include advection variables (horizontal wind vectors, surface pressure, specific humidity) and other variables driving convective transport, planetary boundary layer (PBL) mixing, emissions, radiation, chemistry, and deposition. The full list of variables is at: https://wiki.seas.harvard.edu/geos-chem/index.php/List_of_GEOS-FP_met_fields, (last access: 22 March 2026). The advection variables are grouped in a separate advection archive for 12 km applications. The 12 km and 25 km archives are available globally, and also for individual continents to speed up data extraction. b Hourly for two-dimensional fields such as surface properties and PBL depth; 3 hourly for three-dimensional fields such as temperature and convective mass flux. c Recommended timesteps for operator splitting (Philip et al., 2016), can be adjusted by user. Non-transport operators include emissions, chemistry, and deposition.
GC-Classic allows users to conduct nested simulations over any domain of interest using the GEOS meteorological archives as input and with rectilinear coordinates specified at runtime. This framework was first introduced by Wang et al. (2004) and updated to 0.25° × 0.3125° resolution by Zhang et al. (2015) and Kim et al. (2015). The nested simulations are conducted as a regional model with boundary conditions provided by a separate global simulation at 2° × 2.5° or 4° × 5° resolution that provides dynamic chemical fields updated every 3 h.
Here we use the new global C720 GEOS-FP hourly advection archive, regridded to 0.125° × 0.15625°, to produce the 12 km advection archive that enables GC-Classic nested-grid simulations at 0.125° × 0.15625° resolution. The 12 km advection archive includes horizontal wind vectors, surface pressure, and specific humidity on 72 vertical levels extending from the surface to 0.01 hPa (model top). Horizontal wind vectors are converted from cubed-sphere C720 mass flux data for use in the GC-Classic transport scheme (Lin and Rood, 1996). Surface pressure is needed to infer the vertical air mass fluxes from the horizontal air mass fluxes by mass conservation. Specific humidity is needed to convert wet air fluxes and pressure in the GEOS data to dry air fluxes and pressures used in GEOS-Chem. The regridding from cubed-sphere C720 to the rectilinear 0.125° × 0.15625° grid yields an approximately 12 km × 12 km horizontal scale over midlatitudes, slightly coarser toward the equator and finer toward the poles.
Table 1 summarizes the GEOS-FP input data for the 12 km configuration as compared to the 25 km configuration. The idea behind the advection archive is that higher resolution is most needed for the winds to better represent eddy flows and to leverage the 0.1° × 0.1° resolution of the emission data. Limiting the number of variables in the advection archive enables global data storage at C720. The 12 km advection archive has hourly temporal resolution, compared to 3 hourly resolution for the 3-D variables in the 25 km archive. Other non-advection meteorological inputs including convective mass fluxes and vertical mixing depths are from the standard GEOS-FP archive at 0.25° × 0.3125° resolution and are dynamically regridded to 0.125° × 0.15625° at runtime. Most emission datasets are available on a 0.1° × 0.1° grid and are regridded at runtime to the simulation resolution using HEMCO (Lin et al., 2021). The 12 km archive is available globally. We also maintain separate 12 km advection archives for five continental regions (Africa, Asia, Europe, North America, and South America) to reduce data size and thereby speed up data access and processing over the user-selected nested domains (https://registry.opendata.aws/geoschem-nested-input-data, last access: 21 October 2025).
All simulations presented here were carried out on the Harvard Cannon v2.0 supercomputing cluster using compute nodes equipped with dual-socket Intel Xeon Platinum 8480CL CPUs (56 cores each, base frequency ∼ 2.9 GHz). Each simulation used 48 physical CPU cores and ran on a single node. We find that the 12 km simulation wall-time is about 7 times that of a 25 km simulation over the same domain. This is driven by the 4 times increase in grid cells and the 2 times reduction in timestep. The 1 month full-chemistry simulation presented in Sect. 4 took 26 wall-time hours to complete at 12 km resolution.
We use the TransportTracers simulation of GEOS-Chem (Zhang et al., 2021) to evaluate model transport and scavenging processes. This simulation includes 21 generic species (tracers) to test the different components of GEOS-Chem transport. We focus here on the radionuclide tracers radon-222 (222Rn), lead-210 (210Pb), and beryllium-7 (7Be), which are routinely used to benchmark transport and wet deposition in GEOS-Chem (Liu et al., 2001; Yu et al., 2018). These tracers are particularly useful for evaluating model vertical transport, whereas grid-scale vertical winds are calculated from horizontal mass flux convergence and is not directly available in the model. The nested-grid simulations are conducted over eastern China (100–125° E, 17–45° N, domain shown in Fig. 1) at both 0.125° × 0.15625° and 0.25° × 0.3125° resolutions for February and June 2022. Initial conditions are generated from spin-up simulations at the same resolutions, starting from October 2021 (corresponding to spin-up periods of 4 months for February and 8 months for June). The boundary conditions are updated every 3 h from a global simulation at 2° × 2.5° resolution.
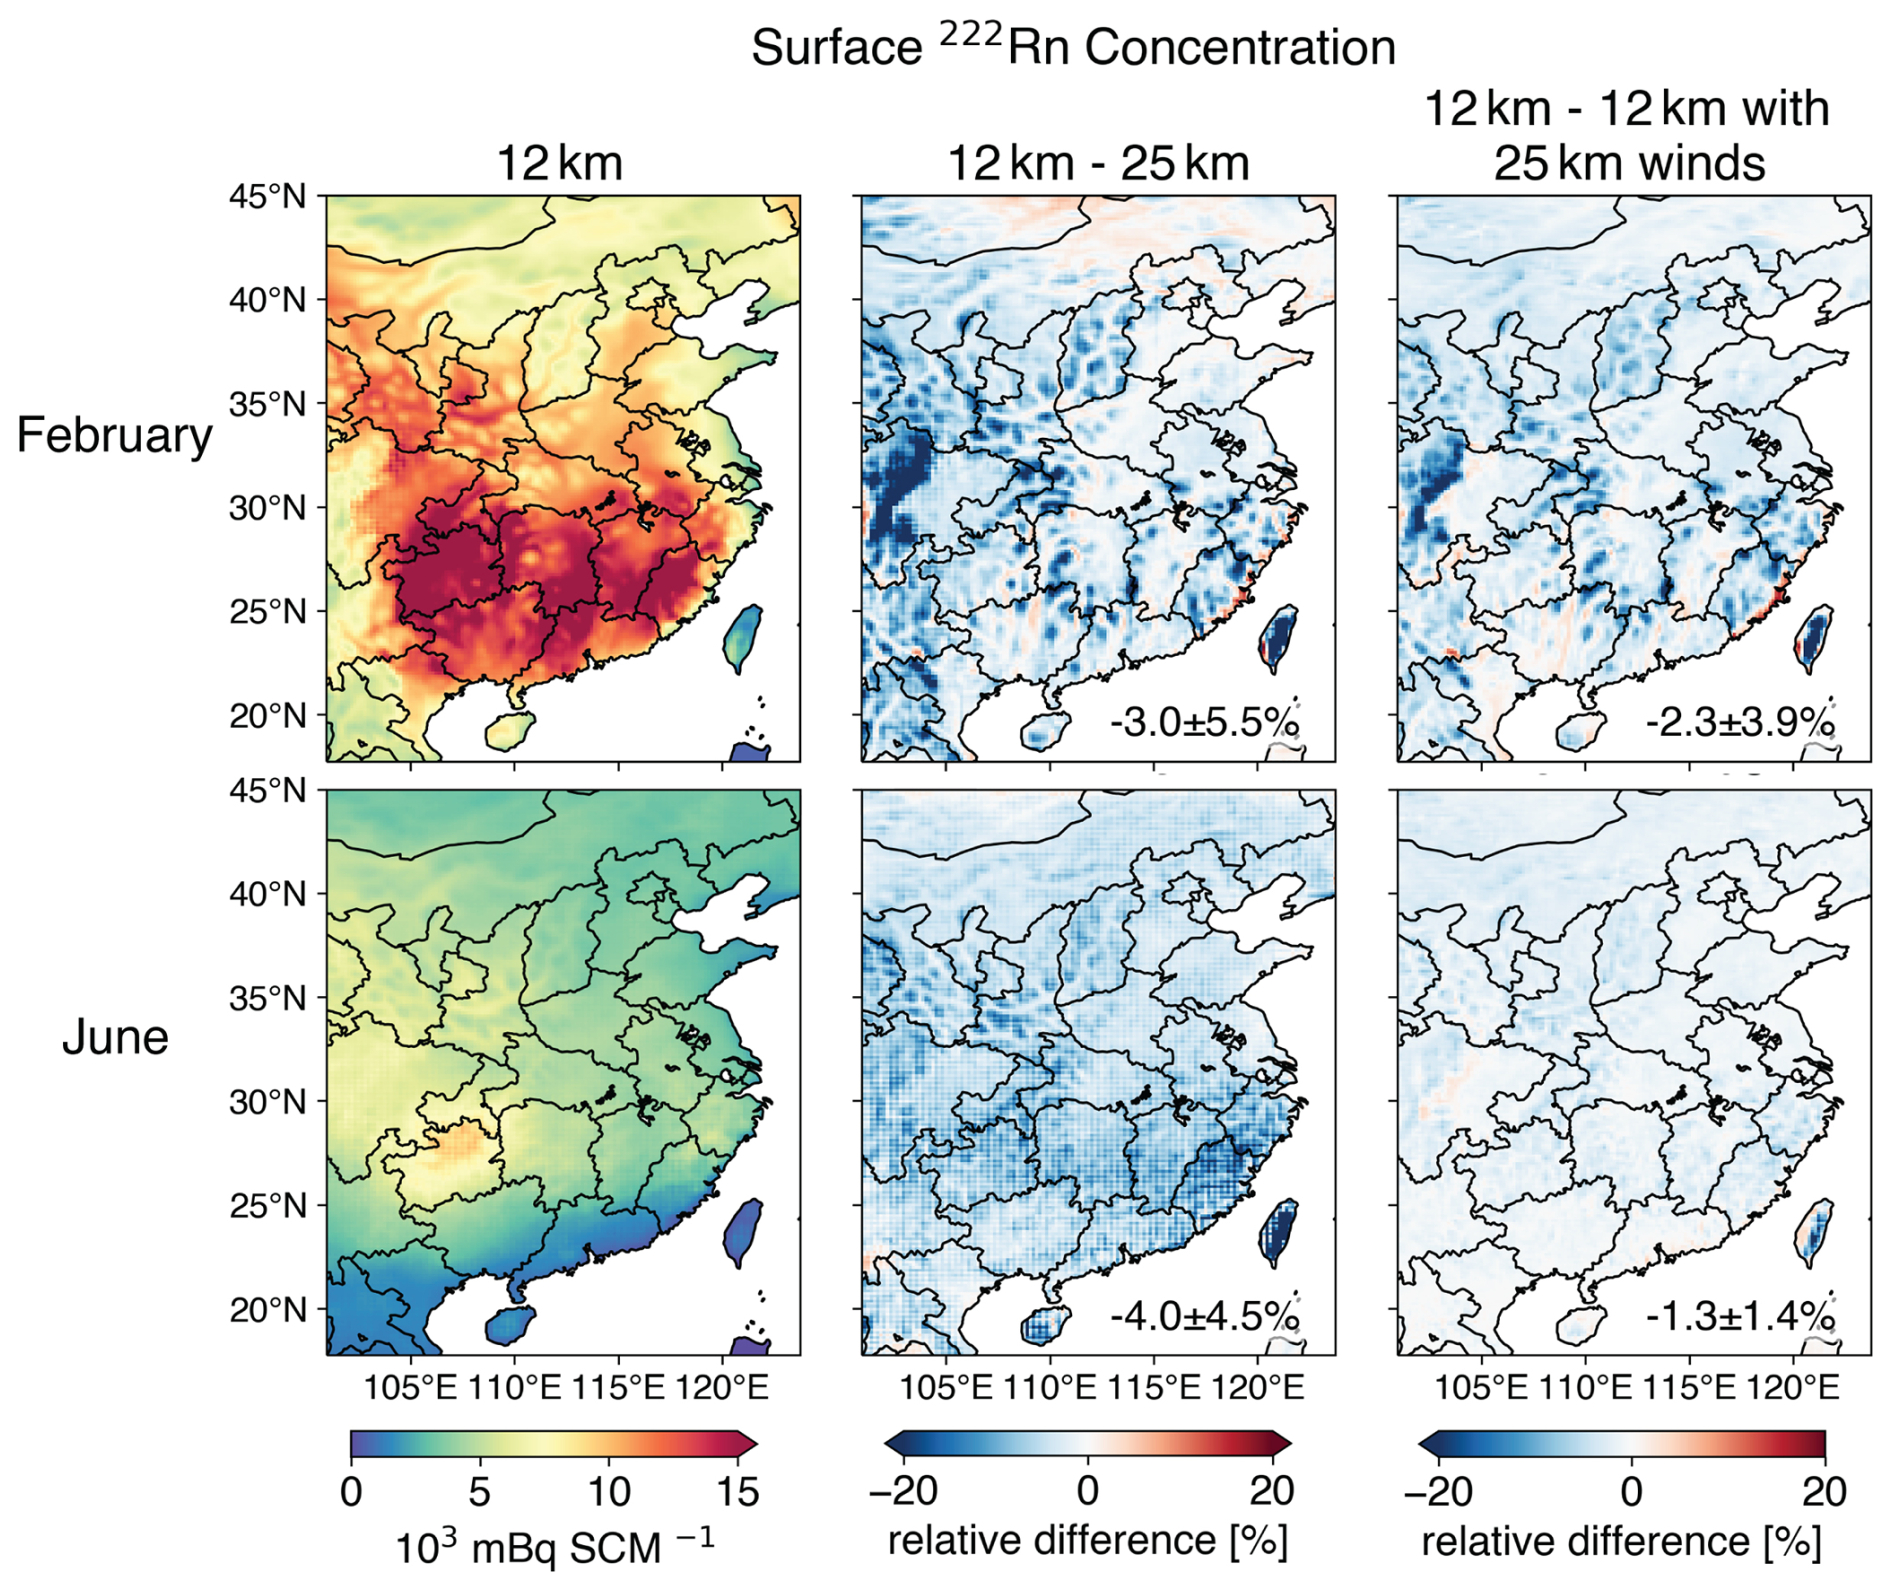
Figure 1Monthly mean surface 222Rn mixing ratios (mBq SCM−1) simulated over eastern China in February and June 2022. Columns from left to right show the concentrations simulated by GEOS-Chem at 12 km resolution, the relative differences with a simulation at 25 km resolution, and the relative differences between two 12 km simulations driven by the 12 km and 25 km GEOS-FP advection archives, respectively. SCM is a standard cubic meter of air at 0 °C (273.15 K) and 1 atm (1013.25 hPa). The mean relative difference and standard deviation are shown inset.
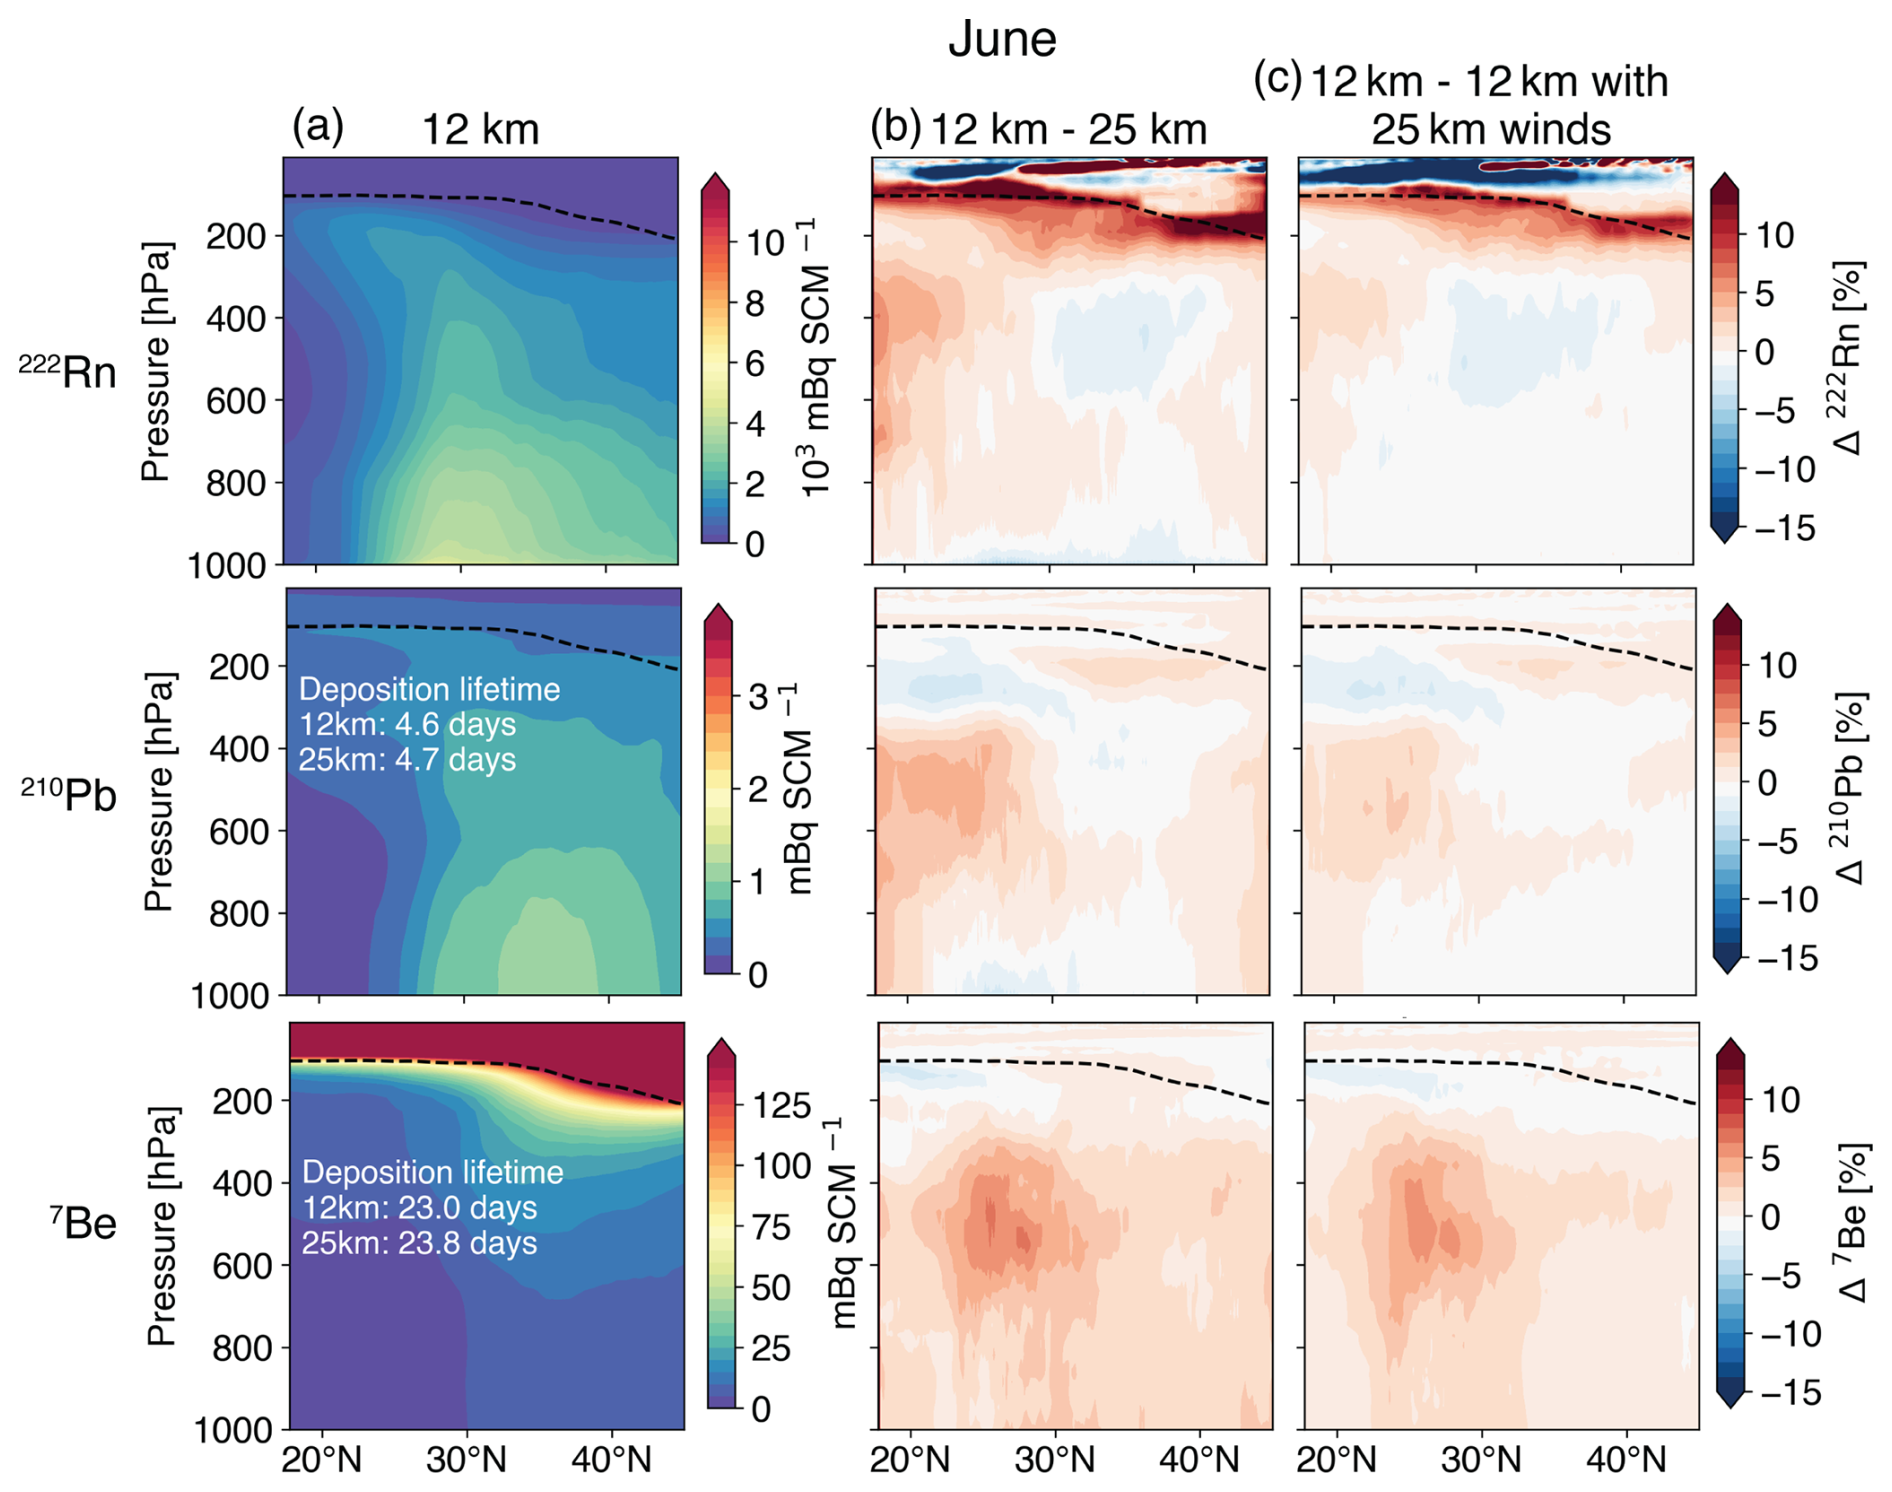
Figure 1 shows surface 222Rn concentrations from the 12 km simulation and relative differences with the 25 km simulation. 222Rn in the simulation has a spatially uniform soil source and is removed by radioactive decay with a half-life of 3.8 d, making it a sensitive tracer for vertical transport in the troposphere (Liu et al., 2001; Yu et al., 2018). Surface 222Rn concentrations are lower by 0 %–20 % at 12 km than at 25 km resolution. Differences are most pronounced over complex terrain such as Sichuan and Taiwan. The total 222Rn burden in the two simulations is the same, and the difference is in the vertical distribution (Figs. 2 and 3). The 12 km simulation shows lower 222Rn concentrations in the lower troposphere and higher concentrations in the middle-to-upper troposphere, indicating stronger vertical transport. The lower 222Rn concentrations in the tropical stratosphere in June, combined with the lower 7Be concentrations below the tropopause, may reflect greater restriction of transport across the tropopause at higher resolution (Stanevich et al., 2020) but would require further investigation because the absolute changes are very small.
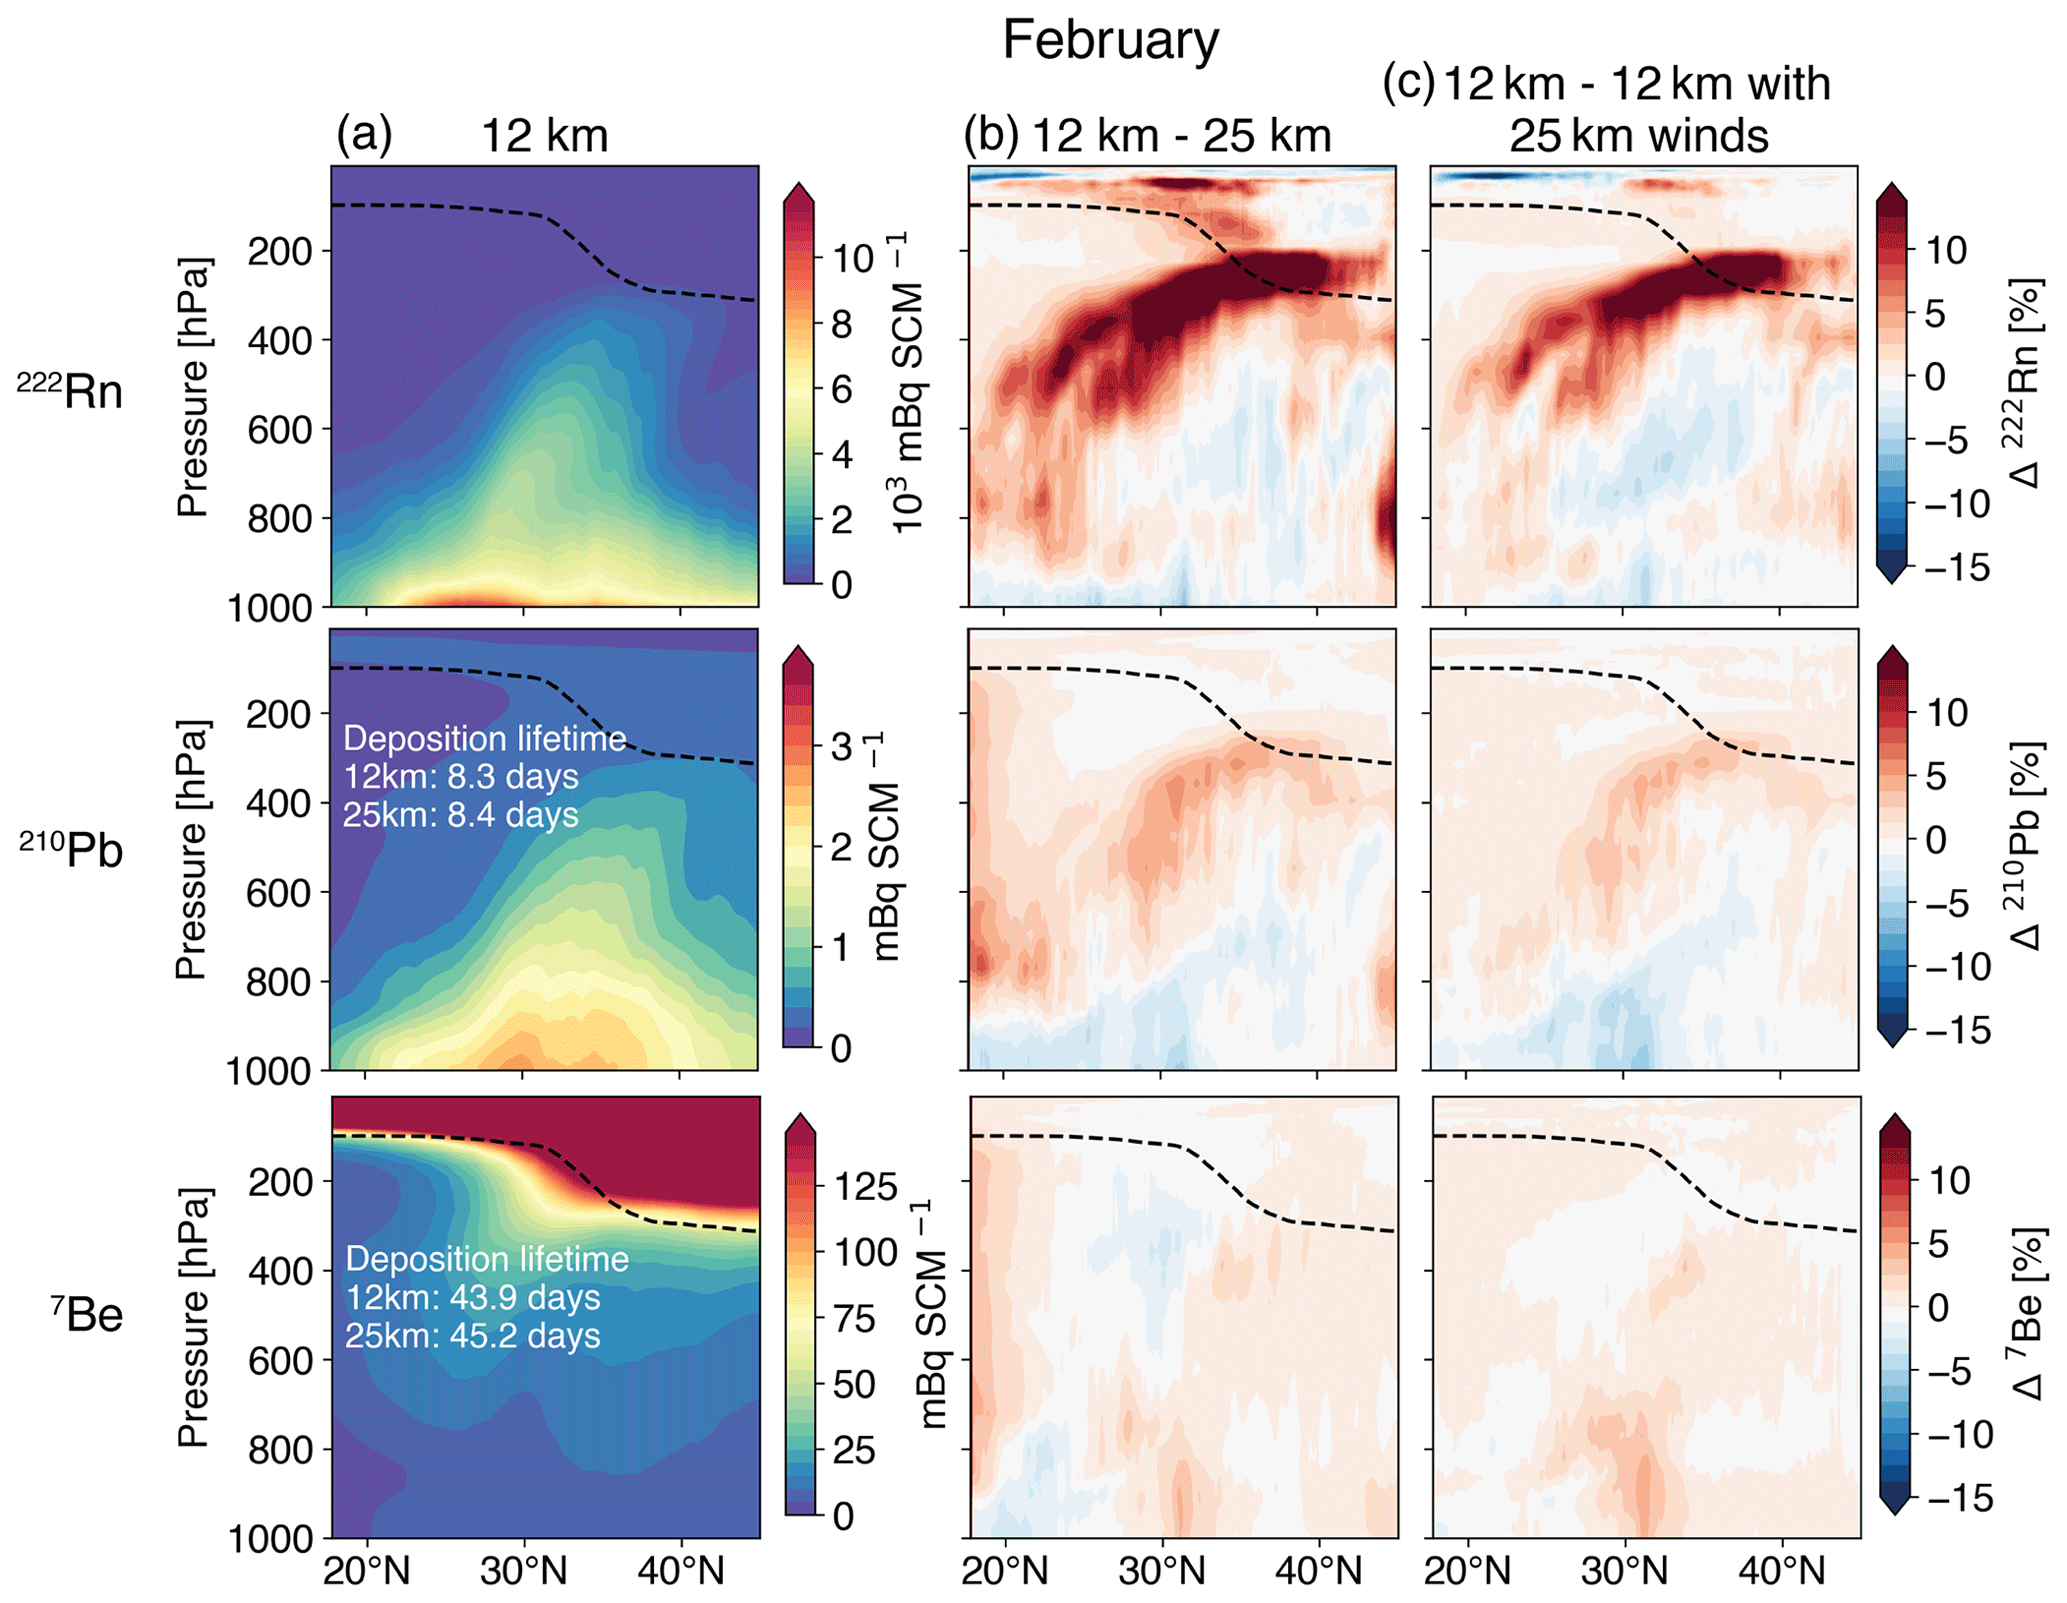
Figure 2Zonally averaged latitude-pressure monthly mean mixing ratios of 222Rn, 210Pb, and 7Be simulated by GEOS-Chem for February 2022 over the eastern China domain of Fig. 1 at 12 km resolution (a), the relative differences with a 25 km simulation (b) and relative differences with a 12 km simulation driven by the 25 km advection archive (c). Lifetimes of tropospheric 210Pb and 7Be against deposition are inset. The dashed black lines indicate the tropopause.
Transport processes in GEOS-Chem include grid-resolved advection (winds), sub-grid parameterized convection (convective mass fluxes), and PBL-mixing (Lin and McElroy, 2010). Differences between the 12 km and 25 km simulations could reflect stronger vertical winds at 12 km due to better resolved horizontal convergence (Yu et al., 2018) and better resolution of concentration gradients leading to stronger tracer convergence for the same winds. To separate these two effects, we conducted a 12 km sensitivity simulation driven by the 3 hourly 25 km advection archive regridded to 12 km resolution during runtime (right columns of Figs. 1–3). We find that both effects contribute, with 12 km winds accounting for about 77 % of the surface 222Rn difference in February and 32 % in June, while better resolved concentration gradients account for the remainder.
210Pb (half-life of 22.3 years) is produced by the decay of 222Rn, and 7Be (half-life of 53.3 d) is generated by cosmic-ray interactions with atmospheric oxygen and nitrogen at high altitudes. Both radionuclides rapidly attach to aerosol particles and are subsequently transported and removed by wet and dry deposition. This makes 210Pb useful to evaluate aerosol transport and removal processes, with 7Be providing complementary information on stratosphere–troposphere exchange and tropospheric subsidence (Liu et al., 2001). Comparisons of 12 km and 25 km simulations for 210Pb show similar differences as for 222Rn (Figs. 2 and 3) but weaker in magnitude because the 210Pb source is more diffuse. Lifetimes against deposition differ by less than 2 % between the 12 km and 25 km simulations. Comparisons for 7Be also show weaker differences than for 222Rn because vertical transport of 7Be in the troposphere is mainly by large-scale subsidence, which is less sensitive to eddy motions. The 7Be lifetime against deposition is 3 % higher at 25 km resolution, explaining the slightly higher overall tropospheric concentrations.
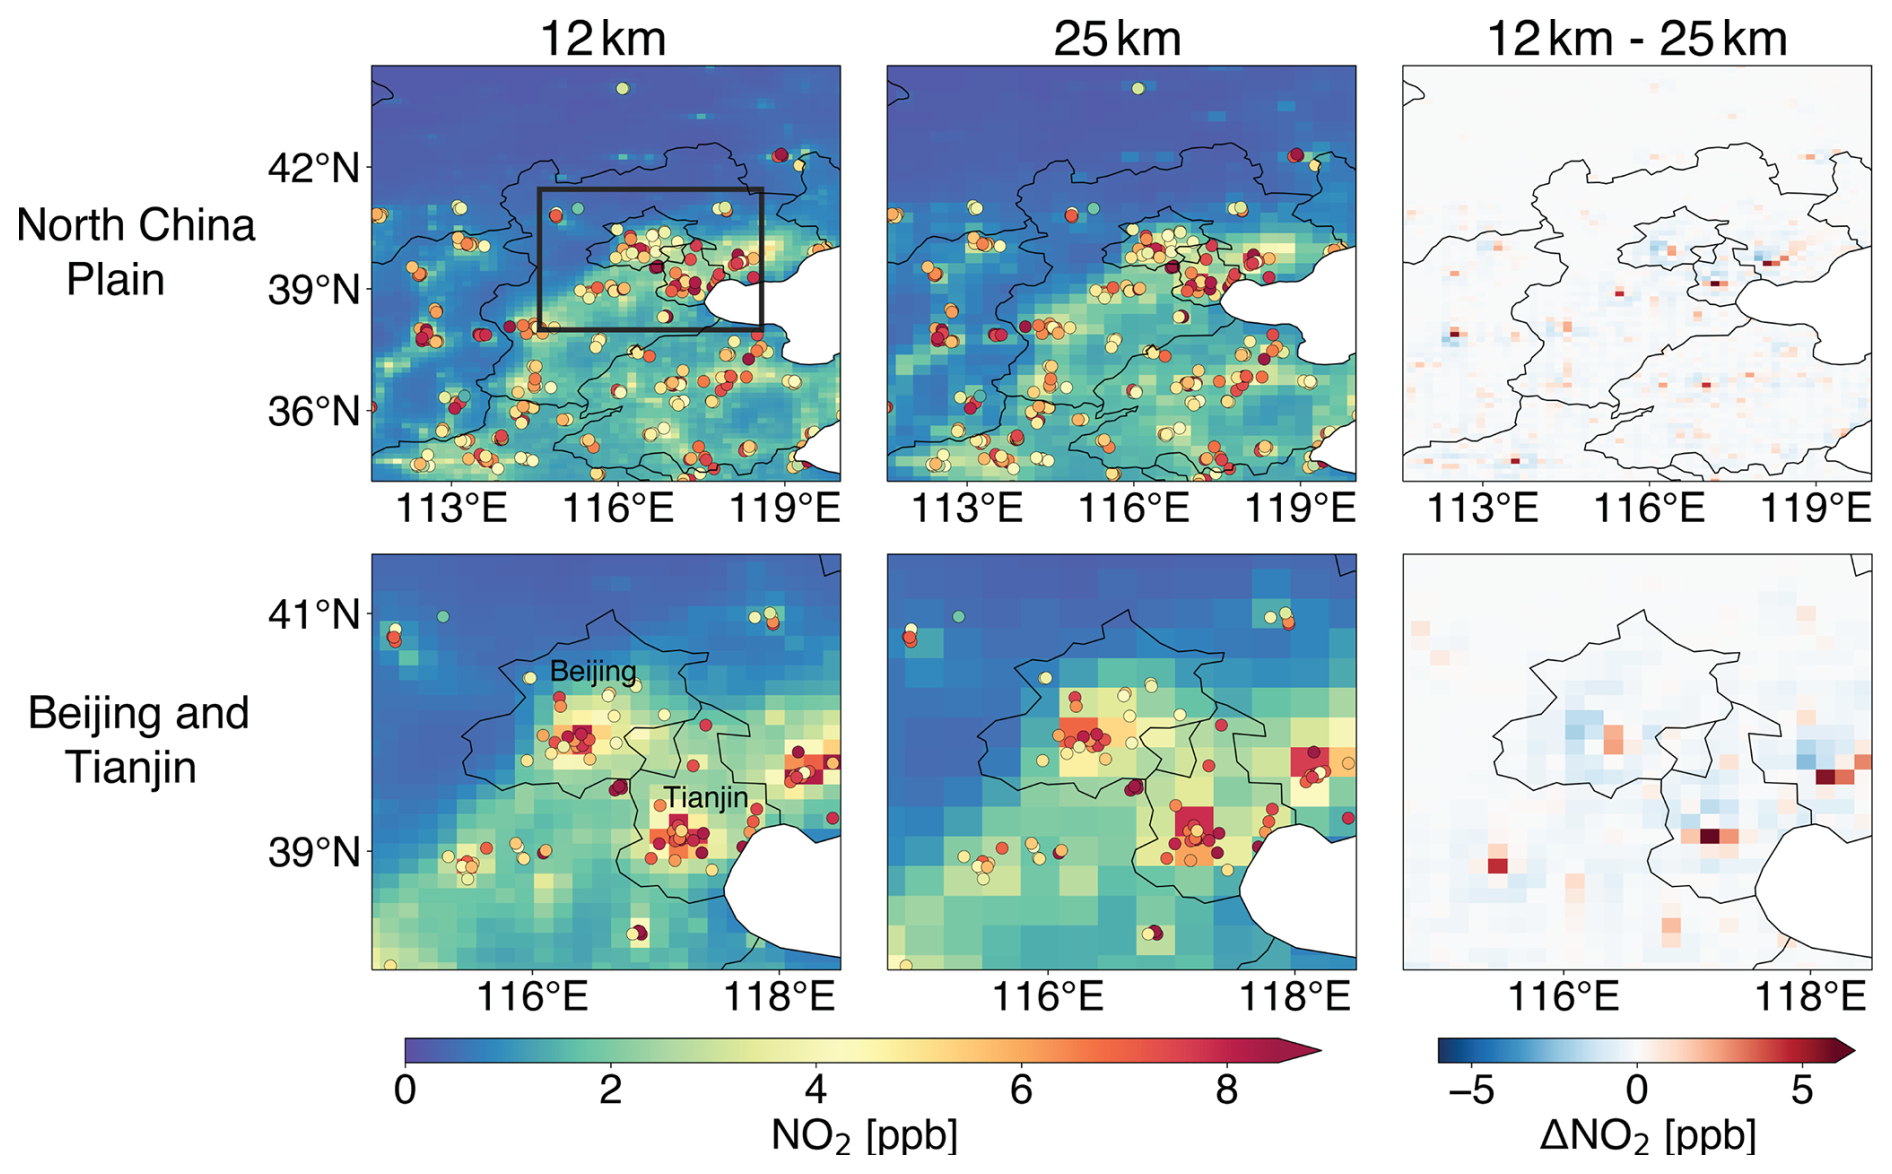
Figure 4Afternoon (13:00–18:00 LT) monthly mean surface NO2 concentrations in June 2022 simulated by GEOS-Chem at 12 km and 25 km resolution, for the North China Plain (NCP) and for Beijing and Tianjin (box in top left panel). Circles show CNEMC network observations.
We perform 1 month full-chemistry simulations for February and June of 2022 over the North China Plain (NCP; domain shown in Fig. 4) at 12 km and 25 km horizontal resolutions for comparison. The full-chemistry configuration of GEOS-Chem includes detailed ozone–NOx–VOCs–aerosol–halogen tropospheric and stratospheric chemistry (Wang et al., 2021). Boundary conditions are provided by a global 2° × 2.5° GEOS-Chem simulation and updated every 3 h, and spin-up simulations are conducted from October 2021 to generate initial conditions. Monthly anthropogenic emissions are from the MIXv2 Asian emission inventory at 0.1° × 0.1° resolution for 2017 (Li et al., 2024), scaled to 2022 using province-level emission data from the MEIC v1.4 inventory (Zheng et al., 2018) and mapped to the 12 km and 25 km grids using HEMCO. We compare the model simulations of surface NO2, ozone, and fine particulate matter (PM2.5) concentrations to hourly observations from 361 sites operated by the China National Environmental Monitoring Centre (CNEMC; http://www.cnemc.cn, last assess: 23 May 2023). The sites are mainly urban. We remove anomalous observations at each site following the quality control protocols described in Lu et al. (2018). We sample model outputs at the observation sites for comparisons.
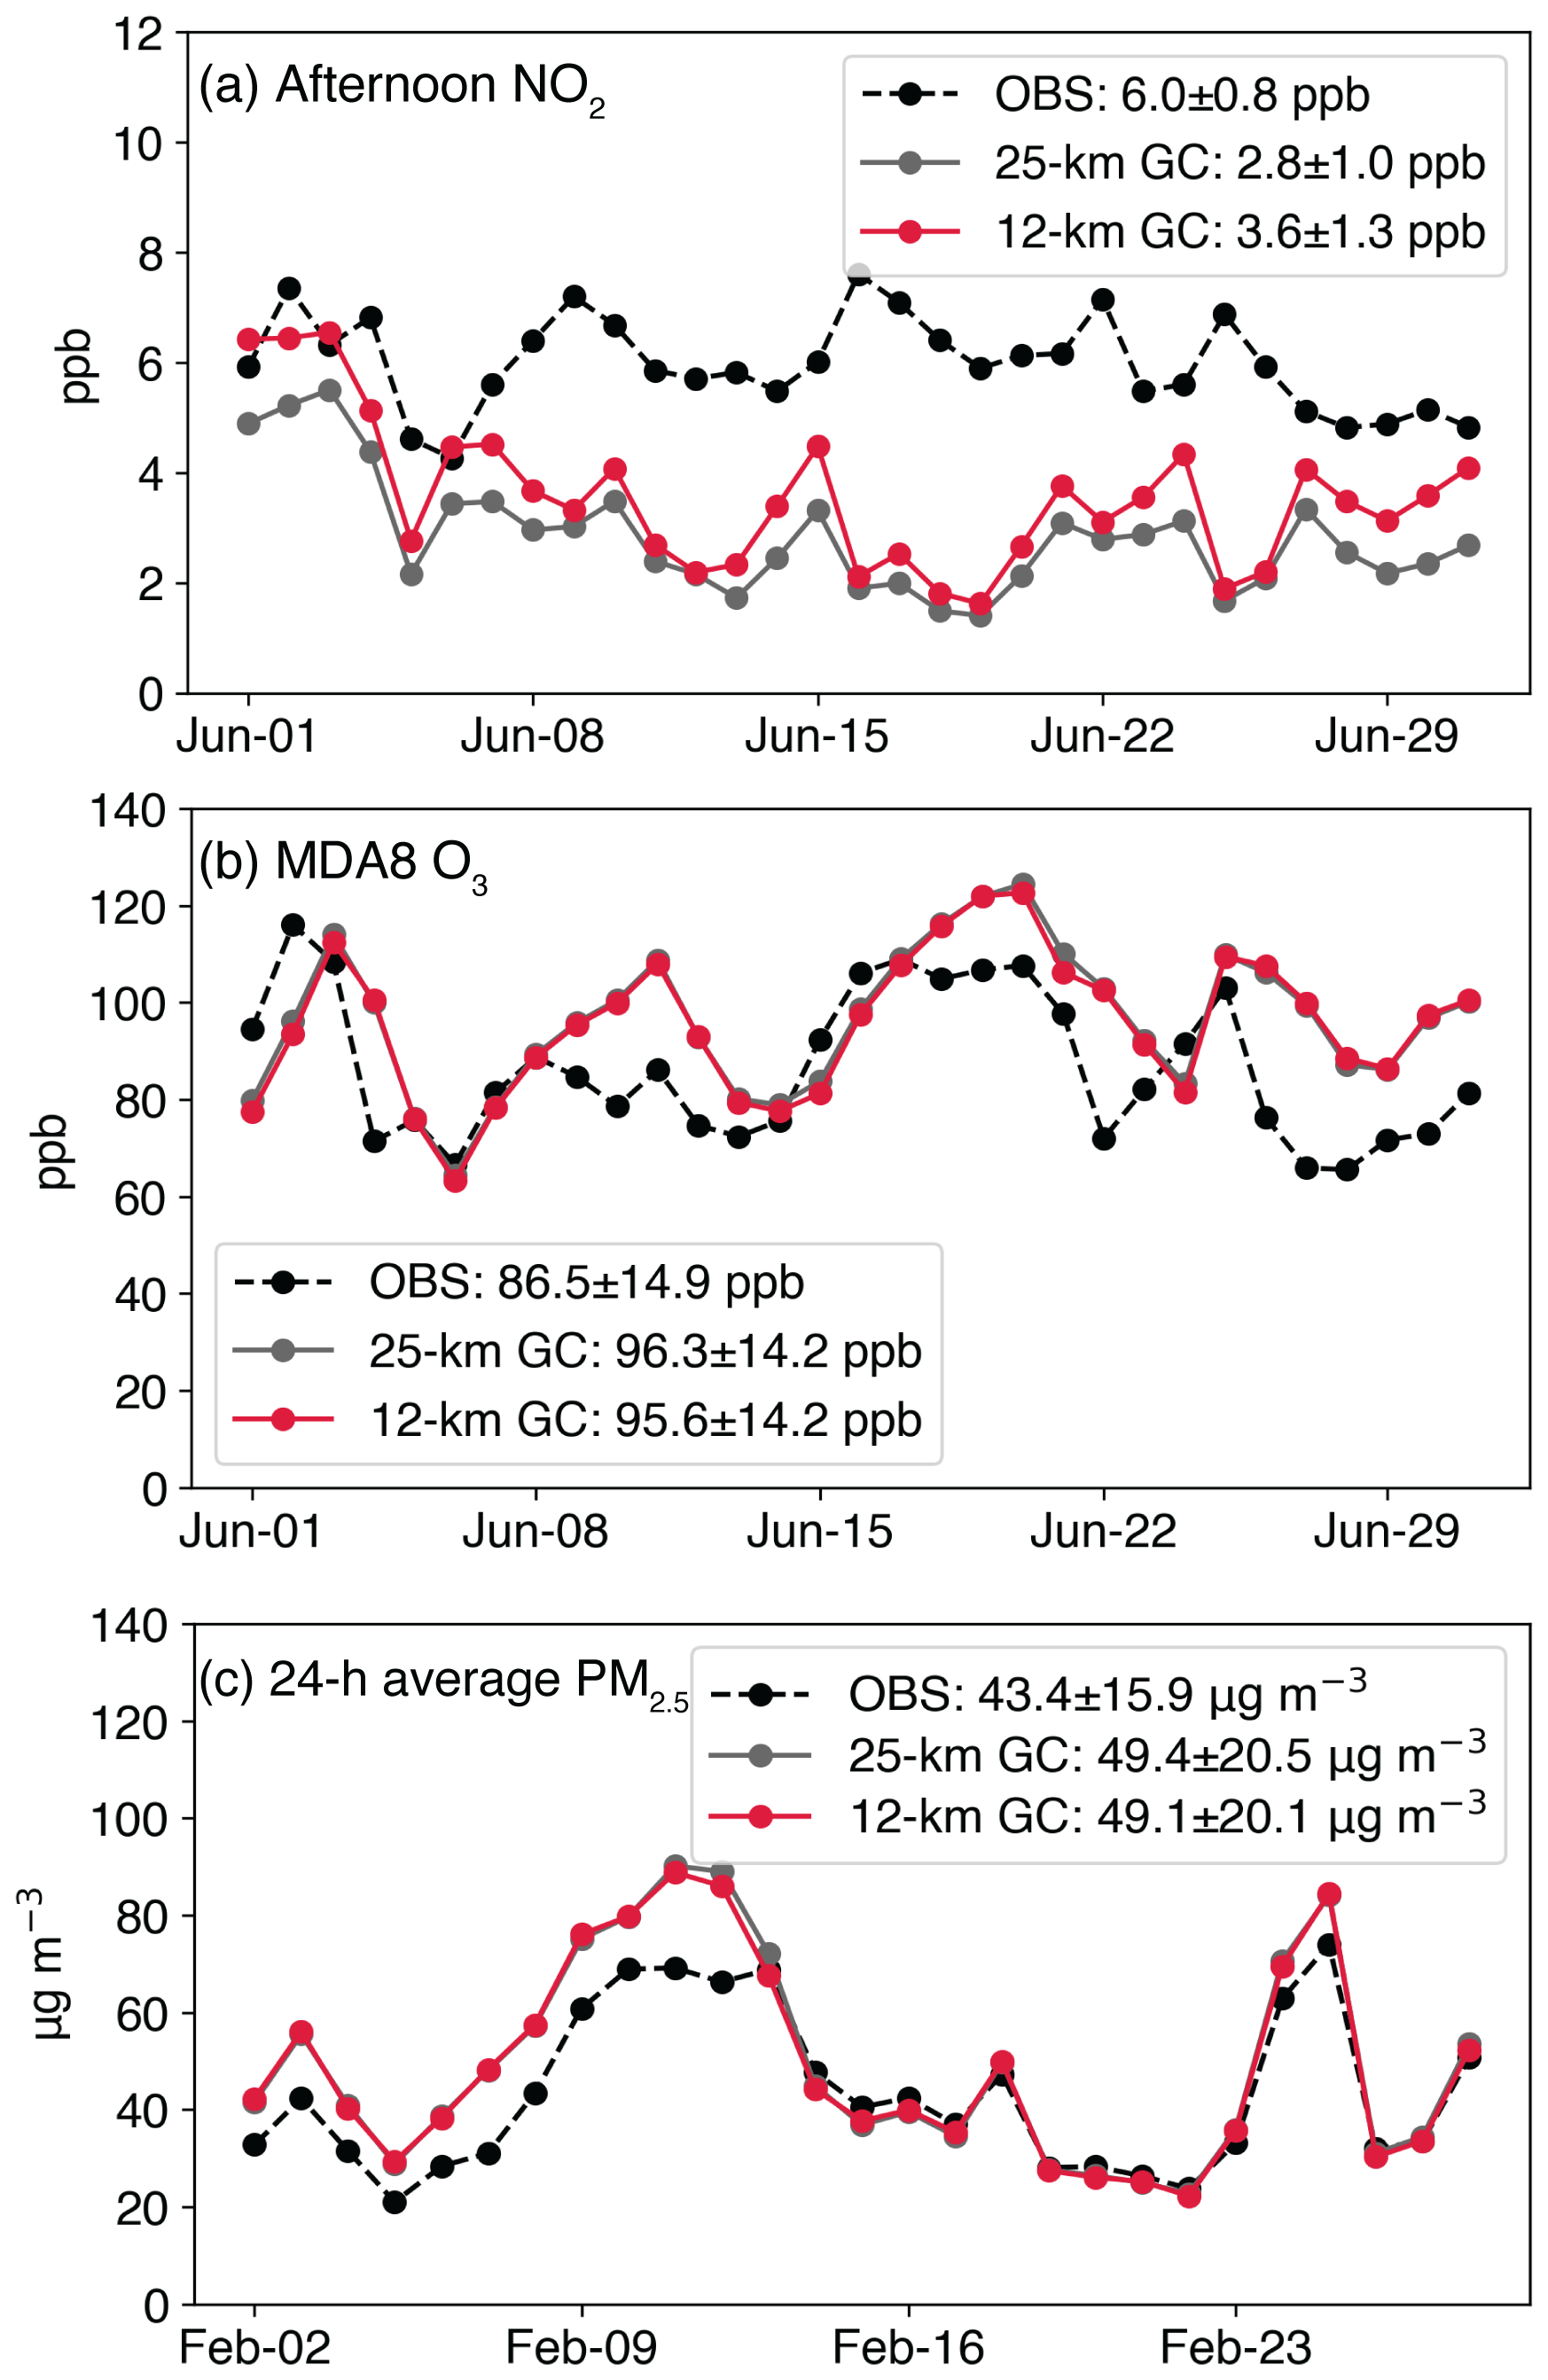
Figure 5Daily time series of surface concentrations in the North China Plain (NCP): (a) afternoon (13:00–18:00 LT) NO2 in June 2022, (b) maximum daily 8 h average (MDA8) ozone in June 2022, and (c) 24 h average PM2.5 in February 2022. Observations at China National Environmental Monitoring Center (CNEMC) sites, shown as circles in Fig. 4 and averaged over the NCP domain, are compared to GEOS-Chem simulations at 12 km and 25 km resolution for the same sites. Monthly mean values and standard deviations across all domain sites are shown inset.
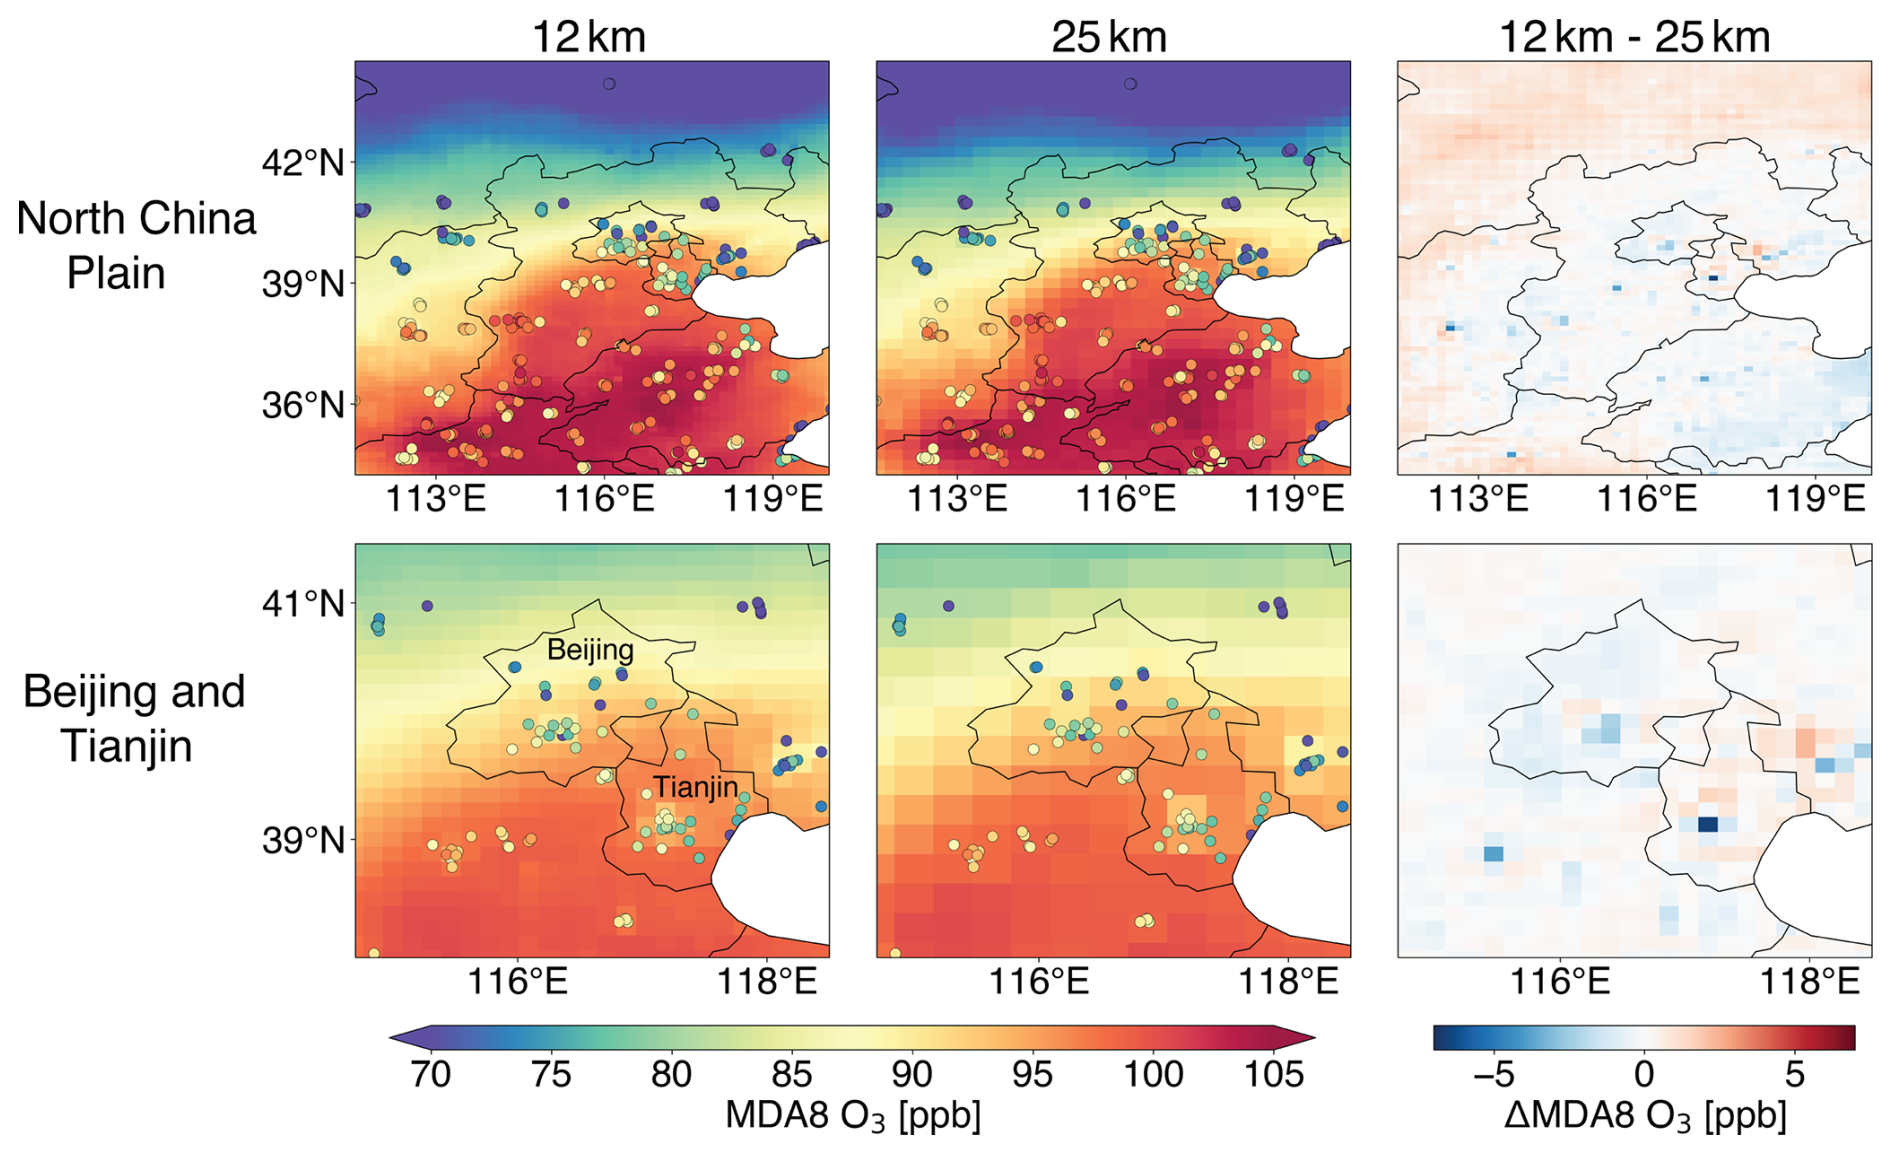
Figure 6Same as Fig. 4 but for surface MDA8 ozone concentrations in June 2022.
Figure 4 shows the afternoon (13:00–18:00 LT) surface NO2 concentrations over the NCP in June 2022 and the effect of model resolution. The finer structure at 12 km resolution is evident and largely reflects the ability to exploit the higher resolution of emissions. Comparison to CNEMC observations (Fig. 5a) shows a low bias in the model, likely reflecting the near-source locations of the sites, but the bias is reduced at 12 km resolution. The 12 km simulation does not improve the correlation with observations for individual CNEMC sites, which could reflect errors in model transport or in the spatial distribution of emissions.
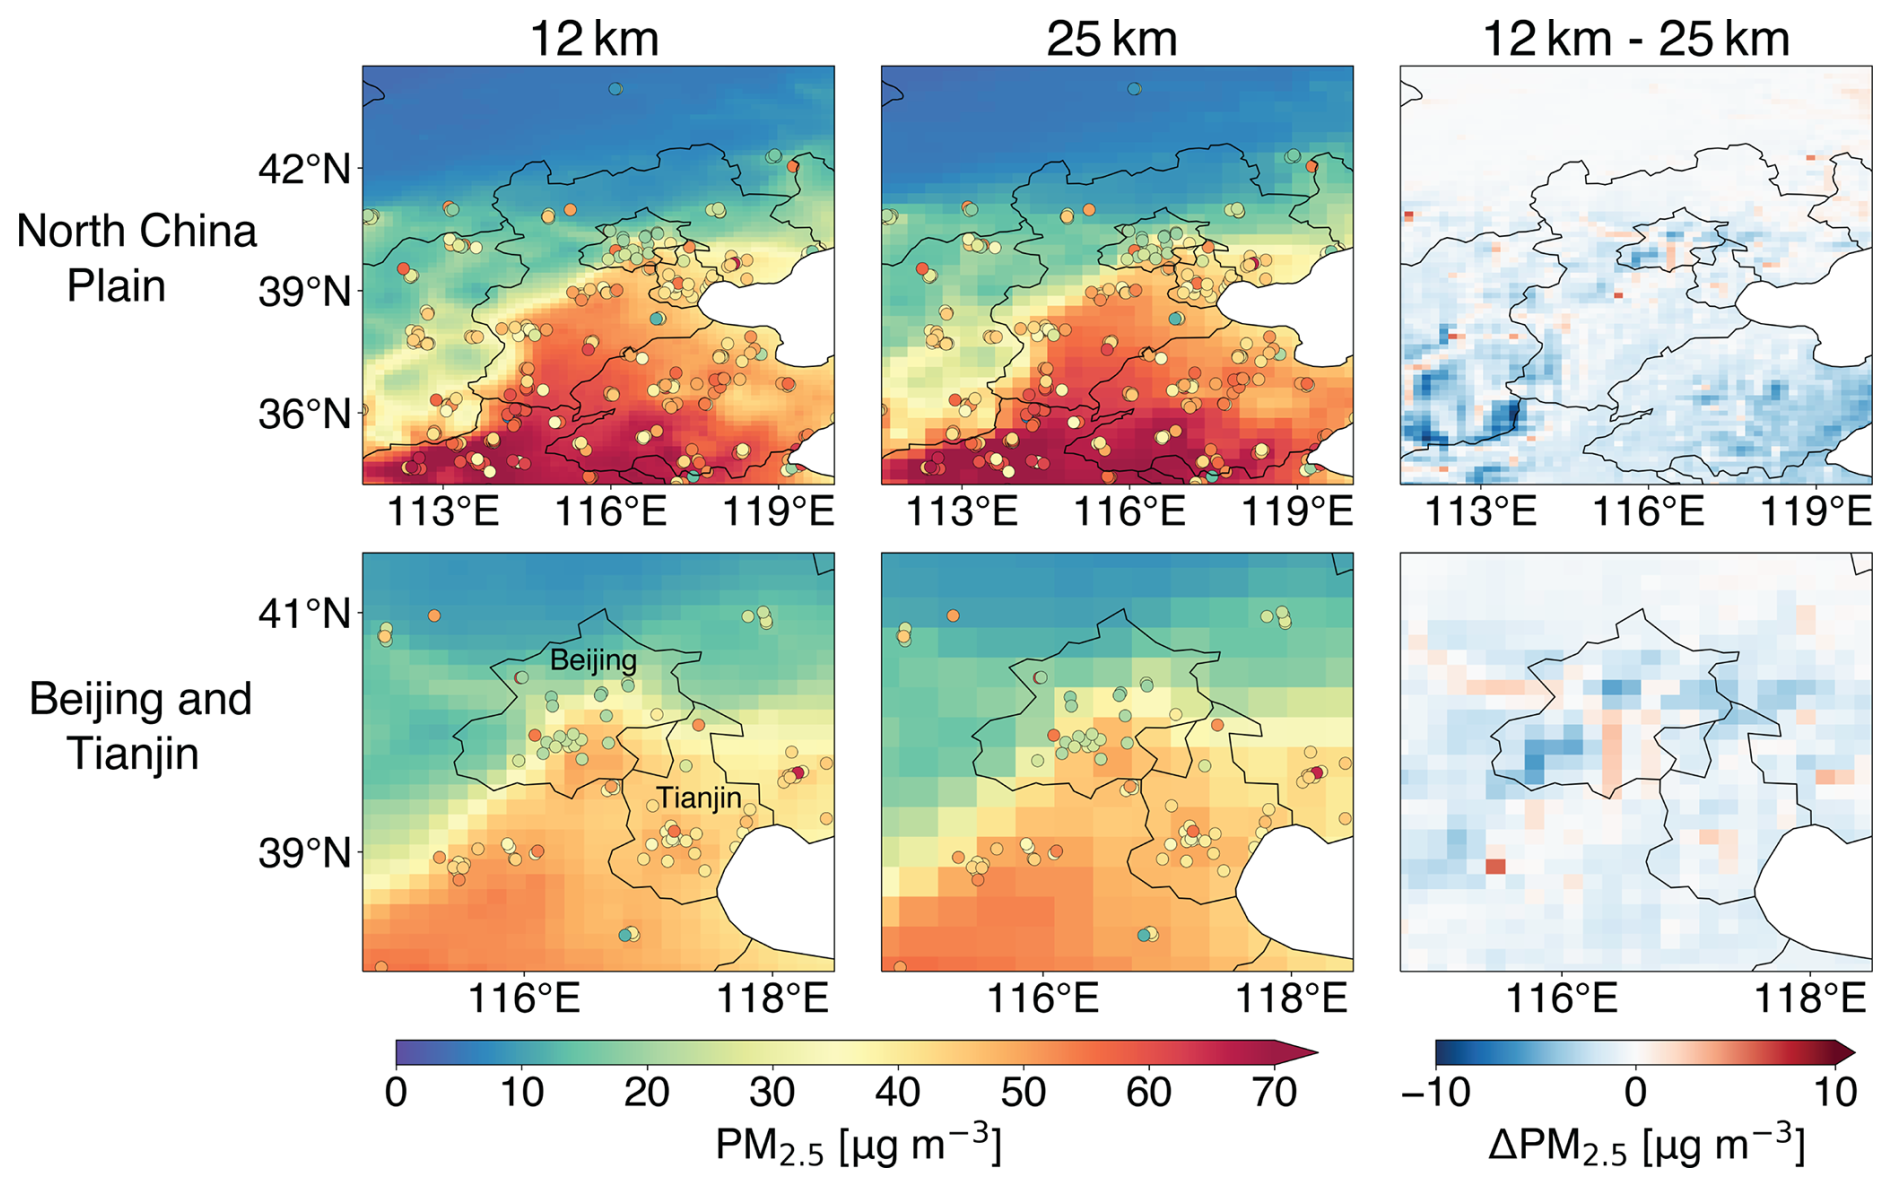
Figure 7Same as Fig. 4 but for surface 24 h average PM2.5 concentrations in February 2022.
Figure 6 compares simulated maximum daily 8 h average (MDA8) surface ozone concentrations at 12 km and 25 km resolutions in June 2022. The differences between the two resolutions are generally smaller than 5 ppb, and there is no significant difference in the fit to observations (Fig. 5b). Background ozone concentrations increase by up to 3 ppb over the northern NCP region, likely driven by increased vertical transport of ozone from aloft as seen in the simulated 7Be concentrations in Fig. 1. Increasing the model resolution to 12 km decreases surface ozone concentrations by about 3 ppb in Beijing and 6 ppb in Tianjin city core areas, as expected from higher NOx concentrations driving stronger ozone titration, whereas suburban areas exhibit ozone increases of no more than 2 ppb. These effects are too small to be effectively evaluated in the comparison to observations (Fig. 5b).
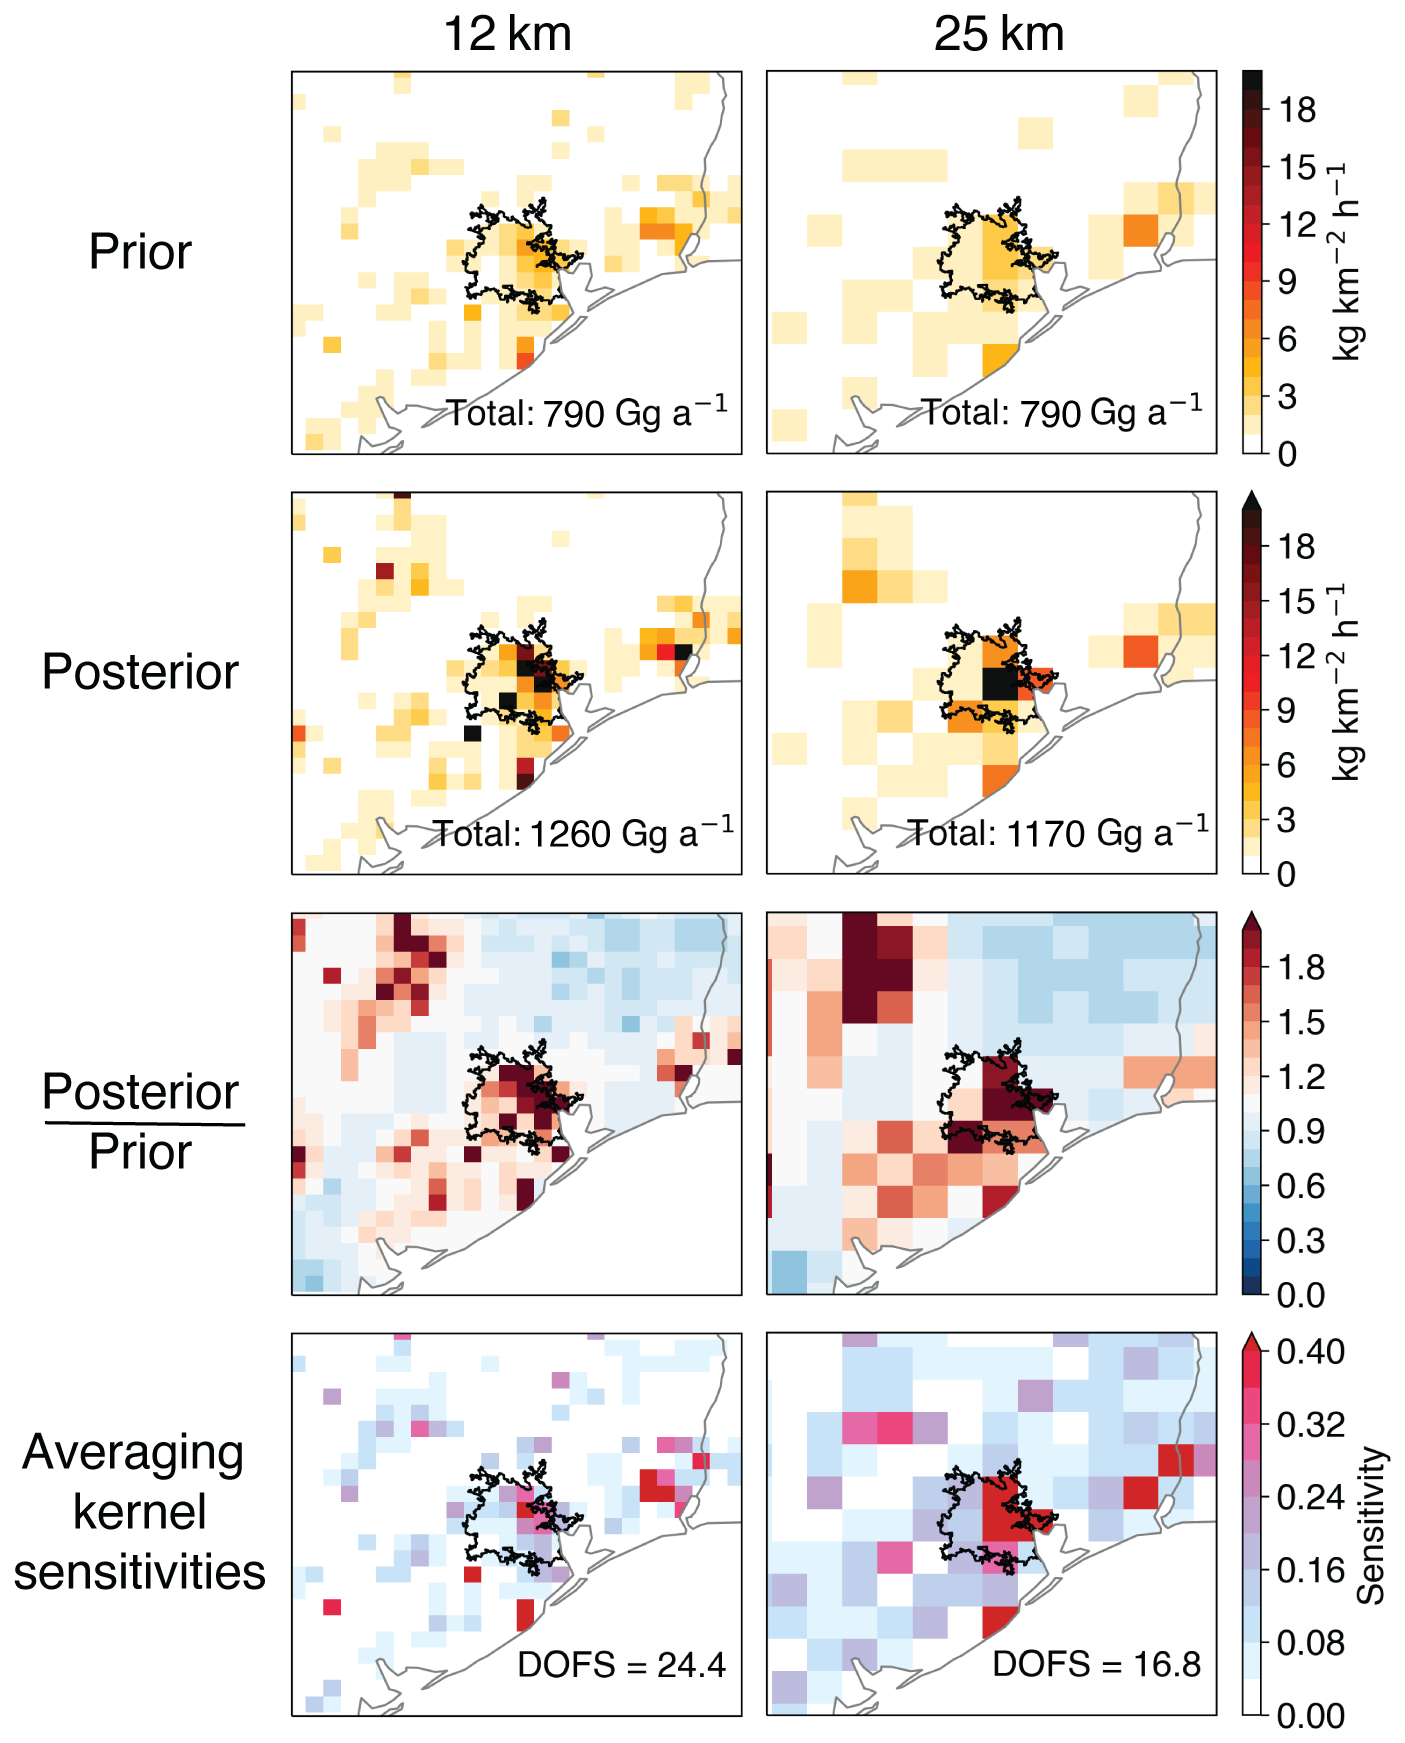
Figure 8Methane emissions in the Houston area of eastern Texas (3° × 4° domain) inferred from TROPOMI satellite observations using the Integrated Methane Inversion (IMI) at 12 km and 25 km resolution. Panels from top to bottom are prior emissions from bottom-up inventories; posterior emissions from the inversion; ratio of posterior to prior emissions; and averaging kernel sensitivities that quantify the sensitivity of the posterior estimates to the true state. The Houston urban boundary (US Census Bureau, 2017) is delineated in black. Emission totals over the whole 3° × 4° domain are shown inset in the top two rows. The sum of area-weighted averaging kernel sensitivities for the whole domain defines the Degrees of Freedom for Signal (DOFS) inset in the bottom panels.
Figure 7 shows the daily-averaged total PM2.5 mass concentrations in February 2022, where PM2.5 is computed in the model as the sum of fine aerosol components (Zhai et al., 2021). We focus on February here because PM2.5 concentrations are higher in winter than in summer (Zhai et al., 2019). PM2.5 concentrations are in general slightly lower at 12 km resolution because of the enhanced vertical transport. However, higher concentrations are found in a few urban hotspots due to primary organic aerosol emissions from combustion that are better resolved spatially. Again, differences are too small to be arbitrated by the observations (Fig. 5c).
The IMI applies the nested GEOS-Chem as forward model in regional analytical inversions of TROPOMI satellite observations of methane columns to optimize methane emissions (Estrada et al., 2025; Varon et al., 2022). It uses Bayesian inference to minimize the mismatch between the TROPOMI methane column observations and the corresponding concentrations simulated by GEOS-Chem, regularized by prior information on emissions. GEOS-Chem is applied to construct the Jacobian matrix describing the sensitivity of TROPOMI observations to emissions as simulated by the model transport. This is then used together with the TROPOMI observations, prior emission estimates, and prior and observational error statistics to derive optimized (posterior) emissions. The TROPOMI satellite observations are at 5.5 × 7 km2 pixel resolution so there is potential benefit for conducting the inversion at 12 km resolution using our new GEOS-Chem capability. The 12 km IMI configuration was previously applied in Wang et al. (2026) to quantify methane emissions across 12 US urban areas. Here we examine how inversion results vary between 12 km and 25 km resolution, focusing on the Houston urban area in eastern Texas as an example.
The IMI inversion procedure is described by Estrada et al. (2025) and Hancock et al. (2025), including the design of state vector, error estimates, and optimization strategy. Here we optimize annual methane emissions in 2022 over a 3° × 4° (latitude × longitude) domain encompassing Houston and its surrounding area as shown in Fig. 8. The state vector to be optimized consists of emissions in each land-containing grid cell of the 3° × 4° domain (496 elements at 12 km resolution and 164 elements at 25 km resolution) and boundary conditions on each lateral edge (4 elements). Our prior estimates of anthropogenic emissions are from the US Environmental Protection Agency Greenhouse Gas Inventory (GHGI) at 0.1° × 0.1° resolution for 2020 (Maasakkers et al., 2023). Natural emissions follow the default configuration as described in Estrada et al. (2025). We assume a lognormal prior error probability density function (PDF) for emissions with a geometric error standard deviation of 2.0 (Bruno et al., 2025), and a normal error PDF for boundary conditions with a 10 ppb error standard deviation. The IMI analytical inversion returns posterior emissions and a posterior error covariance matrix from which the averaging kernel matrix can be derived as a measure of information content from the observations (Brasseur and Jacob, 2017).
The prior estimate of total emissions over the 3° × 4° inversion domain is 790 Gg a−1 (Fig. 8). Total posterior emissions are 50 % higher than the prior estimate and agree closely between the 12 km inversion (1260 Gg a−1) and the 25 km inversion (1170 Gg a−1). The 12 km inversion results, when averaged over the 25 km grid, show a high degree of consistency with the 25 km inversion results over the inversion domain (spatial correlation coefficient = 0.92). The trace of the averaging kernel matrix defines the Degrees of Information for Signal (DOFS) indicating the number of pieces of information that can be obtained from the observations through the inversion independently from the prior estimate. The DOFS for the 3° × 4° domain is 24.4 for the 12 km inversion, higher than the 16.8 for the 25 km inversion. Conducting the inversion at higher resolution allows for more information on emissions to be extracted from the observations.
Another advantage of the higher-resolution inversion is better separation of the sectors contributing to methane emissions. Sectoral information in the inversion is obtained by attributing the posterior/prior emission ratios for each grid cell to the different sectors contributing emissions to that grid cell in the prior estimate (Wecht et al., 2014). Higher spatial resolution in the inversion reduces spatial overlap between sectors.
We have implemented a 12 km resolution nested capability in the GEOS-Chem global model of atmospheric chemistry by taking advantage of a new hourly GEOS advection archive available globally from March 2021 onward and freely distributed to GEOS-Chem users through the AWS cloud. We compared the 12 km simulation to the standard 25 km nested simulation in GEOS-Chem for transport tracers (222Rn, 210Pb, 7Be), ozone-aerosol chemistry, and inversion of methane satellite data where GEOS-Chem provides the forward model. The 12 km simulation has stronger vertical transport (up to 20 % decrease in 222Rn surface concentrations) because of improved representation of horizontal convergence. It shows finer spatial structure in surface pollutants (NO2), with improved capability to reproduce urban observations. It better represents surface ozone titration in urban air and slightly increases the surface ozone background by increasing vertical transport. Application to the Integrated Methane Inversion (IMI) shows regional-scale results consistent with a 25 km inversion but higher information content and greater spatial detail. Overall, this 12 km capability further extends the application of GEOS-Chem in regional atmospheric chemistry and in the use of high-resolution satellite observations to quantify emissions of air pollutants and greenhouse gases at fine spatial scales. Higher model resolution improves the representation of finer concentration gradients and inverse model sensitivity through improved transport and chemistry.
The source code of GEOS-Chem 14.6.0 is publicly available at https://doi.org/10.5281/zenodo.15243271 (The International GEOS-Chem User Community, 2025). The GEOS-FP meteorological fields used to drive GEOS-Chem are available on the Amazon Web Services (AWS) cloud (https://s3.amazonaws.com/gcgrid/index.html, last access: 21 October 2025).
XW and DJJ conceptualized the research. XW performed the analyses and data visualization. XW and MPS developed the model code. MPS, YZ and RVM contributed to the data collection. XW and DJJ wrote the manuscript with input from all authors.
The contact author has declared that none of the authors has any competing interests.
Publisher's note: Copernicus Publications remains neutral with regard to jurisdictional claims made in the text, published maps, institutional affiliations, or any other geographical representation in this paper. The authors bear the ultimate responsibility for providing appropriate place names. Views expressed in the text are those of the authors and do not necessarily reflect the views of the publisher.
This research has been supported by the United Nations Environment Programme's International Methane Emissions Observatory (IMEO) and by the NASA Atmospheric Composition Modeling and Analysis Program (grant no. 80NSSC23K0926). RVM acknowledges support from the US National Science Foundation (NSF; grant no. 2244984).
This paper was edited by Pedro Jimenez-Guerrero and reviewed by two anonymous referees.
Bey, I., Jacob, D. J., Yantosca, R. M., Logan, J. A., Field, B. D., Fiore, A. M., Li, Q., Liu, H. Y., Mickley, L. J., and Schultz, M. G.: Global modeling of tropospheric chemistry with assimilated meteorology: Model description and evaluation, J. Geophys. Res. Atmos., 106, 23073–23095, https://doi.org/10.1029/2001JD000807, 2001.
Bindle, L., Martin, R. V., Cooper, M. J., Lundgren, E. W., Eastham, S. D., Auer, B. M., Clune, T. L., Weng, H., Lin, J., Murray, L. T., Meng, J., Keller, C. A., Putman, W. M., Pawson, S., and Jacob, D. J.: Grid-stretching capability for the GEOS-Chem 13.0.0 atmospheric chemistry model, Geosci. Model Dev., 14, 5977–5997, https://doi.org/10.5194/gmd-14-5977-2021, 2021.
Brasseur, G. P. and Jacob, D. J.: Modeling of Atmospheric Chemistry, Cambridge University Press, https://doi.org/10.1017/9781316544754, 2017.
Bruno, J. H., Jacob, D. J., Wang, X., Sulprizio, M. P., Estrada, L. A., Varon, D. J., Wofsy, S. C., Omara, M., and Gautam, R.: Integrating MethaneAIR aircraft and TROPOMI satellite observations in the Integrated Methane Inversion (IMI) to optimize methane emissions, EGUsphere [preprint], https://doi.org/10.5194/egusphere-2025-4626, 2025.
Eastham, S. D., Long, M. S., Keller, C. A., Lundgren, E., Yantosca, R. M., Zhuang, J., Li, C., Lee, C. J., Yannetti, M., Auer, B. M., Clune, T. L., Kouatchou, J., Putman, W. M., Thompson, M. A., Trayanov, A. L., Molod, A. M., Martin, R. V., and Jacob, D. J.: GEOS-Chem High Performance (GCHP v11-02c): a next-generation implementation of the GEOS-Chem chemical transport model for massively parallel applications, Geosci. Model Dev., 11, 2941–2953, https://doi.org/10.5194/gmd-11-2941-2018, 2018.
Estrada, L. A., Varon, D. J., Sulprizio, M., Nesser, H., Chen, Z., Balasus, N., Hancock, S. E., He, M., East, J. D., Mooring, T. A., Oort Alonso, A., Maasakkers, J. D., Aben, I., Baray, S., Bowman, K. W., Worden, J. R., Cardoso-Saldaña, F. J., Reidy, E., and Jacob, D. J.: Integrated Methane Inversion (IMI) 2.0: an improved research and stakeholder tool for monitoring total methane emissions with high resolution worldwide using TROPOMI satellite observations, Geosci. Model Dev., 18, 3311–3330, https://doi.org/10.5194/gmd-18-3311-2025, 2025.
Fritz, T. M., Eastham, S. D., Emmons, L. K., Lin, H., Lundgren, E. W., Goldhaber, S., Barrett, S. R. H., and Jacob, D. J.: Implementation and evaluation of the GEOS-Chem chemistry module version 13.1.2 within the Community Earth System Model v2.1, Geosci. Model Dev., 15, 8669–8704, https://doi.org/10.5194/gmd-15-8669-2022, 2022.
Hancock, S. E., Jacob, D. J., Chen, Z., Nesser, H., Davitt, A., Varon, D. J., Sulprizio, M. P., Balasus, N., Estrada, L. A., Cazorla, M., Dawidowski, L., Diez, S., East, J. D., Penn, E., Randles, C. A., Worden, J., Aben, I., Parker, R. J., and Maasakkers, J. D.: Satellite quantification of methane emissions from South American countries: a high-resolution inversion of TROPOMI and GOSAT observations, Atmos. Chem. Phys., 25, 797–817, https://doi.org/10.5194/acp-25-797-2025, 2025.
Hu, L., Keller, C. A., Long, M. S., Sherwen, T., Auer, B., Da Silva, A., Nielsen, J. E., Pawson, S., Thompson, M. A., Trayanov, A. L., Travis, K. R., Grange, S. K., Evans, M. J., and Jacob, D. J.: Global simulation of tropospheric chemistry at 12.5 km resolution: performance and evaluation of the GEOS-Chem chemical module (v10-1) within the NASA GEOS Earth system model (GEOS-5 ESM), Geosci. Model Dev., 11, 4603–4620, https://doi.org/10.5194/gmd-11-4603-2018, 2018.
Kim, P. S., Jacob, D. J., Fisher, J. A., Travis, K., Yu, K., Zhu, L., Yantosca, R. M., Sulprizio, M. P., Jimenez, J. L., Campuzano-Jost, P., Froyd, K. D., Liao, J., Hair, J. W., Fenn, M. A., Butler, C. F., Wagner, N. L., Gordon, T. D., Welti, A., Wennberg, P. O., Crounse, J. D., St. Clair, J. M., Teng, A. P., Millet, D. B., Schwarz, J. P., Markovic, M. Z., and Perring, A. E.: Sources, seasonality, and trends of southeast US aerosol: an integrated analysis of surface, aircraft, and satellite observations with the GEOS-Chem chemical transport model, Atmos. Chem. Phys., 15, 10411–10433, https://doi.org/10.5194/acp-15-10411-2015, 2015.
Li, M., Kurokawa, J., Zhang, Q., Woo, J.-H., Morikawa, T., Chatani, S., Lu, Z., Song, Y., Geng, G., Hu, H., Kim, J., Cooper, O. R., and McDonald, B. C.: MIXv2: a long-term mosaic emission inventory for Asia (2010–2017), Atmos. Chem. Phys., 24, 3925–3952, https://doi.org/10.5194/acp-24-3925-2024, 2024.
Lin, H., Feng, X., Fu, T.-M., Tian, H., Ma, Y., Zhang, L., Jacob, D. J., Yantosca, R. M., Sulprizio, M. P., Lundgren, E. W., Zhuang, J., Zhang, Q., Lu, X., Zhang, L., Shen, L., Guo, J., Eastham, S. D., and Keller, C. A.: WRF-GC (v1.0): online coupling of WRF (v3.9.1.1) and GEOS-Chem (v12.2.1) for regional atmospheric chemistry modeling – Part 1: Description of the one-way model, Geosci. Model Dev., 13, 3241–3265, https://doi.org/10.5194/gmd-13-3241-2020, 2020.
Lin, H., Jacob, D. J., Lundgren, E. W., Sulprizio, M. P., Keller, C. A., Fritz, T. M., Eastham, S. D., Emmons, L. K., Campbell, P. C., Baker, B., Saylor, R. D., and Montuoro, R.: Harmonized Emissions Component (HEMCO) 3.0 as a versatile emissions component for atmospheric models: application in the GEOS-Chem, NASA GEOS, WRF-GC, CESM2, NOAA GEFS-Aerosol, and NOAA UFS models, Geosci. Model Dev., 14, 5487–5506, https://doi.org/10.5194/gmd-14-5487-2021, 2021.
Lin, J.-T. and McElroy, M. B.: Impacts of boundary layer mixing on pollutant vertical profiles in the lower troposphere: Implications to satellite remote sensing, Atmos. Environ., 44, 1726–1739, https://doi.org/10.1016/j.atmosenv.2010.02.009, 2010.
Lin, S.-J. and Rood, R. B.: Multidimensional flux-form semi-lagrangian transport schemes, Mon. Weather Rev., 124, 2046–2070, https://doi.org/10.1175/1520-0493(1996)124<2046:MFFSLT>2.0.CO;2, 1996.
Liu, H., Jacob, D. J., Bey, I., and Yantosca, R. M.: Constraints from 210Pb and 7Be on wet deposition and transport in a global three-dimensional chemical tracer model driven by assimilated meteorological fields, J. Geophys. Res. Atmospheres, 106, 12109–12128, https://doi.org/10.1029/2000JD900839, 2001.
Lu, X., Hong, J., Zhang, L., Cooper, O. R., Schultz, M. G., Xu, X., Wang, T., Gao, M., Zhao, Y., and Zhang, Y.: Severe surface ozone pollution in china: A global perspective, Environ. Sci. Technol. Lett., 5, 487–494, https://doi.org/10.1021/acs.estlett.8b00366, 2018.
Lu, X., Zhang, L., Wu, T., Long, M. S., Wang, J., Jacob, D. J., Zhang, F., Zhang, J., Eastham, S. D., Hu, L., Zhu, L., Liu, X., and Wei, M.: Development of the global atmospheric chemistry general circulation model BCC-GEOS-Chem v1.0: model description and evaluation, Geosci. Model Dev., 13, 3817–3838, https://doi.org/10.5194/gmd-13-3817-2020, 2020.
Maasakkers, J. D., McDuffie, E. E., Sulprizio, M. P., Chen, C., Schultz, M., Brunelle, L., Thrush, R., Steller, J., Sherry, C., Jacob, D. J., Jeong, S., Irving, B., and Weitz, M.: A gridded inventory of annual 2012–2018 U.S. anthropogenic methane emissions, Environ. Sci. Technol., 57, 16276–16288, https://doi.org/10.1021/acs.est.3c05138, 2023.
Martin, R. V., Eastham, S. D., Bindle, L., Lundgren, E. W., Clune, T. L., Keller, C. A., Downs, W., Zhang, D., Lucchesi, R. A., Sulprizio, M. P., Yantosca, R. M., Li, Y., Estrada, L., Putman, W. M., Auer, B. M., Trayanov, A. L., Pawson, S., and Jacob, D. J.: Improved advection, resolution, performance, and community access in the new generation (version 13) of the high-performance GEOS-Chem global atmospheric chemistry model (GCHP), Geosci. Model Dev., 15, 8731–8748, https://doi.org/10.5194/gmd-15-8731-2022, 2022.
Philip, S., Martin, R. V., and Keller, C. A.: Sensitivity of chemistry-transport model simulations to the duration of chemical and transport operators: a case study with GEOS-Chem v10-01, Geosci. Model Dev., 9, 1683–1695, https://doi.org/10.5194/gmd-9-1683-2016, 2016.
Stanevich, I., Jones, D. B. A., Strong, K., Parker, R. J., Boesch, H., Wunch, D., Notholt, J., Petri, C., Warneke, T., Sussmann, R., Schneider, M., Hase, F., Kivi, R., Deutscher, N. M., Velazco, V. A., Walker, K. A., and Deng, F.: Characterizing model errors in chemical transport modeling of methane: impact of model resolution in versions v9-02 of GEOS-Chem and v35j of its adjoint model, Geosci. Model Dev., 13, 3839–3862, https://doi.org/10.5194/gmd-13-3839-2020, 2020.
The International GEOS-Chem User Community: geoschem/GCClassic: GCClassic 14.6.0 (14.6.0), Zenodo [code], https://doi.org/10.5281/zenodo.15243271, 2025.
US Census Bureau: TIGER/Line Shapefile, 2017, 2010 nation, U.S., 2010 Census Urban Area National [data set], https://catalog.data.gov/dataset/tiger-line-shapefile-2017-2010-nation-u-s-2010-census-urban-area-national (last access: 18 October 2025), 2017.
Varon, D. J., Jacob, D. J., Sulprizio, M., Estrada, L. A., Downs, W. B., Shen, L., Hancock, S. E., Nesser, H., Qu, Z., Penn, E., Chen, Z., Lu, X., Lorente, A., Tewari, A., and Randles, C. A.: Integrated Methane Inversion (IMI 1.0): a user-friendly, cloud-based facility for inferring high-resolution methane emissions from TROPOMI satellite observations, Geosci. Model Dev., 15, 5787–5805, https://doi.org/10.5194/gmd-15-5787-2022, 2022.
Wang, X., Jacob, D. J., Downs, W., Zhai, S., Zhu, L., Shah, V., Holmes, C. D., Sherwen, T., Alexander, B., Evans, M. J., Eastham, S. D., Neuman, J. A., Veres, P. R., Koenig, T. K., Volkamer, R., Huey, L. G., Bannan, T. J., Percival, C. J., Lee, B. H., and Thornton, J. A.: Global tropospheric halogen (Cl, Br, I) chemistry and its impact on oxidants, Atmos. Chem. Phys., 21, 13973–13996, https://doi.org/10.5194/acp-21-13973-2021, 2021.
Wang, X., Jacob, D. J., Nesser, H., Balasus, N., Estrada, L. A., Sulprizio, M. P., Cusworth, D. H., Scarpelli, T. R., Chen, Z., East, J. D., and Varon, D. J.: Quantifying urban and landfill methane emissions in the United States using TROPOMI satellite data, Sci. Adv., 12, eadz9308, https://doi.org/10.1126/sciadv.adz9308, 2026.
Wang, Y. X., McElroy, M. B., Jacob, D. J., and Yantosca, R. M.: A nested grid formulation for chemical transport over Asia: Applications to CO, J. Geophys. Res. Atmos., 109, https://doi.org/10.1029/2004JD005237, 2004.
Wecht, K. J., Jacob, D. J., Frankenberg, C., Jiang, Z., and Blake, D. R.: Mapping of North American methane emissions with high spatial resolution by inversion of SCIAMACHY satellite data, J. Geophys. Res.-Atmos., 119, 7741–7756, https://doi.org/10.1002/2014JD021551, 2014.
Yu, K., Keller, C. A., Jacob, D. J., Molod, A. M., Eastham, S. D., and Long, M. S.: Errors and improvements in the use of archived meteorological data for chemical transport modeling: an analysis using GEOS-Chem v11-01 driven by GEOS-5 meteorology, Geosci. Model Dev., 11, 305–319, https://doi.org/10.5194/gmd-11-305-2018, 2018.
Zhai, S., Jacob, D. J., Wang, X., Shen, L., Li, K., Zhang, Y., Gui, K., Zhao, T., and Liao, H.: Fine particulate matter (PM2.5) trends in China, 2013–2018: separating contributions from anthropogenic emissions and meteorology, Atmos. Chem. Phys., 19, 11031–11041, https://doi.org/10.5194/acp-19-11031-2019, 2019.
Zhai, S., Jacob, D. J., Brewer, J. F., Li, K., Moch, J. M., Kim, J., Lee, S., Lim, H., Lee, H. C., Kuk, S. K., Park, R. J., Jeong, J. I., Wang, X., Liu, P., Luo, G., Yu, F., Meng, J., Martin, R. V., Travis, K. R., Hair, J. W., Anderson, B. E., Dibb, J. E., Jimenez, J. L., Campuzano-Jost, P., Nault, B. A., Woo, J.-H., Kim, Y., Zhang, Q., and Liao, H.: Relating geostationary satellite measurements of aerosol optical depth (AOD) over East Asia to fine particulate matter (PM2.5): insights from the KORUS-AQ aircraft campaign and GEOS-Chem model simulations, Atmos. Chem. Phys., 21, 16775–16791, https://doi.org/10.5194/acp-21-16775-2021, 2021.
Zhang, B., Liu, H., Crawford, J. H., Chen, G., Fairlie, T. D., Chambers, S., Kang, C.-H., Williams, A. G., Zhang, K., Considine, D. B., Sulprizio, M. P., and Yantosca, R. M.: Simulation of radon-222 with the GEOS-Chem global model: emissions, seasonality, and convective transport, Atmos. Chem. Phys., 21, 1861–1887, https://doi.org/10.5194/acp-21-1861-2021, 2021.
Zhang, L., Liu, L., Zhao, Y., Gong, S., Zhang, X., Henze, D. K., Capps, S. L., Fu, T.-M., Zhang, Q., and Wang, Y.: Source attribution of particulate matter pollution over North China with the adjoint method, Environ. Res. Lett., 10, 084011, https://doi.org/10.1088/1748-9326/10/8/084011, 2015.
Zheng, B., Tong, D., Li, M., Liu, F., Hong, C., Geng, G., Li, H., Li, X., Peng, L., Qi, J., Yan, L., Zhang, Y., Zhao, H., Zheng, Y., He, K., and Zhang, Q.: Trends in China's anthropogenic emissions since 2010 as the consequence of clean air actions, Atmos. Chem. Phys., 18, 14095–14111, https://doi.org/10.5194/acp-18-14095-2018, 2018.
Zhuang, J., Jacob, D. J., Gaya, J. F., Yantosca, R. M., Lundgren, E. W., Sulprizio, M. P., and Eastham, S. D.: Enabling Immediate Access to Earth Science Models through Cloud Computing: Application to the GEOS-Chem Model, Bull. Am. Meteorol. Soc., 100, 1943–1960, https://doi.org/10.1175/BAMS-D-18-0243.1, 2019.
- Abstract
- Introduction
- GEOS-Chem simulation at 12 km resolution
- Transport tracer simulations
- Full-chemistry simulations
- Application to the Integrated Methane Inversion (IMI)
- Conclusions
- Code and data availability
- Author contributions
- Competing interests
- Disclaimer
- Financial support
- Review statement
- References
We implement a new 12-km global nested simulation capability in GEOS-Chem, an open-source global 3-D model of atmospheric chemistry. Compared with the standard 25-km simulation, the 12-km simulation features stronger vertical transport due to better resolved horizontal convergence, along with improved representation of urban NO2 and ozone titration. Application to methane emission inversion yields higher information content and resolves finer spatial structure in emission sectors.
We implement a new 12-km global nested simulation capability in GEOS-Chem, an open-source global...
- Abstract
- Introduction
- GEOS-Chem simulation at 12 km resolution
- Transport tracer simulations
- Full-chemistry simulations
- Application to the Integrated Methane Inversion (IMI)
- Conclusions
- Code and data availability
- Author contributions
- Competing interests
- Disclaimer
- Financial support
- Review statement
- References