the Creative Commons Attribution 4.0 License.
the Creative Commons Attribution 4.0 License.
 | 18 May 2026
Evaluating Long-term seasonal variability of aerosol optical properties in Colorado
Erin K. Boedicker
Andre Bergeron
Gerardo Carrillo-Cardenas
Dominik Kulakowski
John Rogan
Elisabeth Andrews
Aerosol particles resulting from both wildfires and dust events introduce considerable uncertainty into both climate research and public health assessments. These challenges are becoming particularly evident in the western US. To gain a deeper understanding of western US aerosol properties, we analyzed 13 years (2011–2024) of surface in-situ aerosol optical data from Storm Peak Laboratory (SPL) in northwestern Colorado, and 6 years (2019–2024) of surface in-situ aerosol optical data from Table Mountain (BOS) in central Colorado. The aerosol optical properties at both sites demonstrate a strong summer wildfire smoke signal (peaking in August) and evidence of springtime dust events. BOS exhibited higher aerosol loading than SPL, particularly during spring and winter, consistent with the proximity of BOS to urban sources and its lower elevation. While the general patterns observed for SPL are consistent with a previous climatological analysis (covering the period 2011–2016) for the site, the longer SPL dataset used here shows that there has been a significant increase in extreme wildfire smoke events for 2017–2024 relative to 2011–2016. Both summer and fall exhibit statistically significant positive trends in the upper percentiles of scattering coefficient with trends of 10 ± 1 % yr−1 at the 98th percentile in the summer and 2.4 ± 0.4 % yr−1 at the 96th percentile in the fall. Co-variability among some of the aerosol optical properties is used to further identify aerosol types and temporal patterns, demonstrating similarities between the two sites.
- Article
(6916 KB) - Full-text XML
-
Supplement
(3617 KB) - BibTeX
- EndNote


The western US climate has undergone significant changes over the past several decades (Westerling et al., 2006) marked by warming (Higuera and Abatzoglou, 2021), drought (Leeper et al., 2022), and declining snowpack (Mote et al., 2018). These environmental changes have led to enhanced wildfire activity (Pederson et al., 2013; Westerling et al., 2006), intensity (Iglesias et al., 2022; Mote et al., 2018), and increases in annual burn area (Dennison et al., 2014; Weber and Yadav, 2020), resulting in declining air quality conditions (Hallar et al., 2015; McClure and Jaffe, 2018; Wilmot et al., 2021). These shifts are closely linked to earlier springtime warming (Mote et al., 2018; Pederson et al., 2013) which strongly influences spring and summertime land surface aridity and aerosol loading (Hallar et al., 2017; Lian et al., 2020; Wilmot et al., 2021). Changes in surface aridity can lead to an increased exposure to in airborne dust (Achakulwisut et al., 2019; Lambert et al., 2020; Pu and Ginoux, 2017) and particulate matter from wildfires, which can result in increased rates of respiratory illnesses (Delfino et al., 2009; Haikerwal et al., 2016), hospital admissions (Liu et al., 2015, 2017), and mortality rates (Johnston et al., 2012).
In addition to human health concerns, wildfire and dust-induced atmospheric aerosol particles impose notable effects on the climate system (Kok et al., 2023; Penner et al., 1992). For instance, aerosol particles can absorb and scatter solar radiation which inflict direct influences on the planetary energy balance (Bond et al., 2013; Ghan and Schwartz, 2007). They also have an indirect influence due to their ability to act as both ice and cloud condensation nuclei (Barry et al., 2021; Hallar et al., 2017; Jahn et al., 2020; Twohy et al., 2021; Wei et al., 2019). The chemical composition, size distribution, shape, and other external variables (e.g., relative humidity and wavelength of incident light) determine the aerosol optical properties (Seinfeld and Pandis, 2006) and can be used to characterize plumes that travel with air masses in the atmosphere (Davulienė et al., 2024; Junghenn Noyes et al., 2022).
Determining the radiative properties of aerosol particles caused by dust and wildfires requires an understanding of the aerosol properties as well as atmospheric transport mechanisms (Davulienė et al., 2024), and meteorological conditions (Wilmot et al., 2021). However, due to the high spatiotemporal variability of aerosol particles and sensitivity to climate, land use change, land management policies, and human activity (Ford et al., 2018), the radiative impact of aerosol particles remains uncertain (IPCC, 2023; Jiang et al., 2020; Kok et al., 2023). Ground and satellite based remote sensing observations provide broad spatial information and can be used to investigate vertically resolved aerosol processes; however, they cannot provide fine details of conditions at specific locations. Further, variables such as single scattering albedo can only be retrieved during high loading events which may not be representative of the normal climatological conditions (Dubovik and King, 2000). Surface aerosol in-situ measurements provide aerosol information that is critical for quantifying aerosol climatology (temporal patterns, amount, and characteristics) at a specific location (Laj et al., 2020). These measurements can be used to estimate direct and indirect aerosol radiative forcing and to infer additional information such as aerosol type (Cappa et al., 2016; Schmeisser et al., 2017). Long term aerosol measurements can also allow diagnosis of trends and identification of the changes contributing to those trends.
In the western US, concentrations of natural and anthropogenic aerosol particles can vary significantly (Eibedingil et al., 2021; Hand et al., 2024a). In regions with complex topography such as Colorado, regional and synoptic-scale meteorology and climate conditions strongly influence aerosol transport from diverse sources (Creamean et al., 2016). On the more local scale, thermally driven upslope flow can lift pollutants from lower elevations to higher in the atmosphere (Collaud Coen et al., 2018).
Japngie-Green et al. (2019) examined seasonal cycles of aerosol optical properties between 2011 and 2016 at Storm Peak Laboratory (SPL), an atmospheric science research laboratory near the Steamboat Springs ski resort in northwestern Colorado (Borys and Wetzel, 1997; Hallar et al., 2025). SPL is characterized as a mountain-top field site far from traffic, industry, or other anthropogenic influences and is often within the free troposphere (Collaud Coen et al., 2018; Japngie-Green et al., 2019). The work of Japngie-Green et al. (2019) established a baseline for aerosol optical property measurements at SPL, revealing higher aerosol scattering and absorption coefficient patterns in the summertime due to increased wildfire activity and decreased springtime aerosol scattering Ångström exponent patterns related to dust events. Japngie-Green et al. (2019) analyzed the first 6 years of aerosol optical properties from SPL, however the long-term annual trends in aerosol optical properties were not specifically evaluated, as 6 years of data is not long enough for a trend analysis (Collaud Coen et al., 2020). In this study, a longer data set (2011–2024) from SPL was utilized and data from the Table Mountain Field Site (BOS), another Colorado site with identical aerosol instrumentation as SPL, was also incorporated. BOS is located 120 km southeast of SPL on Colorado's Front Range (an urban corridor just east of the Rocky Mountains) and is within the boundary layer where most anthropogenic emissions take place. Data from these two sites was used to evaluate the climatological patterns of aerosol optical properties measured in the region. Specifically, this study aimed to identify the similarities and differences in aerosol properties at SPL and BOS and to discuss how location impacts the long-term patterns observed at each site. Additionally, this study used aerosol optical properties to characterize wildfire activity and dust events in the region.
2.1 Sites
Surface aerosol in-situ data from two sites in Colorado was used: Storm Peak Laboratory and the Table Mountain Field Site. Both sites are part of the NOAA Federated Aerosol Network (NFAN), a collaborative network of sites that make long-term measurements of surface in-situ aerosol optical properties worldwide (Andrews et al., 2019). The NFAN sites have similar inlet and aerosol system infrastructure, operational and data processing protocols, and calibrations that follow established Global Atmosphere Watch Programme (GAW) aerosol sampling protocols to ensure consistent high-quality measurements that are directly comparable across sites in the network (Andrews et al., 2019; WMO, 2016). The location of the sites, their proximity to population centers in Colorado, and topographical information is shown in Fig. 1. For the analysis presented herein, the primary time ranges used are 2011–2024 for SPL and 2019–2024 for BOS; when different time ranges are used it is noted.
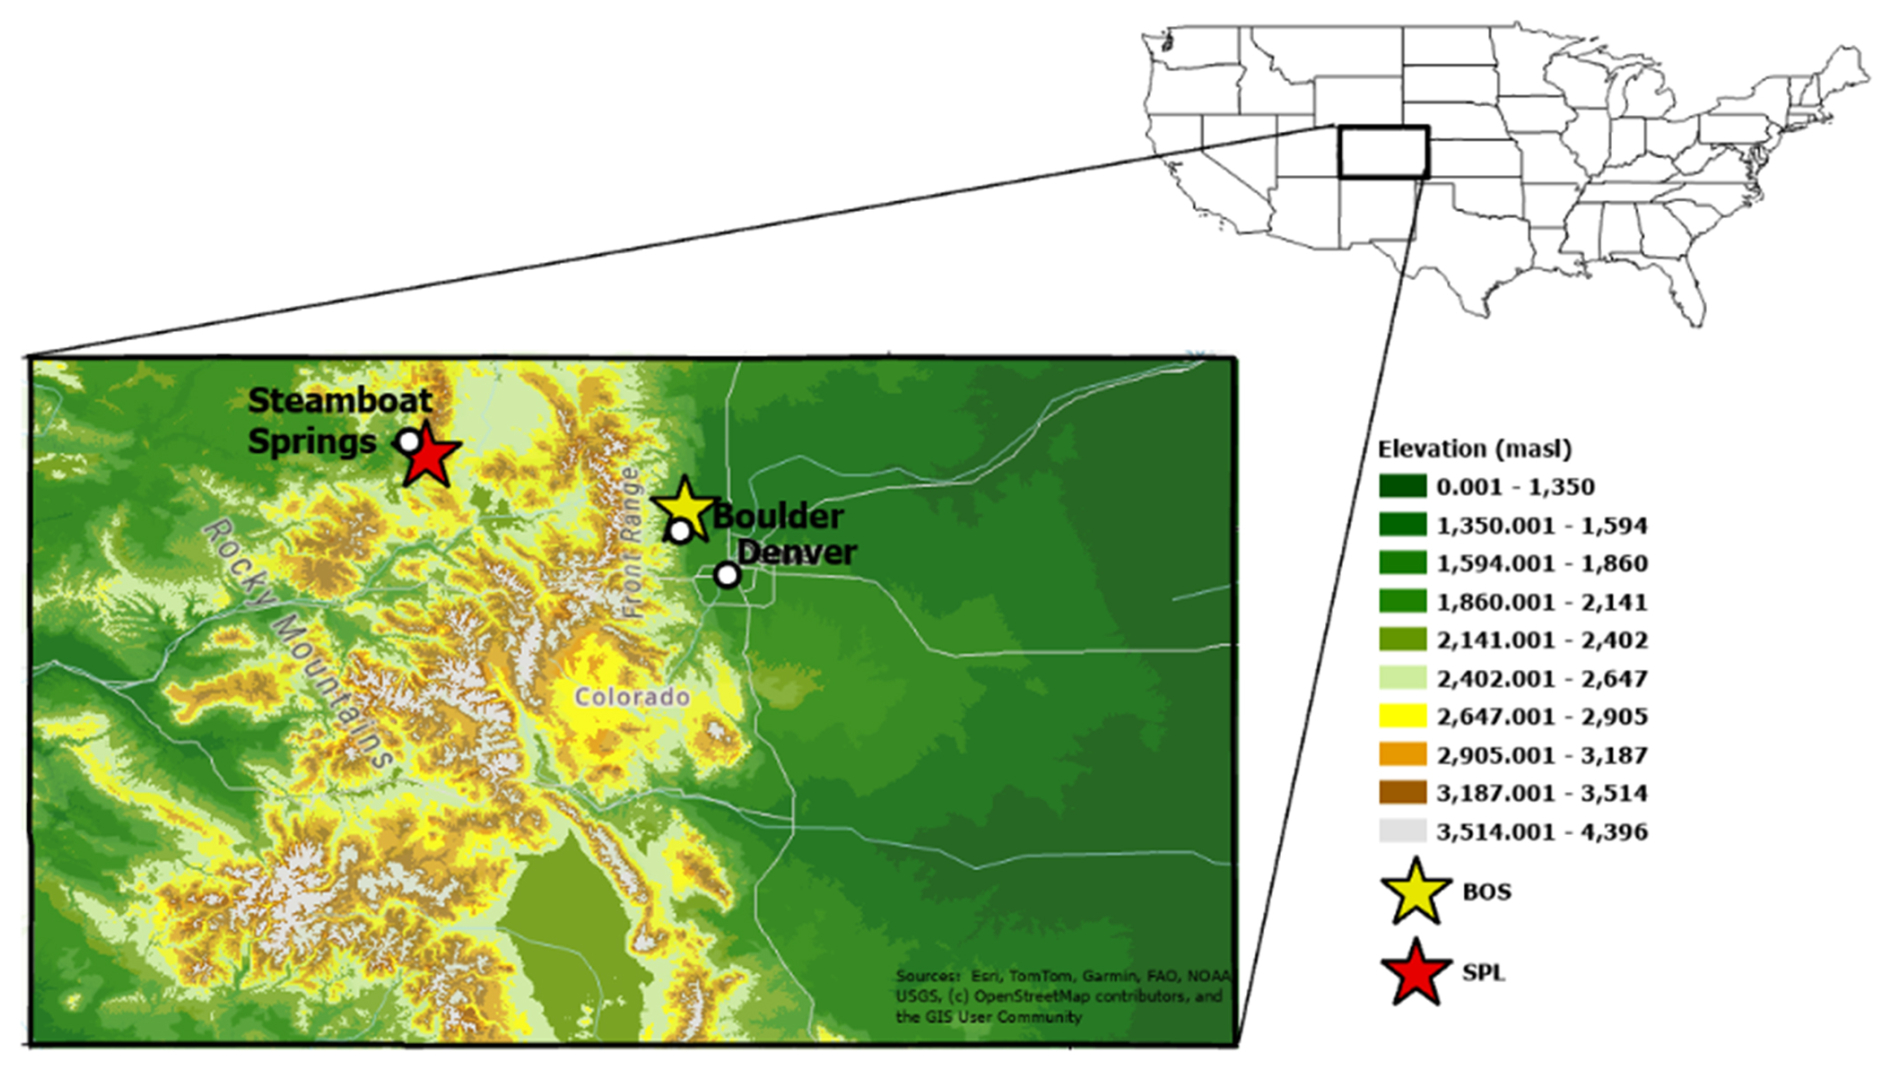
Figure 130 m Digital Elevation Model of Colorado with relative locations of SPL and BOS. Topographic data used is from the Shuttle Radar Topography Mission described by Farr et al. (2007) and the map was generated using ArcGIS Pro (OpenStreetMap).
2.1.1 Storm Peak Laboratory (SPL)
The first in-situ dataset used in this study was from Storm Peak Laboratory (40.455° N, 106.745° W, 3220 ). SPL is a high elevation research facility (Hallar et al., 2025) located on the west summit of Mount Werner in the Park Range of the Rocky Mountains (Fig. 1). The site is 1120 m above and ∼ 5 mi (∼ 8 km) from the nearest population center of Steamboat Springs, CO (population ∼ 13 500). SPL was established in 1981 and the facility is currently operated by the University of Utah. Measurements of in-situ aerosol optical properties began in 2011.
2.1.2 Table Mountain Field Site (BOS)
The second aerosol in-situ dataset was from the Table Mountain Field Site (40.125° N, 105.237° W, 1689 ). BOS is located on a plateau on the eastern edge of the Rocky Mountain Front Range. The site is ∼ 10 km north of the nearest population center of Boulder, Colorado (population ∼ 105 900; Fig. 1) and 50 km northwest of Denver, Colorado (population ∼ 715 000). BOS has been a radio frequency test site since 1954; measurements of in-situ aerosol optical properties began in September of 2019. The site is managed by the National Telecommunications and Information Administration (NTIA), and the NFAN site is operated by NOAA's Global Monitoring Laboratory (GML).
2.2 Sampling conditioning and instrumentation
Aerosol particles at both SPL and BOS are sampled from 10 m above the surface to minimize contamination from local activities. At BOS, when needed, the sample air is gently heated (< 40 °C) to achieve a sample RH ≤ 40 %. Malm et al. (2024) suggests this level of heating would not lead to volatilization of the BOS aerosol. At SPL, bringing the cool outside air into the heated observatory is enough to ensure the sample RH ≤ 40 %. A switched impactor system provides size-segregated measurements using Berner-type multijet cascade impactors for 10 and 1 µm size cuts, which have aerodynamic cut diameters of ∼ 7 and ∼ 0.7 µm under our sampling system (Berner et al., 1979; Hillamo and Kauppinen, 1991). Switching between PM10 and PM1 occurs every 6 min, yielding a 30 min measurement of each size-cut per hour. Optical measurements at both sites are made at 1 min resolution; here hourly averaged data are used. Prior to averaging, all measurements underwent a quality assurance process to remove contaminated values (e.g. spikes from ski area operations at SPL and mowing operations at BOS that are not representative of the wider region) and invalid values (e.g. when instruments failed).
Aerosol scattering (σsp) and backscattering (σbsp) coefficients are measured at both sites using an integrating nephelometer (Model 3563, TSI Inc.). The nephelometer measures aerosol σsp and σbsp coefficients at three wavelengths: 450, 550, and 700 nm. Total scattering coefficient is measured over an angular range of 7–170° and total backscattering coefficient is measured over an angular range of 90–170°. The nephelometer measurements were corrected for angular truncation and other instrument non-idealities using the method described by Anderson and Ogren (1998). The nephelometer data are adjusted to standard temperature and pressure (0 °C, 1 atm). The overall uncertainty in the nephelometer measurements has previously been evaluated to be ∼ 9.2 % under average conditions at continental sites (Sherman et al., 2015). Error was calculated for the instrument and measurement conditions at SPL and BOS and were found to be generally comparable under both extremely clean (∼ 10 % error) and heavy aerosol loading (∼ 9.2 % error) conditions (Table S2 in the Supplement).
At SPL, aerosol absorption coefficients (σap) were measured using both a Particle Soot Absorption Photometer (PSAP; Radiance Research), from 2011–2018, and a Continuous Light Absorption Photometer (CLAP; NOAA; Ogren et al., 2017), from 2011–2024. Both instruments measure absorption at three wavelengths: the PSAP at 467, 530, and 660 nm, and the CLAP at 467, 528, and 652 nm. The two instruments have previously been shown to be comparable measurements (Ogren et al., 2017), and an intercomparison of the PSAP and CLAP data from SPL was done to confirm this (Sect. S1 in the Supplement). For the analysis presented in this work, only the CLAP data from SPL were used. The work done by Japngie-Green et al. (2019) used data from both the PSAP (2011–2013) and the CLAP (2013–2016), but the assessment in Sect. S1 indicates that the CLAP absorption data presented here is comparable to the combination of PSAP and CLAP data presented by Japngie-Green et al. (2019). Only a CLAP was deployed at BOS and those are the data used. Absorption measurements were corrected for scattering and filter artifacts, sample area, flowrate, and non-idealities in the manufacturer's calibration (Bond et al., 1999; Ogren, 2010). Uncertainty in the CLAP σap measurement is ∼ 20 %, though it increases substantially under extremely clean conditions to ∼ 40 % (Sect. S2; Ogren et al., 2017; Sherman et al., 2015). The absorption data are reported at standard temperature and pressure, so no STP correction is needed. In the analysis presented, the wavelengths of all absorption coefficients (σap) were adjusted to match the nephelometer scattering wavelengths (450, 550, and 700 nm) using the measured spectral dependence of absorption (Sect. S2).
2.3 Calculated parameters
Using the measured scattering and absorption coefficients, several variables can be calculated: single scattering albedo (SSA), backscattering fraction (BFR), scattering Ångström exponent (SAE), and absorption Ångström exponent (AAE). The equations for these variables are given below:
In Eqs. (3) and (4), λ represents wavelengths, and the subscripts indicate the specific wavelengths used in the calculation – both SAE and AAE were calculated using the 450 and 700 nm wavelength. These calculated parameters were only considered when constraints were met: σsp > 1 M m−1 and/or σap > 0.5 M m−1. These constraints were applied to the parameters that used the σsp and/or σap values in their calculation (e.g. for SAE only the σsp constraint was applied but for SSA both constraints were applied). Below those values the calculated parameters are more heavily influenced by instrument noise and are less reliable. Average fractional uncertainties for SSA, BFR, SAE, and AAE at these σsp and σap constraints are 3.5 %, 8.2 %, 6.3 % and 32.2 %, respectively (Table S2). This filtering predominately affected parameters related to absorption (SSA and AAE). The SPL data were more heavily impacted as the site has lower overall aerosol loadings, resulting in filtering out over 50 % of the potential SSA and AAE values. Despite this filtering, the overall statistical values for the variables were not significantly affected (Table S3). This was also shown by Schmeisser et al. (2017) who applied the same constraints to SPL data for the time period 2012–2013 (their supplemental Table S5).
The measured σsp and σap parameters depend on aerosol loading while the calculated parameters (SSA, BFR, SAE, and AAE) are independent of aerosol loading and instead describe characteristics of the aerosol. For atmospheric aerosol particles SSA typically ranges from 0.3 to 1 and provides information on aerosol composition and reflectivity (Laj et al., 2020). SSA values near 1 are representative of low/non-absorbing “white” aerosol particles, while low SSA values < 0.85 indicate darker, more-absorbing aerosol particles (Bond et al., 2013). BFR is sensitive to the smallest accumulation mode particles (diameter < 0.3 µm; Collaud Coen et al., 2007). If the accumulation mode shifts to larger sizes, BFR will decrease and vice versa. Typically, BFR ranges from 0.08–0.2. SAE also yields information about the size distribution of aerosol particles (Schuster et al., 2006). Low values (SAE < 1) indicate the presence of coarse particles, while high values (≥ 2) correspond to an aerosol dominated by fine-mode aerosol particles. The absorption Ångström exponent can yield information about particle composition (Russell et al., 2010) with values near 1 associated with black carbon and fossil fuel burning, while larger AAE values (≥ 2) are representative of biomass burning, light-absorbing organic carbon, and dust.
2.4 Trend analysis
Following a similar approach to McClure and Jaffe (2018), quantile regression was used to assess trends in extreme events at SPL (Koenker et al., 2025). This method was developed by Koenker and Bassett (1978), and the software package used herein follows Koenker and D'Orey (1987). Quantile regression (QR) applies asymmetric weighting at different quantiles and regresses the entire dataset at specific quantiles to estimate the rate of change across the entire distribution of data (Koenker, 2005; Koenker and Hallock, 2001). The regressions presented are not for a single quantile or subset of the data, but for the entire dataset at a specific quantile. For example, in the estimation of a 75th quantile regression a regression line is fit through the data so 75 % of the residuals are negative (below the regression line) and then the weighted distances are minimized. This method is appropriate in situations where a dataset has significant outliers that would not be well characterized using symmetric weighting, such as that done in ordinary least squares regressions. This analysis was performed on the σsp and SAE data, to assess changes in both aerosol amount and type. The same filtering used for the calculated optical properties was applied to σsp and SAE before this analysis to minimize effect of noise on the trends in the lowest quantiles. Trends using this method were considered significant when the p-value was < 0.05, corresponding to a 95 % confidence level. All trends are reported with a standard error, calculated using nonlinear interaction decomposition. This method uses the Huber Sandwich estimate to calculate the variance and uses local sparsity of the data around the percentile being fitted, which helps incorporate the uncertainty of the percentile. Bootstrapping was also performed and produced similar error estimates. The seasonal trend of was converted to % yr−1 using the appropriate percentile of the seasonal values from the first year with σsp data as the baseline: 2011 for the winter, spring, and summer and 2012 for the fall. Similar to other trend analysis, long term observations are needed and breakpoints in the data caused by changes in measurement conditions (e.g. inlet and instrument changes) must be resolved. An effort was made to identify any breakpoints in the SPL data, though nothing significant was found. Trend analysis was not performed on the BOS data as the time series was too short.
3.1 Climatology of aerosol optical properties at SPL and BOS
Mean annual PM10 σsp and σap at both field sites follow similar seasonal patterns with differences in overall magnitude. This is visible in both the timeseries of average monthly σsp and σap values, shown in Fig. 2, and the annual climatology, shown in Fig. 3. While measurements were made at both PM10 and PM1 size cuts, the discussion here centers on the PM10 measurement. Average sub-micron fractions for σsp were 0.8 ± 0.2 and 0.7 ± 0.1 for SPL and BOS, respectively, and for σap the sub-micron fractions were 0.8 ± 0.2 and 0.8 ± 0.1 for SPL and BOS, respectively (Fig. S2 in the Supplement) indicating that 70 %–80 % of the σsp and σap are due to the PM1 aerosol. Both σsp and σap exhibited pronounced seasonal patterns with periodic low values occurring every winter (December–February) and peaks occurring in the summer into the early fall (June–September). Observed seasonal patterns for SPL's σsp and σap generally agree with those previously reported by Japngie-Green et al. (2019). While similar seasonal patterns were observed at both sites, BOS exhibited higher σsp and σap values at all wavelengths and across all months for both PM10 and PM1 data (Fig. S3). Specifically, at BOS the σsp and σap values were up to a factor of 2 to 3 higher than those measured at SPL, depending on month and size cut. The largest differences between SPL and BOS in both σsp and σap were observed in the winter (Fig. S4). These differences in magnitude are likely due to both the regional urban influences at BOS, and the elevation gradient between the two sites. Evidence for this can be seen in the diurnal variability at the two sites (Fig. S5). SPL's lower σsp and σap values and weaker diurnal cycles (particularly in winter) are largely due to the site's high elevation causing air masses measured at SPL to frequently be decoupled from the polluted boundary layer (Andrews et al., 2011; Collaud Coen et al., 2018). The slight increase in diurnal variability at SPL in the summer is likely due to thermally driven upvalley and upslope flow, which is also consistent with the overall increase in σsp and σap during those months. BOS exhibits a similar diurnal cycle given its location and proximity to complex terrain, though its cycle also shows influence from some anthropogenic emissions throughout the year. This is expected, as BOS resides within the boundary layer where most anthropogenic emissions take place. This also results in the higher overall PM10 σsp and σap values at BOS.
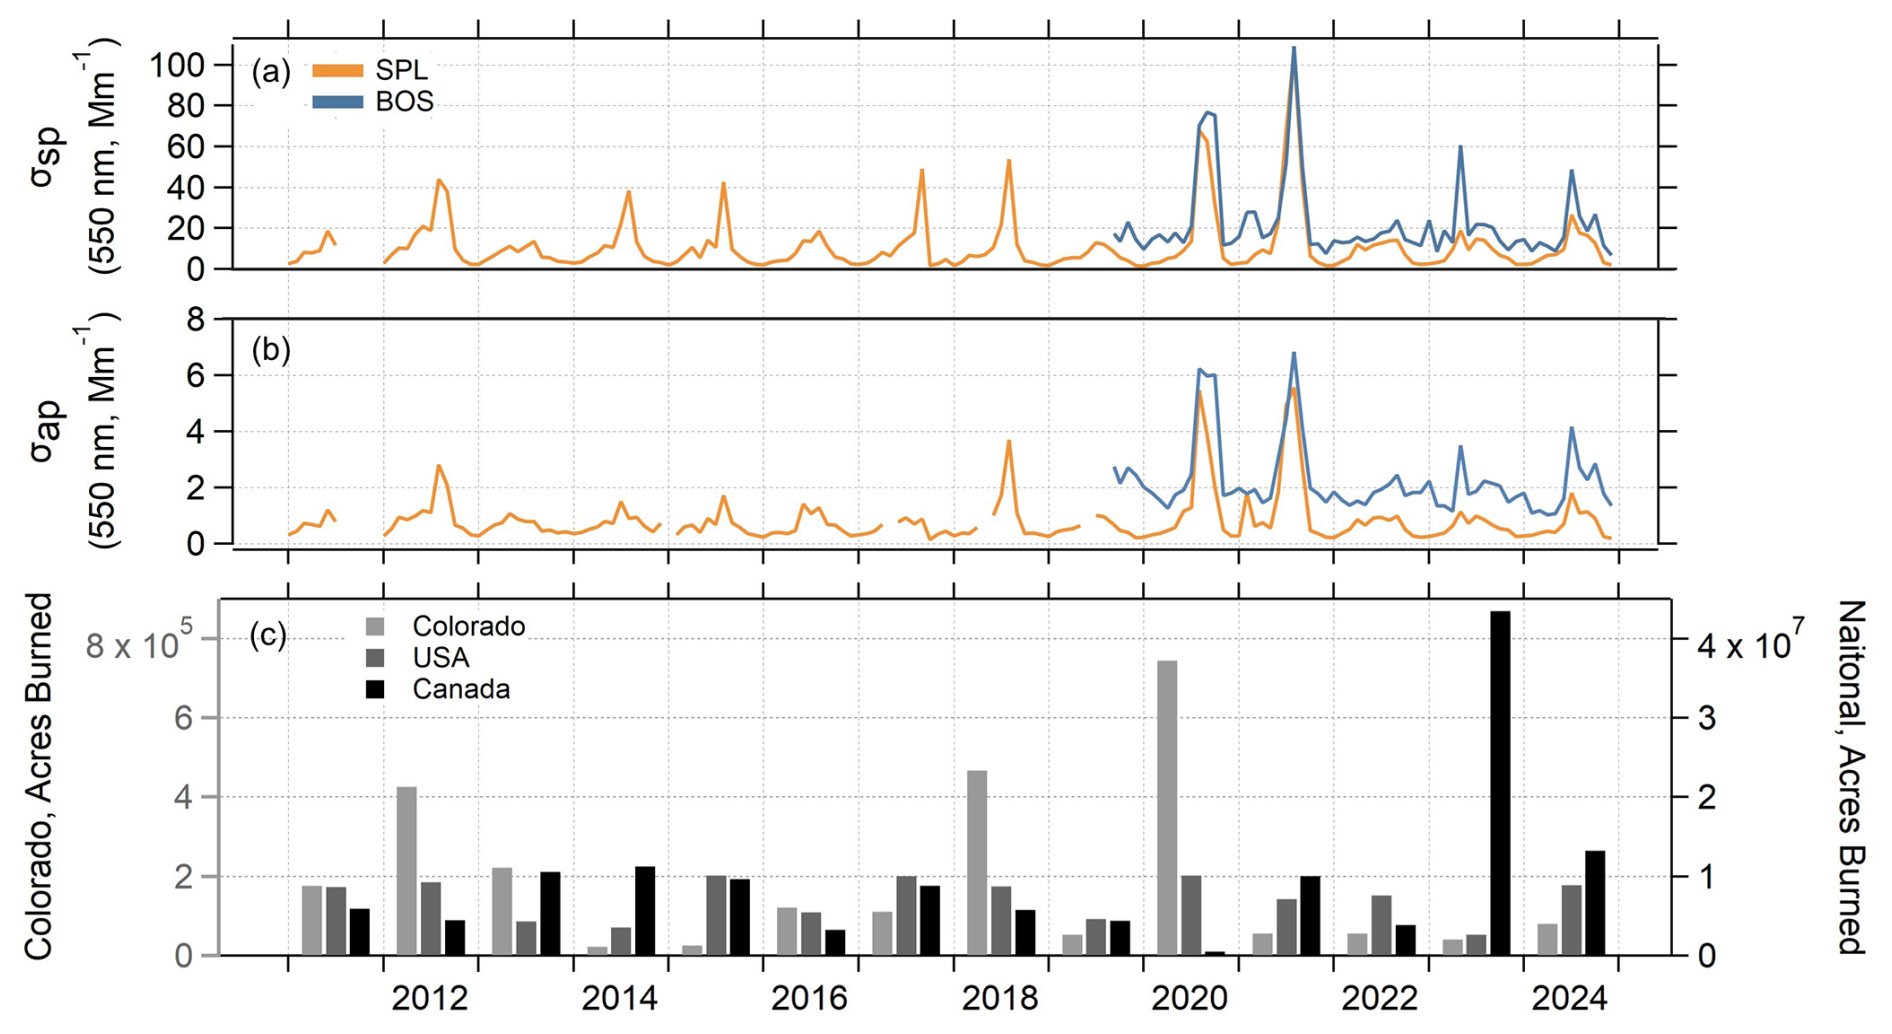
Figure 2Top plots show average monthly cycles of PM10 (a) σsp and (b) σap for 550 nm, from 2011 to 2024 for SPL (orange) and 2019 to 2024 for BOS (blue). The average σsp and σap values represent dry sampling conditions (RH < 40 %). The bottom plot (c) shows yearly acres burned for Colorado (left axis), the United States, and Canada (national values on the right axis) from their respective fire incident databases: Rocky Mountain Area Coordination Center (RMACC), National Interagency Coordination Center (NICC), and the Canadian Wildland Fire Information System (CWFIS).
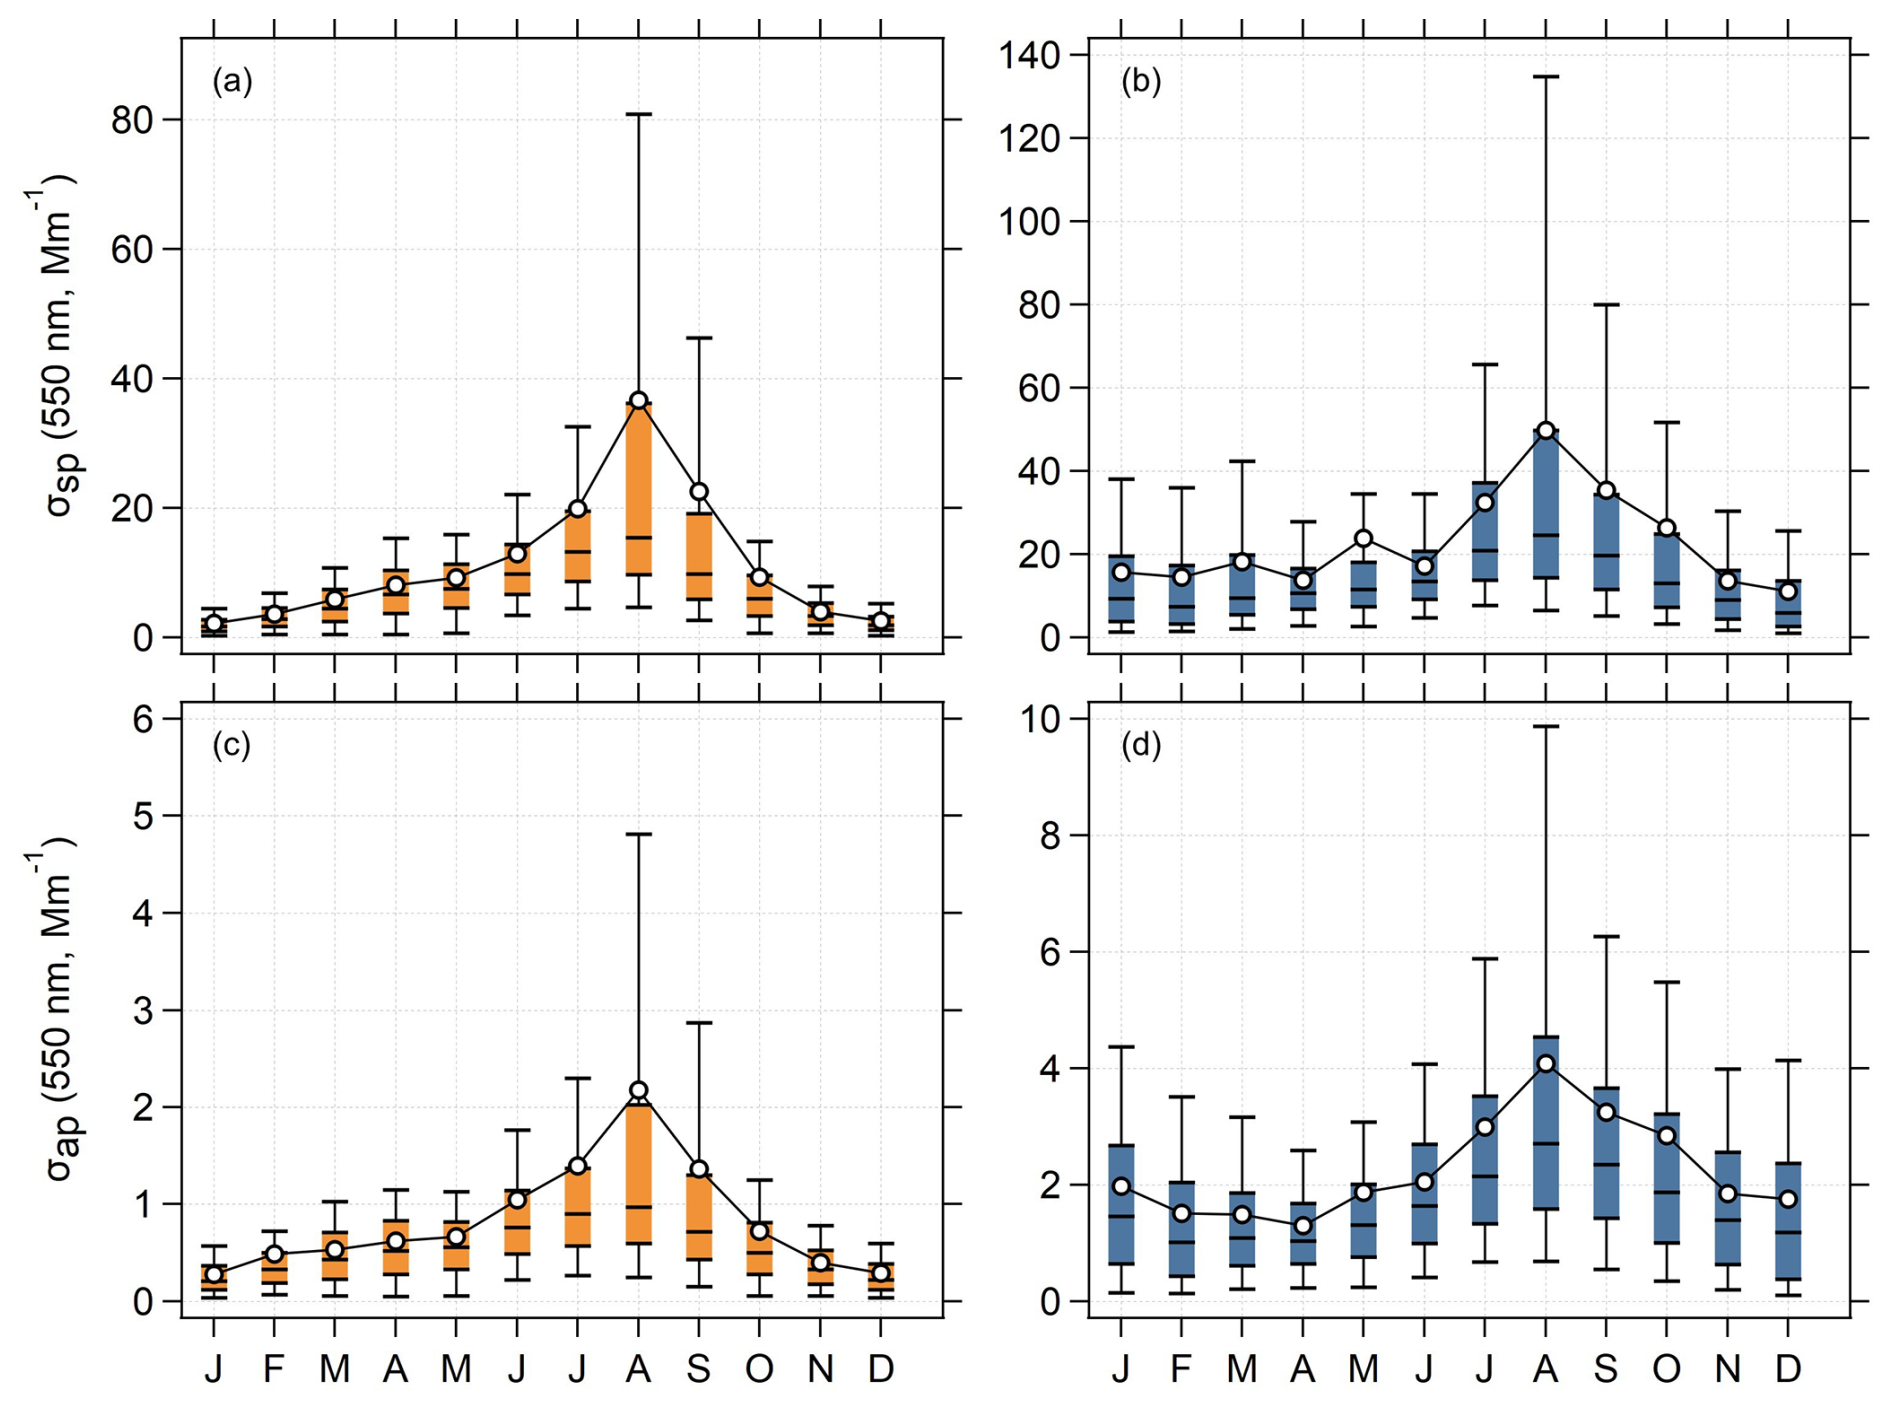
Figure 3Seasonal cycles of PM10 σsp (550 nm) for (a) 2011 to 2024 at SPL and (b) 2019 to 2024 at BOS, and seasonal cycles of PM10 σap (550 nm) for (c) SPL and (d) BOS with the same date ranges used in (a) and (b). The solid lines with markers indicate the mean values, while the box-whiskers represent the percentiles (10th, 25th, median, 75th, and 90th). Note the differences in y-axis ranges.
While the seasonal cycle of σsp and σap (high in summer, low in winter) occurred over the entire period of measurement at both sites, there was noticeable interannual variability with respect to the magnitude of the cycles (Fig. 2). This variability was largest in the summer months, likely associated with episodic wildfires. Often the magnitude of change could be visibly tied to wildfire metrics, such as the total acres burned locally and nationally as shown in Fig. 2c. A notable exception to this was in 2021, where the large increase in aerosol load was driven by transported smoke from the Pacific Northwest region of Canada and the United States, which experienced a severe heat wave that lead to a significant increase in wildfires (White et al., 2023), as well as smoke from central Canada (Bruce et al., 2025). At both sites the influence of extreme wildfire events is not difficult to distinguish from baseline air pollution as aerosol loading is significantly higher during smoke events (ranging from a factor of 2 higher to an order of magnitude higher depending on intensity of the smoke). Increases in aerosol loading associated with intense smoke events align well between the two sites (Fig. 2). Most long-range smoke observed at these two sites is transported eastward from western North America and impacts both sites. However, a notable exception occurred in May 2023 during transport of Canadian wildfire smoke into the US. For this event, the aerosol increase was larger at BOS as a result of the smoke being channelled down the Front Range of the Rocky Mountains with less upward and westward transport to SPL (see 2023 BOS σsp and σap spike in Fig. 2).
The influence of outlier events on the temporal cycles in aerosol loading is apparent in the monthly mean values of σsp and σap, as shown in Fig. 3. In the summer months at both sites, monthly mean values of σsp and σap fall at the edge or above the interquartile range indicating a skew towards higher loading for those months. To investigate the influence of extreme events, simple outlier testing was done for the σsp upper bound, and a value of 50 M m−1 was determined to be appropriate to use for both sites (Table S4). Overall, July–September had the most hours with σsp exceeding 50 M m−1 and these months dominated most years in terms of number of hours over the 50 M m−1 threshold (Fig. S6, Table S5). There were notable exceptions at SPL, where June 2011 and May 2023 had the highest number of hours over 50 M m−1 which could be the result of dust and/or wildfire events. In the SPL data, there is a large variation in the number of outlier periods per year with 2020 and 2021 having the highest rates of these periods. The median number of instances per year has increased since previous analysis (2011–2016; Japngie-Green et al., 2019) from 90 to 110 h yr−1 (97 h yr−1 if the extreme 2020–2021 period is excluded). While this does not indicate a significant trend, it does show that overall, these periods have become more frequent. This change in frequency is not discernible in the shorter BOS time series.
Qualitative information on the general seasonality of aerosol composition and size can be inferred from calculated aerosol optical properties. For readability, the figures below present just the PM10 data, but the seasonal cycles for all variables are similar for the PM1 size cut (Fig. S7). The seasonal patterns for the 2011–2024 SPL calculated aerosol optical properties are consistent with those previously reported for SPL for the 2011–2016 period (Japngie-Green et al., 2019; their Fig. 5) as discussed in more detail below.
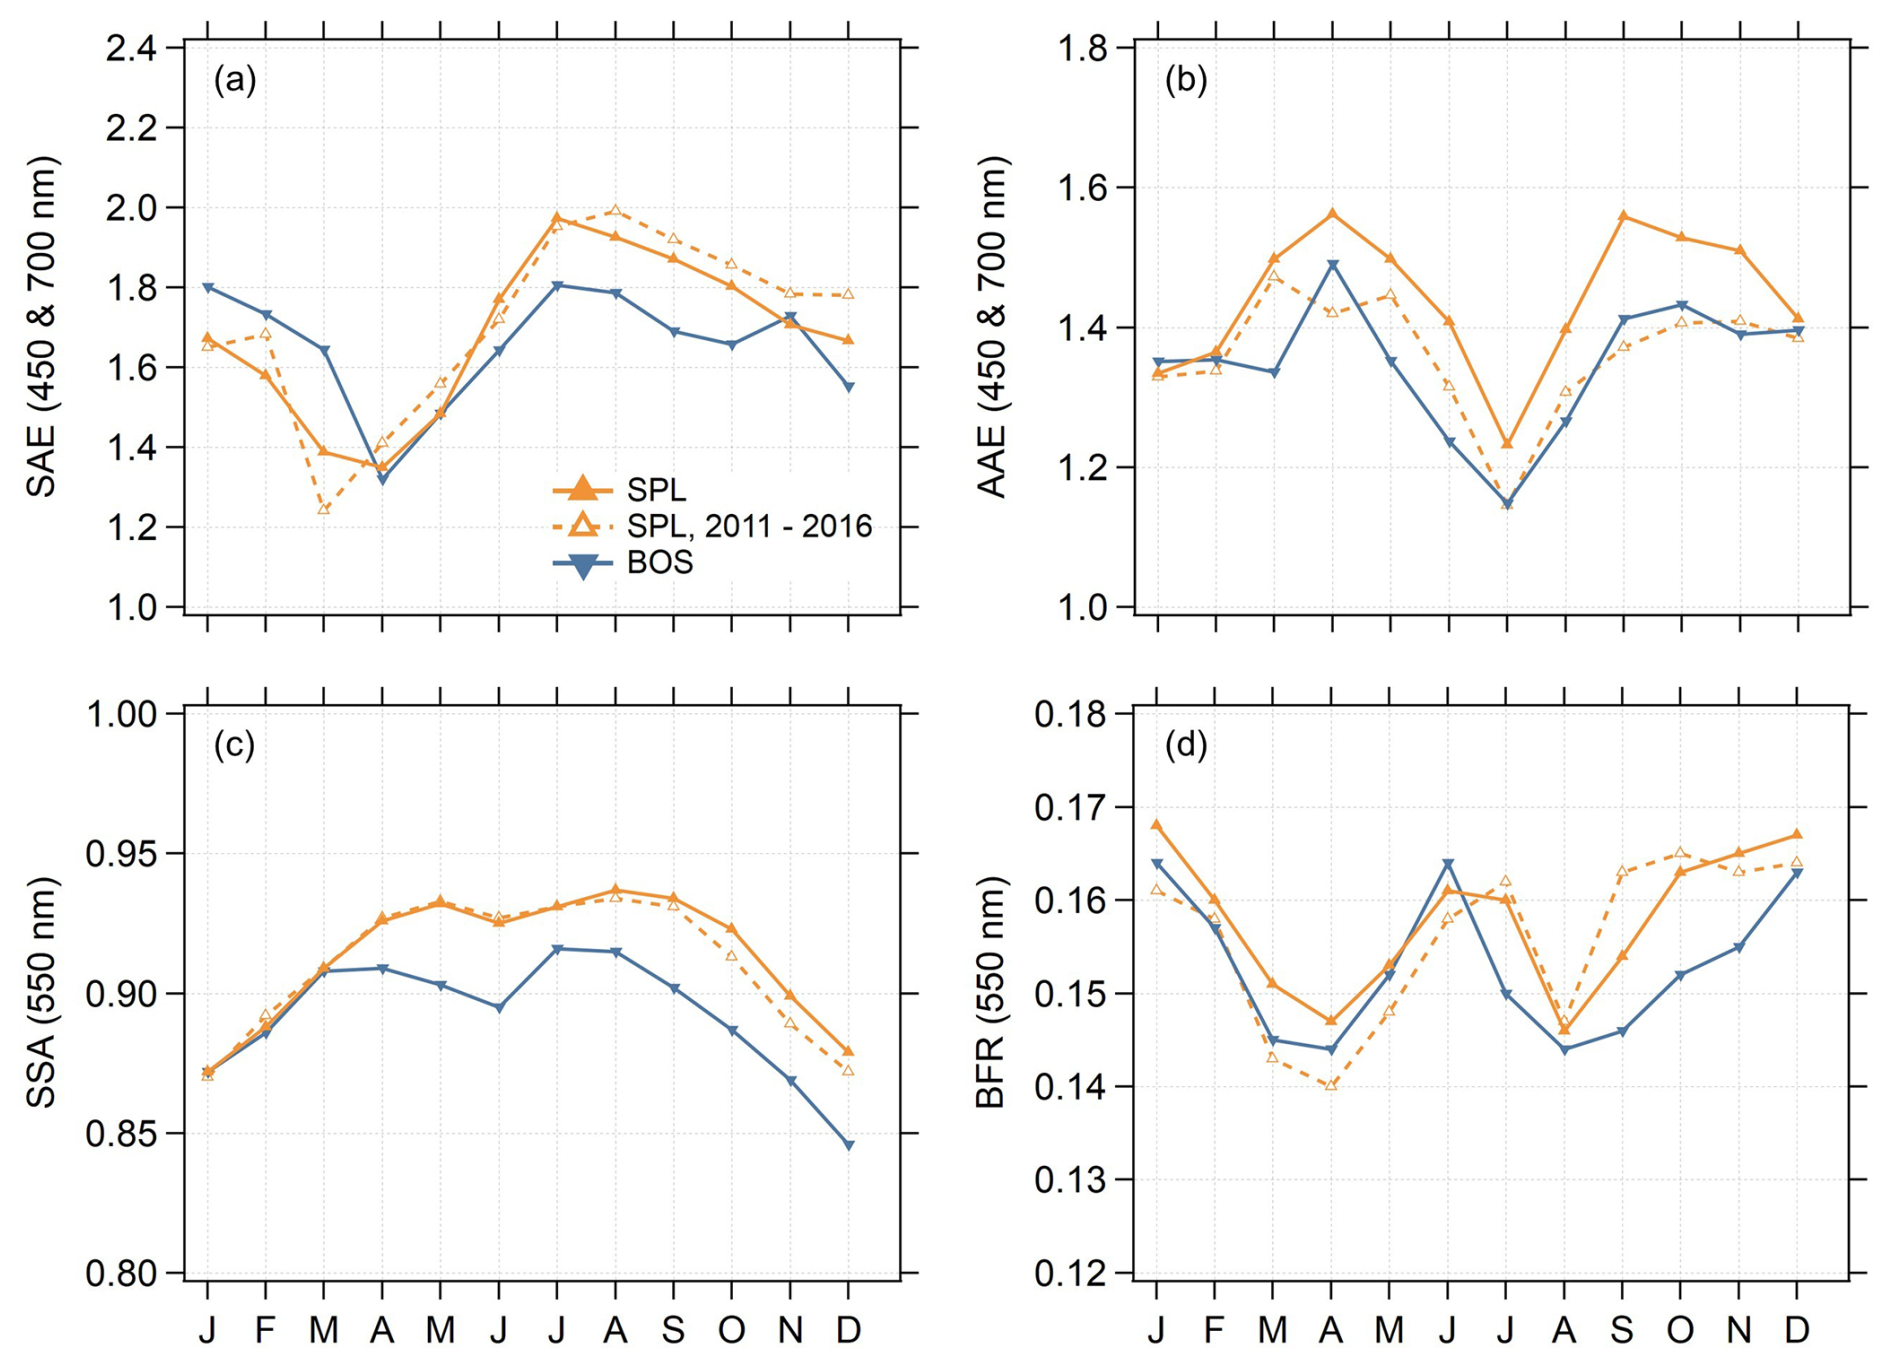
Figure 4Monthly median PM10 (a) SAE for 450 and 700 nm, (b) AAE for 450 and 700 nm, (c) SSA for 550 nm, and (d) BFR for 550 nm. The orange traces represent SPL data, with the solid line representing data from the entire measurement period (2011–2024) and the dashed line with open markers representing data from the shorter period (2011–2016) analyzed by Japngie-Green et al. (2019). The blue trace shows data from BOS (2019–2024).
PM10 SAE and BFR both decrease in the spring at SPL and BOS, indicating a shift towards larger particles (Schuster et al., 2006; Fig. 4a and d). The decrease in the sub-micron scattering fraction during the spring also shows increased influence from coarse mode particles (Fig. S2c). These changes are likely due to dust sources in the spring. Transported dust from Asian outflow is a prominent springtime dust source at both sites (Augustine et al., 2008; Hallar et al., 2015; Japngie-Green et al., 2019), though surface fine dust from local deserts and semi-arid regions in North America are also an important source of dust (Hallar et al., 2011, 2015). The influence of these dust sources is also confirmed by chemical data from the region presented by Hand et al. (2024a). The relationship between SAE and BFR during summer months is more complicated. SAE increases in all summer months, however, BFR increases in June at both sites and through July at SPL before decreasing for the rest of the summer. Increases in both SAE and BFR during the early summer indicate an increased contribution from smaller particles. As BFR and SAE are sensitive to different parts of the aerosol size distribution, the higher sub-micron contribution (increased SAE) with increased large accumulation mode particles (decreased BFR) later in the summer and fall could indicate a narrowing of the size distribution (Collaud Coen et al., 2007). Alternatively, the relationship could also indicate changes in the number or relative importance of different aerosol size modes if the particle size distribution is multi-modal (Schuster et al., 2006).
Aerosol SSA tends to be lower in the fall and winter months and higher in the spring and summer months. The high SSA values in July and August are consistent with aged smoke aerosol where gases associated with the smoke have had the opportunity to condense resulting in a larger, more reflective aerosol (Andrews et al., 2004; Bian et al., 2020; Yokelson et al., 2009). Both sites exhibit a local SSA minimum in June – though the minimum is more pronounced at BOS – indicating aerosol particles are slightly more absorbing during the early summer.
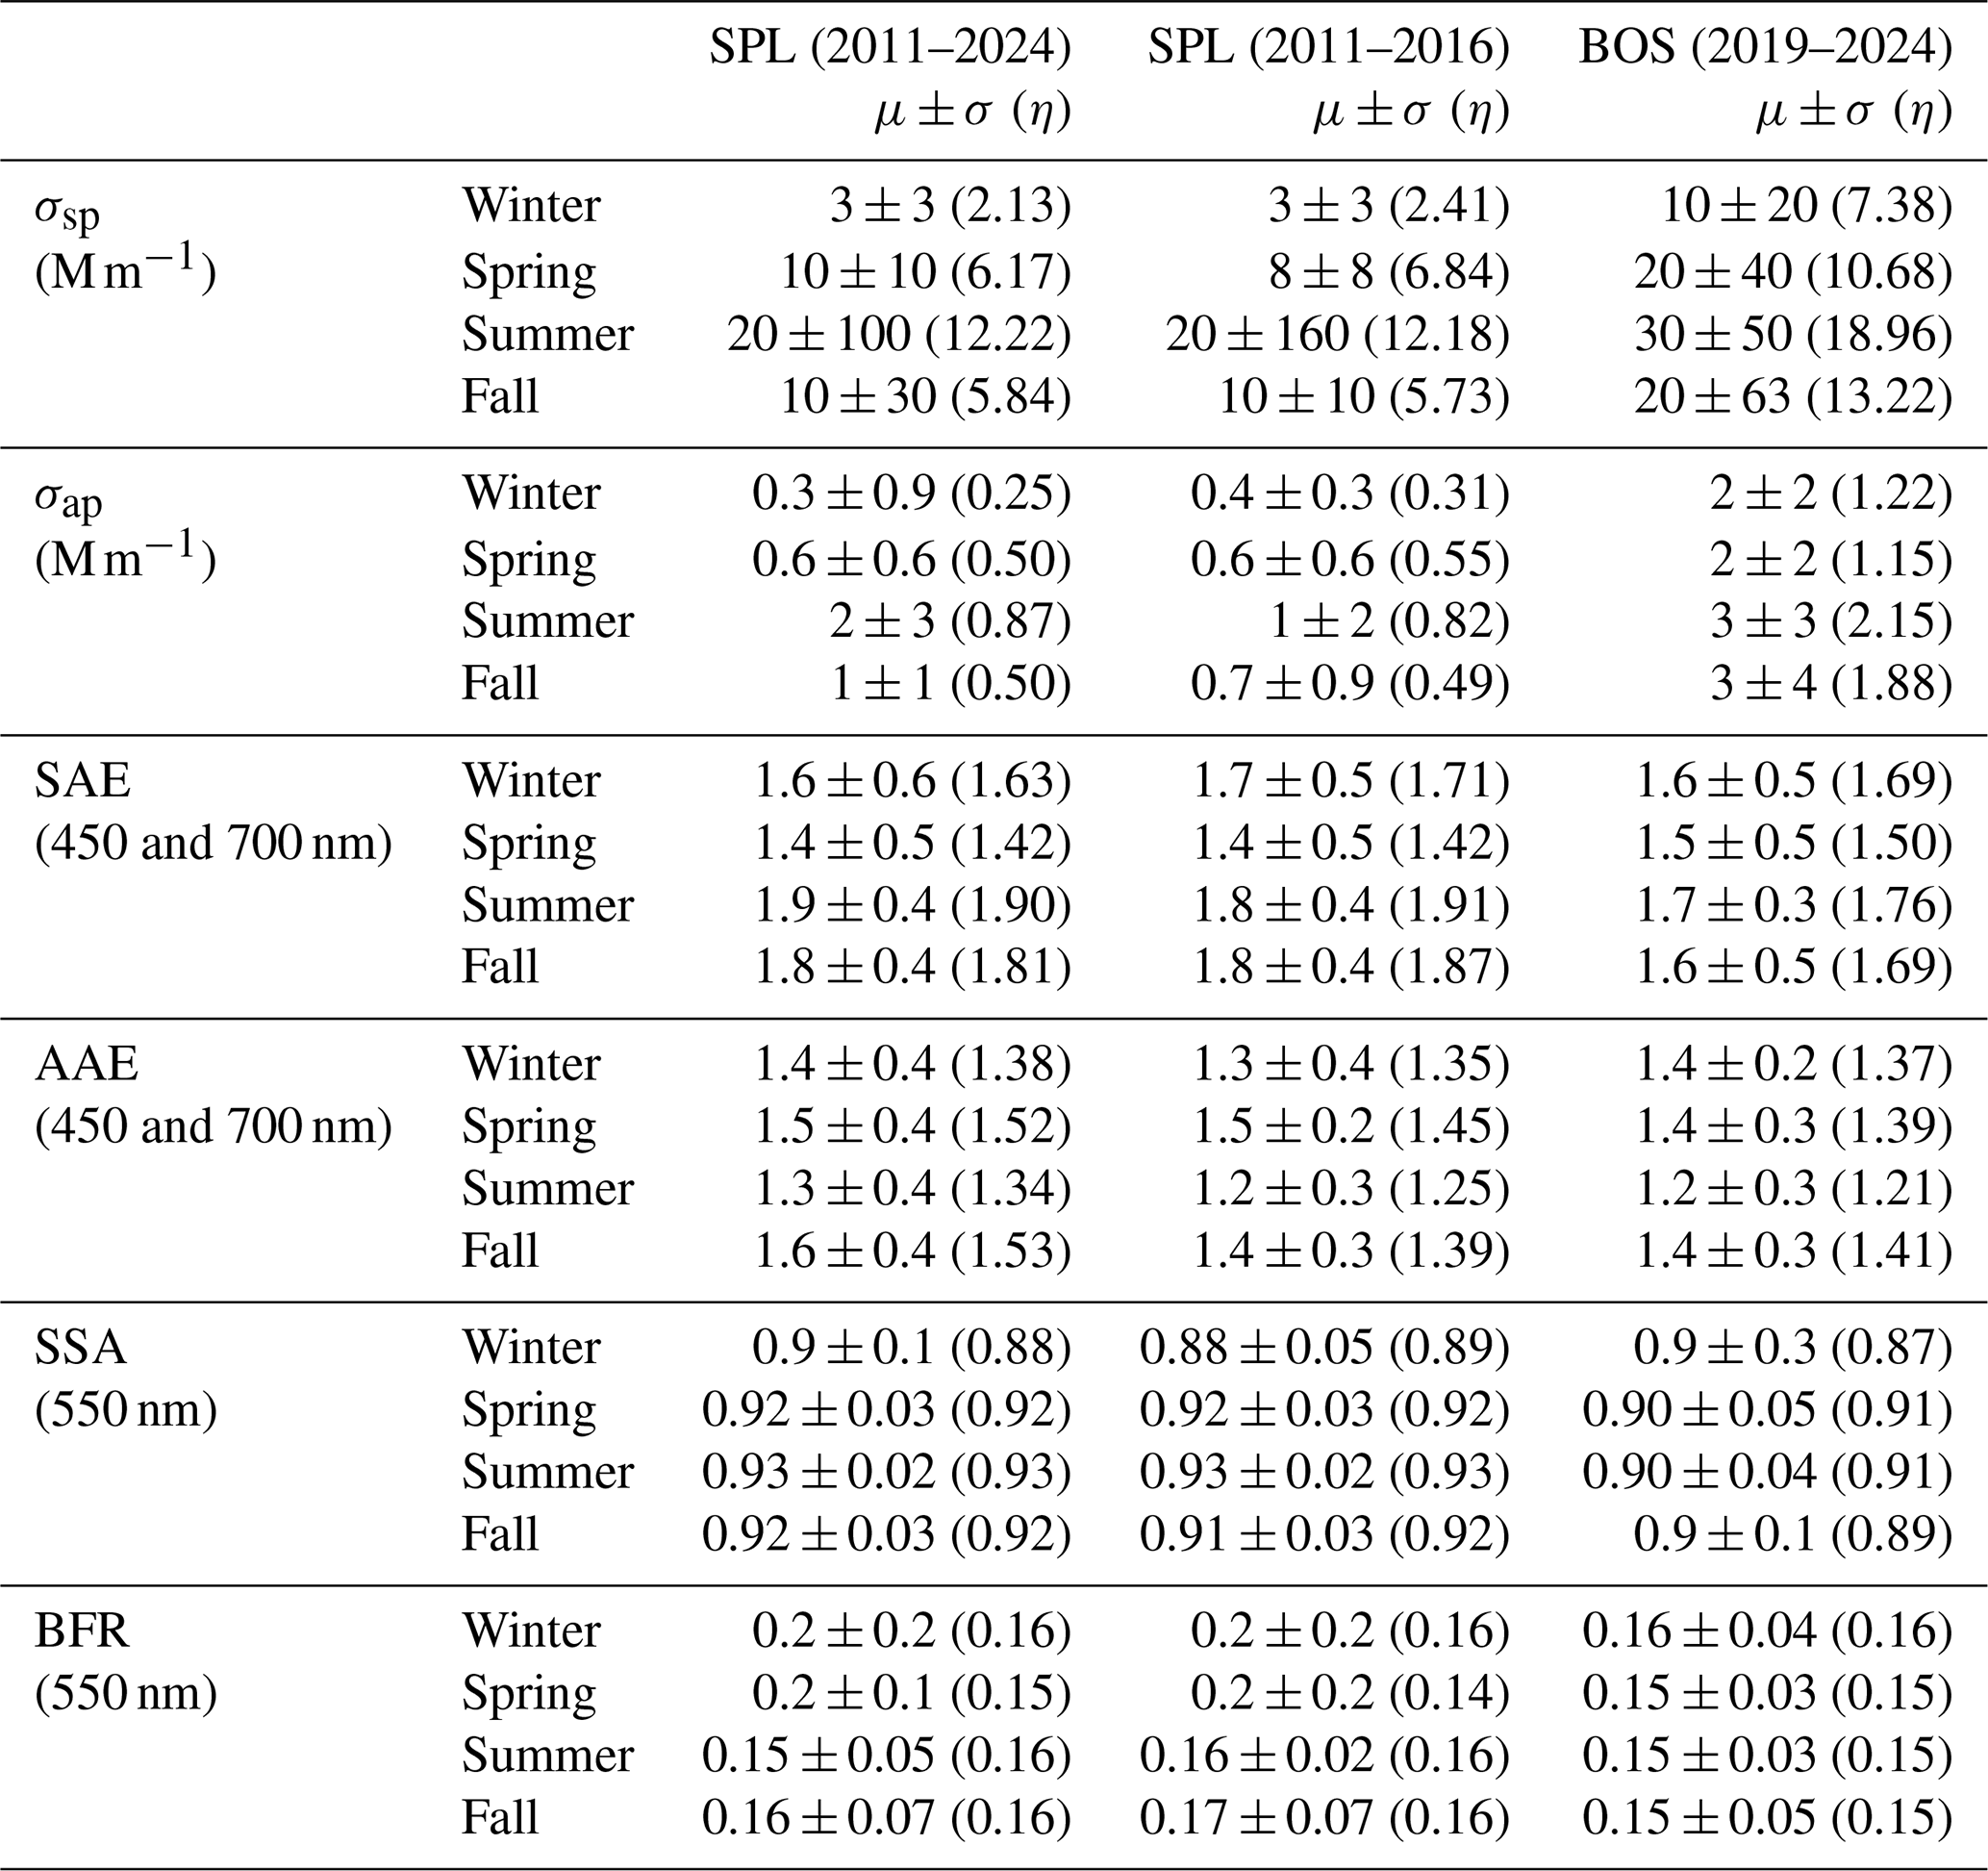
Table 1Seasonal values for σsp, σap, SAE, AAE, SSA, and BFR. The average (μ), standard deviation (σ), and median (η) are reported. The seasons are defined by the following monthly bounds: winter is December–February, spring is March–May, summer is June–August, and fall is September–November. For SPL, statistics are reported for both the entire range (2011–2024) and the shorter range (2011–2016) investigated by Japngie-Green et al. (2019) for comparison.
The aerosol absorption Ångström exponent is composition dependent, with different aerosol types having distinct ranges. Theoretically, black carbon (BC) aerosol has an AAE value of 1 while dust aerosol generally has an AAE value ≈ 2 (Bergstrom et al., 2007). Wildfire smoke plumes are typically expected to have AAE values ≥ 2 depending on fuel types and transport time (Forrister et al., 2015; Selimovic et al., 2018). At both sites, the PM10 AAE is highest in the spring and fall, with a seasonal low in the summer (Figs. 4b and S8). The average spring and fall AAE values range from 1.4–1.6 (Table 1), which aligns with literature value ranges for dust and large particle/BC mixed aerosol (Lee et al., 2012; Schmeisser et al., 2017). The average AAE summer values range from 1.2–1.3 (Table 1), which is consistent with a mixture of fossil fuel, biomass burning, and BC dominated aerosol particles (Schmeisser et al., 2017; their Tables 1 and 4).
The impact of intense smoke plumes in the summer is not clear in the AAE monthly climatology depicted in Fig. 4b (i.e., AAE is not > 2). This is likely due to the mixing of isolated biomass burning plumes with background air and other emissions. Clarke et al. (2007) were able to sample pollution and biomass burning plumes during flights over North America and reported the distribution of AAE for these plumes along with regional background (their Fig. 6). The distributions for all summer SPL and BOS hourly AAE data (Fig. S9) were most similar to the distribution reported for regional background by Clarke et al. (2007) but were broader indicating that multiple indistinguishable sources could be present. Summer distributions showed more frequent high values of AAE than in the spring. Looking at AAE in relation to month and σsp, AAE was high (> 2) during high aerosol loading in the summertime which is consistent with the presence of smoke plumes (Fig. S10). It can also be seen that in the springtime there were both dust (AAE ≥ 2, for high σsp) and pollution (AAE ≤ 1, for high σsp) plumes, with pollution having a higher impact at BOS than dust during that season (Fig. S10).
While the seasonality of AAE at SPL is similar to that reported in Japngie-Green et al. (2019), median AAE values were higher from April to November relative to the period they considered (Fig. 4b). The AAE shift in the summer and fall is clearly attributable to the increase in extreme events with high AAE values (Fig. S10), however, the AAE increase in springtime could be the result of either an increase in dust events, overall decrease in background aerosol, or some combination of the two. For example, in their analysis of data from 2000–2016, Hand et al. (2019) observed significant decreases in PM2.5 leading to an increase in the relative contribution of coarse aerosol mass over the continental US but also found that mean coarse mass in some regions did increase significantly over time. Without quantitative chemical data it is difficult to discern which process is driving changes in the optical properties at SPO and BOS. Additionally, while Japngie-Green et al. (2019) show SPL PM1 AAE values being consistently lower than those of PM10, this study observed PM1 AAE values that were equal to or higher than those calculated for PM10 from August to November (Figs. S7 and S8). This is likely in response to the overall decrease in aerosol loading at SPL (Sect. 3.3), and a shift in the sub-micron composition towards larger, less absorbing particles. Support for this can also be seen in the overall decrease in sub-micron σsp and σap fractions compared to the 2011–2016 period, indicating an increase in the impact of larger particles (Fig. S2c and f). This kind of shift in size has been previously observed at other sites within the continental US (Sherman et al., 2015). Additionally, PM1 SSA at SPL increased from August to November (Fig. S8) relative to the 2011–2016 time period, indicating that aerosol particles have become less absorbing overall. SSA was lowest during the late fall and winter (October–February), which is attributable to increased anthropogenic emissions during colder months. Both AAE and SSA values were generally lower at BOS than at SPL, as a result of the geographical proximity of urban sources to BOS described above.
3.2 Aerosol classification using optical properties
3.2.1 Systematic variability of derived optical properties
Systematic variations between SAE and σsp, and AAE and SAE have previously been used to classify in situ aerosol types and sources (Cappa et al., 2016; Hallar et al., 2015; Schmeisser et al., 2017). Here, analysis of the relationship between AAE and BFR is also explored.
The relationship between SAE and σsp at SPL showed two seasonally distinct aerosol populations (Fig. 5a). In the spring (green-hued lines, Fig. 6), SAE decreased with increased σsp indicating an increase in particle size with higher aerosol loadings which is consistent with dust. In the summer and early fall (orange and magenta hued lines, Fig. 6), SAE increased with increased σsp indicating a decrease in particle size at higher loadings which is consistent with biomass burning (Hallar et al., 2015). The spring SAE and σsp relationship at BOS (Fig. 5b) was less defined than that observed at SPL. At BOS, a similar decrease in SAE for lower aerosol loadings is observed, however, as loading increases the relationship changes and SAE begins increasing sharply. BOS is therefore likely sampling dust plumes that are either less intense and/or mixed with other aerosol types (e.g., background, biomass burning, or anthropogenic outflow). During the summer and fall at BOS, the SAE and σsp relationship is consistent with biomass burning aerosol as the dominant aerosol type at the site.
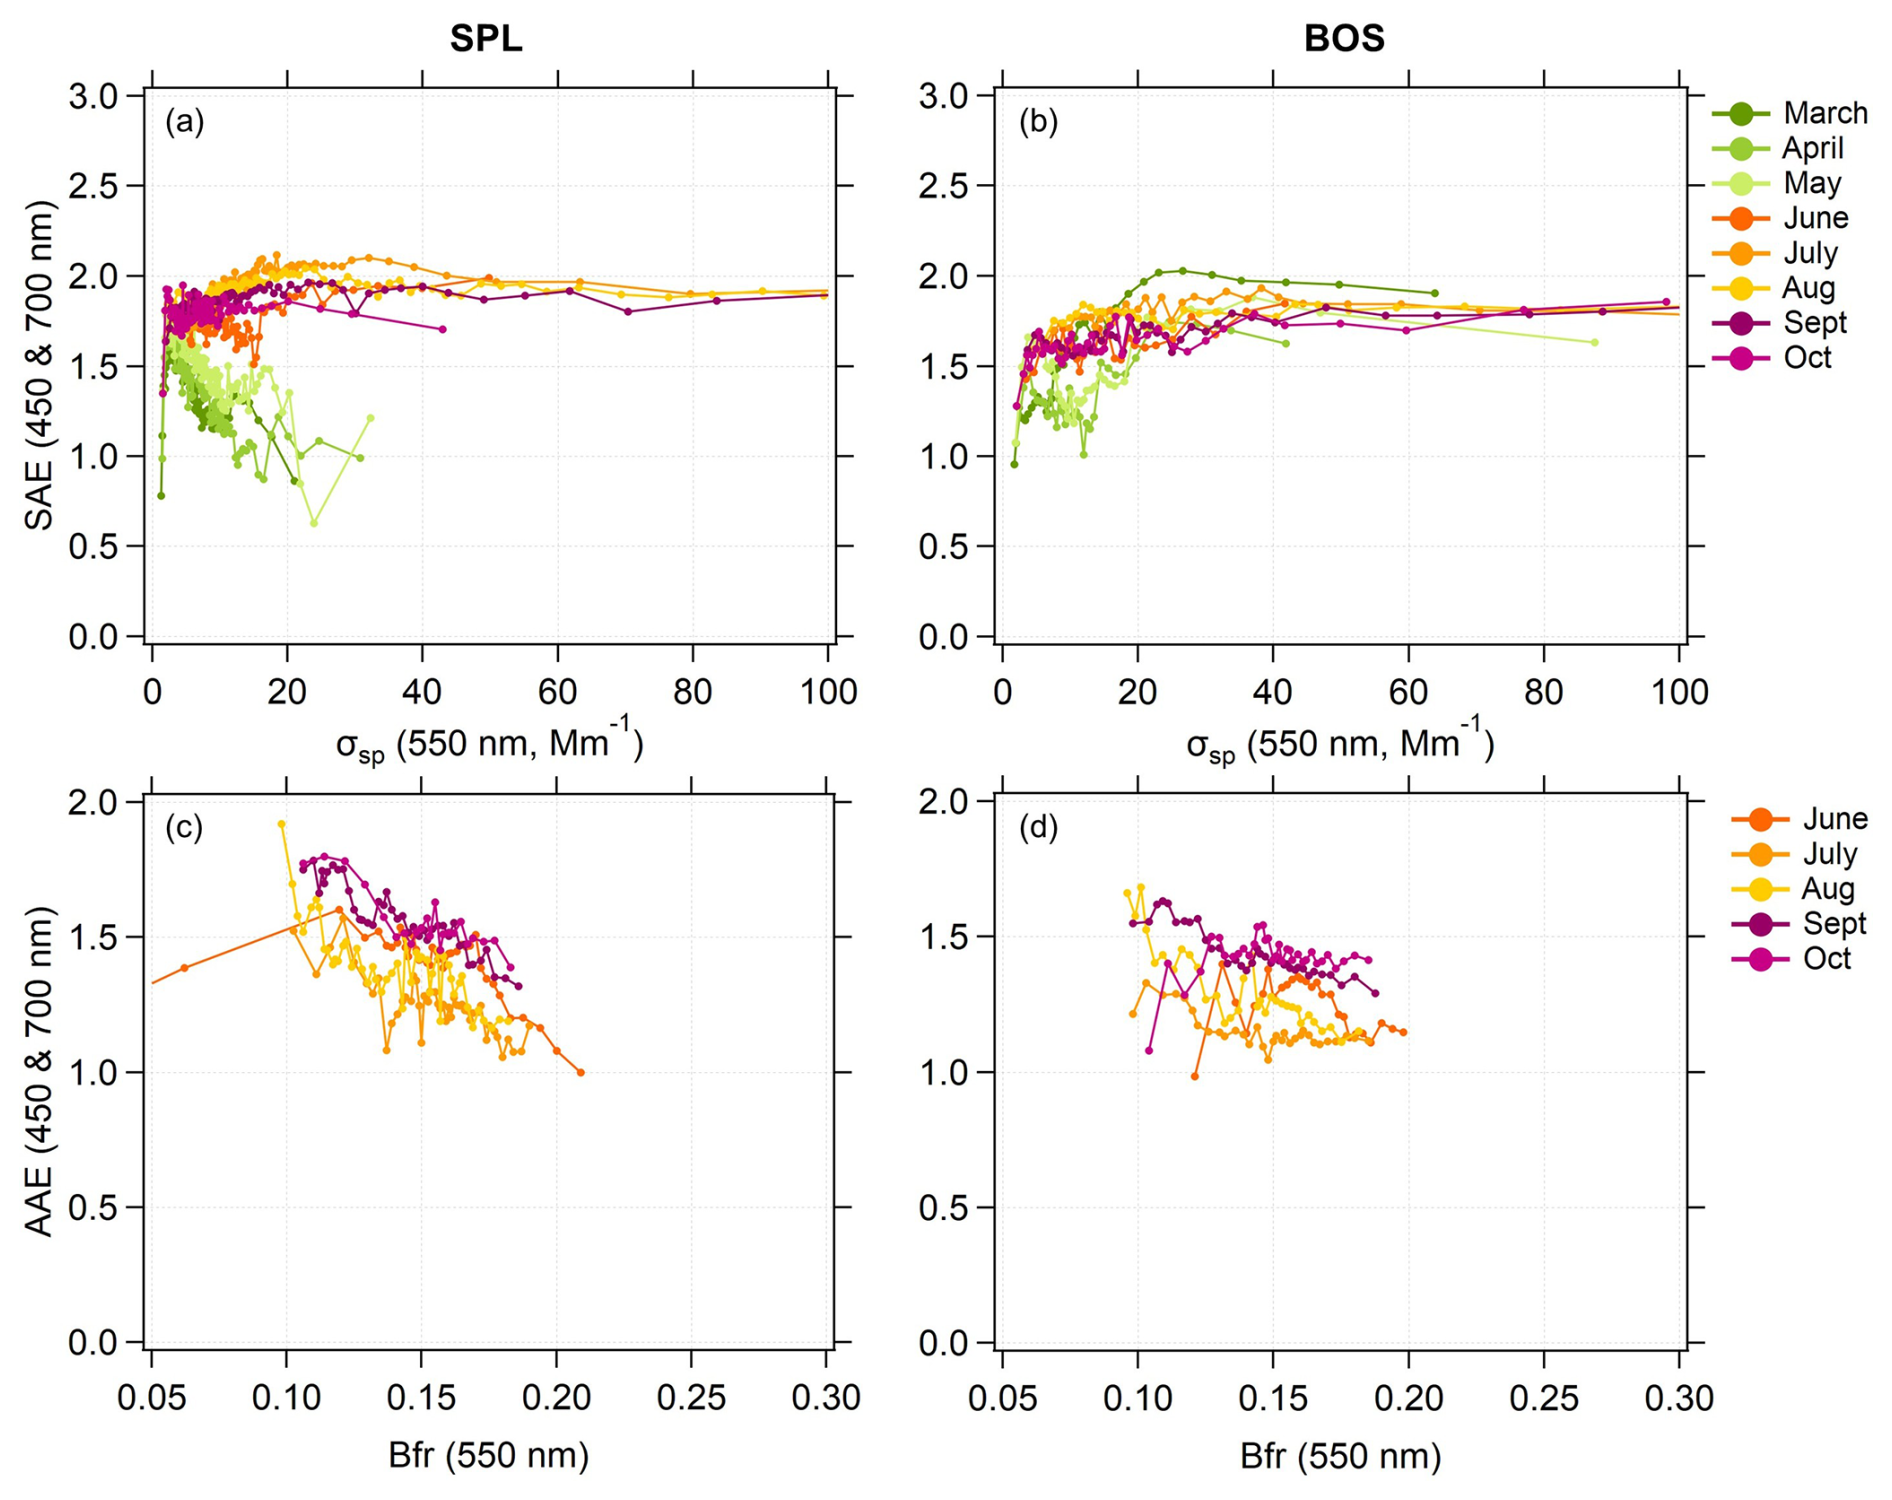
Figure 5PM10 SAE (450 and 700 nm) binned by σsp (550 nm) for (a) SPL and (b) BOS. PM10 AAE (450 and 700 nm) binned by the BFR (550 nm) for (c) SPL and (d) BOS. For all plots, each datum point represents the median of 100 data points. Traces are colored by month with plots (a) and (b) showing data from March to September and plots (c) and (d) showing data from June to October. Figure S14 presents the traces for all months.
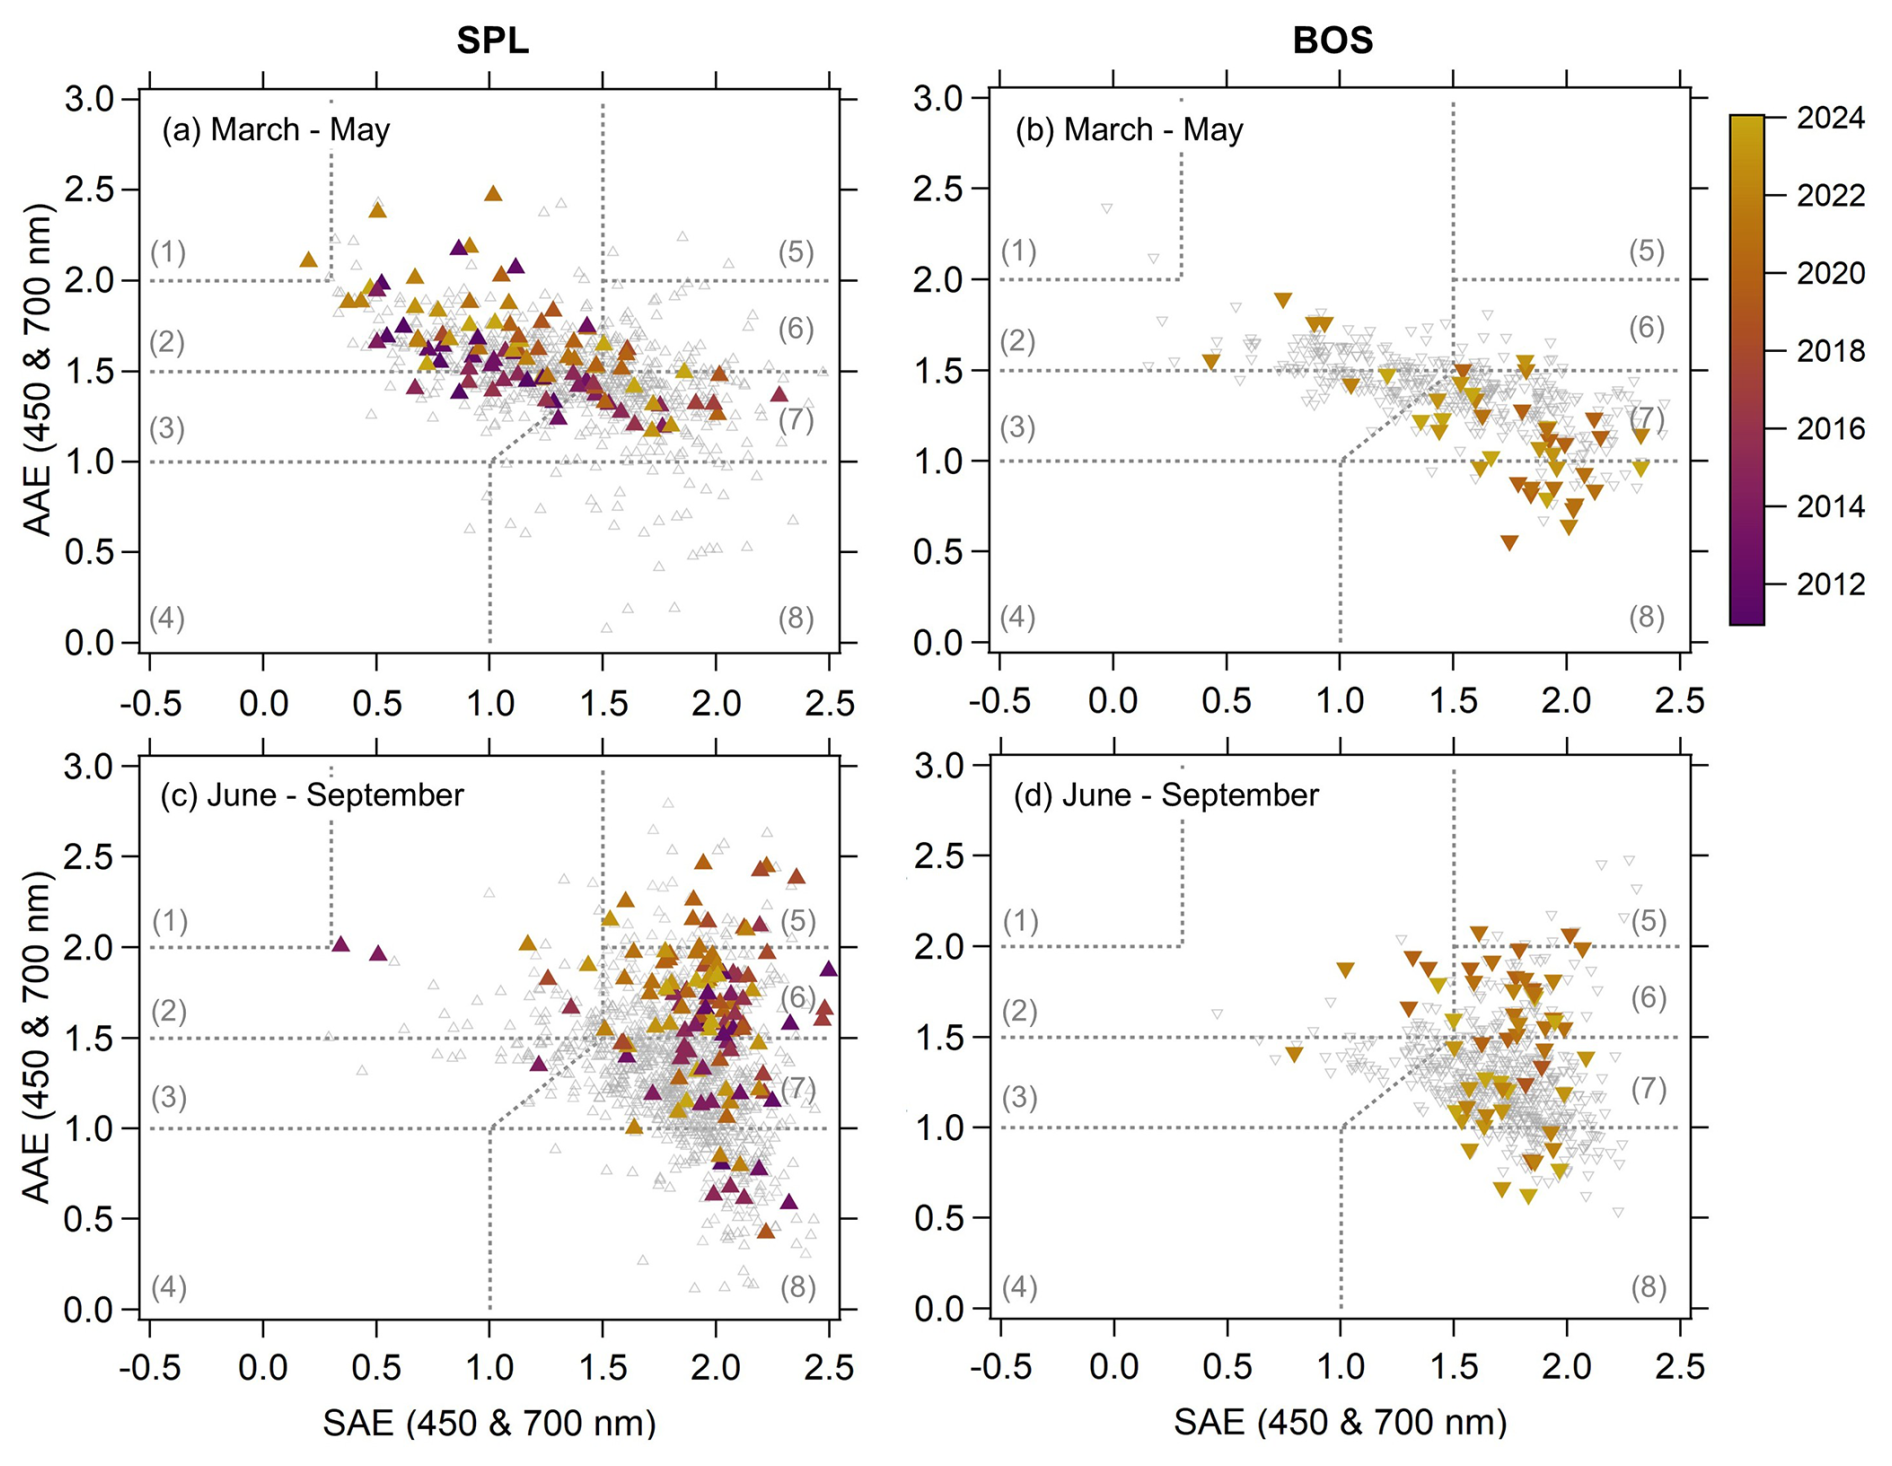
Figure 6Daily medians of AAE vs SAE (450 and 700 nm) for March–May at (a) SPL and (b) BOS, and June–September for (c) SPL and (d) BOS. Open grey markers show all data, while closed colored markers show data where the daily average σsp value is greater than or equal to the 90th percentile for the month. Average fractional uncertainties for AAE and SAE at these levels are approximately 10 % and 2.9 %, respectively (Table S2). The closed markers are colored by year, as indicated by the color scale. Different regimes defined by Cappa et al. (2016) are outlined using grey markers and are labelled one through eight, correlating to the numbered regimes found in the main text.
The negative relationship between AAE and BFR also suggests influence from biomass burning (Fig. 5c and d). The higher AAE and lower BFR are more likely to occur during smoke events due to the impact of condensed organics on the wavelength of absorption and the increase in accumulation mode diameter due to the condensation of those organics and other co-emitted vapors. In contrast, smaller particles (higher BFR values) associated with AAE values near 1 are likely representative of the background air at these sites. This pattern (decreasing AAE with increasing BFR) is visible at both sites in the summer and early fall. In contrast, during the spring and winter values of AAE tend to be more consistent across all BFR values (Fig. S11).
3.2.2 Aerosol classification using derived optical properties
The relationship between AAE and SAE has also been shown to be an indicator of aerosol type, and aerosol classification regimes have been established using these optical properties (Cappa et al., 2016; Cazorla et al., 2013). SAE is a good approximate indicator of the contribution of coarse mode aerosol, although other factors such as the shape of the size distribution might complicate the interpretation (Schuster et al., 2006). Looking at SAE in combination with AAE facilitates the differentiation of smoke and dust events, and since these are both clearly identifiable populations at SPL and BOS the use of this relationship is reasonable. However, these classifications can become less reliable as environmental conditions and source variability become more complex (Schmeisser et al., 2017). For this reason, these classifications are used to look at qualitative changes in aerosol classifications over time, between seasons, and during outlier events.
The classification scheme presented by Cappa et al. (2016) is used here. This scheme identifies eight aerosol regimes categorized primarily based on contributions from absorbing aerosol species (e.g., dust, BC, and brown carbon, BrC) (Fig. S12). The classifications are labeled as: (1) dust, (2) mixed dust/BC/BrC, (3) large particle/BC mix, (4) large particle/low absorption mix or large black particles, (5) strong BrC, (6) mixed BC/BrC, (7) BC dominated, and (8) small particle/low absorption mix. The small particle/low absorption mix classification will not be discussed here as evidence suggests that data in this category may be caused by high uncertainties at low signal levels (Cappa et al., 2016), and this category only represents ∼ 10 % of the hourly data at both sites. BrC is often enhanced in wildfire smoke (Saleh et al., 2013), so categories (5) and (6) should be more prominent during smoke events.
The largest cluster of data falls into the (7) BC dominated classification, with 39 % and 52 % of the total hourly data falling into this category at SPL and BOS, respectively. However, while the contribution of this category is relatively stable at BOS (Fig. S13), its contribution to the aerosol population at SPL visually appears to show a marginal decrease (Fig. S14). This is consistent with the overall decrease in aerosol at SPL shown in the trend analysis discussed in the next section, and indicates that the background aerosol likely falls into this classification.
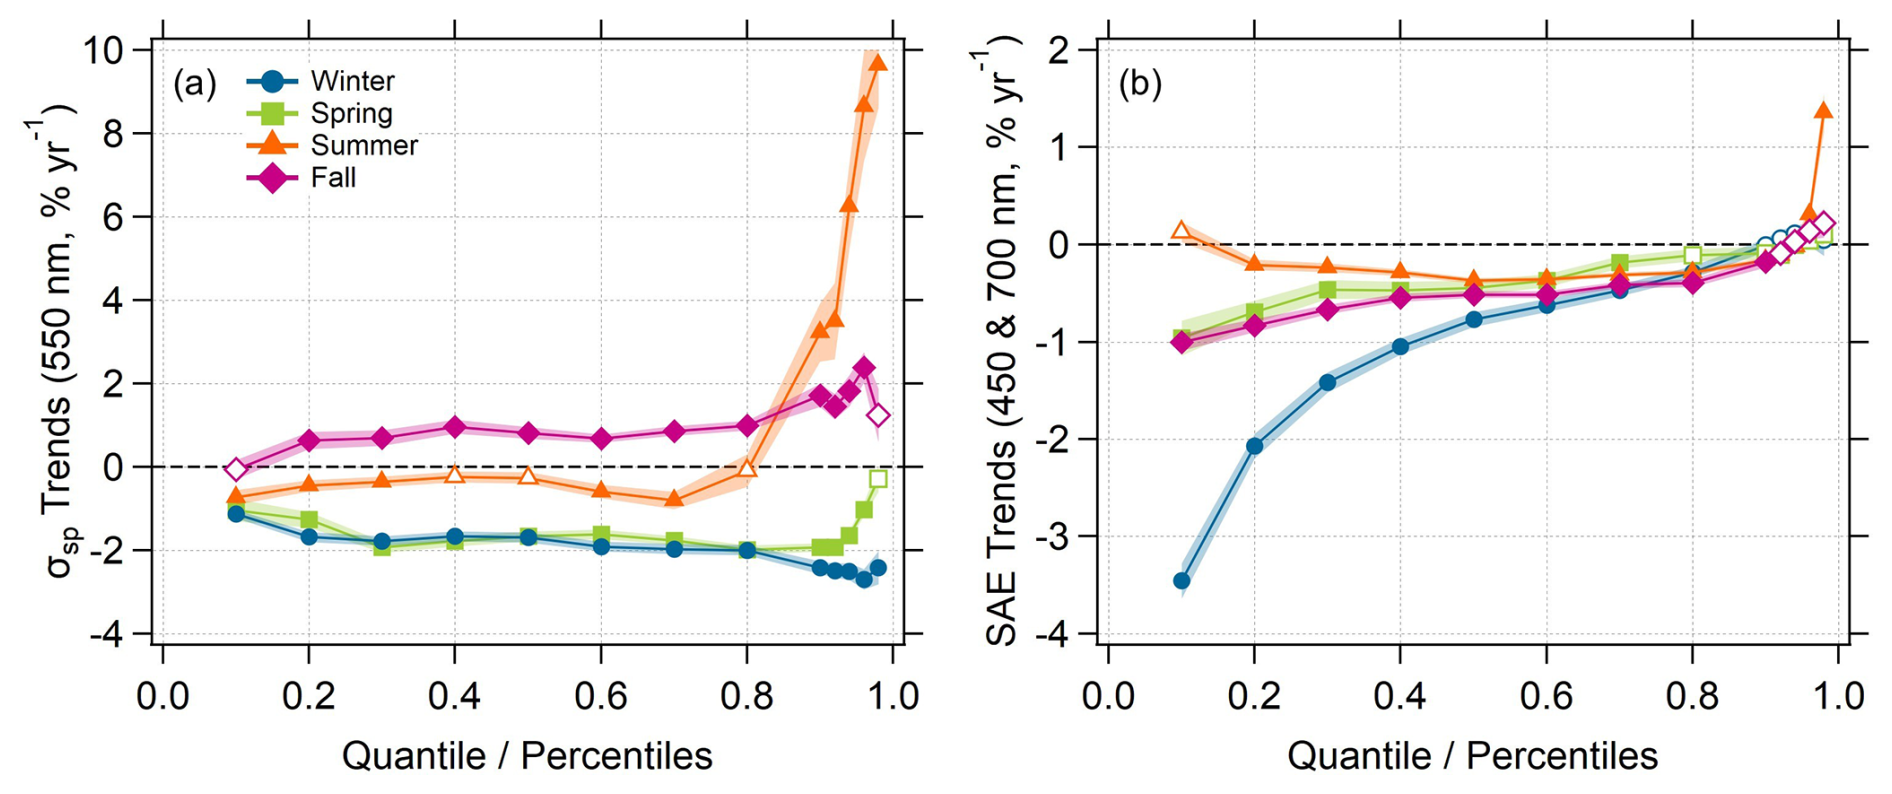
Figure 7Quantile regression trends for PM10 (a) σsp and (b) SAE at SPL over all seasons from 2011 to 2024. Winter = December–February, Spring = March–May, Summer = June–August, Fall = September–November. Open markers show trends that were not significant (p-value ≥ 0.05). Numerical values and p-values for the quantile regression trends are provided in Tables S5 and S6, along with the standard error which is shown as shading on the plot. As with other analyses presented, these trends are for dry sampling conditions (RH < 40 %).
Clear seasonal differences exist in aerosol classification at both sites (Fig. S15, Table S6). In the springtime at SPL the dominant aerosol classification changes to (2) mixed dust/BC/BrC with 43 ± 18 % falling in this group. Contribution of (1) dust and (2) mixed dust/BC/BrC also appear to be increasing in the spring and winter at SPL. However, the number of data points in the dust only class is small (on average ≤ 1 % of data in all seasons, Table S6). At BOS, the (7) BC dominated class is still largest in the spring, but the (2) mixed dust/BC/BrC class is the second largest (Table S6) and contribution from (1) dust at BOS is clearly increasing (Fig. S13). Looking specifically at extreme events in the spring, Fig. 7a and b show data where the daily average σsp value was greater than or equal to the 90th percentile of the month; the points are colored by year. At SPL the AAE of springtime events is increasing (Fig. 6a), which could indicate a trend towards less mixed (i.e. a decrease in other ambient aerosol) or more extreme dust events. BOS shows a clear shift in the class of springtime extreme events towards (1) dust and (2) mixed dust/BC/BrC categories (Fig. 6b). Quantile regression, discussed in the next section, on SAE at SPL also indicates a shift towards large particles in the spring, again consistent with either an increase in dust frequency and intensity or a decrease in background aerosol loading.
In the summer and early fall (June–September), data at both sites are strongly clustered in the classifications influenced by smaller BC and BrC particles (classes 5–7; Figs. 6c, d and S15). These classes represent ∼ 71 % and ∼ 87 % of the data in the summer and fall at SPL, and ∼ 70 % and ∼ 73 % of the data in the summer and fall at BOS. At SPL, the overall influence of the (6) mixed and (5) strong BrC classifications is increasing in the summer and fall (Fig. S14). As previously mentioned, the contribution of BC dominated aerosol is decreasing at SPL. However, the low magnitude of this change is likely caused by the fact that both background aerosol and aerosol from extreme events (Fig. 6c) are encompassed by this classification. Further chemical data would be needed to parse the contributions and trends of the different aerosol sources. Changes in the contribution of these classes at BOS are hard to discern given the shorter time span of the measurements. At both sites the extreme events during the summer and early fall are also clustered into the smaller BC and BrC particle groups, which is further confirmation of wildfire events during those months. Similar to the springtime, the AAE of events in the summer and early fall at SPL are increasing and shifting classification towards more BrC influence. The summertime increase in AAE at SPL since the Japngie-Green et al. (2019) study (i.e., Fig. 4b) in conjunction with the temporal changes in systematic variability shown in Fig. 6 also suggests an increase in the impact of smoke at SPL since 2016.
3.3 Trends in aerosol σsp and SAE at SPL
Long-term seasonal analysis of PM10 σsp at SPL shows that overall aerosol loading is decreasing, with the majority of quantiles showing negative trends in all seasons except the fall (Fig. 7a). This confirms the observed changes discussed in previous sections and is generally consistent with other trend analyses for aerosol scattering coefficients (Collaud Coen et al., 2020) and aerosol extinction coefficients (Hand et al., 2020) in the US. Differences were observed in the trends between seasons and over different quantiles (Figs. 7 and S16). In all seasons, PM10 σsp values in and below the 70th quantile had significant but small observable changes (less than ± 2 % yr−1, Table S7). At the higher percentiles, statistically significant trends were more pronounced indicating that changes in PM10 σsp are being driven by extreme events (Fig. 7a). For the seasonal analysis of SAE, significant trends were generally negative and larger in the lower quantiles for all seasons except the summer (Fig. 7b). A negative trend in SAE indicates an increased contribution from coarse mode aerosol.
Trends in the winter and spring extreme PM10 σsp events were negative, with average significant trends of −2.4 ± 0.2 and −1.7 ± 0.4 % yr−1 in and above the 80th quantile. This could be the result of a decrease in the intensity of dust events, or a decrease in background aerosol overall given that the winter and spring exhibited similar trends in and below the 70th quantile (average significant trends of −1.7 ± 0.3 and −1.6 ± 0.3 % yr−1). In these seasons, SAE trends above the 80th quantile were minimal and not significant (Fig. 7b, Table S8). In contrast, the SAE in the winter and spring had average significant negative trends in SAE of −1 ± 1 and −0.5 ± 0.2 % yr−1 in and below the 70th quantile that were significant indicating an increase in coarse mode aerosol.
The summer and fall upper quantiles exhibited the largest trends in σsp, corresponding to significant increases in aerosol loading during extreme events (i.e. wildfire smoke). This was also observed by McClure and Jaffe (2018), who reported a positive trend in the 98th quantile particulate matter (PM2.5) concentrations of 1.77 ± 0.68 % yr−1 for the northwest region of the United States. They attribute the increase to wildfire activity based on similar trends in total carbon and AOD observed in their study. Here, a positive trend in PM10 σsp of 10 ± 1 % yr along with a trend in SAE of 1.4 ± 0.2 % yr−1 at the 98th percentile was observed in the summertime at SPL indicating increased loadings of smaller particles attributable to wildfire activity. The fall had a significant trend in the σsp 96th quantile of 2.4 ± 0.4 % yr, but no significant trends in the upper quantiles (> 90th) of SAE to indicate changes in aerosol size (Table S7). The positive fall trend for σsp may be due to wildfire season extending further into the autumn months (Goss et al., 2020). This is consistent with positive trends in organic mass concentration in Colorado that have been previously attributed to wildfires (Hand et al., 2024b).
The summer and fall trend attributable to smoke is also apparent in the fire data for Colorado. Previous source analysis of SPL data (Hallar et al., 2015; Japngie-Green et al., 2019) focused on measurements collected prior to 2016. At that time, the 2012 wildfire season was regarded as one of the most severe seasons impacting Colorado, marked by extreme dry winter conditions, hot summer temperatures and intense wildfire activity (Val Martin et al., 2013). Prior to 2017, the 2012 season also had two of the ten largest wildfires in Colorado history. Since then, there have been significant increases in the size and number of fires in Colorado according to metrics reported by the Rocky Mountain Area Coordination Center (RMACC, Figs. 2c and S17). As of 2024, the 2020 fire season is now regarded as the most severe with the three largest fires in Colorado history occurring during that year. Additionally, much of the smoke impacting Colorado comes from outside of the state and the wider western US has also experienced exponential growth in wildfire frequency and area burned (Burke et al., 2021; Weber and Yadav, 2020).
Changes to climate will impact aerosol loading in arid regions due to increases in both wildfire and dust emissions. In this study, long-term, ground-based aerosol optical data from two sites in Colorado (SPL and BOS) were analyzed. It was shown that wildfire activity has led to a positive trend in extreme smoke events at SPL in the summer and fall months. Additionally, the analysis indicated an increase in the impact of dust aerosol at SPL in the spring. While the time series at BOS was insufficient for trend analysis, the temporal patterns and systematic variability among aerosol parameters were comparable to those at SPL. This suggests similar aerosol sources and timing at the two sites, although sources at BOS are clearly more mixed with anthropogenic emissions than at SPL.
Specifically, aerosol σsp and σap peak in August at both SPL and BOS with July through September exhibiting higher loading than other times of year. This peak is attributed to wildfire smoke. Analysis of the long-term SPL time series indicates that there has been little change in the median summertime values of σsp (−0.3 ± 0.1 % yr−1 at the 50th percentile). However, emissions from extreme events during the summer and fall have clearly increased with the σsp upper quartile range showing significant positive trends (10 ± 1 % yr−1 at the 98th percentile for summer). In contrast, upper quartile σsp values in the winter and spring exhibited small negative trends in loading (−2.4 ± 0.4 % yr−1 at the 96th percentile for spring).
Systematic variability among aerosol optical properties was used to characterize sources of the aerosol. The relationship of SAE to σsp showed clear differences between spring (SAE decreases with σsp indicative of dust) and summer/fall (SAE increases with σsp consistent with smoke aerosol). AAE decreases with BFR – the high AAE/low BFR points are characteristic of smoke particles, while the low AAE/high BFR are more representative of background aerosol. In the AAE vs SAE aerosol matrix developed by Cappa et al. (2016) there are seasonal shifts in the type of aerosol, with spring more likely to be impacted by dust and summer/fall more impacted by smoke, consistent with seasonal climatology, trend analyses and the systematic variability evaluation.
These findings highlight the importance of ongoing efforts to monitor and understand aerosol loading, variability, and trends from natural and anthropogenic activities amidst a rapidly changing climate. Given the growing air quality concerns driven by enhanced wildfire and dust induced emissions, including health impacts and decreased visibility, continued monitoring and expanded analysis will be essential for improving our understanding of regional aerosol behavior under a changing climate.
Aerosol optical data for both BOS and SPL is available through the EBAS database (https://ebas-data.nilu.no/Default.aspx, last access: 29 June 2025), and BOS data is also available through the NOAA Global Monitoring Laboratory database (https://doi.org/10.7289/V55T3HJF, Sheridan et al., 2017). Fire data are from three different publicly accessible databases: Colorado data are from the Rocky Mountain Area Coordination Center annual reports (https://gacc.nifc.gov/rmcc/intelligence.php, last access: 7 May 2025), national data for the USA are from the National Interagency Coordination Center (https://www.nifc.gov/nicc/predictive-services/intelligence, last access: 7 May 2025), and national data for Canada is from the Canadian Wildland Fire Information System (https://cwfis.cfs.nrcan.gc.ca/datamart, last access: 7 May 2025). Topographic data used to construct Fig. 1 are from the Shuttle Radar Topography Mission described by Farr et al. (2007) (https://www.earthdata.nasa.gov/data/instruments/srtm/data-access-tools, last access: 7 May 2025).
The supplement related to this article is available online at https://doi.org/10.5194/acp-26-6593-2026-supplement.
EKB performed the systematic variability analysis presented. EKB and AB prepared the manuscript with contributions from all co-authors. AB did the initial climatology analysis for this work, with support from DK, JR, EA, and AGH. GC preformed all trend analysis presented. Data for this work were collected and quality controlled by AGH and GC for SPL and by EKB and EA for BOS. All authors reviewed and edited the manuscript.
At least one of the (co-)authors is a member of the editorial board of Atmospheric Chemistry and Physics. The peer-review process was guided by an independent editor, and the authors also have no other competing interests to declare.
Publisher's note: Copernicus Publications remains neutral with regard to jurisdictional claims made in the text, published maps, institutional affiliations, or any other geographical representation in this paper. The authors bear the ultimate responsibility for providing appropriate place names. Views expressed in the text are those of the authors and do not necessarily reflect the views of the publisher.
We would like to acknowledge Storm Peak Laboratory, and NOAA Global Monitoring Laboratory for providing tech support, data protocols, and for maintaining the instruments that were used to collect the data for this project. Many have provided extensive technical support over the years for Storm Peak Laboratory's instrumentation and data management. A special acknowledgement goes to Mr. Dan Gilchrist, Dr. Maria Garcia, Mr. Ty Atkins, Ms. Megan Ostlie, and Mr. Joe Messina for all their technical assistance with aerosol optical property measurements at SPL. Storm Peak Laboratory is a permittee of the Medicine-Bow Routt National Forests and is an equal opportunity service provider and employer. Finally, the operations of Storm Peak Laboratory would not be possible without the support of the Steamboat Ski and Resort Corporation for logistical assistance and in-kind donations. Patrick Sheridan and Jim Wendell were instrumental in getting the Table Mountain site set up in 2019 and Derek Hageman's software for data acquisition, data QC and data archiving for both BOS and SPL makes doing science with the data a joy. John Rogan was supported by the Massachusetts Department of Conservation and Recreation.
This research has been supported by the National Oceanic and Atmospheric Administration (grant no. NA22OAR4320151) and the National Science Foundation (grant no. 2113201).
This paper was edited by Stefania Gilardoni and reviewed by two anonymous referees.
Achakulwisut, P., Anenberg, S. C., Neumann, J. E., Penn, S. L., Weiss, N., Crimmins, A., Fann, N., Martinich, J., Roman, H., and Mickley, L. J.: Effects of Increasing Aridity on Ambient Dust and Public Health in the U. S. Southwest Under Climate Change, GeoHealth, 3, 127–144, https://doi.org/10.1029/2019GH000187, 2019.
Anderson, T. L. and Ogren, J. A.: Determining Aerosol Radiative Properties Using the TSI 3563 Integrating Nephelometer, Aerosol Sci. Technol., 29, 57–69, https://doi.org/10.1080/02786829808965551, 1998.
Andrews, E., Sheridan, P. J., Ogren, J. A., and Ferrare, R.: In situ aerosol profiles over the Southern Great Plains cloud and radiation test bed site: 1. Aerosol optical properties, J. Geophys. Res., 109, https://doi.org/10.1029/2003JD004025, 2004.
Andrews, E., Ogren, J. A., Bonasoni, P., Marinoni, A., Cuevas, E., Rodríguez, S., Sun, J. Y., Jaffe, D. A., Fischer, E. V., Baltensperger, U., Weingartner, E., Coen, M. C., Sharma, S., Macdonald, A. M., Leaitch, W. R., Lin, N.-H., Laj, P., Arsov, T., Kalapov, I., Jefferson, A., and Sheridan, P.: Climatology of aerosol radiative properties in the free troposphere, Atmos. Res., 102, 365–393, https://doi.org/10.1016/j.atmosres.2011.08.017, 2011.
Andrews, E., Sheridan, P. J., Ogren, J. A., Hageman, D., Jefferson, A., Wendell, J., Alástuey, A., Alados-Arboledas, L., Bergin, M., Ealo, M., Hallar, A. G., Hoffer, A., Kalapov, I., Keywood, M., Kim, J., Kim, S.-W., Kolonjari, F., Labuschagne, C., Lin, N.-H., Macdonald, A., Mayol-Bracero, O. L., McCubbin, I. B., Pandolfi, M., Reisen, F., Sharma, S., Sherman, J. P., Sorribas, M., and Sun, J.: Overview of the NOAA/ESRL Federated Aerosol Network, B. Am. Meteorol. Soc., 100, 123–135, https://doi.org/10.1175/BAMS-D-17-0175.1, 2019.
Augustine, J. A., Hodges, G. B., Dutton, E. G., Michalsky, J. J., and Cornwall, C. R.: An aerosol optical depth climatology for NOAA's national surface radiation budget network (SURFRAD), J. Geophys. Res., 113, https://doi.org/10.1029/2007JD009504, 2008.
Barry, K. R., Hill, T. C. J., Levin, E. J. T., Twohy, C. H., Moore, K. A., Weller, Z. D., Toohey, D. W., Reeves, M., Campos, T., Geiss, R., Schill, G. P., Fischer, E. V., Kreidenweis, S. M., and DeMott, P. J.: Observations of Ice Nucleating Particles in the Free Troposphere From Western US Wildfires, J. Geophys. Res., 126, https://doi.org/10.1029/2020JD033752, 2021.
Bergstrom, R. W., Pilewskie, P., Russell, P. B., Redemann, J., Bond, T. C., Quinn, P. K., and Sierau, B.: Spectral absorption properties of atmospheric aerosols, Atmos. Chem. Phys., 7, 5937–5943, https://doi.org/10.5194/acp-7-5937-2007, 2007.
Berner, A., Lürzer, Ch., Pohl, F., Preining, O., and Wagner, P.: The size distribution of the urban aerosol in Vienna, Sci. Total Environ., 13, 245–261, https://doi.org/10.1016/0048-9697(79)90105-0, 1979.
Bian, Q., Ford, B., Pierce, J. R., and Kreidenweis, S. M.: A Decadal Climatology of Chemical, Physical, and Optical Properties of Ambient Smoke in the Western and Southeastern United States, J. Geophys. Res., 125, https://doi.org/10.1029/2019JD031372, 2020.
Bond, T. C., Anderson, T. L., and Campbell, D.: Calibration and Intercomparison of Filter-Based Measurements of Visible Light Absorption by Aerosols, Aerosol Sci. Technol., 30, 582–600, https://doi.org/10.1080/027868299304435, 1999.
Bond, T. C., Doherty, S. J., Fahey, D. W., Forster, P. M., Berntsen, T., DeAngelo, B. J., Flanner, M. G., Ghan, S., Kärcher, B., Koch, D., Kinne, S., Kondo, Y., Quinn, P. K., Sarofim, M. C., Schultz, M. G., Schulz, M., Venkataraman, C., Zhang, H., Zhang, S., Bellouin, N., Guttikunda, S. K., Hopke, P. K., Jacobson, M. Z., Kaiser, J. W., Klimont, Z., Lohmann, U., Schwarz, J. P., Shindell, D., Storelvmo, T., Warren, S. G., and Zender, C. S.: Bounding the role of black carbon in the climate system: A scientific assessment, J. Geophys. Res., 118, 5380–5552, https://doi.org/10.1002/jgrd.50171, 2013.
Borys, R. D. and Wetzel, M. A.: Storm Peak Laboratory: A Research, Teaching, and Service Facility for the Atmospheric Sciences, B. Am. Meteorol. Soc., 78, 2115–2123, https://doi.org/10.1175/1520-0477(1997)078<2115:SPLART>2.0.CO;2, 1997.
Bruce, E. D., Folorunsho, A., Jaisawal, N., Gaw, E., and Li, Y.: Intra-Continental Transport of Western Wildfire Smoke Heightens Health Risks Across North America, Int. J. Env. Res. Pub. He., 22, https://doi.org/10.3390/ijerph22020226, 2025.
Burke, M., Driscoll, A., Heft-Neal, S., Xue, J., Burney, J., and Wara, M.: The changing risk and burden of wildfire in the United States, P. Natl. Acad. Sci. USA, 118, e2011048118, https://doi.org/10.1073/pnas.2011048118, 2021.
Cappa, C. D., Kolesar, K. R., Zhang, X., Atkinson, D. B., Pekour, M. S., Zaveri, R. A., Zelenyuk, A., and Zhang, Q.: Understanding the optical properties of ambient sub- and supermicron particulate matter: results from the CARES 2010 field study in northern California, Atmos. Chem. Phys., 16, 6511–6535, https://doi.org/10.5194/acp-16-6511-2016, 2016.
Cazorla, A., Bahadur, R., Suski, K. J., Cahill, J. F., Chand, D., Schmid, B., Ramanathan, V., and Prather, K. A.: Relating aerosol absorption due to soot, organic carbon, and dust to emission sources determined from in-situ chemical measurements, Atmos. Chem. Phys., 13, 9337–9350, https://doi.org/10.5194/acp-13-9337-2013, 2013.
Clarke, A., McNaughton, C., Kapustin, V., Shinozuka, Y., Howell, S., Dibb, J., Zhou, J., Anderson, B., Brekhovskikh, V., Turner, H., and Pinkerton, M.: Biomass burning and pollution aerosol over North America: Organic components and their influence on spectral optical properties and humidification response, J. Geophys. Res., 112, https://doi.org/10.1029/2006JD007777, 2007.
Collaud Coen, M., Weingartner, E., Nyeki, S., Cozic, J., Henning, S., Verheggen, B., Gehrig, R., and Baltensperger, U.: Long-term trend analysis of aerosol variables at the high-alpine site Jungfraujoch, J. Geophys. Res., 112, https://doi.org/10.1029/2006JD007995, 2007.
Collaud Coen, M., Andrews, E., Aliaga, D., Andrade, M., Angelov, H., Bukowiecki, N., Ealo, M., Fialho, P., Flentje, H., Hallar, A. G., Hooda, R., Kalapov, I., Krejci, R., Lin, N.-H., Marinoni, A., Ming, J., Nguyen, N. A., Pandolfi, M., Pont, V., Ries, L., Rodríguez, S., Schauer, G., Sellegri, K., Sharma, S., Sun, J., Tunved, P., Velasquez, P., and Ruffieux, D.: Identification of topographic features influencing aerosol observations at high altitude stations, Atmos. Chem. Phys., 18, 12289–12313, https://doi.org/10.5194/acp-18-12289-2018, 2018.
Collaud Coen, M., Andrews, E., Alastuey, A., Arsov, T. P., Backman, J., Brem, B. T., Bukowiecki, N., Couret, C., Eleftheriadis, K., Flentje, H., Fiebig, M., Gysel-Beer, M., Hand, J. L., Hoffer, A., Hooda, R., Hueglin, C., Joubert, W., Keywood, M., Kim, J. E., Kim, S.-W., Labuschagne, C., Lin, N.-H., Lin, Y., Lund Myhre, C., Luoma, K., Lyamani, H., Marinoni, A., Mayol-Bracero, O. L., Mihalopoulos, N., Pandolfi, M., Prats, N., Prenni, A. J., Putaud, J.-P., Ries, L., Reisen, F., Sellegri, K., Sharma, S., Sheridan, P., Sherman, J. P., Sun, J., Titos, G., Torres, E., Tuch, T., Weller, R., Wiedensohler, A., Zieger, P., and Laj, P.: Multidecadal trend analysis of in situ aerosol radiative properties around the world, Atmos. Chem. Phys., 20, 8867–8908, https://doi.org/10.5194/acp-20-8867-2020, 2020.
Creamean, J. M., Neiman, P. J., Coleman, T., Senff, C. J., Kirgis, G., Alvarez, R. J., and Yamamoto, A.: Colorado air quality impacted by long-range-transported aerosol: a set of case studies during the 2015 Pacific Northwest fires, Atmos. Chem. Phys., 16, 12329–12345, https://doi.org/10.5194/acp-16-12329-2016, 2016.
Davulienė, L., Janicka, L., Minderytė, A., Kalinauskaitė, A., Poczta, P., Karasewicz, M., Hafiz, A., Pashneva, D., Dudoitis, V., Kandrotaitė, K., Valiulis, D., Böckmann, C., Schüttemeyer, D., Stachlewska, I. S., and Byčenkienė, S.: Synergic use of in-situ and remote sensing techniques for comprehensive characterization of aerosol optical and microphysical properties, Sci. Total Environ., 906, 167585, https://doi.org/10.1016/j.scitotenv.2023.167585, 2024.
Delfino, R. J., Brummel, S., Wu, J., Stern, H., Ostro, B., Lipsett, M., Winer, A., Street, D. H., Zhang, L., Tjoa, T., and Gillen, D. L.: The relationship of respiratory and cardiovascular hospital admissions to the southern California wildfires of 2003, Occup. Environ. Med., 66, 189–197, https://doi.org/10.1136/oem.2008.041376, 2009.
Dennison, P. E., Brewer, S. C., Arnold, J. D., and Moritz, M. A.: Large wildfire trends in the western United States, 1984–2011, Geophys. Res. Lett., 41, 2928–2933, https://doi.org/10.1002/2014GL059576, 2014.
Dubovik, O. and King, M. D.: A flexible inversion algorithm for retrieval of aerosol optical properties from Sun and sky radiance measurements, J. Geophys. Res.-Atmos., 105, 20673–20696, https://doi.org/10.1029/2000JD900282, 2000.
Eibedingil, I. G., Gill, T. E., Van Pelt, R. S., and Tong, D. Q.: Comparison of Aerosol Optical Depth from MODIS Product Collection 6.1 and AERONET in the Western United States, Remote Sens., 13, 2316, https://doi.org/10.3390/rs13122316, 2021.
Farr, T. G., Rosen, P. A., Caro, E., Crippen, R., Duren, R., Hensley, S., Kobrick, M., Paller, M., Rodriguez, E., Roth, L., Seal, D., Shaffer, S., Shimada, J., Umland, J., Werner, M., Oskin, M., Burbank, D., and Alsdorf, D.: The Shuttle Radar Topography Mission, Rev. Geophys., 45, https://doi.org/10.1029/2005RG000183, 2007.
Ford, B., Val Martin, M., Zelasky, S. E., Fischer, E. V., Anenberg, S. C., Heald, C. L., and Pierce, J. R.: Future Fire Impacts on Smoke Concentrations, Visibility, and Health in the Contiguous United States, GeoHealth, 2, 229–247, https://doi.org/10.1029/2018GH000144, 2018.
Forrister, H., Liu, J., Scheuer, E., Dibb, J., Ziemba, L., Thornhill, K. L., Anderson, B., Diskin, G., Perring, A. E., Schwarz, J. P., Campuzano-Jost, P., Day, D. A., Palm, B. B., Jimenez, J. L., Nenes, A., and Weber, R. J.: Evolution of brown carbon in wildfire plumes, Geophys. Res. Lett., 42, 4623–4630, https://doi.org/10.1002/2015GL063897, 2015.
Ghan, S. J. and Schwartz, S. E.: Aerosol Properties and Processes: A Path from Field and Laboratory Measurements to Global Climate Models, B. Am. Meteorol. Soc., 88, 1059–1084, https://doi.org/10.1175/BAMS-88-7-1059, 2007.
Goss, M., Swain, D. L., Abatzoglou, J. T., Sarhadi, A., Kolden, C. A., Williams, A. P., and Diffenbaugh, N. S.: Climate change is increasing the likelihood of extreme autumn wildfire conditions across California, Environ. Res. Lett., 15, 094016, https://doi.org/10.1088/1748-9326/ab83a7, 2020.
Haikerwal, A., Akram, M., Sim, M. R., Meyer, M., Abramson, M. J., and Dennekamp, M.: Fine particulate matter (PM2.5) exposure during a prolonged wildfire period and emergency department visits for asthma, Respirology (Carlton, Vic.), 21, 88–94, https://doi.org/10.1111/resp.12613, 2016.
Hallar, A. G., Chirokova, G., McCubbin, I., Painter, T. H., Wiedinmyer, C., and Dodson, C.: Atmospheric bioaerosols transported via dust storms in the western United States, Geophys. Res. Lett., 38, https://doi.org/10.1029/2011GL048166, 2011.
Hallar, A. G., Petersen, R., Andrews, E., Michalsky, J., McCubbin, I. B., and Ogren, J. A.: Contributions of dust and biomass burning to aerosols at a Colorado mountain-top site, Atmos. Chem. Phys., 15, 13665–13679, https://doi.org/10.5194/acp-15-13665-2015, 2015.
Hallar, A. G., Molotch, N. P., Hand, J. L., Livneh, B., McCubbin, I. B., Petersen, R., Michalsky, J., Lowenthal, D., and Kunkel, K. E.: Impacts of increasing aridity and wildfires on aerosol loading in the intermountain Western US, Environ. Res. Lett., 12, 014006, https://doi.org/10.1088/1748-9326/aa510a, 2017.
Hallar, A. G., McCubbin, I. B., Borys, R., Lowenthal, D. H., Wetzel, M., Hindman, E., Brooks, S. D., Steenburgh, W. J., Gratz, L., Hoch, S., Stephens, B., Horel, J. D., Molotch, N. P., Mace, G. G., Bailey, A., Pettersen, C., Andrews, E., Cziczo, D. J., and Garcia, M.: Storm Peak Laboratory: A Research and Training Facility for the Atmospheric Sciences, B. Am. Meteorol. Soc., 106, E1130–E1148, https://doi.org/10.1175/BAMS-D-24-0043.1, 2025.
Hand, J. L., Gill, T. E., and Schichtel, B. A.: Urban and rural coarse aerosol mass across the United States: Spatial and seasonal variability and long-term trends, Atmos. Environ., 218, 117025, https://doi.org/10.1016/j.atmosenv.2019.117025, 2019.
Hand, J. L., Prenni, A. J., Copeland, S., Schichtel, B. A., and Malm, W. C.: Thirty years of the Clean Air Act Amendments: Impacts on haze in remote regions of the United States (1990–2018), Atmos. Environ., 243, 117865, https://doi.org/10.1016/j.atmosenv.2020.117865, 2020.
Hand, J. L., Prenni, A. J., Raffuse, S. M., Hyslop, N. P., Malm, W. C., and Schichtel, B. A.: Spatial and Seasonal Variability of Remote and Urban Speciated Fine Particulate Matter in the United States, J. Geophys. Res., 129, e2024JD042579, https://doi.org/10.1029/2024JD042579, 2024a.
Hand, J. L., Prenni, A. J., and Schichtel, B. A.: Trends in Seasonal Mean Speciated Aerosol Composition in Remote Areas of the United States From 2000 Through 2021, J. Geophys. Res.-Atmos., 129, e2023JD039902, https://doi.org/10.1029/2023JD039902, 2024b.
Higuera, P. E. and Abatzoglou, J. T.: Record-setting climate enabled the extraordinary 2020 fire season in the western United States, Glob. Change Biol., 27, 1–2, https://doi.org/10.1111/gcb.15388, 2021.
Hillamo, R. E. and Kauppinen, E. I.: On the Performance of the Berner Low Pressure Impactor, Aerosol Sci. Technol., 14, 33–47, https://doi.org/10.1080/02786829108959469, 1991.
Iglesias, V., Balch, J. K., and Travis, W. R.: U.S. fires became larger, more frequent, and more widespread in the 2000s, Sci. Adv., 8, eabc0020, https://doi.org/10.1126/sciadv.abc0020, 2022.
Intergovernmental Panel on Climate Change (IPCC): Climate Change 2021 – The Physical Science Basis: Working Group I Contribution to the Sixth Assessment Report of the Intergovernmental Panel on Climate Change, Cambridge University Press, https://doi.org/10.1017/9781009157896, 2023.
Jahn, L. G., Polen, M. J., Jahl, L. G., Brubaker, T. A., Somers, J., and Sullivan, R. C.: Biomass combustion produces ice-active minerals in biomass-burning aerosol and bottom ash, P. Natl. Acad. Sci. USA, 117, 21928–21937, https://doi.org/10.1073/pnas.1922128117, 2020.
Japngie-Green, C. M., Andrews, E., McCubbin, I. B., Ogren, J. A., and Hallar, A. G.: Climatology of Aerosol Optical Properties at Storm Peak Laboratory, Aerosol Air Qual. Res., 19, 1205–1213, https://doi.org/10.4209/aaqr.2018.05.0204, 2019.
Jiang, Y., Yang, X.-Q., Liu, X., Qian, Y., Zhang, K., Wang, M., Li, F., Wang, Y., and Lu, Z.: Impacts of Wildfire Aerosols on Global Energy Budget and Climate: The Role of Climate Feedbacks, J. Climate, 33, 3351–3366, https://doi.org/10.1175/JCLI-D-19-0572.1, 2020.
Johnston, F. H., Henderson, S. B., Chen, Y., Randerson, J. T., Marlier, M., Defries, R. S., Kinney, P., Bowman, D. M. J. S., and Brauer, M.: Estimated global mortality attributable to smoke from landscape fires, Environ. Health Perspect., 120, 695–701, https://www.jstor.org/stable/41548667 (last access: 30 June 2025), 2012.
Junghenn Noyes, K. T., Kahn, R. A., Limbacher, J. A., and Li, Z.: Canadian and Alaskan wildfire smoke particle properties, their evolution, and controlling factors, from satellite observations, Atmos. Chem. Phys., 22, 10267–10290, https://doi.org/10.5194/acp-22-10267-2022, 2022.
Koenker, R.: Quantile Regression, Cambridge University Press, Cambridge, https://doi.org/10.1017/CBO9780511754098, 2005.
Koenker, R. and Bassett, G.: Regression Quantiles, Econometrica, 46, 33–50, https://doi.org/10.2307/1913643, 1978.
Koenker, R. and Hallock, K. F.: Quantile Regression, J. Econ. Perspect., 15, 143–156, https://doi.org/10.1257/jep.15.4.143, 2001.
Koenker, R. W. and D'Orey, V.: Computing Regression Quantiles, J. R. Stat. Soc. C-Appl., 36, 383–393, https://doi.org/10.2307/2347802, 1987.
Koenker, R., Portnoy, S., Ng, P. T., Melly, B., Zeileis, A., Grosjean, P., Moler, C., Saad, Y., Chernozhukov, V., Fernandez-Val, I., Maechler, M., and Ripley, B. D.: quantreg: Quantile Regression, CRAN [code], https://doi.org/10.32614/CRAN.package.quantreg, 2025.
Kok, J. F., Storelvmo, T., Karydis, V. A., Adebiyi, A. A., Mahowald, N. M., Evan, A. T., He, C., and Leung, D. M.: Mineral dust aerosol impacts on global climate and climate change, Nat. Rev. Earth Environ., 4, 71–86, https://doi.org/10.1038/s43017-022-00379-5, 2023.
Laj, P., Bigi, A., Rose, C., Andrews, E., Lund Myhre, C., Collaud Coen, M., Lin, Y., Wiedensohler, A., Schulz, M., Ogren, J. A., Fiebig, M., Gliß, J., Mortier, A., Pandolfi, M., Petäja, T., Kim, S.-W., Aas, W., Putaud, J.-P., Mayol-Bracero, O., Keywood, M., Labrador, L., Aalto, P., Ahlberg, E., Alados Arboledas, L., Alastuey, A., Andrade, M., Artíñano, B., Ausmeel, S., Arsov, T., Asmi, E., Backman, J., Baltensperger, U., Bastian, S., Bath, O., Beukes, J. P., Brem, B. T., Bukowiecki, N., Conil, S., Couret, C., Day, D., Dayantolis, W., Degorska, A., Eleftheriadis, K., Fetfatzis, P., Favez, O., Flentje, H., Gini, M. I., Gregorič, A., Gysel-Beer, M., Hallar, A. G., Hand, J., Hoffer, A., Hueglin, C., Hooda, R. K., Hyvärinen, A., Kalapov, I., Kalivitis, N., Kasper-Giebl, A., Kim, J. E., Kouvarakis, G., Kranjc, I., Krejci, R., Kulmala, M., Labuschagne, C., Lee, H.-J., Lihavainen, H., Lin, N.-H., Löschau, G., Luoma, K., Marinoni, A., Martins Dos Santos, S., Meinhardt, F., Merkel, M., Metzger, J.-M., Mihalopoulos, N., Nguyen, N. A., Ondracek, J., Pérez, N., Perrone, M. R., Petit, J.-E., Picard, D., Pichon, J.-M., Pont, V., Prats, N., Prenni, A., Reisen, F., Romano, S., Sellegri, K., Sharma, S., Schauer, G., Sheridan, P., Sherman, J. P., Schütze, M., Schwerin, A., Sohmer, R., Sorribas, M., Steinbacher, M., Sun, J., Titos, G., Toczko, B., Tuch, T., Tulet, P., Tunved, P., Vakkari, V., Velarde, F., Velasquez, P., Villani, P., Vratolis, S., Wang, S.-H., Weinhold, K., Weller, R., Yela, M., Yus-Diez, J., Zdimal, V., Zieger, P., and Zikova, N.: A global analysis of climate-relevant aerosol properties retrieved from the network of Global Atmosphere Watch (GAW) near-surface observatories, Atmos. Meas. Tech., 13, 4353–4392, https://doi.org/10.5194/amt-13-4353-2020, 2020.
Lambert, A., Hallar, A. G., Garcia, M., Strong, C., Andrews, E., and Hand, J. L.: Dust Impacts of Rapid Agricultural Expansion on the Great Plains, Geophys. Res. Lett., 47, e2020GL090347, https://doi.org/10.1029/2020GL090347, 2020.
Lee, S., Yoon, S.-C., Kim, S.-W., Kim, Y. P., Ghim, Y. S., Kim, J.-H., Kang, C.-H., Kim, Y. J., Chang, L.-S., and Lee, S.-J.: Spectral dependency of light scattering/absorption and hygroscopicity of pollution and dust aerosols in Northeast Asia, Atmos. Environ., 50, 246–254, https://doi.org/10.1016/j.atmosenv.2011.12.026, 2012.
Leeper, R. D., Bilotta, R., Petersen, B., Stiles, C. J., Heim, R., Fuchs, B., Prat, O. P., Palecki, M., and Ansari, S.: Characterizing U. S. drought over the past 20 years using the U. S. drought monitor, Int. J. Climatol., 42, 6616–6630, https://doi.org/10.1002/joc.7653, 2022.
Lian, X., Piao, S., Li, L. Z. X., Li, Y., Huntingford, C., Ciais, P., Cescatti, A., Janssens, I. A., Peñuelas, J., Buermann, W., Chen, A., Li, X., Myneni, R. B., Wang, X., Wang, Y., Yang, Y., Zeng, Z., Zhang, Y., and McVicar, T. R.: Summer soil drying exacerbated by earlier spring greening of northern vegetation, Sci. Adv., 6, eaax0255, https://doi.org/10.1126/sciadv.aax0255, 2020.
Liu, J. C., Pereira, G., Uhl, S. A., Bravo, M. A., and Bell, M. L.: A systematic review of the physical health impacts from non-occupational exposure to wildfire smoke, Environ. Res., 136, 120–132, https://doi.org/10.1016/j.envres.2014.10.015, 2015.
Liu, J. C., Wilson, A., Mickley, L. J., Dominici, F., Ebisu, K., Wang, Y., Sulprizio, M. P., Peng, R. D., Yue, X., Son, J.-Y., Anderson, G. B., and Bell, M. L.: Wildfire-specific Fine Particulate Matter and Risk of Hospital Admissions in Urban and Rural Counties, Epidemiology, 28, 77–85, https://doi.org/10.1097/EDE.0000000000000556, 2017.
Malm, W. C., Schichtel, B. A., Prenni, A. J., Day, D., Andrews, E., Perkins, R., Sullivan, A., and Tigges, M.: Revisiting integrating nephelometer measurements, Atmos. Environ., 319, 120237, https://doi.org/10.1016/j.atmosenv.2023.120237, 2024.
McClure, C. D. and Jaffe, D. A.: US particulate matter air quality improves except in wildfire-prone areas, P. Natl. Acad. Sci. USA, 115, 7901–7906, https://doi.org/10.1073/pnas.1804353115, 2018.
Mote, P. W., Li, S., Lettenmaier, D. P., Xiao, M., and Engel, R.: Dramatic declines in snowpack in the western US, npj Clim. Atmos. Sci., 1, 2, https://doi.org/10.1038/s41612-018-0012-1, 2018.
Ogren, J. A.: Comment on “Calibration and Intercomparison of Filter-Based Measurements of Visible Light Absorption by Aerosols,” Aerosol Sci. Technol., 44, 589–591, https://doi.org/10.1080/02786826.2010.482111, 2010.
Ogren, J. A., Wendell, J., Andrews, E., and Sheridan, P. J.: Continuous light absorption photometer for long-term studies, Atmos. Meas. Tech., 10, 4805–4818, https://doi.org/10.5194/amt-10-4805-2017, 2017.
Pederson, G. T., Betancourt, J. L., and McCabe, G. J.: Regional patterns and proximal causes of the recent snowpack decline in the Rocky Mountains, U. S., Geophys. Res. Lett., 40, 1811–1816, https://doi.org/10.1002/grl.50424, 2013.
Penner, J. E., Dickinson, R. E., and O'Neill, C. A.: Effects of Aerosol from Biomass Burning on the Global Radiation Budget, Science, 256, 1432–1434, https://doi.org/10.1126/science.256.5062.1432, 1992.
Pu, B. and Ginoux, P.: Projection of American dustiness in the late 21st century due to climate change, Sci. Rep., 7, 5553, https://doi.org/10.1038/s41598-017-05431-9, 2017.
Russell, P. B., Bergstrom, R. W., Shinozuka, Y., Clarke, A. D., DeCarlo, P. F., Jimenez, J. L., Livingston, J. M., Redemann, J., Dubovik, O., and Strawa, A.: Absorption Angstrom Exponent in AERONET and related data as an indicator of aerosol composition, Atmos. Chem. Phys., 10, 1155–1169, https://doi.org/10.5194/acp-10-1155-2010, 2010.
Saleh, R., Hennigan, C. J., McMeeking, G. R., Chuang, W. K., Robinson, E. S., Coe, H., Donahue, N. M., and Robinson, A. L.: Absorptivity of brown carbon in fresh and photo-chemically aged biomass-burning emissions, Atmos. Chem. Phys., 13, 7683–7693, https://doi.org/10.5194/acp-13-7683-2013, 2013.
Schmeisser, L., Andrews, E., Ogren, J. A., Sheridan, P., Jefferson, A., Sharma, S., Kim, J. E., Sherman, J. P., Sorribas, M., Kalapov, I., Arsov, T., Angelov, C., Mayol-Bracero, O. L., Labuschagne, C., Kim, S.-W., Hoffer, A., Lin, N.-H., Chia, H.-P., Bergin, M., Sun, J., Liu, P., and Wu, H.: Classifying aerosol type using in situ surface spectral aerosol optical properties, Atmos. Chem. Phys., 17, 12097–12120, https://doi.org/10.5194/acp-17-12097-2017, 2017.
Schuster, G. L., Dubovik, O., and Holben, B. N.: Angstrom exponent and bimodal aerosol size distributions, J. Geophys. Res., 111, https://doi.org/10.1029/2005JD006328, 2006.
Seinfeld, J. H. and Pandis, S. N.: Atmospheric chemistry and physics: from air pollution to climate change, 2nd edn., Johm Wiley & Sons, New York, ISBN 9780471720188, 2006.
Selimovic, V., Yokelson, R. J., Warneke, C., Roberts, J. M., de Gouw, J., Reardon, J., and Griffith, D. W. T.: Aerosol optical properties and trace gas emissions by PAX and OP-FTIR for laboratory-simulated western US wildfires during FIREX, Atmos. Chem. Phys., 18, 2929–2948, https://doi.org/10.5194/acp-18-2929-2018, 2018.
Sheridan, P., Hageman, D., and NOAA GML: Earth System Research Laboratory Long-Term Surface Aerosol Measurements, Version 1 [Table Mountain, Colorado, United States (BOS), Aerosols], NOAA National Centers for Environmental Information (NCEI) [data set], https://doi.org/10.7289/V55T3HJF, 2017.
Sherman, J. P., Sheridan, P. J., Ogren, J. A., Andrews, E., Hageman, D., Schmeisser, L., Jefferson, A., and Sharma, S.: A multi-year study of lower tropospheric aerosol variability and systematic relationships from four North American regions, Atmos. Chem. Phys., 15, 12487–12517, https://doi.org/10.5194/acp-15-12487-2015, 2015.
Twohy, C. H., Toohey, D. W., Levin, E. J. T., DeMott, P. J., Rainwater, B., Garofalo, L. A., Pothier, M. A., Farmer, D. K., Kreidenweis, S. M., Pokhrel, R. P., Murphy, S. M., Reeves, J. M., Moore, K. A., and Fischer, E. V.: Biomass Burning Smoke and Its Influence on Clouds Over the Western U. S., Geophys. Res. Lett., 48, e2021GL094224, https://doi.org/10.1029/2021GL094224, 2021.
Val Martin, M., Heald, C. L., Ford, B., Prenni, A. J., and Wiedinmyer, C.: A decadal satellite analysis of the origins and impacts of smoke in Colorado, Atmos. Chem. Phys., 13, 7429–7439, https://doi.org/10.5194/acp-13-7429-2013, 2013.
Weber, K. T. and Yadav, R.: Spatiotemporal Trends in Wildfires across the Western United States (1950–2019), Remote Sens., 12, 2959, https://doi.org/10.3390/rs12182959, 2020.
Wei, J., Li, Z., Peng, Y., and Sun, L.: MODIS Collection 6.1 aerosol optical depth products over land and ocean: validation and comparison, Atmos. Environ., 201, 428–440, https://doi.org/10.1016/j.atmosenv.2018.12.004, 2019.
Westerling, A. L., Hidalgo, H. G., Cayan, D. R., and Swetnam, T. W.: Warming and Earlier Spring Increase Western U. S. Forest Wildfire Activity, Science, 313, 940–943, https://doi.org/10.1126/science.1128834, 2006.
White, R. H., Anderson, S., Booth, J. F., Braich, G., Draeger, C., Fei, C., Harley, C. D. G., Henderson, S. B., Jakob, M., Lau, C.-A., Mareshet Admasu, L., Narinesingh, V., Rodell, C., Roocroft, E., Weinberger, K. R., and West, G.: The unprecedented Pacific Northwest heatwave of June 2021, Nat. Commun., 14, 727, https://doi.org/10.1038/s41467-023-36289-3, 2023.
Wilmot, T. Y., Hallar, A. G., Lin, J. C., and Mallia, D. V.: Expanding number of Western US urban centers face declining summertime air quality due to enhanced wildland fire activity, Environ. Res. Lett., 16, 054036, https://doi.org/10.1088/1748-9326/abf966, 2021.
WMO: WMO/GAW Aerosol Measurement Procedures, Guidelines and Recommendations, Report No. 227, World Meteorological Organization, Geneva, Switzerland, ISBN 9789263111777, 2016.
Yokelson, R. J., Crounse, J. D., DeCarlo, P. F., Karl, T., Urbanski, S., Atlas, E., Campos, T., Shinozuka, Y., Kapustin, V., Clarke, A. D., Weinheimer, A., Knapp, D. J., Montzka, D. D., Holloway, J., Weibring, P., Flocke, F., Zheng, W., Toohey, D., Wennberg, P. O., Wiedinmyer, C., Mauldin, L., Fried, A., Richter, D., Walega, J., Jimenez, J. L., Adachi, K., Buseck, P. R., Hall, S. R., and Shetter, R.: Emissions from biomass burning in the Yucatan, Atmos. Chem. Phys., 9, 5785–5812, https://doi.org/10.5194/acp-9-5785-2009, 2009.