the Creative Commons Attribution 4.0 License.
the Creative Commons Attribution 4.0 License.
 | 12 May 2026
Disentangling controls of multi-scale variability in precipitation stable isotopes at Yadong and Ali on the Tibetan Plateau
Ke Li
Jingjing Yang
Xiaowei Niu
Aibin Zhao
Gebanruo Chen
Yuqing Wu
Yigang Liu
Understanding precipitation stable isotope variability over the Tibetan Plateau (TP) is essential for identifying moisture sources and assessing climatic responses. However, drivers of daily and synoptic-scale variability beyond the westerlies and Indian Summer Monsoon (ISM) remain poorly constrained in the southern and western TP. Using event-based precipitation isotope data (δ18O and δD) from Yadong and Ali (May 2021–September 2023), we investigate multi-scale variability drivers. Both sites exhibit nearly identical δ18O and δD magnitudes during the monsoon (June–September), while the westerly-dominated season (November–February) shows maximum differences of 12.2 ‰ in δ18O and 118.8 ‰ in δD. Meteorological controls vary seasonally: amount effects dominate during the monsoon ( to −0.32, p<0.05), while temperature effects prevail in the westerly season (R=0.51–0.79, p<0.001). ISM dominates during isotopic convergence, while westerlies drive divergence via distinct transport pathways. Local Meteoric Water Line analysis indicates stronger moisture recycling and sub-cloud evaporation variability at Yadong. On synoptic scales, simultaneous precipitation events reflect coherent ISM influence. Interannual variability is significantly modulated by ENSO, with δ18O enrichment of 2.8 ‰–5.1 ‰ (δD of 39.3 ‰–255.9 ‰) from La Niña to El Niño. During El Niño, weakened Walker circulation reduces ISM transport and enhances the relative contribution of local evapotranspiration. These results offer new constraints on seasonal moisture source transitions and reveal ENSO sensitivity exceeding previous estimates, advancing understanding of atmospheric moisture transport and regional climate sensitivity over the TP.
- Article
(6114 KB) - Full-text XML
-
Supplement
(1687 KB) - BibTeX
- EndNote


Stable oxygen and hydrogen isotopes (δ18O and δD) in water are 16O, 17O, and 18O for oxygen, and 1H and 2H (D) for hydrogen. During water phase change, such as evaporation and condensation, isotopic fractionation leads to the change of isotopic ratios (Gat, 1996; Frankenberg et al., 2009; Yoshimura et al., 2008). Stable isotopes in ice cores serve as paleothermometers (Tian et al., 2021), when interpreted through knowledge of precipitation isotope variability. Precipitation stable isotopes offer insight into moisture sources and hydrological processes and form the theoretical foundation for paleoclimate reconstruction and interpretation (Yoshimura, 2015).
Numerous studies have shown that precipitation isotopes are influenced by temperature, precipitation amount, and altitude (Jasechko, 2019). Additional influences include local recycling via evapotranspiration (Risi et al., 2010), convective activity (Gao et al., 2013; Risi et al., 2008), sub-cloud evaporation (Ye et al., 2024), topographic gradients (Zhang et al., 2023), atmospheric circulation (Wang et al., 2024b), moisture sources (Yang and Wang, 2024), and ENSO. The linear relationship between δD and δ18O in precipitation, known as the Global Meteoric Water Line (GMWL; δD = ), was first proposed by Craig (1961). The slope reflects the fractionation ratio of δD and δ18O, and the intercept represents the mean d-excess, which signals kinetic fractionation during ocean evaporation and serves as a tracer of moisture source conditions (Merlivat and Jouzel, 1979). At regional scales, this is referred to as the Local Meteoric Water Line (LMWL), which varies according to local climatic conditions (e.g., temperature, precipitation amount, humidity, wind) (Gao et al., 2011), large-scale convective activity (Dansgaard, 1964), geographic factors (e.g., latitude, elevation, water recycling), and atmospheric circulation patterns (e.g., source regions and transport pathways) (Chakraborty et al., 2016). Deviations from equilibrium fractionation – such as sub-cloud evaporation – can lower both the slope and intercept of the LMWL due to the differing non-equilibrium fractionation of oxygen and hydrogen isotopes (Brunello et al., 2024). Conversely, vapor recycling tends to increase both values (Adhikari et al., 2020).
Deuterium excess (d-excess =δD ), introduced by Dansgaard (1964), is commonly used to assess kinetic fractionation and infer moisture source characteristics (Zhang et al., 2021). Globally, average d-excess in precipitation is around 10 ‰. Lower oceanic relative humidity during winter enhances kinetic fractionation, producing water vapor with elevated d-excess (Natali et al., 2022).
Isotope monitoring on the TP began in 1991 with the establishment of the Tibetan Plateau Network of Isotopes in Precipitation (TNIP) by the Chinese Academy of Sciences (Yao et al., 1991). Precipitation δ18O in the northern TP generally shows positive correlation with temperature (i.e., enriched δ18O in summer, depleted in winter), while precipitation δ18O in the southern TP exhibits a negative correlation with precipitation amount, showing depletion in summer and enrichment in winter (Tian et al., 2007). Spatial precipitation δ18O patterns during summer reflect regional circulation regimes: Indian summer monsoon (ISM) dominance in the south, westerly influence in the north, and a transitional zone in central TP. In winter, westerlies dominate across the entire TP (Yao et al., 2013; Gao et al., 2009).
Previous studies also demonstrated that moisture origins influence precipitation isotopes (Dai et al., 2021). During monsoon seasons, convection transports marine vapor from the Bay of Bengal (BOB), Arabian Sea (AS), and Indian Ocean northward, yielding low d-excess precipitation over the Himalayas and beyond, reflecting marine vapor origins. In contrast, wintertime westerlies carry moisture from remote sources such as the Mediterranean Sea, producing precipitation with lower δ18O and elevated d-excess. Local evapotranspiration contributes isotopically distinct vapor, typically enriched in both δ18O and d-excess (Noone et al., 2011; Gao et al., 2019). Local processes such as evaporation, convection, and sub-cloud evaporation also modulate isotope values seasonally: high temperatures enhance evapotranspiration and sub-cloud evaporation through unsaturated air during summer, enriching δ18O; as sub-cloud evaporation decreases, d-excess rises (Ren et al., 2013). Vapor recycling also contributes to elevated d-excess values (Wang et al., 2016).
ENSO modulates precipitation across the TP by altering the Walker Circulation and associated convective and large-scale moisture transport patterns (Mason and Goddard, 2001). Central Pacific El Niño events typically increase spring precipitation in the western TP and reduce it in the east, while La Niña events have the opposite effect (Wang et al., 2024a). In summer, eastern Pacific El Niño events suppress rainfall in the southwest TP, while Central Pacific La Niña conditions enhance it (Liu et al., 2023). ENSO-driven changes in precipitation modify isotope signals through the amount effect, as well as upstream convective activity along vapor transport pathways. For example, δ18O values at Lhasa are significantly correlated with convective activity both in moisture source regions and along the transport path (Cai et al., 2017). ENSO also alters δ18O in the northwestern TP by affecting regional circulation patterns and the availability of water vapor (Yang et al., 2018). Therefore, the precipitation stable isotopes across the TP serve as effective tracers of ENSO-related climate variability (Murray et al., 2025).
The Yadong Valley, located in the southern TP within the monsoon domain, receives abundant ISM precipitation. Moisture supply linked to evaporation over northeastern India and losses associated with convection over the BoB and Bangladesh significantly impact δ18O and d-excess (Axelsson et al., 2023). In contrast, the Ali region in the arid western TP remains under-studied due to sparse observational data. Prior work has linked sharp mid-summer drops in δ18O to ISM intrusions, while δ18O–temperature correlations dominate during the non-monsoon season, reflecting westerly and local circulation influences (Yu et al., 2009).
Despite these insights, a systematic understanding of drivers on daily and synoptic-scale variability of precipitation isotopes and their response to large-scale systems such as the westerlies, ISM, and ENSO, between the southern and western TP is still lacking. Therefore, here we analyze event-based δ18O and δD data from Yadong and Ali (May 2021–September 2023), in conjunction with in-situ meteorological data, HYSPLIT backward trajectories, ERA5 reanalysis, and the Niño 3.4 index. We characterize isotope variability across daily to interannual timescales, evaluate the role of synoptic-scale moisture transport in modulating moisture sources, and assess ENSO's impact on the TP. Our results offer new insights into precipitation isotope response to climate variations on the TP. Section 2 outlines the study sites, datasets, sampling and analysis methods. Section 3 presents the variability of precipitation isotopes and meteorological parameters, explores local controls, moisture transport process and ENSO influences on precipitation stable isotopes; and analyzes drivers of simultaneous events at Yadong and Ali.
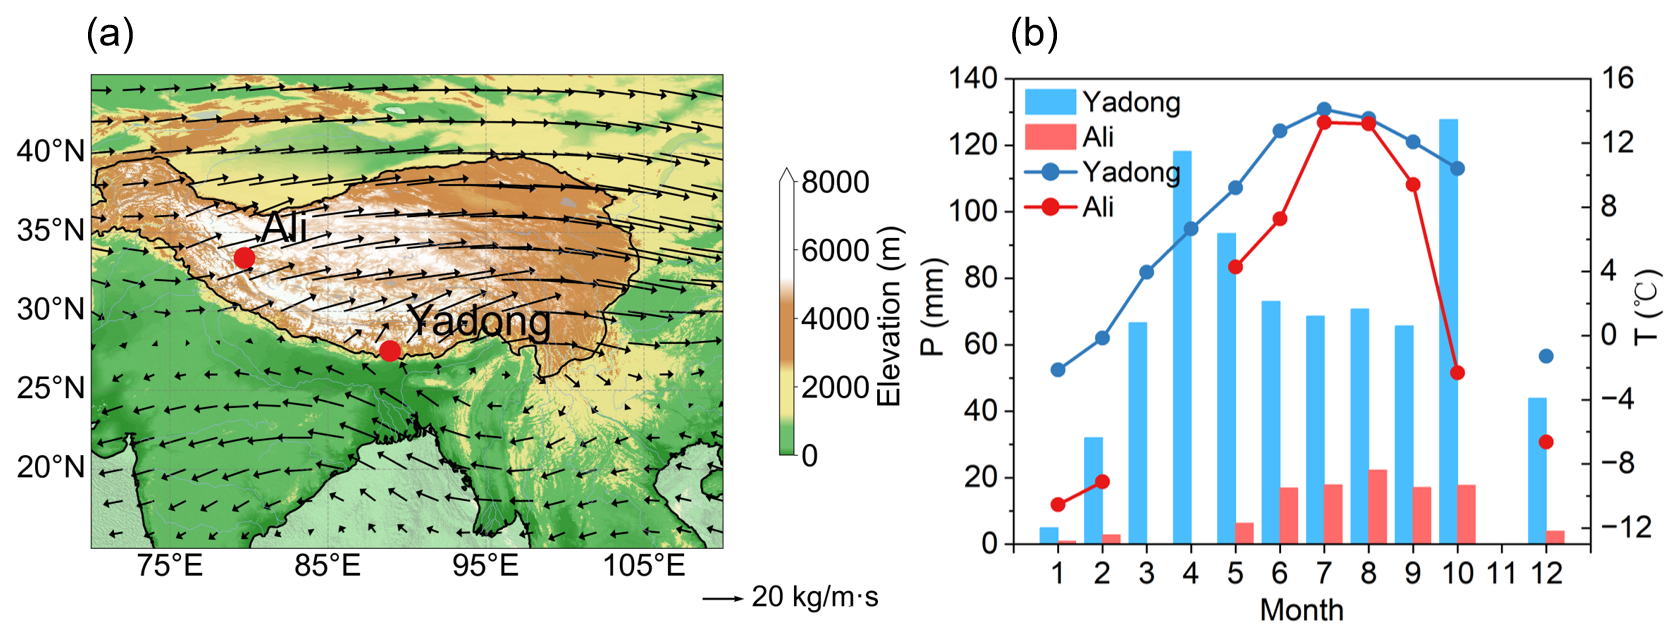
Figure 1Map showing the geographical locations of Yadong and Ali, the mean integrated water vapor flux (500–200 hPa) during the 1994 to 2023 monsoon seasons, and the monthly mean temperature and precipitation at both sites from May 2021 to September 2023. (a) The location of the Yadong and Ali study sites with arrows indicating the integrated water vapor flux from 500 to 200 hPa during the 1994 to 2023 monsoon seasons. (b) Monthly mean temperature (lines) and precipitation (bars) at both sites from May 2021 to September 2023. Note the absence of precipitation events at Yadong in November and at Ali in March, April, and November during the study period.
2.1 Study Site and Data
Precipitation samples were collected at Yadong and Ali sites. Yadong (88.92° E, 27.49° N, 2990 m a.m.s.l.) is located within the Yadong Valley in the central Himalayas, while Ali (79.70° E, 33.39° N, 4270 m a.m.s.l.) lies in the western Tibet at the intersection of the Himalayas, Karakoram, and Gangdise mountain ranges, with an elevation difference of 1280 m between these two sites (Fig. 1a). During the monsoon season, Yadong is primarily influenced by the southwest monsoon and receives an average annual precipitation of 764.8 mm. In contrast, Fig. 1 shows that Ali is mainly influenced by the westerlies and has much lower annual precipitation of 105.6 mm, ∼70 % of which falls during the monsoon season. Temperature at both sites follow a similar seasonal cycle, increasing in spring and summer and decreasing in autumn and winter. However, due to its higher elevation, Ali is consistently colder than Yadong, with an annual mean temperature of 2.1 °C compared to 7.2 °C at Yadong (Fig. 1b).
Meteorological data used in this study include surface temperature, precipitation, relative humidity, and wind speed, recorded at the beginning and end of each precipitation event. Surface temperature, relative humidity, and wind speed were averaged between the two measurements, while precipitation was calculated as the total rainfall amount for each event. Meteorological data for Ali were obtained from a Campbell ClimaVUE50 automatic weather station installed at the site (with minute-level temporal resolution), whereas data for Yadong were provided with hourly resolution. The observation period spans from May 2021 to September 2023 at both sites. To account for the respective influences of the ISM and the mid-latitude westerlies on precipitation stable isotopes, the year is divided into a monsoon season (June–September) and a non-monsoon season (October–May of the following year). The non-monsoon season is further subdivided into the pre-monsoon (March–May), post-monsoon (October), and westerlies (November–February) seasons, following previous isotope-based studies over the Tibetan Plateau (Axelsson et al., 2023; Dai et al., 2021). This seasonal classification is consistent with the typical progression of the ISM as reported by the India Meteorological Department (IMD; https://mausam.imd.gov.in/, last access: 15 December 2025). During the study period, monsoon onset dates occurred on 3 June 2021, 29 May 2022, and 8 June 2023, while monsoon withdrawal dates were 25 October 2021, 23 October 2022, and 16 October 2023, respectively. Meteorological conditions at both Yadong and Ali exhibited pronounced seasonal cycles. Air temperature at both sites peaked during the monsoon season (July means of 14.1 °C at Yadong and 13.3 °C at Ali) and reached minima during the westerlies season (January means of −2.1 and −10.5 °C, respectively). Precipitation patterns differed markedly between the two sites: Yadong experienced substantial rainfall with maxima during both the pre-monsoon (118.2 mm) and post-monsoon (127.8 mm) seasons, whereas approximately 70 % of Ali's annual precipitation occurred during the monsoon season (Fig. 1b). Relative humidity remained consistently high at Yadong throughout the year (pre-monsoon: 93 %; monsoon: 94 %; post-monsoon: 95 %; westerlies: 92 %), while at Ali it was substantially lower overall and exhibited a seasonal maximum during the post-monsoon period (pre-monsoon: 67 %; monsoon: 59 %; post-monsoon: 81 %; westerlies: 70 %). Wind speeds at Yadong were persistently low with minimal seasonal variability (pre-monsoon: 1.6 m s−1; monsoon: 2.2 m s−1; post-monsoon: 1.5 m s−1; westerlies: 1.7 m s−1). In contrast, Ali experienced generally stronger winds, with maxima during the pre-monsoon (2.7 m s−1) and monsoon (2.9 m s−1) seasons (post-monsoon: 1.6 m s−1; westerlies: 1.7 m s−1).
To investigate the influence of ENSO events on precipitation stable isotopes at Yadong and Ali, we used the monthly Oceanic Niño Index (ONI) provided by the National Oceanic and Atmospheric Administration Climate Prediction Center (NOAA CPC, https://www.cpc.ncep.noaa.gov/products/analysis_monitoring/ensostuff/ONI_v5.php, last access: 15 January 2025), based on sea surface temperature (SST) anomalies in the Niño 3.4 region (5° N–5° S, 120–170° W).
2.2 Sample Collection and Measurement
In total, 359 precipitation samples from Yadong and 80 samples from Ali were analyzed, all collected between May 2021 and September 2023. After each precipitation event, samples were immediately transferred into 4 mL glass bottles, sealed, and labeled with event-specific metadata including temperature, precipitation amount, relative humidity, and wind speed at both the beginning and end of the event. All samples were stored under refrigeration until isotope measurements were made. Measurements of δ18O and δD were conducted at the State Key Laboratory of Tibetan Plateau Earth System, Environment and Resources, Institute of Tibetan Plateau Research, Chinese Academy of Sciences (CAS), using a cavity ring-down spectrometer (Picarro-2130i Liquid Water Isotope Analyzer) with an analytical precision of ±0.08 ‰ for δ18O and ±0.5 ‰ for δD. Stable isotope measurements were calibrated and quality-controlled following a standardized analytical protocol. Each analytical batch comprised 27 precipitation samples and 4 laboratory reference standards, with each sample measured six consecutive times. To minimize instrument memory effects, the first three injections were discarded. The remaining three injections were required to meet strict precision criteria, with a standard deviation (SD) of <0.08 ‰ for δ18O and <0.5 ‰ for δD; samples that did not meet these thresholds were remeasured. For calibration, 4 laboratory reference standards calibrated against Vienna Standard Mean Ocean Water (V-SMOW) (δ18O = −0.9 ‰ and δD = −5.3 ‰, δ18O = −10.9 ‰ and δD = −77.0 ‰, δ18O = −19.7 ‰ and δD = −147.0 ‰, δ18O = −29.4 ‰ and δD = −224.6 ‰) were used to cover the isotopic range of ambient precipitation samples at both sites, with reference standard values spanning a similar range to those used in recent precipitation isotope studies from the same TP region (Wang et al., 2023). For each analytical batch, a univariate linear regression was established between the measured isotope values and the assigned values of the reference standards. The resulting calibration equation was then applied to correct the raw isotope measurements of the co-analyzed precipitation samples, ensuring consistency and traceability of the final dataset. Isotope values are reported in delta-notation (δ) relative to Vienna Standard Mean Ocean Water (V-SMOW) (Dansgaard, 1964):
The daily, monthly, seasonal, and annual averages of δ18O are calculated as precipitation amount-weighted averages:
where Pi represents the precipitation amount during the ith rainfall event. denotes the precipitation amount-weighted daily, monthly, seasonal, or annual average. The definition of δD follows a form analogous to Eq. (1), and its precipitation amount-weighted average is calculated identically using Eq. (2).
2.3 Rayleigh Distillation and Mixing Model
The Rayleigh distillation model describes the progressive depletion of heavy isotopes in an air mass as it cools along its trajectory. During this process, condensation and precipitation preferentially remove the heavier isotopes, leaving the residual vapor increasingly depleted (Gat, 1996):
where R and R0 represent the isotopic ratios of residual and initial vapor, respectively. denotes the equilibrium fractionation factor, and f is the fraction of residual water vapor.
By integrating Eq. (1), the Rayleigh distillation model can be expressed as follows:
where δ and δ0 are the isotope ratios against V-SMOW in residual and initial vapor, respectively.
To examine the isotopic characteristics after the mixing of two air masses we employ the following mixing model (Galewsky and Hurley, 2010):
where Rmix represents the isotopic ratio of the mixed air mass, while [HDO] and [H2O] denote isotopic water vapor volume mixing ratios. f is the mixing fraction.
2.4 Backward Trajectory Calculation and Integrated Water Vapor Flux
To assess the influence of moisture sources on precipitation stable isotopes, we employed the HYbrid Single-Particle Lagrangian Integrated Trajectory (HYSPLIT) model developed by the US National Oceanic and Atmospheric Administration (NOAA) to calculate 120 h backward trajectories for air masses arriving 200 m above ground level at Yadong and Ali stations. Backward trajectories were calculated with a duration of 120 h, which was selected because it sufficiently captures transport times from the major moisture source regions to the TP, as demonstrated in previous studies (Gao et al., 2013; Dai et al., 2021). Sensitivity tests using 140 h trajectories showed no significant differences in transport pathways or moisture source attribution compared to the 120 h case (Fig. S1). Therefore, 120 h was adopted as an optimal and computationally efficient choice for this study. Trajectories were initialized four times daily (00:00, 06:00, 12:00, and 18:00 UTC) on all rainy days between May 2021 and September 2023, with one air parcel released at each start time. Specific humidity (q) was tracked along each trajectory, and the magnitude of moisture change () ranged from 0.5 to 8.1 g kg−1 at Yadong and from 0.1 to 16.9 g kg−1 at Ali, indicating substantial moisture uptake and loss along transport pathways.
Cluster analysis was performed using the HYSPLIT clustering algorithm, which groups trajectories with similar spatial pathways. The optimal number of clusters was determined by minimizing the Total Spatial Variance (TSV). For each cluster, a mean trajectory represents the spatial average of all trajectories within that cluster. The percentages shown in Figs. 4 and 7 indicate the fraction of trajectories assigned to each cluster relative to the total number of trajectories at each site. We have added Table S1 to show Total Spatial Variance (TSV, units: degree2) of trajectory clusters at Yadong and Ali in different seasons of each year. The model uses Global Data Assimilation System (GDAS) reanalysis data with a spatial resolution of 1° × 1° and a temporal resolution of 6 h, provided by the National Centers for Environmental Prediction (NCEP, ftp://arlftp.arlhq.noaa.gov/archives/gdas1/, last access: 8 January 2025). To quantify the moisture contribution of each trajectory cluster, we combined the relative frequency of clustered trajectories with the along-trajectory variations in q. Increases in q were interpreted as moisture uptake from surface evaporation over the ocean or evapotranspiration over land, whereas decreases in q were attributed to moisture loss associated with precipitation processes (Dai et al., 2021; Adhikari et al., 2020).
To assess the robustness of the moisture source identification and ensure consistency with the water vapor flux analysis, trajectory analyses were conducted using two distinct initialization levels to verify robustness (see supplementary file): (1) Condensation level: Derived from event-specific in-situ temperature and relative humidity, this level represents the altitude at which water vapor condensation likely occurs and, therefore, corresponds closely to the effective cloud base. The mean heights were 3143 m a.m.s.l. at Yadong (153 m a.g.l.) and 5396 m a.m.s.l. at Ali (1126 m a.g.l.). (2) 500 hPa: The second trajectory set was initiated at the 500 hPa pressure level (mid-troposphere). This level was selected to ensure consistency with the 500–200 hPa used for calculation of vertically integrated water vapor fluxes, minimizing potential discrepancies between trajectory-derived pathways and flux-based transport diagnostics.
We also used ERA5 reanalysis data to calculate integrated water vapor flux from 500 to 200 hPa above the Yadong and Ali sites on rainy days during the study period. ERA5 data, provided by the European Centre for Medium-Range Weather Forecasts (ECMWF, https://cds.climate.copernicus.eu/eu/, last access: 4 February 2025), include specific humidity (q), zonal wind (u), and meridional wind (v) components, and have a spatial resolution of 0.25° × 0.25° and temporal resolution of 1 h. These data were used to calculate the integrated water vapor flux (Q) using:
where g is gravitational acceleration, while Ps and Pt are surface pressure and 200 hPa pressure, respectively.
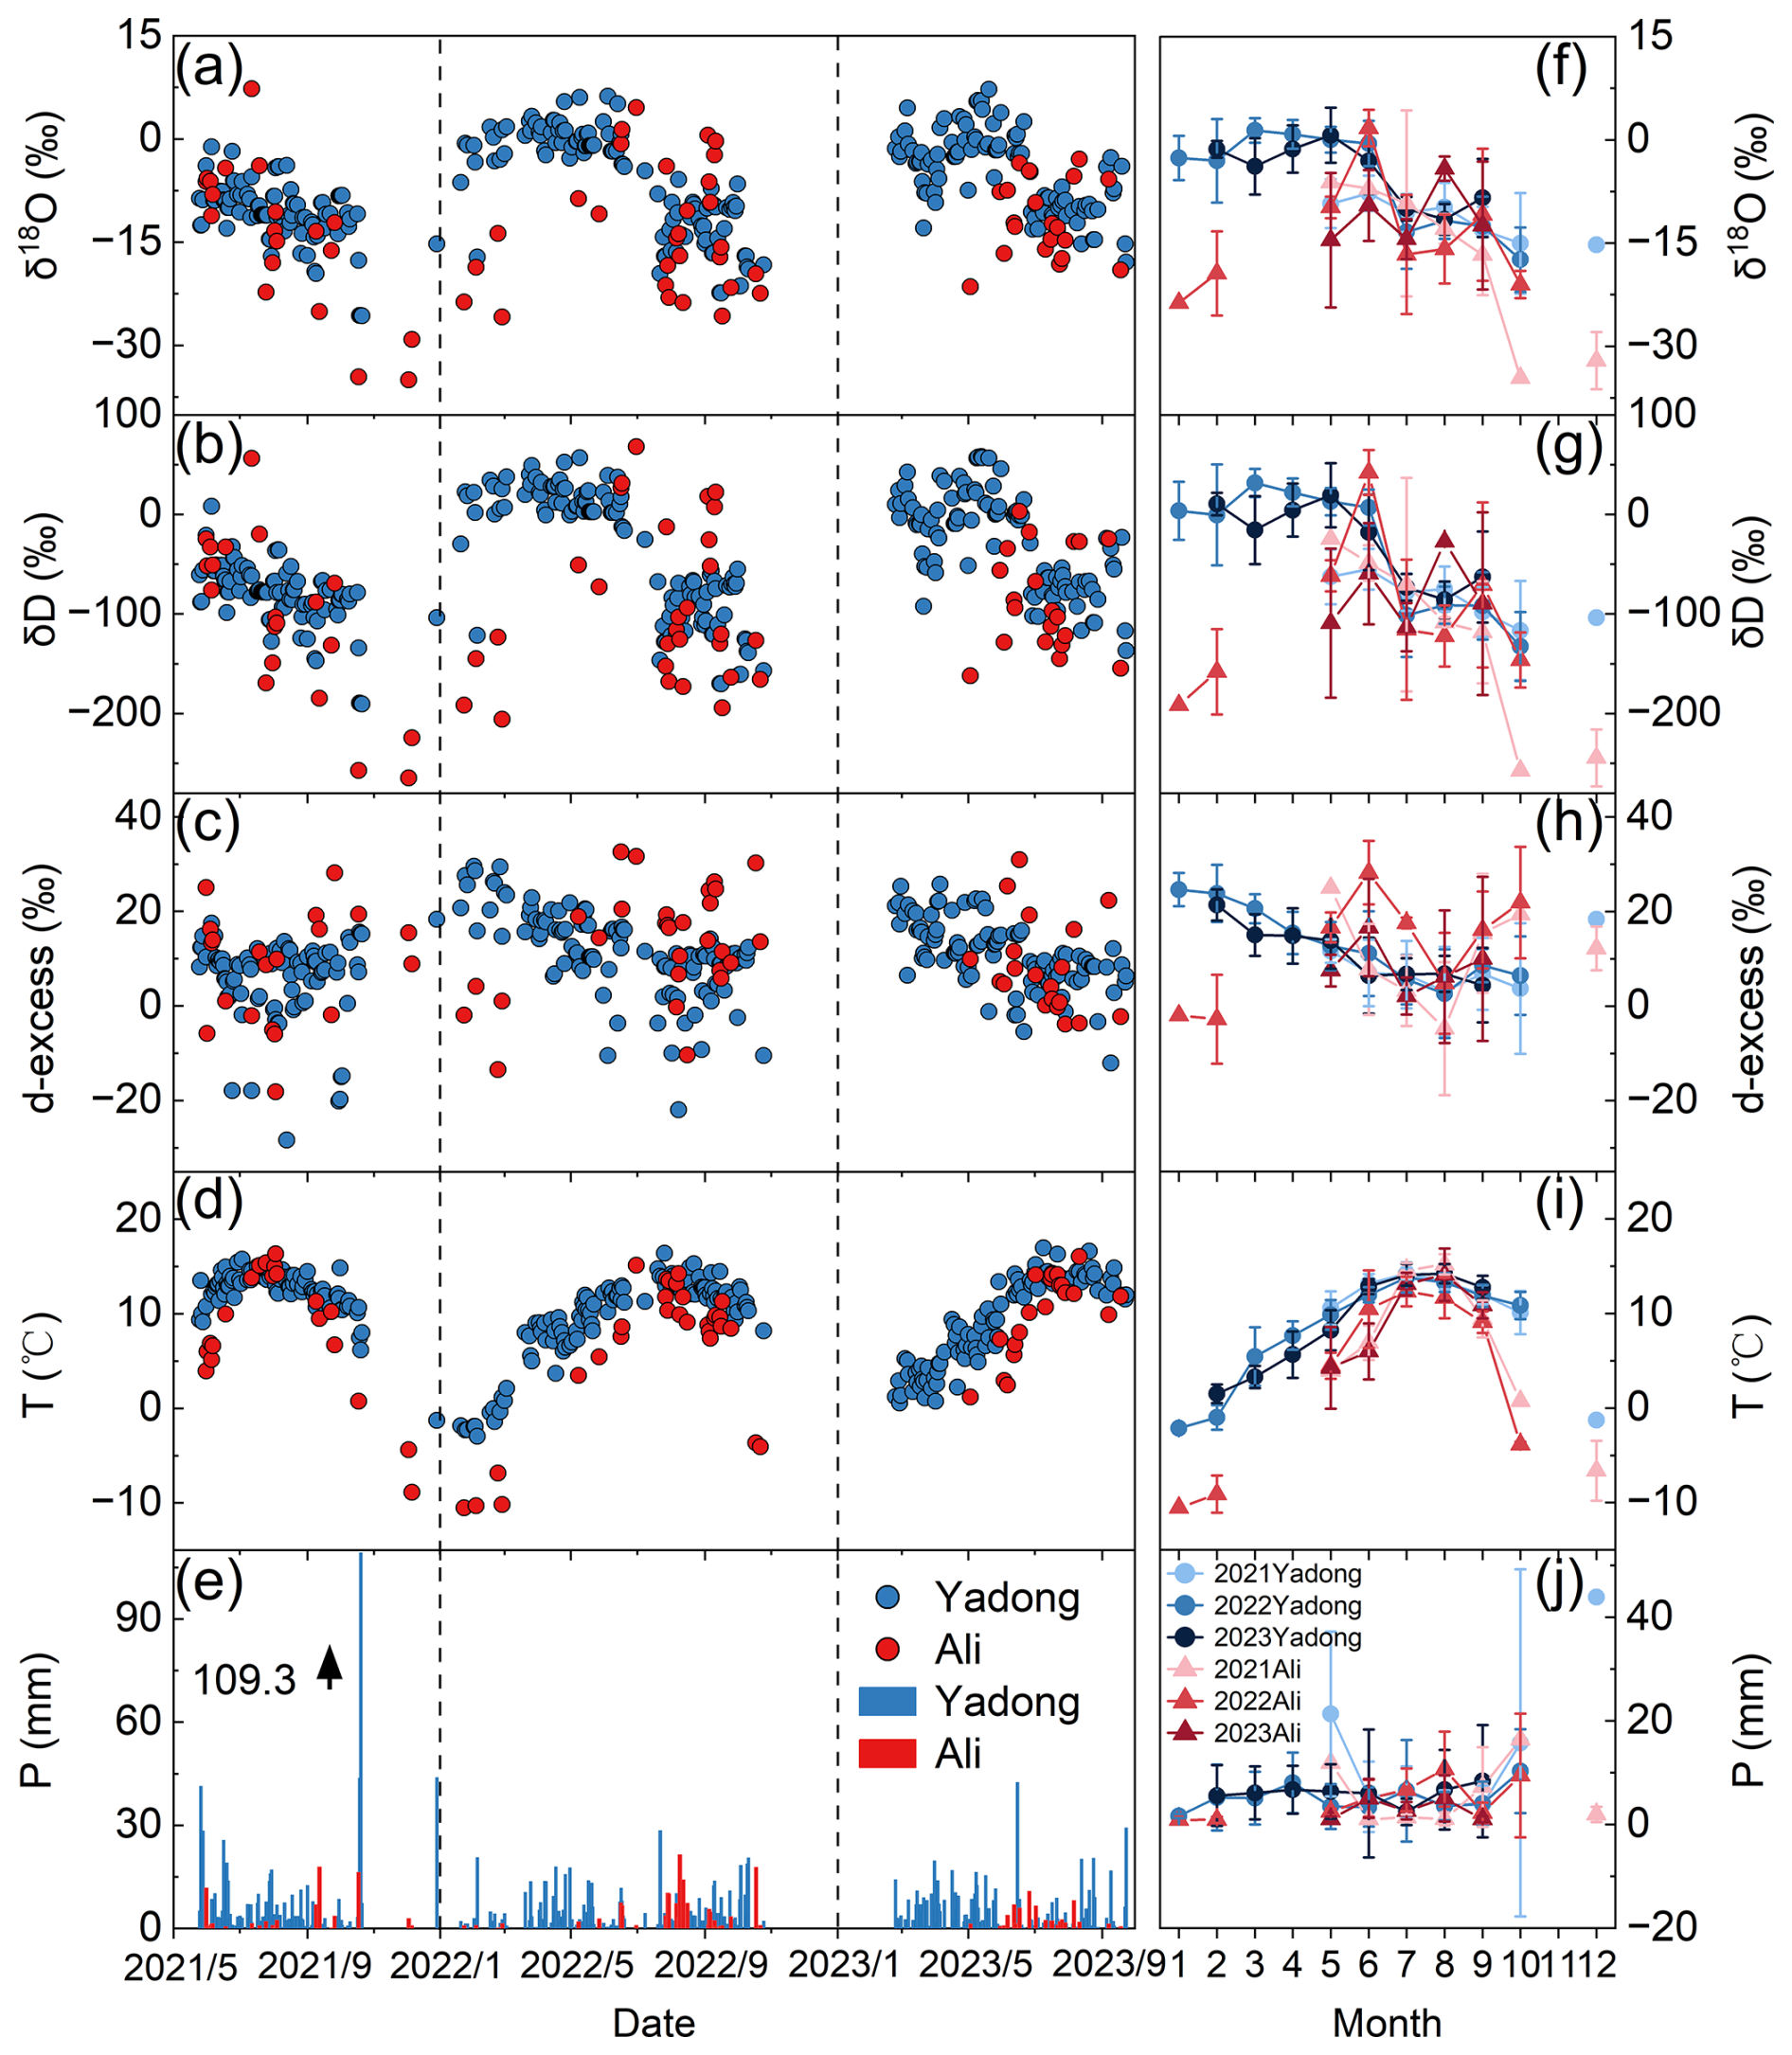
Figure 2Temporal variations of daily and monthly precipitation stable isotopes (δ18O, δD, d-excess) and local meteorological conditions (temperature, precipitation amount) at Yadong and Ali from May 2021 to September 2023. (a, f) Daily and monthly variations in δ18O. (b, g) same as (a) and (f), but for δD. (c, h) same as (a) and (f), but for d-excess. (d, i) same as (a) and (f), but for temperature. (e, j) same as (a) and (f), but for precipitation amount.
3.1 Temporal Variability of Precipitation Stable Isotopes
Both Yadong and Ali exhibit remarkable seasonal variations in temperature and precipitation. Temperatures at both sites follow a unimodal pattern (Figs. 1b, 2d and i), peaking in July during the monsoon season at 14.1 °C (Yadong) and 13.3 °C (Ali), respectively, and reaching their lowest values in January during the non-monsoon season at −2.1 °C (Yadong) and −10.5 °C (Ali). Also seasonal precipitation patterns differ significantly between the two sites (Figs. 1b, 2e and j), with Yadong receiving substantially higher annual precipitation than Ali (764.8 vs. 105.6 mm). Precipitation at Ali exhibits a strong peak located within the monsoon season (August), accounting for 70 % of its annual total. In contrast, the precipitation pattern at Yadong is bimodal, with two peaks in April (pre-monsoon, 118.2 mm, 15.5 % of annual total) and October (post-monsoon, 127.8 mm, 16.7 % of annual total).
Yadong exhibits a pronounced bimodal precipitation regime that exerts seasonally distinct controls on the isotopic composition of precipitation (δ18O and δD; Figs. 1b and 2e). During October, which corresponds to the primary precipitation maximum, extreme rainfall events (e.g., 109.3 and 43.7 mm d−1) dominate the monthly total and induce a strong amount effect, reflected by a statistically significant negative relationship between precipitation amount and isotopic composition (R2=0.36). As a result, October records the most depleted monthly mean isotope values ( ‰; δD = −123.4 ‰), consistent with enhanced rainout and progressive isotopic depletion during intense convective precipitation. In contrast, April represents a secondary precipitation peak characterized by frequent but weak rainfall events (0.4–18.0 mm d−1). Despite relatively high cumulative precipitation, the monthly mean isotope values are anomalously enriched ( ‰; δD = 13.2 ‰). This enrichment indicates that isotopic variability during April is not primarily governed by the amount effect. Instead, it likely reflects the dominant influence of local surface evaporation and sub-cloud kinetic fractionation, which preferentially enrich heavy isotopes under warm and relatively dry pre-monsoonal conditions. These contrasting isotopic responses highlight the seasonally varying balance between large-scale moisture condensation and local evaporative processes in shaping precipitation isotope signals over the southern TP.
Both Yadong and Ali exhibit a distinct three-stage isotopic cycle in response to monsoon evolution: δ18O and δD increase during the pre-monsoon, moderately deplete during monsoon development, and reach their lowest values during the post-monsoon season (Fig. 2a–b, Table S2). For instance, δ18O at Yadong decreases from −2.7 ‰ during the pre-monsoon to −10.7 ‰ during the mature monsoon, reaching −22.9 ‰ at the end of the monsoon, before rising to −9.6 ‰ under westerly influence. Ali follows a similar temporal variation, but with more pronounced extremes (from −8.4 ‰ to −26.7 ‰).
Notably, a large number of positive values of δ18O and δD are observed at both sites, particularly at Yadong (Fig. 2a–b). These enriched values mainly occurred during the pre-monsoon and westerly-dominated seasons. Such enrichment likely results from local moisture recycling and the intrusion of dry continental westerly winds. These positive δ18O and δD values therefore indicate precipitation events dominated by local recycling, westerly winds or evaporative continental moisture, contrasting with the depleted signatures of ISM moisture (Adhikari et al., 2020; Wang et al., 2019).
Both sites exhibit similar seasonal d-excess pattern (Fig. 2c, Table S2). At Yadong, d-excess is elevated during the pre-monsoon (15.3 ‰), lowest during the peak monsoon (6.7 ‰), and then increases again during the post-monsoon and westerly periods (13.1 ‰ and 19.9 ‰, respectively). Similarly, Ali shows high d-excess during the pre-monsoon (20.9 ‰), a decline during the monsoon (14.0 ‰), a peak in the post-monsoon (24.7 ‰), whereas the lowest values during the westerlies (−1.5 ‰) may be attributed to sporadic precipitation events. These variations reflect shifts in moisture sources and the humidity dependence of kinetic fractionation – higher d-excess values are associated with low-humidity sources such as continental or recycled vapor, whereas lower d-excess values correspond to humid or oceanic air masses (Merlivat and Jouzel, 1979; Gat and Matsui, 1991). Ali shows greater amplitude in d-excess changes, especially under westerly influence, indicating a higher sensitivity to shifts between continental and maritime moisture regimes.
Interannual anomalies further highlight the influence of moisture origin and thermal regimes (Fig. 2f, h). At Yadong, pre-monsoon (May–June) δ18O was more depleted in 2021 (−9.3 ‰ and −7.8 ‰) but shifted to more enriched values in 2022 (0.0 ‰ and −0.5 ‰) and 2023 (0.7 ‰ and −3.1 ‰), despite only minor changes in d-excess. This indicates enhanced local recycling or warmer vapor source conditions in the latter years. At Ali, δ18O peaked in June 2022 at 1.7 ‰ (compared to −7.1 ‰ in 2021 and −9.5 ‰ in 2023), while in October 2021, δ18O dropped to −34.6 ‰ (vs. −21.0 ‰ in 2022). These fluctuations correspond to d-excess maxima in mid-summer 2022 (28.2 ‰ and 17.6 ‰) and a minimum in August 2021 (−4.8 ‰). These episodic enrichments and depletions probably result from variations in influence of large-scale mode (ENSO), which modulates the humid ISM and the drier westerly regimes, aligning with documented shifts in moisture transport over the TP (Yao et al., 2012).
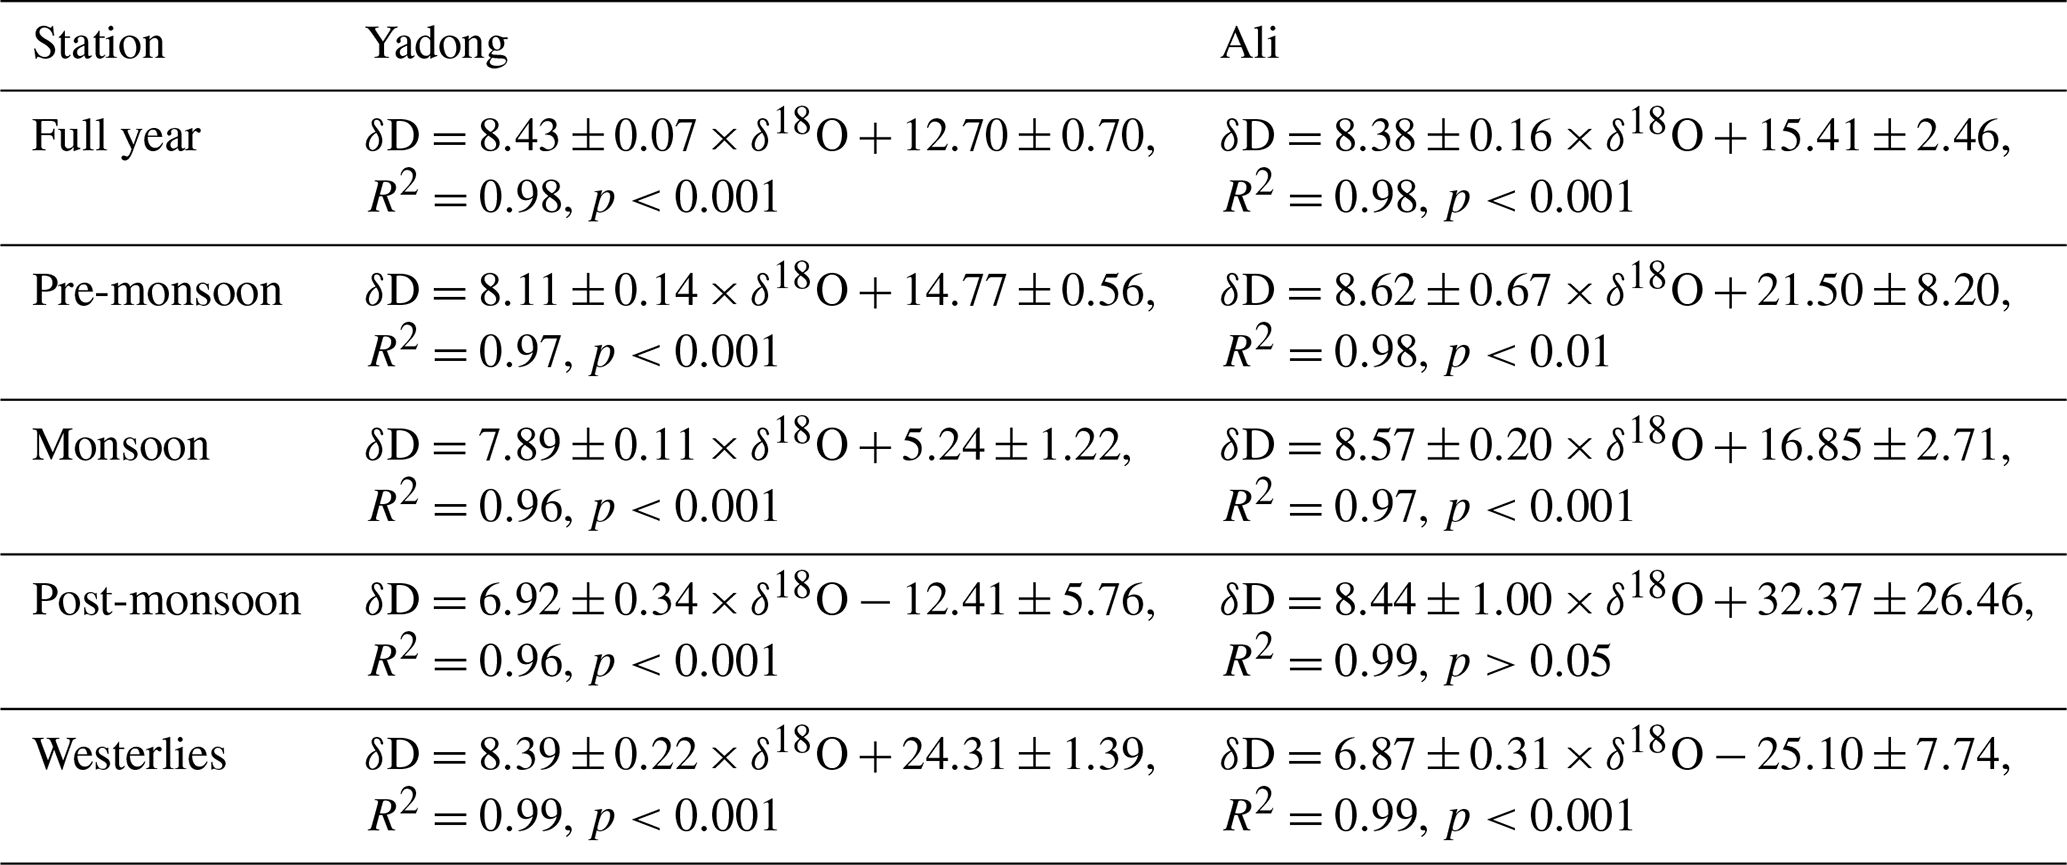
Table 1Local Meteoric Water Line (LMWL) for Yadong and Ali, including coefficient of determination (R2) and p value (H0: no linear relationship between δ18O and δD).
3.2 The Local Meteoric Water Line
We used total least squares (TLS) regression to calculate all LMWLs, accounting for measurement precisions to estimate slope and intercept errors. As shown in Fig. S2 and Table 1, the annual LMWL slope and intercept at Yadong (8.43±0.07 ‰ and 12.70±0.70 ‰, respectively) are higher than those of the GMWL (8 ‰ and 10 ‰), which may reflect strong vapor recycling. During the pre-monsoon, the slope (8.11±0.14) approximates that of the GMWL, while the intercept is higher (14.77±0.56 ‰), suggesting a moisture source with relatively low humidity compared to the monsoon and post-monsoon seasons. During the monsoon, the slope (7.89±0.11) approximates that of the GMWL, while the intercept is lower (5.24±1.22 ‰), suggesting humid moisture sources. During the post-monsoon, both the slope (6.92±0.34) and intercept ( ‰) fall below the GMWL, indicating influence from sub-cloud evaporation and humid moisture sources. In contrast, the LMWL slope and intercept during the westerlies season (8.39±0.22 and 24.31±1.39 ‰) exceed those of the GMWL, likely due to enhanced moisture recycling. These findings are consistent with previous reports, such as an annual LMWL slope and intercept of 8.4 ‰ and 12.02 ‰ at Yadong (Axelsson et al., 2023). Notably, the LMWL at Yadong during the monsoon closely resembles that of Naqu (slope = 7.67, intercept = 1.3 ‰) in the central TP (Li et al., 2023).
At Ali, the LMWL slopes (8.38±0.16, 8.62±0.67, 8.57±0.20, and 8.44±1.00) and intercepts (15.41±2.46 ‰, 21.50±8.20 ‰, 16.85±2.71 ‰, and 32.37±26.46 ‰) are consistently higher than the GMWL during the annual, pre-monsoon, monsoon, and post-monsoon season, suggesting dominance of moisture recycling. Although the linear fit is strong (R2=0.99) during the post-monsoon season, the result is not statistically significant (p>0.05) due to the small sample size. However, during the westerlies season, the slope (6.87±0.31) and intercept ( ‰) are substantially lower, indicating strong sub-cloud evaporation and humid moisture sources. This may result from synoptic transport from oceanic sources, which is discussed in detail in Sect. 3.4.
3.3 The Influence of Local Meteorological Factors
At Yadong, δ18O exhibits a significant negative correlation with temperature throughout the year (slope , , p<0.001, H0: no linear correlation). Seasonally, this relationship is negative from the late pre-monsoon to post-monsoon (, p<0.001), but shifts to a significant positive correlation from the westerlies to the early pre-monsoon of the following year (R=0.51, p<0.001), indicating a clear seasonal reversal in the temperature effect. At Ali, δ18O is positively correlated with temperature year-round (slope = 0.30, R=0.39, p<0.001), with the strongest correlation observed from the post-monsoon to the pre-monsoon season of the following year (R=0.79, p<0.001).
In terms of precipitation, δ18O at Yadong is significantly negatively correlated year-round (slope , , p<0.001), and particularly from the late pre-monsoon to post-monsoon (, p<0.001), reflecting a typical amount effect. This correlation intensifies during the westerlies to early pre-monsoon season (, p<0.001). At Ali, a significant negative correlation between δ18O and precipitation is only observed during the monsoon season (, p<0.05), associated with the missing of temperature effect.
Regarding wind speed, δ18O at Yadong shows a weak negative correlation over the full year (slope , , p<0.05), whereas at Ali, it is significantly positively correlated year-round (slope = 0.04, R=0.34, p<0.01), with the strongest relationship during the post-monsoon to pre-monsoon (R=0.66, p<0.001), associated with the strongest temperature effect (Fig. S3).
These results indicate that Yadong is predominantly influenced by the monsoon from the late pre-monsoon to post-monsoon season, characterized by a strong amount effect. From the westerlies to early pre-monsoon, it is mainly affected by westerly winds and local moisture recycling, exhibiting a significant temperature effect. In contrast, Ali is primarily influenced by the monsoon during the monsoon season, showing a clear amount effect, and by westerlies and local vapor recycling from the post-monsoon to pre-monsoon, where the temperature effect becomes significant. These observations are consistent with previous studies reporting a significant amount effect in the southern TP, including at Bomi and Lhasa (Gao et al., 2011), and a dominant temperature effect in the northwestern TP, such as in the Bagrot Valley (Wang et al., 2019).
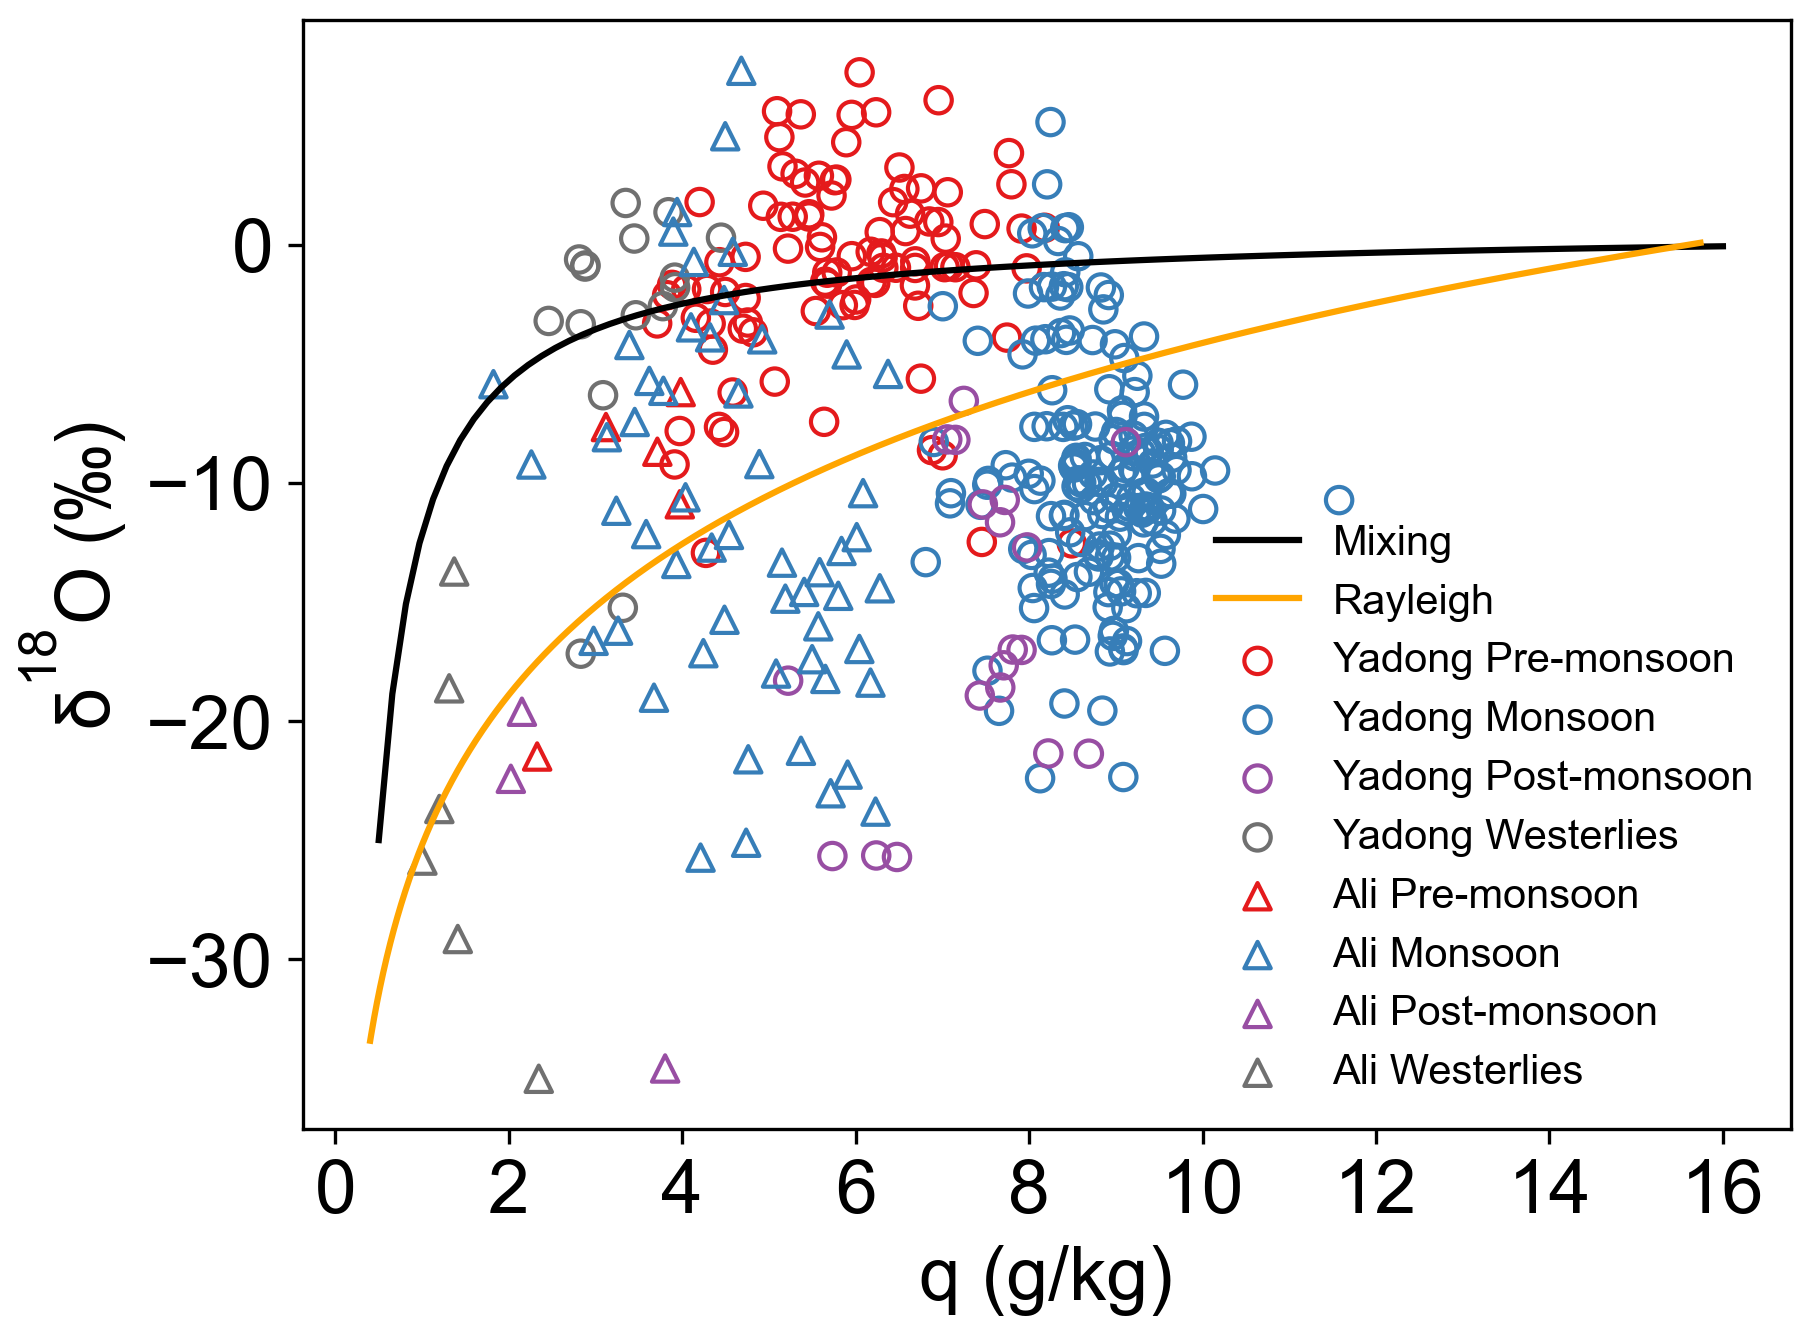
Figure 3Scatter plot of daily δ18O versus q at Yadong and Ali, with mixing and Rayleigh fractionation curves. Black and orange lines represent the mixing and Rayleigh fractionation curves, respectively. The Rayleigh starting point is set at −0.07 ‰ and 16 g kg−1 at 25 °C, assuming equilibrium conditions for precipitation from sea-level air with 80 % relative humidity. The mixing curve uses the same wet end-member; the dry end-member is set at −25 ‰ and 0.5 g kg−1.
3.4 The Influence of Moisture Transport Processes
The q–δ18O relationship effectively reflects seasonal controls on precipitation isotopes at both sites (Fig. 3). At Yadong, during the pre-monsoon and westerlies seasons, most δ18O values lie above the mixing curve, indicating substantial influence from local surface evaporation. In contrast, during the monsoon and post-monsoon, most δ18O values fall below the Rayleigh curve, suggesting dominant effects of sub-cloud evaporation and rainout effect, consistent with prior LMWL-based interpretations. Some monsoon-season values fall between the Rayleigh and mixing curves, reflecting contributions from moisture mixing process.
At Ali, δ18O values during the pre-monsoon, monsoon, and westerlies seasons fall between the Rayleigh and mixing curves, indicating joint control by moisture mixing and precipitation processes. Notably, during the monsoon, post-monsoon, and westerlies seasons, many δ18O values fall below the Rayleigh curve, suggesting sub-cloud evaporation is also influential, consistent with Ali's LMWL during these seasons.
The isotope–humidity contrast between the two sites is clearest during the westerlies season: δ18O averages −9.6 ‰ at Yadong and −21.8 ‰ at Ali, with corresponding q values of 3.3 and 1.4 g kg−1. In contrast, during the monsoon season, δ18O averages converge (−10.7 ‰ at Yadong vs. −13.3 ‰ at Ali) with consistent magnitudes, but q is nearly double at Yadong (8.8 vs. 4.7 g kg−1).
In summary, monsoon-season δ18O at both sites reflects combined influences of sub-cloud evaporation, mixing, and rainout effect. Under westerly conditions, δ18O at Yadong is more influenced by local evaporation, while δ18O at Ali is influenced by Rayleigh-type fractionation and moisture mixing, leading to consistently lower δ18O values.
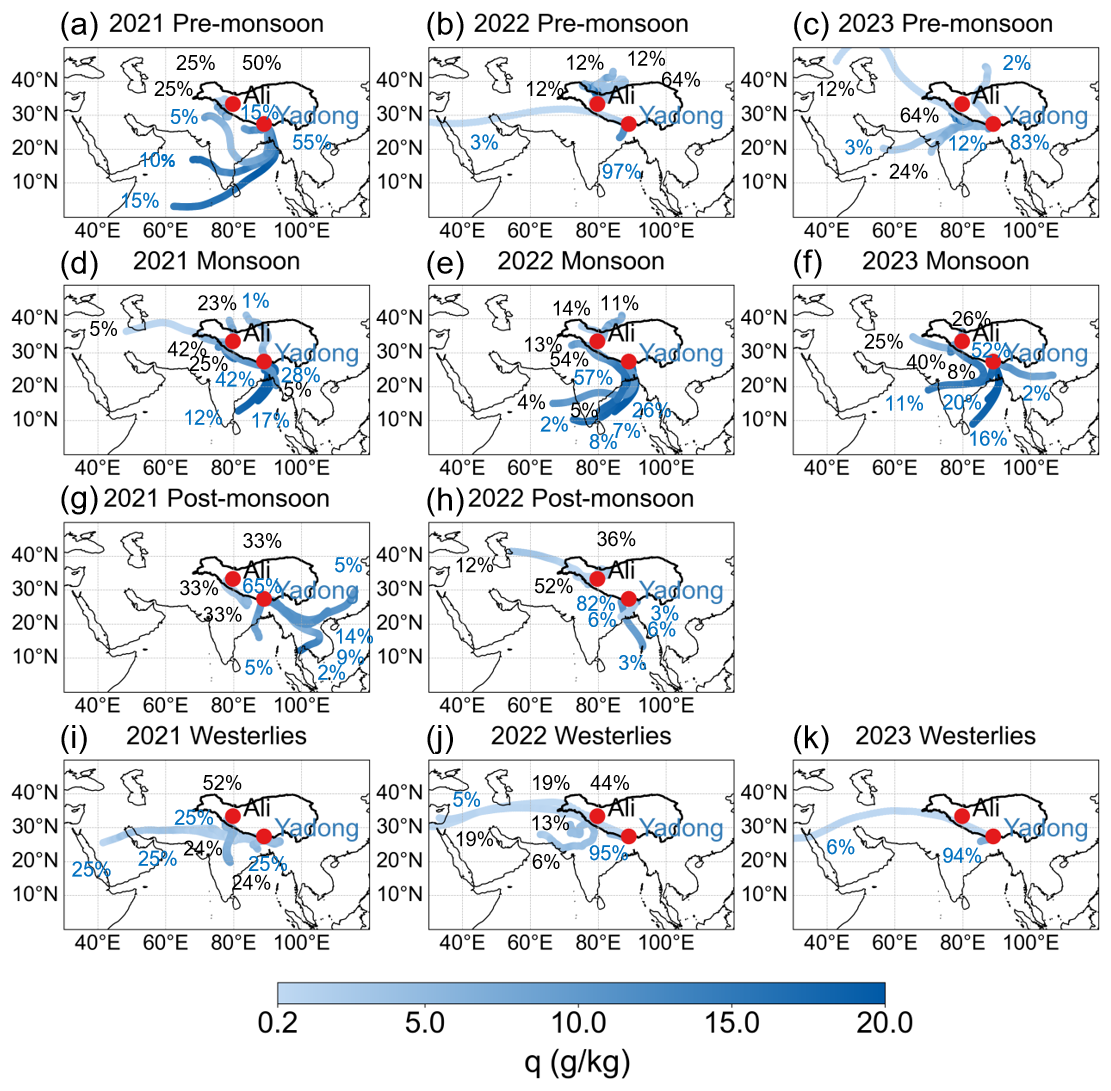
Figure 4Clustered 120 h backward trajectories for air masses arriving 200 m above ground level at Yadong and Ali on rainy days across different seasons (pre-monsoon, monsoon, post-monsoon, westerlies season) from May 2021 to September 2023 based on the HYSPLIT model, with specific humidity value along trajectories and the proportion of each trajectory cluster. Red dots show the locations of both sites. Trajectory colors indicate the values of q, while numbers indicate the proportion of clustered trajectories to total trajectories at Yadong (blue) and Ali (black).
δ18O and d-excess in precipitation at Yadong and Ali during our observation periods reveal consistent distribution ranges and diurnal variability during the monsoon season, implying consistent moisture origins. To delineate seasonal and interannual insight into moisture sources and transport pathways variability, we employed the HYSPLIT model to compute 120 h backward trajectories for rainy days (Gao et al., 2013; Dai et al., 2021), covering four climatological intervals: pre-monsoon, mature monsoon, post-monsoon, and westerly-dominated seasons. During late May 2021 (pre-monsoon), moisture transport at Yadong exhibited atypical characteristics for this season. The site experienced enhanced high-humidity southwesterly moisture flux originating primarily from the BOB and the AS, contributing approximately 55 % and 25 % of the total moisture supply, respectively (Fig. 4a). This anomalous moisture transport was associated with relatively depleted precipitation isotope values, with a mean δ18O of −9.3 ‰. In contrast, in May 2022–2023, high-humidity local surface evapotranspiration (97 % and 83 % of total contribution, respectively) combined with low-humidity westerly (both are 3 % of total contribution) produced a bit enriched δ18O average (Fig. 4b–c). During the mature monsoon season, in 2021–2022 (Fig. 4d–e), high-humidity ISM (57 % and 43 % of total contribution, respectively) combined with high-humidity local surface evapotranspiration (42 % and 57 % of total contribution, respectively) consistently supplied moisture to Yadong, while in 2023 (Fig. 4f), moisture mainly contributed from the high-humidity BOB (36 % of total contribution) and moist Indian subcontinent as well as local recycling (63 % of total contribution) resulted in δ18O average of −10.7 ‰ and d-excess of 6.7 ‰. During the post-monsoon season (Fig. 4g–h), the contribution from high-humidity ISM (7 % and 18 % of total contribution in 2021 and 2022, respectively) and East Asian monsoon (28 % of total contribution in 2021) resulted in depleted δ18O to −22.9 ‰ and raised d-excess to 13.1 ‰. During the westerlies season (Fig. 4i–k), the higher contribution from low-humidity westerly (75 % of total contribution) in 2021 resulted in depleted δ18O to −15.2 ‰ and d-excess to 18.3 ‰, compared to those in 2022 and 2023.
Ali exhibited distinct seasonal patterns. During the pre-monsoon season, in 2021–2022 (Fig. 4a–b), moisture mainly contributed from high-humidity local recycling, while in 2023 (Fig. 4c), Ali received additional moisture from the low-humidity westerly (12 % of total contribution) and AS (24 % of total contribution), resulting in δ18O average of −8.4 ‰ and d-excess of 20.9 ‰. During the monsoon, in 2021–2022 (Fig. 4d–e), high-humidity ISM (5 % and 9 % of total contribution, respectively) combined with high-humidity local surface evapotranspiration and moist Indian subcontinent (67 % and 54 % of total contribution, respectively) consistently supplied moisture to Ali, while in 2023 (Fig. 4f), moisture mainly contributed from the high-humidity eastern Indian subcontinent and local circulation (74 % of total contribution), resulting in δ18O averaged of −13.3 ‰ and d-excess of 14.0 ‰. In October 2021 (Fig. 4g), Ali was influenced by dry northeastern Indian sources, producing extremely depleted δ18O of −34.6 ‰, compare to −21.0 ‰ in October 2022 (Fig. 4h), when moisture mainly contributed from dry westerlies (12 % of total contribution) and western Tibet (88 % of total contribution). During the westerlies season (Fig. 4i–j), Ali received both high-humidity moisture from Indian sources and dry long-range continental moisture via westerly winds, yielding a markedly depleted average δ18O of −21.8 ‰ and moderate d-excess of −1.5 ‰.
Trajectories at the condensation level and at 500 hPa confirm that the dominant large-scale moisture sources (ISM during the monsoon and the westerly during the non-monsoon season) are consistently detected across arrival heights. However, differences appear in the identification of secondary or weak signals, such as local recycling and weak ISM intrusion, particularly during transitional periods. These discrepancies likely reflect the combined influence of vertical moisture stratification, atmospheric stability, and the complex topography surrounding Yadong and Ali.
At Yadong, the valley terrain and relatively low elevation allow local moisture to remain confined within the planetary boundary layer (PBL). As a result, condensation-level trajectories miss weak westerly intrusions during the non-monsoon season (Fig. S4b–c and i–k), possibly because shallow boundary-layer conditions and topographic sheltering enhance the relative contribution of local moisture signals, while 500 hPa trajectories, representing the mid-troposphere, tend to underrepresent locally recycled moisture (Fig. S5b–c, g–h and i–k). During the monsoon (Figs. S4d–f and S5d–f), strong ISM inflow penetrates the full tropospheric column, leading to consistent source identification across all heights.
At Ali, the high-elevation arid basin favors limited local recycling and weak low-level monsoon penetration. Consequently, condensation-level trajectories appear more sensitive to pre-monsoon (Fig. S4c) and post-monsoon (Fig. S4h) seasons, when weak winds and enhanced surface-driven convection may amplify short-range continental moisture contributions relative to the westerly. 500 hPa trajectories are dominated by the large-scale westerly and may miss weak ISM-related moisture (Fig. S5d–f) or local sources (Fig. S5a–c) confined to the lower PBL. Nonetheless, during the westerly-dominated season (Figs. S4i–j and S5i–j), all trajectory heights recover consistent source patterns.
Overall, these findings suggest that differences among trajectory heights mainly arise from the interplay between boundary-layer confinement of local moisture and the strength of large-scale circulation. Trajectories at 200 m a.g.l. provide a balanced representation of both large-scale transport and boundary-layer moisture, supporting their use as the primary framework in our analysis.
Thus, monsoon-season convergence of δ18O values (−10.7 ‰ at Yadong, −13.3 ‰ at Ali) reflects a shared ISM moisture source, whereas the westerlies-season divergence of δ18O is largest (−9.6 ‰ at Yadong, −21.8 ‰ at Ali) due to differing moisture regimes.
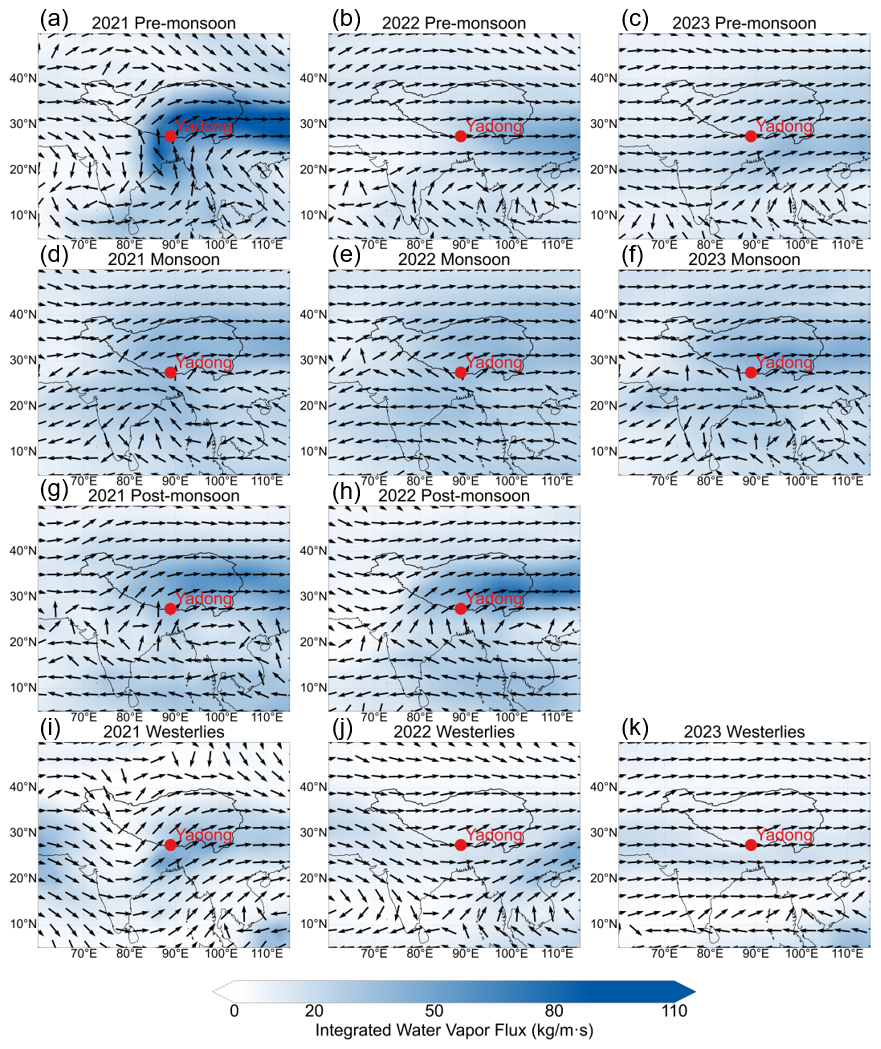
Figure 5The magnitude and direction of seasonal mean integrated water vapor flux (500–200 hPa) over Yadong on rainy days from 25 May 2021 to 23 September 2023 (308 d) across seasons using ERA5 reanalysis data (the blue shading and the direction of the black arrows indicate the magnitude and direction of water vapor flux).
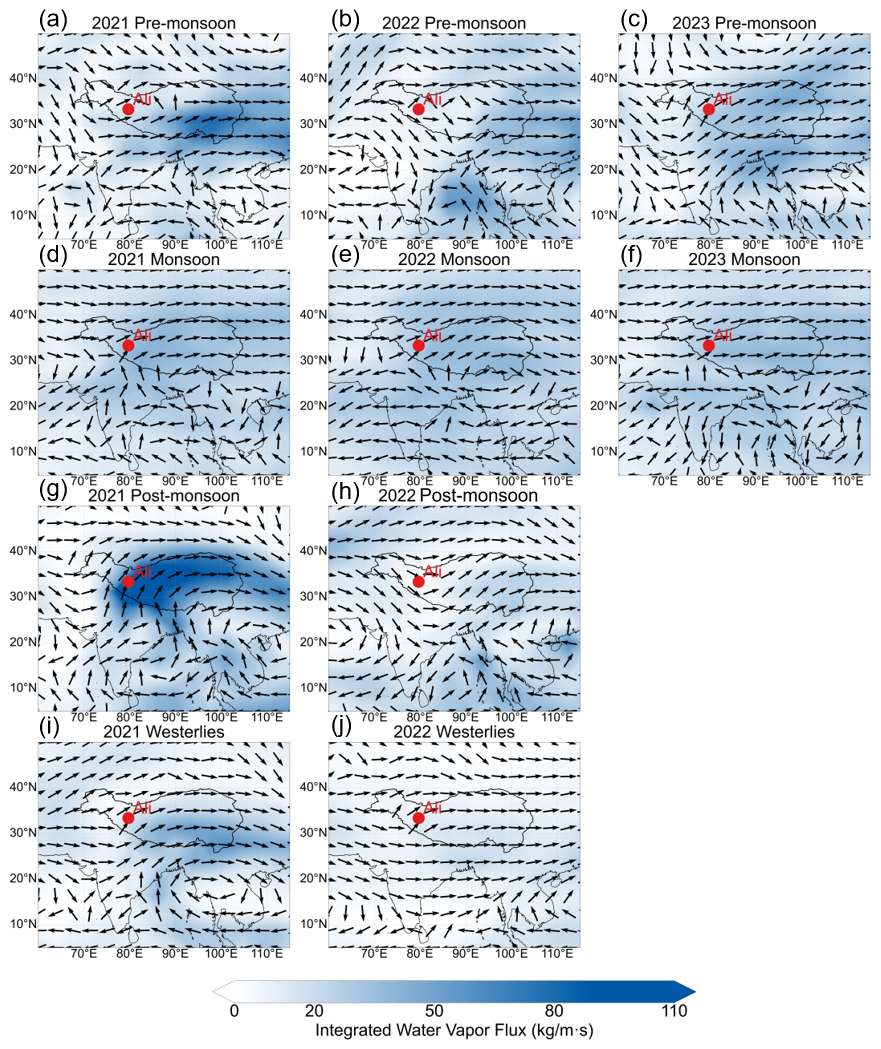
Figure 6The magnitude and direction of seasonal mean integrated water vapor flux (500–200 hPa) over Ali on rainy days from 31 May 2021 to 18 September 2023 (69 d) across seasons using ERA5 reanalysis data (the blue shading and the direction of the black arrows indicate the magnitude and direction of water vapor flux).
Figures 5 and 6 show the seasonal mean vertically integrated water vapor flux in the 500–200 hPa layer on rainy days at Yadong and Ali, respectively, illustrating the seasonal variability in both the magnitude and direction of moisture transport associated with precipitation events at the two sites. The specific rainy days included in the analysis are listed in Table S3. At Yadong, southwesterly moisture transport dominated during late May (pre-monsoon) 2021, with the maximum vertically integrated water vapor flux reaching 77.5 kg m−1 s−1 (Fig. 5a), accompanied by relatively depleted precipitation isotopic values ( ‰). In 2022 and 2023, Yadong was controlled by dry westerly, resulting in a reduction in water vapor flux to 24.6 kg m−1 s−1 (Fig. 5b) and 23.3 kg m−1 s−1 (Fig. 5c), respectively, and corresponding increase in the average δ18O values of 9.3 ‰ and 10.0 ‰ compared to 2021. During the monsoon season, the dominant circulation shifted from westerlies to monsoon, with water vapor flux increasing to 32.5 kg m−1 s−1, and the average δ18O value decreasing by ∼8.0 ‰ relative to the pre-monsoon season (Fig. 5d–f). In the post-monsoon season, water vapor flux reached a seasonal high of 39.6 kg m−1 s−1 (Fig. 5g–h), while the average δ18O decreased by an additional 12.2 ‰. During the westerlies season, westerly carried dryer moisture to this region, resulting in a reduction in water vapor flux to 22.2 kg m−1 s−1 (Fig. 5i–k), and a 13.3 ‰ increase in average δ18O values compared to the post-monsoon.
During the pre-monsoon period (Fig. 6a–c), Ali was dominated by the westerly, with a relatively low water vapor flux of 18.6 kg m−1 s−1 and an average δ18O value of −8.4 ‰. During the monsoon season (Fig. 6d–f), the region transitions to monsoon dominance, resulting in an increase in water vapor flux to 36.5 kg m−1 s−1 and a corresponding decrease in the average δ18O by 4.9 ‰. During the post-monsoon season, substantial interannual variability was observed. In 2021 (Fig. 6g), the region remained under the monsoon influence, with the maximum water vapor flux reaching 98.6 kg m−1 s−1. In contrast, the region shifted to westerly dominance in 2022 (Fig. 6h), leading to a sharp decline in water vapor flux to 5.5 kg m−1 s−1, and an increase in the average δ18O of 13.6 ‰ compared to 2021. During the westerlies season, persistent westerly influence resulted in a further decrease in water vapor flux to 11.5 kg m−1 s−1, accompanied by an increase in average δ18O of 4.9 ‰ relative to the post-monsoon season.
Both methods consistently indicate that Yadong is dominated by monsoon-derived moisture during the pre-monsoon (2021), monsoon, and post-monsoon seasons, and by westerly-sourced moisture during the westerlies season. In contrast, Ali is influenced by monsoon moisture during the monsoon season and by westerly moisture during the westerlies season. These consistent results demonstrate the robustness of our moisture source attribution.
These results demonstrate that seasonal and interannual variations in ISM-westerly patterns exert strong control over both moisture transport and precipitation isotope compositions at both Yadong and Ali. The systematic inverse relationship between water vapor flux and δ18O values reflects the fundamental influence of moisture source regions and transport pathways on isotopic signatures, with monsoon-sourced moisture consistently producing higher flux and more depleted isotopic signatures compared to westerly-transported moisture. The pronounced interannual variability observed during the post-monsoon season, particularly the contrasting circulation patterns between 2021 and 2022, highlights the sensitivity of precipitation stable isotopes to large-scale atmospheric dynamics.
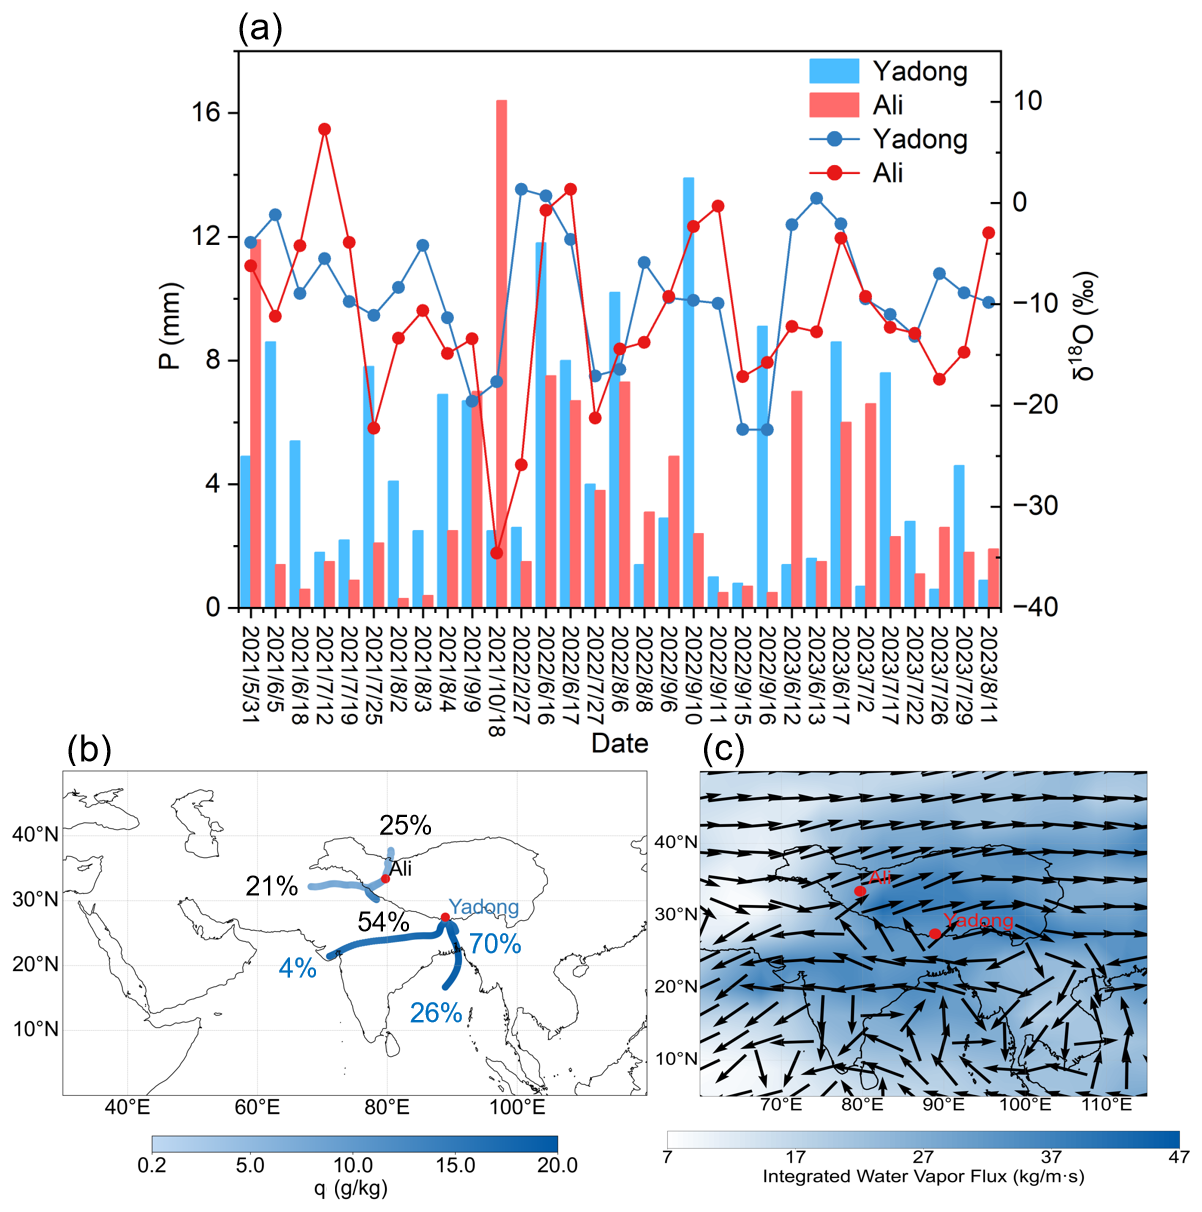
Figure 7Comparative analysis for simultaneous rainy days at Yadong and Ali, including δ18O and precipitation amount, backward trajectories, and mean integrated water vapor flux (500–200 hPa) during the monsoon season. (a) δ18O and P on simultaneous rainy days at Yadong and Ali, bars represent precipitation amount and points represent δ18O values; backward trajectories on simultaneous rainy days at Yadong (b) and Ali (c) during the monsoon season; integrated water vapor flux from 500 to 200 hPa on simultaneous rainy days at Yadong (d) and Ali (e) during the monsoon season.
3.5 Moisture Sources on Simultaneous Rainy Days
During the monsoon season, simultaneous precipitation events were recorded on 28 d at both Yadong and Ali, whereas only 3 such days were observed during the non-monsoon season (Fig. 7a). During the monsoon season, the average δ18O values for simultaneous precipitation days at Yadong and Ali were −9.3 ‰ and −9.4 ‰, respectively, with corresponding average d-excess values of 9.2 ‰ and 13.9 ‰. Precipitation amounts at Yadong (137.9 mm) exceeded those at Ali (84.9 mm) by 53 mm, likely resulting from Yadong's more southeastward location and 1280 m lower altitude under the ISM influence.
In contrast, during the non-monsoon season, concurrent precipitation events exhibited a reversal of the monsoon-season pattern. The average δ18O values on concurrent precipitation events were −6.0 ‰ and −22.8 ‰, respectively, with d-excess averages of 10.7 ‰ and 20.7 ‰, and precipitation amounts of 10.0 and 29.8 mm, respectively. The large differences in δ18O (16.8 ‰) and d-excess (10.0 ‰) indicate distinct moisture sources, with Yadong influenced by more local or recycled moisture and Ali influenced by more continental or long-distance transported westerly moisture.
Backward trajectory analysis supports further these findings. During monsoon-season simultaneous events, the ISM transports large amounts of high-humidity moisture to Yadong, along with contributions from local surface evapotranspiration (Figs. 7b and S6). In contrast, Ali's moisture primarily originates from local evapotranspiration (Fig. 7b), supplemented by high-humidity ISM input and smaller contributions from low-humidity westerly winds (Fig. S6), indicating that the ISM simultaneously influences both Yadong and Ali at the synoptic scale. This conclusion is further supported by water vapor flux analysis (Fig. 7c), exhibiting pronounced high flux of 33.0 kg m−1 s−1 at Yadong and 36.2 kg m−1 s−1 at Ali. The strength and coherence of monsoonal moisture transport across both regions highlight the ISM's crucial role in controlling precipitation isotopic signatures during simultaneous events at the southern and western TP.
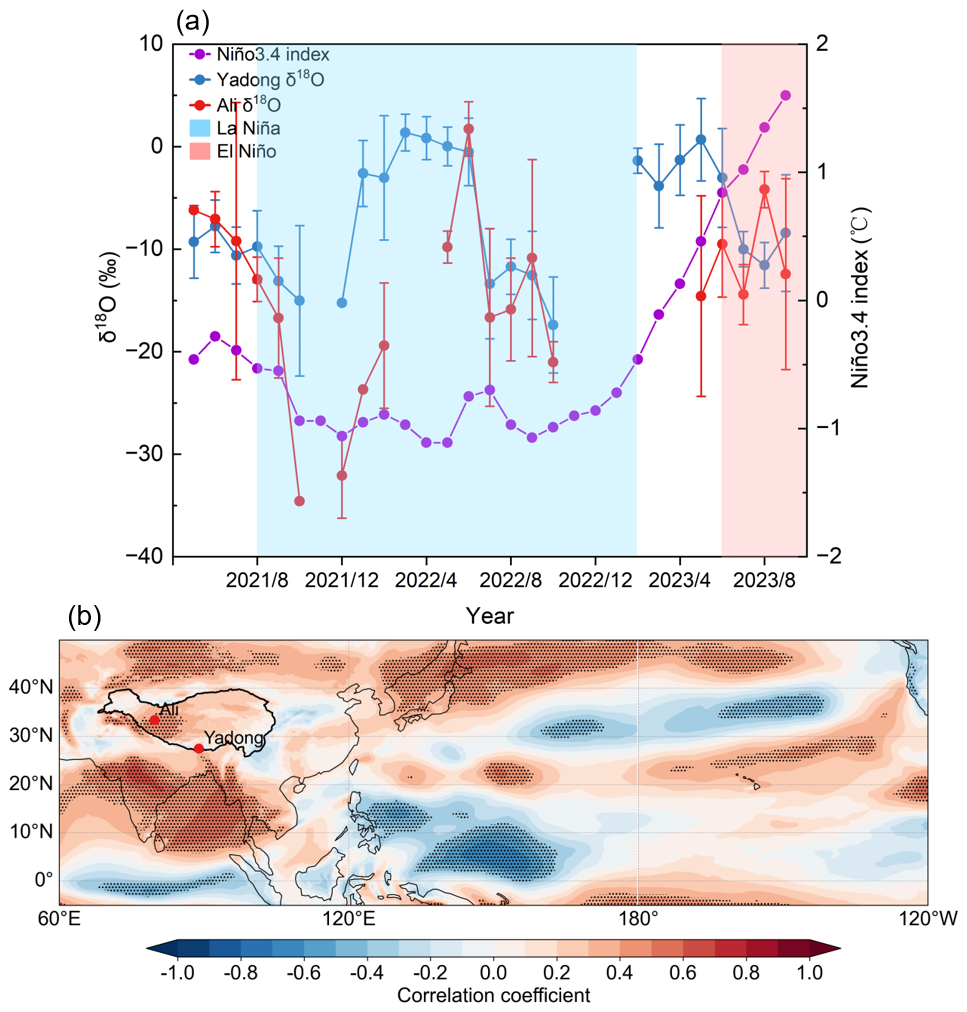
Figure 8Concurrent time series of the monthly Niño 3.4 index and monthly amount-weighted δ18O at Yadong and Ali, and the spatial correlation between the monthly Niño 3.4 index and monthly mean integrated water vapor flux (surface to 200 hPa) from May 2021 to September 2023. (a) Time series of the monthly Niño 3.4 index and monthly amount-weighted δ18O values at Yadong and Ali from May 2021 to September 2023. El Niño and La Niña periods are highlighted in red and blue shading, respectively. (b) Spatial correlation between the monthly Niño 3.4 index and monthly mean integrated water vapor flux (surface to 200 hPa) during the same period. The correlation coefficient reveals regions of enhanced or suppressed moisture transport associated with ENSO phases.
3.6 The Influence of ENSO events
The period from August 2021 to January 2023 was characterized by La Niña conditions, while June to September 2023 coincided with an El Niño phase. Precipitation δ18O values at Yadong and Ali during the monsoon seasons reflect a clear ENSO imprint. During the monsoon season in 2021, average δ18O values at Yadong and Ali were −11.2 ‰ and −17.2 ‰, respectively. During the same period in 2022 (La Niña events), δ18O values are consistent with those in 2021, while in 2023 (El Niño), δ18O increased sharply to −8.9 ‰ at Yadong and −9.1 ‰ at Ali, respectively. The most pronounced increases in δ18O occurred between the La Niña and El Niño monsoon seasons indicate that ENSO noticeably influences the interannual variability of precipitation stable isotopes at both sites, which is consistent with previous studies (Gao et al., 2018) (Fig. 8a).
To further explore the underlying mechanisms, spatial correlation analysis was conducted between the monthly Niño 3.4 index and the monthly mean integrated water vapor flux (surface to 200 hPa) for May 2021 to September 2023 (Fig. 8b). Results show that significant positive correlations (p<0.05, H0: no spatial linear correlation) existed over Ali, the AS, Indian subcontinent, BOB, and Bangladesh. In contrast, significant negative correlations appeared over the equatorial Indian Ocean and western equatorial Pacific, pointing to major shifts in regional moisture transport pathways during ENSO events.
During El Niño events, warm sea surface temperature anomalies (SSTA) develop in the eastern equatorial Pacific, which reduce the east–west SST gradient. This weakens the Walker circulation, and results in westerly wind anomalies in the equatorial Pacific (Bjerknes, 1969). Concurrently, SSTs in the western equatorial Pacific decrease, leading to suppressed surface evaporation and moisture advection, along with anomalously weak convection over that region. In contrast, the region south of the southern TP, including Bangladesh, the BOB, the Indian subcontinent, and the AS, experience increased temperature, enhanced surface evaporation and moisture advection, and anomalous convection, accompanied by low-level easterly wind anomalies (Yao et al., 2024). Together, these anomalies form a zonal–vertical atmospheric circulation pattern (Wang et al., 2024a). Additionally, cooling in the equatorial Indian Ocean suppresses surface evaporation and moisture flux, and weakens southernly wind anomalies toward the TP. These circulation changes result in reduced ISM moisture transport to both Yadong (from 43 % in 2022 to 36 % in 2023) and Ali (from 9 % in 2022 to 0 % in 2023), while contributions of local evapotranspiration and short-distance transport from south moist continental surface increased relatively (from 57 % in 2022 to 63 % in 2023 at Yadong and from 54 % in 2022 to 74 % in 2023 at Ali) (Figs. 4e–f and 8b). This leads to more enriched δ18O values at Yadong and Ali during El Niño years (Cui et al., 2025).
The atmospheric circulation patterns during La Niña events are essentially the inverse of those during El Niño (Cai and Tian, 2016). La Niña strengthens the Walker circulation, with elevated SSTs in the western equatorial Pacific leading to enhanced surface evaporation, increased water vapor flux, and strong anomalous convection. At the same time, SSTs rise in the equatorial Indian Ocean, enhancing surface evaporation and northward moisture advection, resulting in increased ISM moisture transport to both Yadong and Ali. This process contributes to significant δ18O depletion during La Niña events at Yadong and Ali (Figs. 4e–f and 8b).
This study characterized event-based precipitation stable isotopes (δ18O, δD) at Yadong and Ali from May 2021 to September 2023 to investigate climate controls of variability in precipitation stable isotopes on the TP across daily, synoptic, seasonal, and interannual scales. We characterize the influence of shifting moisture sources under westerly and ISM transport regimes, and the differential impact of El Niño and La Niña events on precipitation isotopes.
Our results show that δ18O and δD at Yadong and Ali converge during the monsoon season but diverge sharply during the westerlies season, reaching differences of up to 12.2 ‰ and 118.8 ‰, respectively. While d-excess values remain similar during the pre-monsoon and monsoon seasons, they diverge significantly in the post-monsoon and westerlies seasons, reaching respective differences of 11.6 ‰ and 21.4 ‰.
Our results also show that meteorological controls shift seasonally: (1) precipitation amount effects dominate during monsoon ( to −0.32), while temperature controls prevail during westerly seasons (R=0.51–0.79); (2) during the monsoon, both sites reflect moisture mixing, rainout effect, and sub-cloud evaporation, closely aligned with δ18O changes; however, during the westerlies season, Yadong is influenced primarily by local evaporation, whereas Ali is shaped by Rayleigh fractionation and long-range continental transport, resulting in pronounced δ18O differences (−9.6 ‰ vs. −21.8 ‰); (3) atmospheric moisture at both sites are primarily supplied by the seasonally shifted ISM and westerly, accompanied by local and mid-latitude dry sources at Yadong and long-distance continental moisture at Ali, explaining the seasonal convergence and divergence in δ18O patterns; (4) δ18O variations in 28 simultaneous precipitation events during the monsoon season suggest ISM dominance at both sites during these events.
Our results further confirm that interannual variability in precipitation δ18O at both sites is clearly linked to ENSO, with δ18O enrichment of 2.8 ‰ (Yadong) and 5.1 ‰ (Ali) from 2022 La Niña to 2023 El Niño monsoon seasons. This enrichment results from changes of moisture transport related with ENSO events. During El Niño events, weakened Walker circulation and reduced ISM moisture transport increase the relative contributions of local evapotranspiration and short-distance transport from southern moist continental surfaces, leading to precipitation δ18O enrichment. Conversely, La Niña events strengthen the Walker circulation and enhance ISM moisture transport through elevated western Pacific and Indian Ocean SSTs, resulting in significant precipitation δ18O depletion at both sites.
Our results demonstrate that ISM circulation homogenizes isotopic signatures across the southern and western Tibetan Plateau, while westerly dominance amplifies regional differences through distinct moisture pathways. The seasonal transition from amount-controlled to temperature-controlled isotopic variability reflects fundamental changes in precipitation isotopic mechanisms. The pronounced ENSO sensitivity indicates that tropical Pacific variability significantly modulates regional hydrological processes through altered moisture transport patterns.
Our findings align with previous studies showing ISM dominance in summer isotopic patterns across the Tibetan Plateau, but provide new quantitative constraints on seasonal moisture source transitions. The documented ENSO influence on precipitation isotopes (2.8 ‰–5.1 ‰ variability) exceeds previously reported values from limited observations, highlighting the importance of multi-year datasets for capturing interannual climate impacts. Our q-δ analysis advances understanding of site-specific responses to sub-cloud evaporation and moisture recycling that were sparsely resolved in earlier regional studies.
This study provides critical observational constraints for atmospheric moisture transport and regional climate sensitivity in the Tibetan Plateau. The quantified ENSO sensitivity of precipitation isotopes offers new insights on regional paleoclimate records interpretation. The 3-year sampling period, however, limits our ability to assess decadal-scale variability and multi-ENSO cycle impacts. Future work should extend observations to capture longer-term climate oscillations and validate these findings across broader spatial scales. Additionally, the mechanisms driving the observed local evapotranspiration changes during ENSO events require further investigation through integrated land-atmosphere modeling approaches.
The ERA5 dataset is the latest reanalysis dataset published by the European Centre for Medium-Range Weather Forecasts (ECMWF) available at https://doi.org/10.24381/cds.bd0915c6 (Hersbach et al., 2023). The Global Data Assimilation System (GDAS) has been published by the National Centers for Environmental Prediction (NCEP) (ftp://arlftp.arlhq.noaa.gov/archives/gdas1/, last access: 8 January 2025). The monthly Oceanic Niño Index (ONI) provided by the National Oceanic and Atmospheric Administration Climate Prediction Center (NOAA CPC) (https://www.cpc.ncep.noaa.gov/products/analysis_monitoring/ensostuff/ONI_v5.php, last access: 15 January 2025). The precipitation isotopic compositions dataset will be available on the Zenodo research data repository after manuscript publication.
The supplement related to this article is available online at https://doi.org/10.5194/acp-26-6407-2026-supplement.
LK: data curation, formal analysis, writing (original draft preparation). GJ: data curation, conceptualization, methodology, supervision, writing (review and editing), funding acquisition. YJJ: data curation. NXW: data curation. ZAB: writing (review and editing), project administration. CGBR: data curation. WYQ: data curation. LYG: data curation.
The contact author has declared that none of the authors has any competing interests.
Publisher's note: Copernicus Publications remains neutral with regard to jurisdictional claims made in the text, published maps, institutional affiliations, or any other geographical representation in this paper. The authors bear the ultimate responsibility for providing appropriate place names. Views expressed in the text are those of the authors and do not necessarily reflect the views of the publisher.
This work was funded by The Second Tibetan Plateau Scientific Expedition and Research (STEP) program (grant no. 2024QZKK0400) and the National Natural Science Foundation of China (grant no. 41922002), as well as the Innovation Program for Young Scholars of TPESER (grant no. QNCX2022ZD-01). We acknowledge the staff at the two observational stations for collecting the precipitation samples. We extend our sincere thanks to Sonja Wahl and Laura Jasmin Dietrich for their fruitful suggestions.
This research has been supported by the Second Tibetan Plateau Scientific Expedition and Research (STEP) program (grant no. 2024QZKK0400) and the National Natural Science Foundation of China (grant no. 41922002), as well as the Innovation Program for Young Scholars of TPESER (grant no. QNCX2022ZD-01).
This paper was edited by Kara Lamb and reviewed by two anonymous referees.
Adhikari, N., Gao, J., Yao, T., Yang, Y., and Dai, D.: The main controls of the precipitation stable isotopes at Kathmandu, Nepal, Tellus B, 72, 1445379, https://doi.org/10.1080/16000889.2020.1721967, 2020.
Axelsson, J., Gao, J., Eckhardt, S., Cassiani, M., Chen, D., and Zhang, Q.: A Precipitation Isotopic Response in 2014–2015 to Moisture Transport Changes in the Central Himalayas, J. Geophys. Res.-Atmos., 128, e2023JD038568, https://doi.org/10.1029/2023JD038568, 2023.
Bjerknes, J.: Atmospheric teleconnections from the Equatorial Pacific, Mon. Weather Rev., 97, 163–172, https://doi.org/10.1175/1520-0493(1969)097<0163:ATFTEP>2.3.CO;2, 1969.
Brunello, C. F., Gebhardt, F., Rinke, A., Dütsch, M., Bucci, S., Meyer, H., Mellat, M., and Werner, M.: Moisture Transformation in Warm Air Intrusions Into the Arctic: Process Attribution With Stable Water Isotopes, Geophys. Res. Lett., 51, e2024GL111013, https://doi.org/10.1029/2024GL111013, 2024.
Cai, Z. and Tian, L.: Atmospheric Controls on Seasonal and Interannual Variations in the Precipitation Isotope in the East Asian Monsoon Region, J. Climate, 29, 1339–1352, https://doi.org/10.1175/JCLI-D-15-0363.1, 2016.
Cai, Z., Tian, L., and Bowen, G. J.: ENSO variability reflected in precipitation oxygen isotopes across the Asian Summer Monsoon region, Earth Planet. Sc. Lett., 475, 25–33, https://doi.org/10.1016/j.epsl.2017.06.035, 2017.
Chakraborty, S., Sinha, N., Chattopadhyay, R., Sengupta, S., Mohan, P. M., and Datye, A.: Atmospheric controls on the precipitation isotopes over the Andaman Islands, Bay of Bengal, Sci. Rep., 6, 19555, https://doi.org/10.1038/srep19555, 2016.
Craig, H.: Isotopic Variations in Meteoric Waters, Science, 133, 1702–1703, https://doi.org/10.1126/science.133.3465.1702, 1961.
Cui, Y., Tian, L., Cai, Z., and Wang, S.: Spatially inhomogeneous response of precipitation δ18O in China to ENSO cycles, npj Climate and Atmospheric Science, 8, 164, https://doi.org/10.1038/s41612-025-01057-1, 2025.
Dai, D., Gao, J., Steen-Larsen, H. C., Yao, T., Ma, Y., Zhu, M., and Li, S.: Continuous monitoring of the isotopic composition of surface water vapor at Lhasa, southern Tibetan Plateau, Atmos. Res., 264, 105827, https://doi.org/10.1016/j.atmosres.2021.105827, 2021.
Dansgaard, W.: Stable isotopes in precipitation, Tellus, 16, 436–468, https://doi.org/10.1111/j.2153-3490.1964.tb00181.x, 1964.
Frankenberg, C., Yoshimura, K., Warneke, T., Aben, I., Butz, A., Deutscher, N., Griffith, D., Hase, F., Notholt, J., Schneider, M., Schrijver, H., and Röckmann, T.: Dynamic Processes Governing Lower-Tropospheric HDO/H2O Ratios as Observed from Space and Ground, Science, 325, 1374–1377, https://doi.org/10.1126/science.1173791, 2009.
Galewsky, J. and Hurley, J. V.: An advection-condensation model for subtropical water vapor isotopic ratios, J. Geophys. Res.-Atmos., 115, https://doi.org/10.1029/2009JD013651, 2010.
Gao, J., Tian, L., Liu, Y., and Gong, T.: Oxygen isotope variation in the water cycle of the Yamdrok-tso Lake Basin in southern Tibetan Plateau, Chinese Sci. Bull., 54, 2153–2159, https://doi.org/10.1007/s11434-009-0487-6, 2009.
Gao, J., Masson-Delmotte, V., Yao, T., Tian, L., Risi, C., and Hoffmann, G.: Precipitation Water Stable Isotopes in the South Tibetan Plateau: Observations and Modeling, J. Climate, 24, 3161–3178, https://doi.org/10.1175/2010JCLI3736.1, 2011.
Gao, J., Masson-Delmotte, V., Risi C., He Y., and Yao, T.: What controls precipitation δ18O in the southern Tibetan Plateau at seasonal and intra-seasonal scales? A case study at Lhasa and Nyalam, Tellus B, 65, 121034, https://doi.org/10.3402/tellusb.v65i0.21043, 2013.
Gao, J., He, Y., Masson-Delmotte, V., and Yao, T.: ENSO Effects on Annual Variations of Summer Precipitation Stable Isotopes in Lhasa, Southern Tibetan Plateau, J. Climate, 31, 1173–1182, https://doi.org/10.1175/JCLI-D-16-0868.1, 2018.
Gao, J., Yao, T., Masson-Delmotte, V., Steen-Larsen, H. C., and Wang, W.: Collapsing glaciers threaten Asia's water supplies, Nature, 565, 19–21, https://doi.org/10.1038/d41586-018-07838-4, 2019.
Gat, J. R.: Oxygen and Hydrogen Isotopes in the Hydrologic Cycle, Annu. Rev. Earth Planet. Sci., 24, 225–262, https://doi.org/10.1146/annurev.earth.24.1.225, 1996.
Gat, J. R. and Matsui, E.: Atmospheric water balance in the Amazon basin: An isotopic evapotranspiration model, J. Geophys. Res.-Atmos., 96, 13179–13188, https://doi.org/10.1029/91JD00054, 1991.
Hersbach, H., Bell, B., Berrisford, P., Biavati, G., Horányi, A., Muñoz Sabater, J., Nicolas, J., Peubey, C., Radu, R., Rozum, I., Schepers, D., Simmons, A., Soci, C., Dee, D., and Thépaut, J-N.: ERA5 hourly data on pressure levels from 1940 to present, Copernicus Climate Change Service (C3S) Climate Data Store (CDS) [data set], https://doi.org/10.24381/cds.bd0915c6, 2023.
Jasechko, S.: Global Isotope Hydrogeology – Review, Rev. Geophys., 57, 835–965, https://doi.org/10.1029/2018RG000627, 2019.
Li, J., Tian, L., Xiao, X., and Zhang, C.: Controls on daily to interannual variations of summer precipitation isotopic signatures from Qinghai Lake watershed, northeastern Tibetan Plateau, Theor. Appl. Climatol., 152, 1019–1029, https://doi.org/10.1007/s00704-023-04390-8, 2023.
Liu, M., Ren, H., Wang, R., Ma, J., and Mao, X.: Distinct Impacts of Two Types of Developing El Niño–Southern Oscillations on Tibetan Plateau Summer Precipitation, Remote Sens., 15, 4030, https://doi.org/10.3390/rs15164030, 2023.
Mason, S. J. and Goddard, L.: Probabilistic Precipitation Anomalies Associated with ENSO, B. Am. Meteorol. Soc., 82, 619–638, https://doi.org/10.1175/1520-0477(2001)082<0619:PPAAWE>2.3.CO;2, 2001.
Merlivat, L. and Jouzel, J.: Global climatic interpretation of the deuterium-oxygen 18 relationship for precipitation, J. Geophys. Res.-Atmos., 84, 5029–5033, https://doi.org/10.1029/JC084iC08p05029, 1979.
Murray, N. K., Conroy, J. L., Colin, P. L., Cobb, K. M., and Noone, D. C.: Western Pacific Warm Pool δ18O Response to the El Niño-Southern Oscillation, Geophys. Res. Lett., 52, e2024GL113366, https://doi.org/10.1029/2024GL113366, 2025.
Natali, S., Doveri, M., Giannecchini, R., Baneschi, I., and Zanchetta, G.: Is the deuterium excess in precipitation a reliable tracer of moisture sources and water resources fate in the western Mediterranean? New insights from Apuan Alps (Italy), J. Hydrol., 614, 128497, https://doi.org/10.1016/j.jhydrol.2022.128497, 2022.
Noone, D., Galewsky, J., Sharp, Z. D., Worden, J., Barnes, J., Baer, D., Bailey, A., Brown, D. P., Christensen, L., Crosson, E., Dong, F., Hurley, J. V., Johnson, L. R., Strong, M., Toohey, D., Van Pelt, A., and Wright, J. S.: Properties of air mass mixing and humidity in the subtropics from measurements of the D/H isotope ratio of water vapor at the Mauna Loa Observatory, J. Geophys. Res.-Atmos., 116, https://doi.org/10.1029/2011JD015773, 2011.
Ren, W., Yao, T., Yang, X., and Joswiak, D. R.: Implications of variations in δ18O and δD in precipitation at Madoi in the eastern Tibetan Plateau, Quatern. Int., 313–314, 56–61, https://doi.org/10.1016/j.quaint.2013.05.026, 2013.
Risi, C., Bony, S., and Vimeux, F.: Influence of convective processes on the isotopic composition (δ18O and δD) of precipitation and water vapor in the tropics: 2. Physical interpretation of the amount effect, J. Geophys. Res.-Atmos., 113, https://doi.org/10.1029/2008JD009943, 2008.
Risi, C., Bony, S., Vimeux, F., Frankenberg, C., Noone, D., and Worden, J.: Understanding the Sahelian water budget through the isotopic composition of water vapor and precipitation, J. Geophys. Res.-Atmos., 115, https://doi.org/10.1029/2010JD014690, 2010.
Tian, L., Yao, T., MacClune, K., White, J. W. C., Schilla, A., Vaughn, B., Vachon, R., and Ichiyanagi, K.: Stable isotopic variations in west China: A consideration of moisture sources, J. Geophys. Res.-Atmos., 112, https://doi.org/10.1029/2006JD007718, 2007.
Tian, L., Cai, Z., Shao, L., Wang, D., and Liu, F.: Review on the study of climatic significance of precipitation isotope in Asian monsoon region, Quaternary Sciences, 41, 856–863, https://doi.org/10.11928/j.issn.1001-7410.2021.03.19, 2021.
Wang, D., Tian, L., Risi, C., Wang, X., Cui, J., Bowen, G. J., Yoshimura, K., Wei, Z., and Li, L. Z. X.: Vehicle-based in situ observations of the water vapor isotopic composition across China: spatial and seasonal distributions and controls, Atmos. Chem. Phys., 23, 3409–3433, https://doi.org/10.5194/acp-23-3409-2023, 2023.
Wang, R., Ren, H., Liu, M., Zhou, F., and Du, J.: Impact of the central-Pacific ENSO on the Tibetan Plateau precipitation in boreal spring, Environ. Res. Commun., 6, 101008, https://doi.org/10.1088/2515-7620/ad810d, 2024a.
Wang, S., Wang, L., Yang, G., Xiao, Y., Argiriou, A. A., Shi, Y., Lei, S., and Zhang, M.: Altitude effect of precipitation isotopes in an arid mountain-basin system: Observation and modelling around the world's second-largest shifting desert, J. Hydrol., 636, 131351, https://doi.org/10.1016/j.jhydrol.2024.131351, 2024b.
Wang, S., Zhang, M., Che, Y., Zhu, X., and Liu, X.: Influence of Below-Cloud Evaporation on Deuterium Excess in Precipitation of Arid Central Asia and Its Meteorological Controls, J. Hydrometeorol., 17, 1973–1984, https://doi.org/10.1175/JHM-D-15-0203.1, 2016.
Wang, Y., Yu, W., Zhang, Y., Zhang, T., Gao, H., and Muhammad, A. W.: Precipitation stable isotope variation and its relationship with moisture sources in Bagrot Valley of Upper Indus Basin, Arid Land Geography, 42, 252–262, http://alg.xjegi.com/CN/10.12118/j.issn.1000-6060.2019.02.04, 2019.
Yang, N. and Wang, G.: Spatial variation of water stable isotopes of multiple rivers in southeastern Qaidam Basin, northeast Qinghai-Tibetan Plateau: Insights into hydrologic cycle, J. Hydrol., 628, 130464, https://doi.org/10.1016/j.jhydrol.2023.130464, 2024.
Yang, X., Yao, T., Deji, Zhao, H., and Xu, B.: Possible ENSO Influences on the Northwestern Tibetan Plateau Revealed by Annually Resolved Ice Core Records, J. Geophys. Res.-Atmos., 123, 3857–3870, https://doi.org/10.1002/2017JD027755, 2018.
Yao, M., Tang, H., Huang, G., and Wu, R.: Interdecadal shifts of ENSO influences on Spring Central Asian precipitation, npj Climate and Atmospheric Science, 7, 194, https://doi.org/10.1038/s41612-024-00742-x, 2024.
Yao, T., Xie, Z., Wu, X., and Thompson, L. G.: Climatic Change Since Little Ice Age Recorded by Dunde Ice Cap, Sci. China Ser. B, 34, 760–767, https://www.sciengine.com/doi/10.1360/yb1991-34-6-760, 1991.
Yao, T., Thompson, L., Yang, W., Yu, W., Gao, Y., Guo, X., Yang, X., Duan, K., Zhao, H., Xu, B., Pu, J., Lu, A., Xiang, Y., Kattel, D. B., and Joswiak, D.: Different glacier status with atmospheric circulations in Tibetan Plateau and surroundings, Nat. Clim. Change, 2, 663–667, https://doi.org/10.1038/nclimate1580, 2012.
Yao, T., Masson-Delmotte, V., Gao, J., Yu, W., Yang, X., Risi, C., Sturm, C., Werner, M., Zhao, H., He, Y., Ren, W., Tian, L., Shi, C., and Hou, S.: A review of climatic controls on δ18O in precipitation over the Tibetan Plateau: Observations and simulations, Rev. Geophys., 51, 525–548, https://doi.org/10.1002/rog.20023, 2013.
Ye, L., Zhu, G., Chen, L., Qiu, D., Jiao, Y., Li, R., Lu, S., and Yang, J.: Influence of below-cloud evaporation on stable isotopes of precipitation in the Yellow River source region, Hydrol. Process., 38, e15064, https://doi.org/10.1002/hyp.15064, 2024.
Yoshimura, K.: Stable Water Isotopes in Climatology, Meteorology, and Hydrology: A Review, J. Meteorol. Soc. Jpn. Ser. II, 93, 513–533, https://doi.org/10.2151/jmsj.2015-036, 2015.
Yoshimura, K., Kanamitsu, M., Noone, D., and Oki, T.: Historical isotope simulation using Reanalysis atmospheric data, J. Geophys. Res.-Atmos., 113, https://doi.org/10.1029/2008JD010074, 2008.
Yu, W., Ma, Y., Sun, W., and Wang, Y.: Climatic significance of δ18O records from precipitation on the western Tibetan Plateau, Chinese Sci. Bull., 54, 2131–2139, https://doi.org/10.1007/s11434-009-0495-6, 2009.
Zhang, F., Huang, T., Man, W., Hu, H., Long, Y., Li, Z., and Pang, Z.: Contribution of Recycled Moisture to Precipitation: A Modified D-Excess-Based Model, Geophys. Res. Lett., 48, e2021GL095909, https://doi.org/10.1029/2021GL095909, 2021.
Zhang, J., Yu, W., Lewis, S., Thompson, L. G., Bowen, G. J., Yoshimura, K., Cauquoin, A., Werner, M., Chakraborty, S., Jing, Z., Ma, Y., Guo, X., Xu, B., Wu, G., Guo, R., and Qu, D.: Controls on Stable Water Isotopes in Monsoonal Precipitation Across the Bay of Bengal: Atmosphere and Surface Analysis, Geophys. Res. Lett., 50, e2022GL102229, https://doi.org/10.1029/2022GL102229, 2023.