the Creative Commons Attribution 4.0 License.
the Creative Commons Attribution 4.0 License.
 | 11 May 2026
Continental and marine source regions contributing to the outflow of the Asian summer monsoon anticyclone during the PHILEAS campaign in summer 2023
Valentin Lauther
Franziska Köllner
Fatih Ekinci
Christian Rolf
Johannes Strobel
Ronja van Luijt
C. Michael Volk
Stephan Borrmann
Antonis Dragoneas
Oliver Eppers
Sergej Molleker
Peter Hoor
Linda Ort
Franziska Weyland
Andreas Zahn
Jan Clemens
Gebhard Günther
Oleh Kachula
Rolf Müller
Felix Ploeger
Martin Riese
During the PHILEAS aircraft campaign, which probed the export of air from the Asian summer monsoon anticyclone (ASMA), observations were carried out from Germany and Alaska during August and September 2023. The flights from Germany sampled the western part of the ASMA and its westward outflow. The flights from Alaska probed filaments that had separated from the ASMA at its eastern flank and were transported across the Pacific. This work integrates PHILEAS aircraft in situ measurements with results from Lagrangian transport simulations. Our results show that air masses within the ASMA and its outflow are characterised by a mixture of different continental and marine sources. In the western part of the ASMA and its westward outflow, enhanced pollutants and greenhouse gases such as CH2Cl2, aerosols, CH4, and H2O were detected, indicating sources in South Asia. Additional marine air masses from the western Pacific, characterised by enhanced CH2Br2 and low O3, were found in filaments separated at the ASMA's eastern flank. Thus, air masses from two different surface regions and with different chemical compositions are mixed in filaments separated at the ASMA's eastern flank. Our findings show that the chemical composition of the ASMA's outflow is highly variable and depends on altitude, surface emissions, mixing of air masses from different source regions, and the interplay between the ASMA and tropical cyclones. Overall, the results provide strong support for the Asian summer monsoon is an important pathway for transporting short-lived ozone-depleting and radiatively active substances into the stratosphere.
- Article
(31905 KB) - Full-text XML
- BibTeX
- EndNote


During boreal summer, the Asian summer monsoon forms a seasonally persistent, zonally confined circulation system that efficiently transports climate-relevant emissions (e.g. greenhouse gases, ozone-depleting substances, aerosol particles, and their gas-phase precursors) from near-surface levels to higher altitudes, specifically into the upper troposphere and lower stratosphere (UTLS) (e.g. Mason and Anderson, 1963; Randel and Park, 2006; Park et al., 2007; Vogel et al., 2023). Between June and September, deep convection over South Asia, particularly over the northern Indian subcontinent and China, is associated with the formation of the Asian summer monsoon anticyclone (ASMA), which extends from northeastern Africa to the western Pacific at UTLS levels (e.g. Park et al., 2007; Vogel et al., 2019). The strong anticyclonic circulation at the edge of the ASMA acts as an effective transport barrier (e.g. Ploeger et al., 2015; Kachula et al., 2025), leading to the confinement of tropospheric trace gases and aerosols within the anticyclone (e.g. Rosenlof et al., 1997; Li et al., 2005; Vernier et al., 2015; Chirkov et al., 2016; Santee et al., 2017). However, filaments and sometimes smaller anticyclonic systems (eddies) are frequently shed from the ASMA during boreal summer – particularly at its northeastern flank (e.g. over northeastern China, Korea, and Japan). These structures are transported eastward along the subtropical jet stream towards North America (e.g. Alaska), and subsequently can reach the Atlantic Ocean and Europe (e.g. Dethof et al., 1999; Garny and Randel, 2013; Ungermann et al., 2016; Siu and Bowman, 2020; Clemens et al., 2022). Likewise, air masses can be transported from the ASMA at its western flank (e.g. over northern Africa and the Mediterranean region) westward into the tropical tropopause layer. Finally, these young air masses from the ASMA can potentially be transported into the extratropical lower stratosphere and irreversibly mixed with the surrounding stratospheric air (Vogel et al., 2016).
This process affects the chemical composition and radiative balance of the northern extratropical UTLS (Riese et al., 2012; Adcock et al., 2021). Consequently, during the Asian summer monsoon season, the northern extratropical lower stratosphere is flooded by isentropic transport – sometimes referred to as “flushing” (Hegglin and Shepherd, 2007; Bönisch et al., 2009) – with moist, polluted air originating from South Asia, which is among the most polluted and densely populated regions of the world. This results in enhanced concentrations of greenhouse gases (e.g. H2O, CH4, SF6), pollutants (e.g. CO, PAN, aerosols), and short-lived ozone-depleting substances (e.g. CH2Cl2, CHCl3), particularly those of anthropogenic origin in the northern extratropical UTLS (e.g. Ploeger et al., 2013; Vogel et al., 2014, 2016; Rolf et al., 2018; Wetzel et al., 2021; Lauther et al., 2022; Fadnavis et al., 2024; Graßl et al., 2024; Riese et al., 2025).
In the northwestern Pacific region, tropical cyclones (including typhoons) occur throughout the year, with peak activity from July to October (Emanuel, 2003; Matsuura et al., 2003), coinciding with the peak phase of the ASMA. The interplay between the spatial position of the ASMA and tropical cyclones plays a key role in controlling horizontal transport in the UTLS of marine air uplifted in the western Pacific, in particular if tropical cyclones occur at the edge of the ASMA. Measurements show that ozone- and aerosol-poor marine air, uplifted by tropical cyclones, can be injected into the anticyclonic flow of the ASMA (e.g. Vogel et al., 2014; Li et al., 2017, 2020, 2021; Hanumanthu et al., 2020; Clemens et al., 2024b; Bak et al., 2025). This process can lead to reduced ozone in the UTLS over South Asia (Li et al., 2017, 2023). Further, wet marine air can be uplifted into the UTLS by typhoons and enhance water vapour in this region, however dehydration processes can also decrease water vapour in air masses uplifted by typhoons (Li et al., 2020, 2023). Similarly, ice crystals can be injected into the lower stratosphere by tropical cyclones, leading to hydration. The resulting moist plumes can subsequently be affected by the flow of the ASMA (Pandit et al., 2024). Hence, the rapid uplift by tropical cyclones generally transports air of marine origin to altitudes of the ASMA, but upward transport of polluted air masses during landfall of tropical cyclones also occurs (e.g. Li et al., 2017). Further, subsequent filaments separated from the ASMA can transport boundary layer air from the western Pacific into the northern extratropical UTLS (e.g. towards North America and Europe) (Vogel et al., 2014).
Several balloon campaigns have been conducted over the past decades across the Indian subcontinent and China, aiming to measure trace gases – particularly ozone and water vapour – as well as aerosol backscatter within the ASMA (e.g. Bian et al., 2020; Brunamonti et al., 2018; Vernier et al., 2018; Fadnavis et al., 2023). As part of the StratoClim project, an aircraft campaign was carried out in Kathmandu (Nepal) during summer 2017, providing observations up to 20 km altitude and probing the top of the ASMA (e.g. Höpfner et al., 2019; Adcock et al., 2021; Vogel et al., 2024). Despite these unique measurements, further comprehensive in-situ data sets within the ASMA in other years remain lacking.
Air masses from the eastward outflow of the ASMA, transported along the subtropical jet toward North America and further downstream, were observed during two aircraft campaigns over Europe and the North Atlantic: the “Transport and Composition in the Upper Troposphere and Lowermost Stratosphere” (TACTS) campaign, conducted jointly with the “Earth System Model Validation” (ESMVal) experiment in August and September 2012 (e.g. Vogel et al., 2014, 2016; Müller et al., 2016; Gottschaldt et al., 2017; Rolf et al., 2018), and the “Wave-driven ISentropic Exchange” (WISE) campaign in autumn 2017 (e.g. Wetzel et al., 2021; Rotermund et al., 2021; Lauther et al., 2022). More recently, scientific efforts have focused on the eastern edge of the ASMA and its outflow towards the northern Pacific, including the “Asian Summer Monsoon Chemical and CLimate Impact” project (ACCLIP), conducted from South Korea in July and August 2022 (Pan et al., 2024, 2025; Smith et al., 2025).
The recent aircraft campaign “Probing High Latitude Export of Air from the Asian Summer Monsoon” (PHILEAS) (Riese et al., 2025; Jesswein et al., 2025; Köllner et al., 2026) provided the first in situ observations in the northeastern Pacific region, where mixing of air from the ASMA into the extratropical lower stratosphere occurs (e.g. Vogel et al., 2016). The PHILEAS campaign was conducted from Oberpfaffenhofen, Germany, and Anchorage, Alaska, USA, during summer and early autumn 2023 and provides a valuable dual-flank perspective, sampling both the western part of the ASMA and its westward outflow (via flights from Germany to the Mediterranean region, Israel and Jordan) as well as its eastward outflow (via flights from Alaska to the northeastern Pacific region). More details are given in the campaign overview paper (Riese et al., 2025).
Here, we combine PHILEAS aircraft measurements with global three-dimensional simulations using the Chemical Lagrangian Model of the Stratosphere (CLaMS) (Pommrich et al., 2014; Vogel et al., 2015; Ploeger et al., 2021, and references therein), which includes model tracers of surface origin, as well as CLaMS back-trajectory calculations initiated along all aircraft flight tracks. With CLaMS, we identify the origin of air masses and their transport pathways and transport times to the location of the measurements. In addition, trace gas measurements and the chemical composition of particles are used to link the PHILEAS measurements to specific source regions such as marine (e.g. CH2Br2, marine-influenced particles) and continental sources (e.g. CH2Cl2, nitrate-containing particles) as well as monsoon-influenced air (e.g. CH4). This allows a better source attribution combining model and measurement results.
We will show that in general the PHILEAS measurements are influenced by air masses from South Asia and the Western Pacific, with the respective contributions strongly depending on the interplay between the ASMA circulation and tropical cyclones. Further, we demonstrate that the chemical composition of monsoon-influenced air measured during PHILEAS varies strongly and depends on the geographic source region at the Earth's surface. We discuss three research flights (F02, F06, and F08) as case studies because, on the one hand, they sampled very different dynamical and geographic situations: the western part of the anticyclone (F02), typhoon-influenced air within the westward outflow of the anticyclone (F06), and the eastward outflow of the anticyclone (F08). On the other hand, all three flights were influenced by marine air uplifted by tropical cyclones in the western Pacific, which contributes to the chemical composition of the air at the edge of the ASMA and its outflow. This results in mixing of polluted air from the Asian monsoon region with marine air from tropical cyclones, particularly within eddies or filaments separated at the eastern flank of the anticyclone.
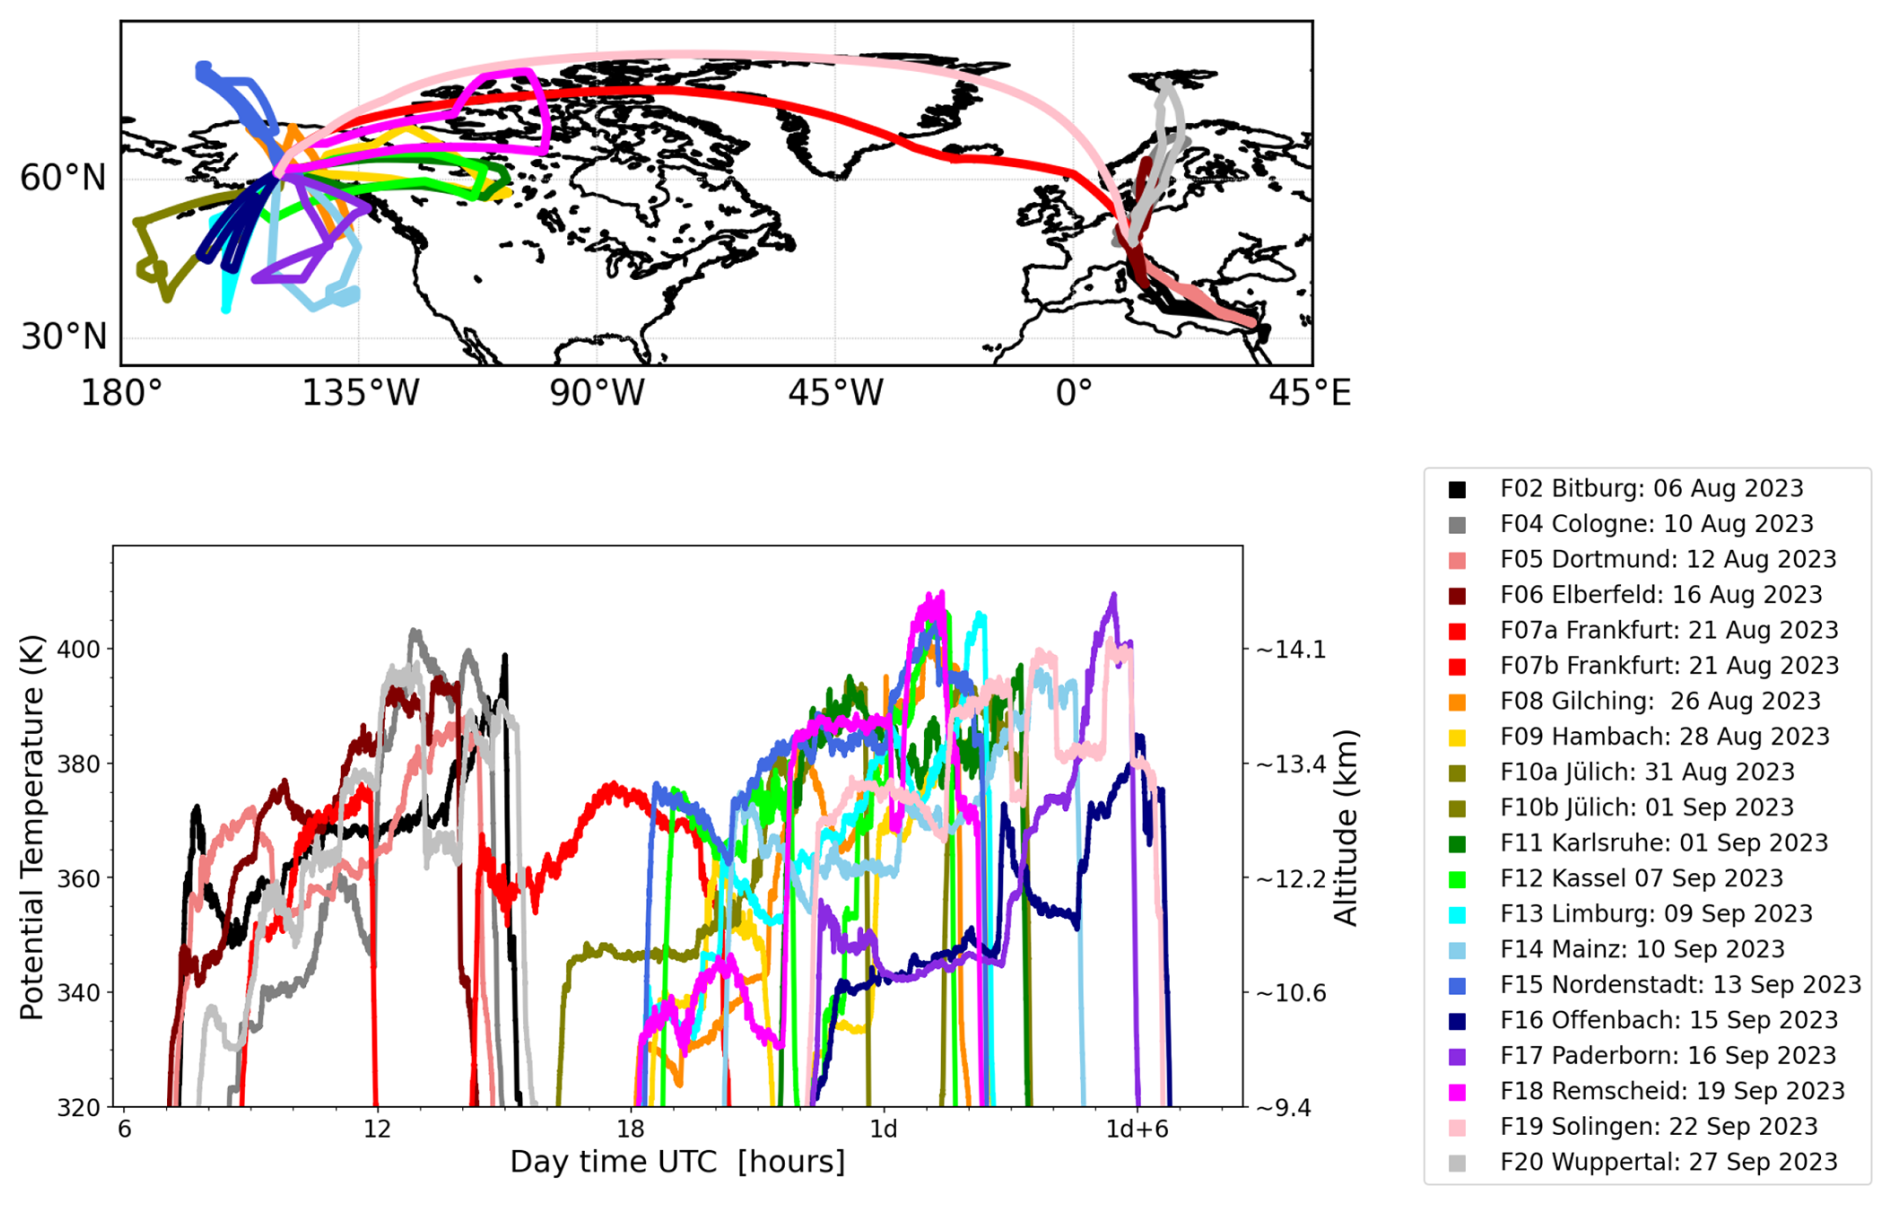
Figure 1Regional map showing all HALO aircraft flight tracks over the Northern Hemisphere during the PHILEAS campaign 2023 (top). A total of 18 scientific flights (F02–F20; excluding the electromagnetic compatibility and turbulence calibration flights F01 and F03, and counting the double flights F07a/b and F10a/b as one flight each) were conducted between 6 August and 27 September 2023, departing from Oberpfaffenhofen, Germany, and Anchorage, Alaska, USA. Maximum altitudes up to ∼ 14.5 km (∼ 410 K potential temperature) were reached. Research flights from Alaska were conducted during local daytime, which corresponds to nighttime in Coordinated Universal Time (UTC), and therefore often crossed the International Date Line, marked as 1 d (Alaska local time = UTC − 7 h, Germany local time = UTC + 2 h considering summer time).
As part of the PHILEAS project, a measurement campaign using the German HALO (High Altitude and Long Range) research aircraft was conducted from Oberpfaffenhofen, Germany, and Anchorage, Alaska, USA, during summer 2023 (Fig. 1) to investigate trace gas and aerosol characteristics of air affected by the Asian summer monsoon (Riese et al., 2025). Maximum flight altitudes of up to ∼ 14.5 km, corresponding to potential temperatures up to ∼ 410 K, were reached. Flights from Oberpfaffenhofen (F02–F06, F20) targeted the western part of the ASMA over the Eastern Mediterranean, Israel, and Jordan, as well as the region north of Oberpfaffenhofen up to Spitsbergen to sample the lower northern extratropical background stratosphere. Flights from Anchorage (F08–F18) focused on investigating the outflow at the eastern flank of the ASMA. Transfer flights between Oberpfaffenhofen and Anchorage (F07a, F07b, F19) can be used to infer the background state of the northern extratropical UTLS (e.g. Ekinci et al., 2026). The PHILEAS measurements provide a valuable data set to characterise key processes governing the transport of particles and trace gases from South Asia – one of the most polluted regions of the world – into the northern UTLS. Measurements from the following in situ instruments on board the HALO aircraft are used in our study:
-
The chemical composition of aerosol particles (larger than ∼ 100 nm) was detected by the ERICA (ERC Instrument for the Chemical composition of Aerosols) Aerosol Mass Spectrometer (ERICA-AMS). It is based on thermal desorption with subsequent electron-impact ionisation, providing in-situ real-time mass concentrations of particulate nitrate, sulfate, and ammonium (Appel et al., 2022; Hünig et al., 2022). The conversion of the measured ERICA-AMS raw signal into mass concentrations involves several steps (for more details, see Eppers et al., 2025). The detection limit was determined for each measurement point by analysing the noise of the background measurement when a shutter in front of the ERICA-AMS ionisation region was closed (blocking ambient air and aerosol). Further, a de-trending method was applied (for more details, see Appel et al., 2022). In addition, single-particle mass spectra were obtained from the ERICA-LAMS part, which uses laser ablation and ionisation mass spectrometry. With ERICA-LAMS, particle fractions of certain particle types were analysed that are typically associated with marine-influenced air masses. Particle types were classified into three main categories based on characteristic ion marker peaks. Sodium chloride (Na/Cl) was identified by peaks at 23, −35, and −37 (Na+, Cl−). Methanesulfonic acid (MSA) was identified by a peak at −95 (), and trimethylamine (TMA) by peaks at 58 and +59 (C3H8N+ and C3H9N+) (Angelino et al., 2001; Rehbein et al., 2011; Healy et al., 2015; Köllner et al., 2017; Willis et al., 2017). These tracers are typically associated with marine-influenced air masses. However, TMA can also originate from anthropogenic sources such as animal husbandry and biomass burning (Ge et al., 2011).
-
Ozone (O3) was measured with FAIRO, a lightweight (14.5 kg) instrument with high accuracy (2 %) and high time resolution (10 Hz) developed for the HALO aircraft. FAIRO combines a dual-beam UV photometer with a UV-LED as a light source and a dry chemiluminescence detector (Zahn et al., 2012). In our study, ozone-poor air is used as indicator for tropospheric marine air and ozone-rich air for stratospheric air (e.g. Li et al., 2018, 2021).
-
Water vapour (H2O) measurements were obtained from the Fast In situ Stratospheric Hygrometer (FISH), which is based on the Lyman-α photofragment fluorescence technique (Zöger et al., 1999). The FISH inlet was mounted facing forward to measure total water which is the sum of gas-phase water and water in ice particles. A correction procedure is applied to calculate gas-phase water from FISH measurements in clouds (for more details, see e.g. Meyer et al., 2015). The uncertainty for the water measurements by FISH during PHILEAS is 5 % plus an offset of 0.8 ppmv. The FISH instrument is calibrated every second flight and an instrument drift < 1 % is estimated based on these regular calibrations for the PHILEAS campaign, which is included in the accuracy estimate. The relative humidity with respect to ice (RHi) – a measure for potential cloud formation – is derived from H2Ogas using RHi = 100 × , where H2Osat, ice is the ice saturation mixing ratio as a function of temperature (Murphy and Koop, 2005; Krämer et al., 2016). Here, H2O is used to analyse the impact of the ASMA and of tropical cyclones (e.g. Vogel et al., 2014; Rolf et al., 2018).
-
Dichloromethane (CH2Cl2) and dibromomethane (CH2Br2) were measured by HAGAR-V on board of HALO. HAGAR-V comprises a two-channel gas chromatograph (GC) with electron capture detection (ECD) as well as a non-dispersive infrared absorption module for the detection of CO2. In addition, a mass spectrometer (MS) coupled to two GC channels by a two-position valve to alternately use the detector and thereby double the time resolution of the wide range of measured species is integrated (Lauther et al., 2022). HAGAR-V uses two different in-flight calibration gases for a calibration measurement every fifth sample. The used gases were calibrated at the University of Frankfurt based on AGAGE-derived calibrations according to the SIO-14 (CH2Cl2) and the NOAA-03 (CH2Br2) scales. During PHILEAS the average measurement precision of CH2Cl2 and CH2Br2 was 1.3 % and 2.3 %, respectively. In our study, CH2Cl2 and CH2Br2 are used as markers for anthropogenic sources – in particular from South Asia – and for natural oceanic sources – in particular for the western Pacific –, respectively (e.g. Lauther et al., 2022; Adcock et al., 2021).
-
Methane (CH4) measurements are used from UMAQS, the University of Mainz Airborne Quantum Cascade Laser (QCL) Spectrometer (e.g. Müller et al., 2015; Kunkel et al., 2019). Direct absorption of an infrared QCL laser at 2989 cm−1 for CH4 at a constant cell pressure of 40 Torr is used to determine its concentration, which is converted to mixing ratio using measured cell pressure and temperature. The instrument does in-flight calibrations against secondary gas standards of compressed dried ambient air, which are compared to standards from NOAA prior and after the campaign. With this setup, a total uncertainty (1 sigma) for the 1 Hz data set of 0.7 ppbv for CH4 under in-flight conditions on straight legs was achieved. Here, CH4 mixing ratios are used as an indicator of air influenced by the Asian summer monsoon (e.g. Tao et al., 2024).
The Chemical Lagrangian Model of the Stratosphere (CLaMS) (McKenna et al., 2002b, a; Pommrich et al., 2014, and references therein) was developed to study transport and chemical processes throughout the upper troposphere and stratosphere. In this study, CLaMS is driven by high-resolution ERA5 reanalysis data (Hersbach et al., 2020) provided by the European Centre for Medium-Range Weather Forecasts (ECMWF). We used ERA5 data on native model levels, including 137 vertical levels up to 0.01 hPa, with a horizontal resolution of 0.3° × 0.3° (∼ 31 km; according to a spectral trunction of TL 639) and an hourly time resolution. The high-resolution ERA5 reanalysis has already been used for pure CLaMS trajectory calculations (Li et al., 2020; Vogel et al., 2023, 2024; Clemens et al., 2024b, a) and is used here for the first time for global three-dimensional CLaMS simulations (in addition to Yang et al., 2026). Technical improvements were implemented to accelerate the reading of ERA5 reanalysis data (here used in netCDF format). Furthermore, the storage of the ERA5 reanalysis data was changed from distributed memory to shared memory using the Message Passing Interface (MPI).
In CLaMS, the diabatic approach is used to calculate vertical velocities at these atmospheric altitudes. Specifically, potential temperature is used as the vertical coordinate at pressures below approximately 300 hPa, i.e. in the upper troposphere and stratosphere. At higher pressures (for > 0.3), a pressure-based, orography-following hybrid coordinate (expressed in units of K) is applied (Pommrich et al., 2014). At lower pressure levels, vertical velocity is determined solely by the total diabatic heating rate from ERA5 reanalysis (Pommrich et al., 2014; Ploeger et al., 2021). Total diabatic heating rates include clear-sky radiative heating, cloud radiation, latent heat release, as well as turbulent and diffusive heat transport for the upper troposphere and stratosphere.
The upward transport and convection in CLaMS (in both trajectory calculations and three-dimensional simulations) depend on the underlying reanalysis data (Li et al., 2020; Clemens et al., 2024b; Vogel et al., 2024). For the use of high-resolution ERA5 data, no additional parametrisation for convection is applied in our simulations. Although an additional parametrisation for convection in CLaMS has been developed (Konopka et al., 2019, 2022), it is in its present form designed for use with down-sampled ERA5 data (with a 1° × 1° horizontal resolution and a 6-hourly temporal resolution). This approach is a computing-time-saving alternative that is well suited for global, multi-annual CLaMS simulations. The representation of convection and tropical cyclones (e.g., typhoons) in ERA5 has substantially improved compared to its predecessor, ERA-Interim (e.g., Hoffmann et al., 2019; Li et al., 2020; Malakar et al., 2020; Clemens et al., 2024b; Vogel et al., 2024), and represents the best data currently provided by ECMWF. However, unresolved small-scale convection in ERA5 represents a potential limitation of our simulations. Furthermore, vertical transport in the lower stratosphere in ERA5 has been found to be somewhat too slow (Ploeger et al., 2021; Vogel et al., 2024), which may affect air masses transported upward into the stratosphere and subsequently advected isentropically to higher latitudes.
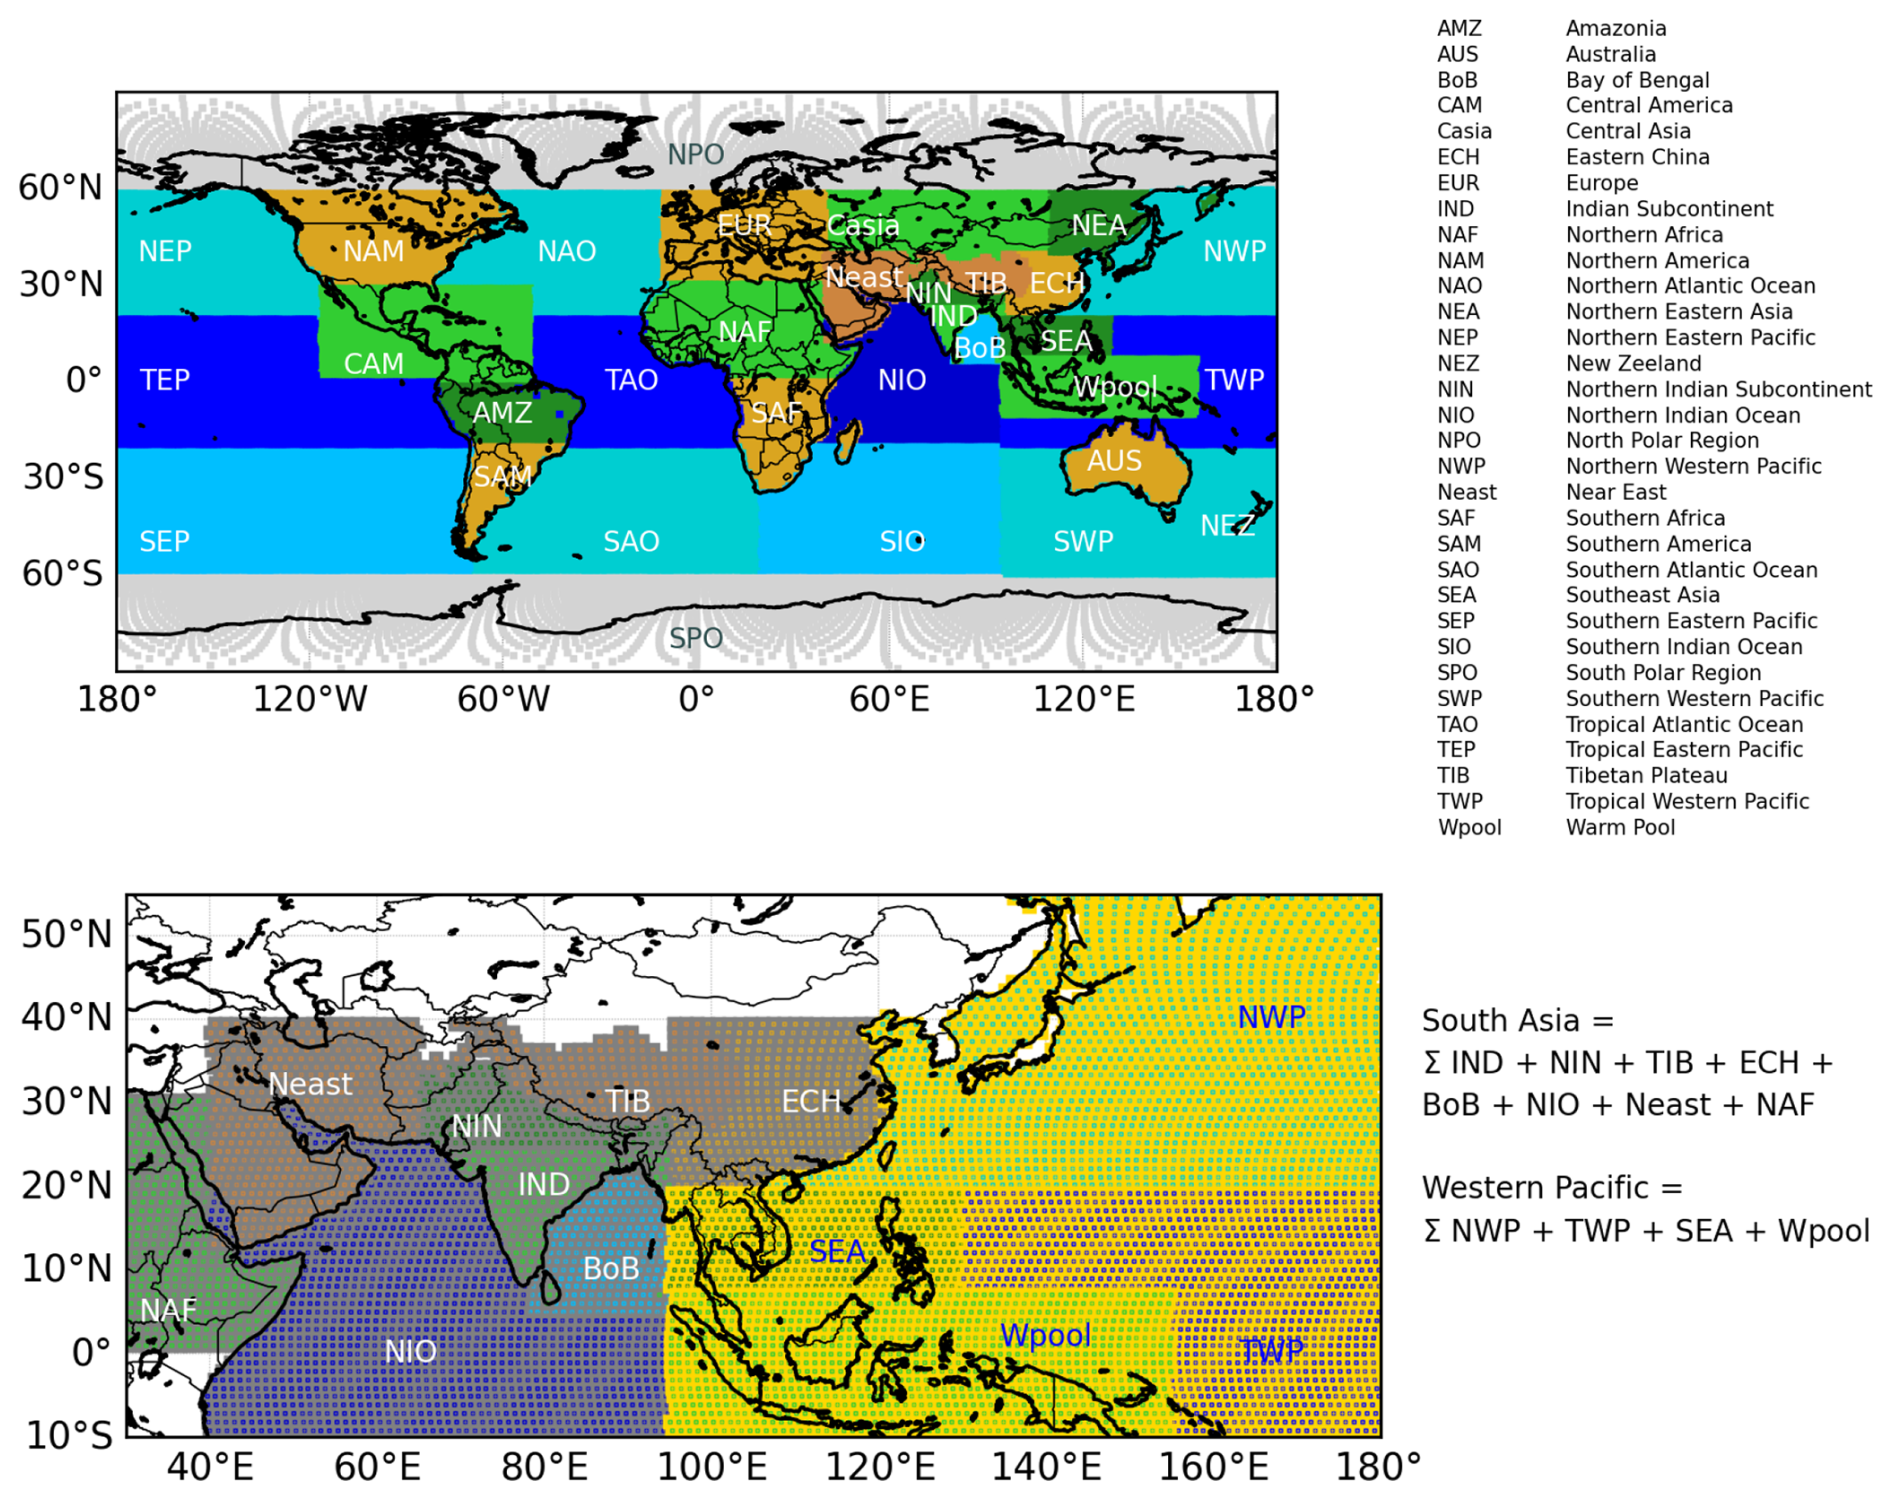
Figure 2Geographical map showing the global distribution of surface–origin tracers implemented in CLaMS (top). The South Asia tracer is defined as the sum of several surface–origin tracers in the Asian summer monsoon region (TIB + IND + NIN + ECH + BoB + NIO + Neast + NAF), and serves as a good proxy for the ASMA (bottom, grey background). The Western Pacific tracer (SEA + Wpool + TWP + NWP) is a good indicator of air uplifted into the UTLS by tropical cyclones in the western Pacific and, more generally, of air masses with marine origin (bottom, yellow background).
3.1 Lagrangian three-dimensional simulations including surface–origin tracer
Three-dimensional CLaMS simulations that include irreversible mixing (applied here every 24 h) (e.g. Konopka et al., 2007) provide a very good representation of observed tracer gradients in the UTLS, particularly near the tropopause and at the edge of the ASMA (e.g. Vogel et al., 2015, 2019; Ploeger et al., 2017, 2024). Here, we use CLaMS simulations with 32 different regional model tracers of surface origin (hereafter referred to as “surface–origin tracers”) that together cover the entire Earth's surface (Fig. 2). The simulation starts on 1 May 2023, during the pre-monsoon period, and covers the entire Asian summer monsoon season of 2023.
These surface–origin tracers are released into the model boundary layer (approximately 2–3 km above the surface, accounting for orography) every 24 h and are subsequently transported – by advection and mixing – into the free atmosphere over the course of the simulation. Surface–origin tracers serve as a valuable diagnostic tool for identifying the surface source regions of air masses. In addition, a surface–origin tracer representing the global model boundary layer (MBL), corresponding to the sum of all regional surface–origin tracers shown in Fig. 2, is included. The global MBL tracer provides an estimate of the age of the air: low MBL fractions indicate a large fraction of aged air masses (i.e. air older than 1 May 2023), such as stratospheric background air.
Previous model studies using CLaMS surface–origin tracers (albeit with a slightly different definition of tracer regions) indicate that young air masses originating from South Asia are largely confined within the ASMA. In contrast, air masses from adjacent regions – particularly from Southeast Asia and the western Pacific – tend to be located near the edge of the ASMA (e.g. Vogel et al., 2015, 2019; Becker et al., 2025). Our simulations show that the following surface–origin tracers contribute in general to the composition of the ASMA: Northern Indian Subcontinent (NIN), Indian Subcontinent (IND), Tibetan Plateau (TIB), Eastern China (ECH), Bay of Bengal (BoB), Northern Indian Ocean (NIO), as well as the Near East (Neast) and Northern Africa (NAF), with the latter two contributing only in small fractions to the composition of the ASMA. In the following, we use the sum of these surface–origin tracers as a marker for air originating from the ASMA and refer to it as the South Asia tracer (although some of these regions are not part of South Asia in the classical geographical sense, the term “South Asia” is used here in an extended sense).
Air masses from the western Pacific, that is the sum of the surface–origin tracers of Southeast Asia (SEA), Warm Pool (Wpool), Tropical Western Pacific (TWP) and Northern Western Pacific (NWP) (Fig. 2) also play a role in the chemical composition of the ASMA (e.g. Li et al., 2017, 2023; Hanumanthu et al., 2020; Vogel et al., 2023; Clemens et al., 2024b) and are frequently observed at its edge (e.g. Li et al., 2017; Vogel et al., 2019), partly due to uplift associated with tropical cyclones.
In general, the Asian summer monsoon is divided into the Indian (South Asian), East Asian, and Western North Pacific summer monsoon regions (Wang and LinHo, 2002). The role of the East Asian monsoon on the chemical composition of the ASMA was studied based on measurements taken during the ACCLIP campaign from South Korea in July and August 2022 (e.g. Smith et al., 2025; Pan et al., 2024, 2025). Compared to that, the StratoClim measurements sampled the core region of the Indian summer monsoon (e.g. Höpfner et al., 2019; Adcock et al., 2021; Vogel et al., 2024). The CLaMS regional surface-origin tracers can be used to link the PHILEAS measurements to sub-regions reflecting the influence of the Indian (South Asian) (surface-origin tracers: IND, NIN) and the East Asian (surface-origin tracer: ECH) as well as to the western North Pacific (surface-origin tracer: NWP) summer monsoon.
These surface–origin tracers – especially the South Asia tracer (excluding contributions from the Near East and Northern Africa) – were used for flight planning during the PHILEAS campaign (Riese et al., 2025) to identify the ASMA, as well as filaments and anticyclonic structures (eddies) detached from it, where simulations with ECMWF forecast and analysis products were used for flight planning. We demonstrate that the South Asia tracer serves as a reliable proxy for polluted air originating from the Asian summer monsoon region. Additionally, the Western Pacific tracer is a useful indicator of air uplifted into the UTLS by tropical cyclones in the western Pacific, and more generally, it serves as a marker for air masses of marine origin.
3.2 Back-trajectory calculations and dehydration analysis
CLaMS trajectory calculations consider only advective transport, neglecting mixing processes entirely. However, back-trajectory calculations are well suited to analyse the detailed transport pathway, transport time, and surface origin of air parcels and therefore provide added value compared to three-dimensional CLaMS simulations including irreversible mixing (as has been shown in previous publications, e.g. Vogel et al., 2019; Lauther et al., 2022; Vogel et al., 2023, 2024). CLaMS diabatic back-trajectories were initiated along the entire flight paths (every 1 s) of all 18 research flights conducted during the PHILEAS campaign. On average, the research flights lasted 6 to 8 h, resulting in approximately 23 000 to 33 000 trajectories calculated per flight, depending on flight duration. Trajectories are considered to terminate in the model boundary layer when they first descend to below approximately 2–3 km above the Earth's surface, accounting for orography (i.e., when the vertical hybrid pressure-potential-temperature coordinate, ζ, satisfies ζ ≤ 120 K) (see details in, e.g., Vogel et al., 2023, 2024). The transport time of each air parcel is defined as the time difference between the start and end points of its back-trajectory in the model boundary layer. Trajectories not ending in the model boundary layer were calculated back to 1 May 2023; representing older air found in the UTLS region. Thus, the length of these trajectories span the same time period as the global three-dimensional CLaMS simulations that include surface–origin tracers (i.e., a quasi-forward calculation including irreversible mixing) and cover both the pre-monsoon and monsoon period. Along the CLaMS back-trajectories as well as along the flight tracks of all scientific PHILEAS flights the local tropopause heights (first and second) were calculated from ERA5 reanalysis data based on the WMO definition according to Hoffmann and Spang (2022).
In addition, the temperature evolution along the back-trajectories is used to check if dehydration can possibly occur along the trajectories. That is in particular important at the convective outflow of tropical cyclones (e.g. Li et al., 2020), but also tropical convection can impact hydration and dehydration in the UTLS (e.g. Schoeberl et al., 2018; Ueyama et al., 2023). To estimate dehydration, the minimum of the water vapour saturation mixing ratio with respect to ice () along the back-trajectories is calculated based on ERA5 temperatures and pressures. Dehydration is only relevant in a first approximation for air masses that are transported from the troposphere into the lower stratosphere. Therefore, tropopause heights along the trajectories are used to check whether the trajectories originate in the troposphere before reaching and remain in the stratosphere afterwards.
Trajectories originating in the stratosphere and being transported into the troposphere, but with only a very short residence time just below the tropopause, are filtered out. Air parcels along the flight track are marked as dehydrated when the following criteria are fulfilled: trajectory (at least 80 % of the time) is below the tropopause before reaching and above afterwards, in addition FISH H2O measurements (total water) should be greater equal and to exclude measurements inside of clouds, FISH RHi has to be lower than 90 %. We determined a value of 80 % as threshold because the time periods of dehydration using thresholds of 70 %, 80 %, and 90 % along the flight tracks remain nearly the same.
4.1 Air mass origin and impact of tropical cyclones
In this study, we focus on the UTLS, and therefore only consider back-trajectories of aircraft measurements taken above 340 K potential temperature. To determine the origin of the air masses sampled during the PHILEAS aircraft campaign, it is crucial to identify the location where the back-trajectories intersect the model boundary layer. Figure 3 (top) shows the frequency distribution of locations where air parcels were traced back to the model boundary layer for all CLaMS back-trajectories initiated above 340 K across all 18 research flights (F02–F20).
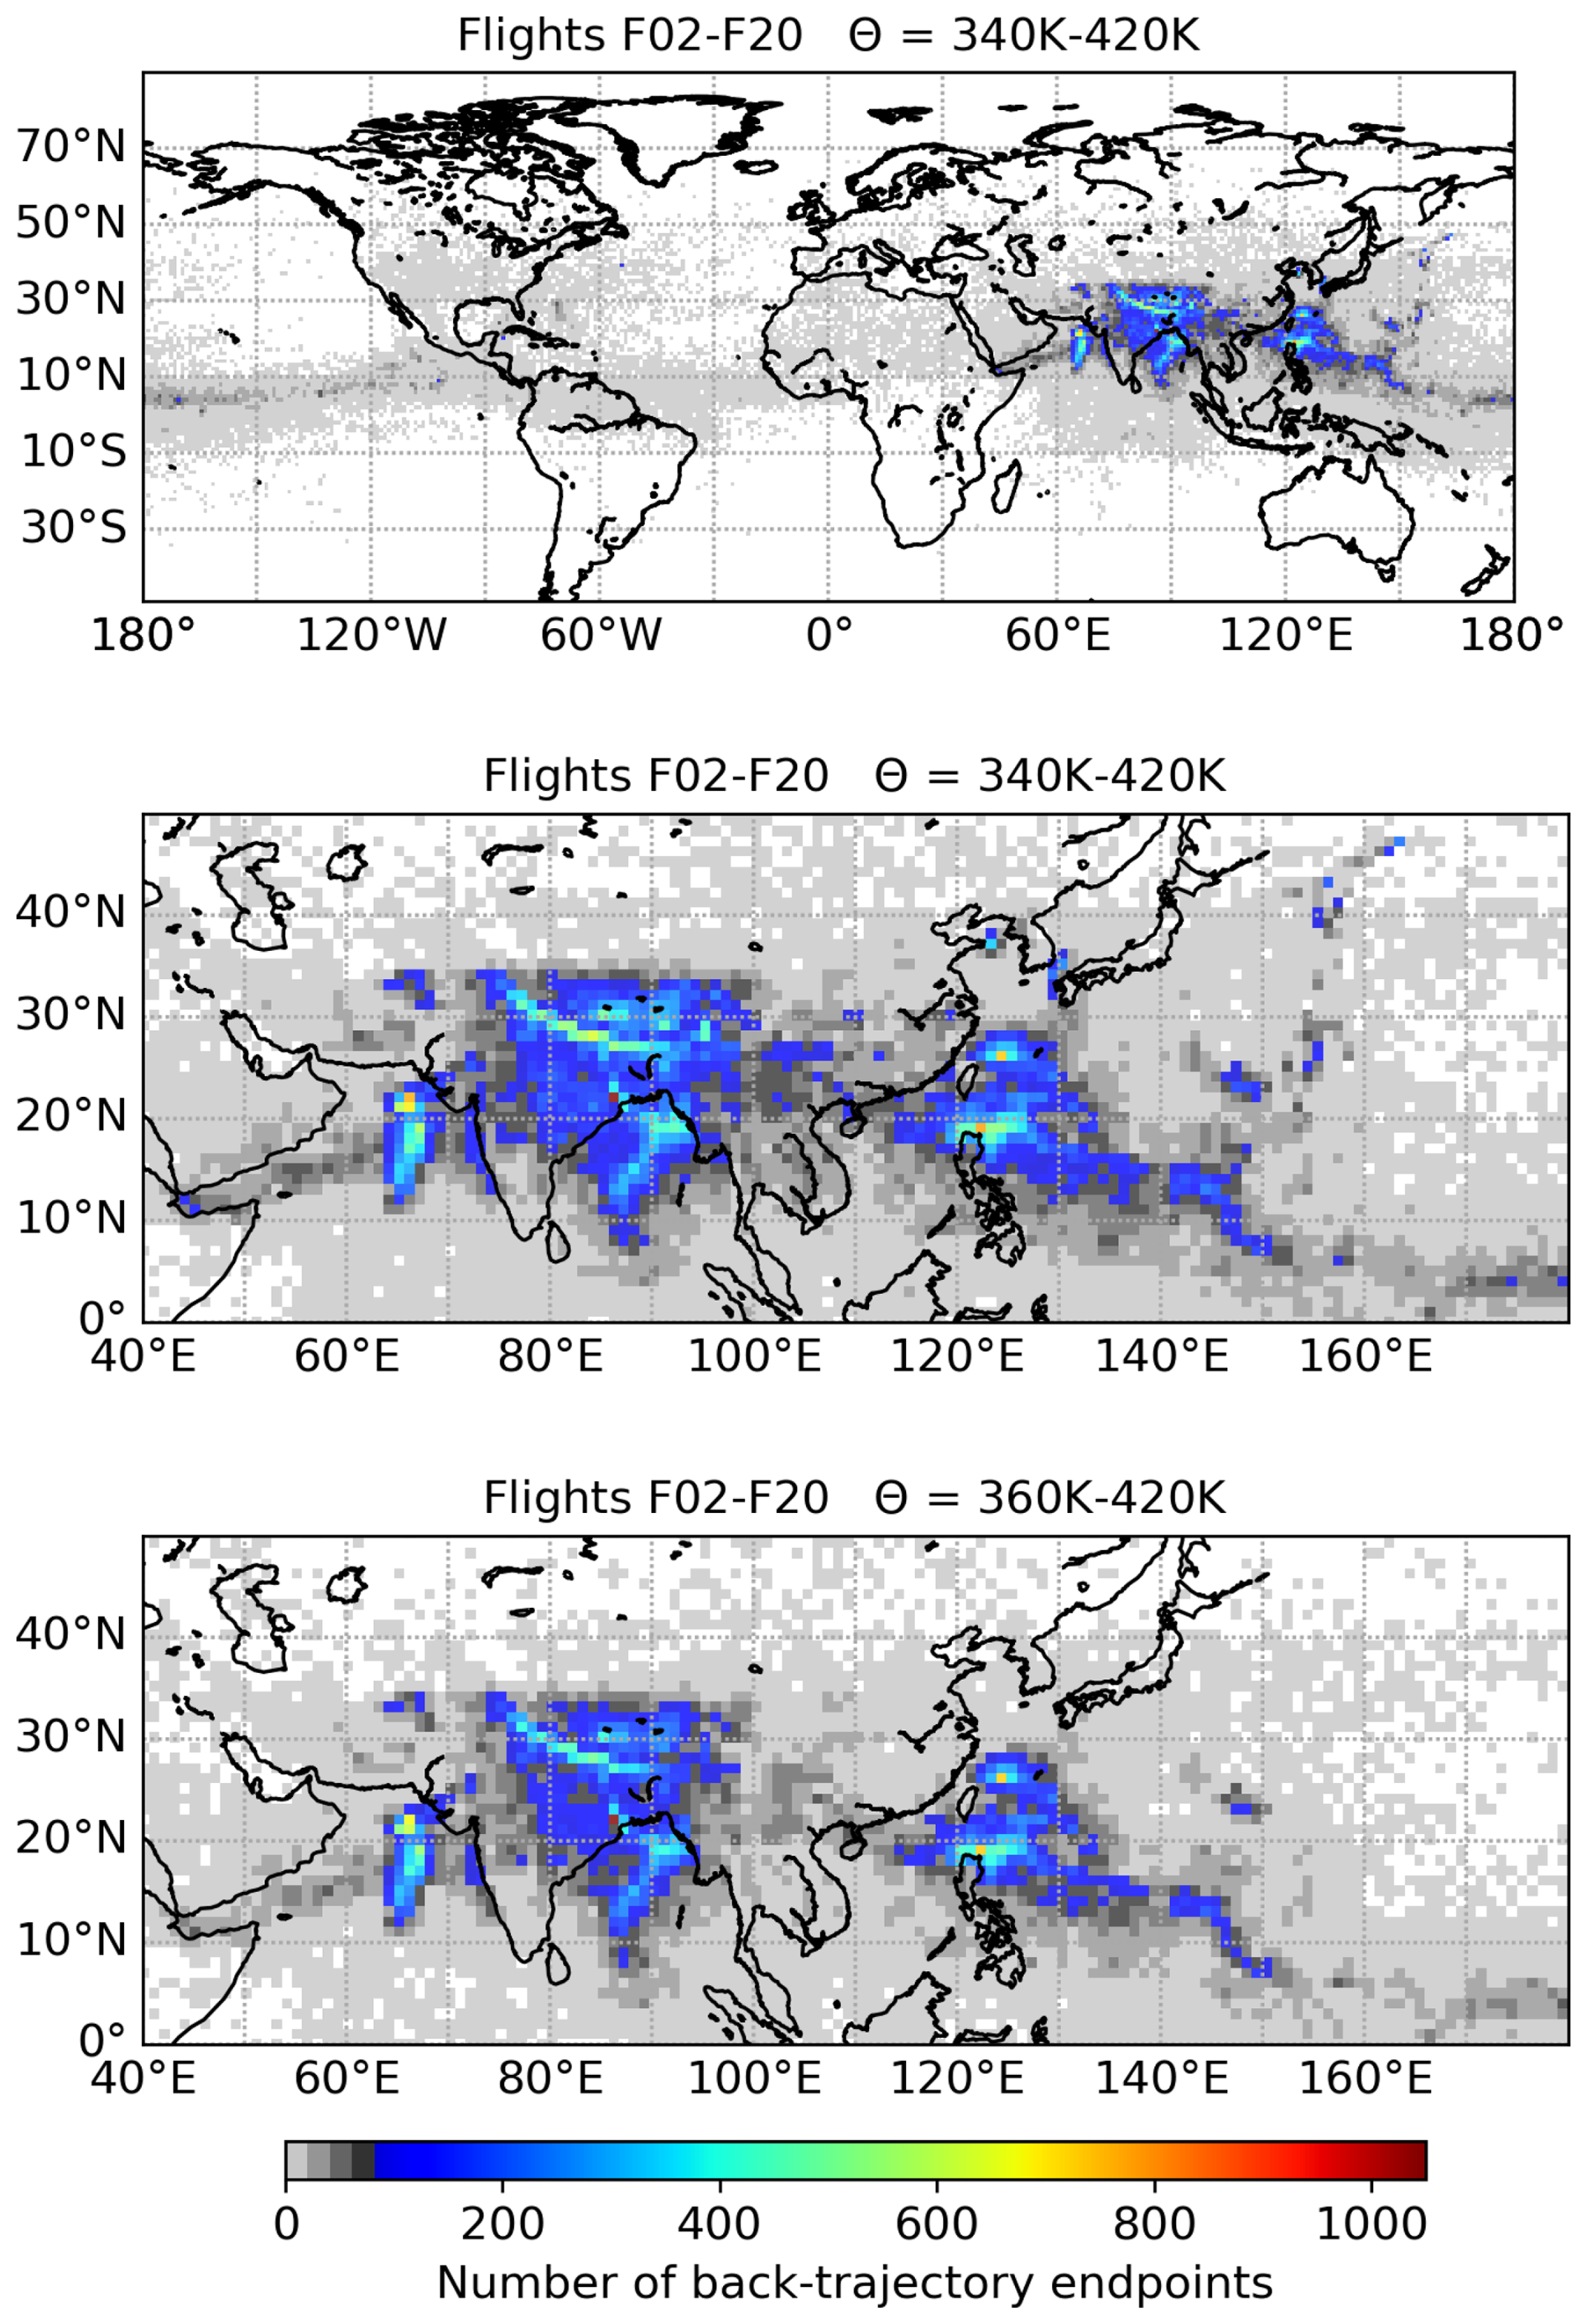
Figure 3Frequency distribution of locations where air parcels along the flight tracks of all PHILEAS research flights (F02–F20) were traced back to the model boundary layer using CLaMS back-trajectory calculations. Frequency distributions are shown for measurements above 340 K in a global view (top) as well as zoomed in on South Asia and the western Pacific (middle). To highlight sources in Asia reaching altitudes of the ASMA an additional frequency distribution for measurements between 360 and 420 K is shown (bottom).
Above 340 K, most back-trajectories originate from two main regions (Fig. 3, middle): (1) South Asia – particularly the Indian Subcontinent, the Arabian Sea, the Bay of Bengal, the Tibetan Plateau, China, and Mainland Southeast Asia – and (2) the Western Pacific, including the eastern coast of China and the regions around Taiwan and the Philippines. The frequency distribution of locations where air parcels were traced back to the model boundary layer motivated our definition of the South Asia tracer and Western Pacific tracer introduced in Sect. 3.1.
When focusing on measurements above the maximum level of convective outflow (i.e. 360 K) up to the maximum flight altitude (420 K), corresponding to the vertical extent of the ASMA (Brunamonti et al., 2018; Gettelman and de Forster, 2002) (Fig. 3, bottom), distinct source regions emerge. The highest frequencies of air mass origins are found over the Arabian Sea, the Bay of Bengal, the northeastern part of the Indian subcontinent, and the western Pacific.
Particularly in the western Pacific, frequent occurrence of strong tropical cyclones is found impacting the PHILEAS measurements. Figure 4 shows the frequency distribution of locations where CLaMS back-trajectories are traced back to the model boundary layer, zoomed to the western Pacific and overlaid with all cyclone tracks that occurred in the western Pacific between 6 June and 8 September 2023 and may have impacted the PHILEAS measurements (provided by the Japan Meteorological Agency; (https://www.jma.go.jp/jma/jma-eng/jma-center/rsmc-hp-pub-eg/besttrack.html, last access: 9 October 2024). The cyclone category is indicated along each cyclone track: tropical depression, tropical storm, severe tropical storm, typhoon and extra-tropical cyclone.
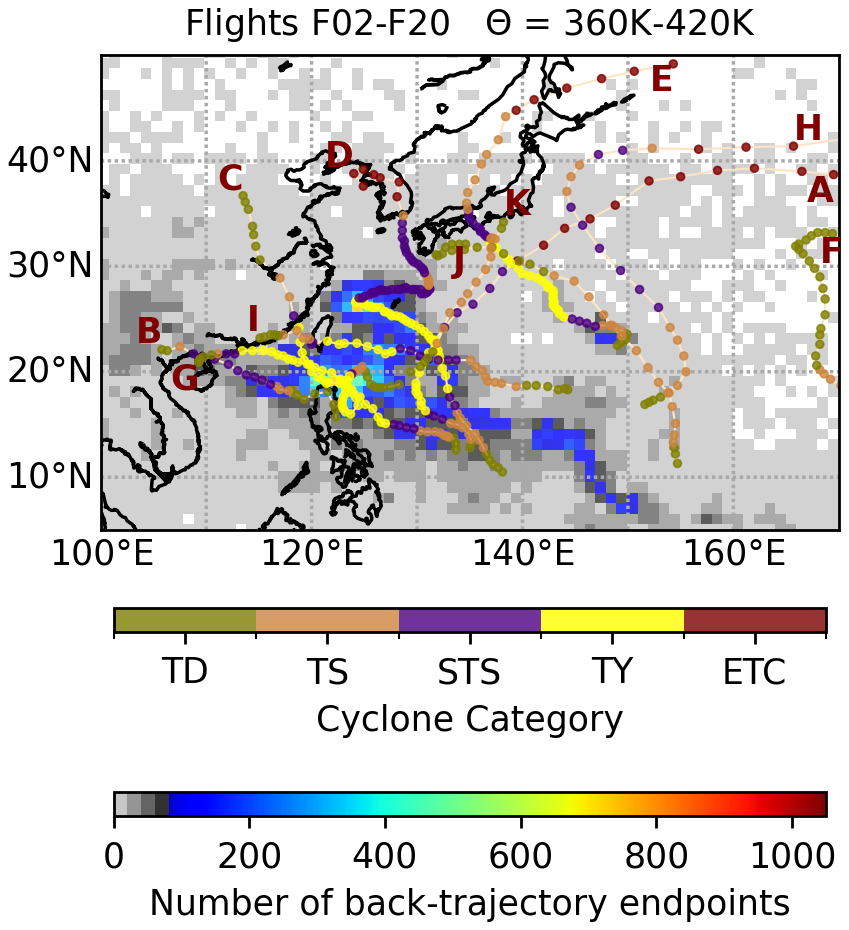
Figure 4Frequency distribution of locations where air parcels were traced back to the model boundary layer using CLaMS back-trajectory calculations (for aircraft measurements taken above potential temperature levels of 360 K), overlaid with cyclone tracks in the western Pacific. Cyclone categories are indicated as follows: Tropical Depression (TD), Tropical Storm (TS), Severe Tropical Storm (STS), Typhoon (TY), Extra-tropical Cyclone (ETC). The following cyclones are included: (A) Guchol (6–16 June 2023), (B) Talim (13–18 July 2023), (C) Doksuri (20–30 July 2023), (D) Khanun (26 July–11 August 2023), (E) Lan (7–18 August 2023), (F) Dora (12–22 August 2023), (G) Saola (22 August–3 September 2023), (H) Damrey (23–30 August 2023), (I) Haikui (27 August–6 September 2023) (J) Kirogi (29 August–6 September 2023) and (K) Yun-Yeung (4–8 September 2023). The end of each cyclone track is marked by the corresponding capital letter.
A strong local coincidence between the frequency distribution of air mass origins and cyclone tracks is found for tropical cyclones (B) Talim, (C) Doksuri, (G) Saola and (I) Haikui north of the Philippines; the latter three were all categorised as a typhoon in this region (Fig. 4). Furthermore, a strong spatial overlap is observed for tropical cyclones (D) Khanun during its transition from a typhoon to a severe tropical storm off the eastern coast of China, and later during its landfall in the region of Japan, Korea, and the Chinese coast. For each PHILEAS flight (F02–F20), a local coincidence is found between the frequency distribution of air mass origins (for measurements above 360 K potential temperature) at least with one of the tropical cyclones shown in Fig. 4. Further details are discussed for selected PHILEAS flights in Sect. 4.3.
4.2 CH4–CH2Cl2 relations indicating pollution sources in South Asia
Tracer–tracer relations of different measured trace gases are commonly used to diagnose mixing between air masses of different origin, such as between tropospheric and stratospheric air masses (e.g. Hoor et al., 2002; Hegglin and Shepherd, 2007; Pan et al., 2007). In this study, tracer–tracer relations, namely CH4–CH2Cl2 relations, based on in situ measurements are combined with surface–origin tracers from three–dimensional global CLaMS simulations (e.g. Vogel et al., 2011; Lauther et al., 2022). The CLaMS surface–origin tracers are interpolated in space and time along the flight paths of all PHILEAS research flights (F02–F20). Only flight segments above 340 K are considered here in tracer–tracer relations to remove the impact of the lower troposphere. Using CH4–CH2Cl2 relations in combination with CLaMS surface-origin tracers, the variability of the chemical composition of monsoon-influenced air depending on the air mass origin – thus the variability of CH2Cl2 sources in Asia – will be analysed. Further, we will demonstrate that air masses originating from South Asia exhibit a different chemical composition compared to those from the western Pacific.
South Asia is a substantial source of methane (CH4) – an important greenhouse gas, primarily due to elevated emissions from rice paddies (e.g. Park et al., 2004; Schuck et al., 2010; Tao et al., 2024). These emissions lead to a statistically significant increase in CH4 in the ASMA and subsequently in the northern extratropical UTLS during summer and autumn (e.g. Baker et al., 2012; Rolf et al., 2018; Zhu et al., 2025).
The PHILEAS campaign overview paper by Riese et al. (2025) proposed an identification of monsoon-influence based on CH4 mixing ratios exceeding a threshold of 1850 ppbv (referring to Rolf et al., 2018). In our study, no specific CH4 threshold is applied, because in the outflow of the ASMA, mixing of monsoon air with surrounding air masses occurs, reducing the enhanced CH4 mixing ratios associated with the ASMA. Because only flight segments above 340 K are considered here, enhanced CH4 measured in the lower troposphere over Europe and North America and in particular measured during take-off and landing of the research aircraft are not taken into account in our analysis.
Dichloromethane (CH2Cl2), a chlorine-containing very short-lived halogenated substance (VSLS), originates mainly from anthropogenic sources – in particular from China and India (Feng et al., 2018; Say et al., 2019). An average annual increase of 13 % in emissions of the industrially produced CH2Cl2 was reported for the time period between 2011 and 2019 – primarily from eastern China (An et al., 2021). Recent studies highlight the increasing influence of chlorine-containing VSLS such as CH2Cl2 that is not regulated by the Montreal Protocol on the stratospheric chlorine budget and therefore their possible role in ozone depletion (e.g. Hossaini et al., 2017; Claxton et al., 2019; Dubé et al., 2025). The coincidence of strong CH2Cl2 sources in Asia, in particular in eastern China, and the Asian summer monsoon that transport surface emissions from Asia very fast into the northern lower stratosphere, makes CH2Cl2 measurements in the ASMA and in its outflow very important. Previous aircraft measurements already confirm that CH2Cl2 is enhanced over Asia. Over the Indian subcontinent CH2Cl2 mixing ratios up to ∼ 140 ppt were measured during the StratoClim aircraft campaign in 2017, a factor of more than two more than reported previously at the tropical tropopause (∼ 50 ppt) (Adcock et al., 2021). During the ACCLIP aircraft campaign in 2022 record-breaking mixing ratios up to ∼ 600 ppt CH2Cl2 were measured at tropopause altitudes at the eastern edge of the ASMA (over Korea and Japan) (Pan et al., 2024). Export of air from the ASMA to the northern extratropical UTLS leads to enhanced CH2Cl2 mixing ratios over the Atlantic Ocean and Northern Europe (Lauther et al., 2022) as well as in the Arctic (Laube et al., 2025).
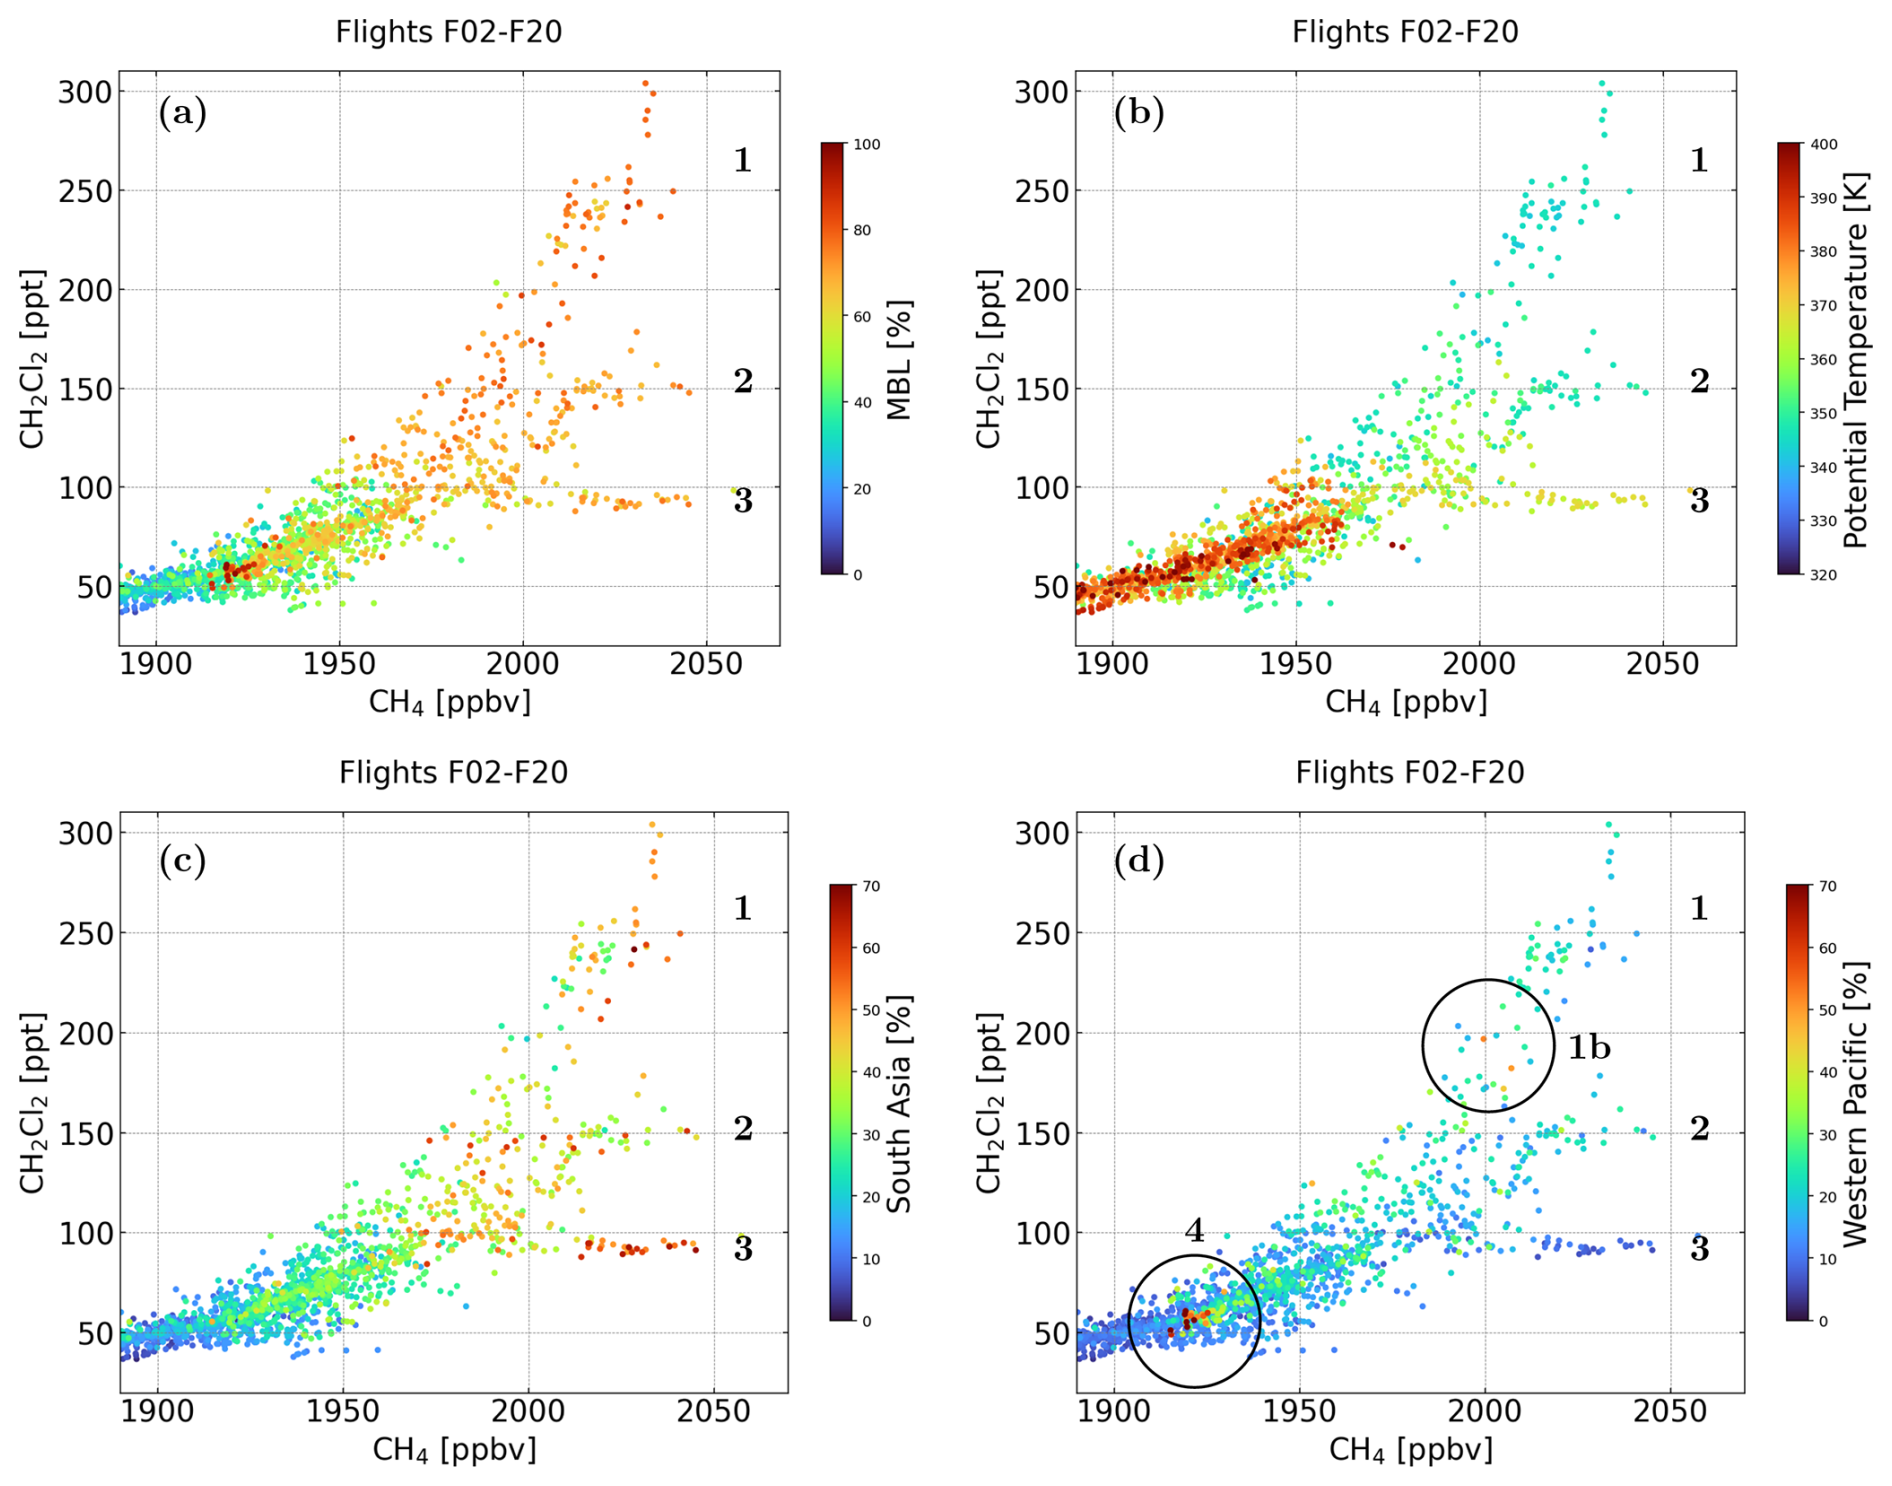
Figure 5CH4–CH2Cl2 relations for all scientific PHILEAS flights F02–F20, colour-coded by entire (a) model boundary layer (MBL) and (b) potential temperature for measurements above 340 K. The MBL tracer serves as an indicator for young air (younger than 1 May 2023). The (c) South Asia (TIB + IND + NIN + ECH + BoB + NIO + Neast + NAF) and (d) Western Pacific (SEA + Wpool + TWP + NWP) tracers indicate different origins of air in different parts of the CH4–CH2Cl2 relation.
In this study, we use CH4–CH2Cl2 relations as an indicator of monsoon-influenced air. The variability of CH2Cl2 over Asia helps to identify local source regions within the continent. The CH4–CH2Cl2 relation over all scientific PHILEAS flights (F02–F20) is shown in Figure 5. It demonstrates that the CH4–CH2Cl2 relation is split into three distinct branches (clearly distinguishable by visual inspection) with varying CH2Cl2 mixing ratios at high CH4 levels (greater than 2000 ppbv): up to 300 ppt of CH2Cl2 (branch 1 in Fig. 5), around 150 ppt (branch 2 in Fig. 5), and nearly 100 ppt (branch 3 in Fig. 5). All three branches are associated with contributions of the global model boundary layer (MBL; released since 1 May 2023) tracer exceeding 60 % (Fig. 5a), indicating young air masses and reflecting the short atmospheric lifetime of CH2Cl2 (∼ 6 months). Branches 1 and 2 correspond to measurements around 350 K potential temperature, while branch 3 was observed at higher altitudes, around 370 K (Fig. 5b). Thus only branch 3 constitutes measurements at altitudes of the ASMA.
Analysis of the South Asia and Western Pacific surface-origin tracers in Fig. 5c–d reveals that branches 1 and 2 have intermediate contributions from South Asia (reddish colours; fractions greater than 45 % ) mixed with lower fractions from the Western Pacific (∼ 25 %–35 %), except in the part of the relation in Fig. 5d denoted by 1b, where also substantial fractions from the Western Pacific (∼ 40 %–50 %) were found. The surface-origin tracers for more specific regions, which contribute to the South Asia and Western Pacific tracer (Appendix A1; Fig. A1), show that branch 1 is related to air mass origin in eastern China (ECH) and the Northern Western Pacific (NWP; in particular in region 1b) and branch 2 is related to eastern China (ECH), Northern Indian Subcontinent (NIN) and the Tropical Western Pacific (TWP). Thus our findings confirm that enhanced CH2Cl2 in the UTLS can be attributed to sources in China (Feng et al., 2018; An et al., 2021; Pan et al., 2024; Jesswein et al., 2025).
In contrast, in branch 3 the fractions from South Asia are up to 70 %, with minor contributions from the Western Pacific (tracer lower than 10 %). Here the Indian Subcontinent (IND) and Bay of Bengal (BoB) are the main surface-origin tracers that contribute (Appendix A1; Fig. A1). CH2Cl2 mixing ratios in a similar range (up to about 140 ppt) were also measured during the StratoClim aircraft campaign over the Indian subcontinent, near the tropopause (Adcock et al., 2021).
Large fractions of the Western Pacific tracer (up to 70 %) are found for CH4 mixing ratios of ∼ 1950 ppbv and CH2Cl2 mixing ratios of ∼ 50–60 ppt denoted as region 4 in Fig. 5d. These low CH2Cl2 mixing ratios correspond to the northern hemispheric background from ground-based CH2Cl2 measurements during summer performed outside of Asia (https://www-air.larc.nasa.gov/missions/agage/static/figures/monthly/pdf/CH2Cl2_mm.pdf, last access: 5 May 2026; https://gml.noaa.gov/hats/gases/CH2Cl2.html, last access: 27 January 2026). Thus, air masses in region 4 are most likely marine air from the western Pacific, because both CH4 and CH2Cl2 have only minor marine sources, and a large fraction – up to 70 % – of the Western Pacific tracer is found.
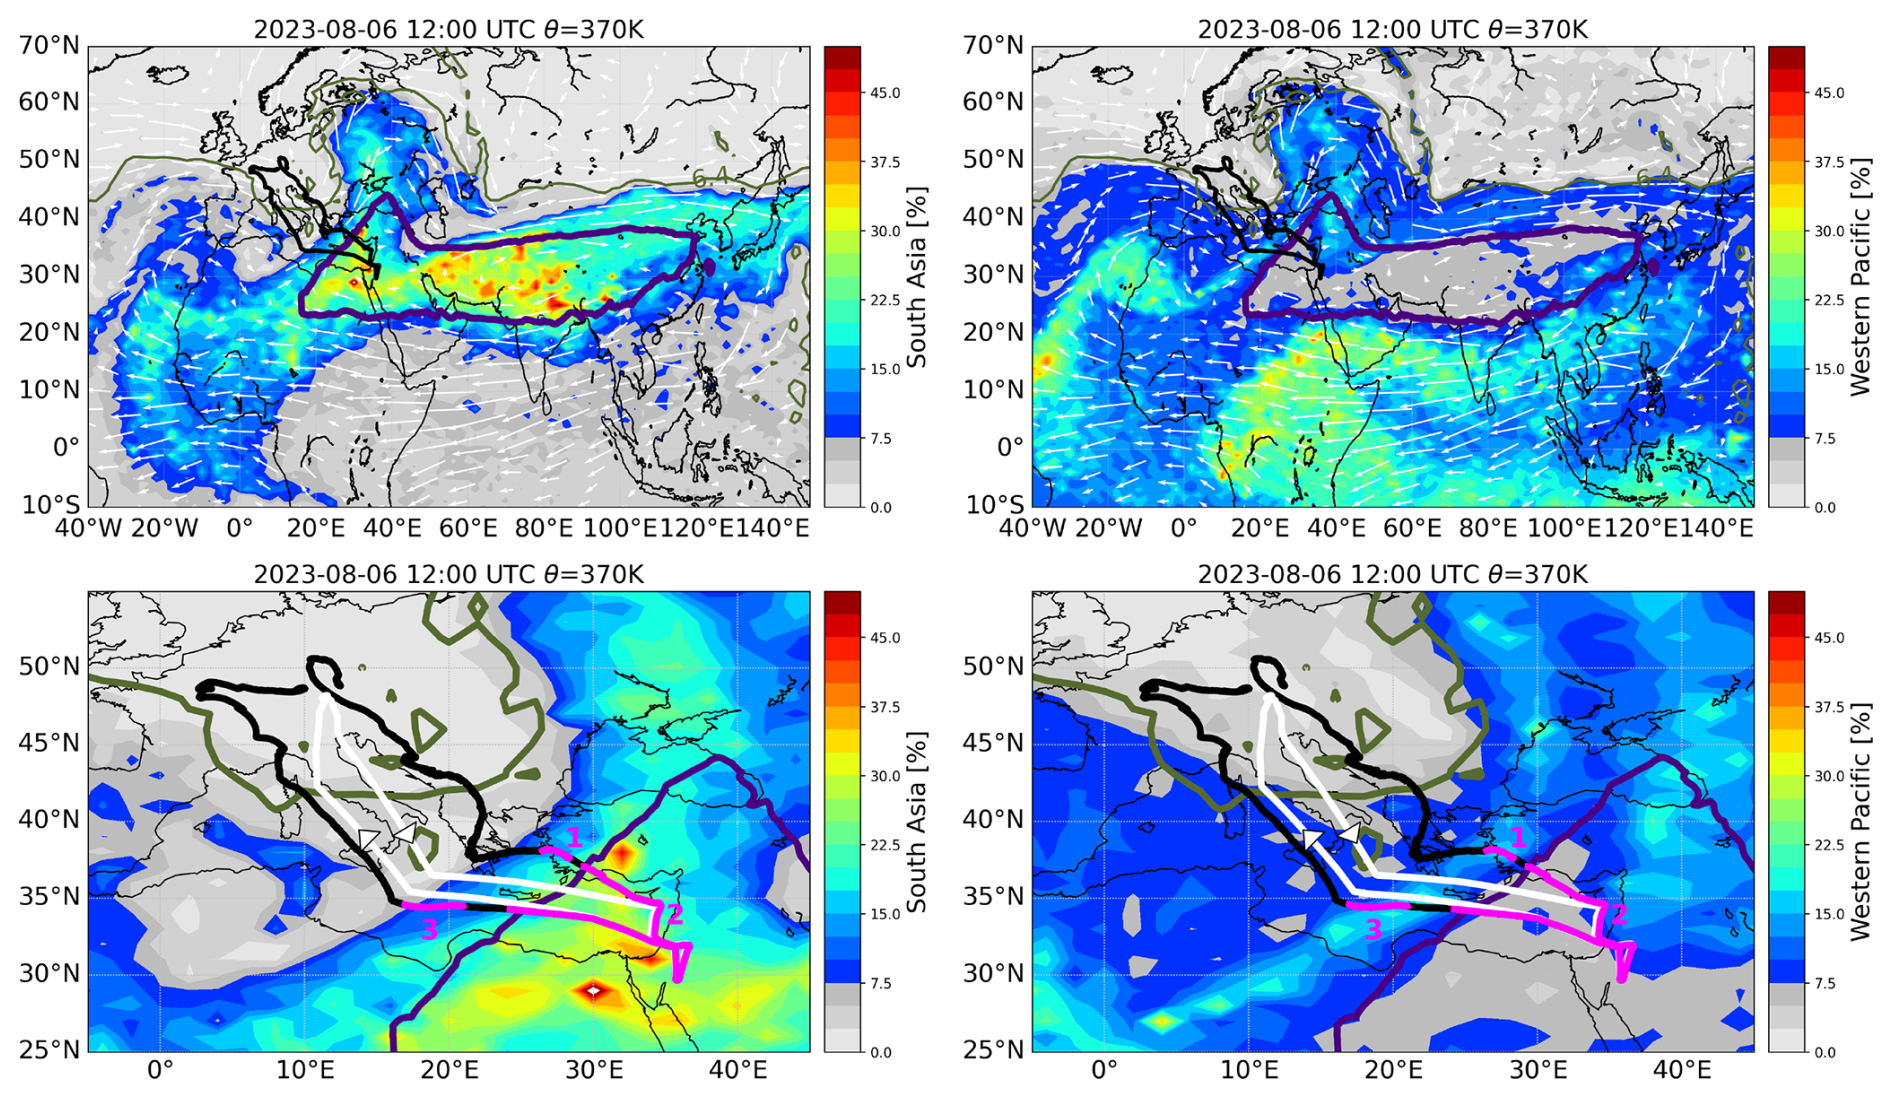
Figure 6Research flight F02 on 6 August 2023 conducted from Oberpfaffenhofen, Germany, to the Mediterranean area intruding into the western part of the ASMA (South Asia surface–origin tracer at 370 K, 12:00 UTC, left). The entire anticyclone (top) as well as a zoom to the flight area (bottom) are shown. A belt of air from the western Pacific is found around the outer edge of the ASMA (Western Pacific surface–origin tracer at 370 K, 12:00 UTC, right). The surface–origin tracer distributions are based on a CLaMS simulation driven by ERA5. To align the flight tracks with the synoptic CLaMS model output at 12:00 UTC, the actual flight positions (white line) were extrapolated to 12:00 UTC positions using forward and backward CLaMS trajectories to calculate the synoptic HALO flight track (black line). To indicate the edge of the ASMA (indigo line), the boundary of the ASMA is calculated using the Montgomery streamfunction. An optimised Montgomery streamfunction value gives the ASMA boundary (MSF = 357.3 × 10³ m2 s−2) for 6 August 2023 at 12:00 UTC and 370 K using ERA5 reanalysis data based on the method by Kachula et al. (2025). The climatological isentropic transport barrier (PV = 6.4 PVU) derived by Kunz et al. (2015) for the Northern Hemisphere at 370 K during summer indicates the barrier between the tropical tropopause layer and the extra-tropical lower stratosphere (olive line). Further, horizontal winds from ERA5 are indicated by white arrows. Time intervals 1–3 shown in Fig. 8 are marked in magenta.
To demonstrate that other parts of the world, besides South Asia and the Western Pacific, have only a minor impact on the PHILEAS measurements, the CH4–CH2Cl2 relation is shown for surface–origin tracers representing the northern background (only relevant for local CH4 emissions observed during take-off and landing of the HALO aircraft) that contributes with a fraction of ∼ 10 % and the residual surface (mainly parts of the Southern Hemisphere) that has a negligibly impact (∼ 0 %) on the PHILEAS flights in Appendix A1 (Fig. A2).
In the following, we discuss three research flights (F02, F06, and F08) as case studies, focusing on potential temperature levels of the ASMA (greater than 360 K), to analyse the impact of the origin of the air masses on the chemical composition of the ASMA and its outflow, as well as the influence of tropical cyclones at these potential temperature levels. The presented analysis of the CH4–CH2Cl2 relationship for all PHILEAS flights helps to place the measured CH4 and CH2Cl2 mixing ratios of the selected case studies within the variability observed across all PHILEAS flights.
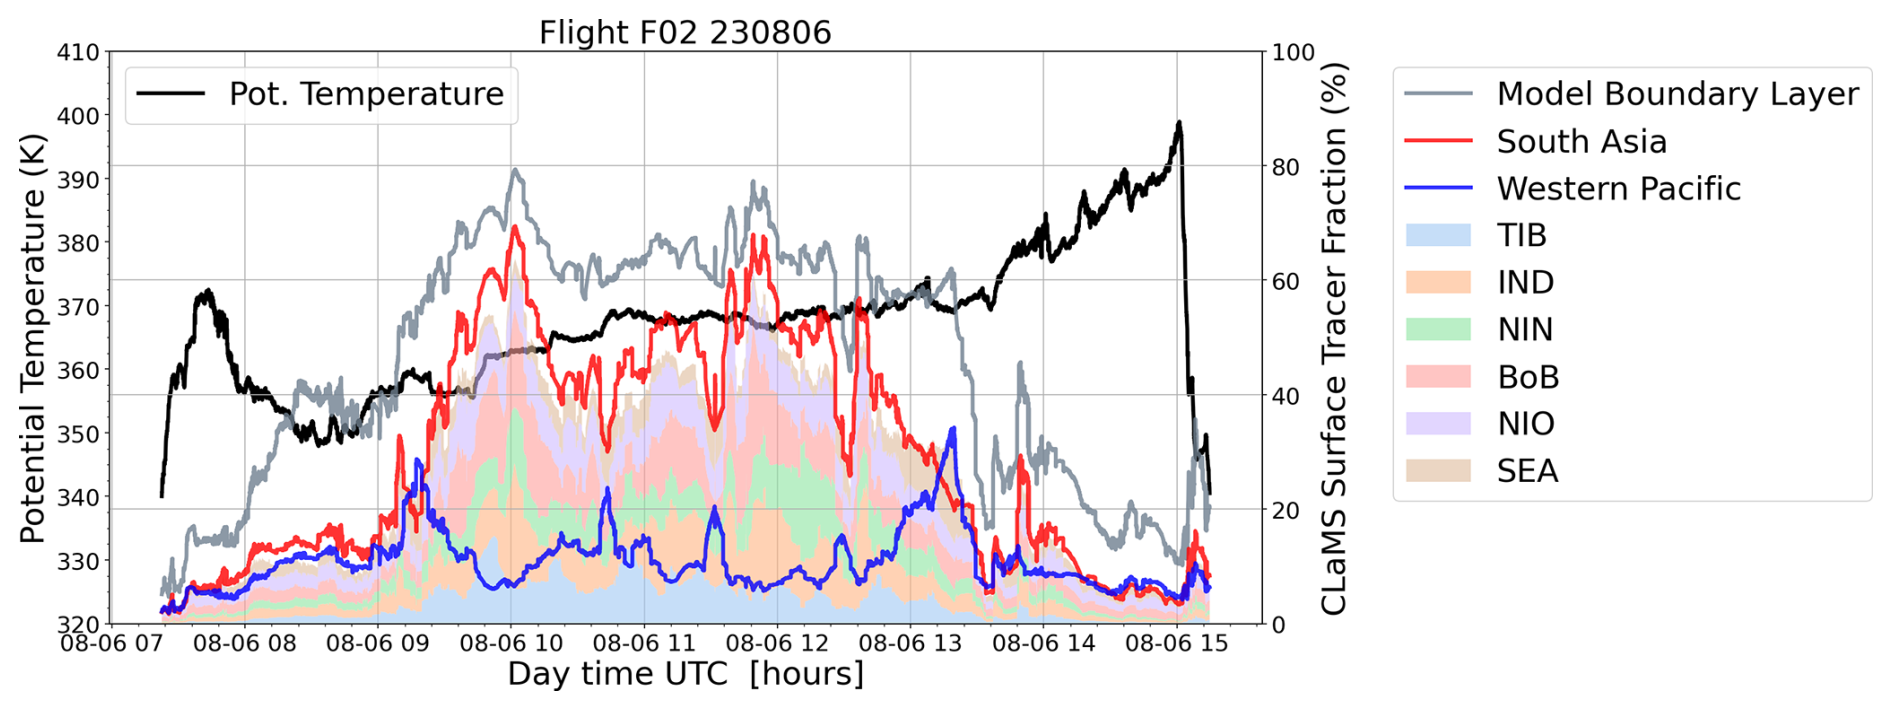
Figure 7Surface–origin tracers for the model boundary layer, South Asia and the Western Pacific interpolated in space and time along the flight track of research flight F02 on 6 August 2023. In addition, individual surface-origin tracers with fractions greater than 10 % are shown as a stacked plot (TIB, IND, NIN, BoB, NIO, and SEA).
4.3 Case studies of selected flights
4.3.1 Research flight F02 (6 August 2023): The western part of the anticyclone
Research flight F02 on 6 August 2023 was conducted from Oberpfaffenhofen, Germany, to the Mediterranean area and intruded into the western part of the ASMA located over the eastern Mediterranean region (Fig. 6, left). To indicate the edge of the ASMA, its horizontal boundary is calculated on selected isentropes using an optimised Montgomery streamfunction value based on the recently published method by Kachula et al. (2025). An advantage of this method is that it can be applied at any time scale, allowing the selection of individual days or specific hours. In Fig. 6, the optimised Montgomery streamfunction value is calculated on 370 K potential temperature for 6 August 2026 at noon using ERA5 reanalysis data. A belt of air from the western Pacific is found at the outer edge of the ASMA that was crossed by the HALO aircraft twice (Fig. 6, right). Further, at the turning point of the flight track above the Arabian Peninsula, a filament of air from the western Pacific was reached caused by a meandering subtropical jet.
Air masses measured in the western part of the ASMA and in its westward outflow (air outside the ASMA) mainly originate from the Indian subcontinent (IND, NIN, BoB, TIB, NIO); the main contributions from the western Pacific are from Southeast Asia (SEA) (Fig. 7). Between approximately 09:15 and 13:30 UTC, the ASMA (Fig. 6, bottom panel, interval 2) and the belt of air from the western Pacific (Fig. 6, bottom panel, intervals 1 and 3), were crossed by the research plane. Qualitatively Fig. 7 shows that within this flight segment (intervals 1–3) the South Asia tracer and the Western Pacific tracer along the flight track exhibit opposite variations indicating that here the two different air masses are separated and not well mixed. This separation is caused by the transport barrier at the edge of the ASMA. Before and after this flight segment (intervals 1–3), fractions of the South Asia tracer are in general small ∼ 10 % (except at 13:50 UTC where a small monsoon-influenced filament (outflow) was crossed).
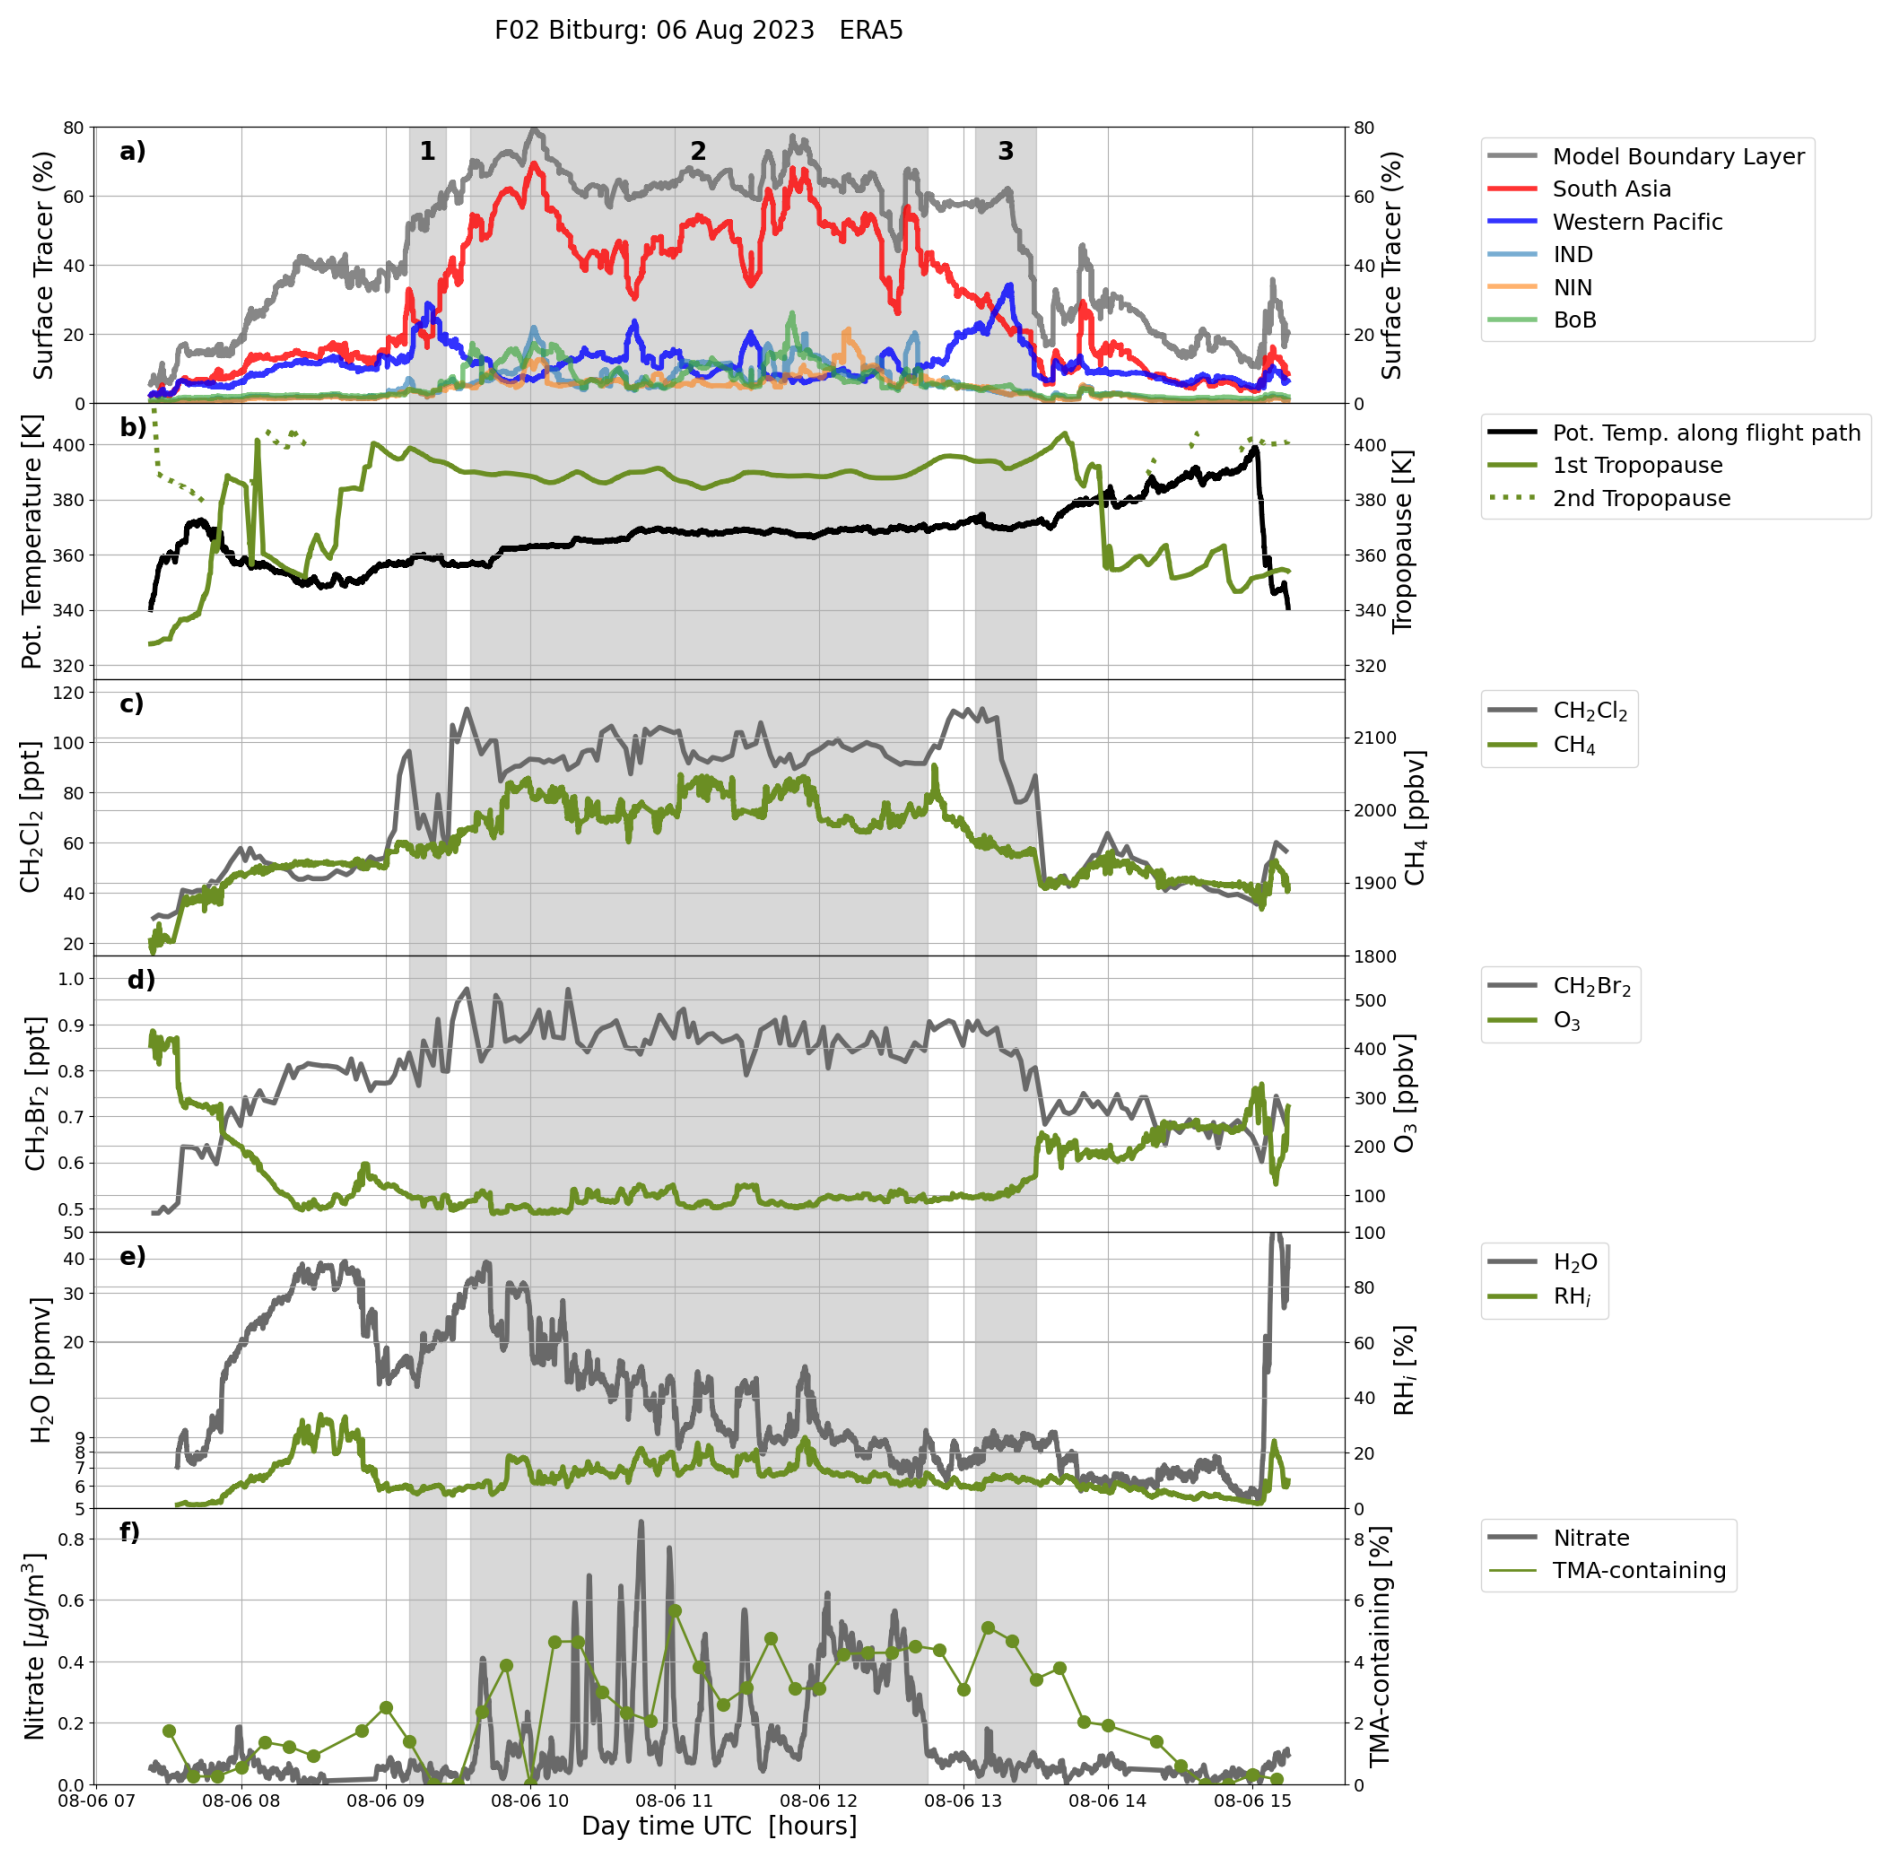
Figure 8Surface–origin tracers interpolated along the flight track of research flight F02 on 6 August 2023, potential temperature along the flight track, potential temperature at the tropopause as well as measurements of different chemical trace gases such as CH2Cl2, CH4, CH2Br2, O3, H2O, relative humidity with respect to ice RHi as well as nitrate mass concentration and TMA fractions from aerosol particles. Only regional surface–origin tracers with fractions greater than 20 % are shown for better visibility. In intervals 1 and 3 (see Fig. 6) enhanced fraction of the Western Pacific and in interval 2 of the South Asia tracer are found. Note that H2O, RHi and nitrate are smoothed over 10 s.
Main parts of research flight F02 in particular intervals 1–3 are below the local tropopause (Fig. 8), thus characterise tropospheric air masses. In contrast to the end of the flight outside the ASMA over Europe, stratospheric air was measured. The time series of the surface–origin tracers interpolated along the flight track of research flight F02 are qualitatively compared with measurements of different chemical trace gases namely CH2Cl2, CH4, CH2Br2, O3 and H2O including RHi as well as particulate nitrate and the number fraction of particulate TMA (Fig. 8). The number fraction refers to the number of particles containing TMA divided by the total number of particles measured within the 10 min time interval.
Particulate nitrate is used as indicator for air from the Asian tropopause aerosol layer (ATAL) (e.g. Höpfner et al., 2019; Appel et al., 2022; Köllner et al., 2026); mass concentrations of up to 0.8 µg m−3 were found in time interval 2. During the StratoClim aircraft campaign over the Indian subcontinent in summer 2017, nitrate mass concentrations of up to 1 µg m−3 were measured within the ASMA and the ATAL (Appel et al., 2022). Further, PHILEAS measurements show that outside the ASMA (and the ATAL), nitrate mass concentrations in UTLS aerosol are generally very low, often close to zero. Further, in time interval 2 enhanced fractions of the South Asia tracer (up to 70 %) are found simultaneously with enhanced mixing ratios of pollutants and greenhouse gases such as CH2Cl2 (up to 120 ppt), CH4 (> 2000 ppbv) and enhanced fraction of TMA-containing particles (up to 6 %).
Interval 2 (Fig. 8) is flanked by interval 1 and 3 – crossing the belt of air from the western Pacific at the edge of the ASMA – here fractions of the Western Pacific tracer of up to 35 % are simulated. Within these flight segments mixing ratios of pollutants and greenhouse gases such as CH2Cl2, CH4 as well as mass concentrations of particulate nitrate are low or are decreasing (e.g. in interval 3). Marine sources are indicated by low ozone mixing ratios (≲ 100 ppbv) or enhanced dibromomethane CH2Br2 (≳ 0.7–0.8 ppt) (Adcock et al., 2021) that has mostly natural oceanic sources in contrast to chlorinated VSLS such as CH2Cl2 that has mainly anthropogenic sources. In all three intervals 1–3, ozone mixing ratios are low and CH2Br2 mixing ratios are enhanced indicating marine sources, however there is no strong difference between interval 2 compared to interval 1 and 3.
An increased fraction of TMA-containing particles during intervals 2 and 3 (Fig. 8, bottom) was observed. Gaseous TMA originates from both natural and anthropogenic sources, including emissions from marine biota, biomass burning, and animal husbandry (Gibb et al., 1999; Facchini et al., 2008; Ge et al., 2011). Once released into the atmosphere, TMA can participate in aerosol chemistry through gas-to-particle conversion and dissolution in cloud droplets. ERICA-LAMS single-particle spectra further indicate that TMA was internally mixed with nitrate, ammonium, and sulfate (see Fig. B1 in Appendix B). These observations suggest, first, that TMA may contribute to particle formation and growth within the ASMA, alongside ammonium, nitrate, and sulfate. Second, they point to South Asia and the Western Pacific as potential source regions, and/or to shared emission sources – such as agricultural activities in northern India – for TMA and other compounds like ammonia.
In general, the Asian summer monsoon is a source of water vapour in the UTLS caused by the relatively high cold point tropopause in the ASMA (Rosenlof et al., 1997; Ploeger et al., 2013; Rolf et al., 2018). Also during flight F02 the tropopause is at higher potential temperature during flight segments within the ASMA (corresponding to enhanced fractions of the South Asia tracer in interval 2; Fig. 8). Research flight F02 is the only flight probing air from inside the western part of the ASMA, therefore relatively high water vapour mixing ratios (up to ∼ 30 ppmv) in interval 2 (Fig. 8) are measured above 360 K potential temperature (for more details to H2O mixing ratios during PHILEAS see Fig. A3 in Appendix A2). In general, H2O is decreasing with increasing potential temperature, however, there is also a lot of additional variability of FISH total water mixing ratios along the flight path of research flight F02. Low fractions of the relative humidity with respect to ice (RHi) (< 20 %) indicate that cloud formation did not occur during the measurements in intervals 1–3, thus FISH total water mixing ratios correspond here to gas-phase H2O mixing ratios. FISH H2O in intervals 1 and 3, are different compared to water vapour in interval 2 at adjacent levels of potential temperature below the local tropopause. These findings suggest that air masses in intervals 1 and 3 or parts of them have different origins and transport pathways compared to air masses measured in interval 2.
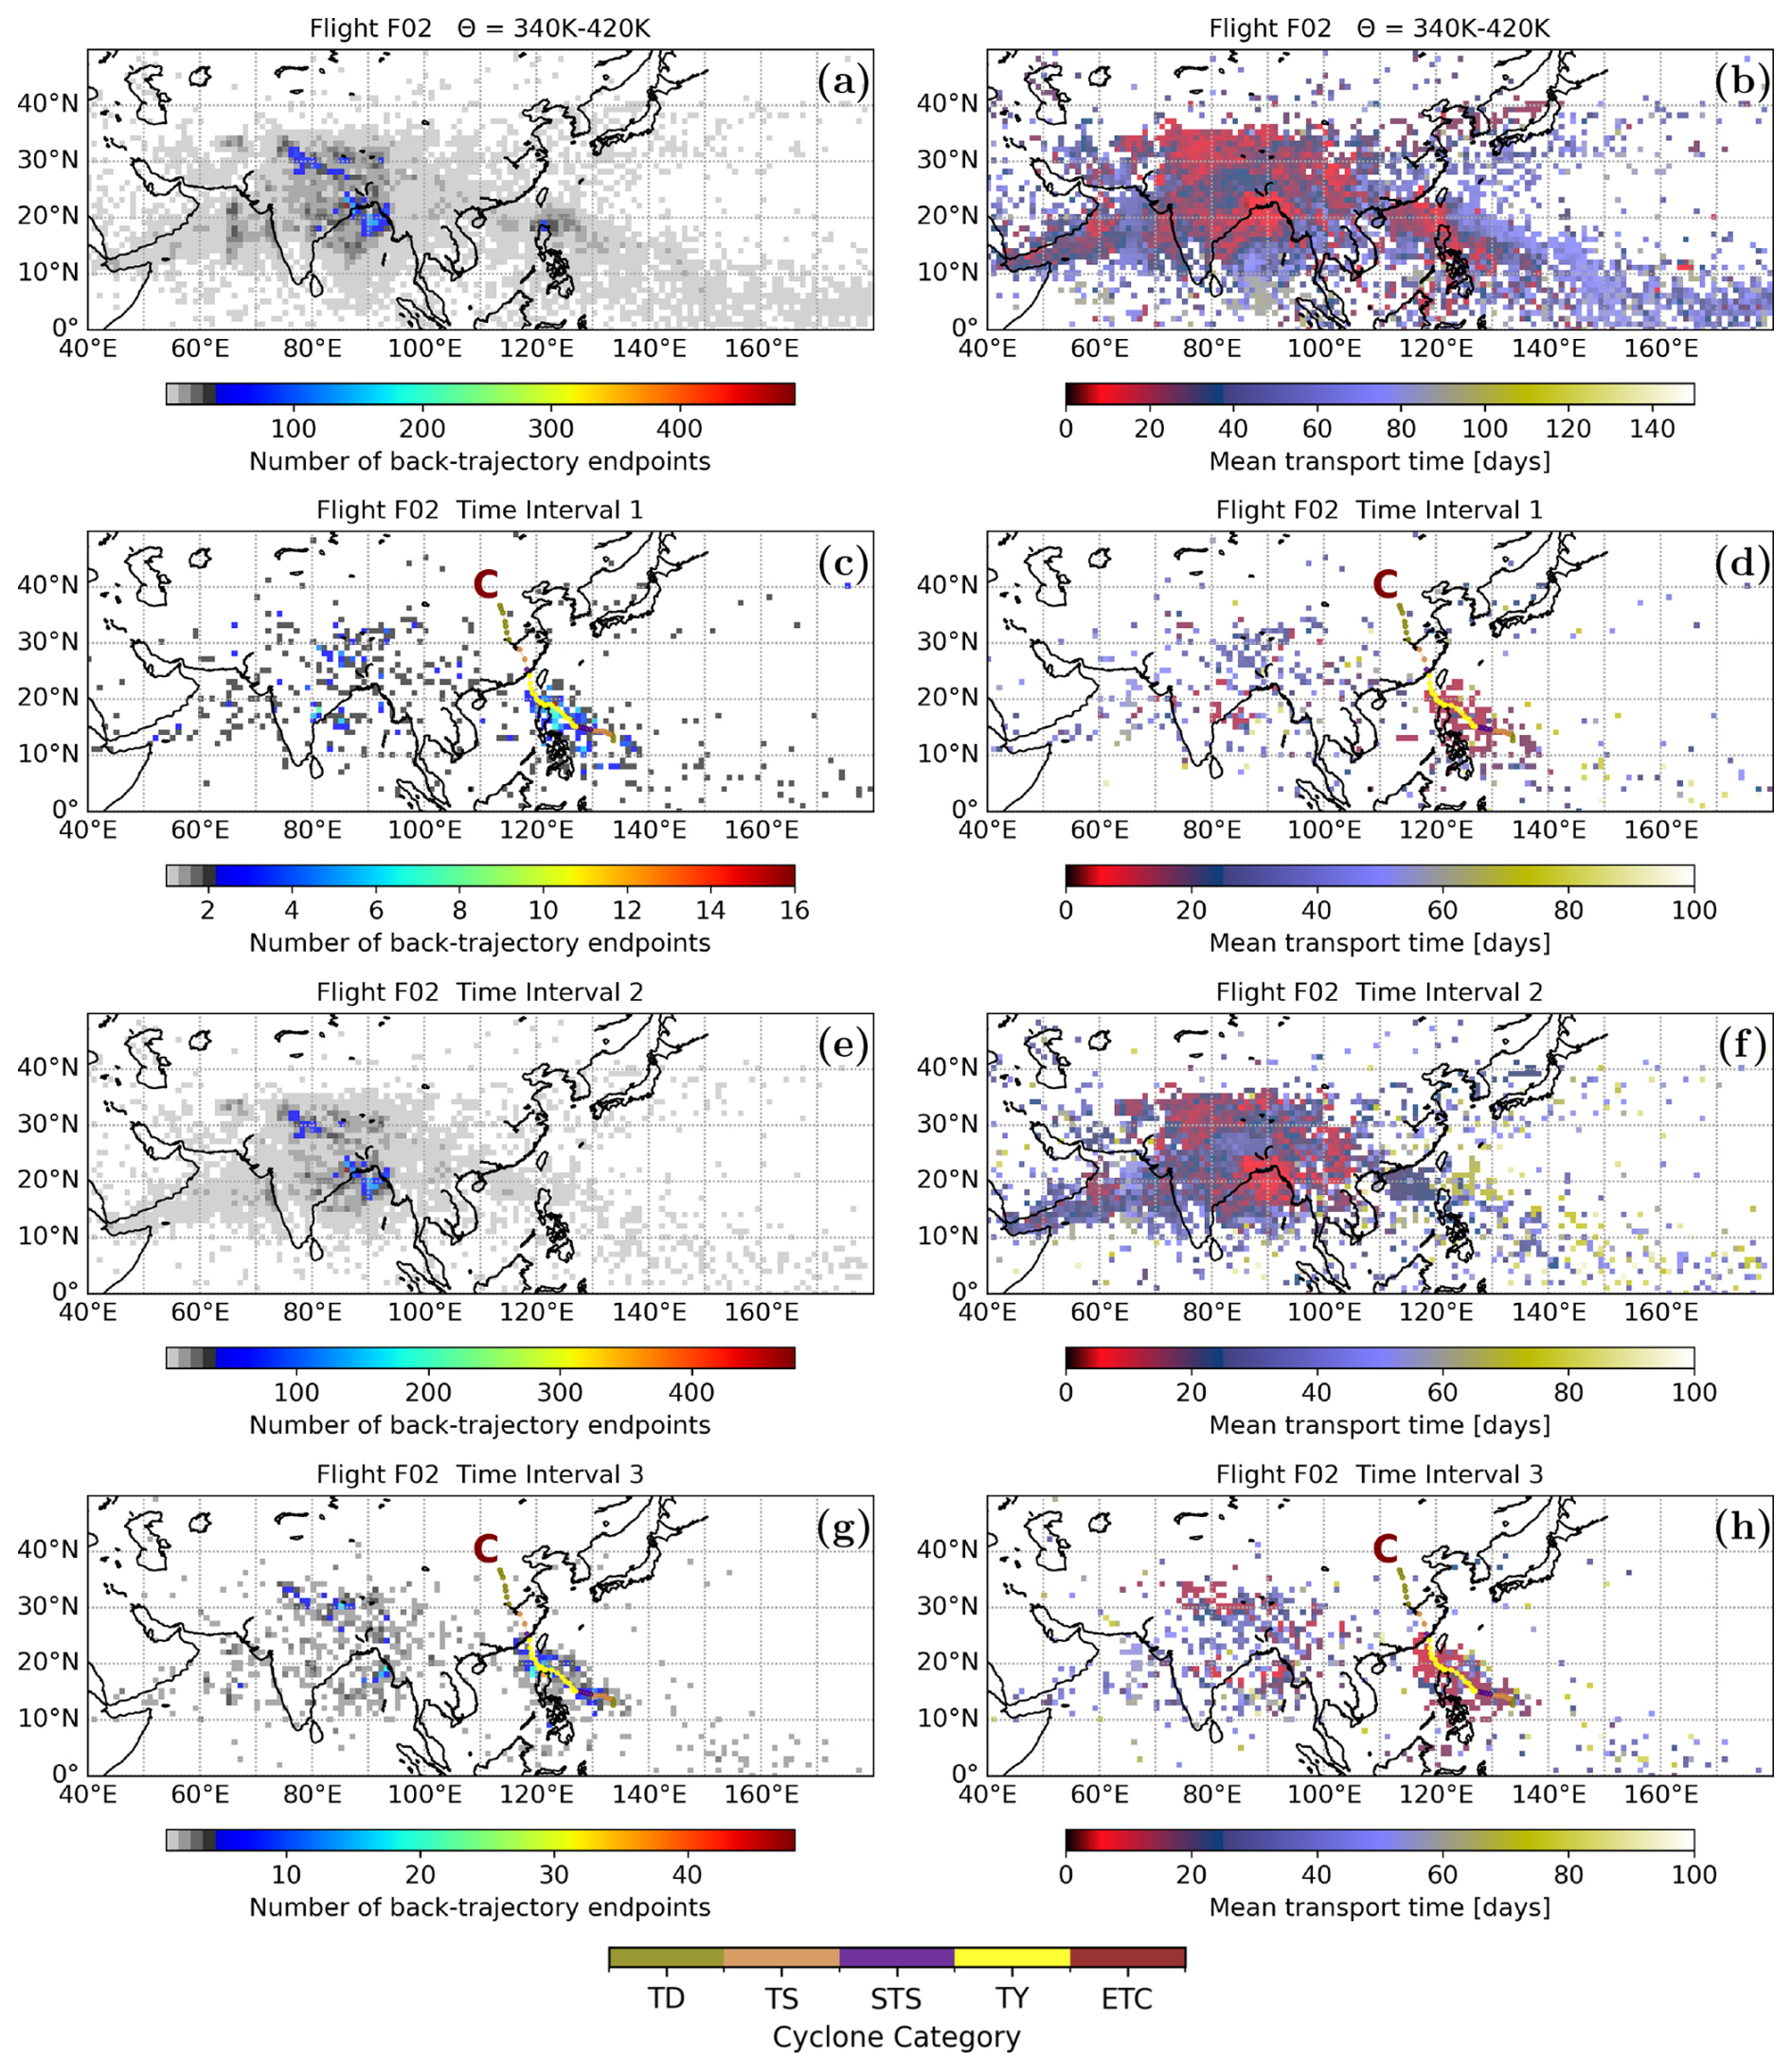
Figure 9Frequency distribution of the locations where air parcels were traced back from the flight track of research Flight F02 on 6 August 2023 to the model BL (a, c, e, g) and mean transport time (b, d, f, h) for the entire flight (above 340 K) (a, b) and time intervals 1–3 (c–h) (see Fig. 6). Reddish colours indicate mean transport times of a few days found for air from Bay of Bengal in time interval 2 (f) and from Southeast Asia in time interval 1 (d) and 3 (h). Short transport times found in time interval 1 and 3 from the Western Pacific have a coincidence with the storm track of tropical cyclone Doksuri (C) (20–30 July 2023, for more details to cyclone category see Fig. 4).
Analysing the back-trajectories from Flight F02, main source regions are the Bay of Bengal, the Northern Indian Subcontinent and the Western Pacific (Fig. 9a) in accordance with CLaMS simulations using surface–origin tracers (Fig. 8). Interval 2 is dominated by air from the Bay of Bengal and the Northern Indian Subcontinent (Fig. 9e and f), whereby air masses in interval 1 (Fig. 9c and d) and 3 (Fig. 9g and h) were mainly traced back to the Western Pacific. The trajectory endpoints in the model boundary layer have a strong coincidence with the track of tropical cyclone Doksuri in particular with the location where it is classified as a typhoon. Thus, our findings show that air masses from the western Pacific found in interval 1 and 3 are uplifted by tropical cyclone Doksuri.
The temporal evolution of the South Asia tracer at 370 K potential temperature (Fig. C1 in Appendix C) shows, that large fraction of the South Asia tracer were uplifted in the Bay of Bengal and adjoining continental regions to the UTLS between 1 and 3 August 2023 and subsequently were transported westward with the anticyclonic flow of the ASMA to the Mediterranean area. The temporal evolution of the Western Pacific tracer at 370 K potential temperature (Fig. C2 and C3 in Appendix C) shows the impact of tropical cyclone Doksuri uplifting large fractions of the Western Pacific tracer up to 370 K, thus to potential temperature levels of the UTLS. Subsequently, enhanced fractions of the Western Pacific tracer uplifted by tropical cyclone Doksuri (from 23 to 27 July) were transported anticyclonically around the ASMA's southern edge. Thereafter, at the western flank of the ASMA over the Atlantic Ocean these air masses were captured by the subtropical jet and were transported eastwards. Thus, a belt of air with enhanced fractions of the Western Pacific tracer is forming between the northern edge of the ASMA and the subtropical jet that was measured during research flight F02 (Fig. 6).
Thus, simulations with CLaMS indicate that air masses at the edge of the ASMA have a different origin compared to air masses inside the anticyclone which is in agreement with signatures found in measurements of different chemical trace gases and in the occurrence of particles formed within the ATAL (here indicated by nitrate mass concentrations).
Further, TMA-containing particles found in interval 2 indicate the influence from marine sources and/or sources in regions within rural areas with livestock farming and biomass burning such as in regions around the Bay of Bengal (West Bengal or Bangladesh). High mixing ratios of CH2Br2 up to ∼ 0.9 ppt supports the hypothesis that natural oceanic sources or at least coastal regions contribute to air masses in interval 2. Interval 3 represents a mixture of air from South Asia and the Western Pacific; thus, both agricultural activities around the Bay of Bengal and marine sources in the Western Pacific are potential sources of TMA and CH2Br2.
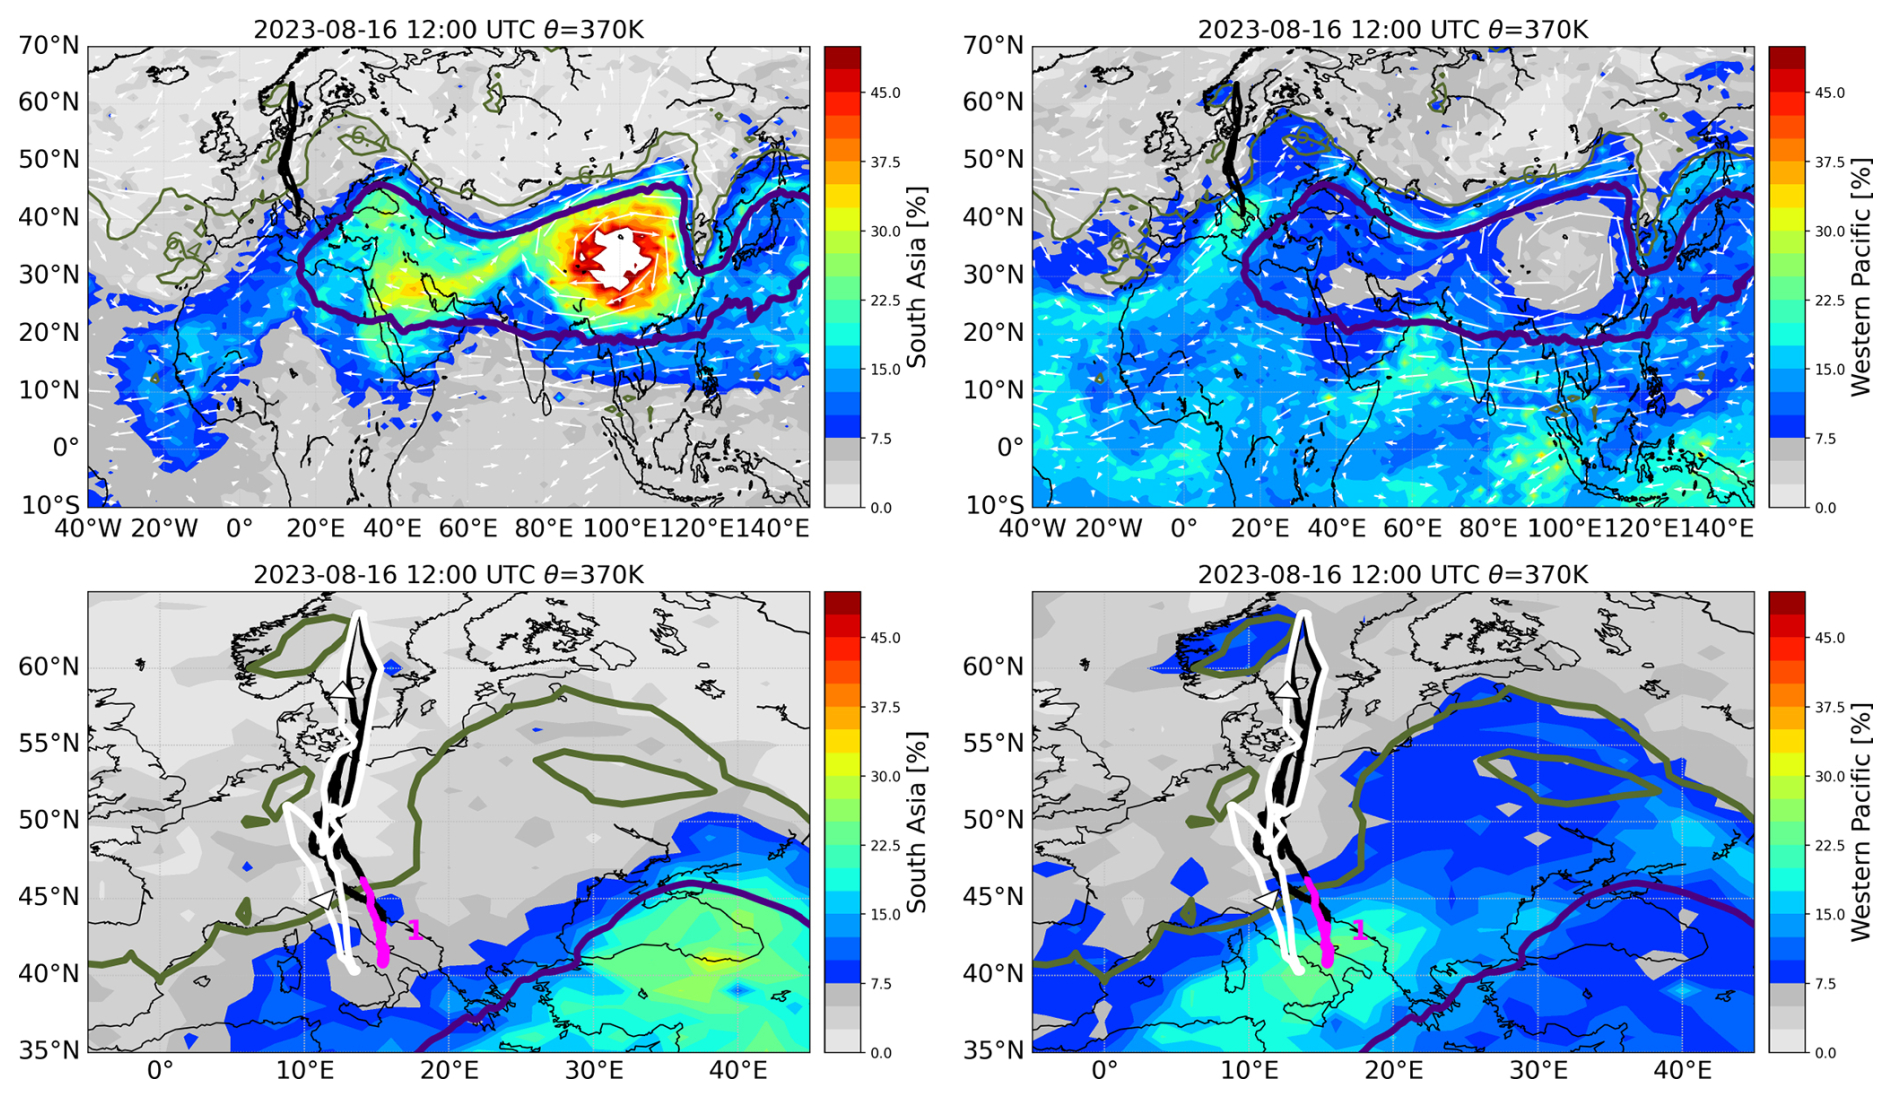
Figure 10As in Fig. 6 but for research flight F06 on 16 August 2023 conducted from Oberpfaffenhofen, Germany, to the Mediterranean region (towards southern Italy). Research flight F06 reaches the outer edge of the ASMA (South Asia surface–origin tracer at 370 K, 12:00 UTC, left), which is dominated by air from the western Pacific (Western Pacific surface–origin tracer at 370 K, 12:00 UTC, right). The ASMA boundary (indigo line) is given by MSF = 356.6 × 10³ m2 s−2 for 16 August 2023 at 12:00 UTC and 370 K. Time interval 1 shown in Fig. 11 is marked in magenta (bottom).
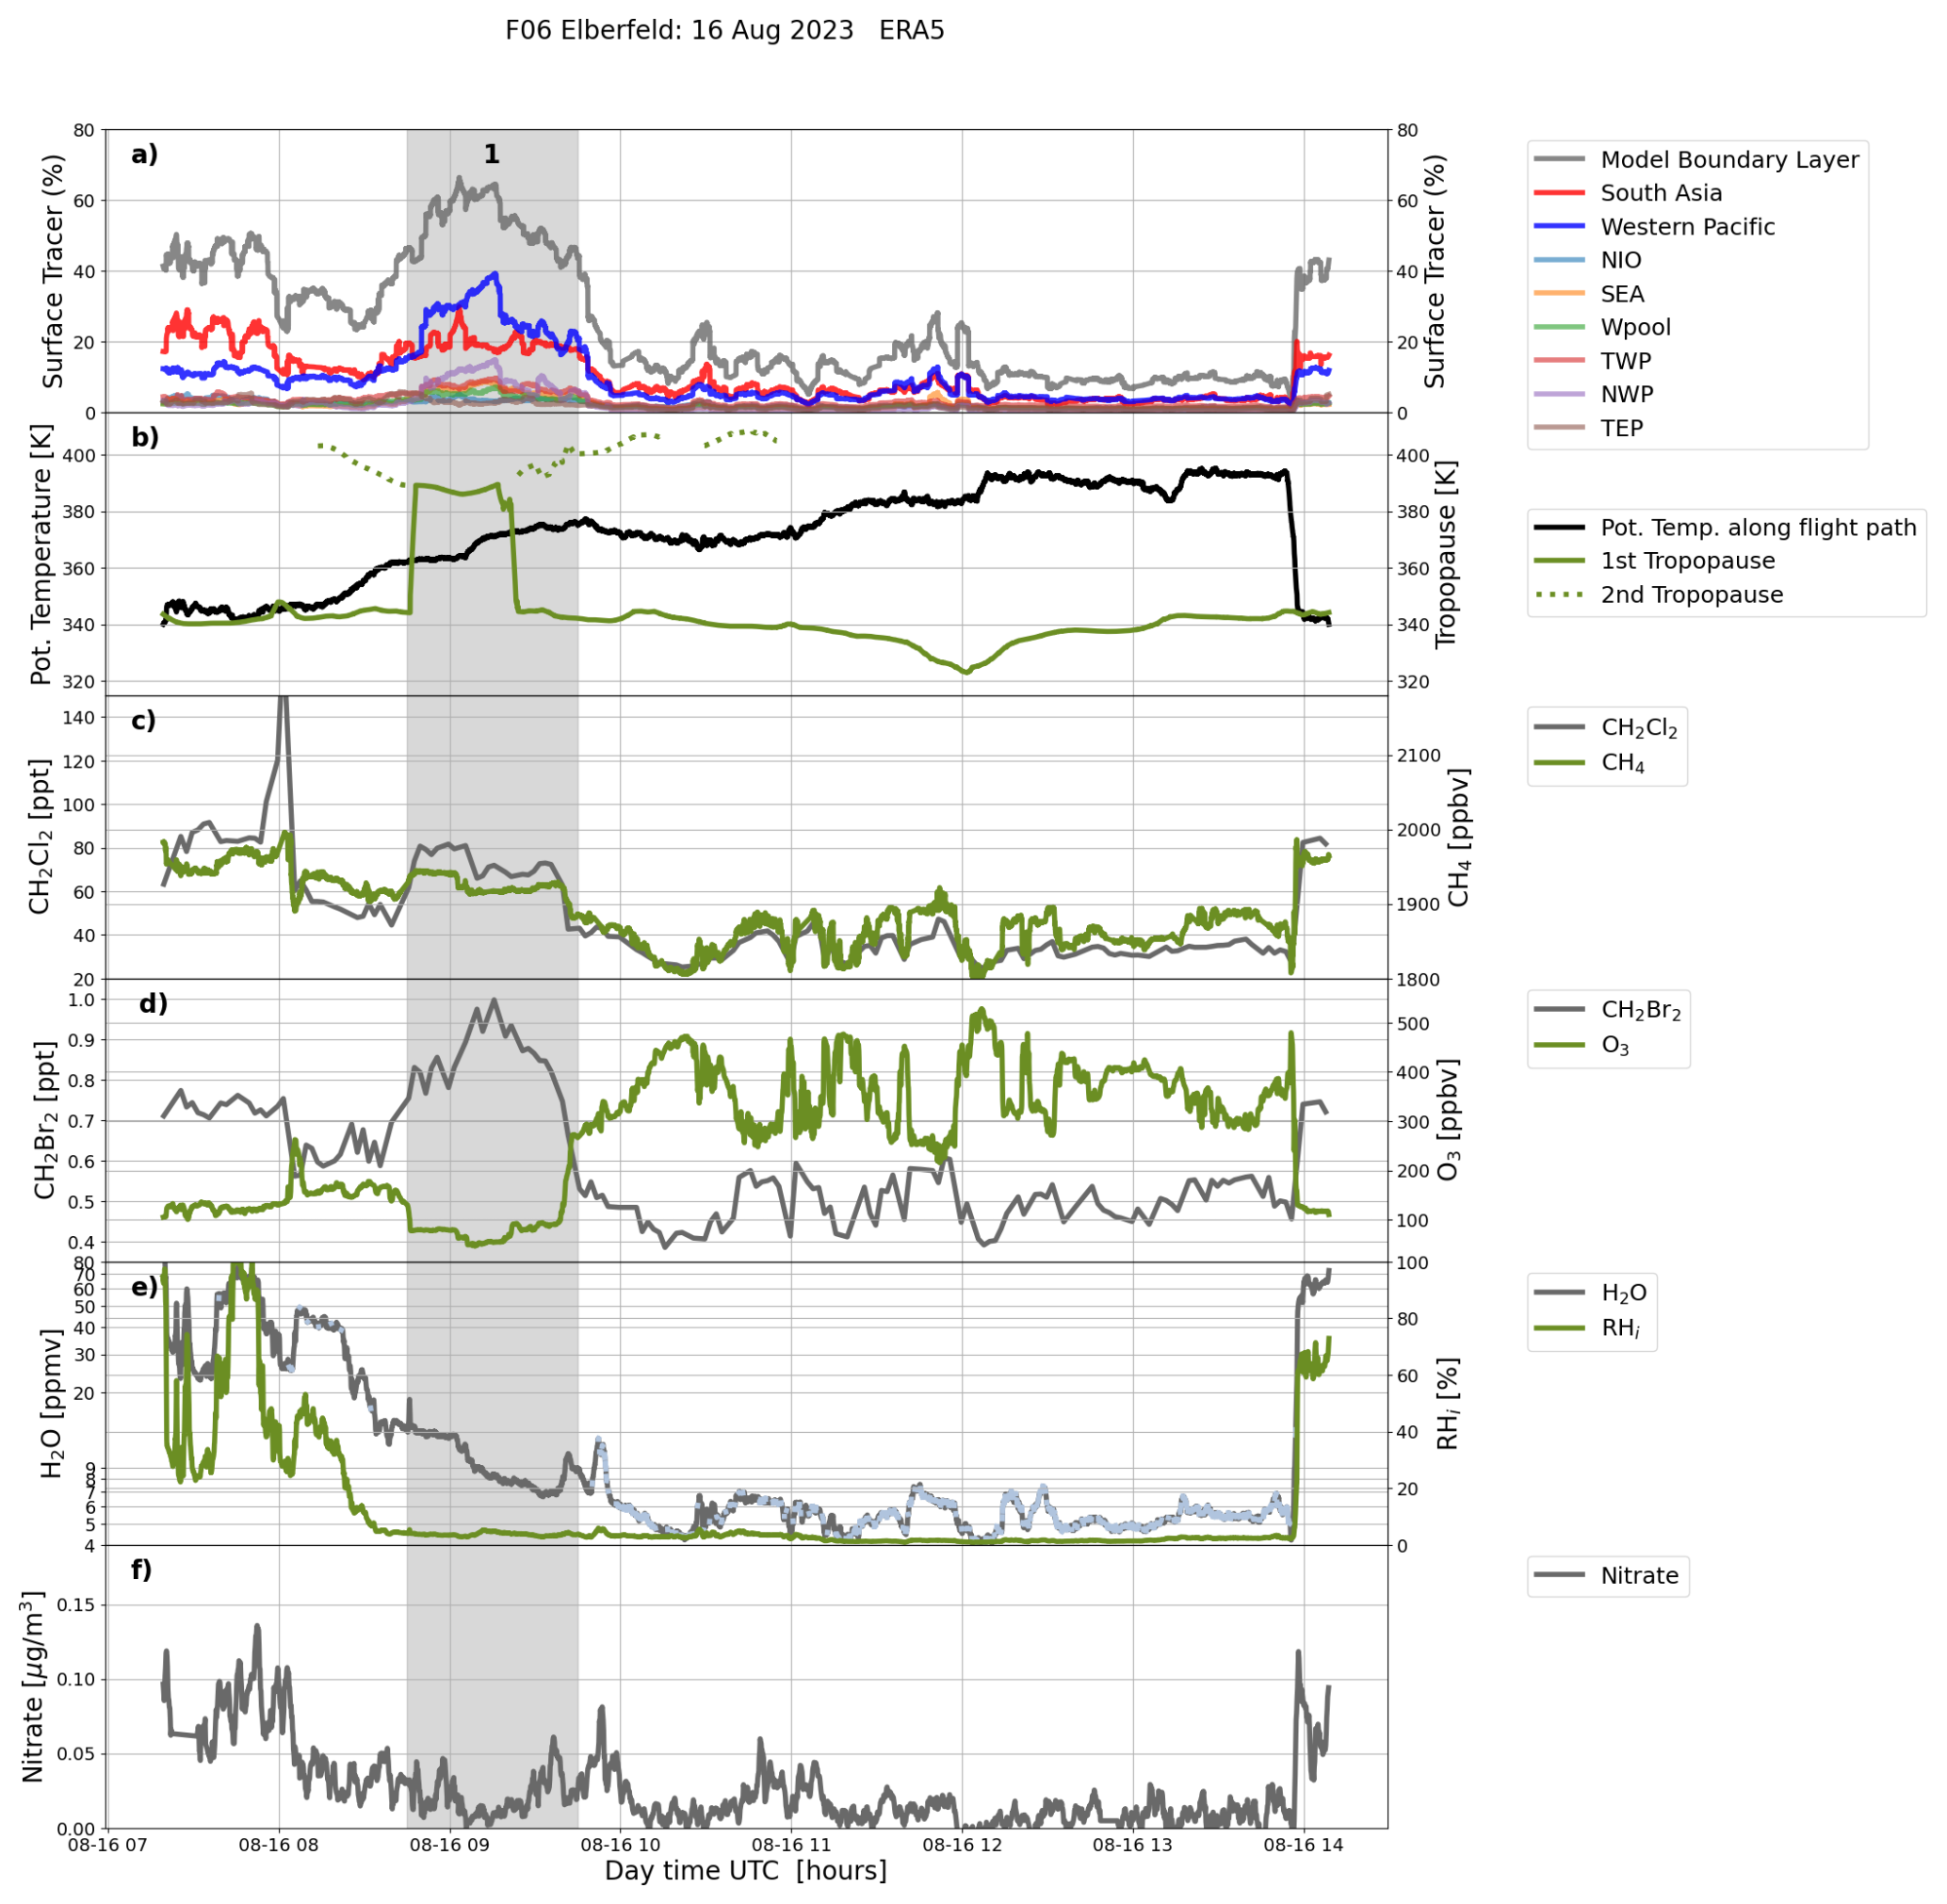
Figure 11Surface–origin tracers interpolated along the flight track of research flight F06 on 16 August 2023, potential temperature along the flight track, potential temperature at the tropopause as well as measurements of different chemical trace gases such as CH2Cl2, CH4, CH2Br2, O3, H2O, relative humidity with respect to ice RHi as well as nitrate mass concentration from aerosol particles. Regional surface–origin tracers with fractions greater than 5 % are shown. In interval 1 enhanced fraction of the South Asia and Western Pacific tracer are found; the dominant regional source region is the Northern Western Pacific (NWP, purple in Fig. 11a). Note that H2O, RHi and nitrate are smoothed over 10 s. Along the H2O time series, flight segments are colour-coded in light-blue, when along the CLaMS back-trajectories possible dehydration is indicated.
4.3.2 Research flight F06 (16 August 2023): Typhoon air within the westward outflow of the anticyclone
Research flight F06 on 16 August 2023 conducted from Oberpfaffenhofen, Germany, to the Mediterranean area (in direction of South Italy) reached the westward outflow of the ASMA which is mixed with air from the Western Pacific (Fig. 10). At the southern turning point of research flight F06, a filament (interval 1) with large fractions of the Western Pacific tracer is reached. In this filament, the fractions from the Western Pacific tracer (up to 40 %) are higher than from the South Asia tracer (about 20 %); the main source region is here the Northern Western Pacific (Fig. 11a). Within interval 1 also the tropopause is enhanced or a second tropopause exists (indicating Rossby wave breaking along the subtropical jet (Vogel et al., 2016)) compared to other flight segments (Fig. 8b). Therefore within interval 1 the flight track was below the tropopause or between the first and second tropopause.
A comparison with chemical trace gases shows that in interval 1 the mixing ratios of CH2Cl2 (up to 80 ppt) and CH4 (up to 1950 ppbv) are lower than in the western part of the ASMA during research flight F02 (interval 2 in Fig. 8 with up to 120 ppt CH2Cl2 and CH4 > 2000 ppbv), but still higher than in the stratospheric background at these altitudes (CH2Cl2 < 50 ppt and CH4 < 1900 ppbv). Low amounts of O3 (below 100 ppbv) and enhanced amounts of CH2Br2 (higher than 0.8 ppt) indicate the influence from marine sources in interval 1 (Fig. 11).
Dehydration occurs mostly in flight segments after interval 1 and sometimes also before interval 1 indicating that the air parcels have passed the cold point tropopause. During interval 1 no dehydration was found even in the flight segment above the 1st tropopause (but below the second tropopause) indicating moistening of the lower stratosphere in flight segments with enhanced fractions of the Western Pacific. This indicates another origin and transport pathway of air masses in interval 1 compared to the adjacent flight segments.
The South Asia tracer has small fractions of about 20 % in interval 1 indicating some westward outflow of the ASMA. However, during research flight F06, the low nitrate concentrations including interval 1 indicate that the flight was outside the ATAL and that the air masses likely did not originate from the ATAL. Further, no enhanced levels of sodium chloride-, TMA-, or MSA-containing particles were detected during Interval 1 (not shown), suggesting that marine-sourced particles may have been removed during transport, possibly through washout processes.
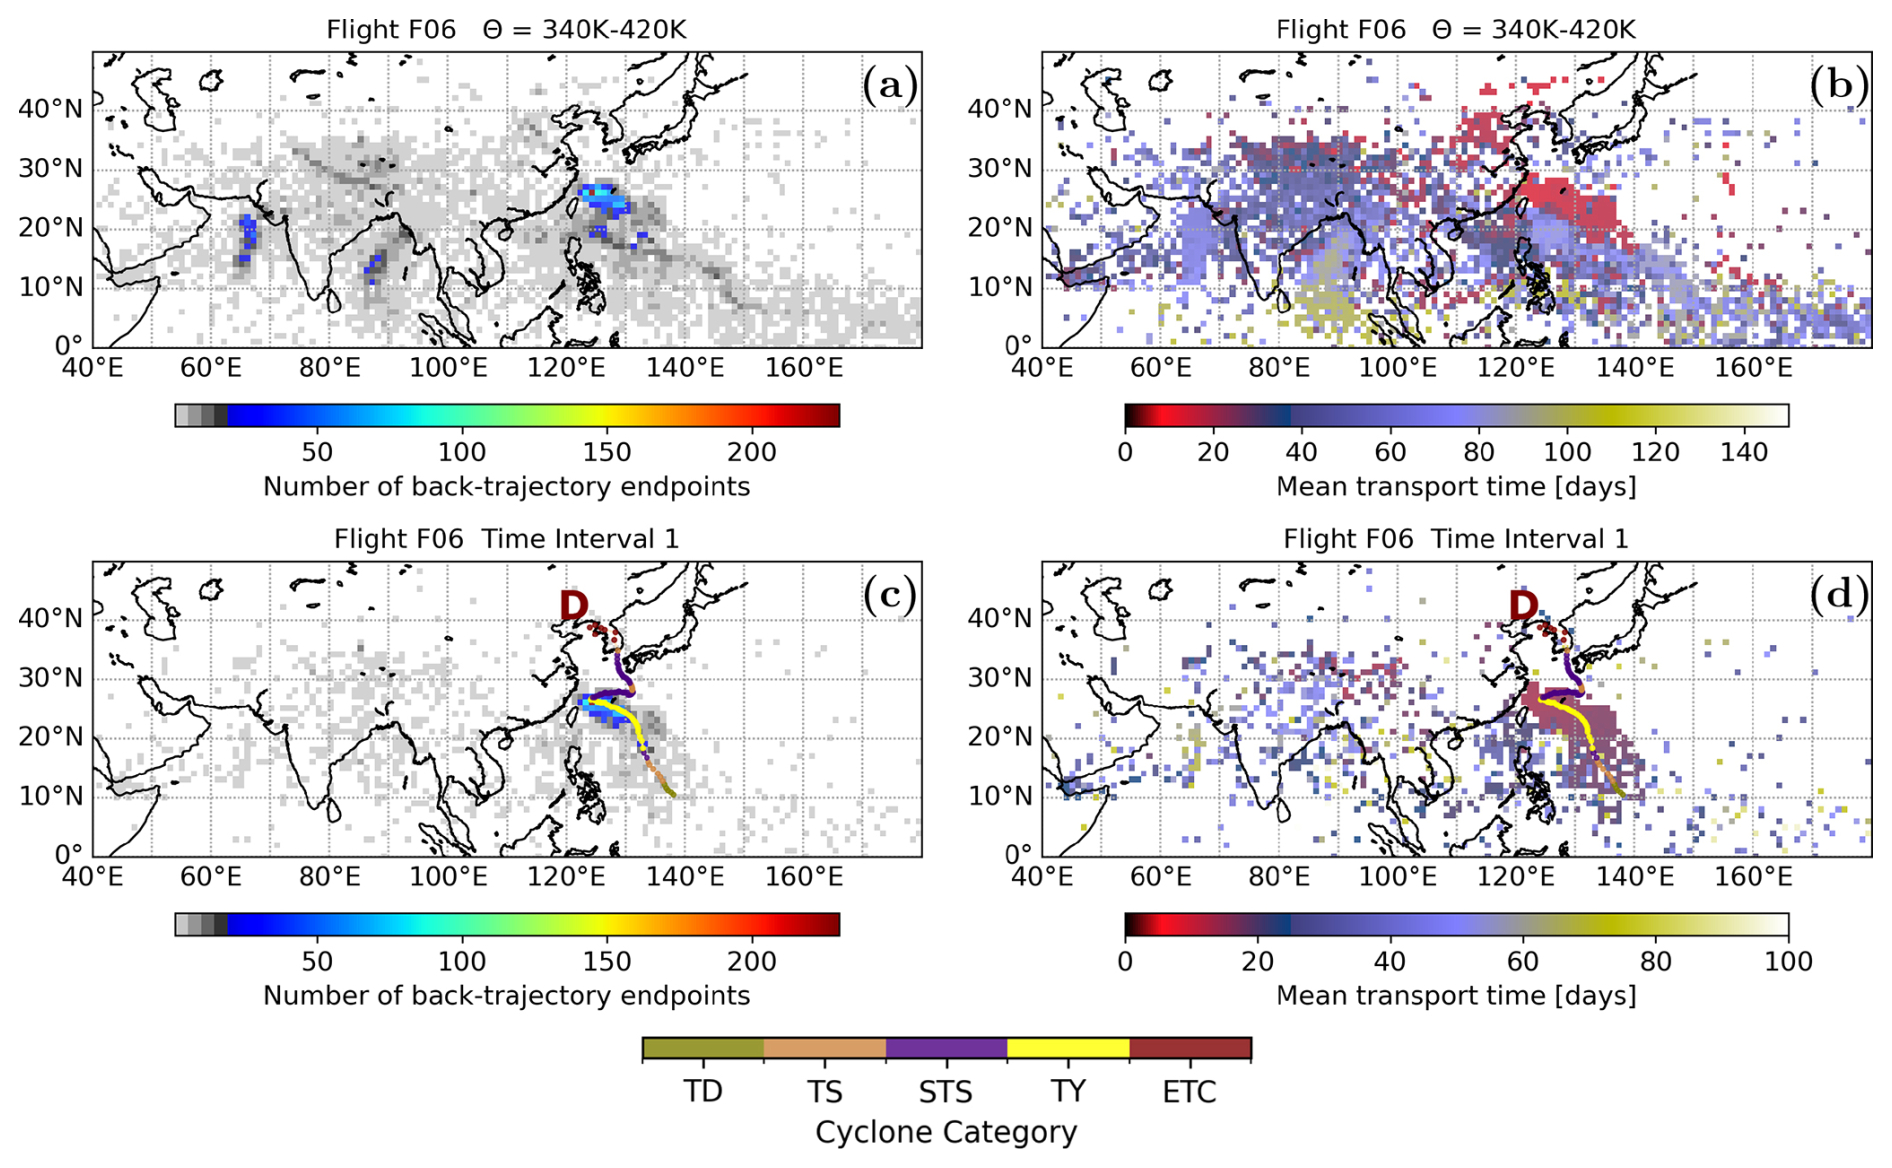
Figure 12Frequency distribution of the locations where air parcels were traced back from the flight track of research Flight F06 on 16 August 2023 to the model BL (left) and mean transport time (right) for the entire flight (above 340 K) (a, b) and time intervals 1 (c, d). Reddish colours indicate mean transport times of a few days found for air from the Northern Western Pacific during time interval 1 (d). Short transport time in time interval 1 coincidence with the storm track of tropical cyclone (D) Khanun (26 July–11 August 2023, for more details to cyclone category see Fig. 4).
The origin of the back-trajectories in interval 1 coincide with the storm track of tropical cyclone Khanun (26 July–11 August 2023) (Fig. 12c and d). The temporal evolution of the Western Pacific tracer at 370 K potential temperature (Fig. C3 in Appendix C) shows the impact of tropical cyclone Khanun in particular on 1 and 2 August 2023. Subsequently, enhanced fractions of the western Pacific tracer uplifted by tropical cyclone Khanun were transported anticyclonically around the ASMA's southern edge. These air masses were measured during research flight F06 in interval 1 (Fig. 10).
Research flight F06 on 16 August 2023 demonstrates the impact of tropical cyclones in the western Pacific on the UTLS over South Europe, transporting a relatively large amount of CH2Br2 and low O3 to the UTLS over South Europe and most likely further into the lower extra-tropical stratosphere within double tropopauses.
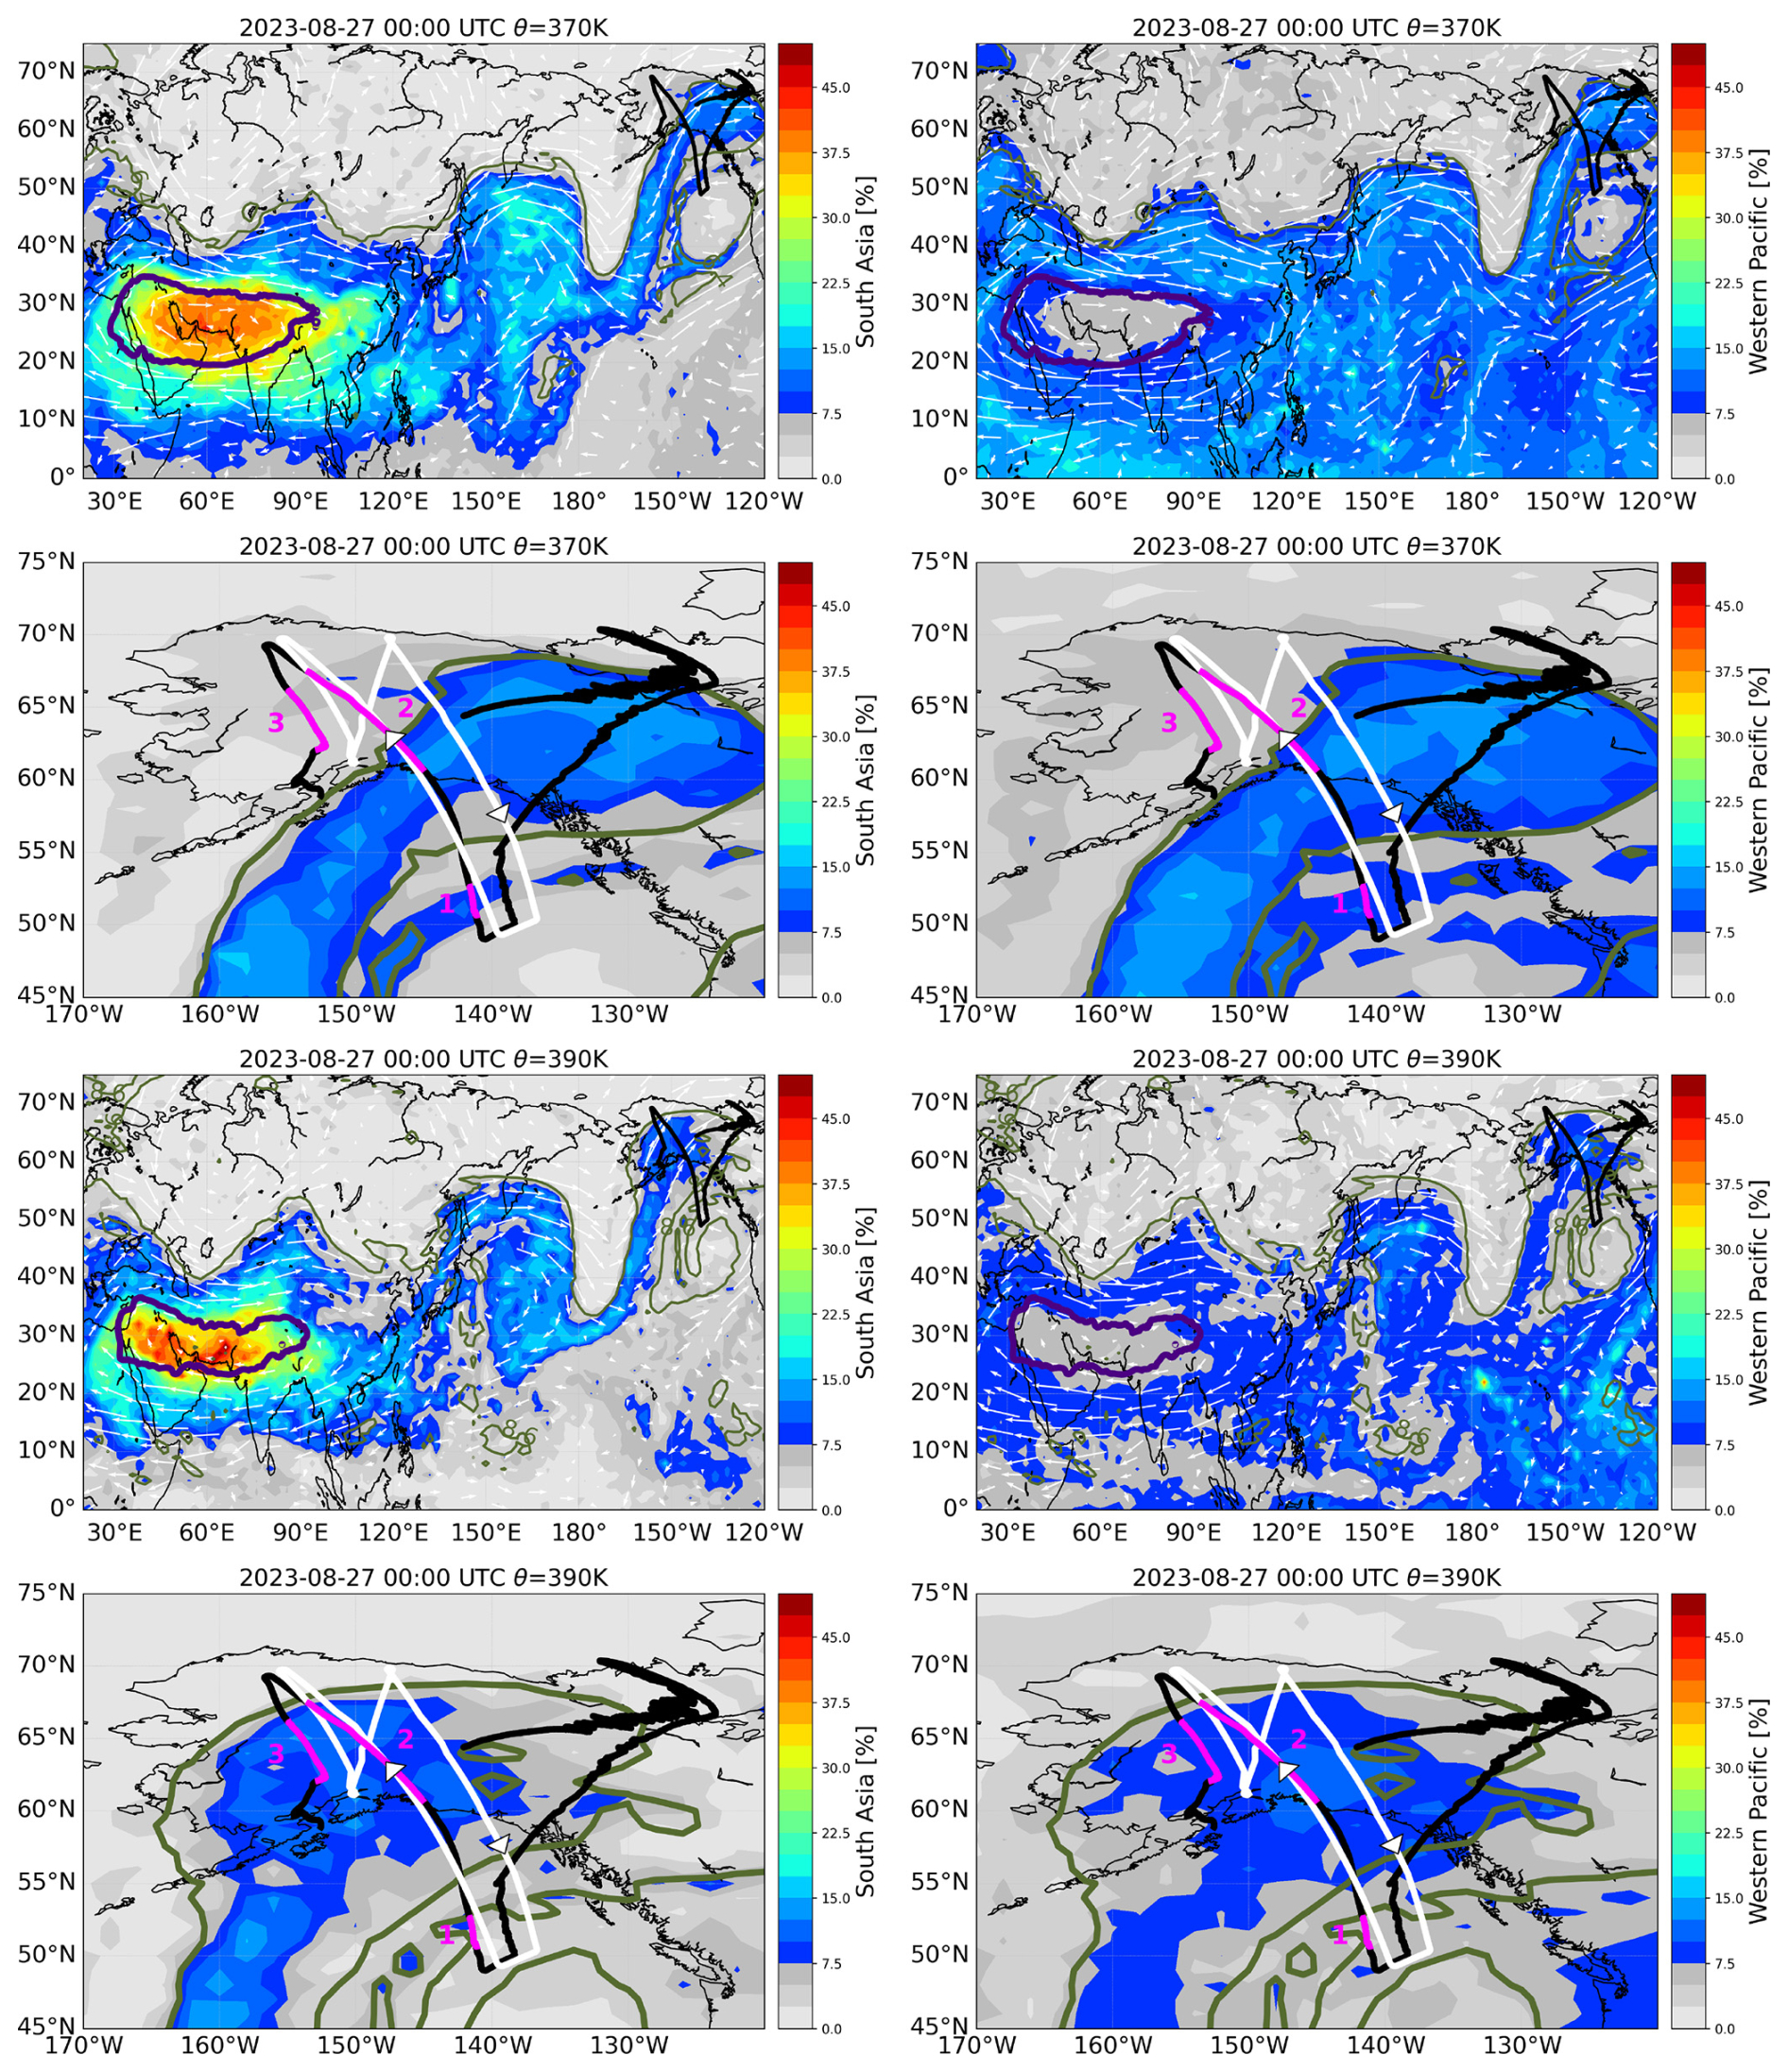
Figure 13As in Fig. 6 but for research flight F08 on 26–27 August 2023 conducted from Anchorage probing a filament over Alaska separated from the ASMA (South Asia surface–origin tracer at 370 and at 390 K, 00:00 UTC, left), which is mixed with air from the western Pacific (Western Pacific surface–origin tracer at 370 and 390 K, 00:00 UTC, right). The calculated synoptic HALO flight track position at 27 August 2023 is shown at 00:00 UTC (black line). The ASMA boundaries (indigo line) are given by MSF = 357.0 × 10³ m2 s−2 at 370 K and MSF = 367.6 × 10³ m2 s−2 at 390 K for 27 August 2023 at 00:00 UTC. Climatological isentropic transport barriers (olive line) at 370 K (PV = 6.4 PVU) and at 390 K (8.6 PVU) are given. Time intervals 1–3 shown in Fig. 15 are marked in magenta in the zoomed plots. The zoomed plots indicate that the shape and location of the monsoon-influenced filament are different at 370 K compared to 390 K potential temperature.
4.3.3 Research flight F08 (26/27 August 2023): The eastward outflow of the anticyclone
Research flight F08 on 26/27 August 2023, conducted from Anchorage, measured the eastward outflow of the ASMA in a filament over Alaska. This filament, separated from the main ASMA, is well mixed with air from the Western Pacific (Fig. 13). This monsoon-influenced filament is separated from the northern extratropical UTLS by the subtropical jet that constitutes a transport barrier on an isentropic level. Subsequent mixing of this monsoon-influenced air into the northern extratropical UTLS can occur (Vogel et al., 2016).
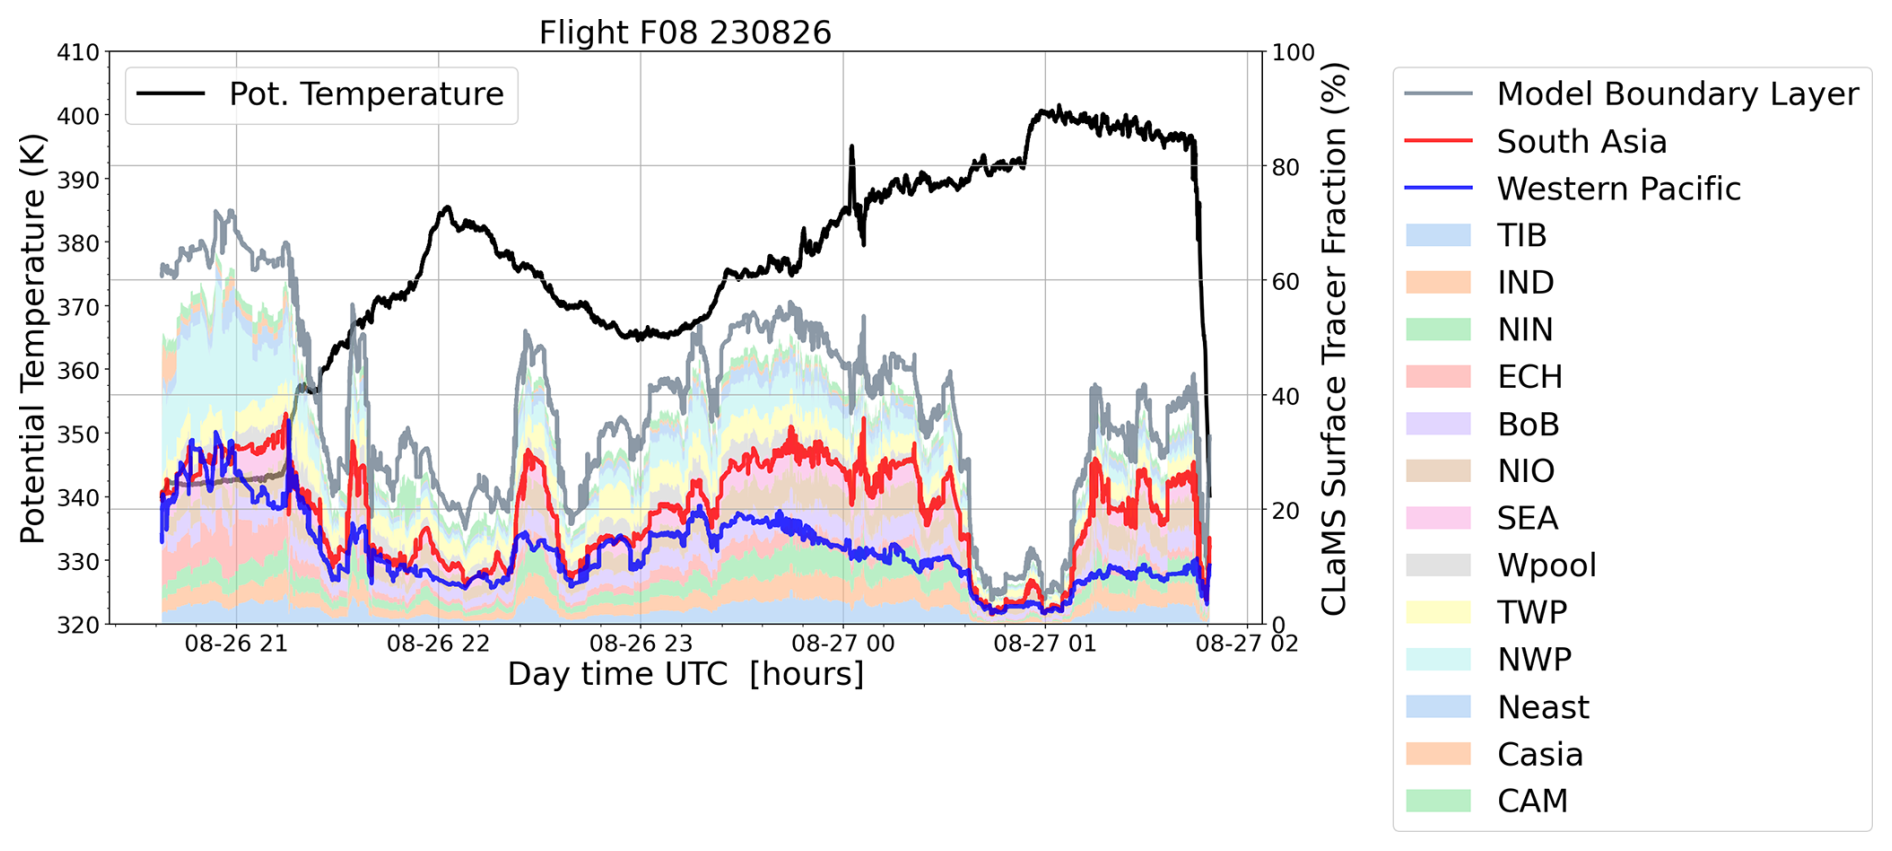
Figure 14Surface–origin tracers for the model boundary layer, South Asia and the Western Pacific interpolated in space and time along the flight track of research flight F08 on 26 August 2023. In addition individual surface–origin tracers with fractions greater than 5 % are shown as a stacked plot. The main contributions are from China and the western Pacific (ECH, NWP, TWP).
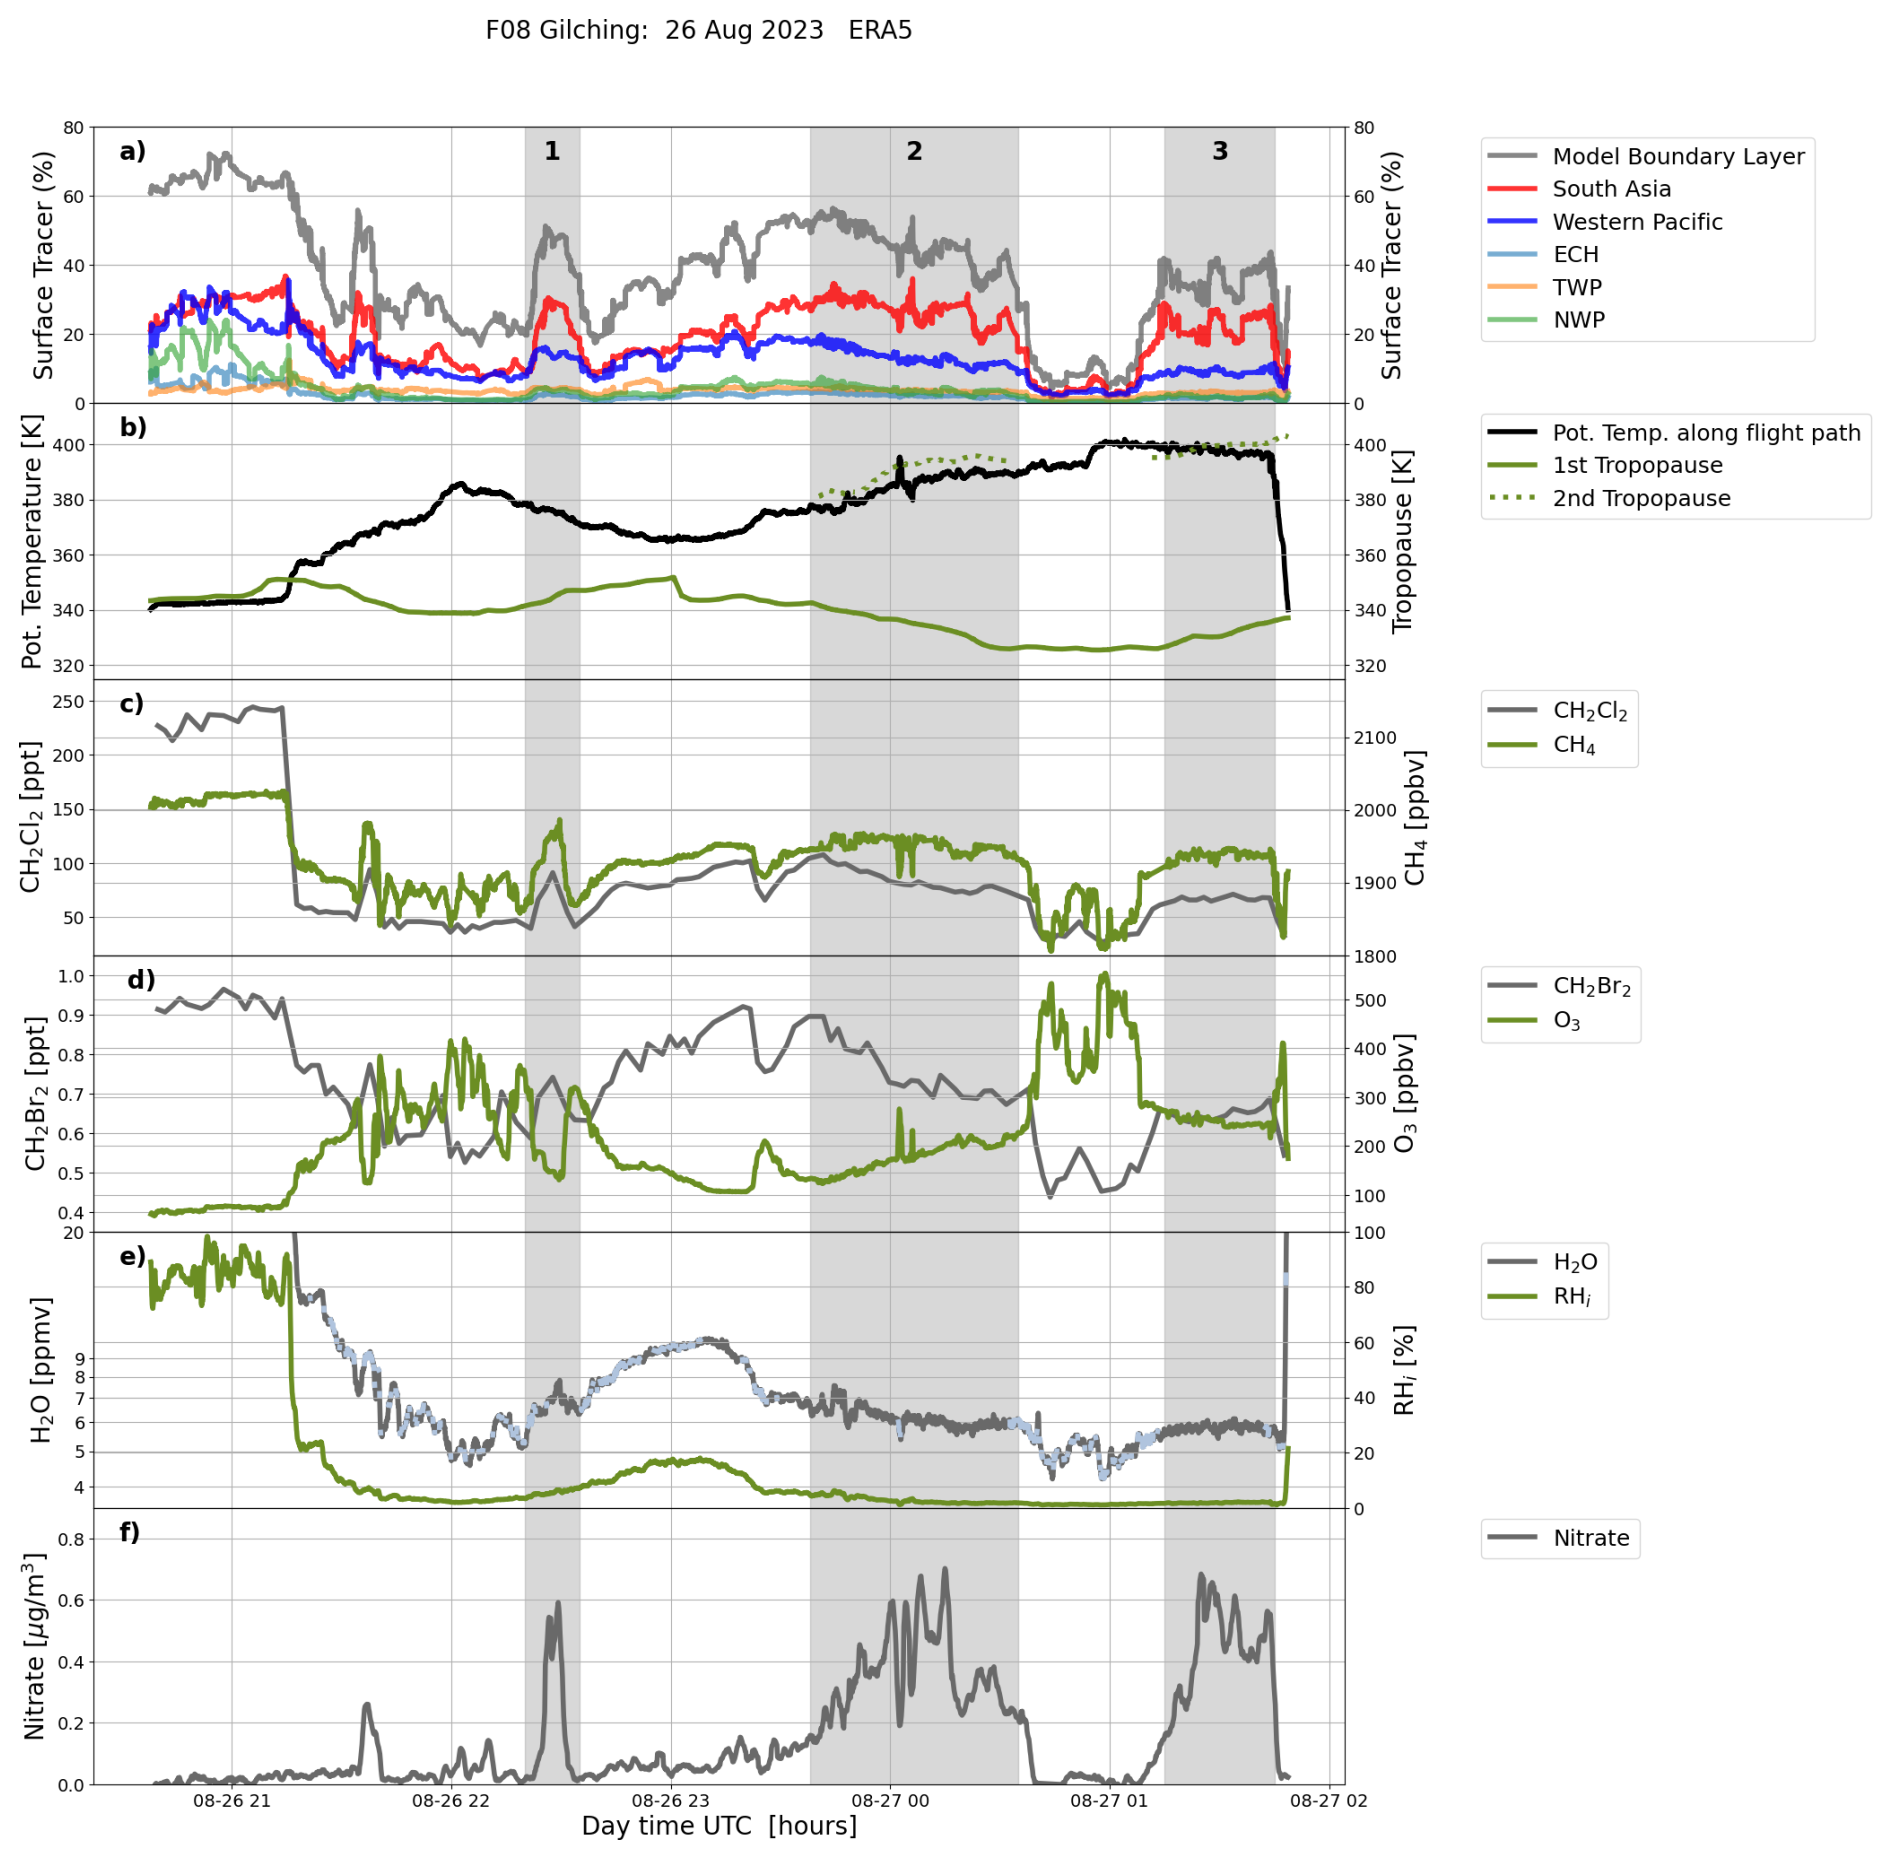
Figure 15As Fig. 11 but for research flight F08 on 26–27 August 2023. Regional surface–origin tracers with fractions greater than 10 % are shown. Three time intervals (1–3) high-lighting enhanced nitrate mass concentrations in aerosol particles as an indicator of air from the ATAL as well as enhanced fraction of the South Asia tracer (indicating ASMA air) and the Western Pacific tracer are marked in grey.
Air masses measured in this monsoon-influenced filament of the ASMA (intervals 1–3 in Fig. 13) originate mainly from East China (ECH) and the Western Pacific (NWP and TWP) (Figs. 14 and 15a), in contrast to the western part of the ASMA measured during research flight F02, where air originates mainly from the Indian subcontinent (IND, NIN, BoB; Figs. 7 and 8a). Within the monsoon-influenced filament measured on 26/27 August, somewhat higher fractions (by approximately a factor of two) of the South Asia tracer are generally found compared to the Western Pacific tracer (Fig. 14), in contrast to air in the western part of the ASMA (flight F02), where fractions of the South Asia tracer are higher by about a factor of 7 (Fig. 7). During research flight F08, both tracers are positively correlated, in contrast to flight F02, where the two tracers are negatively correlated. This indicates that during the separation of the filament from the ASMA, air from inside the ASMA (high amounts of the South Asia tracer) was mixed with air located at its outer edge (high amounts of the Western Pacific tracer). The temporal evolution of the South Asia and the Western Pacific tracer at 370 K potential temperature from 19 to 27 August 2023 is shown in Fig. C4 (Appendix C) demonstrating the mixing of these two air masses.
The time series of the surface–origin tracers interpolated along the flight track of research flight F08 are also qualitatively compared with measurements of several chemical trace gases (Fig. 15). In our study, we focus on measurements above 340 K potential temperature (thus to UTLS levels) in contrast to other recent studies that include measurements from research flight F08 below this level (conducted during the first hours of the flight, which are not shown in Fig. 15). These studies link enhanced CH2Cl2 mixing ratios (up to 300 ppt) measured in this flight segment to sources in eastern China (Jesswein et al., 2025; Riese et al., 2025), which is consistent with our CLaMS simulations but which is not discussed further here.
In the following, we will focus on the flight track measured after ∼ 22:00 UTC crossing the monsoon-influenced filament. After ∼ 22:00 UTC, the South Asia and the Western Pacific tracer are positively correlated (Fig. 15a). Both surface-origin tracers are further positively correlated with CH2Cl2 (with values up to 110 ppt), a marker for anthropogenic sources in Asia, CH4 (with values up to 1980 ppbv), a marker for monsoon-influenced air and CH2Br2 (with values up to 0.9 ppt), a marker for natural oceanic sources. O3, a tracer of marine tropospheric (low values) and stratospheric air (high values), shows more complex behaviour in detail but is generally negatively correlated with both the South Asia and the Western Pacific tracers, indicating the impact of ozone-poor marine air. However, O3 increases with potential temperature (interval 2), consistent with the increasing influence of stratospheric air.
The three intervals 1–3 (shown in Fig. 13) are at different levels of potential temperature and are selected to highlight enhanced nitrate mass concentrations in aerosol particles as an indicator of air from the ATAL (ASMA) (Fig. 15f, the small peak at 21:40 UTC is not considered here, but yield similar results as for interval 1, however with a lower amount of air parcels). Similar as for F06 also here in F08, no enhanced levels of sodium chloride-, TMA-, or MSA-containing particles were detected during interval 1–3 (not shown), suggesting that marine-sourced particles may have been removed during transport to potential temperature levels above 360 K, possibly through washout processes.
In contrast to research flight F02 inside the western part of the ASMA, the flight segments of research flight F08 above ∼ 360 K were also above the local 1st tropopause, thus in the lower stratosphere (Fig. 15b). In intervals 1, 2 and 3 (all three intervals are above the tropopause) also water vapour is enhanced compared to adjacent flight segments at the same potential temperature level. Here, in intervals 1–3, cloud formation processes along the flight track can be excluded (RHi ≲ 10 %). Findings from back-trajectory calculations show that in intervals 1, 2 and 3 dehydration (flight segments that are shown in light–blue in Fig. 15e) does not occur (only for a minor number of trajectories), thus enhanced H2O is found within the filament separated from the ASMA. In particular in intervals 2 and 3, hydration is evident above 380 K potential temperature.
This demonstrates that both polluted air from South Asia as well as marine air contribute to the chemical composition of the monsoon-influenced filament separated from the ASMA. Caused by the mixing of two air masses with different tropospheric origin, the chemical composition of the filaments separated at the eastern edge of the anticyclone is different from the chemical composition of the ASMA's air itself measured during research flight F02.
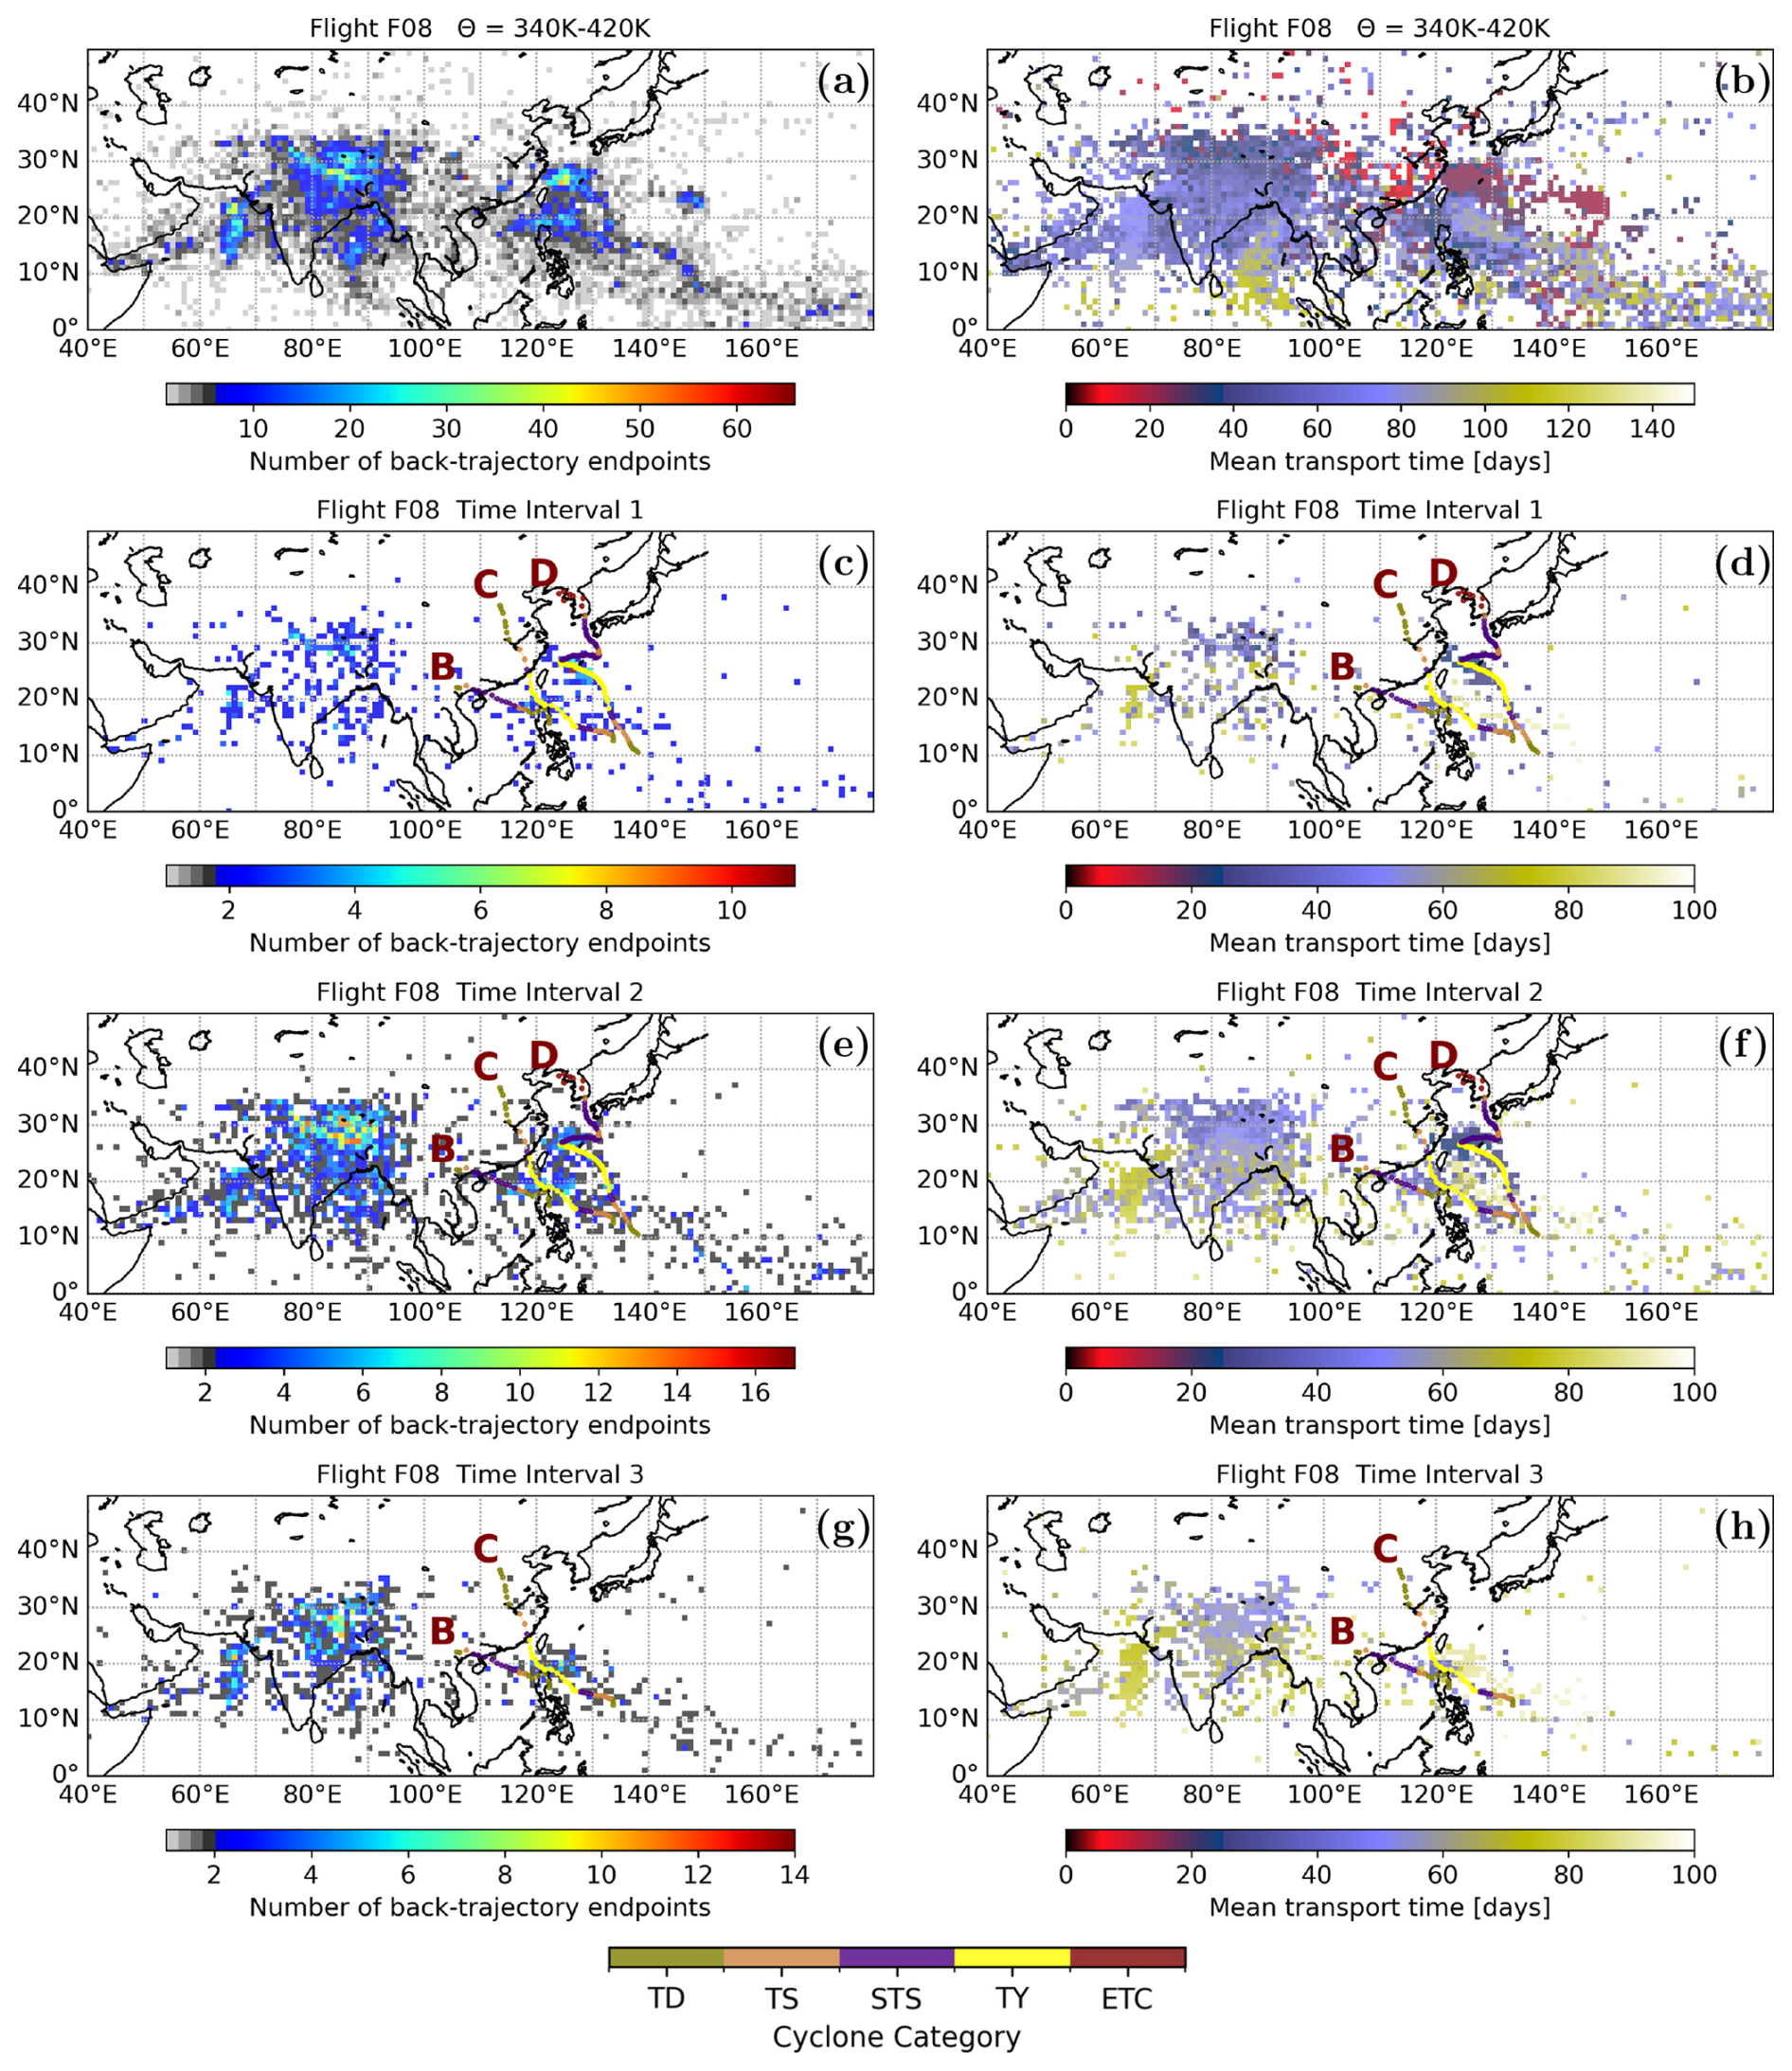
Figure 16Frequency distribution of the locations where air parcels were traced back from the flight track of research Flight F08 on 26–27 August 2023, to the model BL (left) and mean transport time (right) for the entire flight (above 340 K) (a, b) and time intervals 1–3 (c–h). An accumulation of trajectory endpoints is found in South Asia as well as in the western Pacific. The time intervals are on different levels of potential temperatures whereby the potential temperature is increasing from interval 1 to 3. The origin of the back-trajectories in the selected interval coincide with the storm track of tropical cyclones (B) Talim (13–18 July 2023), (C) Doksuri (20–30 July 2023), (D) Khanun (26 July–11 August 2023), however for the highest potential temperature level in interval 3, only Talim and Doksuri play a role (for more details to cyclone category see Fig. 4).
The back-trajectory analysis shows that an accumulation of trajectory endpoints is found in South Asia as well as in the western Pacific in agreement with simulations using surface–origin tracers (Fig. 16). The origin of the back-trajectories in intervals 1, 2 and 3 coincide with the storm track of several tropical cyclones (Fig. 16c–h). The time intervals are on different levels of potential temperatures whereby the potential temperature is increasing from interval 1 to 3 (Fig. 15b). The origin of the back-trajectories in the selected intervals coincide with the storm track of tropical cyclones (B) Talim (13–18 July 2023), (C) Doksuri (20–30 July 2023), (D) Khanun (26 July–11 August 2023), however for the highest potential temperature level at ∼ 400 K in interval 3, only Talim and Doksuri play a role. Longer transport times (∼ 40–60 d) are found from storm tracks of tropical cyclones at the model boundary layer to flight segments at 400 K potential temperature compared to flight segments at lower potential temperature.
Filaments separated at the eastern flank of the ASMA transport a mixture of polluted air from South Asia and marine air from the western Pacific towards the lower extratropical UTLS. Thus, regarding the eastward outflow of the ASMA by the separation of filaments or eddy shedding, our findings demonstrate that within these filaments contributions of air from the western Pacific also have to be taken into account.
We combined PHILEAS HALO aircraft measurements with global three-dimensional CLaMS simulations, including model tracers of surface origin and with pure CLaMS back-trajectory calculations started along all aircraft flight tracks. Both three-dimensional simulations and back-trajectory calculations are driven by the high-resolution ERA5 reanalysis. Boundary source regions and transport times of air masses measured during the PHILEAS campaign were identified. Main source regions in South Asia and in the western Pacific (impacted by tropical cyclones) were found. Caused by the high-resolution of the ERA5 reanalysis data and the Lagrangian transport including irreversible mixing in CLaMS, a remarkable agreement between fine-scale structures found in measured chemical tracers and in simulated surface–origin tracers along the flight tracks are identified.
Our findings show that for the PHILEAS campaign, the South Asia tracer serves as a reliable proxy for polluted air originating from the Asian summer monsoon region. Additionally, the Western Pacific tracer is a useful marker for air masses of marine origin, and more specifically, an indicator of air uplifted into the UTLS by tropical cyclones in the western Pacific. Regional surface–origin tracers, sub-regions of the South Asia or the Western Pacific tracer such as Northern Indian Subcontinent (NIN), Indian Subcontinent (IND), Tibetan Plateau (TIB), Eastern China (ECH), Bay of Bengal (BoB), Indian Ocean (IND) or Northern Western Pacific (NWP) narrow the air mass origin of the PHILEAS measurements to smaller source regions.
Measured mixing ratios of CH2Cl2 from the HAGAR-V instrument depend strongly on the specific source region in Asia and 3 different branches with enhanced CH2Cl2 (higher than the background value at tropopause heights of ∼ 50 ppt (e.g. Adcock et al., 2021)) and CH4 larger than 1920 ppbv (as an indicator for monsoon-influenced air) are found. The highest CH2Cl2 mixing ratios (200–300 ppt) are found in air masses influenced by sources in China and mixed with air from the Northern Western Pacific, particularly at altitudes below the ASMA (≤ 360 K), driven by both convection and strong CH2Cl2 sources in eastern China. Further, CLaMS simulations indicate that CH2Cl2 mixing ratios of ∼ 150 ppt are a mixture of air from eastern China, Northern Indian Subcontinent and the Tropical Western Pacific; this is also valid for potential temperature levels below 360 K. CH2Cl2 mixing ratios of ∼ 100 ppt, at potential temperature levels of the ASMA (≥ 360 K) are associated with air masses mainly from the Indian Subcontinent and Bay of Bengal where CH2Cl2 sources can be assumed to be much lower than in China. In general, transport above the maximum convective outflow level (∼ 360,K) is much slower; thus, mixing with CH2Cl2-poor air within the ASMA becomes more important compared to air masses observed in the upper troposphere that are directly influenced by fast uplift of air from the main CH2Cl2 source regions in Asia. The short chemical lifetime of CH2Cl2 (∼ 6 months) plays only a minor role in the spatial distribution of CH2Cl2 within the ASMA and its outflow compared to the time scales of mixing (dilution; ∼ hours to several weeks).
The presented case studies of three single research flights (F02, F06, and F08) are focused on the western part of the ASMA – the eastern part of the main anticyclone was not reached during the PHILEAS flights – and likewise on its westward and eastward outflow at potential temperature levels ≥ 360 K. Measurements of pollutants and greenhouse gases such as CH2Cl2, CH4 and water vapour as well as enhanced nitrate mass concentrations (a sign for particles from the ATAL) indicate sources in South Asia in agreement with CLaMS South Asia surface–origin tracer finding sources in the region of the ASMA. Further, enhanced TMA was found in the western part of the ASMA during research flight F02, with an enhanced influence from northern India, in particular from West Bengal, Bangladesh, and the Bay of Bengal. Potentially large agricultural sources of TMA, as well as natural oceanic sources, may be associated with the measurements.
Our findings show that the PHILEAS measurements are in general impacted by tropical cyclones in the western Pacific. The model simulations demonstrate that the outer edge of the ASMA in 2023 is impacted by marine air from the western Pacific uplifted by tropical cyclones. The contribution of the surface-origin tracers in the ASMA and at its edge are highly inhomogeneous and depend on the interplay of tropical cyclones and the ASMA in agreement with trace gas and particle measurements from research flights F02, F06, and F08. Subsequent mixing of polluted air from inside the ASMA and marine air (including enhanced natural CH2Br2) at its edge occurs at the eastern flank of the anticyclone when filaments are separated from the main anticyclone. Therefore, the chemical composition of air in the eastward outflow of the anticyclone differs from the western part of the ASMA. Furthermore, air masses measured in the eastward outflow of the ASMA are mainly from East China and the Western Pacific (from the region of East Asian and Western North Pacific summer monsoons) in contrast to the western part that originates mainly from the Indian subcontinent (from the region of the Indian summer monsoon). Our findings are schematically summarised in Fig. 17 for potential temperature levels of the ASMA; however, the interplay between the ASMA and tropical cyclones is highly variable and can differ in individual cases.
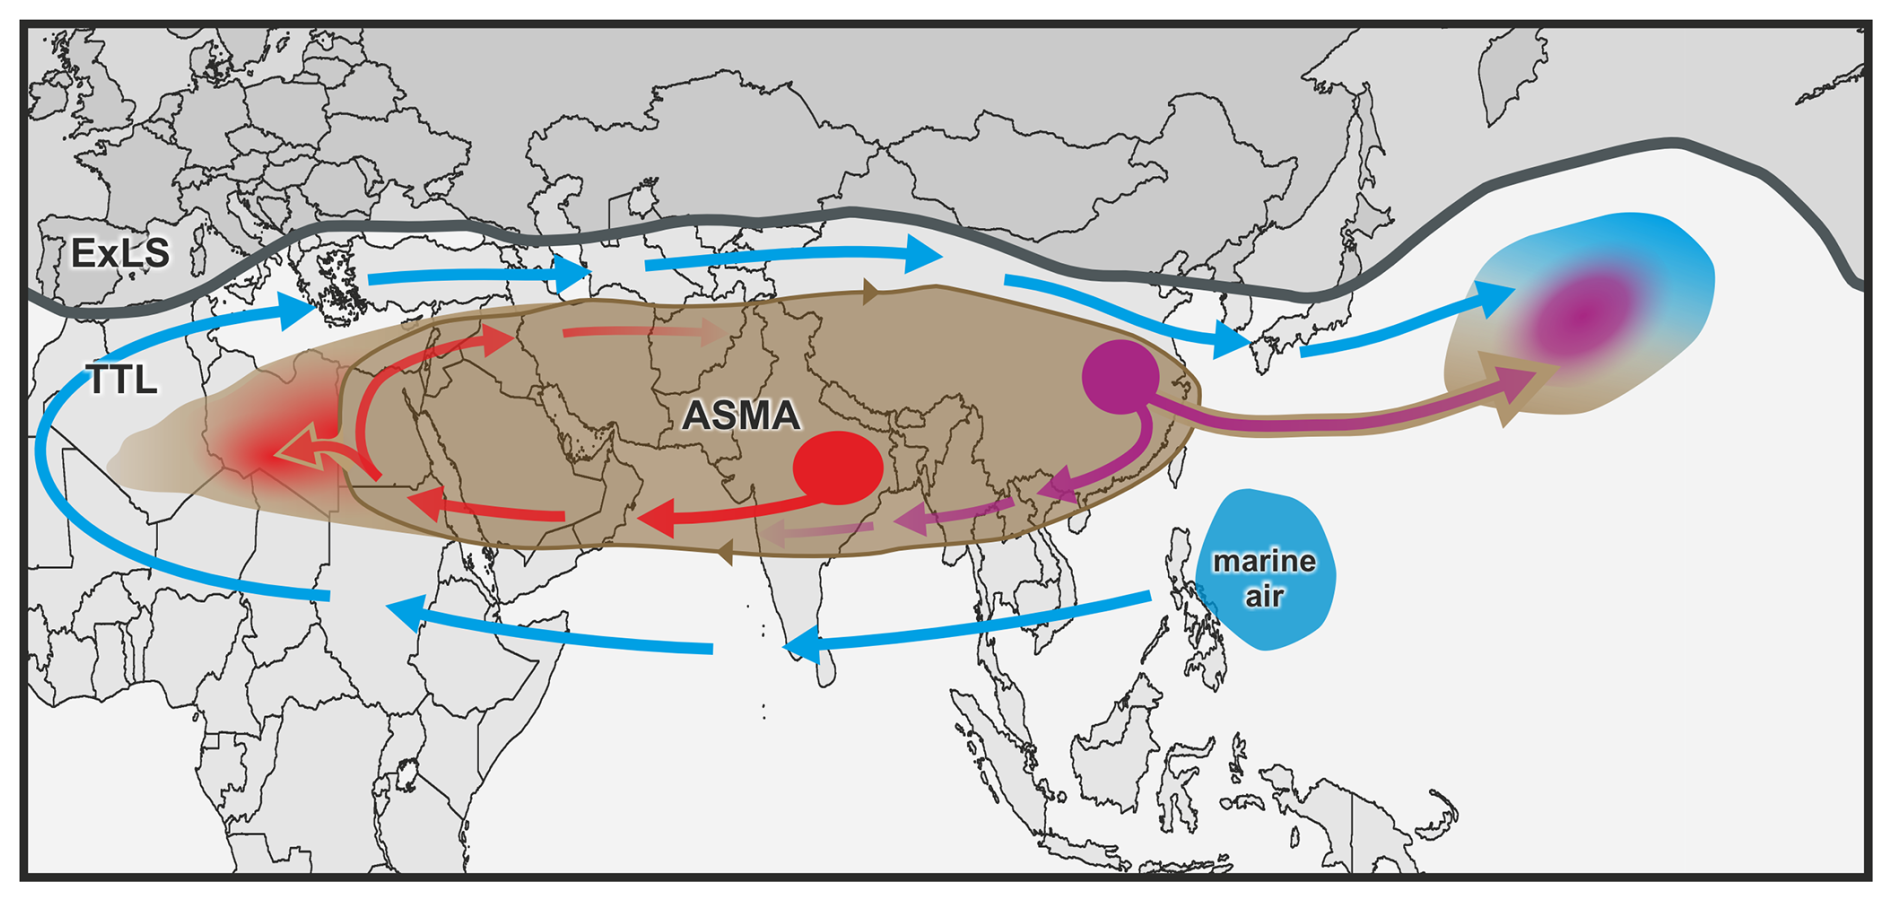
Figure 17Schematic of the ASMA and its westward and eastward outflow (brownish arrows). Marine air from the western Pacific (blue) can be uplifted by tropical cyclones to altitudes of the ASMA and subsequently transported around the outer edge of the ASMA (blue arrows). Mixing of polluted air from inside the ASMA (brown) with marine air (blue) at its edge occurs at the eastern flank of the anticyclone when filaments are separated from the main anticyclone. Air masses measured in the eastward outflow of the ASMA are mainly from eastern China (purple) and the western Pacific (from the region of East Asian and Western North Pacific summer monsoons) in contrast to the western part that originates mainly from the Indian subcontinent (from the region of the Indian summer monsoon; red).
Measurements of ozone-poor and relatively enhanced CH2Br2 air that has mostly natural oceanic sources indicate sources in the Western Pacific in agreement with CLaMS Western Pacific surface–origin tracer as well as back-trajectory calculations indicating possible impact of tropical cyclones (e.g., region 1 in Figs. 11 and 15). The uplift of marine air by tropical cyclones and the subsequent transport impacted by the ASMA is a potential source of CH2Br2, ozone-poor air and water vapour contributing to the chemical composition of the UTLS. Bromine from very short lived substances such as CH2Br2, primarily from natural oceanic sources, contributes substantially to the stratospheric bromine loading and has a significant impact on modelled ozone and ozone trends in particular in the extratropical UTLS (Sinnhuber and Meul, 2015). Despite research flights F02, F06, and F08 were influenced by tropical cyclones and have marine sources, no significant particle fractions from sea salt and MSA as marine tracers were found. We emphasise that the intensity and duration of tropical cyclones has been increasing in recent decades (e.g. Emanuel, 2005; Mei and Xie, 2016; Knutson et al., 2020; Bhatia et al., 2022). Therefore, direct injections of marine air by rapid uplift in tropical cyclones to the outer edge of the ASMA will likely increase in the future.
A1 CH4–CH2Cl2 relations
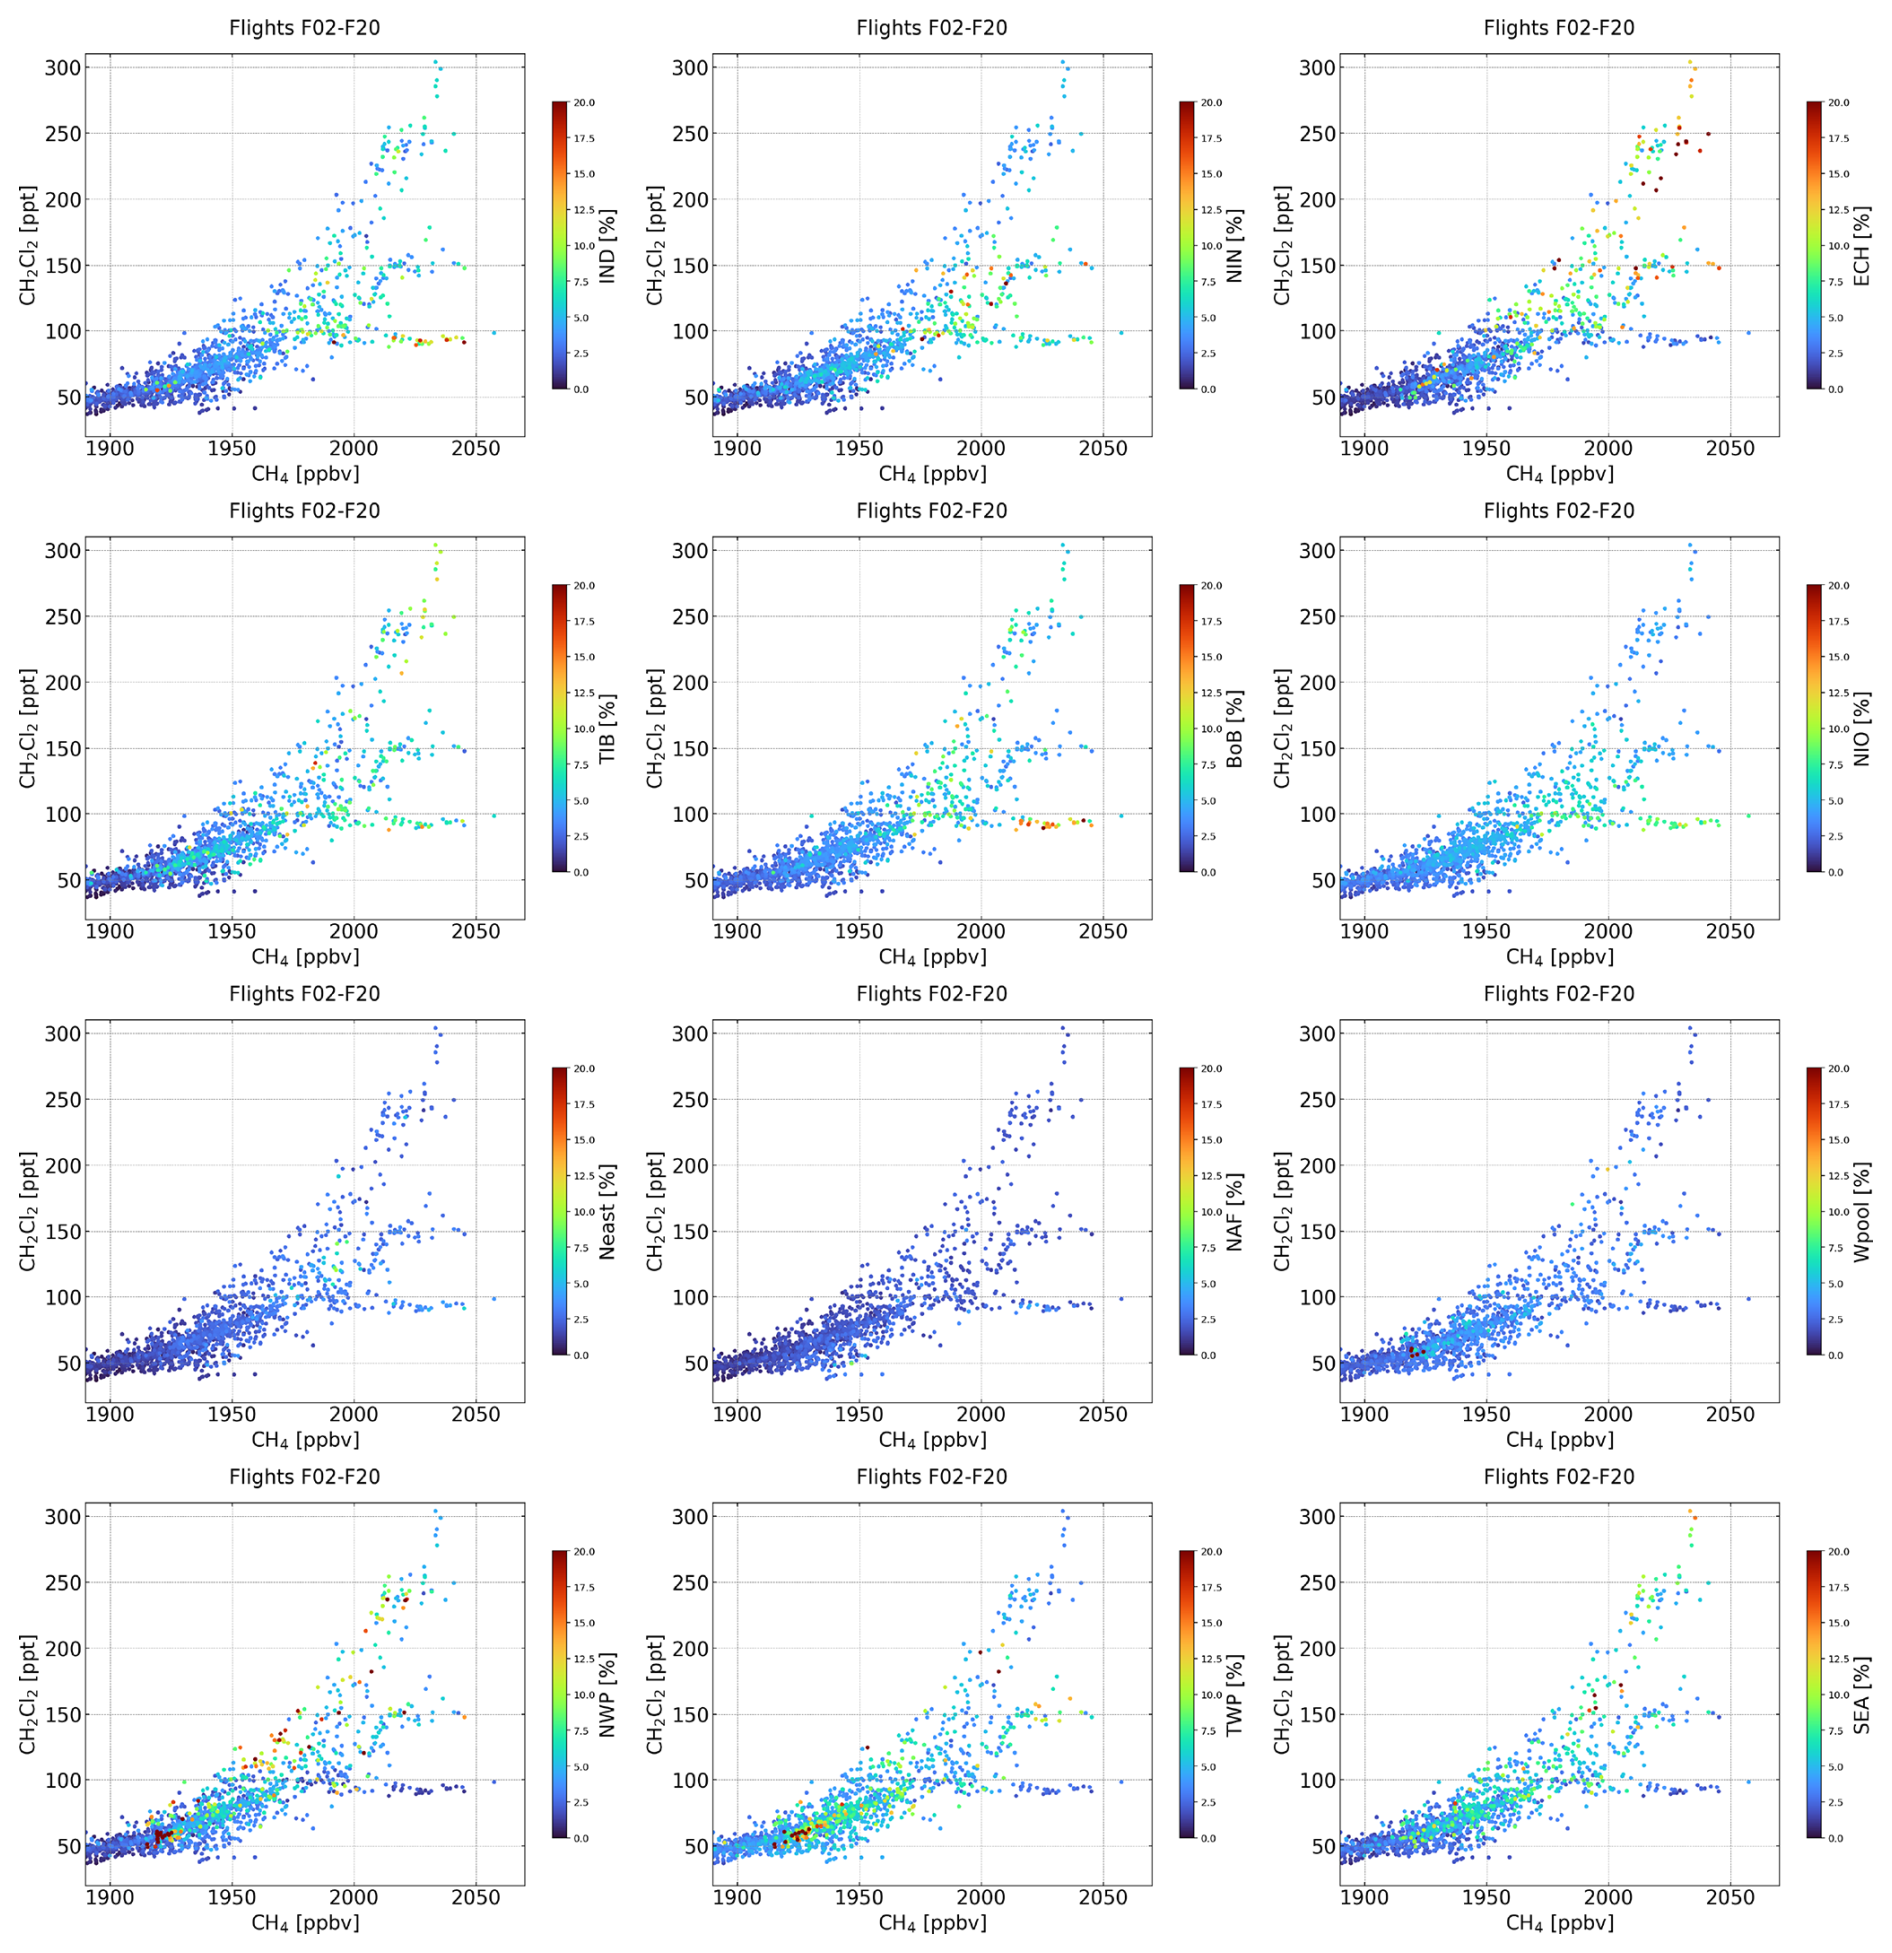
Figure A1The same as Fig. 5, but for surface–origin tracers contributing to the South Asia (IND, NIN, ECH, TIB, BoB, NIO, Neast, NAF) and Western Pacific tracer (Wpool, TWP, NWP, SEA).
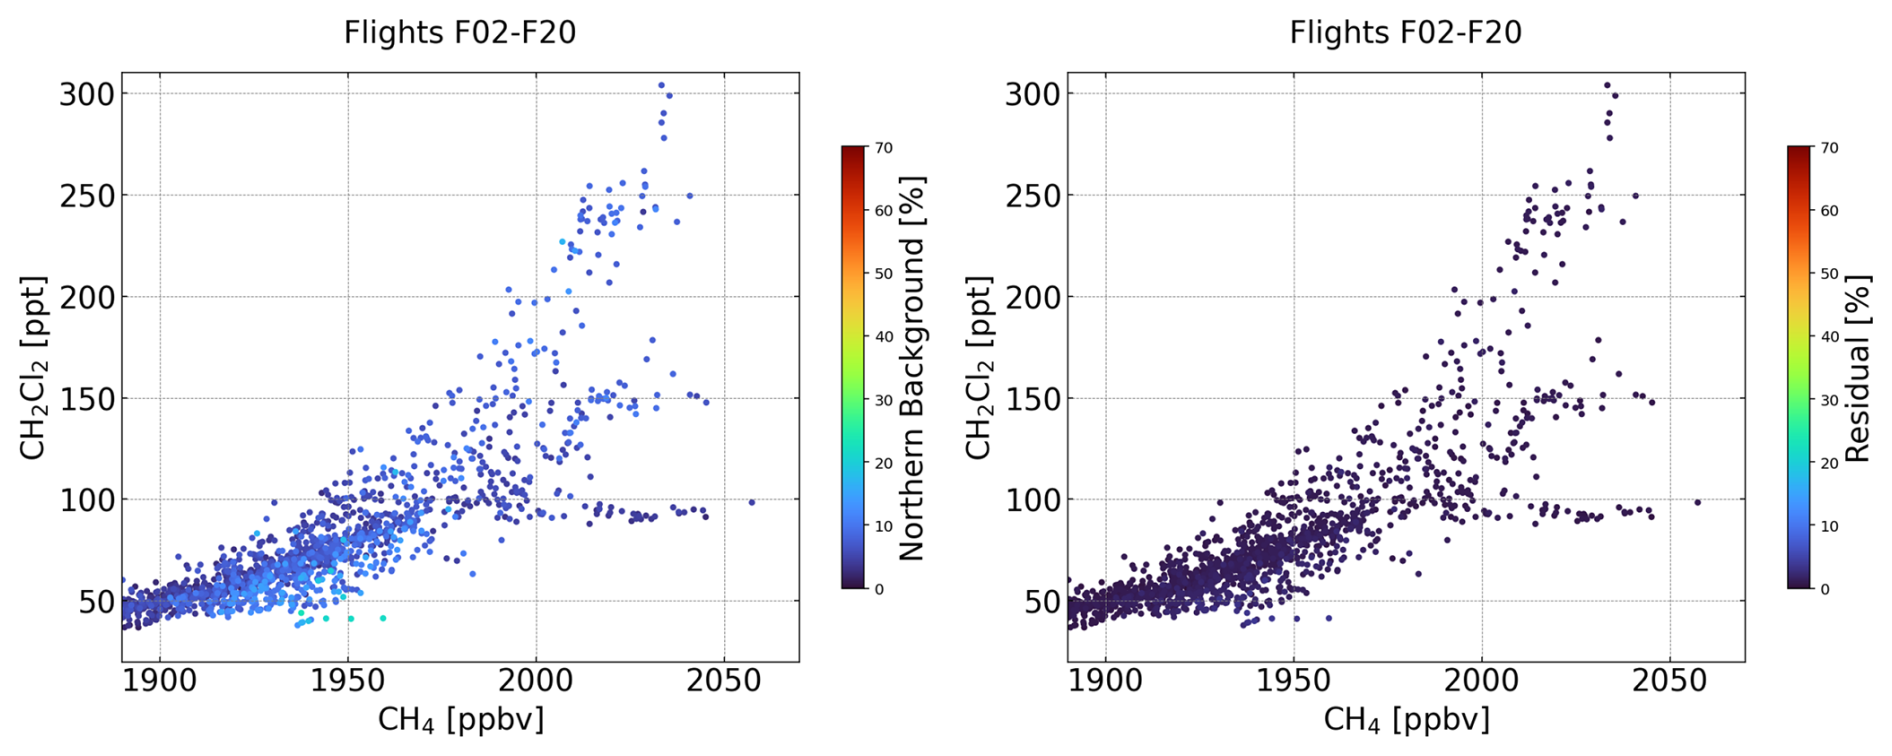
A2 CH4–H2O relations indicating water vapour sources in South Asia and the western Pacific

Figure A3CH4–H2O relations for all scientific PHILEAS flights F02–F20 for measurements above 360 K, i.e. at altitudes of the ASMA colour-coded by the South Asia and Western Pacific tracer and potential temperature. In addition, also the scientific flights F02 (6 August 2023), F06 (16 August 2023) and F08 (26–27 August 2023) are shown.
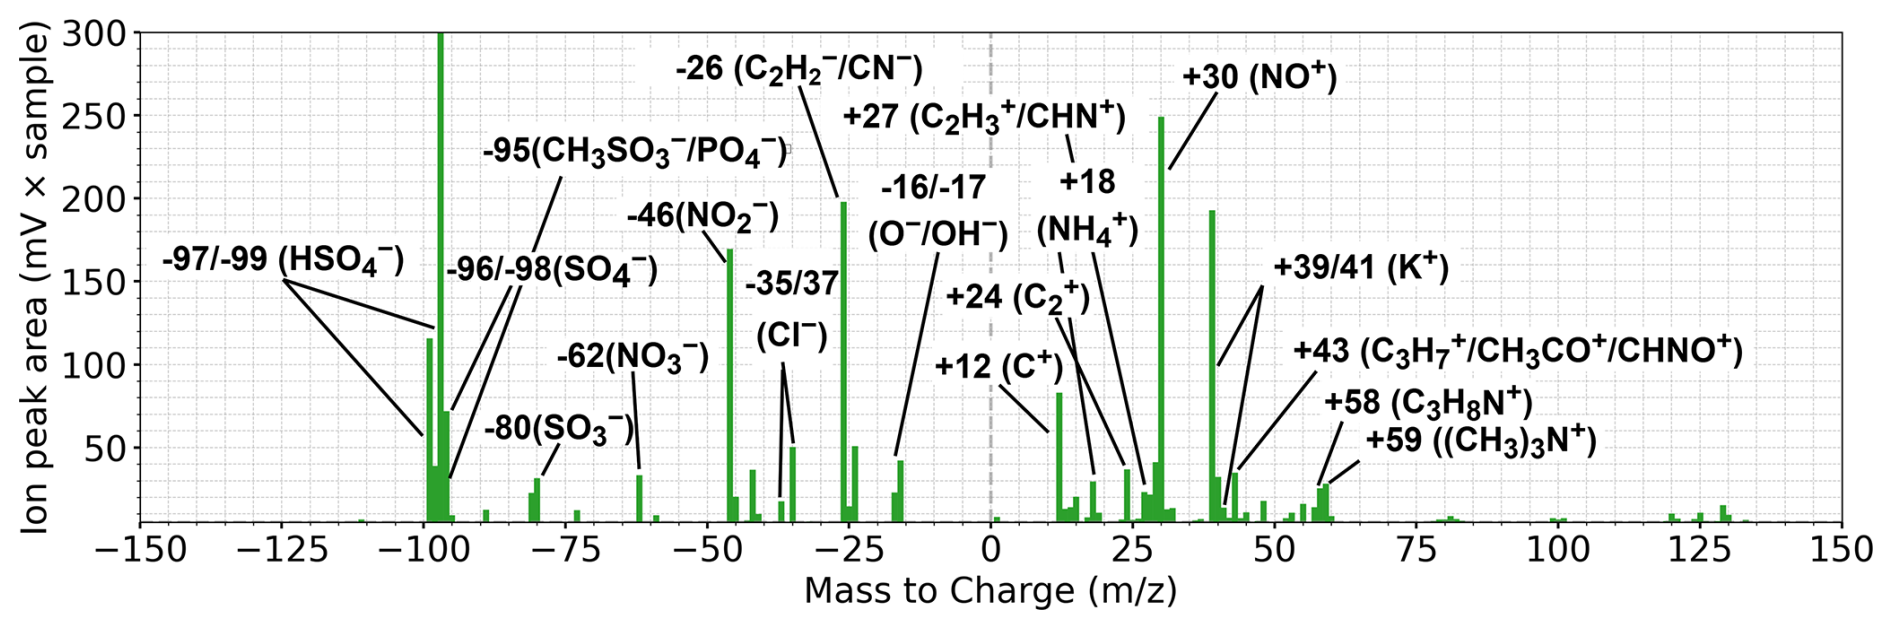
Figure B1Bipolar mean spectrum of the TMA-containing particle type (average over 354 particles) measured with ERICA-LAMS during F02. The mean spectrum indicates that TMA in single particles is internally mixed with sulfate, nitrate, ammonium, potassium, chloride, MSA, and organic compounds. The signal intensity axis is limited to 300 mV, while the −97 actually reaches up to 3000 mV.
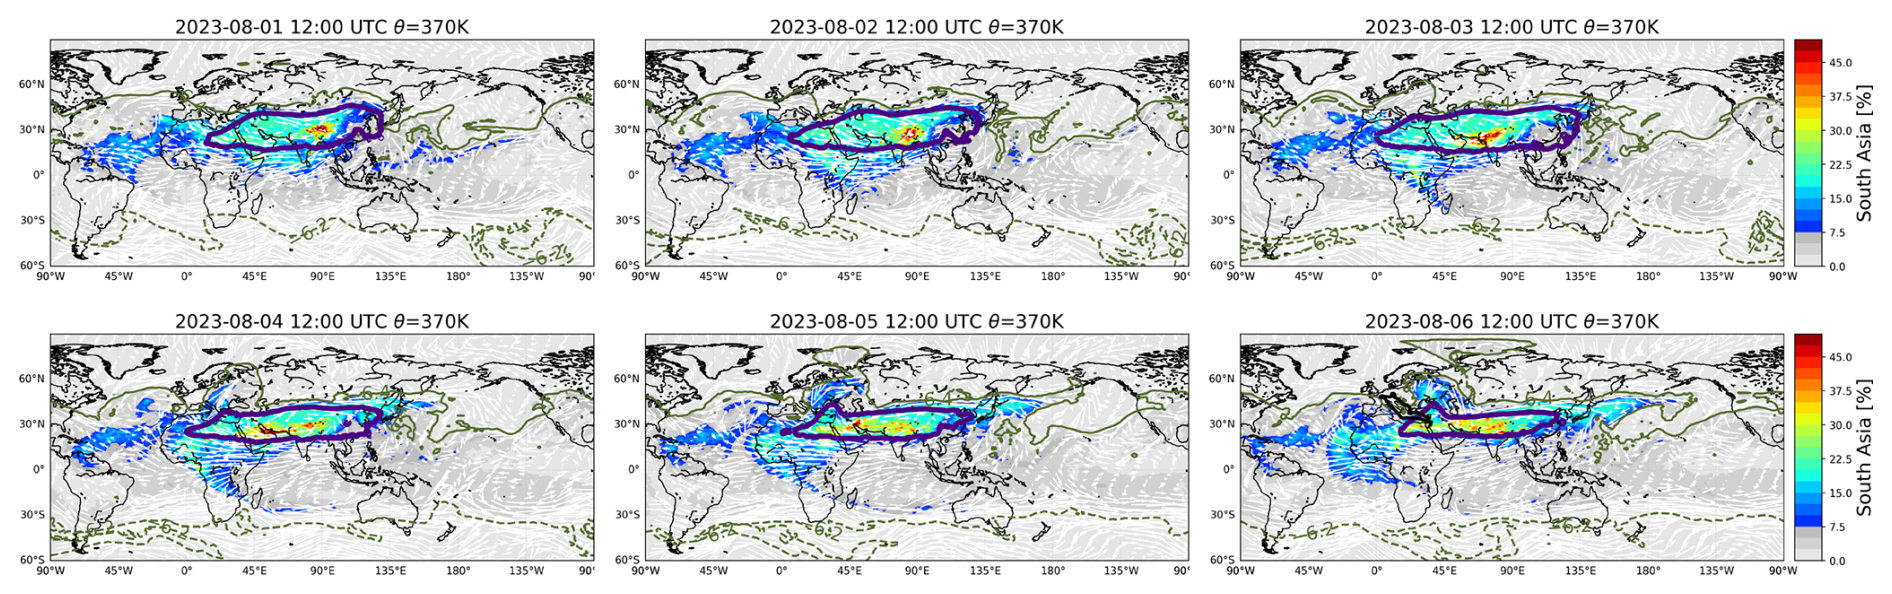
Figure C1Temporal evolution of the South Asia tracer at 370 K potential temperature from 1 to 6 August 2023. On 6 August 2023 the calculated synoptic HALO flight track position at 12:00 UTC of research flight F02 is indicated (black line). The climatological isentropic transport barrier for the Northern (PV = 6.4 PVU; solid olive line) and Southern (PV = −6.2 PVU; dashed olive line) Hemisphere at 370 K during summer derived by Kunz et al. (2015) indicates the barrier between the tropical tropopause layer and the extra-tropical lower stratosphere.
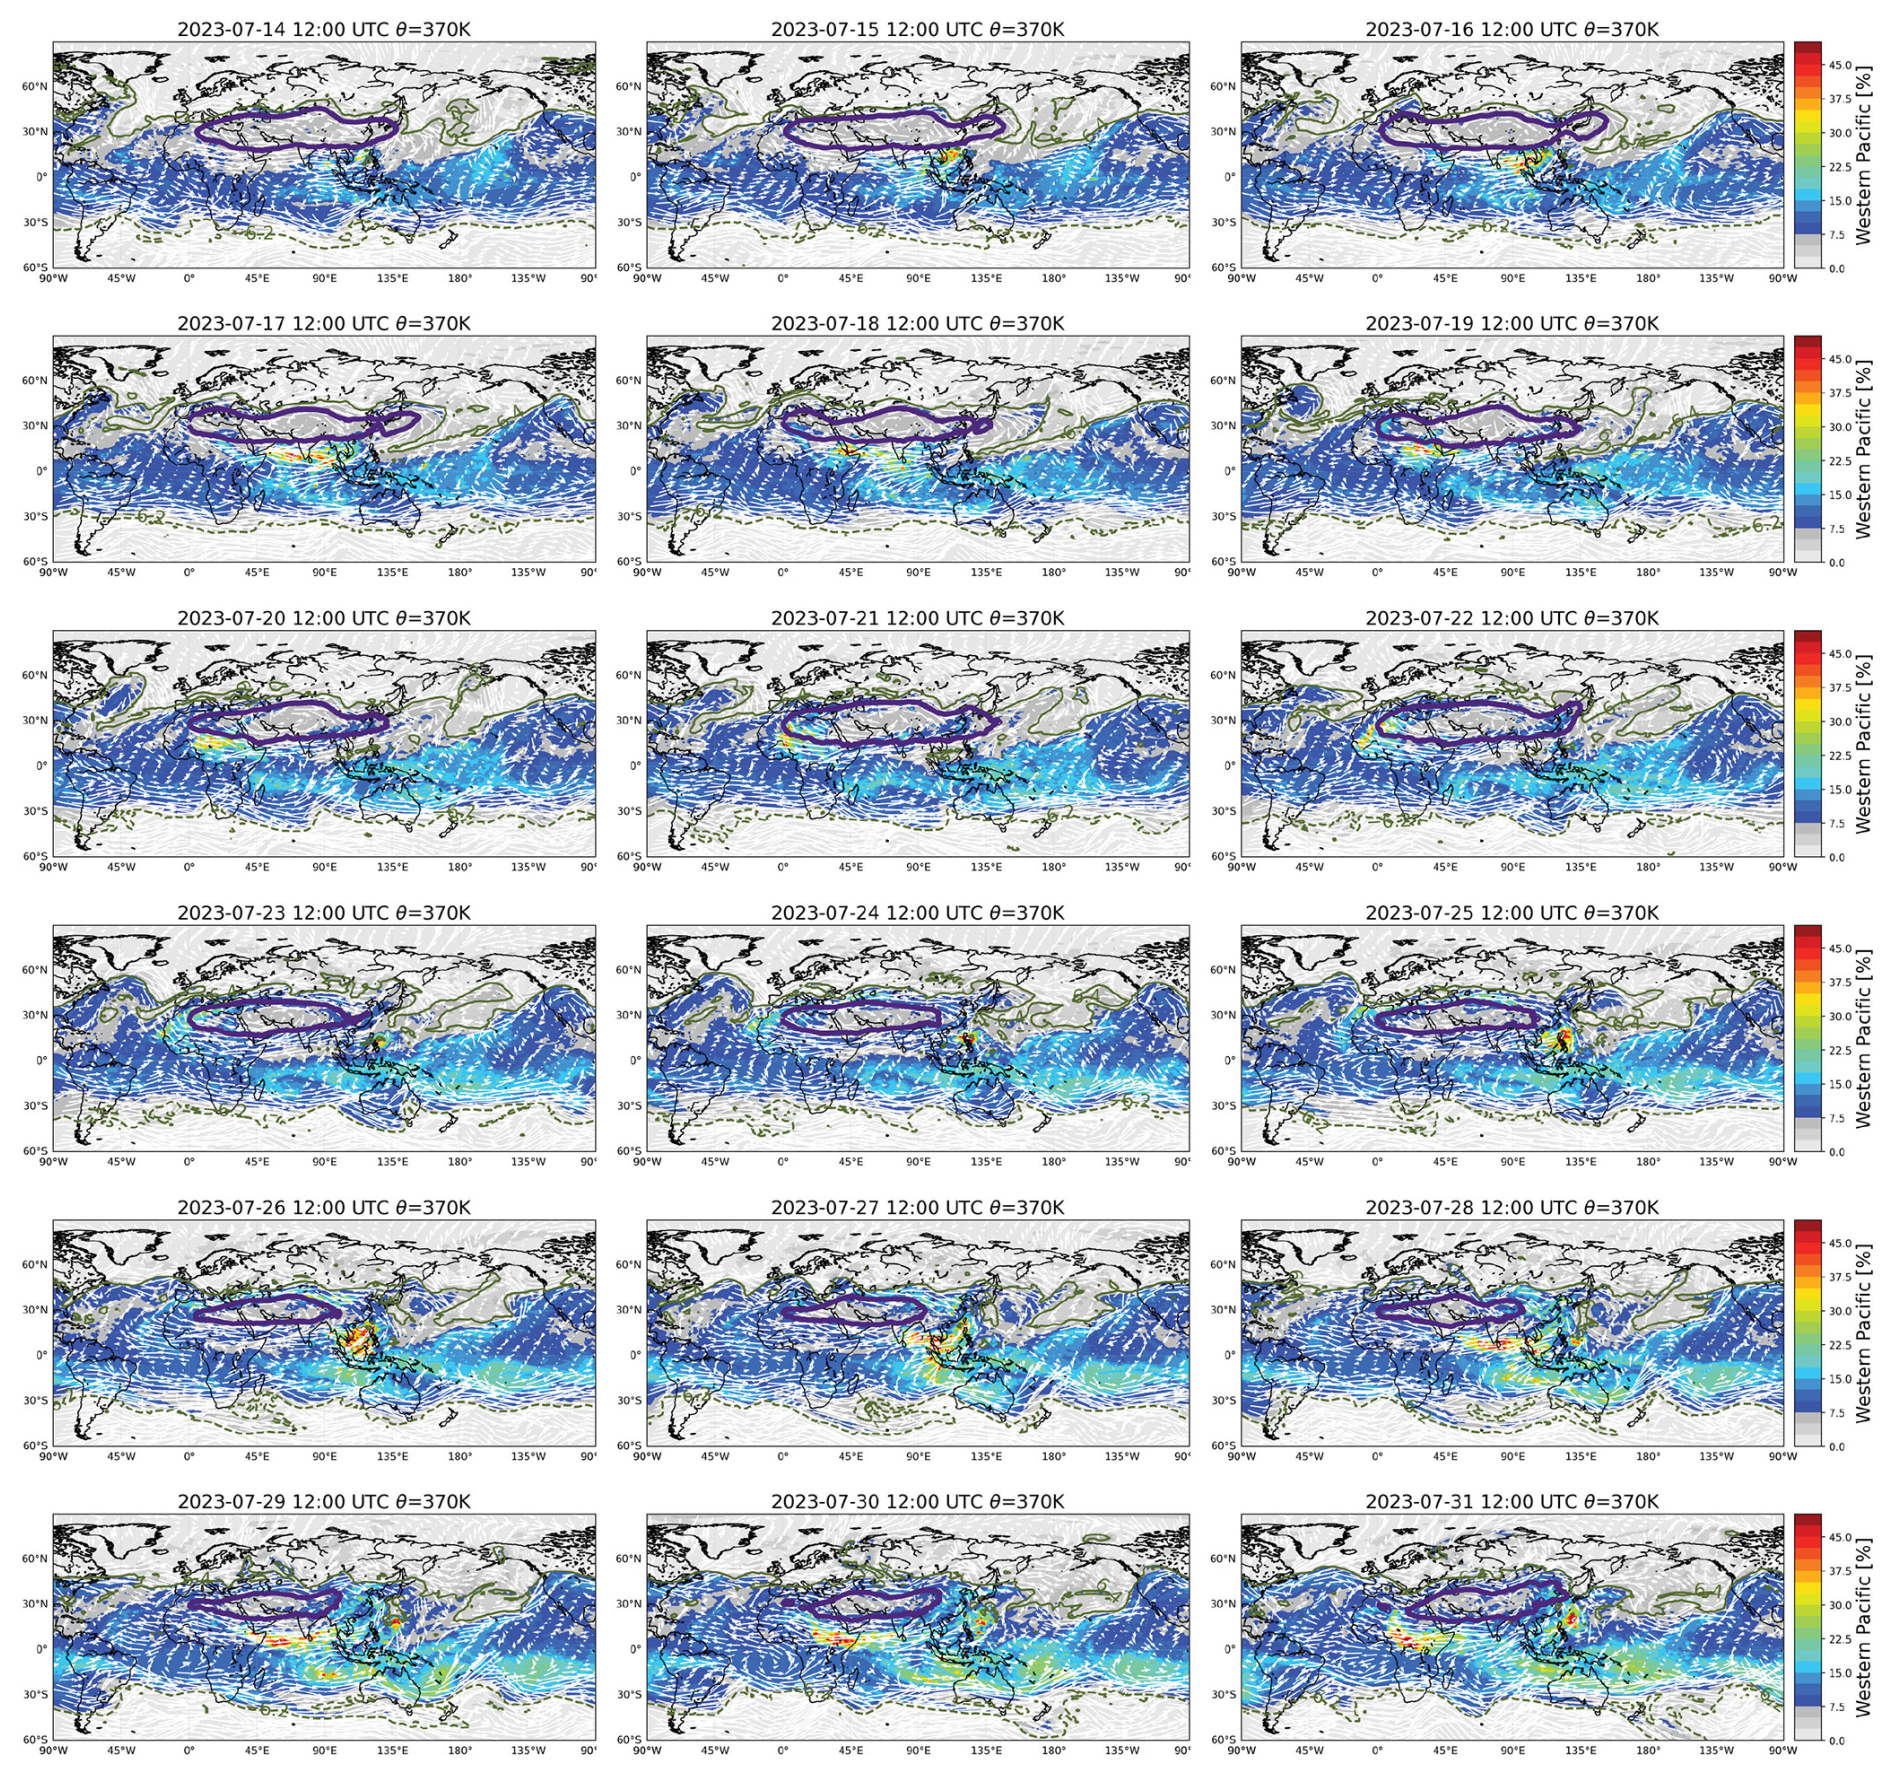
Figure C2Temporal evolution of the Western Pacific tracer at 370 K potential temperature from 15 to 31 July 2023. The impact of several tropical cyclones on the Western Pacific tracer is evident (reddish colours): Talim (B) (14–16 July), Doksuri (C) (23–27 July) and Khanun (D) (29 July–2 August; see next figure for August). Subsequent enhanced fractions of the Western Pacific tracer uplifted by tropical cyclones were transported anticyclonically around the ASMA's southern edge. Thereafter, at the western flank of the ASMA over Africa or the Atlantic Ocean the air is transported eastwards by the subtropical jet and a belt of the Western Pacific tracer is developing between the northern edge of the ASMA and the subtropical jet. The climatological isentropic transport barriers (olive lines) are the same as in Fig. C1.
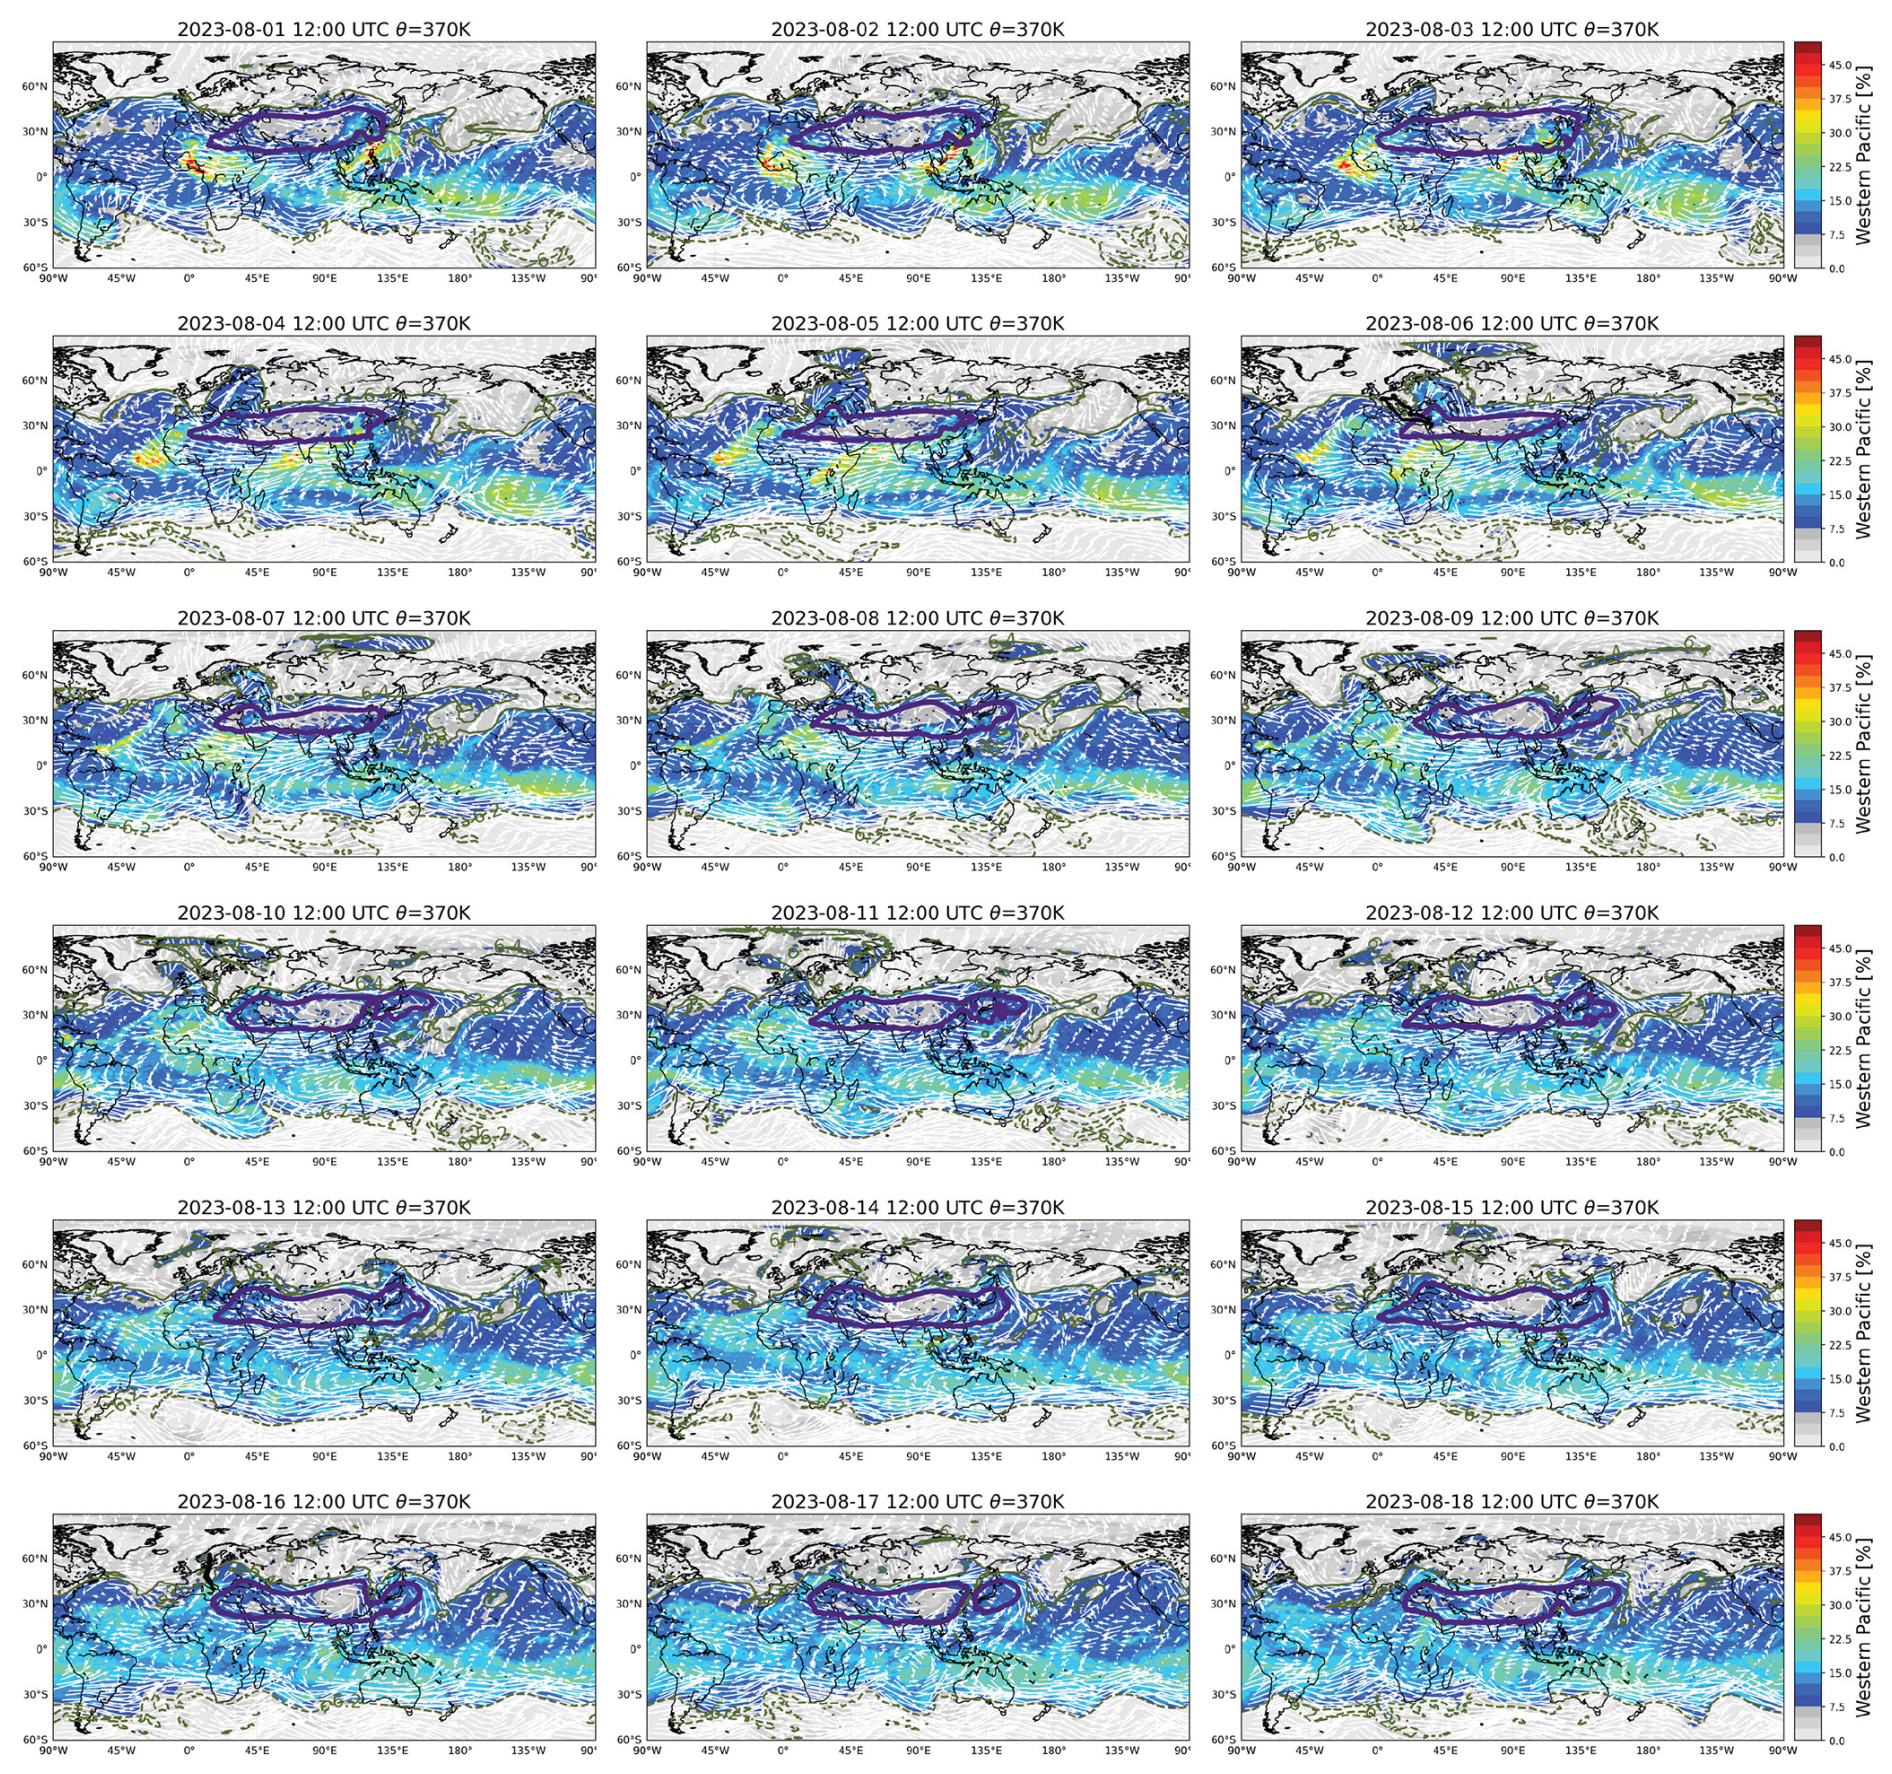
Figure C3Same as Fig. C2, but from 1 to 18 August 2023. On 6 and 16 August 2023 the calculated synoptic HALO flight track position at 12:00 UTC of research flight F02 and F06, respectively, are indicated (black line).
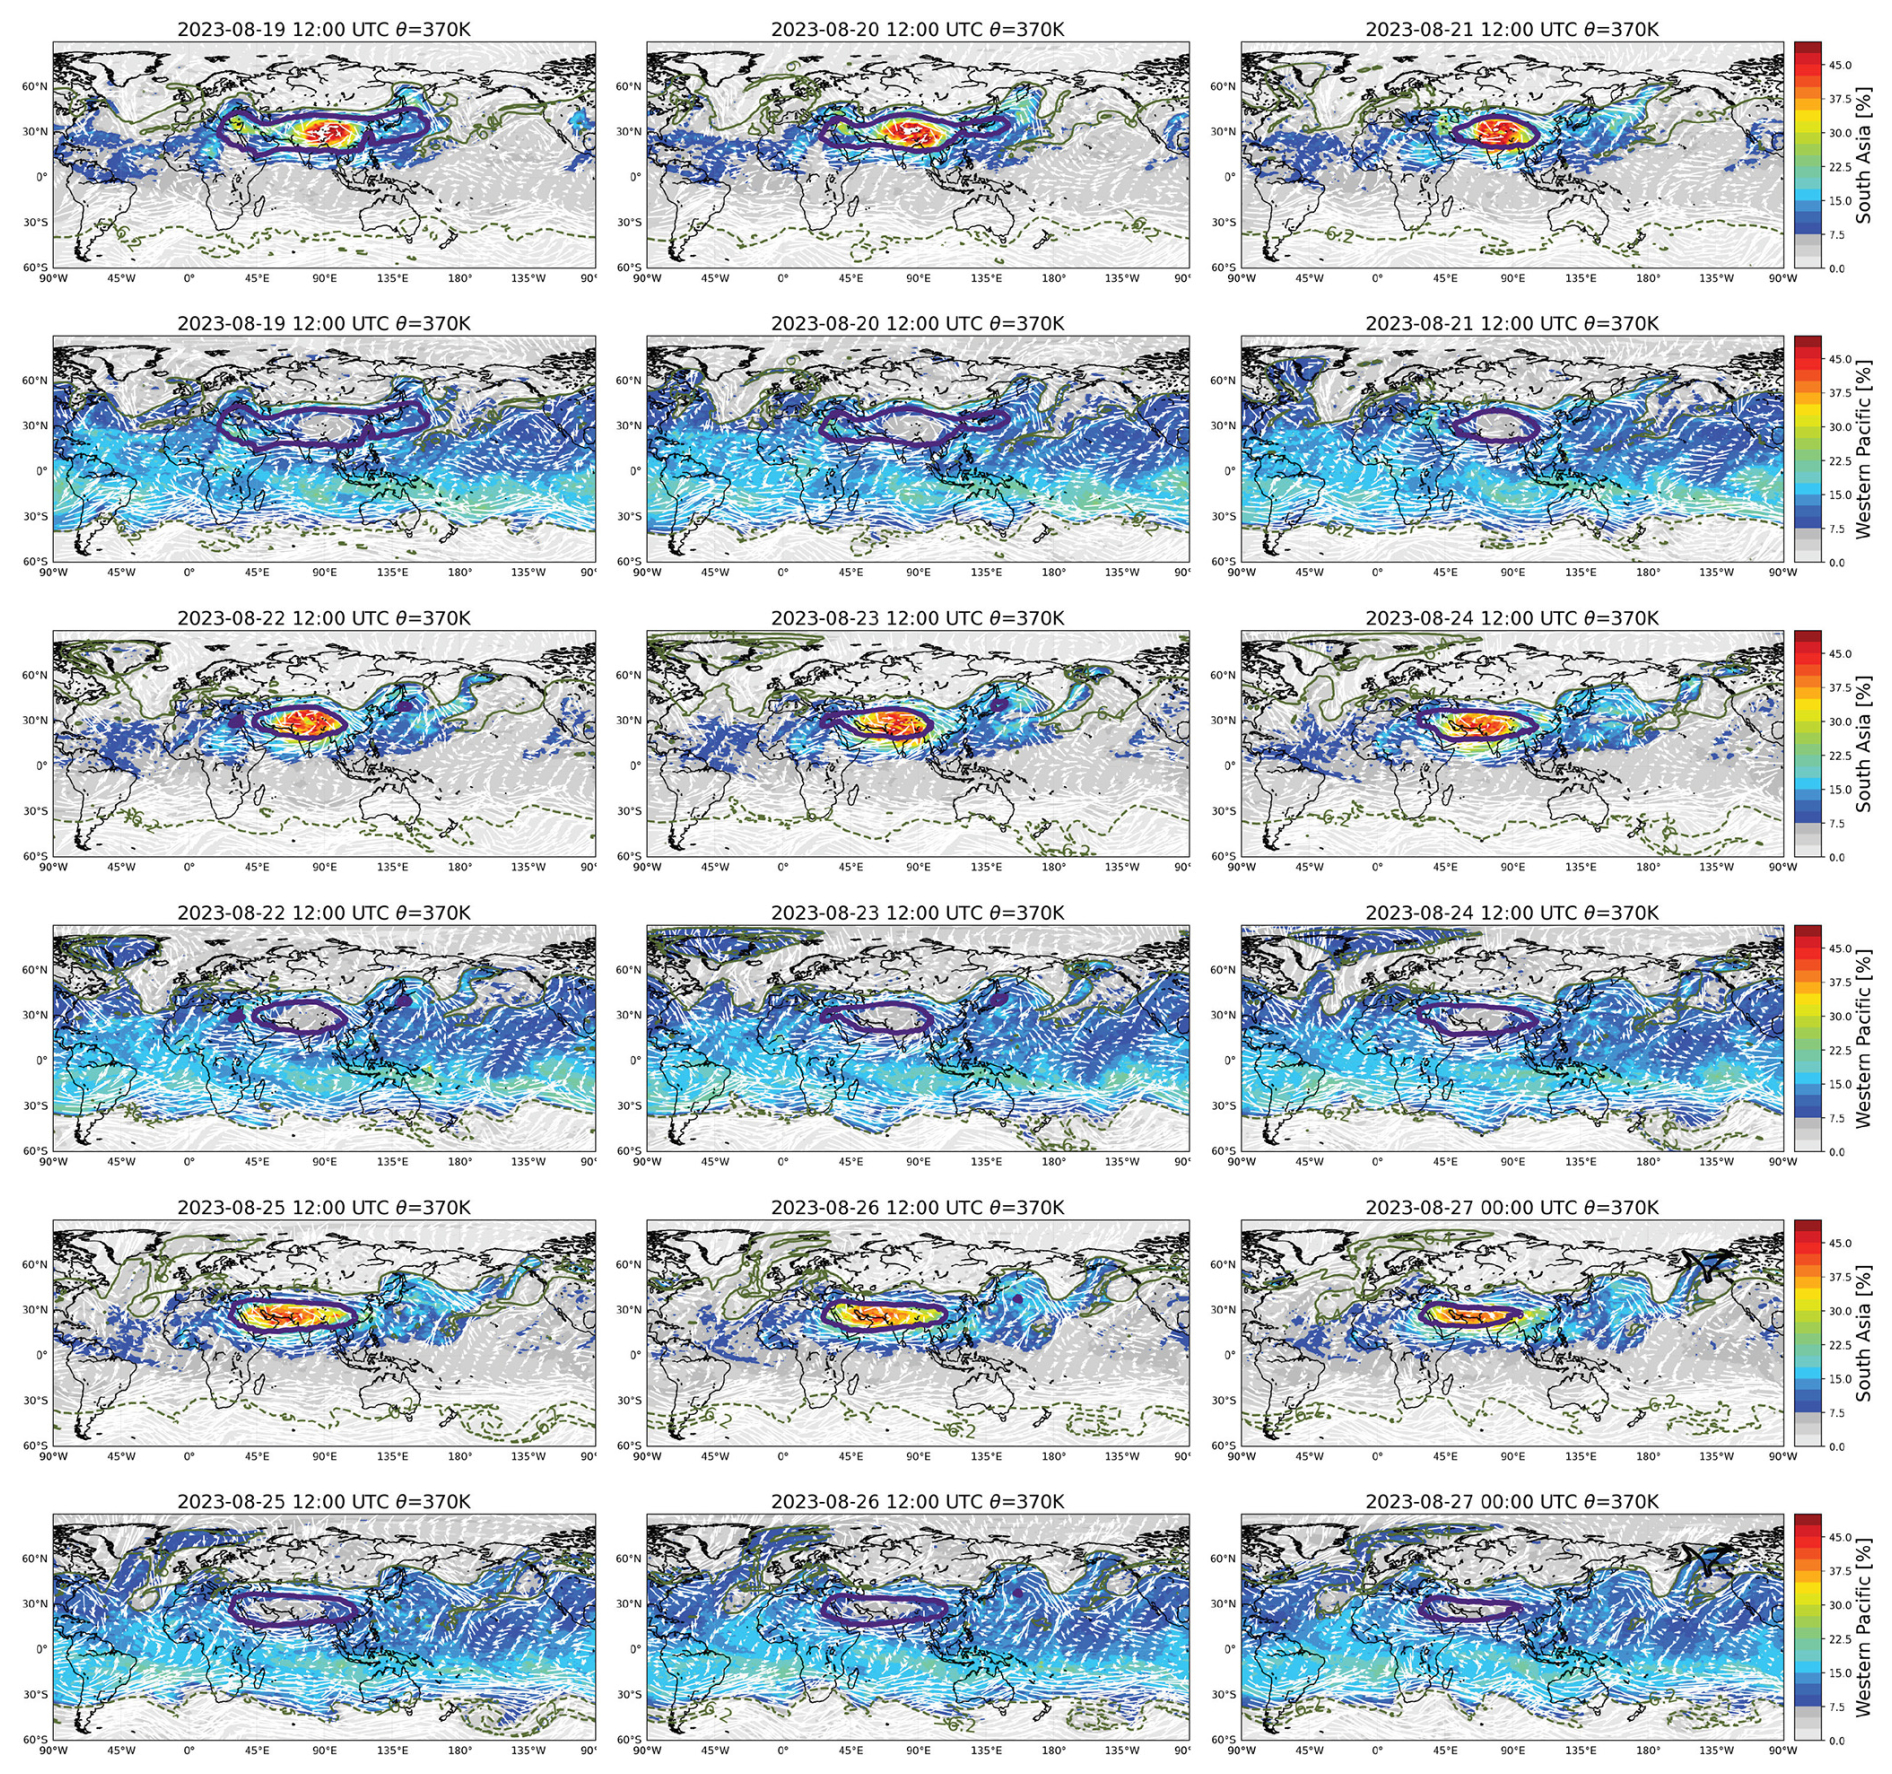
Figure C4Temporal evolution of the South Asia and the Western Pacific tracer at 370 K potential temperature from 19 to 27 August 2023. On 27 August 2023 (00:00 UTC; in contrast to all other panels that are shown on 12:00 UTC) the calculated synoptic HALO flight track position of research flight F08 is indicated (black line).
Observational data from the PHILEAS HALO mission are available via the HALO database (https://halo-db.pa.op.dlr.de/, last access: 6 May 2026). The ERA5 data used here are available from the ECMWF (https://www.copernicus.eu/en, last access: 6 May 2026). The tropical cyclone tracks in the western Pacific are provided by the Japan Meteorological Agency and are available under https://www.jma.go.jp/jma/jma-eng/jma-center/rsmc-hp-pub-eg/besttrack.html (last access: 9 October 2024). The CLaMS code is available on a GitLab server at https://jugit.fz-juelich.de/clams/CLaMS (last access: 6 May 2026). Results of the CLaMS simulations presented in this work are available from the corresponding author upon request.
BV developed the concept for this study and performed the CLaMS simulations with contributions of JC. VL, JS, RvL, MCV, FE, FK, SB, AD, OE, SM, JS, PH, LO, FW, CR, and AZ conducted the HALO PHILEAS measurements and the subsequent data analysis of these observations. MR, PH and CR coordinated the PHILEAS campaign including the scientific flight planning. OK provided the ASMA boundaries. BV wrote the paper with contributions of all authors. The interpretation of the results was discussed with all coauthors.
The authors have the following competing interests: At least one of the (co-)authors is a member of the editorial board of Atmospheric Chemistry and Physics.
Publisher's note: Copernicus Publications remains neutral with regard to jurisdictional claims made in the text, published maps, institutional affiliations, or any other geographical representation in this paper. The authors bear the ultimate responsibility for providing appropriate place names. Views expressed in the text are those of the authors and do not necessarily reflect the views of the publisher.
We are grateful to all colleagues that were involved in the PHILEAS project, in particular applying and coordinating the project, planning the research flights including the provision of forecast products as well as preparing and conducting measurements onboard HALO and the subsequent data analysis. In particular we would like to thank Florian Obersteiner (KIT, Karlsruhe, Germany) for the FAIRO data, Daniel Kunkel (University Mainz, Germany) and Johannes Schneider (MPI, Mainz, Germany) for further discussion of the manuscript. We thank the European Centre for Medium-Range Weather Forecasts (ECMWF) for providing the the ERA5 reanalyses and the Jülich Supercomputing Centre (JSC; Research Centre Jülich, Germany) for the computing time on the supercomputer JUWELS (project CLaMS-ESM) and for the storage resources. Finally, we acknowledge Matthias Riße and Nicole Thomas very much for their support on a variety of technical issues related to this work and Karlheinz Nogai for the creation of the summary figure. ChatGPT was used for assistance with language refinement and Python programming.
The presented work was partly funded by the German Science Foundation (Deutsche Forschungsgemeinschaft, DFG) as part of the HALO Priority Program SPP 1294 (VO 1276/7-1, HO-4225/17-1 HO-4225/19-1, KO 6470/1-1), the NSFC–DFG project ATALTrack (VO 1276/6-1 and BO 1829/12-1) and the TRR 301 TPChange project (Project-ID 428312742).
The article processing charges for this open-access publication were covered by the Forschungszentrum Jülich.
This paper was edited by Jianzhong Ma and reviewed by five anonymous referees.
Adcock, K. E., Fraser, P. J., Hall, B. D., Langenfelds, R. L., Lee, G., Montzka, S. A., Oram, D. E., Röckmann, T., Stroh, F., Sturges, W. T., Vogel, B., and Laube, J. C.: Aircraft-Based Observations of Ozone-Depleting Substances in the Upper Troposphere and Lower Stratosphere in and Above the Asian Summer Monsoon, J. Geophys. Res., 126, e2020JD033137, https://doi.org/10.1029/2020JD033137, 2021. a, b, c, d, e, f, g, h
An, M., Western, L. M., Say, D., Chen, L., Claxton, T., Ganesan, A. L., Hossaini, R., Krummel, P. B., Manning, A. J., Mühle, J., O'Doherty, S., Prinn, R. G., Weiss, R. F., Young, D., Hu, J., Yao, B., and Rigby, M.: Rapid increase in dichloromethane emissions from China inferred through atmospheric observations, Nat. Commun., 12, https://doi.org/10.1038/s41467-021-27592-y, 2021. a, b
Angelino, S., Suess, D. T., and Prather, K. A.: Formation of Aerosol Particles from Reactions of Secondary and Tertiary Alkylamines: Characterization by Aerosol Time-of-Flight Mass Spectrometry, Environ. Sci. Technol., 35, 3130–3138, https://doi.org/10.1021/es0015444, 2001. a
Appel, O., Köllner, F., Dragoneas, A., Hünig, A., Molleker, S., Schlager, H., Mahnke, C., Weigel, R., Port, M., Schulz, C., Drewnick, F., Vogel, B., Stroh, F., and Borrmann, S.: Chemical analysis of the Asian tropopause aerosol layer (ATAL) with emphasis on secondary aerosol particles using aircraft-based in situ aerosol mass spectrometry, Atmos. Chem. Phys., 22, 13607–13630, https://doi.org/10.5194/acp-22-13607-2022, 2022. a, b, c, d
Bak, J., Kim, J., Koo, J.-H., Pan, L. L., Ryoo, J.-M., Newman, P. A., Franchin, A., Liu, X., Abad, G. G., Lee, H.-J., Jeon, W., and Kim, C.-H.: An Integrated Analysis of Ozone and Carbon Monoxide Over the Western Pacific Using Satellite and Aircraft Measurements During the ACCLIP Summer Campaign 2022, J. Geophys. Res., 130, e2024JD042771, https://doi.org/10.1029/2024JD042771, 2025. a
Baker, A. K., Schuck, T. J., Brenninkmeijer, C. A. M., Rauthe-Schöch, A., Slemr, F., van Velthoven, P. F. J., and Lelieveld, J.: Estimating the contribution of monsoon-related biogenic production to methane emissions from South Asia using CARIBIC observations, Geophys. Res. Lett., 39, https://doi.org/10.1029/2012GL051756, 2012. a
Becker, F., Vogel, B., Günther, G., Ploeger, F., Riese, M., Rosanka, S., Taraborrelli, D., Nützel, M., Jöckel, P., Brinkop, S., and Müller, R.: Upward transport of boundary layer air to altitudes of the Asian summer monsoon anticyclone in Eulerian and Lagrangian model simulations, Meteorol. Z., 3, 195–211, https://doi.org/10.1127/metz/1266, 2025. a
Bhatia, K., Baker, A., Yang, W., Vecchi, G., Knutson, T., Murakami, H., Kossin, J., Hodges, K., Dixon, K., Bronselaer, B., and Whitlock, C.: A potential explanation for the global increase in tropical cyclone rapid intensification, Nat. Commun., 13, 6626, https://doi.org/10.1038/s41467-022-34321-6, 2022. a
Bian, J., Li, D., Bai, Z., Li, Q., Lyu, D., and Zhou, X.: Transport of Asian surface pollutants to the global stratosphere from the Tibetan Plateau region during the Asian summer monsoon, Natl. Sci. Rev., 7, 516–533, https://doi.org/10.1093/nsr/nwaa005, 2020. a
Bönisch, H., Engel, A., Curtius, J., Birner, Th., and Hoor, P.: Quantifying transport into the lowermost stratosphere using simultaneous in-situ measurements of SF6 and CO2, Atmos. Chem. Phys., 9, 5905–5919, https://doi.org/10.5194/acp-9-5905-2009, 2009. a
Brunamonti, S., Jorge, T., Oelsner, P., Hanumanthu, S., Singh, B. B., Kumar, K. R., Sonbawne, S., Meier, S., Singh, D., Wienhold, F. G., Luo, B. P., Boettcher, M., Poltera, Y., Jauhiainen, H., Kayastha, R., Karmacharya, J., Dirksen, R., Naja, M., Rex, M., Fadnavis, S., and Peter, T.: Balloon-borne measurements of temperature, water vapor, ozone and aerosol backscatter on the southern slopes of the Himalayas during StratoClim 2016–2017, Atmos. Chem. Phys., 18, 15937–15957, https://doi.org/10.5194/acp-18-15937-2018, 2018. a, b
Chirkov, M., Stiller, G. P., Laeng, A., Kellmann, S., von Clarmann, T., Boone, C. D., Elkins, J. W., Engel, A., Glatthor, N., Grabowski, U., Harth, C. M., Kiefer, M., Kolonjari, F., Krummel, P. B., Linden, A., Lunder, C. R., Miller, B. R., Montzka, S. A., Mühle, J., O'Doherty, S., Orphal, J., Prinn, R. G., Toon, G., Vollmer, M. K., Walker, K. A., Weiss, R. F., Wiegele, A., and Young, D.: Global HCFC-22 measurements with MIPAS: retrieval, validation, global distribution and its evolution over 2005–2012, Atmos. Chem. Phys., 16, 3345–3368, https://doi.org/10.5194/acp-16-3345-2016, 2016. a
Claxton, T., Hossaini, R., Wild, O., Chipperfield, M. P., and Wilson, C.: On the Regional and Seasonal Ozone Depletion Potential of Chlorinated Very Short-Lived Substances, Geophys. Res. Lett., 46, 5489–5498, https://doi.org/10.1029/2018GL081455, 2019. a
Clemens, J., Ploeger, F., Konopka, P., Portmann, R., Sprenger, M., and Wernli, H.: Characterization of transport from the Asian summer monsoon anticyclone into the UTLS via shedding of low potential vorticity cutoffs, Atmos. Chem. Phys., 22, 3841–3860, https://doi.org/10.5194/acp-22-3841-2022, 2022. a
Clemens, J., Hoffmann, L., Vogel, B., Grießbach, S., and Thomas, N.: Implementation and evaluation of diabatic advection in the Lagrangian transport model MPTRAC 2.6, Geosci. Model Dev., 17, 4467–4493, https://doi.org/10.5194/gmd-17-4467-2024, 2024a. a
Clemens, J., Vogel, B., Hoffmann, L., Griessbach, S., Thomas, N., Fadnavis, S., Müller, R., Peter, T., and Ploeger, F.: A multi-scenario Lagrangian trajectory analysis to identify source regions of the Asian tropopause aerosol layer on the Indian subcontinent in August 2016, Atmos. Chem. Phys., 24, 763–787, https://doi.org/10.5194/acp-24-763-2024, 2024b. a, b, c, d, e
Dethof, A., O'Neill, A., Slingo, J. M., and Smit, H. G. J.: A mechanism for moistening the lower stratosphere involving the Asian summer monsoon, Q. J. Roy. Meteor. Soc., 556, 1079–1106, 1999. a
Dubé, K., Tegtmeier, S., Bourassa, A., Laube, J. C., Engel, A., Saunders, L. N., Walker, K. A., Hossaini, R., and Bednarz, E. M.: Chlorinated very short-lived substances offset the long-term reduction of inorganic stratospheric chlorine, Commun. Earth Environ., 6, 487, https://doi.org/10.1038/s43247-025-02478-9, 2025. a
Ekinci, F., Eppers, O., Appel, O., Ploeger, F., Dragoneas, A., Molleker, S., Brauner, P., Lachnitt, H.-C., Weyland, F., Ort, L., Emig, N., Clemen, H.-C., Tomsche, L., Ebert, M., Hoor, P., Vogel, B., Cheng, Y., Schneider, J., Borrmann, S., and Köllner, F.: Enhancement of ammonium nitrate aerosol in the Northern Hemisphere lower stratosphere linked to Asian summer monsoon outflow, EGUsphere [preprint], https://doi.org/10.5194/egusphere-2026-998, 2026. a
Emanuel, K.: Tropical cyclons, Annu. Rev. Earth Pl. Sc., 3, 75–104, 2003. a
Emanuel, K.: Increasing destructiveness of tropical cyclones over the past 30 years, Nature, 436, 686–688, https://doi.org/10.1038/nature03906, 2005. a
Eppers, O., Köllner, F., Appel, O., Brauner, P., Ekinci, F., Molleker, S., Dragoneas, A., Smith, W. P., Ueyama, R., Bucci, S., Legras, B., Williamson, C., Campos, T., Ullman, K., Schill, G. P., Murphy, D. M., Pan, L. L., Cheng, Y., and Borrmann, S.: Regional contributions to the chemical composition of the Asian tropopause aerosol layer (ATAL, ESS Open Archive, https://doi.org/10.22541/essoar.175130383.35260852/v1, 2025. a
Facchini, M. C., Decesari, S., Rinaldi, M., Carbone, C., Finessi, E., Mircea, M., Fuzzi, S., Moretti, F., Tagliavini, E., Ceburnis, D., and O'Dowd, C. D.: Important Source of Marine Secondary Organic Aerosol from Biogenic Amines, Environ. Sci. Technol., 42, 9116–9121, https://doi.org/10.1021/es8018385, 2008. a
Fadnavis, S., Sagalgile, A., Sonbawne, S., Vogel, B., Peter, T., Wienhold, F. G., Dirksen, R., Oelsner, P., Naja, M., and Müller, R.: Comparison of ozonesonde measurements in the upper troposphere and lower Stratosphere in Northern India with reanalysis and chemistry-climate-model data, Sci. Rep., 13, https://doi.org/10.1038/s41598-023-34330-5, 2023. a
Fadnavis, S., Sonbawne, S. M., Laakso, A., Ploeger, F., Rap, A., Heinold, B., Sabin, T. P., and Müller, R.: Long range transport of South and East Asian anthropogenic aerosols counteracting Arctic warming, npj Climate and Atmospheric Science, 7, https://doi.org/10.1038/s41612-024-00633-1, 2024. a
Feng, Y., Bie, P., Wang, Z., Wang, L., and Zhang, J.: Bottom-up anthropogenic dichloromethane emission estimates from China for the period 2005–2016 and predictions of future emissions, Atmos. Environ., 186, 241–247, https://doi.org/10.1016/j.atmosenv.2018.05.039, 2018. a, b
Garny, H. and Randel, W. J.: Dynamic variability of the Asian monsoon anticyclone observed in potential vorticity and correlations with tracer distributions, J. Geophys. Res., 118, 13421–13433, https://doi.org/10.1002/2013JD020908, 2013. a
Ge, X., Wexler, A. S., and Clegg, S. L.: Atmospheric amines – Part I. A review, Atmos. Environ., 45, 524–546, https://doi.org/10.1016/j.atmosenv.2010.10.012, 2011. a, b
Gettelman, A. and de Forster, P. M.: Definition and climatology of the tropical tropopause layer, J. Meteorol. Soc. Jpn., 80, 911–924, 2002. a
Gibb, S. W., Mantoura, R. F. C., and Liss, P. S.: Ocean-atmosphere exchange and atmospheric speciation of ammonia and methylamines in the region of the NW Arabian Sea, Global Biogeochem. Cy., 13, 161–178, https://doi.org/10.1029/98GB00743, 1999. a
Gottschaldt, K.-D., Schlager, H., Baumann, R., Bozem, H., Eyring, V., Hoor, P., Jöckel, P., Jurkat, T., Voigt, C., Zahn, A., and Ziereis, H.: Trace gas composition in the Asian summer monsoon anticyclone: a case study based on aircraft observations and model simulations, Atmos. Chem. Phys., 17, 6091–6111, https://doi.org/10.5194/acp-17-6091-2017, 2017. a
Graßl, S., Ritter, C., Tritscher, I., and Vogel, B.: Does the Asian summer monsoon play a role in the stratospheric aerosol budget of the Arctic?, Atmos. Chem. Phys., 24, 7535–7557, https://doi.org/10.5194/acp-24-7535-2024, 2024. a
Hanumanthu, S., Vogel, B., Müller, R., Brunamonti, S., Fadnavis, S., Li, D., Ölsner, P., Naja, M., Singh, B. B., Kumar, K. R., Sonbawne, S., Jauhiainen, H., Vömel, H., Luo, B., Jorge, T., Wienhold, F. G., Dirkson, R., and Peter, T.: Strong day-to-day variability of the Asian Tropopause Aerosol Layer (ATAL) in August 2016 at the Himalayan foothills, Atmos. Chem. Phys., 20, 14273–14302, https://doi.org/10.5194/acp-20-14273-2020, 2020. a, b
Healy, R. M., Evans, G. J., Murphy, M., Sierau, B., Arndt, J., McGillicuddy, E., O'Connor, I. P., Sodeau, J. R., and Wenger, J. C.: Single-particle speciation of alkylamines in ambient aerosol at five European sites, Anal. Bioanal. Chem., 407, 1618–2650, https://doi.org/10.1007/s00216-014-8092-1, 2015. a
Hegglin, M. I. and Shepherd, T. G.: O3-N2O correlations from the Atmospheric Chemistry Experiment: Revisiting a diagnostic of transport and chemistry in the stratosphere, J. Geophys. Res., 112, D19301, https://doi.org/10.1029/2006JD008281, 2007. a, b
Hersbach, H., Bell, B., Berrisford, P., Hirahara, S., Horànyi, A., Muñoz Sabater, J., Nicolas, J., Peubey, C., Radu, R., Schepers, D., Simmons, A., Soci, C., Abdalla, S., Abellan, X., Balsamo, G., Bechtold, P., Biavati, G., Bidlot, J., Bonavita, M., De Chiara, G., Dahlgren, P., Dee, D., Diamantakis, M., Dragani, R., Flemming, J., Forbes, R., Fuentes, M., Geer, A., Haimberger, L., Healy, S., Hogan, R. J., Hólm, E., Janiskovà, M., Keeley, S., Laloyaux, P., Lopez, P., Lupu, C., Radnoti, G., de Rosnay, P., Rozum, I., Vamborg, F., Villaume, S., and Thépaut, J.-N.: The ERA5 global reanalysis, Q. J. Roy. Meteor. Soc., 146, 1999–2049, https://doi.org/10.1002/qj.3803, 2020. a
Hoffmann, L. and Spang, R.: An assessment of tropopause characteristics of the ERA5 and ERA-Interim meteorological reanalyses, Atmos. Chem. Phys., 22, 4019–4046, https://doi.org/10.5194/acp-22-4019-2022, 2022. a
Hoffmann, L., Günther, G., Li, D., Stein, O., Wu, X., Griessbach, S., Heng, Y., Konopka, P., Müller, R., Vogel, B., and Wright, J. S.: From ERA-Interim to ERA5: the considerable impact of ECMWF's next-generation reanalysis on Lagrangian transport simulations, Atmos. Chem. Phys., 19, 3097–3124, https://doi.org/10.5194/acp-19-3097-2019, 2019. a
Hoor, P., Fischer, H., Lange, L., Lelieveld, J., and Brunner, D.: Seasonal variations of a mixing layer in the lowermost stratosphere as identified by the CO-O3 correlation from in situ measurements, J. Geophys. Res., 107, 4044, https://doi.org/10.1029/2000JD000289, 2002. a
Höpfner, M., Ungermann, J., Borrmann, S., Wagner, R., Spang, R., Riese, M., Stiller, G., Appel, O., Batenburg, A. M., Bucci, S., Cairo, F., Dragoneas, A., Friedl-Vallon, F., Hünig, A., Johansson, S., Krasauskas, L., Legras, B., Leisner, T., Mahnke, C., Möhler, O., Molleker, S., Müller, R., Neubert, T., Orphal, J., Preusse, P., Rex, M., Saathoff, H., Stroh, F., Weigel, R., and Wohltmann, I.: Ammonium nitrate particles formed in upper troposphere from ground ammonia sources during Asian monsoons, Nat. Geosci., 12, 608–612, https://doi.org/10.1038/s41561-019-0385-8, 2019. a, b, c
Hossaini, R., Chipperfield, M. P., Montzka, S. A., Leeson, A. A., Dhomse, S. S., and Pyle, J. A.: The increasing threat to stratospheric ozone from dichloromethane, Nat. Commun., 8, 15962, https://doi.org/10.1038/ncomms15962, 2017. a
Hünig, A., Appel, O., Dragoneas, A., Molleker, S., Clemen, H.-C., Helleis, F., Klimach, T., Köllner, F., Böttger, T., Drewnick, F., Schneider, J., and Borrmann, S.: Design, characterization, and first field deployment of a novel aircraft-based aerosol mass spectrometer combining the laser ablation and flash vaporization techniques, Atmos. Meas. Tech., 15, 2889–2921, https://doi.org/10.5194/amt-15-2889-2022, 2022. a
Jesswein, M., Lauther, V., Emig, N., Hoor, P., Keber, T., Lachnitt, H.-C., Ort, L., Schuck, T., Strobel, J., Van Luijt, R., Volk, C. M., Weyland, F., and Engel, A.: Tracing elevated abundance of CH2Cl2 in the subarctic upper troposphere to the Asian Summer Monsoon, Atmos. Chem. Phys., 25, 8107–8126, https://doi.org/10.5194/acp-25-8107-2025, 2025. a, b, c
Kachula, O., Vogel, B., Günther, G., and Müller, R.: An optimization-based approach to track the Asian summer monsoon anticyclone across daily and interannual variability, Atmos. Chem. Phys., 25, 15171–15195, https://doi.org/10.5194/acp-25-15171-2025, 2025. a, b, c
Knutson, T., Camargo, S. J., Chan, J. C. L., Emanuel, K., Ho, C.-H., Kossin, J., Mohapatra, M., Satoh, M., Sugi, M., Walsh, K., and Wu, L.: Tropical Cyclones and Climate Change Assessment: Part II: Projected Response to Anthropogenic Warming, B. Am. Meteorol. Soc., 101, E303–E322, https://doi.org/10.1175/BAMS-D-18-0194.1, 2020. a
Köllner, F., Schneider, J., Willis, M. D., Klimach, T., Helleis, F., Bozem, H., Kunkel, D., Hoor, P., Burkart, J., Leaitch, W. R., Aliabadi, A. A., Abbatt, J. P. D., Herber, A. B., and Borrmann, S.: Particulate trimethylamine in the summertime Canadian high Arctic lower troposphere, Atmos. Chem. Phys., 17, 13747–13766, https://doi.org/10.5194/acp-17-13747-2017, 2017. a
Köllner, F., Kohl, M., Ekinci, F., Eppers, O., Schneider, J., Dragoneas, A., M., S., Johansson, S., Ungermann, J., Kretschmer, E., Höpfner, M., Lauther, V., Volk, C. M., Appel, O., Brauner, P., Kunkel, D., Lachnitt, H.-C., Bozem, H., Weyland, F., Emig, N., Ort, L., Zahn, A., Tomsche, L., Pozzer, A., Lelieveld, J., Cheng, Y., Riese, M., Hoor, P., and Borrmann: Aerosol from the Asian monsoon ubiquitous throughout the extratropical stratosphere, Commun. Earth Eniron., https://doi.org/10.31223/X5RB46, under review, EarthArXiv [preprint], 2026. a, b
Konopka, P., Günther, G., Müller, R., dos Santos, F. H. S., Schiller, C., Ravegnani, F., Ulanovsky, A., Schlager, H., Volk, C. M., Viciani, S., Pan, L. L., McKenna, D.-S., and Riese, M.: Contribution of mixing to upward transport across the tropical tropopause layer (TTL), Atmos. Chem. Phys., 7, 3285–3308, https://doi.org/10.5194/acp-7-3285-2007, 2007. a
Konopka, P., Tao, M., Ploeger, F., Diallo, M., and Riese, M.: Tropospheric mixing and parametrization of unresolved convective updrafts as implemented in the Chemical Lagrangian Model of the Stratosphere (CLaMS v2.0), Geosci. Model Dev., 12, 2441–2462, https://doi.org/10.5194/gmd-12-2441-2019, 2019. a
Konopka, P., Tao, M., von Hobe, M., Hoffmann, L., Kloss, C., Ravegnani, F., Volk, C. M., Lauther, V., Zahn, A., Hoor, P., and Ploeger, F.: Tropospheric transport and unresolved convection: numerical experiments with CLaMS 2.0/MESSy, Geosci. Model Dev., 15, 7471–7487, https://doi.org/10.5194/gmd-15-7471-2022, 2022. a
Krämer, M., Rolf, C., Luebke, A., Afchine, A., Spelten, N., Costa, A., Meyer, J., Zöger, M., Smith, J., Herman, R. L., Buchholz, B., Ebert, V., Baumgardner, D., Borrmann, S., Klingebiel, M., and Avallone, L.: A microphysics guide to cirrus clouds – Part 1: Cirrus types, Atmos. Chem. Phys., 16, 3463–3483, https://doi.org/10.5194/acp-16-3463-2016, 2016. a
Kunkel, D., Hoor, P., Kaluza, T., Ungermann, J., Kluschat, B., Giez, A., Lachnitt, H.-C., Kaufmann, M., and Riese, M.: Evidence of small-scale quasi-isentropic mixing in ridges of extratropical baroclinic waves, Atmos. Chem. Phys., 19, 12607–12630, https://doi.org/10.5194/acp-19-12607-2019, 2019. a
Kunz, A., Sprenger, M., and Wernli, H.: Climatology of potential vorticity streamers and associated isentropic transport pathways across PV gradient barriers, J. Geophys. Res., 120, 3802–3821, https://doi.org/10.1002/2014JD022615, 2014JD022615, 2015. a, b
Laube, J. C., Schuck, T. J., Baartman, S., Chen, H., Geldenhuys, M., van Heuven, S., Keber, T., Popa, M. E., Tuffnell, E., Voet, F., Vogel, B., Wagenhäuser, T., Zanchetta, A., and Engel, A.: Vertical distribution of halogenated trace gases in the summer Arctic stratosphere based on two independent air sampling methods, Atmos. Meas. Tech., 18, 4087–4102, https://doi.org/10.5194/amt-18-4087-2025, 2025. a
Lauther, V., Vogel, B., Wintel, J., Rau, A., Hoor, P., Bense, V., Müller, R., and Volk, C. M.: In situ observations of CH2Cl2 and CHCl3 show efficient transport pathways for very short-lived species into the lower stratosphere via the Asian and the North American summer monsoon, Atmos. Chem. Phys., 22, 2049–2077, https://doi.org/10.5194/acp-22-2049-2022, 2022. a, b, c, d, e, f, g
Li, D., Vogel, B., Bian, J., Müller, R., Pan, L. L., Günther, G., Bai, Z., Li, Q., Zhang, J., Fan, Q., and Vömel, H.: Impact of typhoons on the composition of the upper troposphere within the Asian summer monsoon anticyclone: the SWOP campaign in Lhasa 2013, Atmos. Chem. Phys., 17, 4657–4672, https://doi.org/10.5194/acp-17-4657-2017, 2017. a, b, c, d, e
Li, D., Vogel, B., Müller, R., Bian, J., Günther, G., Li, Q., Zhang, J., Bai, Z., Vömel, H., and Riese, M.: High tropospheric ozone in Lhasa within the Asian summer monsoon anticyclone in 2013: influence of convective transport and stratospheric intrusions, Atmos. Chem. Phys., 18, 17979–17994, https://doi.org/10.5194/acp-18-17979-2018, 2018. a
Li, D., Vogel, B., Müller, R., Bian, J., Günther, G., Ploeger, F., Li, Q., Zhang, J., Bai, Z., Vömel, H., and Riese, M.: Dehydration and low ozone in the tropopause layer over the Asian monsoon caused by tropical cyclones: Lagrangian transport calculations using ERA-Interim and ERA5 reanalysis data, Atmos. Chem. Phys., 20, 4133–4152, https://doi.org/10.5194/acp-20-4133-2020, 2020. a, b, c, d, e, f
Li, D., Vogel, B., Müller, R., Bian, J., Günther, G., and Riese, M.: Tropical Cyclones Reduce Ozone in the Tropopause Region Over the Western Pacific: An Analysis of 18 Years Ozonesonde Profiles, Earths Future, 9, 1–9, https://doi.org/10.1029/2020EF001635, 2021. a, b
Li, D., Bian, J., Zhang, X., Vogel, B., Müller, R., and Gn̈ther, G.: Impact of typhoon Soudelor on ozone and water vapor in the Asian monsoon anticyclone western Pacific mode, Atmos. Sci. Lett., 24, e1147, https://doi.org/10.1002/asl.1147, 2023. a, b, c
Li, Q., Jiang, J. H., Wu, D. L., Read, W. G., Livesey, N. J., Waters, J. W., Zhang, Y., Wang, B., Filipiak, M. J., Davis, C. P., Turquety, S., Wu, S., Park, R. J., Yantosca, R. M., and Jacob, D. J.: Convective outflow of South Asian pollution: A global CTM simulation compared with EOS MLS observations, Geophys. Res. Lett., 32, L14826, https://doi.org/10.1029/2005GL022762, 2005. a
Malakar, P., Kesarkar, A., Bhate, J., Singh, V., and Deshamukhya, A.: Comparison of Reanalysis Data Sets to Comprehend the Evolution of Tropical Cyclones Over North Indian Ocean, Earth Space Sci., 7, e2019EA000978, https://doi.org/10.1029/2019EA000978, 2020. a
Mason, R. B. and Anderson, C. E.: The development and decay of the 100-mb. summertime anticyclone over southern Asia, Mon. Weather Rev., 91, 3–12, https://doi.org/10.1175/1520-0493(1963)091<0003:TDADOT>2.3.CO;2, 1963. a
Matsuura, T., Yumoto, M., and Iizuka, S.: A mechanism of interdecadal variability of tropical cyclone activity over the western North Pacific, Clim. Dynam., 21, 105–117, https://doi.org/10.1007/s00382-003-0327-3, 2003. a
McKenna, D. S., Grooß, J.-U., Günther, G., Konopka, P., Müller, R., Carver, G., and Sasano, Y.: A new Chemical Lagrangian Model of the Stratosphere (CLaMS): 2. Formulation of chemistry scheme and initialization, J. Geophys. Res., 107, 4256, https://doi.org/10.1029/2000JD000113, 2002a. a
McKenna, D. S., Konopka, P., Grooß, J.-U., Günther, G., Müller, R., Spang, R., Offermann, D., and Orsolini, Y.: A new Chemical Lagrangian Model of the Stratosphere (CLaMS): 1. Formulation of advection and mixing, J. Geophys. Res., 107, 4309, https://doi.org/10.1029/2000JD000114, 2002b. a
Mei, W. and Xie, S.-P.: Intensification of landfalling typhoons over the northwest Pacific since the late 1970s, Nat. Geosci., 9, 753–757, https://doi.org/10.1038/ngeo2792, 2016. a
Meyer, J., Rolf, C., Schiller, C., Rohs, S., Spelten, N., Afchine, A., Zöger, M., Sitnikov, N., Thornberry, T. D., Rollins, A. W., Bozóki, Z., Tátrai, D., Ebert, V., Kühnreich, B., Mackrodt, P., Möhler, O., Saathoff, H., Rosenlof, K. H., and Krämer, M.: Two decades of water vapor measurements with the FISH fluorescence hygrometer: a review, Atmos. Chem. Phys., 15, 8521–8538, https://doi.org/10.5194/acp-15-8521-2015, 2015. a
Müller, S., Hoor, P., Berkes, F., Bozem, H., Klingebiel, M., Reutter, P., Smit, H. G. J., Wendisch, M., Spichtinger, P., and Borrmann, S.: In situ detection of stratosphere–troposphere exchange of cirrus particles in the midlatitudes, Geophys. Res. Lett., 42, 949–955, https://doi.org/10.1002/2014GL062556, 2015. a
Müller, S., Hoor, P., Bozem, H., Gute, E., Vogel, B., Zahn, A., Bönisch, H., Keber, T., Krämer, M., Rolf, C., Riese, M., Schlager, H., and Engel, A.: Impact of the Asian monsoon on the extratropical lower stratosphere: trace gas observations during TACTS over Europe 2012, Atmos. Chem. Phys., 16, 10573–10589, https://doi.org/10.5194/acp-16-10573-2016, 2016. a
Murphy, D. M. and Koop, T.: Review of the vapour pressures of ice and supercooled water for atmospheric applications, Q. J. Roy. Meteor. Soc., 131, 1539–1565, 2005. a
Pan, L. L., Bowman, K. P., Shapiro, M., Randal, W. J., Gao, R. S., Campos, T., Davis, C., Schauffler, S., Ridley, B. A., Wei, J. C., and Barnet, C.: Chemical behavior of the tropopause observed during the Stratosphere-Troposphere Analyses of Regional Transport experiment, J. Geophys. Res., 112, https://doi.org/10.1029/2007JD008645, 2007. a
Pan, L. L., Atlas, E. L., Honomichl, S. B., Smith, W. P., Kinnison, D. E., Solomon, S., Santee, M. L., Saiz-Lopez, A., Laube, J. C., Wang, B., Ueyama, R., Bresch, J. F., Hornbrook, R. S., Apel, E. C., Hills, A. J., Treadaway, V., Smith, K., Schauffler, S., Donnelly, S., Hendershot, R., Lueb, R., Campos, T., Viciani, S., D'Amato, F., Bianchini, G., Barucci, M., Podolske, J. R., Iraci, L. T., Gurganus, C., Bui, P., Dean-Day, J. M., Millán, L., Ryoo, J.-M., Barletta, B., Koo, J.-H., Kim, J., Liang, Q., Randel, W. J., Thornberry, T., and Newman, P. A.: East Asian summer monsoon delivers large abundances of very short-lived organic chlorine substances to the lower stratosphere, P. Natl. Acad. Sci. USA, 121, e2318716121, https://doi.org/10.1073/pnas.2318716121, 2024. a, b, c, d
Pan, L. L., Atlas, E. L., Newman, P. A., Thornberry, T., Jucks, K. W., Toon, O. B., Randel, W. J., Liang, Q., Kinnison, D. E., Ueyama, R., Bresch, J. F., Honomichl, S. B., Smith, W. P., Hornbrook, R. S., Ziemba, L., Fujiwara, M., Apel, E. C., Barucci, M., Bianchini, G., Brown, M., Bui, T. P., Campos, T., Chin, M., D'Amato, F., Dean-Day, J., Diskin, G., Franchin, A., Gurganus, C., Iraci, L. T., Kim, J., Koo, J.-H., Lait, L. R., Lesko, K., Podolske, J. R., Rollins, A., Sakai, T., Shiraishi, K., Treadaway, V., Viciani, S., and Waxman, E.: The Asian Summer Monsoon Chemical and Climate Impact Project (ACCLIP): An Overview, J. Geophys. Res.-Atmos., 130, e2025JD044417, https://doi.org/10.1029/2025JD044417, 2025. a, b
Pandit, A. K., Vernier, J.-P., Fairlie, T. D., Bedka, K. M., Avery, M. A., Gadhavi, H., Venkat Ratnam, M., Dwivedi, S., Amar Jyothi, K., Wienhold, F. G., Vömel, H., Liu, H., Zhang, B., Kumar, B. S., Dinh, T., and Jayaraman, A.: Investigating the role of typhoon-induced waves and stratospheric hydration in the formation of tropopause cirrus clouds observed during the 2017 Asian monsoon, Atmos. Chem. Phys., 24, 14209–14238, https://doi.org/10.5194/acp-24-14209-2024, 2024. a
Park, M., Randel, W. J., Kinnison, D. E., Garcia, R. R., and Choi, W.: Seasonal variation of methane, water vapor, and nitrogen oxides near the tropopause: Satellite observations and model simulations, J. Geophys. Res., 109, D03302, https://doi.org/10.1029/2003JD003706, 2004. a
Park, M., Randel, W. J., Gettleman, A., Massie, S. T., and Jiang, J. H.: Transport above the Asian summer monsoon anticyclone inferred from Aura Microwave Limb Sounder tracers, J. Geophys. Res., 112, D16309, https://doi.org/10.1029/2006JD008294, 2007. a, b
Ploeger, F., Günther, G., Konopka, P., Fueglistaler, S., Müller, R., Hoppe, C., Kunz, A., Spang, R., Grooß, J.-U., and Riese, M.: Horizontal water vapor transport in the lower stratosphere from subtropics to high latitudes during boreal summer, J. Geophys. Res., 118, 8111–8127, https://doi.org/10.1002/jgrd.50636, 2013. a, b
Ploeger, F., Riese, M., Haenel, F., Konopka, P., Müller, R., and Stiller, G.: Variability of stratospheric mean age of air and of the local effects of residual circulation and eddy mixing, J. Geophys. Res., 120, 716–733, https://doi.org/10.1002/2014JD022468, 2015. a
Ploeger, F., Konopka, P., Walker, K., and Riese, M.: Quantifying pollution transport from the Asian monsoon anticyclone into the lower stratosphere, Atmos. Chem. Phys., 17, 7055–7066, https://doi.org/10.5194/acp-17-7055-2017, 2017. a
Ploeger, F., Diallo, M., Charlesworth, E., Konopka, P., Legras, B., Laube, J. C., Grooß, J.-U., Günther, G., Engel, A., and Riese, M.: The stratospheric Brewer–Dobson circulation inferred from age of air in the ERA5 reanalysis, Atmos. Chem. Phys., 21, 8393–8412, https://doi.org/10.5194/acp-21-8393-2021, 2021. a, b, c
Ploeger, F., Birner, T., Charlesworth, E., Konopka, P., and Müller, R.: Moist bias in the Pacific upper troposphere and lower stratosphere (UTLS) in climate models affects regional circulation patterns, Atmos. Chem. Phys., 24, 2033–2043, https://doi.org/10.5194/acp-24-2033-2024, 2024. a
Pommrich, R., Müller, R., Grooß, J.-U., Konopka, P., Ploeger, F., Vogel, B., Tao, M., Hoppe, C. M., Günther, G., Spelten, N., Hoffmann, L., Pumphrey, H.-C., Viciani, S., D'Amato, F., Volk, C. M., Hoor, P., Schlager, H., and Riese, M.: Tropical troposphere to stratosphere transport of carbon monoxide and long-lived trace species in the Chemical Lagrangian Model of the Stratosphere (CLaMS), Geosci. Model Dev., 7, 2895–2916, https://doi.org/10.5194/gmd-7-2895-2014, 2014. a, b, c, d
Randel, W. J. and Park, M.: Deep convective influence on the Asian summer monsoon anticyclone and associated tracer variability observed with Atmospheric Infrared Sounder (AIRS), J. Geophys. Res., 111, D12314, https://doi.org/10.1029/2005JD006490, 2006. a
Rehbein, P. J. G., Jeong, C.-H., McGuire, M. L., Yao, X., Corbin, J. C., and Evans, G. J.: Cloud and Fog Processing Enhanced Gas-to-Particle Partitioning of Trimethylamine, Environ. Sci. Technol., 45, 4346–4352, https://doi.org/10.1021/es1042113, 2011. a
Riese, M., Ploeger, F., Rap, A., Vogel, B., Konopka, P., Dameris, M., and Forster, P.: Impact of uncertainties in atmospheric mixing on simulated UTLS composition and related radiative effects, J. Geophys. Res., 117, D16305, https://doi.org/10.1029/2012JD017751, 2012. a
Riese, M., Hoor, P., Rolf, C., Kunkel, D., Vogel, B., Köllner, F., Pöhlker, M., Ploeger, F., Ungermann, J., Woiwode, W., Johansson, S., Bauer, R., Barmpounis, K., Borrmann, S., Brauner, P., Clemens, J., Dragoneas, A., Ekinci, F., Emig, N., Engel, A., Eppers, O., Fadnavis, S., Friedl-Vallon, F., Geldenhuys, M., Günther, G., Grooß, J.-U., Hegglin, M. I., Hoepfner, M., Jesswein, M., Joppe, P., Kaumanns, J., Kachula, O., Keber, T., Kretschmer, E., Lachnitt, H.-C., Lauther, V., Lloyd, P. E., Molleker, S., Müller, R., Neubert, T., Ort, L., Pöschl, U., Pöhlker, C., Rapp, M., Retzlaff, M., Rhode, S., Schneider, J., Schuck, T., Sinnhuber, B.-M., Spelten, N., Strobel, J., Tomsche, L., Turhal, K., van Luijt, R., Versick, S., Voigt, C., Volk, M., von Hobe, M., Weyland, F., Zahn, A., Ziereis, H., and Zlotos, L.: Long-range transport of polluted Asian summer monsoon air to high latitudes during the PHILEAS campaign in the boreal summer 2023, B. Am. Meteorol. Soc., https://doi.org/10.1175/BAMS-D-24-0232.1, preprint, Online Publication: 8 July 2025, 2025. a, b, c, d, e, f, g
Rolf, C., Vogel, B., Hoor, P., Afchine, A., Günther, G., Krämer, M., Müller, R., Müller, S., Spelten, N., and Riese, M.: Water vapor increase in the lower stratosphere of the Northern Hemisphere due to the Asian monsoon anticyclone observed during the TACTS/ESMVal campaigns, Atmos. Chem. Phys., 18, 2973–2983, https://doi.org/10.5194/acp-18-2973-2018, 2018. a, b, c, d, e, f
Rosenlof, K. H., Tuck, A. F., Kelly, K. K., Russell III, J. M., and McCormick, M. P.: Hemispheric asymmetries in the water vapor and inferences about transport in the lower stratosphere, J. Geophys. Res., 102, 13213–13234, https://doi.org/10.1029/97JD00873, 1997. a, b
Rotermund, M. K., Bense, V., Chipperfield, M. P., Engel, A., Grooß, J.-U., Hoor, P., Hüneke, T., Keber, T., Kluge, F., Schreiner, B., Schuck, T., Vogel, B., Zahn, A., and Pfeilsticker, K.: Organic and inorganic bromine measurements around the extratropical tropopause and lowermost stratosphere: insights into the transport pathways and total bromine, Atmos. Chem. Phys., 21, 15375–15407, https://doi.org/10.5194/acp-21-15375-2021, 2021. a
Santee, M. L., Manney, G. L., Livesey, N. J., Schwartz, M. J., Neu, J. L., and Read, W. G.: A comprehensive overview of the climatological composition of the Asian summer monsoon anticyclone based on 10 years of Aura Microwave Limb Sounder measurements, J. Geophys. Res., 122, 5491–5514, https://doi.org/10.1002/2016JD026408, 2017. a
Say, D., Ganesan, A. L., Lunt, M. F., Rigby, M., O'Doherty, S., Harth, C., Manning, A. J., Krummel, P. B., and Bauguitte, S.: Emissions of halocarbons from India inferred through atmospheric measurements, Atmos. Chem. Phys., 19, 9865–9885, https://doi.org/10.5194/acp-19-9865-2019, 2019. a
Schoeberl, M. R., Jensen, E. J., Pfister, L., Ueyama, R., Avery, M., and Dessler, A. E.: Convective Hydration of the Upper Troposphere and Lower Stratosphere, J. Geophys. Res., 123, 4583–4593, https://doi.org/10.1029/2018JD028286, 2018. a
Schuck, T. J., Brenninkmeijer, C. A. M., Baker, A. K., Slemr, F., von Velthoven, P. F. J., and Zahn, A.: Greenhouse gas relationships in the Indian summer monsoon plume measured by the CARIBIC passenger aircraft, Atmos. Chem. Phys., 10, 3965–3984, https://doi.org/10.5194/acp-10-3965-2010, 2010. a
Sinnhuber, B.-M. and Meul, S.: Simulating the impact of emissions of brominated very short lived substances on past stratospheric ozone trends, Geophys. Res. Lett., 42, 2449–2456, https://doi.org/10.1002/2014GL062975, 2015. a
Siu, L. W. and Bowman, K. P.: Unsteady Vortex Behavior in the Asian Monsoon Anticyclone, J. Atmos. Sci., 77, 4067–4088, https://doi.org/10.1175/JAS-D-19-0349.1, 2020. a
Smith, W. P., Pan, L. L., Ueyama, R., Honomichl, S., Campos, T., Viciani, S., D'Amato, F., Bianchini, G., Barruci, M., Hornbrook, R. S., Apel, E. C., Hills, A. J., Barletta, B., Atlas, E., Schauffler, S., Treadaway, V., Smith, K., Lueb, R., Hendershot, R., Donnelly, S., Rollins, A., Waxman, E., Novak, G., Huey, L. G., Tanner, D., Lee, Y. R., Bekemeier, C., and Bowman, K. P.: Transport by Asian Summer Monsoon Convection to the Upper Troposphere and Lower Stratosphere During ACCLIP (2022), J. Geophys. Res., 130, e2024JD042732, https://doi.org/10.1029/2024JD042732, 2025. a, b
Tao, M., Cai, Z., Zhu, S., Liu, Y., Feng, L., Fang, S., Yi, Y., and Bian, J.: New evidence for CH4 enhancement in the upper troposphere associated with the Asian summer monsoon, Environ. Res. Lett., 19, 034033, https://doi.org/10.1088/1748-9326/ad2738, 2024. a, b
Ueyama, R., Schoeberl, M., Jensen, E., Pfister, L., Park, M., and Ryoo, J.-M.: Convective Impact on the Global Lower Stratospheric Water Vapor Budget, J. Geophys. Res., 128, e2022JD037135, https://doi.org/10.1029/2022JD037135, 2023. a
Ungermann, J., Ern, M., Kaufmann, M., Müller, R., Spang, R., Ploeger, F., Vogel, B., and Riese, M.: Observations of PAN and its confinement in the Asian summer monsoon anticyclone in high spatial resolution, Atmos. Chem. Phys., 16, 8389–8403, https://doi.org/10.5194/acp-16-8389-2016, 2016. a
Vernier, J. P., Fairlie, T. D., Natarajan, M., Wienhold, F. G., Bian, J., Martinsson, B. G., Crumeyrolle, S., Thomason, L. W., and Bedka, K. M.: Increase in upper tropospheric and lower stratospheric aerosol levels and its potential connection with Asian pollution, J. Geophys. Res., 120, 1608–1619, https://doi.org/10.1002/2014JD022372, 2015. a
Vernier, J.-P., Fairlie, T. D., Deshler, T., Ratnam, M. V., Gadhavi, H., Kumar, B. S., Natarajan, M., Pandit, A. K., Raj, S. T. A., Kumar, A. H., Jayaraman, A., Singh, A. K., Rastogi, N., Sinha, P. R., Kumar, S., Tiwari, S., Wegner, T., Baker, N., Vignelles, D., Stenchikov, G., Shevchenko, I., Smith, J., Bedka, K., Kesarkar, A., Singh, V., Bhate, J., Ravikiran, V., Rao, M. D., Ravindrababu, S., Patel, A., Vernier, H., Wienhold, F. G., Liu, H., Knepp, T. N., Thomason, L., Crawford, J., Ziemba, L., Moore, J., Crumeyrolle, S., Williamson, M., Berthet, G., Jégou, F., and Renard, J.-B.: BATAL: The Balloon Measurement Campaigns of the Asian Tropopause Aerosol Layer, B. Am. Meteorol. Soc., 99, 955–973, https://doi.org/10.1175/BAMS-D-17-0014.1, 2018. a
Vogel, B., Pan, L. L., Konopka, P., Günther, G., Müller, R., Hall, W., Campos, T., Pollack, I., Weinheimer, A., Wei, J., Atlas, E. L., and Bowman, K. P.: Transport pathways and signatures of mixing in the extratropical tropopause region derived from Lagrangian model simulations, J. Geophys. Res., 116, D05306, https://doi.org/10.1029/2010JD014876, 2011. a
Vogel, B., Günther, G., Müller, R., Grooß, J.-U., Hoor, P., Krämer, M., Müller, S., Zahn, A., and Riese, M.: Fast transport from Southeast Asia boundary layer sources to northern Europe: rapid uplift in typhoons and eastward eddy shedding of the Asian monsoon anticyclone, Atmos. Chem. Phys., 14, 12745–12762, https://doi.org/10.5194/acp-14-12745-2014, 2014. a, b, c, d, e
Vogel, B., Günther, G., Müller, R., Grooß, J.-U., and Riese, M.: Impact of different Asian source regions on the composition of the Asian monsoon anticyclone and of the extratropical lowermost stratosphere, Atmos. Chem. Phys., 15, 13699–13716, https://doi.org/10.5194/acp-15-13699-2015, 2015. a, b, c
Vogel, B., Günther, G., Müller, R., Grooß, J.-U., Afchine, A., Bozem, H., Hoor, P., Krämer, M., Müller, S., Riese, M., Rolf, C., Spelten, N., Stiller, G. P., Ungermann, J., and Zahn, A.: Long-range transport pathways of tropospheric source gases originating in Asia into the northern lower stratosphere during the Asian monsoon season 2012, Atmos. Chem. Phys., 16, 15301–15325, https://doi.org/10.5194/acp-16-15301-2016, 2016. a, b, c, d, e, f
Vogel, B., Müller, R., Günther, G., Spang, R., Hanumanthu, S., Li, D., Riese, M., and Stiller, G. P.: Lagrangian simulations of the transport of young air masses to the top of the Asian monsoon anticyclone and into the tropical pipe, Atmos. Chem. Phys., 19, 6007–6034, https://doi.org/10.5194/acp-19-6007-2019, 2019. a, b, c, d, e
Vogel, B., Volk, C. M., Wintel, J., Lauther, V., Müller, R., Patra, P. K., Riese, M., Terao, Y., and Stroh, F.: Reconstructing high-resolution in-situ vertical carbon dioxide profiles in the sparsely monitored Asian monsoon region, Commun. Earth Environ., 4, https://doi.org/10.1038/s43247-023-00725-5, 2023. a, b, c, d, e
Vogel, B., Volk, C. M., Wintel, J., Lauther, V., Clemens, J., Grooß, J.-U., Günther, G., Hoffmann, L., Laube, J. C., Müller, R., Ploeger, F., and Stroh, F.: Evaluation of vertical transport in ERA5 and ERA-Interim reanalysis using high-altitude aircraft measurements in the Asian summer monsoon 2017, Atmos. Chem. Phys., 24, 317–343, https://doi.org/10.5194/acp-24-317-2024, 2024. a, b, c, d, e, f, g, h
Wang, B. and LinHo: Rainy Season of the Asian–Pacific Summer Monsoon, J. Climate, 15, 386–398, https://doi.org/10.1175/1520-0442(2002)015<0386:RSOTAP>2.0.CO;2, 2002. a
Wetzel, G., Friedl-Vallon, F., Glatthor, N., Grooß, J.-U., Gulde, T., Höpfner, M., Johansson, S., Khosrawi, F., Kirner, O., Kleinert, A., Kretschmer, E., Maucher, G., Nordmeyer, H., Oelhaf, H., Orphal, J., Piesch, C., Sinnhuber, B.-M., Ungermann, J., and Vogel, B.: Pollution trace gases C2H6, C2H2, HCOOH, and PAN in the North Atlantic UTLS: observations and simulations, Atmos. Chem. Phys., 21, 8213–8232, https://doi.org/10.5194/acp-21-8213-2021, 2021. a, b
Willis, M. D., Köllner, F., Burkart, J., Bozem, H., Thomas, J. L., Schneider, J., Aliabadi, A. A., Hoor, P. M., Schulz, H., Herber, A. B., Leaitch, W. R., and Abbatt, J. P. D.: Evidence for marine biogenic influence on summertime Arctic aerosol, Geophys. Res. Lett., 44, 6460–6470, https://doi.org/10.1002/2017GL073359, 2017. a
Yang, Z., Vogel, B., Plöger, F., Bai, Z., Li, D., Griessbach, S., Hoffmann, L., Wienhold, F. G., Asher, E., Baron, A. A., Smith, K. R., Thornberry, T., Bian, J., and Hegglin, M. I.: Transport of volcanic aerosol from the Raikoke eruption in 2019 through the Northern Hemisphere, Atmos. Chem. Phys., 26, 4749–4769, https://doi.org/10.5194/acp-26-4749-2026, 2026. a
Zahn, A., Weppner, J., Widmann, H., Schlote-Holubek, K., Burger, B., Kühner, T., and Franke, H.: A fast and precise chemiluminescence ozone detector for eddy flux and airborne application, Atmos. Meas. Tech., 5, 363–375, https://doi.org/10.5194/amt-5-363-2012, 2012. a
Zhu, S., Tao, M., Cai, Z., Liu, Y., Feng, L., Sangmu, P., Yu, Z., and Cao, J.: Significant response of methane in the upper troposphere to subseasonal variability in the Asian monsoon anticyclone, Atmos. Chem. Phys., 25, 9843–9857, https://doi.org/10.5194/acp-25-9843-2025, 2025. a
Zöger, M., Schiller, C., and Eicke, N.: Fast in situ hygrometers: A new family of balloonborne and airborne Lyman-α photofragment fluorescence hygrometers, J. Geophys. Res., 104, 1807–1816, 1999. a
- Abstract
- Introduction
- Measurements during PHILEAS 2023
- Lagrangian transport simulations
- Results
- Conclusions
- Appendix A: Additional tracer-tracer relations
- Appendix B: Bipolar mean spectrum of the TMA-containing particle type
- Appendix C: Temporal evolution of the South Asia and Western Pacific tracer
- Code and data availability
- Author contributions
- Competing interests
- Disclaimer
- Acknowledgements
- Financial support
- Review statement
- References