the Creative Commons Attribution 4.0 License.
the Creative Commons Attribution 4.0 License.
 | 11 May 2026
Fine and coarse dust radiative impact during an intense Saharan dust outbreak over the Iberian Peninsula – long-wave and net direct radiative effect
María Ángeles López-Cayuela
Carmen Córdoba-Jabonero
Michaël Sicard
Jesús Abril-Gago
Vanda Salgueiro
Adolfo Comerón
María José Granados-Muñoz
Maria João Costa
Constantino Muñoz-Porcar
Juan Antonio Bravo-Aranda
Daniele Bortoli
Alejandro Rodríguez-Gómez
Lucas Alados-Arboledas
Juan Luis Guerrero-Rascado
The dust direct radiative effect (DRE) in the long-wave (LW) (DRELW), and the net effect (DRENET), is analysed during an intense and long-lasting Saharan dust intrusion over the Iberian Peninsula, complementing the study on the short-wave (SW) DRE (DRESW) (López-Cayuela et al., 2025). In LW, a warming effect at both the bottom-of-atmosphere (BOA) and the top-of-atmosphere (TOA) levels is induced by the fine (Df) and coarse (Dc) dust particles, while Dc being dominant. The DRELW-to-DRESW ratio for Df ranged 4 %–8 % at BOA (1 %–4 % at TOA), and for Dc it was rather higher (39 %–54 % at BOA and 20 %–50 % at TOA). DRENET was consistently negative (net cooling) at both levels, and the derived atmospheric DRENET was positive (net warming). The Df contribution to DRENET was 12 % (LW) and 30 % (SW). The SW aerosol heating rate (AHR) peaked at higher altitudes, inducing warming within the dust layer, than LW AHR (weaker cooling). Consequently, a net warming inside the dust layer was found, with potential cooling below and above. While SW dominates the net atmospheric warming, LW cooling partially mitigates it. As a novelty of this study, two methodologies for estimating DRE in both LW and net spectral ranges are compared. Differences in DRE between a classical approach considering total dust and an approach separating fine and coarse modes are analysed. DRELW (and DRENET) is underestimated (overestimated) by using the dust-mode separation approach in comparison to the classical one (no separation) when fine radii are lesser (greater) than a particular threshold (e.g. 0.1 µm), revealing the particle size impact in DRELW. The dust-induced net effect is primarily driven by SW and modulated by LW. The classical (no separation) approach overestimates DRENET, with mean (standard deviation) relative differences of −5 % (7 %) at BOA and −9 % (13 %) at TOA. Moreover, under moderate-to-high dust, separating Df and Dc contributions yields a weaker (stronger) net cooling at BOA (TOA).
- Article
(3100 KB) - Full-text XML
- Companion paper 1
- Companion paper 2
-
Supplement
(2349 KB) - BibTeX
- EndNote


The latest report about airborne dust from the World Meteorological Organization (WMO Bulletin, 2023) reveals that the global surface dust concentration has seen a slight increase in 2022 compared to 2021. This is attributed to increased emissions from several dust-active sources, such as West-Central Africa. Among the most affected regions, receiving a dust influx much greater than the climatological mean, the Iberian Peninsula is prominently featured. Particularly, the anomaly of the annual mean surface dust concentration in 2022 (relative to the 1981–2010 mean) shows increased values of 5–20 µg m−3. Those results agree with several different studies indicating that since the pre-industrial Era there has been a 46 % increase in the mass of dust lifted into the atmosphere in these North African regions (Kok et al., 2023). Notably, there is not only a rising frequency of Saharan dust episodes in the Iberian Peninsula compared to long-term historical data (Sousa et al.,2019), but also an increasing number of reports on extreme and highly intense episodes (e.g. Guerrero-Rascado et al., 2008, 2009; Preißler et al., 2011; Cazorla et al., 2017; Córdoba-Jabonero et al., 2019; Fernández et al., 2019; López-Cayuela et al., 2023; Papanikolaou et al., 2024). Those results gain significance since desert dust aerosols affect Earth's energy balance. Thus, variations in the atmospheric dust loading may induce substantial changes in the radiative forcing of the climate system (Mahowald et al., 2010).
The aerosol radiative effect in the short-wave (SW) spectral range related to desert dust intrusions over the Iberian Peninsula has been widely investigated during the last years (e.g. Cachorro et al., 2008; Obregón et al., 2015; Sicard et al., 2016; Valenzuela et al., 2017; Granados-Muñoz et al., 2019; Córdoba-Jabonero et al., 2021a; Bazo et al., 2023, López-Cayuela et al., 2025). However, part of the literature often overlooked the aerosol radiative effects on the long-wave (LW) spectral range. This omission was primarily attributed to the intricate challenges associated with precisely quantifying the optical characteristics within this spectral domain (Roger et al., 2006; Mallet et al., 2008; Sicard et al., 2012). Moreover, the radiative forcing attributed to most aerosol categories (in particular, fine particles like pollution and smoke), is generally less pronounced in the LW range compared to their effects in the SW range. However, an exception arises with large and light-scattering particles (like mineral dust), which have been shown to possess a significant radiative forcing effect in the LW domain (e.g. Fouquart et al., 1987; di Sarra et al., 2011; Sicard et al., 2014a, 2022), highlighting again its climatic importance.
Recent research has demonstrated that separating the dust population into fine and coarse modes provides a useful framework to analyse size-dependent radiative effects. Sicard et al. (2014b) found that a clear distinction between dust modes is suitable for the reliable estimation of LW radiative forcing, particularly in the presence of large particles, which are common during mineral dust outbreaks, and mostly with intense dust incidence. This requirement is further supported by Adebiyi and Kok (2020), who discovered that the atmosphere burden of coarse dust is approximately four times larger than that simulated by current climate models. Consequently, an inadequate representation of coarse particles can lead to substantial errors in modelled dust–climate interactions. The findings also highlight the contrasting radiative effects associated with the two size modes, with coarse dust inducing a net warming at the top of the atmosphere (TOA) and fine dust contributing to cooling it, indicating their fundamentally different roles in the Earth's radiative budget. In addition, Kok et al. (2017) demonstrated that the dust direct radiative forcing is highly sensitive to the atmospheric dust size distribution, with climate models systematically underestimating the coarse-mode dust while overestimating the fine-mode fraction. Their analytical framework highlights the importance of considering the size-resolved dust mass and distribution, given that key radiative properties of dust (such as single-scattering albedo, asymmetry parameter, and extinction efficiency) are strongly dependent on particle size. It should be highlighted that the two dust modes differ not only in abundance and lifetime but also in their optical characteristics and radiative impacts. Thus, separating the dust population into fine and coarse modes provides a useful framework to analyse size-dependent radiative effects.
The present paper focuses on the assessment of the direct radiative effect (DRE) of dust particles in the LW range as well as their net effect. The event in study is an exceptionally intense and long-lasting Saharan dust event that crossed the Iberian Peninsula from 25 March–7 April 2021. This event was well characterized in López-Cayuela et al. (2023), which analysed the vertical behaviour of the optical and microphysical dust properties using polarization-sensitive lidar measurements from five Iberian lidar stations, separating the dust into its fine (Df) and coarse (Dc) components following the methodology of Mamouri and Ansmann (2014, 2017). The DRE analysis in the SW range can be found in López-Cayuela et al. (2025).
Although several works investigated the LW radiative effects associated with desert dust outbreaks over the Mediterranean basin (e.g. di Sarra et al., 2011; Perrone et al., 2012; Antón et al., 2014; Bazo et al., 2023), only a few studies have addressed the separation of both Df and Dc components (e.g. Sicard et al., 2014b, 2022). Two main conclusions highlight from these studies: (i) the quasi-linearity of LW radiative forcing at the bottom-of-atmosphere (BOA) and TOA with the Aerosol Optical Depth (AOD), and (ii) the high dependency of LW radiative forcing on the coarse-mode dust. Thus, the aim of the present study is to investigate whether this quasi-linearity holds for high AOD values (>0.50), in addition to distinguish the contribution of Df and Dc components to the DRE in the LW range. Indeed, this study introduces the novelty of simulating the LW dust DRE using two different approaches, used in López-Cayuela et al. (2025) for the SW range: (i) by simulating the contribution of Df and Dc components separately, and then estimating the total dust DRE as their sum (as ), and (ii) directly simulating DRE for the total dust component as a whole.
From a radiative transfer perspective, the most rigorous way to estimate DRE would be to integrate the optical properties over the full particle size distribution. In this work, however, the separation between Df and Dc is not introduced as a radiative-transfer requirement but arises naturally from the observational framework used. The polarization lidar methodology allows the retrieval of vertically resolved extinction profiles separately for fine and coarse dust particles (Tesche et al., 2009; Mamouri and Ansmann, 2014, 2017), as stated before. Treating these two modes independently therefore provides a direct way to propagate the observationally constrained dust components into the radiative transfer calculations. In addition, separating the Df and Dc modes offers a useful diagnostic framework for interpreting the size-dependent radiative effects of mineral dust. Df tends to dominate SW scattering, while Dc plays a more important role in LW emission and absorption, leading to potentially different or even compensating contributions to the DRE. Analysing both modes separately therefore allows for a better understanding of how different parts of the size distribution contribute to the overall radiative impact. Finally, this separated-mode approach also enables a direct comparison considering the total dust as a whole. In this study, the DRE obtained by summing the contributions from Df and Dc particles is compared with the DRE computed using the total dust population, allowing for assessing the sensitivity of the radiative effect to the size-mode resolved representation of dust.
The paper is organized as follows. The radiative transfer model and the parametrizations used in terms of the LW range are described in Sect. 2. The results and discussion are shown in Sect. 3. Finally, the main conclusions of this study are found in Sect. 4.
2.1 Monitoring stations and lidar measurements
Lidar measurements were performed for vertical dust monitoring in five Iberian lidar stations: El Arenosillo/Huelva (ARN), Granada (GRA), Torrejón/Madrid (TRJ), and Barcelona (BCN) in Spain, and Évora (EVO) in Portugal. A more detailed description of those stations and lidar systems can be found in López-Cayuela et al. (2023). Briefly, polarized Micro-Pulse lidars operated at ARN, TRJ, and BCN sites. These single-wavelength elastic lidars (532 nm) operate continuously () with high pulse repetition frequency and low-energy laser emission, and include polarization capabilities (Campbell et al., 2002; Welton and Campbell, 2002; Flynn et al., 2007; Córdoba-Jabonero et al., 2018, 2021b; Welton et al., 2018). In addition, multi-wavelength Raman lidars were operative at EVO and GRA stations, which are part of EARLINET (European Aerosol Research Network; Pappalardo et al., 2014). These lidar systems use high-energy Nd:YAG lasers and provide elastic, Raman, and polarization-sensitive measurements at several wavelengths. In this work, only the common elastic 532 nm channel has been used. For the reader's convenience, information related to the location at the Iberian Peninsula and the period of the dust intrusion observed in each station can be found in Table S1 and Fig. S1 in the Supplement.
In order to obtain the Df and Dc contribution separately, the POLIPHON method (Polarisation Lidar photometer Networking method; Mamouri and Ansmann, 2014, 2017; Ansmann et al., 2019) was applied. In the first step of POLIPHON approach, background aerosols are separated from dust particles (Df+Dc). In the second step, Df and Dc are identified, and their specific backscatter coefficient profile is discriminated. The extinction coefficient (α532) for each component is then determined by considering the typical particle lidar ratio at 532 nm for each one (Ansmann et al., 2019). The uncertainties in the α532 calculation by using this method are 30 %–50 %, 20 %–30 %, and 15 %–25 % for Df, Dc, and DD () dust, respectively (Ansmann et al., 2019).
2.2 Radiative transfer model: GAME. The MIE and LW modules
The GAME (Global Atmospheric Model; Dubuisson et al., 1996, 2004) has been used in increasing studies because of its significant advantage, i.e. the ability to fully represent the aerosol scattering and absorption in the LW region. Moreover, the model's moderate spectral resolution accounts for the spectral variations in aerosol properties, particularly in the infrared window. An extended description of the LW module of GAME can be found in Sicard et al. (2014a).
GAME calculates spectrally integrated upward and downward radiative fluxes in 40 plane and homogeneous layers from 0–100 km. Regarding the spectral limits, GAME employs 200–2500 cm−1 (i.e. wavelength: 4.0–50.0 µm) with a fixed resolution of 20 cm−1 (115 points). Moreover, this radiative transfer model considers thermal emission, absorption and scattering as well as their interplay employing the discrete ordinates method (DISORT, Stamnes et al., 1988). In the framework of GAME, an explicit account is taken for the absorption of gases, including H2O, CO2, O3, N2O, CO, CH4, and N2, using the correlated k-distribution as proposed by Lacis and Oinas (1991). Detailed insights into the computation of gas transmission functions can be found in Dubuisson et al. (2004) and Sicard et al. (2014a). The parameterization of gas absorption is based on pressure, temperature, and relative humidity profiles. Notably, these profiles are sourced from the Global Data Assimilation System (GDAS), provided by the National Oceanic and Atmospheric Administration (NOAA, last access: 28 March 2025).
The land surface temperature (LST) is a variable needed in the LW module. In this work, LST is provided by the Copernicus Land Service (https://land.copernicus.eu/global/products/lst, last access: 28 March 2025). Particularly, the hourly LST V2 dataset is used, which has uncertainties of less than 0.5 %. Moreover, the Earth's surface is assumed Lambertian, with a constant surface albedo of 0.017 in the LW spectral range. This value was determined by Sicard et al. (2014a) in Barcelona, based on the Clouds and Earth's Radiant Energy System (CERES) measurements in the spectral range of 8.1–11.8 µm, and averaged over the spring and summer seasons during five years. This same value is used at the five stations of this study, in the basis of the work of Zhou et al. (2013), which showed that the LW surface albedo remains relatively stable across the European continent.
Information on the aerosol shape, refractive index, size distribution, and density is required for an accurate calculation of their radiative properties. Yang et al. (2007) demonstrated that the non-sphericity effect of dust particles is negligible at thermal infrared wavelengths. Therefore, it is reasonable to assume that mineral dust is “spherical” in the LW range, and, hence, a Mie code can be applied for analysis. The spectral refractive index (both real and imaginary components) is identical to that reported in Sicard et al. (2014a) and was derived from measurements of long-range transported mineral dust collected in western Germany (Volz, 1983). The data that present the refractive index as a function of wavelength was obtained from Krekov (1993). The spectral variation of both the real and imaginary parts of the refractive index is illustrated in Fig. 1 of Sicard et al. (2014a). It should be highlighted that the refractive index used in the simulations (Volz, 1983), although assumed no varying, could be a source of uncertainty. Di Biagio et al. (2014, 2017) investigated the variability of the refractive index of mineral dust in LW as a function of its mineralogical composition and size distribution using in situ measurements. That study suggested that while a constant real refractive index can be probably assumed for dust from different sources, a varying complex refractive index should be used both at global and regional scale. They reported that for Saharan dust sampled at various sites, the real refractive index ranged from 1.3–2.0, and the complex refractive index ranged from 0.3–0.9 at a wavelength of 10 µm. The refractive index reported by Volz (1983), which has been used in the GAME simulations, is within those intervals of values for both the real and complex refractive index.
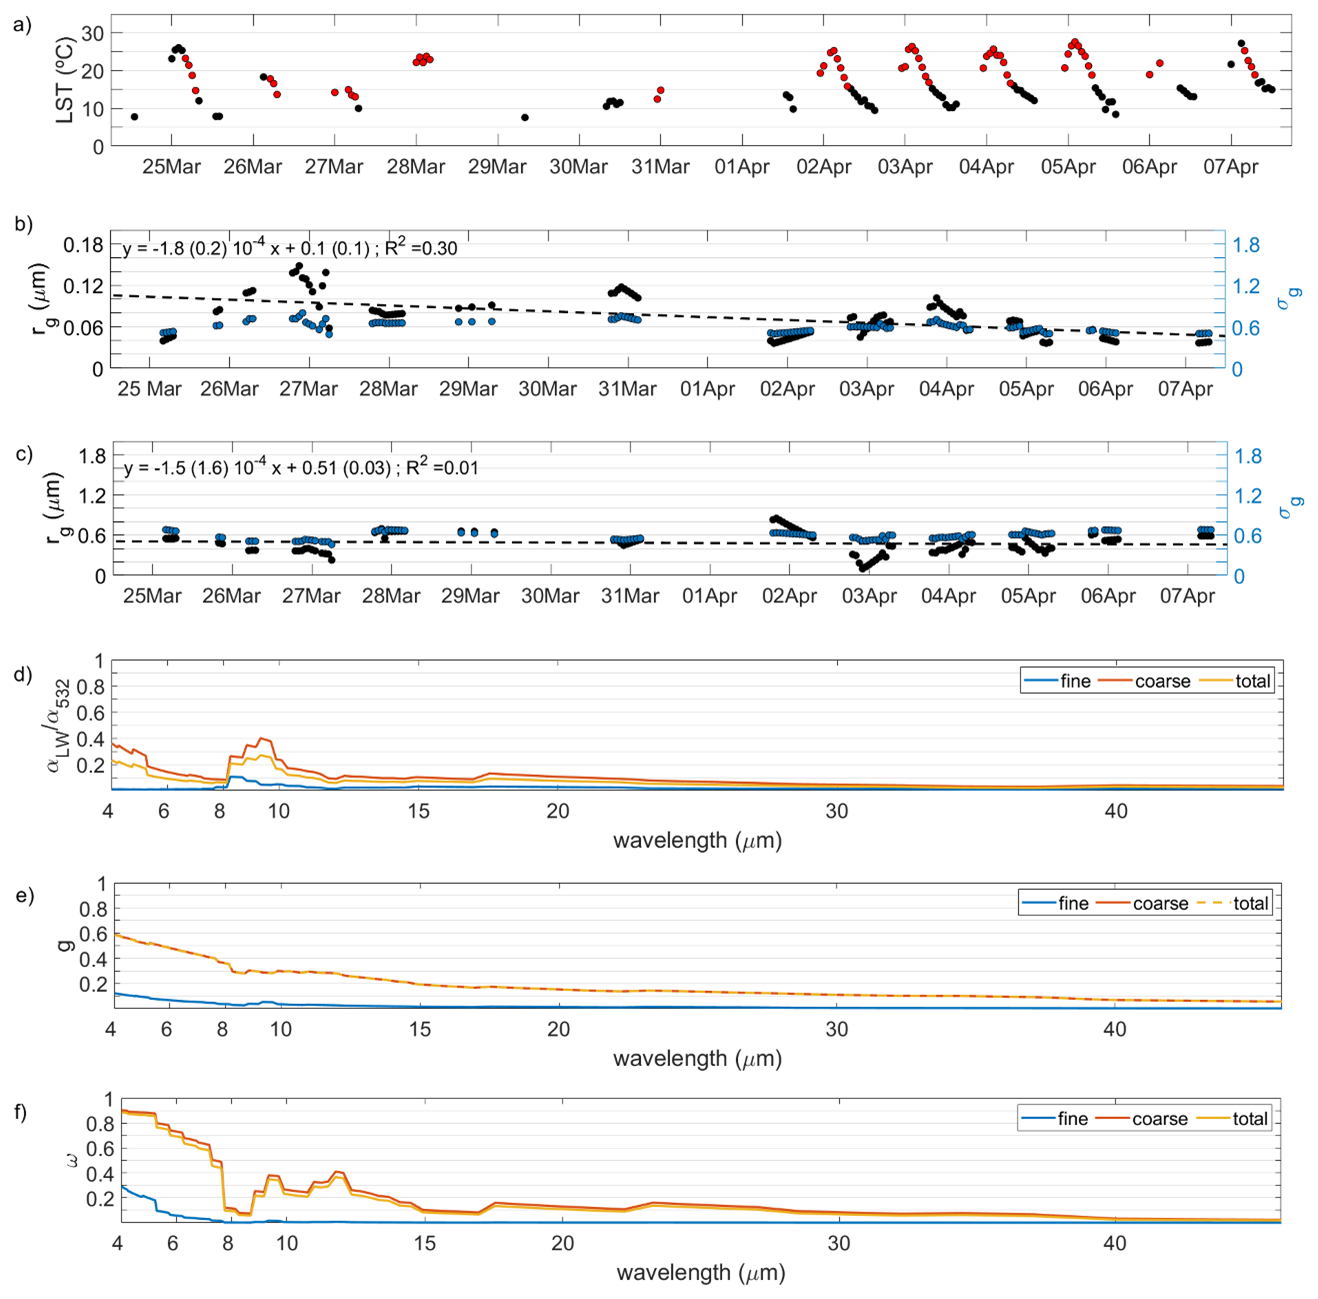
Figure 1(a) Hourly land surface temperature (LST, in °C), where the red dots represent the cases coincident with lidar measurements; AERONET geometric median radius (rg, in µm) and standard deviation (σg) for the (b) fine and (c) coarse modes, where the dashed lines represent the linear fitting of rg over time; Episode-averaged values of (d) the Mie-derived normalized spectral extinction () (see Eq. 3), (e) asymmetry factor (gLW), and (f) single scattering albedo (ωLW), for the fine (blue), coarse (red) and total (yellow) modes. All the panels refer to El Arenosillo/Huelva (ARN) station; for the rest of stations, see the Supplement.
Moreover, the geometric median radius (rg), and its standard deviation (σg), of the lognormal distribution are also needed in the Mie code. Those parameters are obtained for both the coarse and fine modes using column-integrated AERONET (Aerosol Robotic NETwork; http://aeronet.gsfc.nasa.gov, last access: 28 March 2025) Version 3 Level 2.0 data inversion products. AERONET provides the volume median radius (rv) and its corresponding standard deviation (σv); hence, the following expressions were applied to determine both rg and σg:
with σg=σv. These data were hourly averaged (and interpolated if missing). The column-integrated number concentration (N) is also derived. The AERONET column-integrated volume concentration (vc), together with the rv and σv, is used to calculate N as follows:
The Mie module is capable of computing the spectral single scattering albedo (ωLW), the asymmetry factor (gLW) and the normalized extinction coefficient () for each atmospheric layer. Then, the estimated extinction coefficient in the LW range, αLW, distinguishing between Df and Dc modes, is calculated as follows:
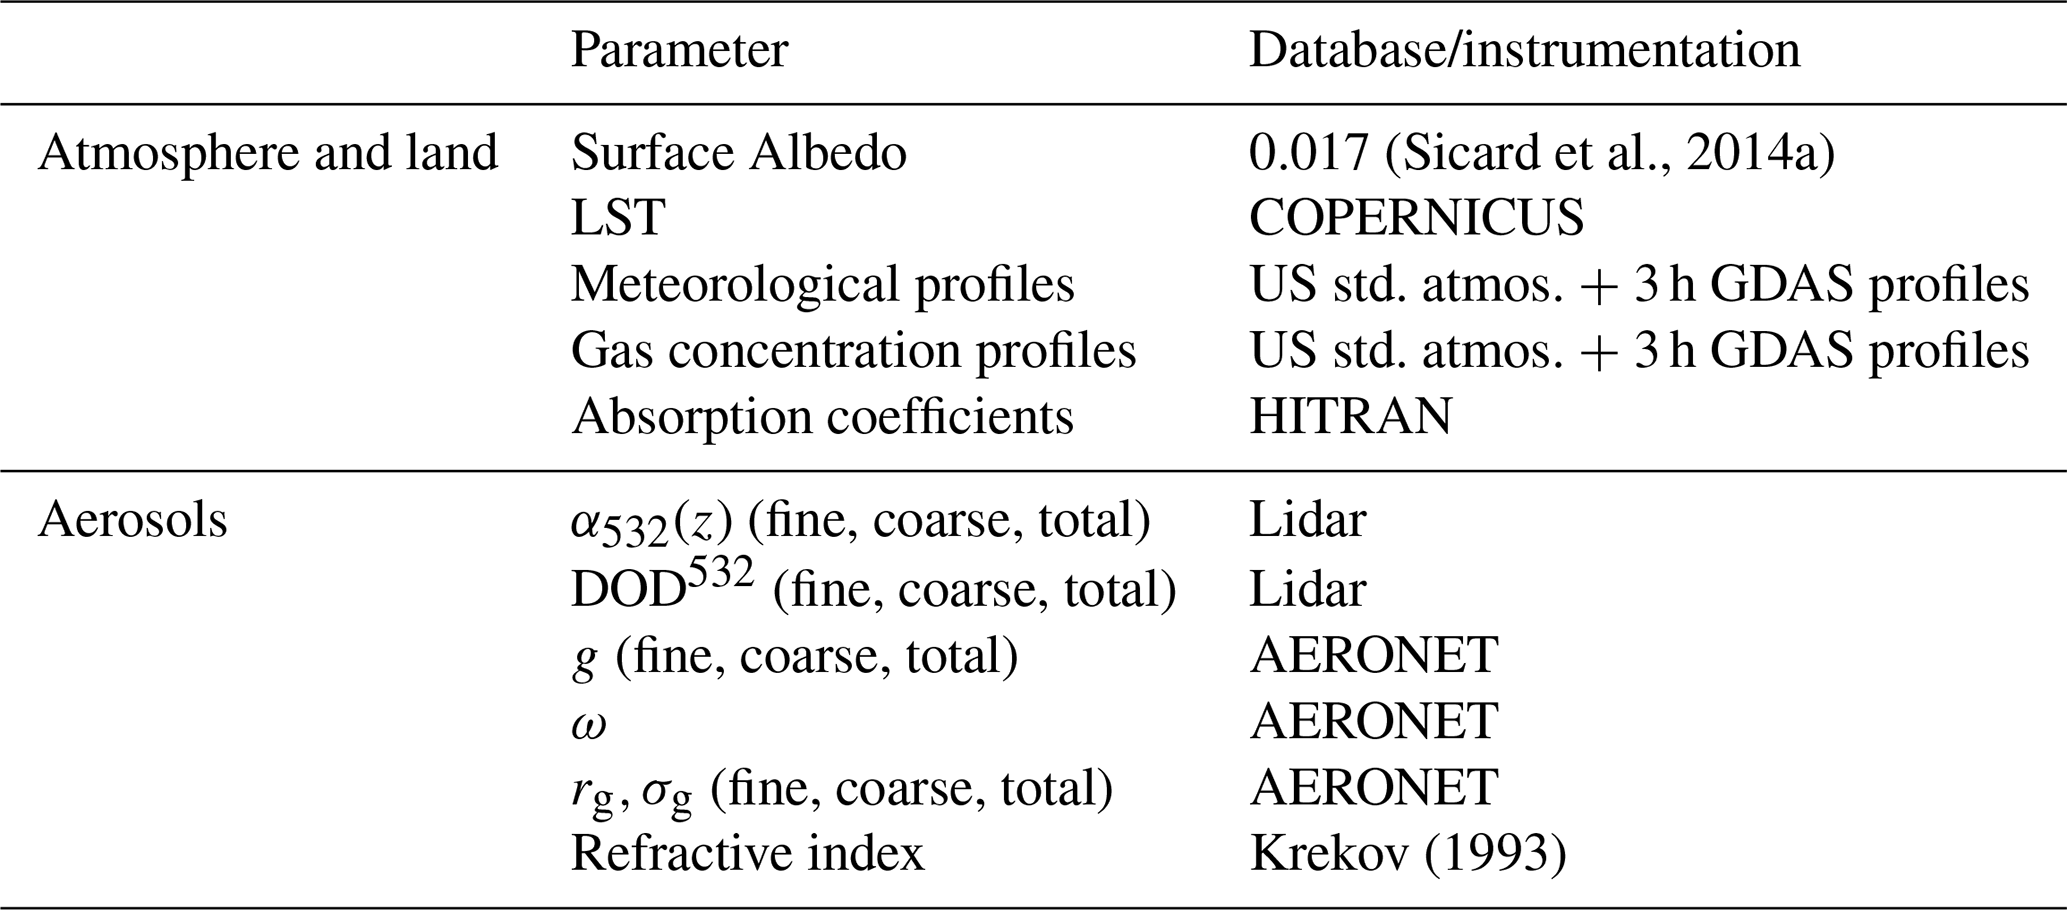
where the upper-index i refers to total dust, Dc and Df, and α532(measured) is the extinction coefficient at 532 nm as provided in López-Cayuela et al. (2023). Table 1 shows the input parameters used in the LW spectral range module as well as the data source.
Table 1Input parameters and radiative properties for the GAME model in the LW spectral range. Note that z denotes the vertical dependence.
2.3 Dust radiative effect and heating rate estimation
The dust-induced DRE, simulated either at the BOA or the TOA, is defined as in López-Cayuela et al. (2025) (see there Eq. 1). In particular, the atmospheric DRE (DREATM) is computed as the difference between the DRE at TOA (DRETOA) and that at BOA (DREBOA), that is, . In general, all those quantities are denoted as DRE, where i stands for TOA and BOA, and j is the spectral band where DRE is calculated, i.e. j=LW, and net (SW+LW). All SW magnitudes were previously obtained in López-Cayuela et al. (2025). Both hourly DRE for SW and LW were computed for solar zenith angles (SZA)<90°, since GAME calculates those fluxes only during daytime.
As in López-Cayuela et al. (2025), both the hourly- and daily-averaged DRE is calculated. In the SW range, the daily averages were computed as the mean (over 24 h) of the number of daytime hourly values, as SW fluxes during night-time are zero, unlike those in the LW range. Therefore, night-time hourly LW fluxes were assumed to be equal to the mean value of the daytime LW ones, and hence the daily DRELW was obtained from averaging those day-time and night-time-derived hourly (over 24 h) DRELW values. Similar procedure has been applied by other authors (di Sarra et al., 2011; Meloni et al., 2015; Sicard et al., 2022). Under this assumption, some uncertainty may still arise from two main factors affecting the DRE: differences in DOD values, and variations in the downward radiation flux during both day- and night-time. Regarding the first factor, the episode analysed was highly cloudy, resulting in numerous observational gaps during both day and night. However, recent studies by Tindan et al. (2023, 2025) investigating diurnal differences in dust aerosols across the dust belt have shown that such variations are insignificant over the Iberian Peninsula. With respect to the second factor, Granados-Muñoz et al. (2019) reported that the downward LW radiation flux displays a moderate daily variability (approximately 13 %), which would slightly modify the contrast in radiative forcing between daytime and nighttime conditions. Consequently, assuming night-time hourly LW fluxes to be equal to the mean daytime LW flux does not significantly affect the results of the present study.
Moreover, the fine-to-total (Df/DD) ratio (ftr) of the hourly-averaged DREj(ftr_DREj, j=LW, NET) is computed. In addition, a linear fitting analysis of this variable is performed over time, thus obtaining the slope of this linear fitting (δDREj), which serves as an indicator of the temporal rate of the relative contribution of Df particles to the DREj. The dust radiative efficiency (DREffj) is also obtained from the slope of the linear fitting (forced to zero) of DRE values as a function of the dust optical depth at 532 nm (DOD532) along the event.
Following the same methodology as in López-Cayuela et al. (2025), differences in the dust-induced DRE (ΔDRE) as obtained from the two approaches are computed as follows:
where DRE is the contribution to DRE of Df and Dc particles in each spectral range (i.e., j=LW, NET), that is,
and DRE is the contribution of the total dust as a whole, that is,
Moreover, the relative differences (ΔrelDRE) between the two approaches were calculated as:
As in López-Cayuela et al. (2025), the classical approach (i.e., without dust component separation) is adopted as the reference. Accordingly, throughout this manuscript, cases are described in which the component-separated DRE either overestimates or underestimates this classical approximation. Furthermore, a statistical analysis based on the relevant percentiles (P), e.g. P(25), P(50) (i.e. median), and P(75), of both ΔDRE and ΔrelDRE datasets was conducted to evaluate the significance of the discrepancies between the two methodologies.
Finally, it should be noted that aerosols predominantly exhibit a net cooling effect resulting from negative radiative forcing estimates, due to their inherent capacity to scatter solar radiation. However, certain aerosol types such as mineral dust are also able to absorb radiation to a greater or lesser degree, even likely leading to an opposite effect. Consequently, dust can induce heating in specific atmospheric layers, despite the potential net cooling effect observed for the overall atmospheric column (Pilewskie, 2007). The aerosol heating rate (AHR, K d−1) is defined as the radiatively aerosol-induced rate of the temperature change in time () within a layer of the atmosphere. For a plane-parallel geometry, it can be expressed as follows:
where ![]() is the gravity acceleration (9.81 m s−1), cpd is the specific heat of dry air at constant pressure (p) (1005 kJ kg−1 K−1), Δp is the difference of the atmospheric pressure between two layers (Δp>0), and ΔF(z) represents the corresponding vertical difference in the flux (F(z); for Δz<0), which is defined as
is the gravity acceleration (9.81 m s−1), cpd is the specific heat of dry air at constant pressure (p) (1005 kJ kg−1 K−1), Δp is the difference of the atmospheric pressure between two layers (Δp>0), and ΔF(z) represents the corresponding vertical difference in the flux (F(z); for Δz<0), which is defined as
where Fd and F0 denote the solar radiative flux (W m−2) as computed by GAME, with and without dust presence, respectively. The arrows indicate whether the fluxes are downward (↓) or upward (↑).
Comprehensive details describing the dust outbreak in overall, and regarding the methodology applied to derive dust optical and microphysical properties from polarized lidar measurements, are reported in López-Cayuela et al. (2023). The DRE analysis in the SW range can be found in López-Cayuela et al. (2025).
3.1 Dust radiative and microphysical properties in the LW range
Figure 1a shows the hourly LST at ARN station, for instance, during the dust outbreak period, where red dots represent the coincident values with lidar measurements when the DRELW can be calculated. Data from all the five Iberian lidar stations can be found in Fig. S2 in the Supplement. Consequently, compared to the SW study (López-Cayuela et al., 2025), 18 %–45 % fewer DRELW data were available for analysis. The lidar stations mostly affected by this lack of LST data were ARN and EVO. Regarding the LST results, except for a few days with missing data, the diurnal LST cycle is nicely visible at the stations. The maximum values ranged from approximately 28 °C (ARN, EVO, BCN) to 32 °C (GRA and TRJ) without significant changes over time (less than 0.02 °C). The maximum night/day difference ranged from approximately 18 °C (BCN) to 30 °C (TRJ).
In Fig. 1b and c, rg and σg are represented as a function of time, and split into the fine and coarse modes, respectively, during the period for ARN station (Fig. S3 in the Supplement shows the same for the rest of the Iberian lidar stations). Those values are obtained from the AERONET rv and σv (see Eq. 1). A linear fitting of those values over time is also performed. The episode-averaged value and the slope of the linear fitting (γ) are shown in Table 2. For the fine mode, the mean rg (σg) value over the dust episode ranged from 0.076–0.093 µm (from 0.613–0.624 µm) at the southern stations (ARN, GRA and EVO). For TRJ and BCN, those values were lower, ranging from 0.059–0.067 µm (0.552–0.575 µm). It means that the fine particles were, on average, 10 %–30 % smaller at TRJ and BCN than at the southern stations. Regarding the γ values found, they were positive for GRA, TRJ and BCN, and negative for ARN and EVO. However, that increase/decrease over time was not significant, as it was less than 1 % µm d−1 at every station. Therefore, by examining each station individually, the size of the fine particles did not vary considerably throughout the episode. These results are consistent with those obtained by Sicard et al. (2022) for BCN, showing a value of 0.7 % µm d−1 during a summer Saharan dust outbreak in 2019.
Table 2Episode-averaged median radius (rg, µm) and standard deviation (σg, µm) at the five lidar stations: Barcelona (BCN), Torrejón/Madrid (TRJ), Évora (EVO), Granada (GRA) and El Arenosillo/Huelva (ARN) for the fine and coarse modes. The slope of each linear fitting (γ, % µm d−1) and its standard error (in brackets) is also shown.
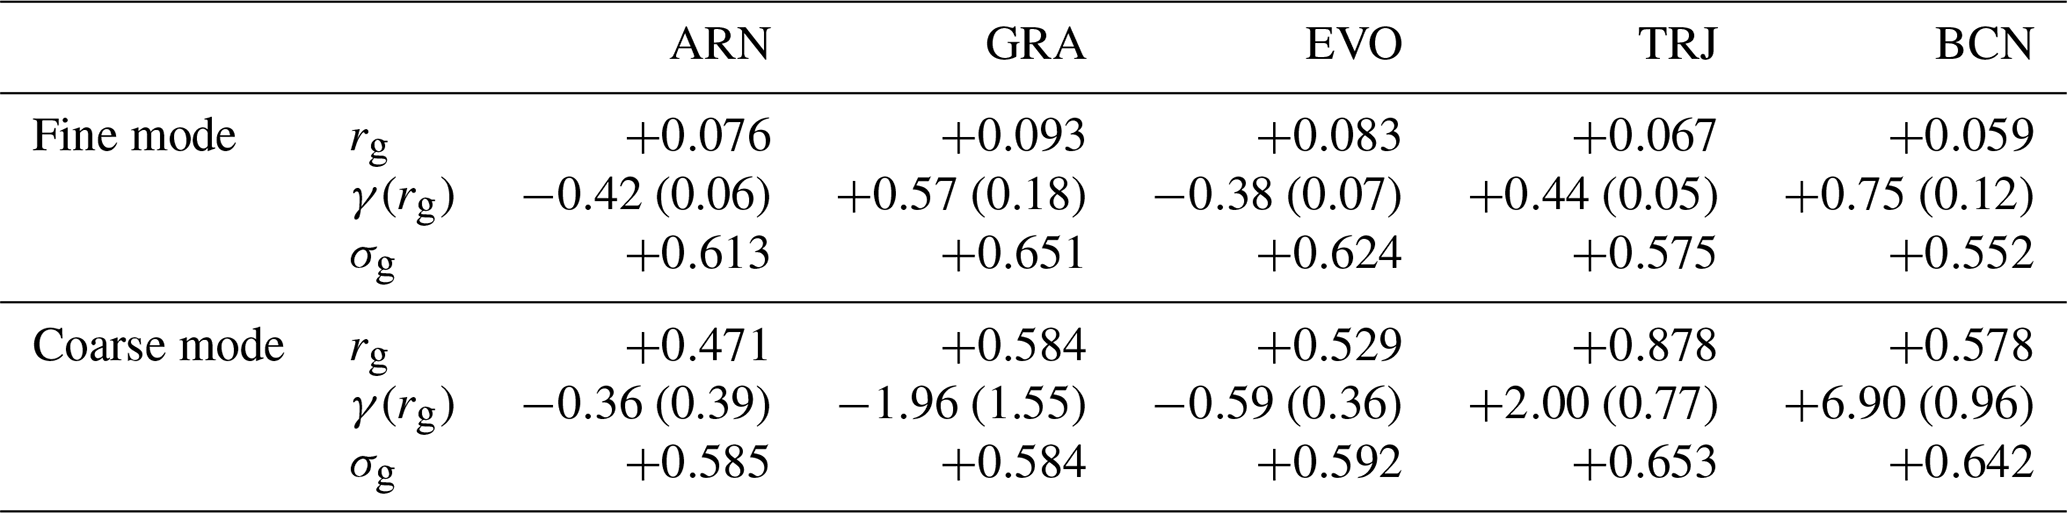
For the coarse mode, the lowest (highest) mean rg over the dust episode was found at ARN (TRJ), showing a value of 0.471 (0.878). Regarding the σg, the lowest (highest) value was found at the same stations, that is 0.585 µm (0.653 µm). For the rest of the stations, rg (σg) ranged from 0.529–0.584 µm (from 0.592–0.642 µm). Indeed, a value of 6 was found for the episode-averaged coarse-to-fine rg ratio at the southern stations, being higher than 10 at TRJ and BCN. Similarly to the fine mode, that increase/decrease over time was not significant either (lower than 2 % µm d−1) except for BCN, reaching almost 7 % µm d−1. This increase in the geometric radius of the coarse particles at BCN has been observed previously where the coarse dust rg increased during a summer Saharan dust outbreak in 2019 at a rate of (Sicard et al., 2022). A possible explanation for this phenomenon was provided in the aforementioned study. Briefly, when the transport of mineral dust occurs over polluted regions with high humidity conditions, not only anthropogenic inorganic acids can be adsorbed onto the dust surface, forming hygroscopic salt compounds that coat the dust particles (Abdelkader et al., 2015; Athanasopoulou et al., 2016), but the formation of secondary pollutants is also enhanced (Querol et al., 2019; Xu et al., 2020).
Figure 1d–f show the episode-averaged optical properties introduced in the GAME Mie module (see Sect. 2.1), i.e. and ωLW, for instance, at the ARN station. Note that the LW range stands for 4–50 µm in this work, and those quantities are separated into the fine, coarse and total modes for the five lidar stations. As observed, the most sensitive spectral window for radiative forcing is between 8 and 13 µm. For that reason, the analysis will be performed by averaging the properties in that spectral window, denoted here by δLW. All those quantities were derived separately for the fine and coarse dust contributions, as well as for the overall bimodal distribution (total dust). It should be mentioned that values for are slightly higher than those for . Those ratios depicted in Fig. 1d are normalized against the corresponding α532 for coarse (Dc) and total dust, respectively. Thus, the ratio is slightly higher due to a slightly smaller value as compared to . Furthermore, due to the low sensitivity of fine mode in LW, is an order of magnitude lower than, with mean differences in the ratio of less than 6 % accounting for all the lidar stations on average along the dust episode.
Regarding the episode-averaged and at BCN station, they were from 2–10 times greater with respect to those values found in the other stations. However, noted that those values for the fine mode were remarkably lower than those for the coarse mode. Indeed, the episode-averaged fine-to-coarse ratio of gδLW and ωδLW is approximately 25 % and 5 %, respectively. Furthermore, the and properties were either rather similar or slightly higher than those corresponding to the total dust. That finding agrees with other studies (e.g. Sicard et al., 2014b). The coarse-to-total ratio was 1.0 and 1.2 on average for gLW and ωLW, respectively. However, in some cases, was 1.7–3.0 times higher. The coarse-to-total ratio was 1.5–2.0 on average reaching up to values of 3.0–7.0 at several times during the dust event. This indicates that the separated coarse dust likely produces greater extinction in the LW range than that for the total dust (considering the bimodal distribution in overall). This hypothesis will be examined in Sect. 3.4, where the comparison between the two approaches considered in this study (see Sect. 2.2) will be addressed.
3.2 Long-wave dust direct radiative effect (DRELW)
A detailed description of the dust incidence of the Saharan intrusion by crossing the Iberian Peninsula is provided in López-Cayuela et al. (2023). In addition, the temporal evolution of the DOD532 for the five lidar stations is shown in Fig. S4, where the particular days with high aerosol loads (i.e., hourly DOD532>0.5) are also indicated, occurring between 27 March and 1 April 2021 at various stations.
3.2.1 DRELW at BOA
Figure 2 shows the hourly dust direct radiative effect in the LW range (DRELW, W m−2) at BOA, TOA and ATM as induced by the Df and Dc particles at the ARN station, shown as an example. The rest of the stations can be found in Figs. S5–S8 in the Supplement along with the daily DRELW values for all stations. Table 3 shows the episode-averaged DRELW as induced by Dc, Df and DD at the five Iberian lidar stations, and at BOA and TOA. At all stations, DRELW is positive at BOA for both Df and Dc particles, indicating the expected dust-induced warming. During the most intense part of the episode (from 26 March–1 April for all the stations, except for BCN, where lasting until 3 April), hourly Dc (Df) DRELW values below +10 (+1) W m−2 were mostly found. Note that 27 and 31 March stand out at ARN and TRJ (when DOD532>0.80) showing hourly DRELW values of ∼ +20 (∼ +2) W m−2 for Dc (Df) particles. For the other stations, maximum hourly DRELW values are 40 %–60 % lower than those in ARN (see Table 3). During the rest of the dust event, Dc (Df) DRELW was lower than +5 (+1) W m−2 at all stations. Regarding the daily DRELW (Fig. 2c and d), for days with daily DD DOD532≥0.50, DRELW values remained below +20 (+2) W m−2 for Dc (Df) particles. For days with daily DD DOD532<0.50, DRELW values were below +10 (+0.8) W m−2 for Dc (Df) particles.
Table 3Episode-averaged dust direct radiative effect in the LW range (DRELW, in W m−2), and the standard deviation (SD, in brackets), at the BOA and TOA (and ATM) as induced by fine (Dc), coarse (Dc) and total dust (DD) at the five Iberian lidar stations. indicates the mean value for the whole event (SD are also shown), and Xmax refers to the maximal value. The DREff (in ) denotes the DRE efficiency. The ftr_DRE denotes the hourly Df-to-DD DRE ratio (in %,), showing also the mean, median, minimum (min), and maximum (max) values; δDRE (in % d−1) is the slope of the linear fitting analysis of the hourly ftr_DRE values along time.
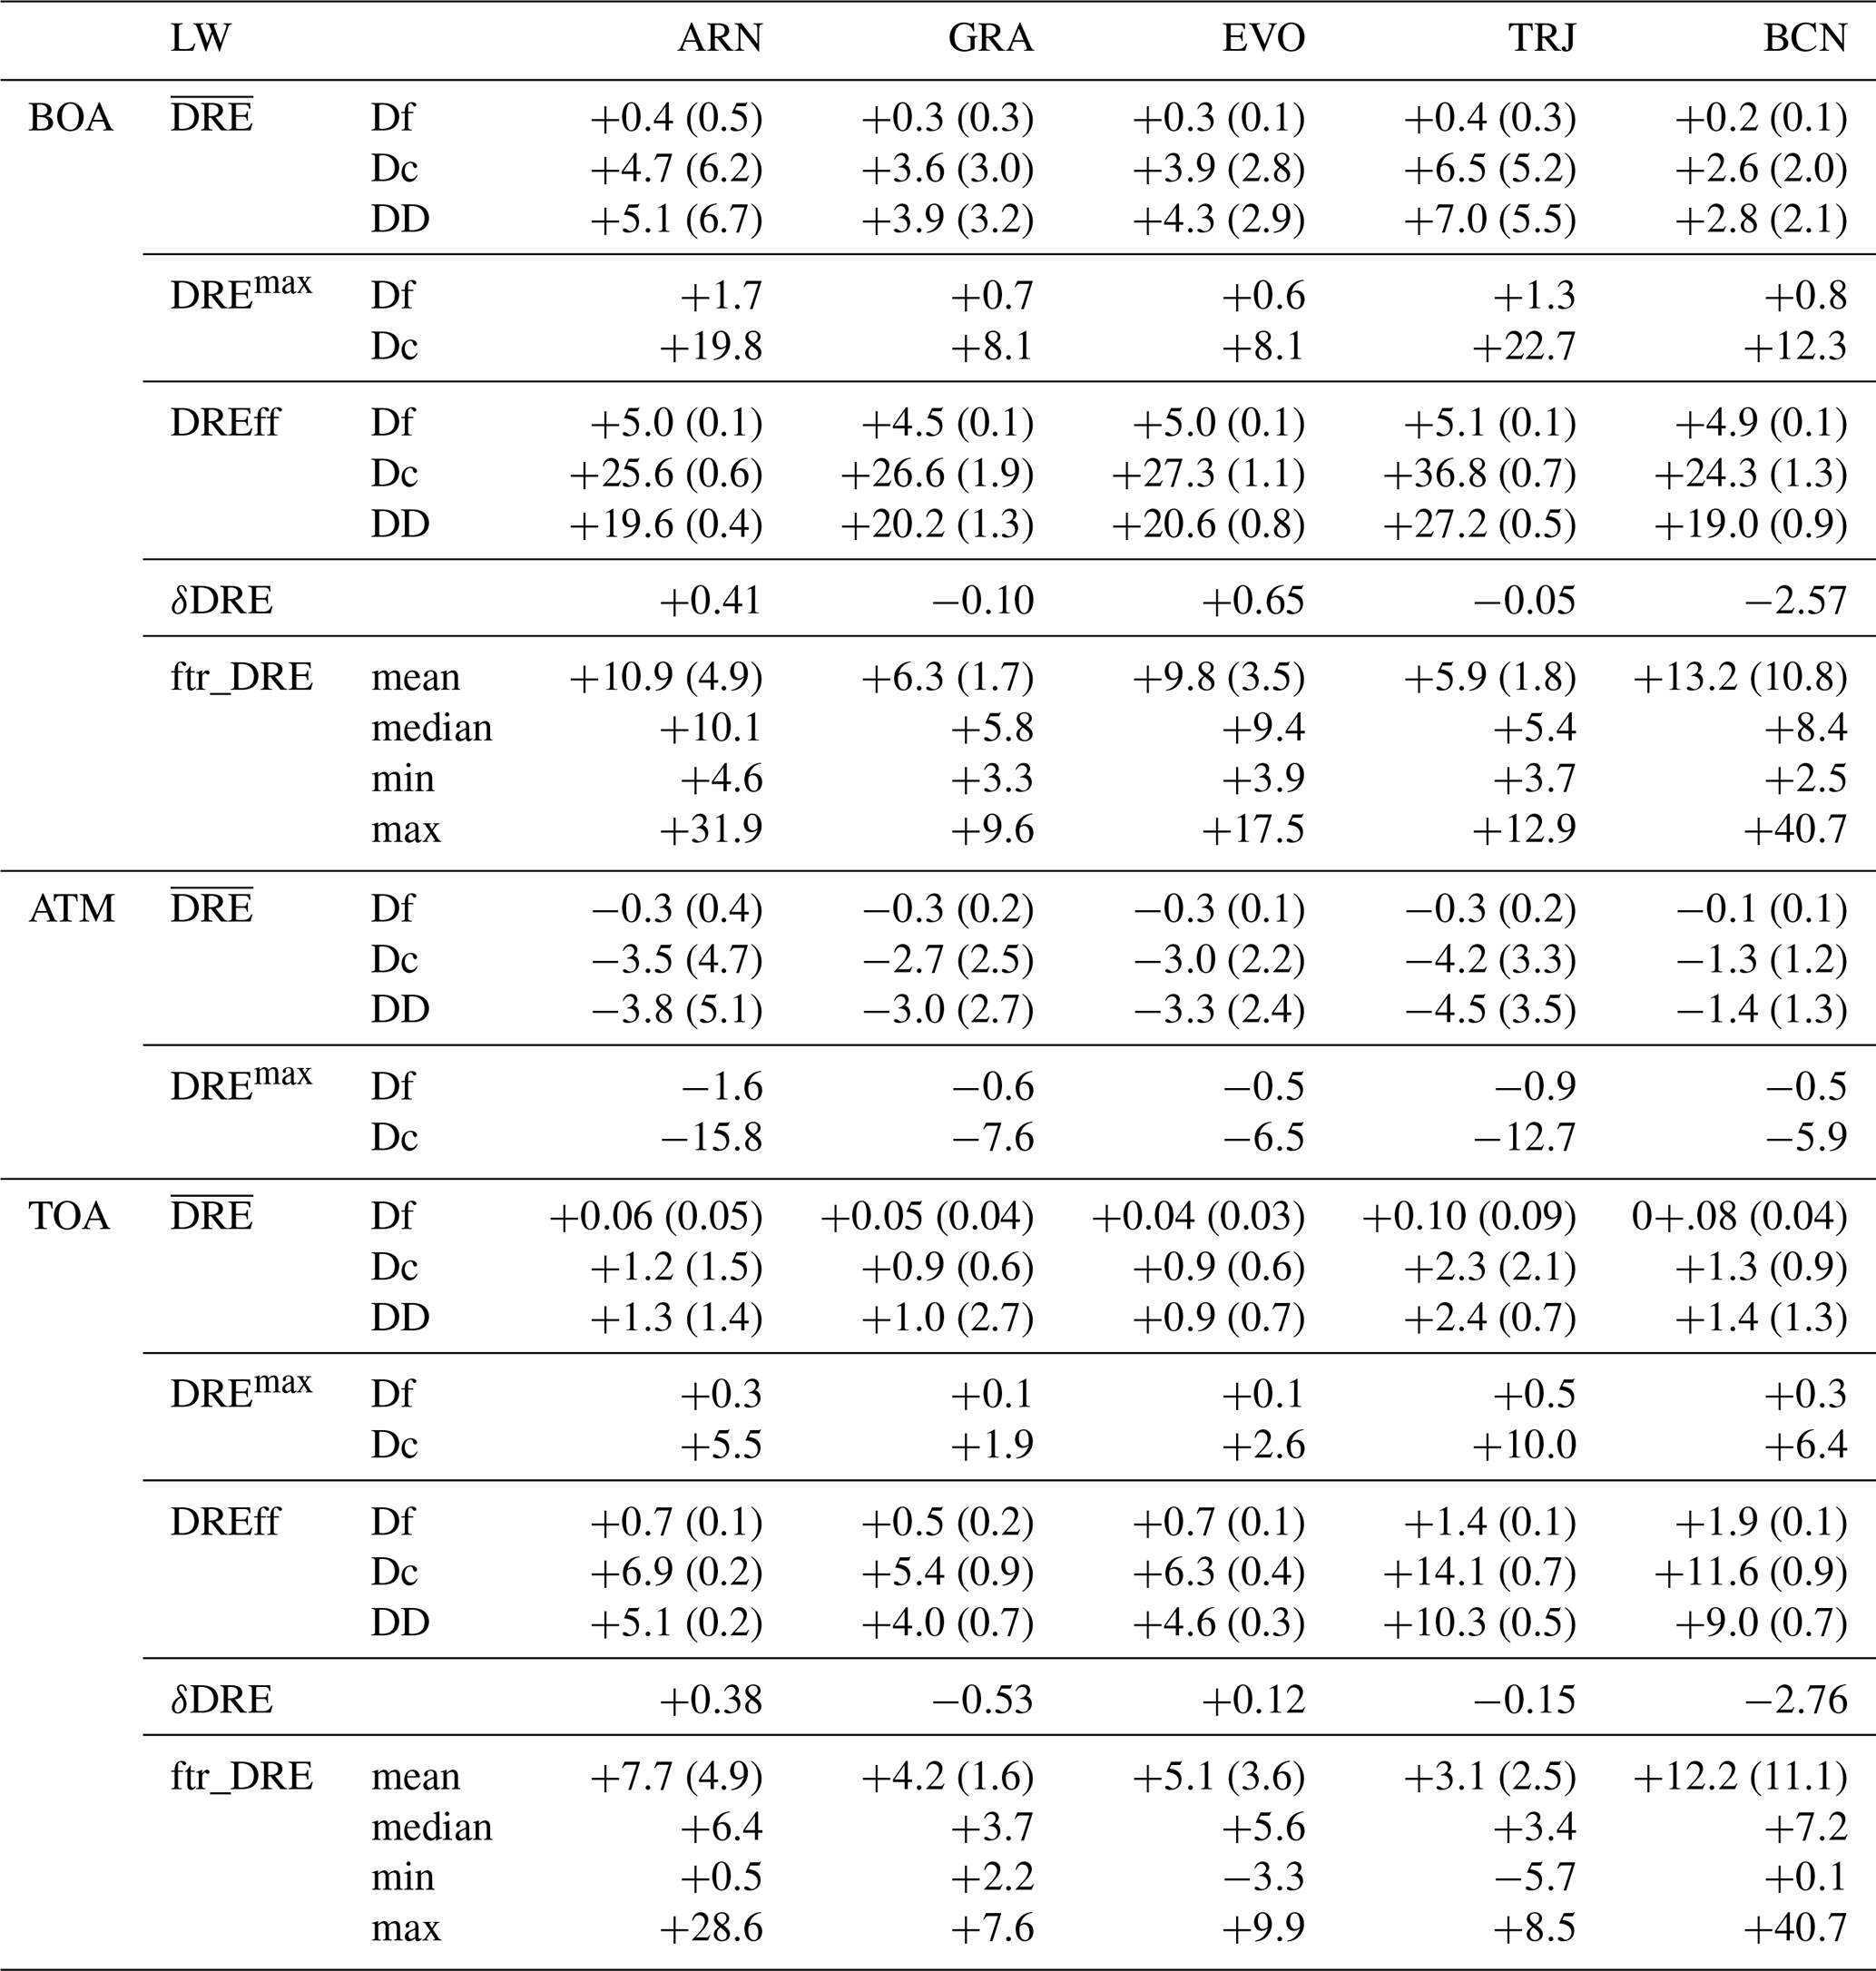
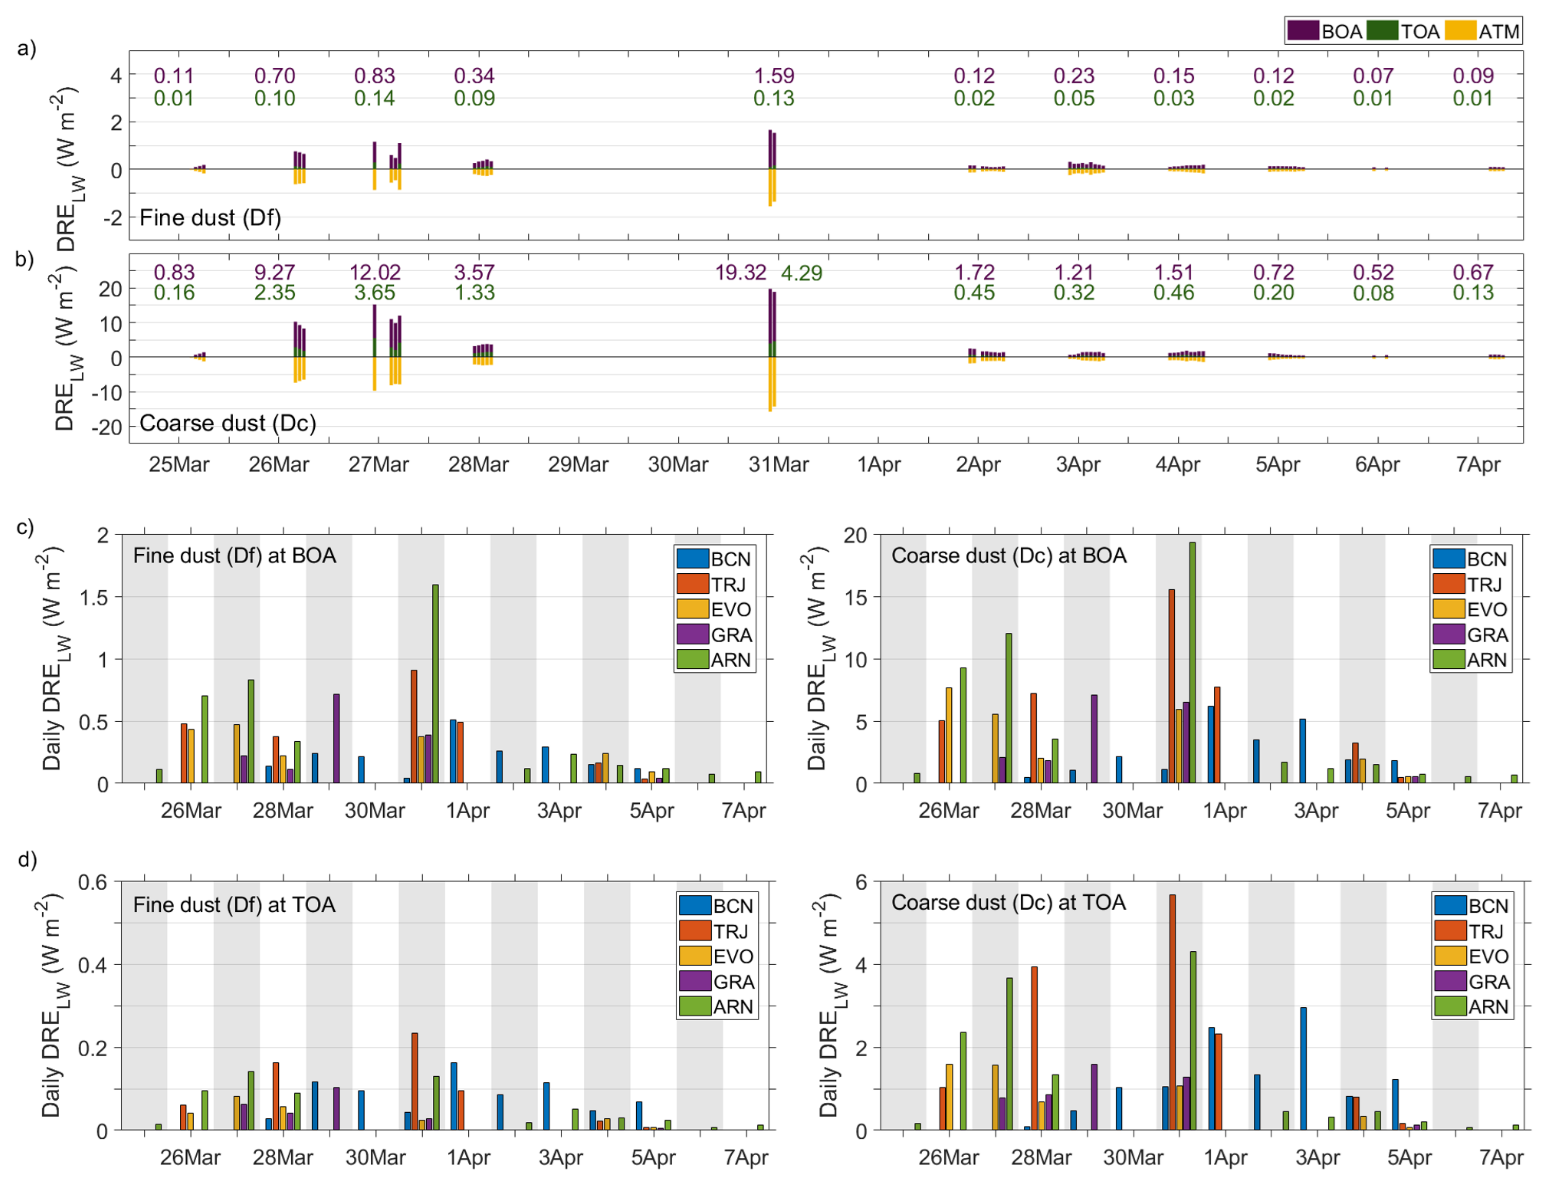
Figure 2Dust direct radiative effect in the long-wave range (DRELW, W m−2) at BOA (purple), TOA (green) and in the atmosphere (ATM, yellow) at the ARN station, for instance, as induced by: (a) fine dust (Df), and (b) coarse dust (Dc) particles. Daily mean values are also included at the top (as marked by the same colours). Daily mean DRELW values at (c) BOA and (d) TOA for Df (right) and Dc (left) particles at the five lidar stations.
Looking at the entire episode, the DRELW averaged values () ranged from +2.6 to +6.5 W m−2 for Dc particles, and from +0.2 to +0.4 W m−2 for Df particles (Table 3). As noted in López-Cayuela et al. (2023), aerosol load exhibited very high variability across all stations during the study period, resulting in considerably large the standard deviation (SD; Table 3). The contribution of fine particles to DD DRELW is one order of magnitude lower than that of the Dc particles. The slope of the linear fitting of DRELW over time (δDRELW) showed values that ranged from −2.57 (BCN) to +0.65 (EVO) % d−1 (Table 3). The mean ftr_DRELW values over the entire episode ranged from 6 % to 13 %, although the maximum hourly ftr_DRELW values varied between 10 % (GRA) and 41 % (BCN). Indeed, 10 %–15 % of the hourly ftr_DRELW values exceed the mean (±SD) values for the whole dust episode. These results indicate that Dc particles are the primary contributors to the DD DRELW. As expected, Df DREffLW is also much smaller than Dc DREffLW at all stations (Table 3). Specifically, Df DREffLW is close to , whereas Dc DREffLW ranges from +24 to .
Performing a comparative analysis of the DRELW obtained in this work with previous studies can be challenging, as DRELW depends on multiple factors (e.g. fine-to-coarse rg ratio, DOD, ftr_DOD, LST), and may vary significantly from one dust event to another. Moreover, DRELW is highly sensitive to the height reached by the dust layer (Dufresne et al., 2002; Sicard et al., 2022). Therefore, although the results of the present study are generally consistent with several previous works on mineral dust in the infrared range over Iberian Peninsula stations (e.g. Sicard et al., 2014b, 2022; Granados-Muñoz et al., 2019; Bazo et al., 2023), some differences can be expected. In particular, Sicard et al. (2022) studied the LW direct radiative effect during a summer dust outbreak in 2019 over BCN, using the same approach as in this study (separately considering the contribution of the Df and Dc modes). That work reported DREffLW values of for Dc particles, and for Df particles. In the present study, similar Df DREffLW values were obtained, whereas Dc DREffLW were almost 50 % lower. This discrepancy likely arises from the strong sensitivity of LW radiative forcing simulations to aerosol load, coarse-mode particle radius, refractive index, vertical distribution, LST, and surface albedo (Sicard et al., 2014a). For example, substantially higher LST values were observed in Sicard et al. (2022), largely attributed to a concurrent heatwave during the Saharan dust outbreak, with night-time LST values greater than 15 °C and maximum daytime LST of 45 °C.
3.2.2 DRELW at TOA and in ATM
Similar to the BOA analysis, DRELW at TOA is positive, representing also a dust-induced heating (Fig. 2a and b). However, the magnitude is much lower (vs. DRELW at BOA). In particular, the maximum hourly DRELW values were 2–3 times lower at TOA than at BOA, and they were found at TRJ and BCN, where the dust plume reached higher altitudes (>6 km) (López-Cayuela et al., 2023). Those specific maximum DRELW values were +10.0 and +6.4 (+0.5 and +0.3) W m−2, respectively, at TRJ and BCN for Dc (Df) particles, that is, between 2–5 times greater than for the rest of the stations (Table 3). The daily DRELW at TOA (Fig. 2c) shows values < +6.0 (+0.3) W m−2 for Dc (Df) particles for high daily DD DOD532 (≥ 0.50). For low and moderate daily DD DOD532 (< 0.50), DRELW decreased to values lower than +2.0 (+0.1) W m−2 for Dc (Df) particles. Regarding the mean DRELW values as averaged over the whole event, the Dc (Df) values ranged from +0.9 to +2.3 (from +0.04 to +0.10) W m−2 for all the stations (Table 3). As shown in Sect. 3.2.1, aerosol load exhibited a very high variability across all stations throughout the study period. Consequently, the SD is considerably high (Table 3).
The mean ftr_DRELW for the entire period varied approximately from +4 % to +8 % at all the stations except BCN, and slightly increased or decreased over time, depending of those stations (Table 3), but no significant impact was observed (δDRELW varied from around −0.5 to ). However, at the BCN station, ftr_DRELW values of around +12 % with were found. In addition, note that ftr_DRELW reached maximum values up to 41 %, with the Df contribution rather relevant. Indeed, between 8 % and 15 % of the hourly ftr_DRELW exceed the corresponding episode-averaged values (± standard deviation). Since similar results were found at BOA, this agrees with the findings reported by other authors supporting that DRELW is primarily dominated by the contribution of Dc particles (e.g. Sicard et al., 2022).
As expected, DREffLW is much smaller at TOA than at BOA (Table 3). In particular, DREffLW for Dc (Df) particles is overall nearly 4 (7) times lower at TOA (vs. at BOA) over the southern stations (ARN, GRA and EVO), and 2 (3) times lower at the rest. Additionally, the DREffLW at TOA for the fine dust component is much smaller than for the coarse dust (Table 3). For all the stations, Df DREffLW is lower than , and Dc DREffLW ranges from (at the southern stations) to (on TRJ and BCN). Thus, Dc DREffLW is around 3–10 times greater than Df DREffLW.
By comparing with other studies (e.g. Granados-Muñoz et al., 2019; Sicard et al., 2022), and regarding the southern stations, similar results for DRELW and DREffLW are found. However, those parameters are 2–4 times greater at TRJ and BCN with respect to those previous studies. The difference in Dc DRELW may be explained by the finding of Sicard et al. (2014b), who reported that Dc DRELW exhibit little variations when the aerosol optical depth is kept constant. Indeed, Sicard et al. (2014b) and Dufresne et al. (2002) demonstrated that DRELW is highly dependent on the dust layer heights. In comparison with the heights reached by the dust intrusion as reported by Sicard et al. (2022), the observed differences in DRELW and DREffLW could be based on this fact. Indeed, the dust plumes reached higher altitudes, especially at TRJ and BCN, during the dust outbreak examined in this study (>6 km height; López-Cayuela et al., 2023).
Finally, results on the dust radiative effect in the atmospheric column are reported in Table 3. For instance, hourly DRELW values in ATM at ARN station are shown in Fig. 2a and b for illustration. The rest of the stations can be found in Figs. S4–S8. By examining the DRELW at BOA and TOA, the DRELW at ATM is negative during the entire episode at all stations, as DRELW is lower at TOA than BOA, thus indicating a generalised atmospheric dust-induced cooling. The minimum hourly DRELW at ATM (i.e. the most negative) values are found at ARN and TRJ: −15.8 (−1.6) and −12.7 (−0.9) W m−2 for Dc (Df) particles, respectively. For the rest of the stations the hourly DRELW at ATM minima (i.e. the most negative values) are 50 % lower (vs. ARN and TRJ stations; see Table 3). Regarding the episode-averaged estimates, atmospheric Dc (Df) DRELW ranged from −1.3 to −4.2 (from −0.1 to −0.3) W m−2.
3.3 Dust net direct radiative effect (DRENET)
3.3.1 Relationship between DRELW and DRESW
It is known that the LW range is dominated by the Dc particles, whereas the Df particles induce a more pronounced effect in the SW range. In this work, ftr_DRE is less than 12 % in the LW range (Sect. 3.2), and 45 % in the SW range (López-Cayuela et al., 2025). This fact is illustrated in Fig. 3, where the DRELW with respect to DRESW ratio (DRE, in absolute value) is represented, giving an estimation of the percentage of radiative effect that the LW component represents compared to the SW one. For all the stations, the DRE for Df particles ranges on average 4 %–8 %, at both BOA and ATM. At TOA, the magnitude is lower, showing values of 1 %–4 %. Additionally, the Dc DRE ranges 39 %–54 % at BOA, and 20 %–50 % at both TOA and ATM. Particular mention should be made on the case of TRJ, where DRE for Dc reached values of 76 %. Other studies also report higher DRE values at BOA than at TOA. Particularly for desert dust outbreaks in the Mediterranean basin, daily DRE for total dust of 49 %–52 % and 26 %–35 % were found at BOA and TOA, respectively (di Sarra et al., 2011; Meloni et al., 2015). Sicard et al. (2022), which also performed the study by separating both Df and Dc components, found greater values of DRE for coarse dust (67 % at BOA, and 60 % at TOA). The reason could be attributed to multiple factors thus simulations of LW radiative forcing have demonstrated significant sensitivity to several key parameters, including aerosol load, coarse-mode particle radius, refractive index, vertical aerosol distribution, LST, and surface albedo (Sicard et al., 2014a). Therefore, discrepancies in this variable compared to other studies may be attributed to significant differences in the key parameters described above (see Sect. 3.2.1). Moreover, it is worthy to highlight, as Granados-Muñoz et al. (2019) pointed out, that the results at TOA might not be directly comparable to previous studies due to discrepancies in vertical resolutions within the GAME model for the SW and LW ranges above 4 km, potentially resulting in numerical artefacts in the derived outcomes.
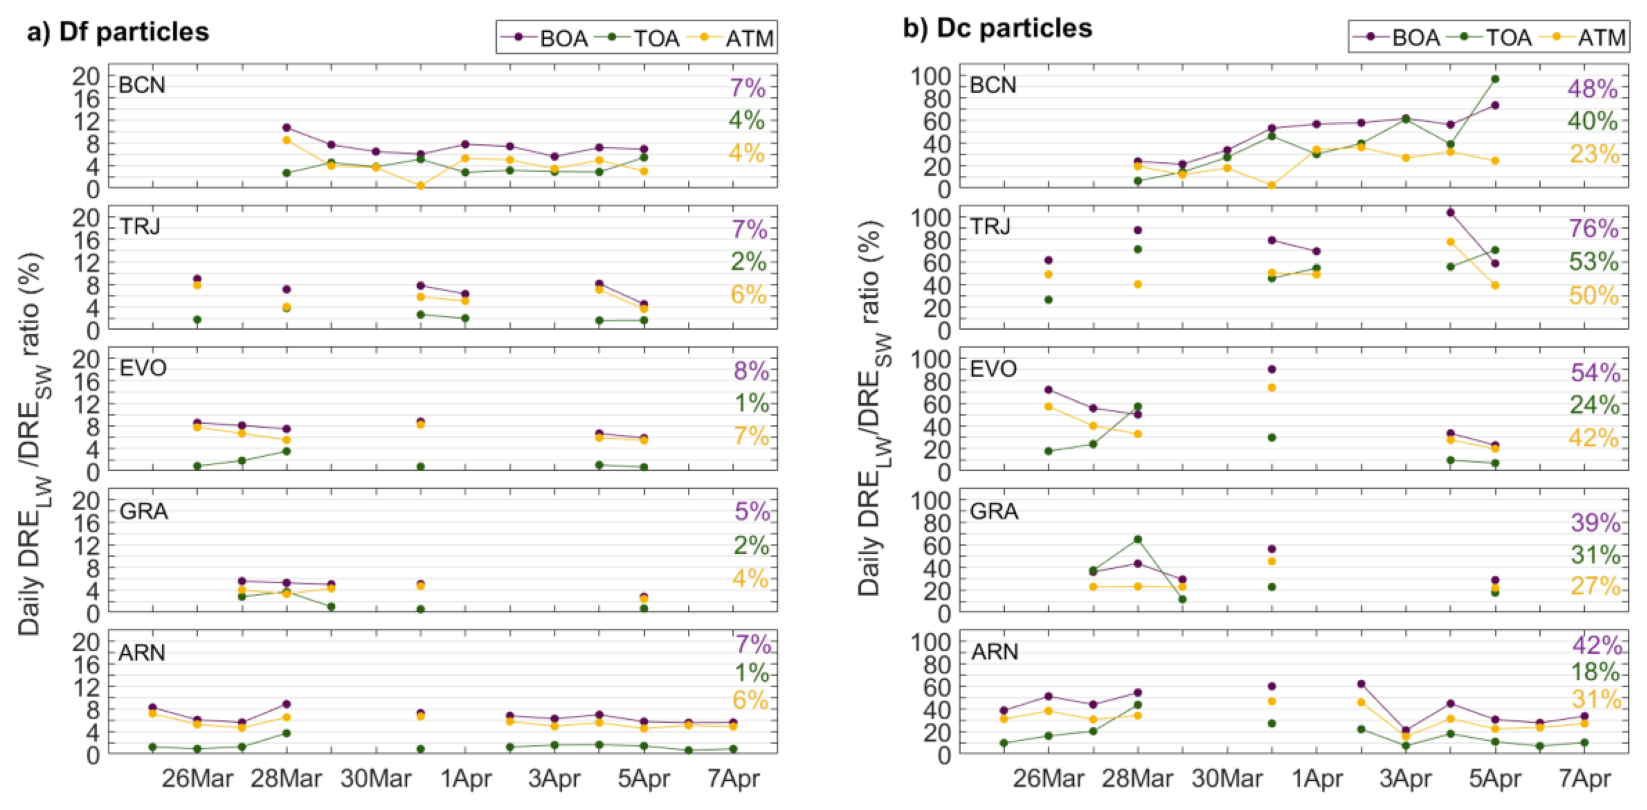
Figure 3Daily DRE ratio (%; in absolute units) at the five Iberian lidar stations, at BOA (purple), TOA (green), and in ATM (yellow), corresponding to: (a) Df particles, and (b) Dc particles. The episode-averaged values are also shown on the right of each panel.
3.3.2 DRENET at BOA
By looking at the results, overall, DRENET is negative at BOA for all the stations, indicating a dust-induced net cooling effect. Figures 4a and b shows the hourly Df and Dc DRENET, respectively, at TOA, BOA and ATM in ARN, as an example. Results for the rest of stations are shown in Figs. S9–S12 in the Supplement. Moreover, the daily Df and Dc DRENET at BOA for all the stations considered in this study is shown in Fig. 4c. Table 4 shows the episode-averaged dust radiative effect in the net range (, in W m−2) at BOA, TOA and ATM as induced by Df, Dc and DD at the five Iberian lidar stations.
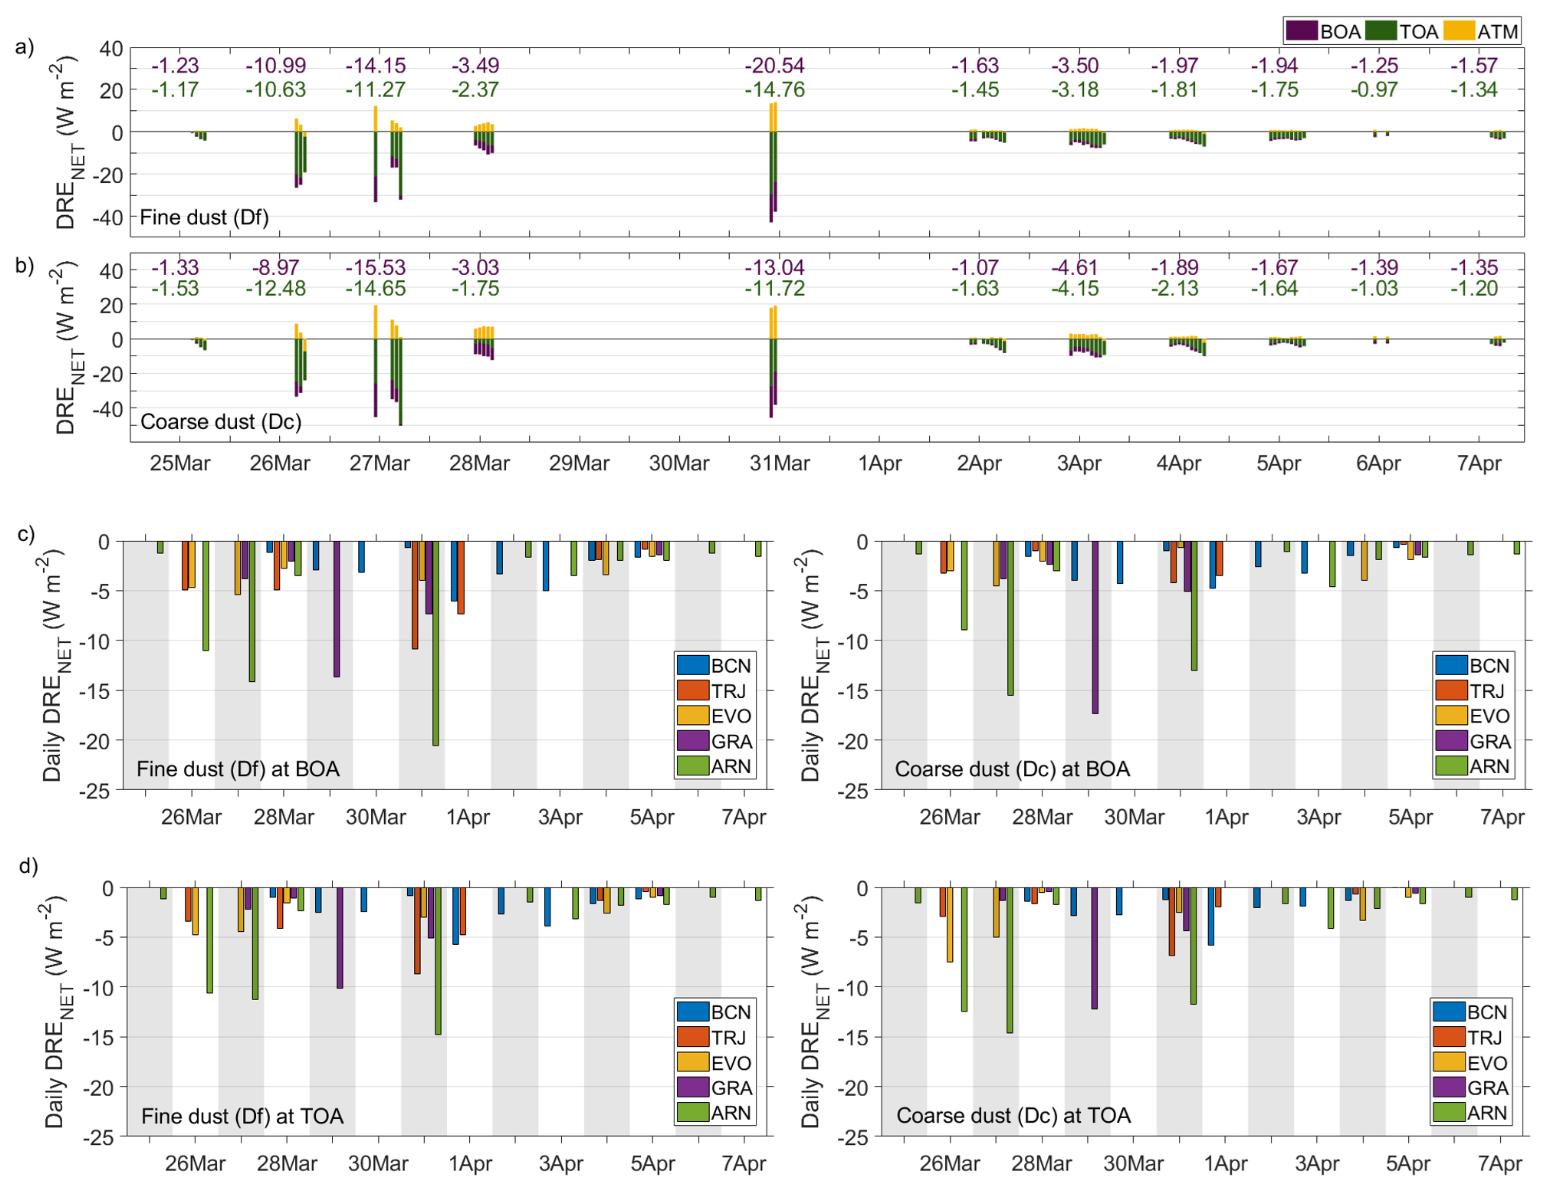
Table 4The same as Table 3, but for the episode-averaged dust net direct radiative effect (DRENET).
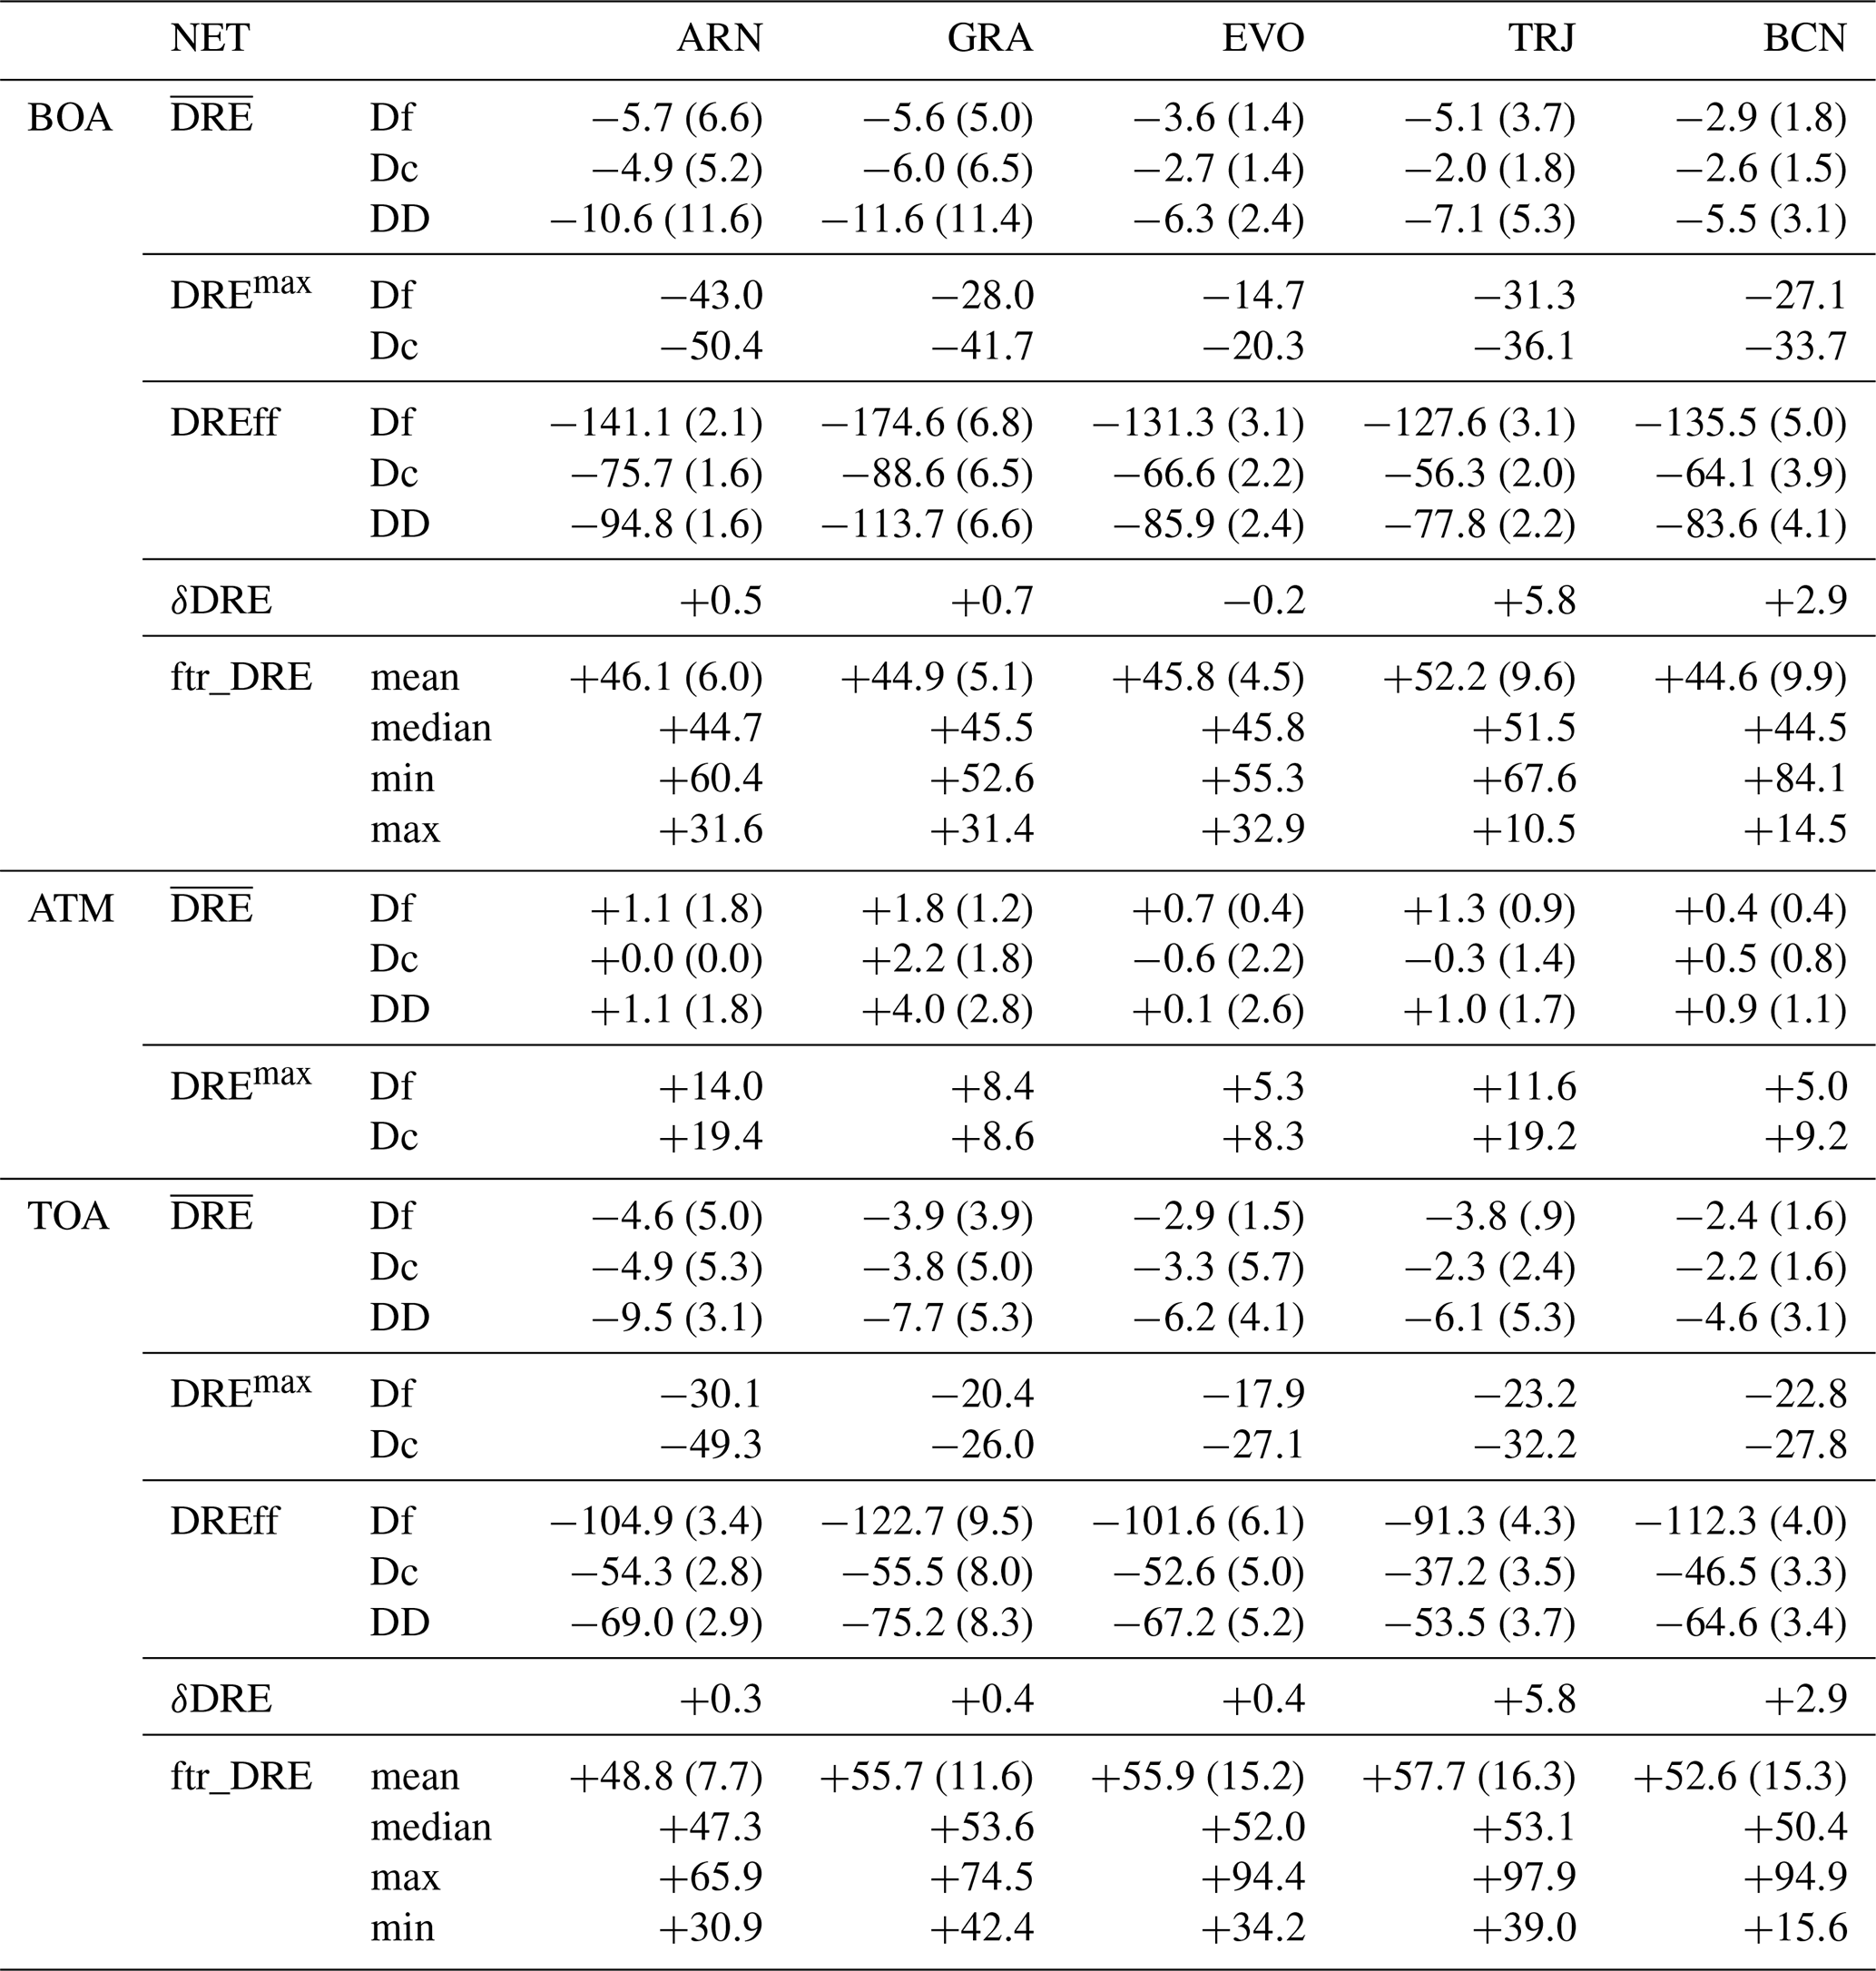
Dc (Df) ranges from −2.0 to (from −2.9 to ). Note that those values are rather similar for Dc and Df particles, i.e. both dust components produce on average a similar net cooling at BOA. The daily DRENET (Fig. 4c) showed values from −13.1 to (from −14.2 to ) for Dc (Df) particles during days with high daily DD DOD532 (≥0.50). During days with moderate and low daily DD DOD532 (<0.50), DRENET is always lower than () for Dc (Df). These results slightly agree with a few findings in the literature, reporting daily DD DRENET ranged from −14.6 to (Di Sarra et al., 2011; Meloni et al., 2015; Valenzuela et al., 2017). By definition, the DRENET is the sum of their SW and LW components. Therefore, those observed differences might be related to the varying balance between the DRESW (negative) and DRELW (positive). The maximum hourly DRENET was found at ARN station, showing values of −50.4 (Dc) and −43.0 (Df) W m−2. For the rest of the stations, the maximum DRENET are lower (in absolute value) than those at ARN (20 %–60 % and 30 %–65 % for Dc and Df, respectively).
The impact of fine particles to DD DRENET is mainly due to their dominating contribution in the SW (vs. LW) range, as ftr_DRESW was estimated to be around 40 % for all the stations (López-Cayuela et al., 2025), meanwhile their LW contribution is between 6 % (TRJ) and 13 % (BCN) only (ftr_DRELW, see Table 3). Indeed, the ftr_DRENET values are 45 %–50 %, close to those obtained in the SW for all the stations (see Table 4 in López-Cayuela et al., 2025).
Moreover, DREffNET values at BOA for the Df particles ranged from −128 to , which is approximately twice the Dc DREffNET (see Table 4). In addition, the DD DREffNET showed values from −78 to . Moreover, Granados-Muñoz et al. (2019) found values of DD DREffNET approximately 1.5 times lower at GRA station than those reported in this work. Sicard et al. (2022) reported Dc and DD DREffNET values approximately 2 and 1.5 times greater, respectively, at BCN station than those found in this work. Differences could be attributed to the radiative balance in DRE between the LW and SW ranges. In this work, the Dc and DD DREffNET is reduced by a factor of 1.2 and 1.4, respectively, by counting on the LW contribution, with respect to the Dc and DD DREffSW (López-Cayuela et al., 2025). Those reducing factors agree with the findings of Granados-Muñoz et al. (2019) and Sicard et al. (2022), that is, the DD DREffNET is 1.1–1.6 times lower (vs. DD DREffSW), although the Dc DREffNET is reduced by a slightly higher factor of 2.5.
3.3.3 DRENET at TOA and in ATM
Similarly to the BOA, the DRENET is negative at TOA (Fig. 4d), indicating a dust-induced net cooling effect. In addition, DRENET values are 20 %–30 % lower (in absolute units), overall, representing a less pronounced net cooling at TOA with respect to that at BOA. Regarding DRENET on average for the entire episode (, Table 4, Dc (Df) DRENET values range from −2.2 to (from −2.4 to ). As it was for at BOA, note that those values are rather similar for Dc and Df particles, i.e. both dust components produce, on average, a similar net cooling at TOA.
The mean ftr_DRENET for the entire period was approximately ranging from 49 % to 58 % between stations (Table 4), with no significant temporal change observed () at the southern stations, meanwhile slightly higher δDRENET values of approximately 3–6 % d−1 were found for TRJ and BCN.
The DD DREffNET presented nearly 22 %–34 % smaller values at TOA (between −54 and ) than those at BOA (see Table 3). In particular, DREffNET for Dc particles ranged from −37 to , which are around half of the Df DREffNET (i.e., from −91 to ). It is important to note (as highlighted in Sect. 3.3.2) that the results obtained at TOA may not be directly comparable with those of previous studies due to differences in the vertical resolution of the GAME model in the SW and LW spectral ranges above 4 km, which could introduce numerical artefacts in results (Granados-Muñoz et al., 2019).
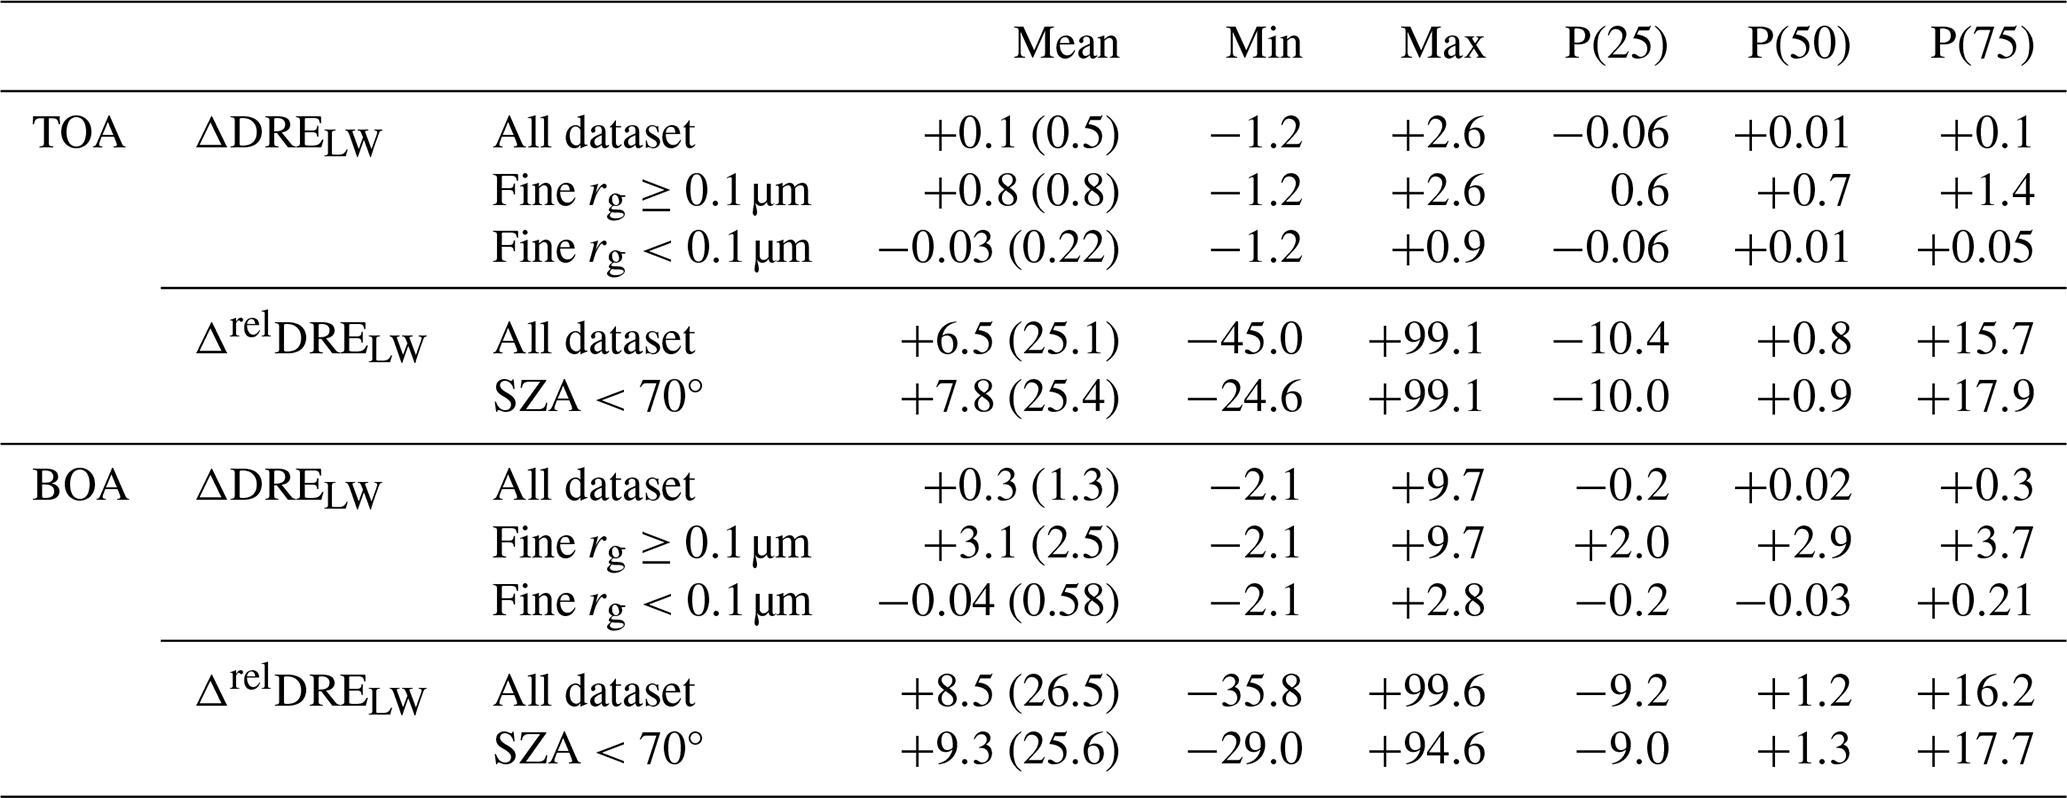
Table 5Mean (SD), maximal (Max) and minimal (Min) values together the percentiles P(25), P(50) and P(75) of ΔDRELW (W m−2) and ΔrelDRELW (%) at BOA and TOA. SD stands for the standard deviation.
Finally, a dust-induced atmospheric net warming effect can be derived as DRENET is positive in ATM. Those results on the dust direct radiative effect in the atmospheric column are reported in Table 4. For illustration, the hourly DRENET values at ATM at ARN station are shown for Df and Dc particles, respectively, in Fig. 4a and b (results for the rest of stations are shown in Figs. S9–S12). The maximum hourly DRENET values at ATM are found at ARN and TRJ, showing values of +19.4 (+14.0) and +19.2 (+11.6) W m−2 for Dc (Df) particles, respectively. For the rest of the stations, the hourly DRENET maxima at ATM ranged from +5.0 to +8.4 W m−2 and from +8.3 to +9.2 W m−2 for Df and Dc particles, respectively (see Table 4).
3.4 Differences in DRELW and DRENET as estimated using different approaches
Following the approach applied by López-Cayuela et al. (2025) for the SW range, the differences in DRELW and DRENET at all the stations were examined using the two approaches described in Sect. 2.2.
Relative differences in the LW range (ΔrelDRELW; see Eq. 7) with respect to the classical approach (DRE, see Eq. 5) are shown in Fig. 5 as a function of SZA, highlighting the dependence on DD DOD532. The entire dataset was considered, covering the period from 25 March to 7 April 2021 at all five Iberian lidar stations. As discussed in López-Cayuela et al. (2025), the significant ΔrelDRESW values found for SZA>70° are attributed to the intrinsic uncertainty in GAME simulations arising from the assumption of a plane-parallel atmosphere, and, hence, these values should be discarded. However, no clear correlation was observed between ΔrelDRELW and SZA. At BOA (TOA), mean ΔrelDRELW values of approximately +8.5 % (+6.5 %) were obtained, although relatively large SD values were observed (∼ 25 %–27 %, see Table 5). Indeed, comparable ΔrelDRELW values are found for SZA<70° (see Table 5). Moreover, no clear relationship is evident between ΔrelDRELW and DD DOD532. An analysis of percentiles further revealed consistent patterns at both levels: P(75) around +16 %, P(50) in the interval of +0.8 % to +1.2 %, and P(25) close to −10 % independently on SZA (see Table 5 and Fig. 5). These results indicate that larger absolute DRE values relative to DRE are predominantly derived when the full dataset is considered. Specifically, 75 % of the ΔrelDRELW values are higher than around −10 %, with only 25 % falling between −10 % to +1 %.
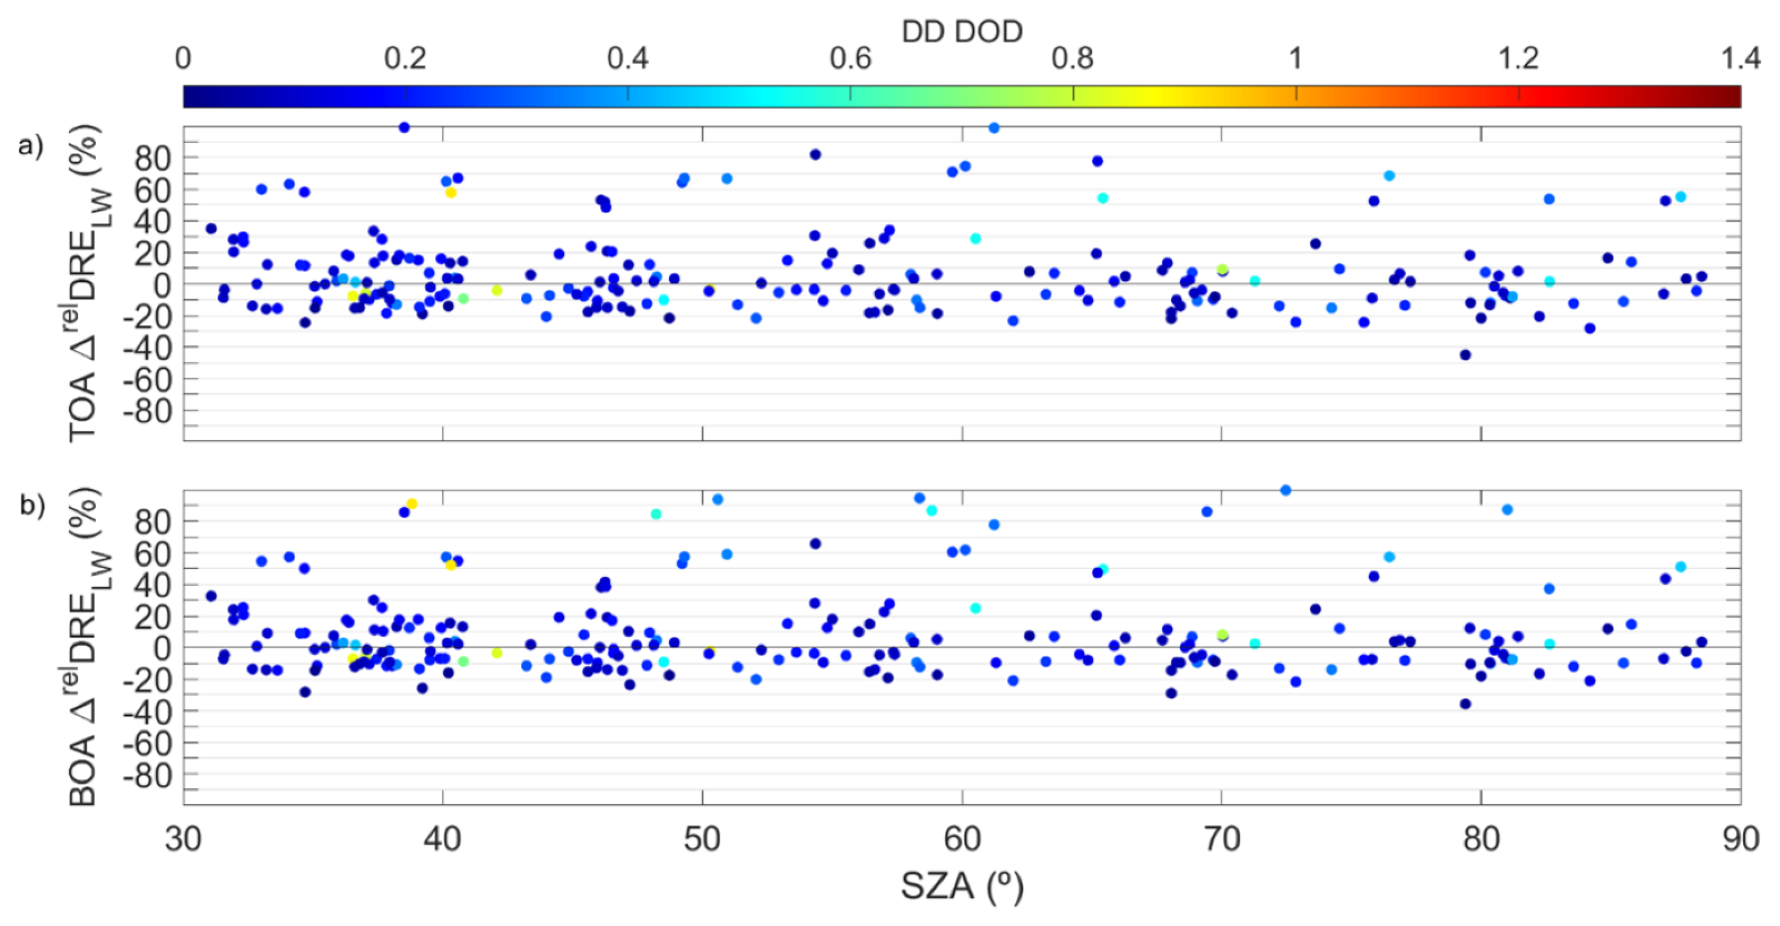
Figure 5Relative differences in DRELW (ΔrelDRELW, in %) as obtained from the two approaches (Eq. 7) as a function of SZA at: (a) TOA, and (b) BOA, for all five lidar stations from 25 March–7 April 2021. The dependence on DD DOD532 is shown as a colour-scaled bar at the top.
Regarding the absolute differences in DRELW (ΔDRELW; see Eq. 4), those computed from the full dataset were found to be approximately 3–4 times larger at BOA than TOA, with mean (SD) values of +0.3 (1.3) and +0.1 (0.5) W m−2, respectively, which are close to zero. Maximum (minimum) ΔDRELW values of +9.7 (−2.1) and +2.6 (−1.2) W m−2 were reached at BOA and TOA, respectively.
However, when the dependence of ΔDRELW on rg is examined for the fine and coarse dust, a differentiated behaviour can be observed. Figure 6 displays ΔDRELW as a function of DRE at both BOA and TOA, highlighting the dependence on fine rg. It was found that, as fine rg increases ΔDRELW shifts from negative to positive values; the same behaviour is observed depending on the coarse rg. The inflexion point (ΔDRELW=0) was estimated at thresholds of approximately 0.1 µm for fine rg (or 0.7 µm for coarse rg; data not shown). As this study focuses on the relevance of fine particles, reference will be made to the threshold related to fine rg throughout this section.
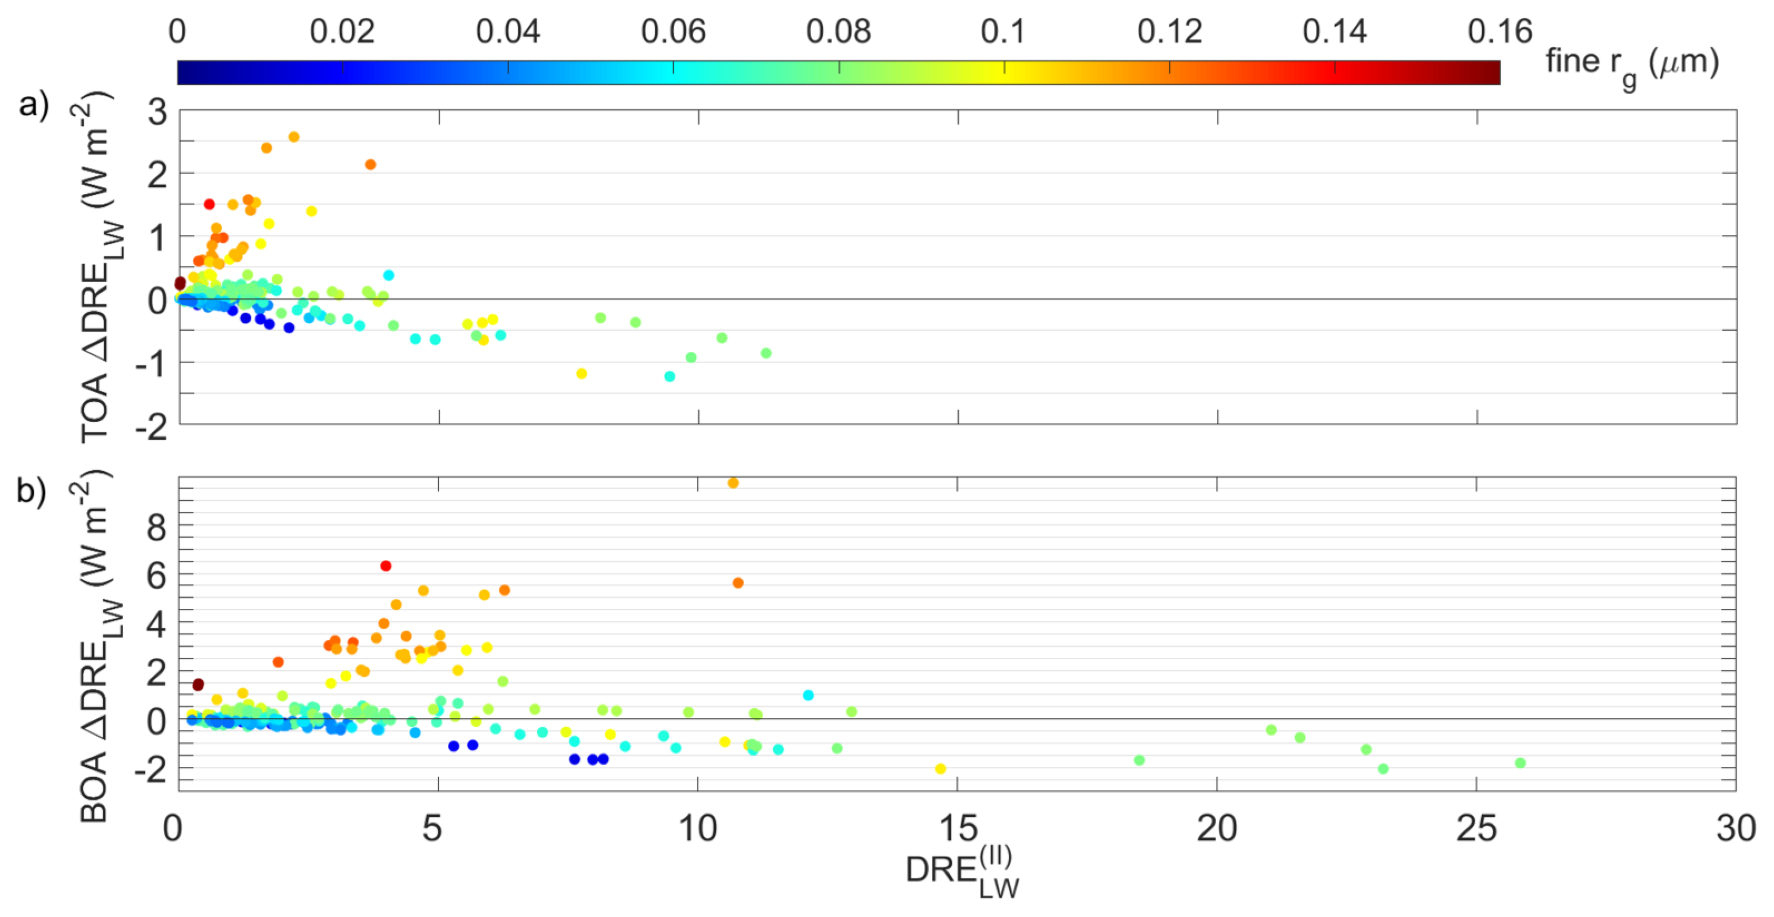
Figure 6Differences in DRELW as obtained from the two approaches (, Eq. 4; W m−2) as a function of DRE at: (a) TOA, and (b) BOA, for all five lidar stations from 25 March–7 April 2021. The dependence on the fine rg (µm) is shown as a colour-scaled bar at the top.
For cases with fine rg<0.1 µm (i.e. for rather small fine dust particles), the use of the dust-mode separation approach resulted in negative ΔDRELW at both BOA and TOA (see Fig. 6). This reveals an underestimation of DRELW values for separated dust components, leading to a less pronounced warming effect. Conversely, when fine rg≥0.1 µm, ΔDRELW tended to be positive, resulting in an overestimation of DRELW values with respect to the traditional method, and hence in a more pronounced dust-induced warming effect. Those results are aligned with Sicard et al. (2014b), who demonstrated that the radiative forcing produced by aerosols whose size distribution is dominated by the coarse mode is higher than the estimated by the classical approach. In terms of mean values, the largest differences are found for size distributions dominated by finer particles, for which ΔDRELW exhibited mean (SD) values of −0.04 (0.58) and −0.03 (0.22) W m−2 at BOA and TOA, respectively. In contrast, for cases with fine rg ≥ 0.1 µm, ΔDRELW presented mean (SD) values of +3.1 (2.5) and +0.8 (0.8) W m−2 at BOA and TOA, respectively (see Table 5).
By looking at the main percentiles P(75), P(50) and P(25), as computed from the statistical analysis of ΔDRELW (see Table 5), the data distribution is nearly symmetrical, with median values closely matching those mean ones for both fine rg intervals. This same pattern depending on fine rg is observed at both BOA and TOA, though finding lower ΔDRELW at TOA. Indeed, P(25) values indicate that 75 % of the ΔDRELW values are above +2.0 and +0.6 W m−2 at BOA and TOA, respectively, for cases with fine rg < 0.1 µm, but close to zero for the remaining cases. These discrepancies observed in dependence of the size interval at both BOA and TOA further emphasizes the critical role of particle size in modulating the vertical distribution and net effect of dust radiative forcing.
The same analysis has been performed for the differences in DRENET. Figure 7 shows ΔrelDRENET as a function of SZA for all five lidar stations and the whole dataset. In this case, a clear dependence on SZA is observed, originating from the same effect as in the SW range (López-Cayuela et al., 2025). Specifically, larger differences are found for SZA>70°, although the effect is less pronounced than in the SW range (López-Cayuela et al., 2025), as it is modulated by the contribution of the LW range to the net radiative balance. At TOA and for SZA>70°, ΔrelDRENET values are mostly positive, ranging from approximately −10 % to +65 %, with a mean (SD) value of +14.0 (20.0) % (see Fig. 7a). For the same SZA range, ΔrelDRENET at BOA showed values that ranged from around −35 % to +90 %, and with a mean (SD) value of +12.7 (22.7) % (see Fig. 7b). As explained in López-Cayuela et al. (2025), the significant ΔrelDRENET found for SZA>70° are associated to the intrinsic uncertainty in GAME simulations resulting from the model assumption of a plane-parallel atmosphere, and hence those values should be discarded.
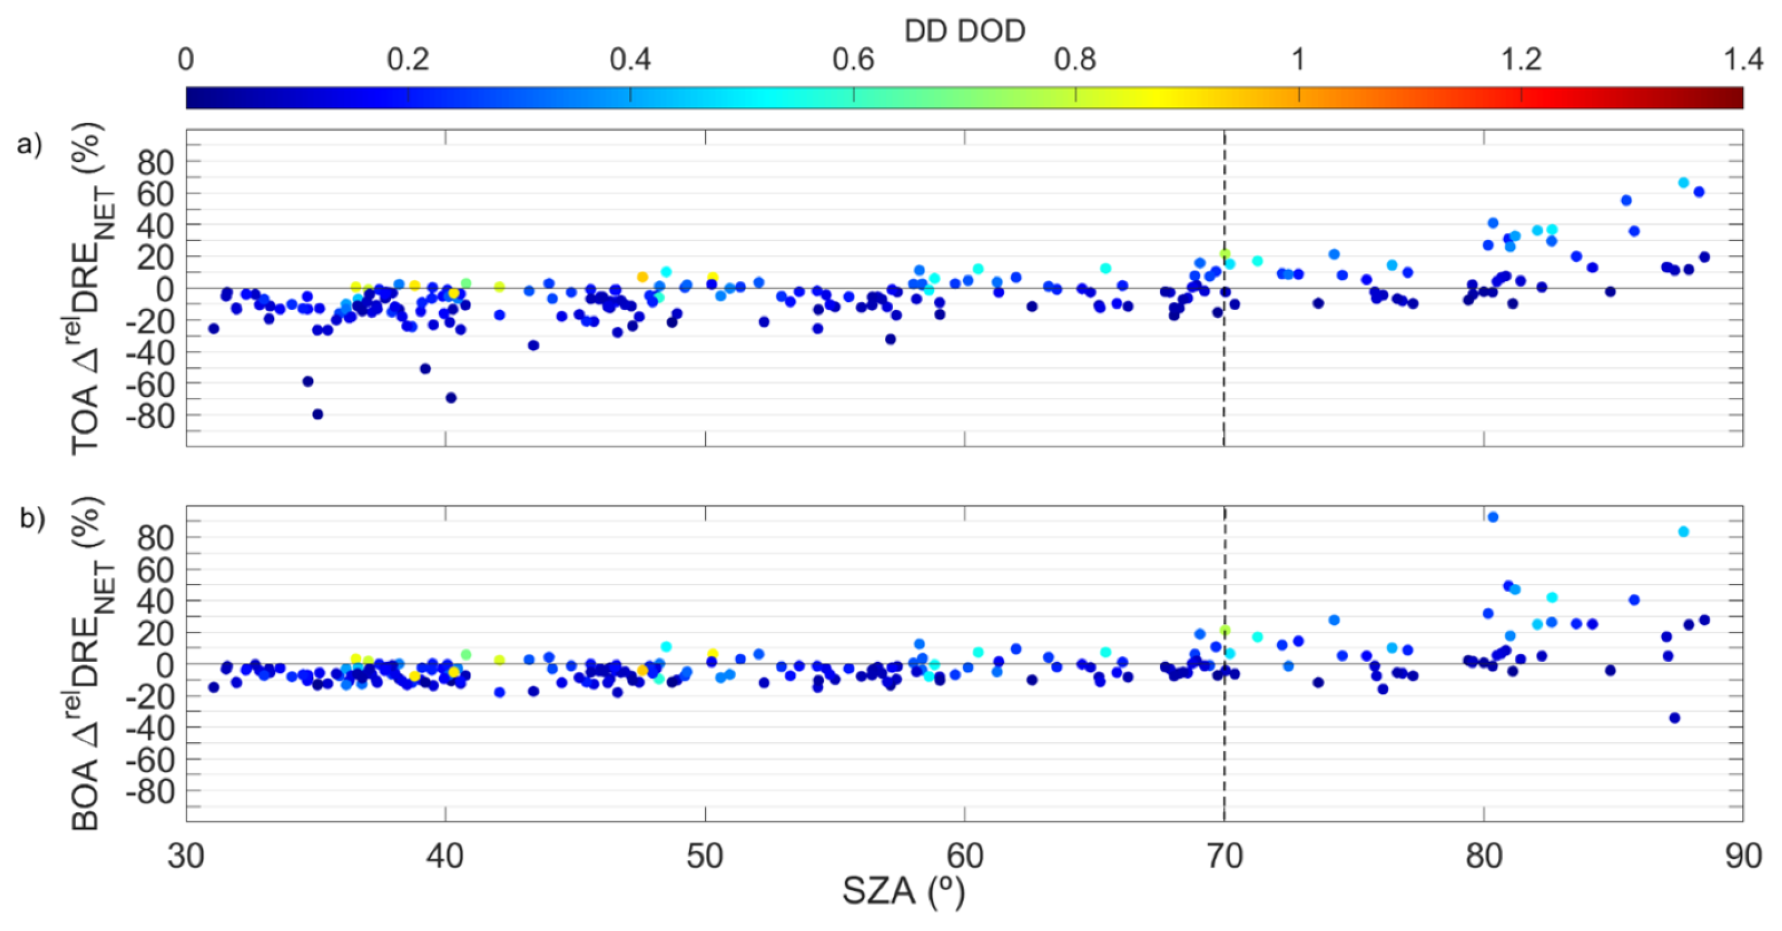
Figure 7The same as Fig. 5, but for DRENET (ΔrelDRENET, in %). The vertical dashed black line denotes SZA=70°.
Thus, once disregarding values of ΔrelDRENET for SZA>70°, ΔrelDRENET are mostly negative at both BOA and TOA, showing mean (SD) values of −4.8 (6.6) % and −8.5 (13.0) %, respectively. This is also corroborated by looking at the percentiles P(25) and P(75), which show values, respectively, of −9.6 % and −1.6 % at BOA, and −13.4 % and −1.2 % at TOA (see Table 6). Indeed, those results indicate that 75 % of ΔrelDRENET values are below around −2 % and −1 % at BOA and TOA, respectively, with minima of −18.2 % and −80 %. This represents, as DRENET is negative, a less pronounced net cooling at both BOA and TOA when the Df and Dc contribution is separately (vs. total dust) accounted for and showing larger differences at TOA (vs. BOA).
Table 6The same as Table 5, but for ΔDRENET (W m−2) and ΔrelDRENET (%).
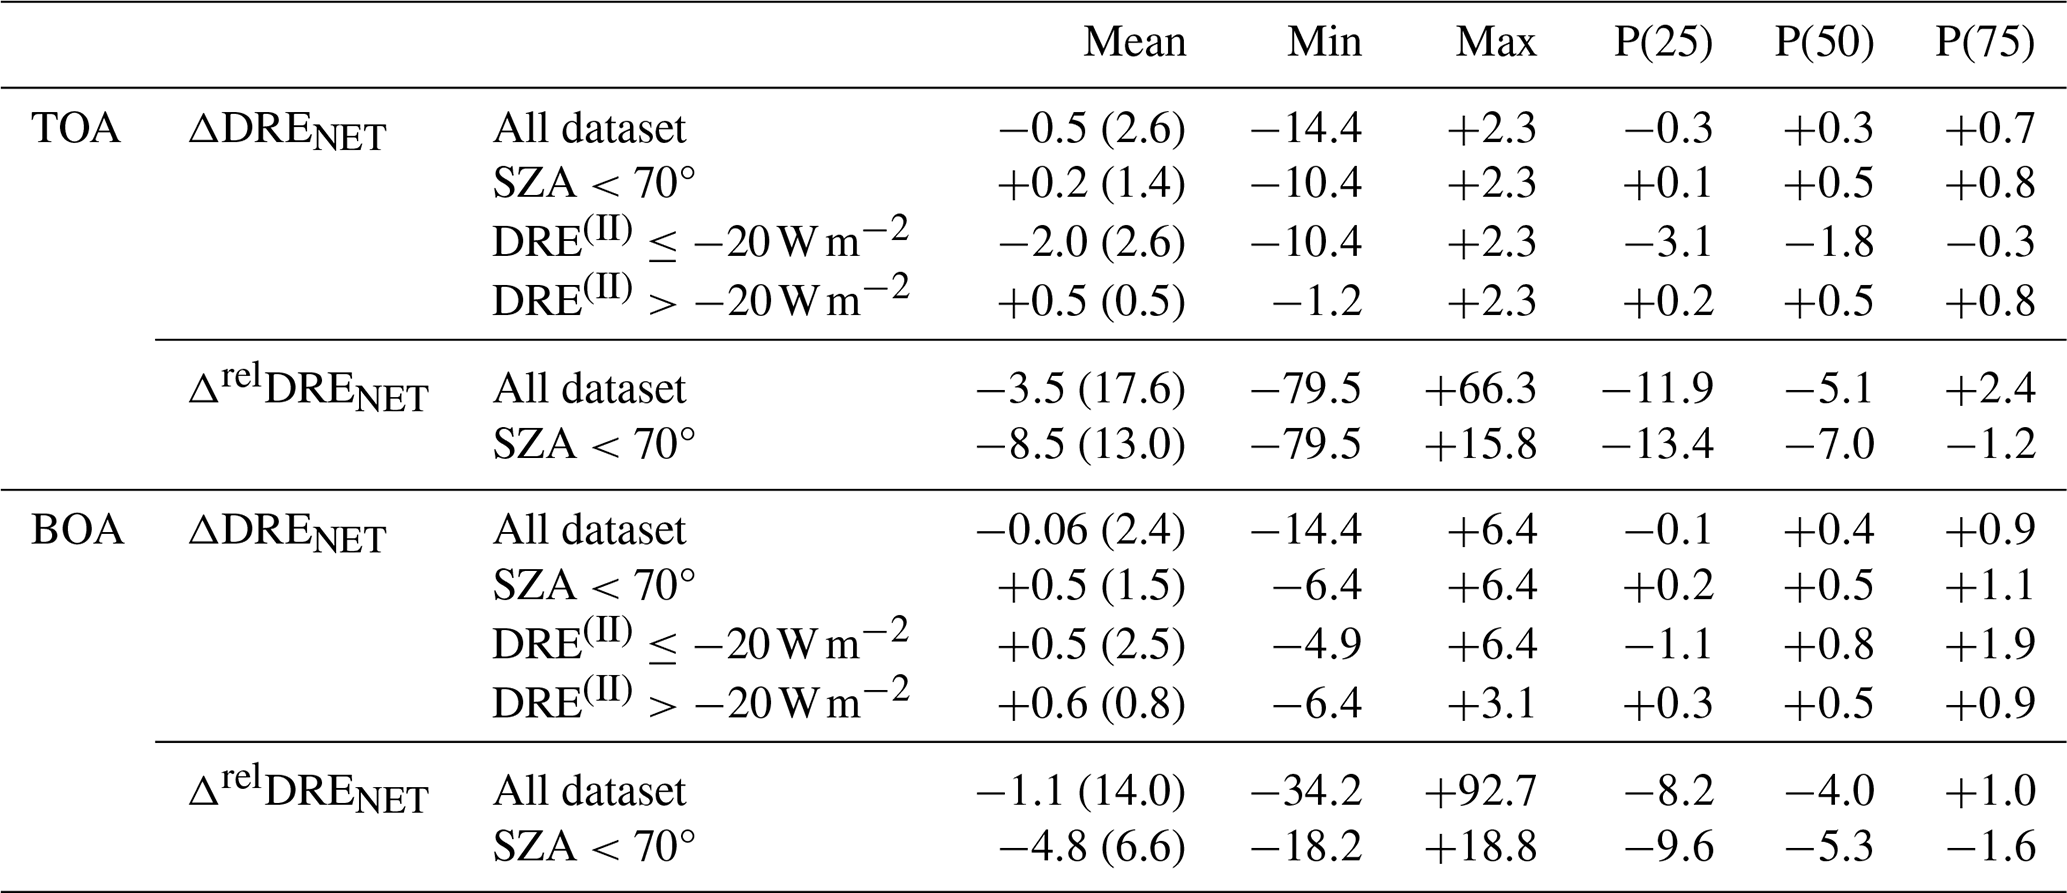
Finally, Fig. 8 shows the differences in DRENET (ΔDRENET) obtained from the two approaches at both BOA and TOA for all five lidar stations. It should be noted that absolute ΔDRENET tend to increase as DOD532 increases. In general, ΔDRENET were mostly close to zero at lower DOD (<0.2), and increased somewhat at moderate/high-dust-load conditions (DOD > 0.50). Indeed, those differences in DRENET reached minimum (maximum) values of −6.4 (+6.4) and −10.4 (+2.3) W m−2, respectively, at both BOA and TOA for SZA < 70°, showing positive (and close to zero) mean (SD) values of +0.5 (1.5) and +0.2 (1.4) W m−2. This can be corroborated by looking at the percentiles: 75 % of ΔDRENET values are mostly positive (i.e., and +0.1 W m−2 at BOA and TOA, respectively). Table 6 shows all those values. Moreover, it should be noted that a differentiated behaviour is observed around a DRENET threshold of . In particular, when DRE, similar low mean ΔDRENET values are obtained at BOA () and TOA (). However, for DRE, corresponding to higher dust load conditions, ΔDRENET show positive mean values at BOA () and negative mean values at TOA (). Moreover, as shown in Table 6, 75 % of ΔDRENET are above at BOA, and below at TOA. Overall, these results would indicate a less pronounced net cooling at BOA in contrast of a more pronounced net cooling at TOA when the separation contribution of the Df and Dc particles (vs. total dust) is regarded under high dusty conditions. This highlights a potential modulation of the dust impact in the atmosphere, which could potentially be able to produce an atmospheric net cooling (contrary to what stated in Sect. 3.3). However, those final remarks should be carefully regarded as only 8 % of those examined DRENET profiles correspond to DOD532 values greater than 0.5.
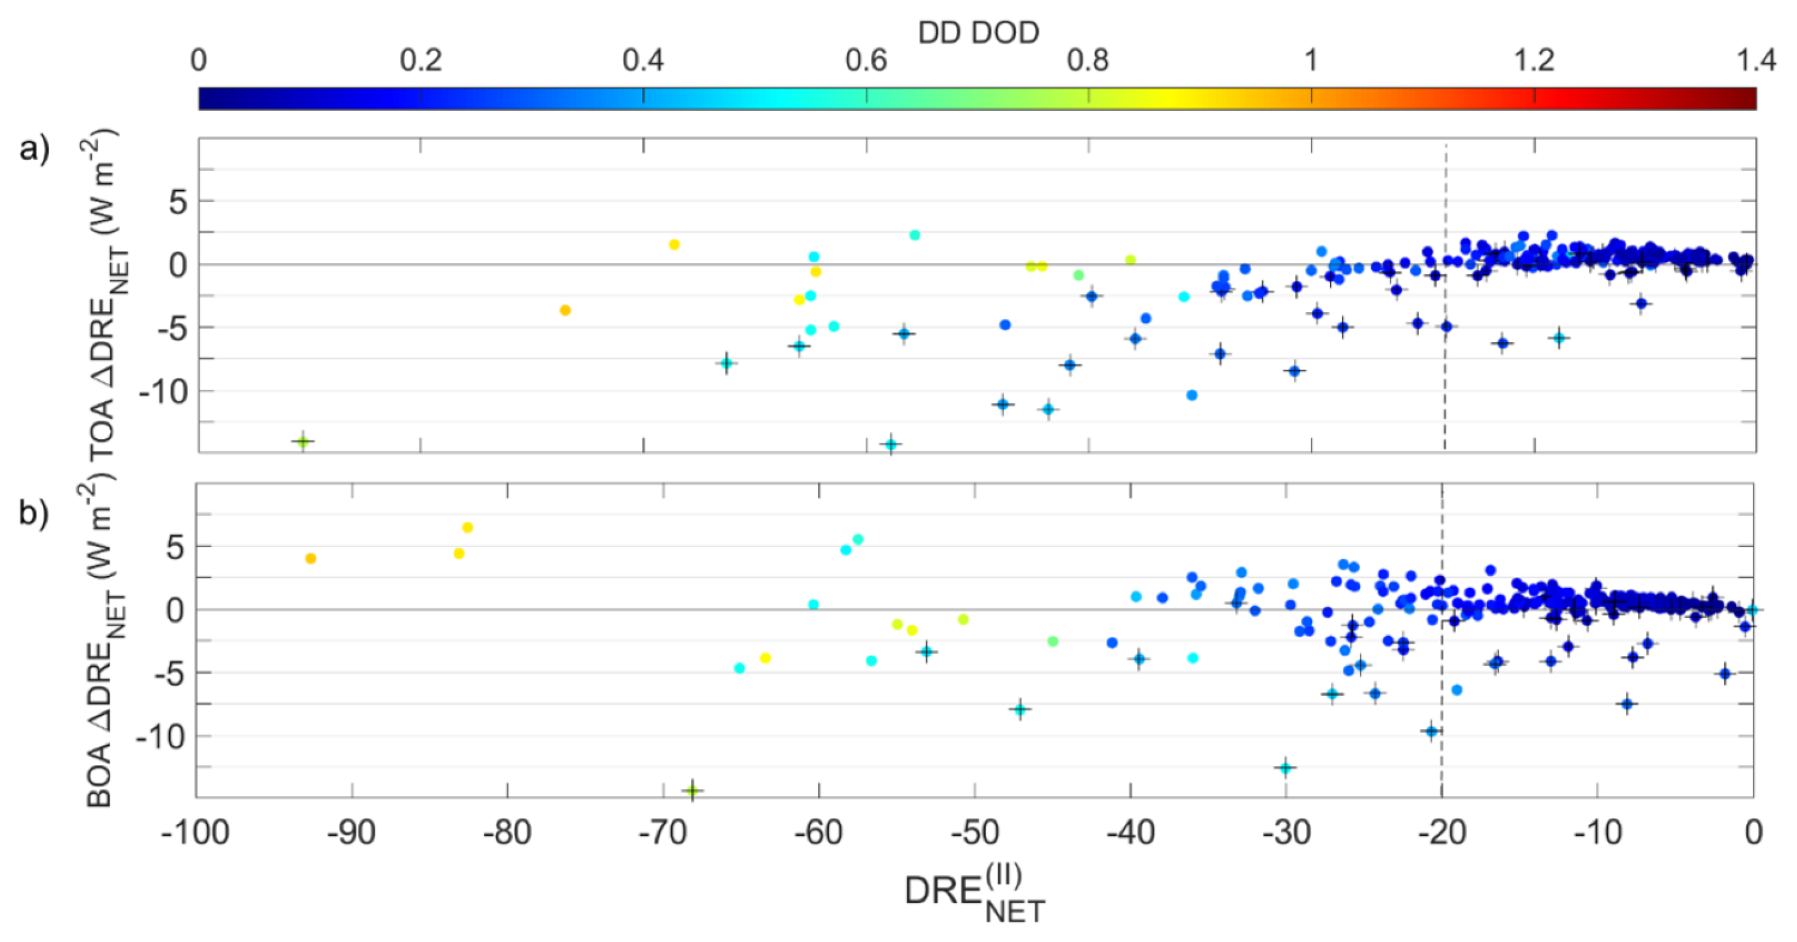
Figure 8Differences in DRENET as obtained from the two approaches (; Eq. 4; W m−2) at (a) TOA, and (b) BOA, for all five lidar stations from 25 March–7 April 2021. The dependence on the DD DOD532 is shown as a colour-scaled bar at the top. Data for SZA>70° are highlighted by cross symbols. The vertical dashed line indicates DRE.
3.5 Aerosol heating rate
The vertical aerosol heating rate (AHR) has been computed in the SW and LW range (see Sect. 2.2, Eq. 8) for all the dust components (DD, Df, Dc). Maxima of the hourly AHR (AHRmax, K d−1) during the entire dust episode at each lidar station, along with the episode-averaged values and their corresponding altitudes, are shown in Table 7. In the SW range, the AHRSW is predominantly positive, with maximum values within the dust layer, indicating a warming effect in the atmosphere. On the contrary, near the surface, AHRSW are mostly negative (cooling effect). Since the fine-to-total AHR ratio in the SW (ftr_AHRSW) remains nearly constant for all stations (around 30 % within the dust layer; see Table 7), the discussion primarily focused on DD AHRSW (for clarity, Fig. S13 in the Supplement shows the AHRSW at the five Iberian lidar stations). As stated in several works, the AHRSW is linked to the vertical distribution of the dust extinction, and its magnitude increases with the DOD (Perrone et al., 2012; Meloni et al., 2015; Peris-Ferrús et al., 2017). An extensive study of the vertical dust extinction distribution can be found in López-Cayuela et al. (2023, 2025).
Table 7Maxima of the hourly aerosol heating rates (, K d−1) found for the entire episode at each lidar stations. Values for the fine (Dc), coarse (Dc) and total dust (DD) are shown. The episode-averaged of those (, K d−1) and their corresponding heights (, km), and the fine-to-total AHR ratio (ftr_AHRi) is also shown. The index i stands for the SW, LW and NET ranges. The standard deviation (SD) is shown in brackets.
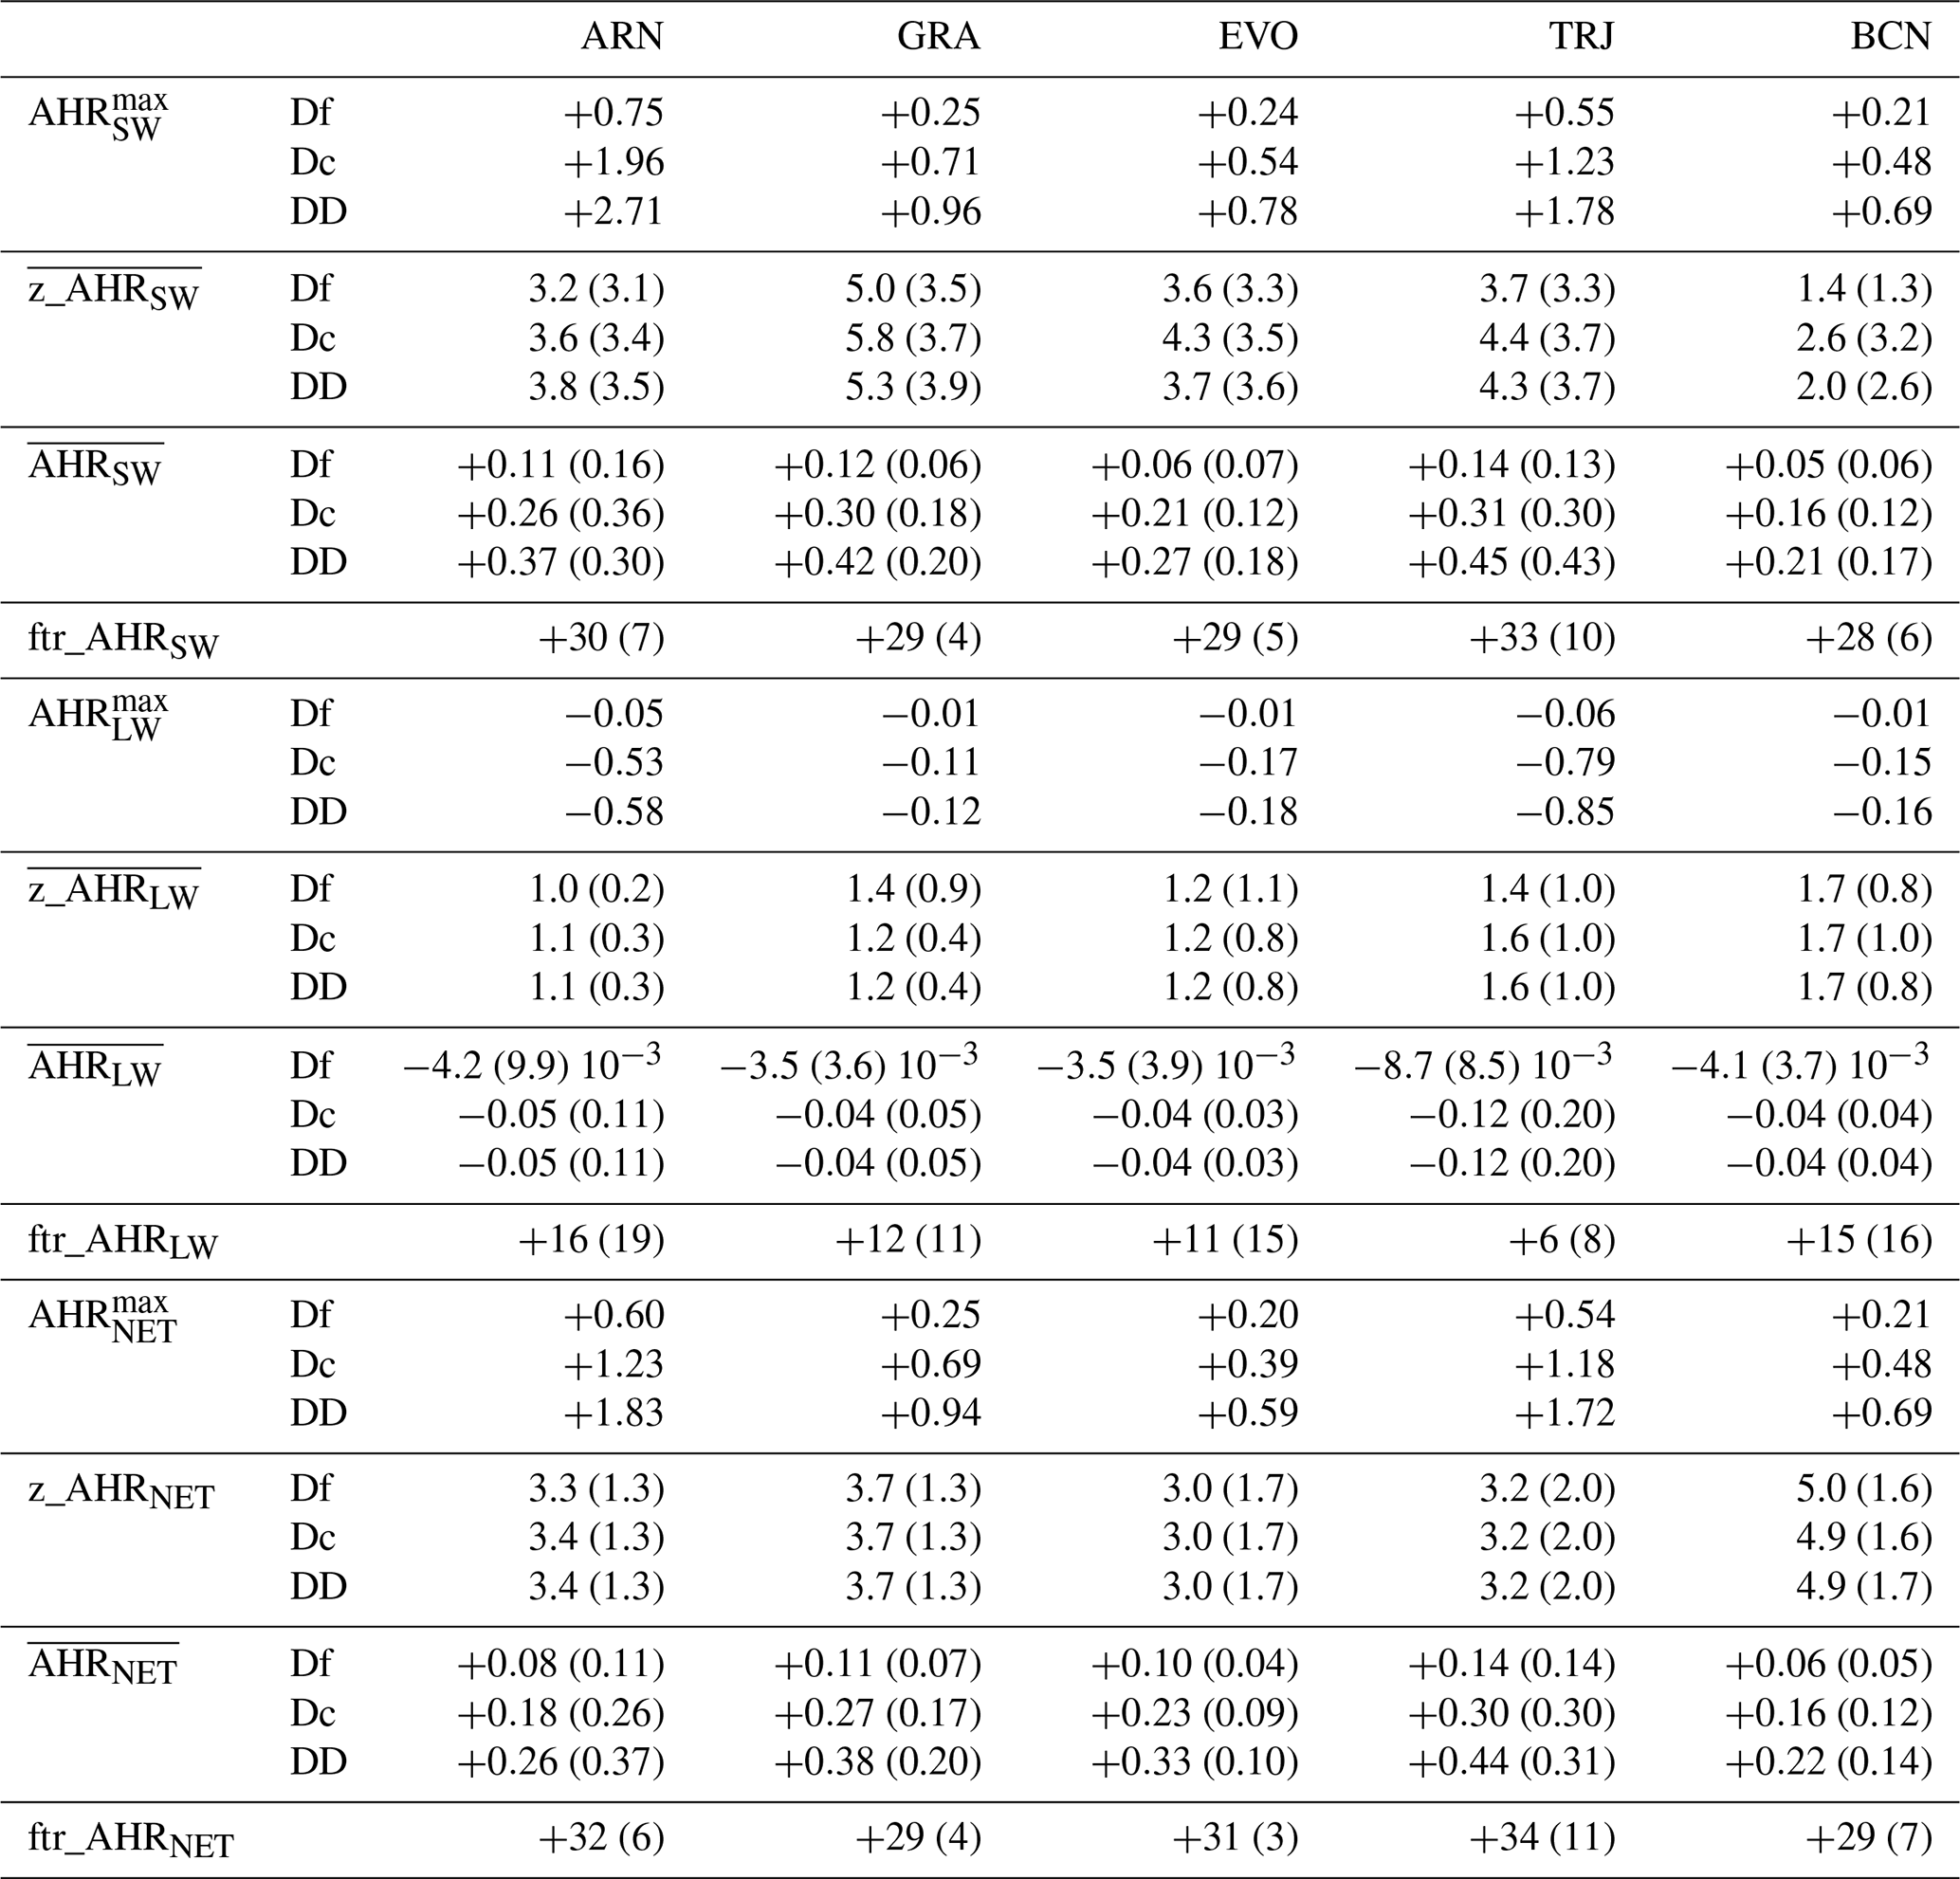
To summarize, the dust plume initially appeared below 3 km at the southern stations (ARN, GRA, EVO) on 25–26 March. On 27 March, enhanced atmospheric instability lifted the plume up to 6 km. The strongest intrusion occurred on 29–31 March, with dust extending from the surface to ∼ 7 km height. From 1 April, the plume weakened and descended to ∼ 3 km (see Fig. 2 in López-Cayuela et al., 2025). Regarding the AHRSW, the maxima varied from at the beginning of the episode, peaked on 31 March, and decreased to at the end of the episode, at altitudes of 3–5 km. At the central station (TRJ), the dust plume was initially detected below 4 km on 26 March, ascending to 10 km later that day. In the following days, plume top heights fluctuated between 6–8 km height, occasionally reaching 10 km. The strongest intrusion also occurred on 29–31 March. From 1 April, the plume subsided from 8–4 km with reduced intensity (see Fig. 2 in López-Cayuela et al., 2025). The maxima AHRSW varied at altitudes of 4–6 km from at the beginning of the dust outbreak, peaking on 31 March, to at the end of the episode. At BCN, the dust plume was persistently stratified and less intense than at the other stations, although plume tops occasionally reached 10 km. On 28 March, dust was confined to 2–3 km. On 29 March, a more complex structure formed with two distinct layers (at 2–3 and 9–10 km) in the morning and three layers (at 1–2, 4–7, 8–10 km) later in the day. Similar stratification persisted in the following days, peaking on 1 April. Afterwards, the dust intrusion gradually weakened until 6 April (see Fig. 2 in López-Cayuela et al., 2025). The maxima AHRSW varied at altitudes of 2–6 km, from until 1 April, when peaked to , to finally decreased to at the end of the episode. Averaging over the entire dusty period, the maximum hourly DD AHRSW values peaked at mean altitudes between 2.0 (BCN) and 5.3 (GRA) km, with magnitudes ranging from +0.20 to (see Table 7).
Regarding the LW range, AHRLW is predominantly negative. As the fine mode contribution to the DD AHRLW is low (ftr_AHRLW<16 %; see Table 7), the discussion will focus on DD AHRLW (the vertical distribution of DD AHRLW can be found on Fig. S14 in the Supplement). The absorption of SW radiation by the dust layer led to the emission of LW radiation in all directions, resulting in a negative AHRLW (cooling effect). Indeed, examining the vertical AHR structure, the AHRLW profiling usually peaks at lower altitudes than those for AHRSW, with maxima located below the dust layer. This behaviour was also found in previous studies (e.g. Sicard et al., 2014a). As stated in Meloni et al. (2015), when the dust intrusion is structured in multiple layers, the sign of AHRLW can switch from negative to positive below the most dust-loaded layer, depending on the absorption of the lowermost layer. Generally, when the extinction coefficient indicates a significant aerosol load in the lowermost atmosphere, AHRLW remains predominantly negative, reflecting to thermal emissions within the layer itself. Conversely, AHRLW tends to be positive when the aerosol extinction near the surface is negligible, as the primary dust layer induces a LW heating effect beneath it, attributable to the absorption of local thermal radiation emitted by the dust layer (Meloni et al., 2015). The maximum (negative) values of the hourly DD AHRLW occurred on days of strongest dust incidence, at altitudes below the main dust layer (López-Cayuela et al., 2023), ranging from −0.12 (GRA) to −0.85 (TRJ) K d−1. The period-averaged values of the maximum (negative) hourly DD AHRLW for each station and spectral range are shown in Table 7, ranging from −0.12 K d−1 at 1.6 km in TRJ to −0.04 K d−1 at 1.1–1.7 km for the rest of stations.
Note that AHR results for both SW and LW ranges are consistent with previous studies on mineral dust, which reported hourly AHRSW and AHRLW values ranging from +0.30 to , and from −0.30 to , respectively (Sicard et al., 2014a; Meloni et al., 2015; Peris-Ferrús et al., 2017; Valenzuela et al., 2017; Bazo et al., 2023).
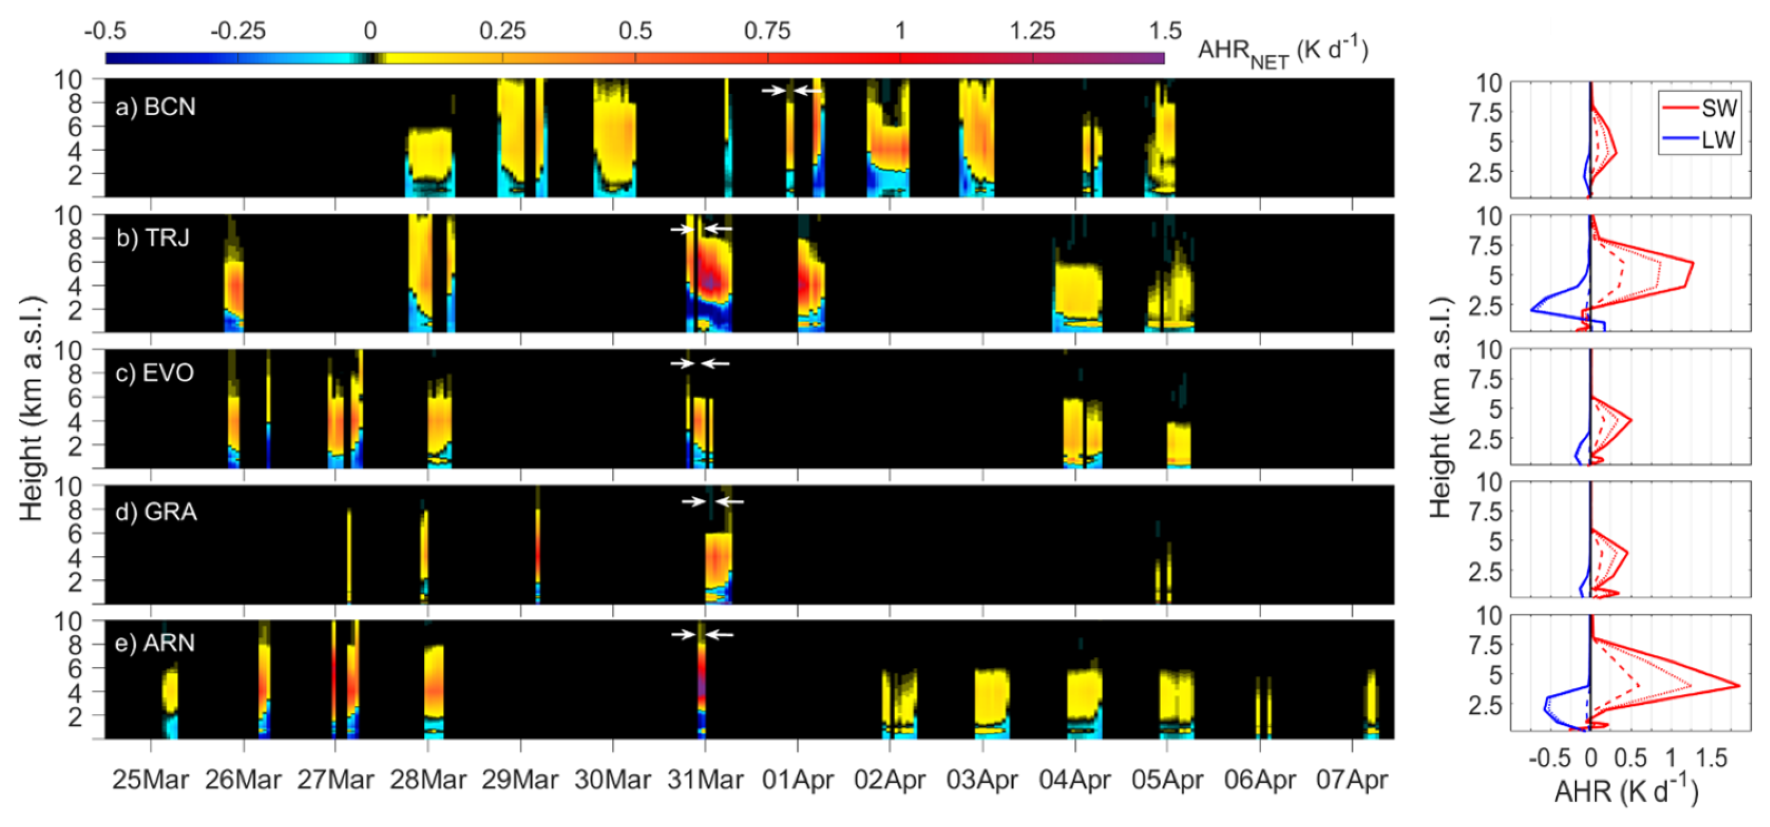
Figure 9(Left) Vertical distribution of the net aerosol heating rates (AHRNET, K d−1) corresponding to dust (DD) particles at the five Iberian lidar stations (from North-East to South-West, by decreasing latitude): (a) BCN, (b) TRJ, (c) EVO, (d) GRA and (e) ARN stations. (Right) An example of an hourly-averaged AHR profile for the SW (red) and LW (blue) range at each station. These specific profiles are marked on the left panel between white arrows. Solid, dashed and dotted lines refer to DD, Df and Dc AHRNET, respectively.
Figure 9 shows the vertical AHRNET (K d−1) for DD particles at the five Iberian lidar stations along the dust event, together with examples of hourly AHRSW and AHRLW profiling at each site. As stated for the AHR in the SW range, ftr_AHRNET is also nearly constant across all stations (nearly 30 % within the dust layer; see Table 7). AHRNET profiles indicate negative values (net cooling) in the lowermost atmosphere during the dusty period, as both LW and SW contributions are negative, which is consistent with the negative DRENET at BOA (Sect. 3.3.1). In contrast, positive AHRNET (net warming) dominates within the dust layer, where the (positive) AHRSW prevails. Figure S15 in the Supplement shows the vertical distribution of the LW-to-net AHR ratio (; %). It can be seen that the LW contribution to AHRNET is generally <10 % inside the dust layer, but nearly all of it occurs below, and to a lesser extent above, the layer (see Fig. S15). Overall, AHRNET is positive in the most dust-loaded layer and negative below and above it, typically between 2–4 km height and occasionally above 8 km, which is consistent with López-Cayuela et al. (2023). Although AHRSW dominates, AHRLW remains relevant as it modulates the strength of the net effect. As expected, the maxima values are found on day of maxima DOD, within the dust layer, and reaching values from (ARN) to +0.59 K d−1 (EVO). The dust period-averaged DD AHRNET showed values ranging from around 5 km (BCN) to around 3 km (TRJ) (see Table 7).
This work is complementary to the research conducted by López-Cayuela et al. (2023, 2025), with the aim of introducing thus the closure study about the vertical radiative impact of an intense and long-lasting Saharan dust outbreak over the Iberian Peninsula in springtime 2021. In this work, the temporal variation of the DRE in the LW range and net DRE was estimated, separating the Df and Dc contributions. For that purpose, lidar observations in five Iberian stations (namely ARN, GRA, TRJ, and BCN in Spain, and EVO in Portugal) were used. The key findings are summarised below.
The availability of DRELW computations was reduced by 18 %–45 % compared to the DRESW reported in the accompanying article due mainly to limited LST measurements, particularly at ARN and EVO. Despite some data gaps, the diurnal LST cycle was clearly observed, with maximum values between 28 and 32 °C and minor temporal variability (<0.02 °C). The fine geometric median radius rg and its standard deviation σg were larger at the southern Iberian Peninsula stations (ARN, GRA, EVO) than at TRJ (central Iberian Peninsula) and BCN (north-eastern Iberian Peninsula), indicating 10 %–30 % smaller fine particles in the latter stations. Temporal trends in rg were negligible across stations (), indicating that fine particle size remained stable during the dust outbreak. Although many stations showed stable coarse particle sizes, BCN experienced a significant increase (), which is consistent with previous studies. This may be due to dust interaction with anthropogenic pollutants and humid conditions enhancing particle growth. The coarse mode dominated the LW extinction and scattering processes, as indicated by higher g and ω values, and their coarse-to-total ratios exceeding unity, reaching up to 3–7 for the extinction. The dominant role of coarse dust in the LW spectral range (particularly 8–13 µm) implies that LW radiative forcing estimations should be mainly affected by coarse-mode contributions. These findings align with previous literature and were validated in Sect. 3.1.
On the one hand, a dust-induced warming at BOA was consistently observed for both fine and coarse dust particles, with Dc contributing the most. During the highest incidence of the dust episode, maximum hourly DRELW values at BOA reached up to (Dc) and (Df), especially at ARN and TRJ stations. The daily DRELW values were significantly lower when the dust optical depth at 532 nm (DOD532) was below 0.50, indicating a direct dependency on dust concentration. Episode-averaged DRELW values ranged from +2.6 to for Dc and from +0.2 to for Df particles. This shows that Df contributes an order of magnitude less to the LW radiative forcing. The relative contribution of Df (ftr_DRELW) was 6 %–13 % on average, but it could reach up to 41 % during some times, particularly at BCN. Despite these peaks, the Dc component remains the dominant driver of the total dust DRELW. Regarding the radiative efficiency, DREffLW values were much higher for Dc (from +24 to ) than Df (), reinforcing the greater radiative impact of coarse dust.
This study also provides a comprehensive assessment of the DRENET, which is consistently negative at both BOA and TOA, thereby reflecting a net cooling effect induced by dust. In contrast, a positive DRENET was observed within the atmospheric column, suggesting a dust-driven net warming at this level. Regarding the effect of the Df particles at both BOA and TOA, they contributed a maximum of 12 % and 30 % to the DRENET in the LW and SW ranges, respectively. The Df DRENET was similar to the Df DRESW, since the Df DRELW is nearly negligible. Indeed, ftr_DRENET was approximately 45 %–50 % at BOA, and 50 %–60 % at TOA. In addition, the DREffNET corresponding to Df particles was almost half of Dc DREffNET at both BOA and TOA. Among all stations, ARN exhibited the highest hourly DRENET magnitudes, highlighting the influence of local atmospheric and surface conditions on radiative forcing. The inclusion of the LW component was found to decrease the net radiative efficiency, with reduction factors ranging from 1.2–2.5, depending on the dust mode fraction. This underscores the importance of accounting for the SW–LW balance when quantifying the net radiative impact of dust. All these findings contribute to a better understanding of the vertical distribution of dust radiative effects and their implications for regional climate over the Iberian Peninsula.
Concerning the vertical distribution of the aerosol heating rates, the peak of AHRSW profiling occurred at a higher altitude than that of the AHRLW one. Moreover, the AHRSW was predominantly positive (warming effect within the dust layer) unlike the AHRLW, which was negative (cooling effect). Hence, in the dust layer, AHRNET displayed a warming effect. On the contrary, below (until 2–4 km) and above (beyond 8 km) the dust layer, AHRNET indicates a cooling effect. Moreover, the ftr_AHRNET in the dust layer at all the stations is on average nearly 30 %, with the contribution of the AHR in the LW range reaching a maximum of 10 % to AHRNET. Despite AHRSW dominates leading to a predominant atmospheric warming effect of dust, the relevance of the opposite (cooling) AHRLW effect relies on the potential atmospheric modulation by reducing the strength of the warming net impact.
On the other hand, as a novelty in this work, two methodologies for estimating DRE in each spectral range were examined in detail. For that purpose, differences in DRE (ΔDRE) were analysed by comparing the contribution of the two dust components computed separately (Dc, Df; approach 1) with the classical estimation (approach 2), which considers total dust as a whole. Results revealed that the classical approach underestimated the DRELW, with mean (SD) relative differences of approximately +9 % (25 %) and 8 % (26 %) at both BOA and TOA, respectively. Moreover, for cases with rather small fine dust particles, the use of dust-mode separation approach resulted in negative LW differences at both BOA and TOA, revealing an underestimation of DRELW values when using the separated dust components approach. This leads to a less pronounced warming effect unlike when fine dust radii exceed 0.1 µm, resulting in a DRELW overestimation with respect to the traditional method and, consequently, to a more pronounced dust-induced warming effect. These discrepancies observed in dependence of the size interval at both BOA and TOA further emphasizes the critical role of particle size in modulating the vertical distribution of the DRELW and then affecting the net dust radiative forcing.
Indeed, the dust-induced net effect is strongly affected by the SW range but modulated by the LW range. On average, DRENET is overestimated by the classical approach, with mean relative differences (SD) of −5 % (7 %) at BOA and −9 % (13 %) at TOA. In addition, under moderate-to-high dust conditions, the net cooling at BOA is less pronounced, whereas is stronger at TOA, when the separation contribution of the Df and Dc particles (compared to total dust) are considered. These results highlight a potential modulation of the dust impact in the atmosphere, which could actually lead to net atmospheric cooling.
The literature consistently indicates that global models underestimate the burden and extent of Dc particles, leading to an underestimation of their LW warming and reduced SW cooling effectiveness. Incorporating dust observations alters both regional and global direct radiative forcing, improving agreement between simulations and observations. While SW dominates surface cooling, Dc-induced LW contributes to warming at TOA and within the atmospheric column, further modulating semi-direct cloud effects. Dust size-resolving studies show that computing DRE in bulk overestimates (in absolute terms) SW cooling; when fine and coarse dust components are treated separately, Df and Dc contributions partly offset each other, yielding a less negative radiative forcing (i.e., less pronounced cooling) at TOA, whereas the net DRE remains strongly negative at BOA. Recent estimates highlight a globally significant positive LW direct forcing during the industrial era, previously overlooked due to the lack of realistic coarse-mode representation. Therefore, separating fine and coarse dust contributions to DRE computation is crucial, affecting the TOA radiative forcing sign, BOA attenuation magnitude, atmospheric heating profiles, and model biases linked to underrepresented Dc particles in their LW effects. Thus, the dust radiative impact, and related cloud adjustments, can be wrongly estimated in both sign and magnitude when not considering this dust component separation.
EARLINET lidar files are available from the EARLINET data portal (https://data.earlinet.org/, last access: 21 December 2021; Pappalardo et al., 2014). The accessibility of these files is limited based on the EARLINET criteria. Part of the data used in this publication were obtained as part of the AERONET network and are publicly available. For additional lidar data or information, please contact the corresponding author.
The supplement related to this article is available online at https://doi.org/10.5194/acp-26-6257-2026-supplement.
MÁL-C, CC-J, and JLG-R conceptualized the study. MÁL-C, CC-J, MS, and JLG-R were responsible for the formal analysis. MÁL-C wrote the original draft of the paper and applied the software. MÁL-C, CC-J, MS, and JLG-R carried out the investigation. MÁL-C, CC-J, MS, VS, MJG-M, AC, JAB-A, CM-P, MJC, AR-G, DB, JA-G, LA-A, and JLG-R reviewed and edited the paper. CC-J, MJG-M, AR-G, and DB were responsible for data curation. CC-J, LA-A, AC, and MJC provided the resources. CC-J and JLG-R supervised the investigation. All authors have read and agreed upon the published version of the paper.
The contact author has declared that none of the authors has any competing interests.
Publisher's note: Copernicus Publications remains neutral with regard to jurisdictional claims made in the text, published maps, institutional affiliations, or any other geographical representation in this paper. The authors bear the ultimate responsibility for providing appropriate place names. Views expressed in the text are those of the authors and do not necessarily reflect the views of the publisher.
This work was supported by the Agencia Estatal de Investigación (AEI)/Ministerio de Ciencia, Innovación y Universidades (MICIU) and FEDER “Una manera de hacer Europa” (grant nos. PID2023-151666NB-I00, PID2023-149747NB-I00, PID2024-158786NB-C21, PID2024-158786NB-C22, EQC2018-004686-P, and RED2024-153891-E), by the University of Granada (the Singular Laboratory programme LS2022-1, and the Scientific Units of Excellence Programme grant UCE-PP2017-02), and partially supported by the EU H2020 (ACTRIS GA 871115). This work was also supported by the Horizon Europe program under the Marie Sklodowska-Curie Staff Exchange Actions with the project AERIS (grant agreement No 101236396). The PT team is co-funded by national funds through FCT – Fundação para a Ciência e Tecnologia, I.P., in the framework of the project UIDB/06107 – Centro de Investigação em Ciência e Tecnologia para o Sistema Terra e Energia – CREATE. Michaël Sicard acknowledges the support of the European Commission through the REALISTIC project (GA 101086690) and CNES through the projects EECLAT, AOS, and EXTRA-SAT. María Ángeles López-Cayuela is supported by the INTA predoctoral contract programme. María Ángeles López-Cayuela thanks ATMO-ACCESS for the TNA LIRTASOM (“Lidar data in Radiative Transfer model for dust direct radiative effect estimation and evaluation against solar measurement”) project, supported by the European Commission (H2020-INFRAIA-2020-1, grant 101008004). Jesús Abril-Gago thanks the Spanish Ministry of Universities for the grant FPU 21/01436. The BCN team thanks Ellsworth J. Welton for providing the MPL unit at the Barcelona site. Ellsworth J. Welton and Sebastian A. Stewart are warmly acknowledged for their continuous help in keeping the MPL systems up to date. The authors gratefully acknowledge the PIs and technical staff of all the lidar and AERONET stations for maintenance support of the instrumentation involved in this work.
This research has been funded by the Agencia Estatal de Investigación (AEI)/Ministerio de Ciencia, Innovación y Universidades (MICIU) (grant no. PID2023-151666NB-I00/AEI/10.13039/501100011033).
This paper was edited by Zhibo Zhang and reviewed by two anonymous referees.
Abdelkader, M., Metzger, S., Mamouri, R. E., Astitha, M., Barrie, L., Levin, Z., and Lelieveld, J.: Dust–air pollution dynamics over the eastern Mediterranean, Atmos. Chem. Phys., 15, 9173–9189, https://doi.org/10.5194/acp-15-9173-2015, 2015.
Adebiyi, A. A. and Kok, J. F.: Climate models miss most of the coarse dust in the atmosphere, Science Advances, 6, eaaz9507, https://doi.org/10.1126/sciadv.aaz9507, 2020.
Ansmann, A., Mamouri, R.-E., Hofer, J., Baars, H., Althausen, D., and Abdullaev, S. F.: Dust mass, cloud condensation nuclei, and ice-nucleating particle profiling with polarization lidar: updated POLIPHON conversion factors from global AERONET analysis, Atmos. Meas. Tech., 12, 4849–4865, https://doi.org/10.5194/amt-12-4849-2019, 2019.
Antón, M., Valenzuela, A., Mateos, D., Alados, I., Foyo-Moreno, I., Olmo, F. J., and Alados-Arboledas, L.: Longwave aerosol radiative effects during an extreme desert dust event in southeastern Spain, Atmos. Res., 149, 18–23, https://doi.org/10.1016/j.atmosres.2014.05.022, 2014.
Athanasopoulou, E., Protonotariou, A., Papangelis, G., Tombrou, M., Mihalopoulos, N., and Gerasopoulos, E.: Long-range transport of Saharan dust and chemical transformations over the Eastern Mediterranean, Atmos. Environ., 140, 592–604, https://doi.org/10.1016/j.atmosenv.2016.06.041, 2016.
Bazo, E., Granados-Muñoz, M. J., Román, R., Bravo-Aranda, J. A., Cazorla, A., Valenzuela, A., González, R., Olmo, F. J., and Alados-Arboledas, L.: Evaluation of the vertically-resolved aerosol radiative effect on shortwave and longwave ranges using sun-sky photometer and ceilometer measurements, Atmos. Res., 282, 106517, https://doi.org/10.1016/j.atmosres.2022.106517, 2023.
Cachorro, V. E., Toledano, C., Prats, N., Sorribas, M., Mogo, S., Berjón, A., Torres, B., Rodrigo, R., Rosa, J. de la, and Frutos, A. M. D.: The strongest desert dust intrusion mixed with smoke over the Iberian Peninsula registered with Sun photometry, J. Geophys. Res.-Atmos., 113, https://doi.org/10.1029/2007JD009582, 2008.
Campbell, J. R., Hlavka, D. L., Welton, E. J., Flynn, C. J., Turner, D. D., Spinhirne, J. D., Scott, V. S., and Hwang, I. H.: Full-Time, Eye-Safe Cloud and Aerosol Lidar Observation at Atmospheric Radiation Measurement Program Sites: Instruments and Data Processing, J. Atmos. Ocean. Tech., 19, 431–442, https://doi.org/10.1175/1520-0426(2002)019<0431:FTESCA>2.0.CO;2, 2002.
Cazorla, A., Casquero-Vera, J. A., Román, R., Guerrero-Rascado, J. L., Toledano, C., Cachorro, V. E., Orza, J. A. G., Cancillo, M. L., Serrano, A., Titos, G., Pandolfi, M., Alastuey, A., Hanrieder, N., and Alados-Arboledas, L.: Near-real-time processing of a ceilometer network assisted with sun-photometer data: monitoring a dust outbreak over the Iberian Peninsula, Atmos. Chem. Phys., 17, 11861–11876, https://doi.org/10.5194/acp-17-11861-2017, 2017.
Córdoba-Jabonero, C., Sicard, M., Ansmann, A., del Águila, A., and Baars, H.: Separation of the optical and mass features of particle components in different aerosol mixtures by using POLIPHON retrievals in synergy with continuous polarized Micro-Pulse Lidar (P-MPL) measurements, Atmos. Meas. Tech., 11, 4775–4795, https://doi.org/10.5194/amt-11-4775-2018, 2018.
Córdoba-Jabonero, C., Sicard, M., del Águila, A., Jiménez, M., and Zorzano, M.-P.: Performance of a dust model to predict the vertical mass concentration of an extreme Saharan dust event in the Iberian Peninsula: Comparison with continuous, elastic, polarization-sensitive lidars, Atmos. Environ., 214, 116828, https://doi.org/10.1016/j.atmosenv.2019.116828, 2019.
Córdoba-Jabonero, C., Sicard, M., López-Cayuela, M.-Á., Ansmann, A., Comerón, A., Zorzano, M.-P., Rodríguez-Gómez, A., and Muñoz-Porcar, C.: Aerosol radiative impact during the summer 2019 heatwave produced partly by an inter-continental Saharan dust outbreak – Part 1: Short-wave dust direct radiative effect, Atmos. Chem. Phys., 21, 6455–6479, https://doi.org/10.5194/acp-21-6455-2021, 2021a.
Córdoba-Jabonero, C., Ansmann, A., Jiménez, C., Baars, H., López-Cayuela, M.-Á., and Engelmann, R.: Experimental assessment of a micro-pulse lidar system in comparison with reference lidar measurements for aerosol optical properties retrieval, Atmos. Meas. Tech., 14, 5225–5239, https://doi.org/10.5194/amt-14-5225-2021, 2021b.
Di Biagio, C., Boucher, H., Caquineau, S., Chevaillier, S., Cuesta, J., and Formenti, P.: Variability of the infrared complex refractive index of African mineral dust: experimental estimation and implications for radiative transfer and satellite remote sensing, Atmos. Chem. Phys., 14, 11093–11116, https://doi.org/10.5194/acp-14-11093-2014, 2014.
Di Biagio, C., Formenti, P., Balkanski, Y., Caponi, L., Cazaunau, M., Pangui, E., Journet, E., Nowak, S., Caquineau, S., Andreae, M. O., Kandler, K., Saeed, T., Piketh, S., Seibert, D., Williams, E., and Doussin, J.-F.: Global scale variability of the mineral dust long-wave refractive index: a new dataset of in situ measurements for climate modeling and remote sensing, Atmos. Chem. Phys., 17, 1901–1929, https://doi.org/10.5194/acp-17-1901-2017, 2017.
di Sarra, A., Di Biagio, C., Meloni, D., Monteleone, F., Pace, G., Pugnaghi, S., and Sferlazzo, D.: Shortwave and longwave radiative effects of the intense Saharan dust event of 25–26 March 2010 at Lampedusa (Mediterranean Sea), J. Geophys. Res.-Atmos., 116, https://doi.org/10.1029/2011JD016238, 2011.
Dubuisson, P., Buriez, J. C., and Fouquart, Y.: High spectral resolution solar radiative transfer in absorbing and scattering media: Application to the satellite simulation, J. Quant. Spectrosc. Ra., 55, 103–126, https://doi.org/10.1016/0022-4073(95)00134-4, 1996.
Dubuisson, P., Dessailly, D., Vesperini, M., and Frouin, R.: Water vapor retrieval over ocean using near-infrared radiometry, J. Geophys. Res.-Atmos., 109, https://doi.org/10.1029/2004JD004516, 2004.
Dufresne, J.-L., Gautier, C., Ricchiazzi, P., and Fouquart, Y.: Longwave scattering effects of mineral aerosols, J. Atmos. Sci., 59, 1959–1966, https://doi.org/10.1175/1520-0469(2002)059<1959:LSEOMA>2.0.CO;2, 2002.
Fernández, A. J., Sicard, M., Costa, M. J., Guerrero-Rascado, J. L., Gómez-Amo, J. L., Molero, F., Barragán, R., Basart, S., Bortoli, D., Bedoya-Velásquez, A. E., Utrillas, M. P., Salvador, P., Granados-Muñoz, M. J., Potes, M., Ortiz-Amezcua, P., Martínez-Lozano, J. A., Artíñano, B., Muñoz-Porcar, C., Salgado, R., Román, R., Rocadenbosch, F., Salgueiro, V., Benavent-Oltra, J. A., Rodríguez-Gómez, A., Alados-Arboledas, L., Comerón, A., and Pujadas, M.: Extreme, wintertime Saharan dust intrusion in the Iberian Peninsula: Lidar monitoring and evaluation of dust forecast models during the February 2017 event, Atmos. Res., 228, 223–241, https://doi.org/10.1016/j.atmosres.2019.06.007, 2019.
Flynn, C. J., Mendoza, A., Zheng, Y., and Mathur, S.: Novel Polarization-Sensitive Micropulse Lidar Measurement Technique, Opt. Express., 15, 2785–2790, https://doi.org/10.1364/OE.15.002785, 2007.
Fouquart, Y., Bonnel, B., Brogniez, G., Buriez, J. C., Smith, L., Morcrette, J. J., and Cerf, A.: Observations of Saharan aerosols: Results of ECLATS field experiment. Part II: Broadband radiative characteristics of the aerosols and vertical radiative flux divergence, J. Appl. Meteorol. Clim., 26, 38–52, https://doi.org/10.1175/1520-0450(1987)026<0038:OOSARO>2.0.CO;2, 1987.
Granados-Muñoz, M. J., Sicard, M., Román, R., Benavent-Oltra, J. A., Barragán, R., Brogniez, G., Denjean, C., Mallet, M., Formenti, P., Torres, B., and Alados-Arboledas, L.: Impact of mineral dust on shortwave and longwave radiation: evaluation of different vertically resolved parameterizations in 1-D radiative transfer computations, Atmos. Chem. Phys., 19, 523–542, https://doi.org/10.5194/acp-19-523-2019, 2019.
Guerrero-Rascado, J. L., Ruiz, B., and Alados-Arboledas, L.: Multi-spectral Lidar characterization of the vertical structure of Saharan dust aerosol over southern Spain, Atmos. Environ., 42, 2668–2681, https://doi.org/10.1016/j.atmosenv.2007.12.062, 2008.
Guerrero-Rascado, J. L., Olmo, F. J., Avilés-Rodríguez, I., Navas-Guzmán, F., Pérez-Ramírez, D., Lyamani, H., and Alados Arboledas, L.: Extreme Saharan dust event over the southern Iberian Peninsula in september 2007: active and passive remote sensing from surface and satellite, Atmos. Chem. Phys., 9, 8453–8469, https://doi.org/10.5194/acp-9-8453-2009, 2009.
Kok, J. F., Ridley, D. A., Zhou, Q., Miller, R. L., Zhao, C., Heald, C. L., Ward, D. S., Albani, S., and Haustein, K.: Smaller desert dust cooling effect estimated from analysis of dust size and abundance, Nat. Geosci., 10, 274–278, https://doi.org/10.1038/ngeo2912, 2017.
Kok, J. F., Storelvmo, T., Karydis, V. A., Adebiyi, A. A., Mahowald, N. M., Evan, A. T., He, C., and Leung, D. M.: Mineral dust aerosol impacts on global climate and climate change, Nat. Rev. Earth Environ., 4, 71–86, https://doi.org/10.1038/s43017-022-00379-5, 2023.
Krekov, G. M.: Models of atmospheric aerosols, in: Aerosol effects on climate, A93-39529, 15–42, 9–72, , 1993.
Lacis, A. A. and Oinas, V.: A description of the correlated k distribution method for modeling nongray gaseous absorption, thermal emission, and multiple scattering in vertically inhomogeneous atmospheres, J. Geophys. Res.-Atmos., 96, 9027–9063, https://doi.org/10.1029/90JD01945, 1991.
López-Cayuela, M. Á., Córdoba-Jabonero, C., Bermejo-Pantaleón, D., Sicard, M., Salgueiro, V., Molero, F., Carvajal-Pérez, C. V., Granados-Muñoz, M. J., Comerón, A., Couto, F. T., Barragán, R., Zorzano, M.-P., Bravo-Aranda, J. A., Muñoz-Porcar, C., Costa, M. J., Artíñano, B., Rodríguez-Gómez, A., Bortoli, D., Pujadas, M., Abril-Gago, J., Alados-Arboledas, L., and Guerrero-Rascado, J. L.: Vertical characterization of fine and coarse dust particles during an intense Saharan dust outbreak over the Iberian Peninsula in springtime 2021, Atmos. Chem. Phys., 23, 143–161, https://doi.org/10.5194/acp-23-143-2023, 2023.
López-Cayuela, M.-Á., Córdoba-Jabonero, C., Sicard, M., Abril-Gago, J., Salgueiro, V., Comerón, A., Granados-Muñoz, M. J., Costa, M. J., Muñoz-Porcar, C., Bravo-Aranda, J. A., Bortoli, D., Rodríguez-Gómez, A., Alados-Arboledas, L., and Guerrero-Rascado, J. L.: Fine and coarse dust radiative impact during an intense Saharan dust outbreak over the Iberian Peninsula – short-wave direct radiative effect, Atmos. Chem. Phys., 25, 3213–3231, https://doi.org/10.5194/acp-25-3213-2025, 2025.
Mahowald, N. M., Kloster, S., Engelstaedter, S., Moore, J. K., Mukhopadhyay, S., McConnell, J. R., Albani, S., Doney, S. C., Bhattacharya, A., Curran, M. A. J., Flanner, M. G., Hoffman, F. M., Lawrence, D. M., Lindsay, K., Mayewski, P. A., Neff, J., Rothenberg, D., Thomas, E., Thornton, P. E., and Zender, C. S.: Observed 20th century desert dust variability: impact on climate and biogeochemistry, Atmos. Chem. Phys., 10, 10875–10893, https://doi.org/10.5194/acp-10-10875-2010, 2010.
Mallet, M., Pont, V., Liousse, C., Gomes, L., Pelon, J., Osborne, S., Haywood, J., Roger, J. C., Dubuisson, P., Mariscal, A., Thouret, V., and Goloub, P.: Aerosol direct radiative forcing over Djougou (northern Benin) during the African Monsoon Multidisciplinary Analysis dry season experiment (Special Observation Period-0), J. Geophys. Res.-Atmos., 113, https://doi.org/10.1029/2007JD009419, 2008.
Mamouri, R. E. and Ansmann, A.: Fine and coarse dust separation with polarization lidar, Atmos. Meas. Tech., 7, 3717–3735, https://doi.org/10.5194/amt-7-3717-2014, 2014.
Mamouri, R.-E. and Ansmann, A.: Potential of polarization/Raman lidar to separate fine dust, coarse dust, maritime, and anthropogenic aerosol profiles, Atmos. Meas. Tech., 10, 3403–3427, https://doi.org/10.5194/amt-10-3403-2017, 2017.
Meloni, D., Junkermann, W., Sarra, A. di, Cacciani, M., Silvestri, L. D., Iorio, T. D., Estellés, V., Gómez-Amo, J. L., Pace, G., and Sferlazzo, D. M.: Altitude-resolved shortwave and longwave radiative effects of desert dust in the Mediterranean during the GAMARF campaign: Indications of a net daily cooling in the dust layer, J. Geophys. Res.-Atmos., 120, 3386–3407, https://doi.org/10.1002/2014JD022312, 2015.
Obregón, M. A., Pereira, S., Salgueiro, V., Costa, M. J., Silva, A. M., Serrano, A., and Bortoli, D.: Aerosol radiative effects during two desert dust events in August 2012 over the Southwestern Iberian Peninsula, Atmos. Res., 153, 404–415, https://doi.org/10.1016/j.atmosres.2014.10.007, 2015.
Papanikolaou, C.-A., Papayannis, A., Gidarakou, M., Abdullaev, S. F., Ajtai, N., Baars, H., Balis, D., Bortoli, D., Bravo-Aranda, J. A., Collaud-Coen, M., de Rosa, B., Dionisi, D., Eleftheratos, K., Engelmann, R., Floutsi, A. A., Abril-Gago, J., Goloub, P., Giuliano, G., Gumà-Claramunt, P., Hofer, J., Hu, Q., Komppula, M., Marinous, E., Martucci, G., Mattis, I., Michailidis, K., Muñoz-Porcar, C., Mylonaki, M., Mytilinaios, M., Nicolae, D., Rodríguez-Gómez, A., Salgueiro, V., Shang, X., Staachlewska, I. S., Stefanie, H. I., Szczepanik, D., M., Trickl, T., Vogelmann, H., and Voudouri, K. A.: Large-Scale Network-Based Observations of a Saharan Dust Event across the European Continent in Spring 2022, Remote Sens.-Basel, 16, 3350, https://doi.org/10.3390/rs16173350, 2024.
Pappalardo, G., Amodeo, A., Apituley, A., Comeron, A., Freudenthaler, V., Linné, H., Ansmann, A., Bösenberg, J., D'Amico, G., Mattis, I., Mona, L., Wandinger, U., Amiridis, V., Alados-Arboledas, L., Nicolae, D., and Wiegner, M.: EARLINET: towards an advanced sustainable European aerosol lidar network, Atmos. Meas. Tech., 7, 2389–2409, https://doi.org/10.5194/amt-7-2389-2014, 2014.
Peris-Ferrús, C., Gómez-Amo, J. L., Marcos, C., Freile-Aranda, M. D., Utrillas, M. P., and Martínez-Lozano, J. A.: Heating rate profiles and radiative forcing due to a dust storm in the Western Mediterranean using satellite observations, Atmos. Environ., 160, 142–153, https://doi.org/10.1016/j.atmosenv.2017.04.023, 2017.
Perrone, M. R., Tafuro, A. M., and Kinne, S.: Dust layer effects on the atmospheric radiative budget and heating rate profiles, Atmos. Environ., 59, 344–354, https://doi.org/10.1016/j.atmosenv.2012.06.012, 2012.
Pilewskie, P.: Aerosols heat up, Nature, 448, 541–542, https://doi.org/10.1038/448541a, 2007.
Preißler, J., Wagner, F., Pereira, S., and Guerrero-Rascado, J. L.: Multi-instrumental observation of an exceptionally strong Saharan dust outbreak over Portugal, J. Geophys. Res., 116, D24204, 1–12, https://doi.org/10.1029/2011JD016527, 2011.
Querol, X., Tobías, A., Pérez, N., Karanasiou, A., Amato, F., Stafoggia, M., Pérez García-Pando, C., Ginoux, P., Forastiere, F., Gumy, S., Mudu, P., and Alastuey, A.: Monitoring the impact of desert dust outbreaks for air quality for health studies, Environ. Int., 130, 104867, https://doi.org/10.1016/j.envint.2019.05.061, 2019.
Roger, J. C., Mallet, M., Dubuisson, P., Cachier, H., Vermote, E., Dubovik, O., and Despiau, S.: A synergetic approach for estimating the local direct aerosol forcing: Application to an urban zone during the Expérience sur Site pour Contraindre les Modèles de Pollution et de Transport d'Emission (ESCOMPTE) experiment, J. Geophys. Res.-Atmos., 111, https://doi.org/10.1029/2005JD006361, 2006.
Sicard, M., Mallet, M., García-Vizcaíno, D., Comerón, A., Rocadenbosch, F., Dubuisson, P., and Muñoz-Porcar, C.: Intense dust and extremely fresh biomass burning outbreak in Barcelona, Spain: characterization of their optical properties and estimation of their direct radiative forcing, Environ. Res. Lett., 7, 034016, https://doi.org/10.1088/1748-9326/7/3/034016, 2012.
Sicard, M., Bertolín, S., Mallet, M., Dubuisson, P., and Comerón, A.: Estimation of mineral dust long-wave radiative forcing: sensitivity study to particle properties and application to real cases in the region of Barcelona, Atmos. Chem. Phys., 14, 9213–9231, https://doi.org/10.5194/acp-14-9213-2014, 2014a.
Sicard, M., Bertolín, S., Muñoz, C., Rodríguez, A., Rocadenbosch, F., and Comerón, A.: Separation of aerosol fine- and coarse-mode radiative properties: Effect on the mineral dust longwave, direct radiative forcing, Geophys. Res. Lett., 41, 6978–6985, https://doi.org/10.1002/2014GL060946, 2014b.
Sicard, M., Barragan, R., Dulac, F., Alados-Arboledas, L., and Mallet, M.: Aerosol optical, microphysical and radiative properties at regional background insular sites in the western Mediterranean, Atmos. Chem. Phys., 16, 12177–12203, https://doi.org/10.5194/acp-16-12177-2016, 2016.
Sicard, M., Córdoba-Jabonero, C., López-Cayuela, M.-Á., Ansmann, A., Comerón, A., Zorzano, M.-P., Rodríguez-Gómez, A., and Muñoz-Porcar, C.: Aerosol radiative impact during the summer 2019 heatwave produced partly by an inter-continental Saharan dust outbreak – Part 2: Long-wave and net dust direct radiative effect, Atmos. Chem. Phys., 22, 1921–1937, https://doi.org/10.5194/acp-22-1921-2022, 2022.
Sousa, P. M., Barriopedro, D., Ramos, A. M., García-Herrera, R., Espírito-Santo, F., and Trigo, R. M.: Saharan air intrusions as a relevant mechanism for Iberian heatwaves: The record breaking events of August 2018 and June 2019, Weather Clim. Extrem., 26, 100224, https://doi.org/10.1016/j.wace.2019.100224, 2019.
Stamnes, K., Tsay, S.-C., Wiscombe, W., and Jayaweera, K.: Numerically stable algorithm for discrete-ordinate-method radiative transfer in multiple scattering and emitting layered media, Appl. Optics, 27, 2502, https://doi.org/10.1364/AO.27.002502, 1988.
Tesche, M., Ansmann, A., Müller, D., Althausen, D., Engelmann, R., Freudenthaler, V., and Groß, S.: Vertically resolved separation of dust and smoke over Cape Verde using multiwavelength Raman and polarization lidars during Saharan Mineral Dust Experiment 2008, J. Geophys. Res.-Atmos., 114, https://doi.org/10.1029/2009JD011862, 2009.
Tindan, J. Z., Jin, Q., and Pu, B.: Understanding day–night differences in dust aerosols over the dust belt of North Africa, the Middle East, and Asia, Atmos. Chem. Phys., 23, 5435–5466, https://doi.org/10.5194/acp-23-5435-2023, 2023.
Tindan, J. Z., Pu, B., and Jin, Q.: Trends in daytime and nighttime dust aerosols over the Dust Belt revealed by IASI, Sci. Total Environ., 1004, 180742, https://doi.org/10.1016/j.scitotenv.2025.180742, 2025.
Valenzuela, A., Costa, M. J., Guerrero-Rascado, J. L., Bortoli, D., and Olmo, F. J.: Solar and thermal radiative effects during the 2011 extreme desert dust episode over Portugal, Atmos. Environ., 148, 16–29, https://doi.org/10.1016/j.atmosenv.2016.10.037, 2017.
Volz, F. E.: Infrared optical constants of aerosols at some locations, Appl. Optics, 22, 3690–3700, https://doi.org/10.1364/AO.22.003690, 1983.
Welton, E. J. and Campbell, J. R.: Micropulse Lidar Signals: Uncertainty Analysis, J. Atmos. Ocean. Tech., 19, 2089–2094, https://doi.org/10.1175/1520-0426(2002)019<2089:MLSUA>2.0.CO;2, 2002.
Welton, E. J., Stewart, S. A., Lewis, J. R., Belcher, L. R., Campbell, J. R., and Lolli, S.: Status of the NASA Micro Pulse Lidar Network (MPLNET): overview of the network and future plans, new version 3 data products, and the polarized MPL, EPJ Web Conf., 176, 09003, https://doi.org/10.1051/epjconf/201817609003, 2018.
WMO Bulletin: Airborne Dust Bulletin, No 7., World Meteorological Organization, Geneva, Switzerland, https://library.wmo.int/idurl/4/68475 (last access: 10 June 2025), 2023.
Xu, W., Kuang, Y., Liang, L., He, Y., Cheng, H., Bian, Y., Tao, J., Zhang, G., Zhao, P., Ma, N., Zhao, H., Zhou, G., Su, H., Cheng, Y., Xu, X., Shao, M., and Sun, Y.: Dust-Dominated Coarse Particles as a Medium for Rapid Secondary Organic and Inorganic Aerosol Formation in Highly Polluted Air, Environ. Sci. Technol., 54, 15710–15721, https://doi.org/10.1021/acs.est.0c07243, 2020.
Yang, P., Feng, Q., Hong, G., Kattawar, G. W., Wiscombe, W. J., Mishchenko, M. I., Dubovik, O., Laszlo, I., and Sokolik, I. N.: Modeling of the scattering and radiative properties of nonspherical dust-like aerosols, J. Aerosol Sci., 38, 995–1014, https://doi.org/10.1016/j.jaerosci.2007.07.001, 2007.
Zhou, D. K., Larar, A. M., and Liu, X.: MetOp-A/IASI Observed Continental Thermal IR Emissivity Variations, IEEE J. Sel. Top. Appl., 6, 1156–1162, https://doi.org/10.1109/JSTARS.2013.2238892, 2013.
- Article
(3100 KB) - Full-text XML