the Creative Commons Attribution 4.0 License.
the Creative Commons Attribution 4.0 License.
 | 08 May 2026
Tropospheric bromine monoxide in Ny-Ålesund: source analysis and impacts on atmospheric chemistry
Yuhan Luo
Bianca Zilker
Andreas Richter
Ke Dou
Haijin Zhou
Kai Zhan
Wenqing Liu
Arctic tropospheric bromine monoxide (BrO) plays a critical role in atmospheric chemistry, particularly during springtime ozone depletion events. While sources such as sea ice, open ocean, aerosols, and snowpack have been proposed, their relative contributions remain uncertain. In this study, we addressed this uncertainty using long-term Multi-Axis Differential Optical Absorption Spectroscopy observations of BrO and aerosol profiles in Ny-Ålesund, Svalbard (78.92° N, 11.93° E), collected from March–May 2017–2023. BrO enhancements are positively correlated with aerosol extinction, indicating a close association with airborne particles, as supported by a Chemistry Transport Model (p-TOMCAT) simulations showing that heterogeneous recycling on aerosols is essential for sustaining elevated BrO levels. Five-day backward trajectories (0–3 km) showed significant BrO correlation with sea-ice contact time, particularly over multi-year ice (MYI) regions, which contributes comparably to first-year ice (FYI) regions in the total blowing-snow-sourced bromine flux, highlighting the comparable importance of snow over MYI and FYI regions in driving bromine explosion events. In addition, strong winds cause enhanced reactive bromine release from the sea ice. BrO and aerosol variability show a seasonal shift, with sea ice dominating in early spring and open ocean influence increasing toward late spring. BrO correlated negatively with surface ozone and mercury, indicating that enhanced bromine drives both ozone and mercury depletion. In particular, observed BrO correlated positively with modelled blowing-snow-sourced sea salt aerosol and the corresponding bromine emission fluxes from blowing snow. Snowpack-sourced bromine fluxes also correlated with BrO, although disentangling release processes remains challenging.
- Article
(14396 KB) - Full-text XML
-
Supplement
(11741 KB) - BibTeX
- EndNote


Reactive bromine plays a crucial role in the Arctic troposphere (Barrie et al., 1988). In polar spring, the release of large amounts of reactive bromine species (Br and BrO) during bromine explosion events (BEEs) (Wennberg, 1999; Abbatt et al., 2012; Simpson et al., 2007a) can trigger ozone depletion events (ODEs), in which surface ozone volume mixing ratios (VMRs) fall below 10 ppbv and sometimes approach near-zero values (Oltmans and Komhyr, 1986; Bottenheim et al., 1986; Halfacre et al., 2014). Reactive bromine also influences key photochemical species in the boundary layer, including OH/HO2, NO/NO2, and volatile organic compounds (Barrie and Platt, 1997; von Glasow and Crutzen, 2007; Simpson et al., 2015). Furthermore, enhanced reactive bromine promotes the oxidation of gaseous elemental mercury (GEM) and increases the deposition of particulate mercury, potentially impacting Arctic wildlife and human health through bioaccumulation in the food chain (Schroeder et al., 1998; Steffen et al., 2008).
In ozone depletion chemistry, the three main reaction cycles involving reactive bromine – self-reaction (BrO + BrO), cross-reaction (BrO + IO/ClO), and the catalytic cycle (BrO + HO2) – do not modify the total abundance of the Brx family (Simpson et al., 2007a). BEEs are widely believed to occur through heterogeneous reactions on low-pH saline surfaces containing sufficient bromide (Br−), which release reactive bromine into the gas phase via an autocatalytic cycle (Fan and Jacob, 1992; Wennberg, 1999; Abbatt et al., 2012):
In the multiphase Reaction (R1), HOBr reacts with Br−, releasing a bromine molecule. Photolysis of Br2 (Reaction R2) produces two bromine atoms, leading to a rapid buildup of reactive bromine (Lehrer et al., 2004). In addition to this pathway, other bromine release mechanisms have been reported. For example, at night, the reaction between O3 and bromide ions on saline surfaces can generate gaseous bromine molecules (Oum et al., 1998). Laboratory studies have shown that bromide ions, H3O+, and O2 can produce bromine radicals through heterogeneous reactions under nighttime conditions (Cao et al., 2024). Furthermore, the release of reactive bromine could also be influenced by sea salt Cl− (Vogt et al., 1996) and OH radicals (Halfacre et al., 2019).
Potential sources of reactive bromine include: open-ocean sea spray (Sander et al., 2003); snow over first-year sea ice (FYI) (Jones et al., 2006; Simpson et al., 2007b) and over multi-year sea ice (MYI) (Peterson et al., 2019; Huang et al., 2020); frost flowers (Kaleschke et al., 2004; Nghiem et al., 2012); sea salt aerosol (SSA) from polynyas or open leads (Kirpes et al., 2019; Criscitiello et al., 2021); tundra snowpack photochemistry (Pratt et al., 2013); blowing-snow-sourced SSA (Yang et al., 2008, 2010; Jones et al., 2009; Choi et al., 2018; Huang et al., 2020); and stratosphere-to-troposphere transport of BrO (Salawitch et al., 2010). Field studies in Alaska and laboratory experiments have shown that acidic saline snowpacks can release reactive bromine when exposed to sunlight and ozone (Wren et al., 2013; Pratt et al., 2013). Reactive bromine fluxes from snowpack in Alaska, ranging from 7 × 10⁷ to 1.2 × 10⁹ molec. cm−2 s−1, based on direct measurements of BrCl and Br2, were reported. These are in line with those needed in models to reproduce BEEs and ODEs (Custard et al., 2017). In contrast, Yang et al. (2024) derived a much lower average snowpack release flux of 1 × 10⁷ molec. cm−2 s−1 or below from field measurements in Eureka, Canada (86.4° W, 80.1° N), suggesting that coastal snowpack is a weak reactive bromine source. Moreover, based on a mass balance approach, Yang et al. (2024) estimated that the lifetime of atmospheric reactive bromine as a family is 17–42 d, which is longer than the 4–10 d reported in previous studies (von Glasow et al., 2004; Yang et al., 2005). Fresh frost flowers, although highly alkaline and saline, likely make only minor or local contributions due to their limited spatial extent on open leads (Obbard et al., 2009; Lieb-Lappen and Obbard, 2015). Stratospheric influence on tropospheric BrO columns also appears limited (Theys et al., 2011).
Among these potential bromine sources, FYI and MYI differ in their physical and chemical properties, which may influence the efficiency of bromine activation. MYI is generally thicker and less porous than FYI, and these physical characteristics limit brine connectivity within the ice and its upward transport, resulting in distinct roles in Arctic bromine chemistry (Haas et al., 2006, 2010). After undergoing multiple summer melt–refreeze cycles, MYI is desalinated through gravity drainage and flushing, whereas FYI typically retains higher salinity (Krnavek et al., 2012). Although brine can migrate upward through the ice–snow interface and supply salts to overlying snow, this process is highly sensitive to snow depth, with observations suggesting an effective upper limit of approximately 17 cm (Domine et al., 2004). MYI regions generally accumulate deeper snowpacks, limiting the upward transport of salts from the ice and resulting in lower snow salinity compared to FYI regions (Webster et al., 2014; Blanchard-Wrigglesworth et al., 2015). Under such low-salinity conditions, atmospheric deposition and recycling may become increasingly important in controlling bromide availability in the snow (Krnavek et al., 2012; Nandan et al., 2017). Surface snow over MYI regions typically exhibits low salinity, with a typical median value around 0.01 practical salinity unit (psu), whereas snow over FYI regions is generally more saline, with median values ranging from 0.1 to 0.7 psu (Krnavek et al., 2012). Analysis of bromine enrichment factors indicates that bromide depletion is more frequently observed in snow over MYI compared to snow over FYI, suggesting that, in addition to FYI regions, snow over MYI regions may actively participate in Arctic boundary layer bromine chemistry (Peterson et al., 2019). This explains the enhanced tropospheric BrO observed over MYI regions (Peterson et al., 2016; Burd et al., 2017). However, it is commonly assumed that snow over FYI regions represents the primary source of reactive bromine, while the contribution from snow over MYI regions is relatively limited. Most current chemistry models do not account for the effects of MYI.
Investigating reactive bromine release mechanisms in the polar troposphere requires robust observational evidence, which has been partially provided by satellite measurements offering key insights into BrO distribution. Wagner and Platt (1998) and Richter et al. (1998) reported elevated BrO in the polar spring from GOME measurements, with BrO-rich air masses generally located near sea ice regions. Jacobi et al. (2006) reported enhanced tropospheric BrO detected by the SCIAMACHY satellite during an ODE near the Arctic sea ice edge. Jones et al. (2009) observed elevated BrO with SCIAMACHY at Halley Station, Antarctica, and found that both stable boundary layers under low wind speeds and turbulent boundary layers under high wind speeds could lead to ODEs. Subsequent studies using GOME-2 satellite observations linked Arctic BrO enhancement to high-wind cyclonic systems, blowing-snow-generated SSA, and FYI contact (Begoin et al., 2010; Theys et al., 2011; Bougoudis et al., 2020). Seo et al. (2019) detected BrO enhancements with TROPOMI in diverse regions, including Arctic sea ice, volcanic areas, and salt lakes. However, limited spatial resolution and vertical sensitivity hinder a full understanding of reactive bromine activation mechanisms (Sihler et al., 2012).
Ground-based Differential Optical Absorption Spectroscopy (DOAS) observations provide minute-level temporal resolution and good vertical coverage, offering significant advantages for studying boundary layer BEEs (Hausmann and Platt, 1994; Hönninger et al., 2004; Frieß et al., 2004, 2011; Liao et al., 2011; Stutz et al., 2011; Peterson et al., 2015; Zhao et al., 2016; Simpson et al., 2017). Enhanced BrO has been detected during polar spring using long-path DOAS and MAX-DOAS instruments (Hausmann and Platt, 1994; Hönninger et al., 2004). MAX-DOAS observations also facilitate investigations of BrO vertical distribution within the boundary layer (Peterson et al., 2015; Simpson et al., 2017; Frieß et al., 2023; Brockway et al., 2024). Additionally, BrO has been measured using airborne DOAS instruments and chemical ionization mass spectrometers, although such measurements are generally limited to specific campaigns (Liao et al., 2011, 2012; General et al., 2014; Peterson et al., 2017). In Ny-Ålesund, several research groups have conducted BrO observations over the years. Tuckermann et al. (1997) detected BrO VMR exceeding 30 pptv using a DOAS instrument, which was associated with severe ODEs. Langendörfer et al. (1999) reported that filterable bromine concentrations measured by ion chromatography were consistent with BrO variations observed by DOAS. Luo et al. (2018) reported that enhanced BrO detected by MAX-DOAS in April 2015 was linked to sea ice cover in the Kings Bay region. Chen et al. (2022) documented a BEE event in March 2017, observed by MAX-DOAS, and attributed it primarily to SSA generated by blowing snow over sea ice under high wind conditions. Zilker et al. (2023) analyzed surface ozone and satellite-retrieved tropospheric BrO column data during spring seasons from 2010 to 2021, showing that enhanced BrO frequently occurred near Svalbard during ODEs, with the strongest enhancements typically observed in March.
Based on these observations, various reactive bromine emission mechanisms have been incorporated into chemical models. For example, Toyota et al. (2011, 2014) implemented a chemical scheme representing reactive bromine release from snowpack on sea ice, successfully reproducing enhanced BrO observed by the GOME satellite during Arctic spring. The same mechanism has also been applied to simulate BrO in both the Arctic and Antarctic (Falk and Sinnhuber, 2018). Yang et al. (2008, 2010) developed an alternative scheme in which reactive bromine is released from SSA generated by blowing snow, rather than directly from snowpack emissions. This mechanism is supported by recent field observations confirming SSA production from blowing snow (Yang et al., 2019; Frey et al., 2020; Gong et al., 2023). Models using this scheme have successfully reproduced BEEs and ODEs in both hemispheres. For instance, Choi et al. (2018) reported that the spatial distribution of model-simulated SSA from blowing snow closely matched tropospheric BrO columns observed by the OMI satellite during Arctic spring. Marelle et al. (2021) modelled Arctic ODEs in spring 2012 by applying both the snowpack and blowing-snow SSA schemes, and their results indicated that each contributed to ODE occurrence. Although these models can reproduce BEEs and ODEs, challenges remain due to low spatial resolution, limited ability to simulate boundary layer dynamics, and a lack of field data to constrain key parameters such as snow salinity and snow age, making quantitative comparison with in situ observations and mechanism validation difficult.
In this study, we retrieved 0–4 km BrO partial columns from observations made using a MAX-DOAS deployed at the Yellow River Station in Ny-Ålesund during 2017–2023. These data were combined with overpassing GOME-2B satellite measurements, p-TOMCAT model simulations, near-surface ozone observations, local meteorological records, and backward trajectories to study the possible sources and causes of variability in BrO levels in Ny-Ålesund. We further quantified the relative contributions of open ocean and sea ice to reactive bromine. Section 2 describes the methods and data used in this analysis. The results and discussions are presented in Sect. 3, and the conclusions are summarized in Sect. 4.
2.1 Measurements at Ny-Ålesund
Driven by global warming and Arctic amplification, Arctic sea ice has been significantly altered over the past three decades, with both its extent and thickness decreasing (Comiso et al., 2017; Bocquet et al., 2024). During polar spring, the area southwest of Svalbard is predominantly open ocean due to the North Atlantic Warm Current, whereas the region north of Ny-Ålesund is typically covered by sea ice (Fig. 1). Specifically, FYI mainly covers the Barents Sea to the east, whereas MYI dominates areas northwest of Svalbard and near Greenland. This sharp geographical contrast provides a natural laboratory for investigating the relative contributions of open ocean and sea ice to reactive bromine emissions.
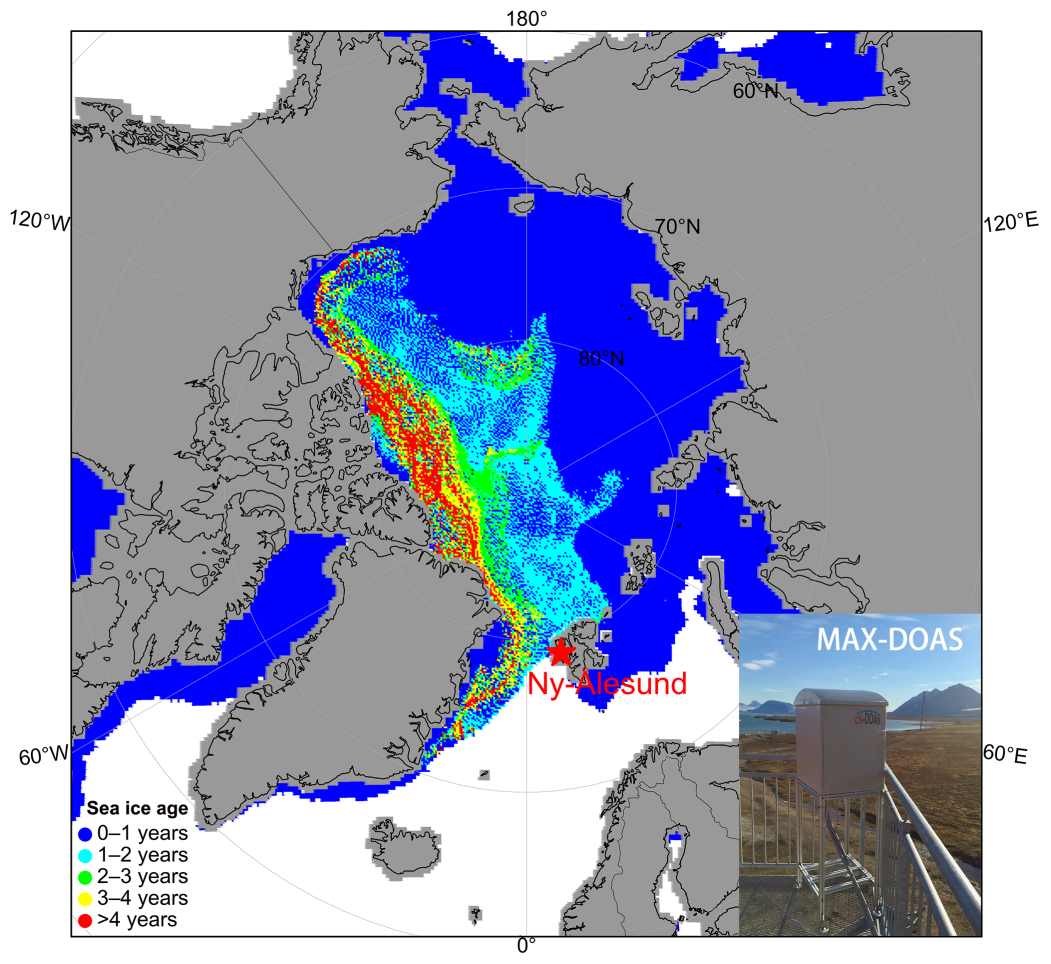
Figure 1Location of the MAX-DOAS observations at Ny-Ålesund. The background map shows the distribution of sea ice age during 11–17 March 2020, based on weekly sea ice age data (https://daacdata.apps.nsidc.org/, last access: 6 May 2026, login required). Different colours represent sea ice of various ages, from FYI to MYI, while white areas indicate open ocean.
In this study, BrO partial columns and aerosol extinction were measured at the Arctic Yellow River Station in Ny-Ålesund (78.92° N, 11.93° E; 10 m above sea level [a.s.l.]), located on the western coast of Svalbard, with the instrument installed at an altitude of 30 m a.s.l. Meteorological data from the Ny-Ålesund atmospheric observatory were supplied by the Alfred Wegener Institute–Research Unit Potsdam and accessed through the PANGAEA database (Maturilli, 2018–2023). This study used meteorological records for March–May during the years 2017–2023. Continuous ozone and GEM measurements have been carried out at Zeppelin Station (78.90° N, 11.88° E; 472 m a.s.l.), located approximately 2.1 km from the Arctic Yellow River Station (Platt et al., 2022). These datasets were obtained from the EBAS database managed by the Norwegian Institute for Air Research. The ozone dataset is available at https://doi.org/10.48597/87NH-HWSM (Aas et al., 1989–2024), and the GEM dataset at https://doi.org/10.48597/RKPP-ZA3R (Aspmo et al., 2000–2025).
2.2 Remote sensing data
2.2.1 MAX-DOAS
A MAX-DOAS instrument has been installed at the Chinese Yellow River Station in Ny-Ålesund since April 2015, with an azimuthal viewing direction of 45°. It collects scattered sunlight from multiple viewing angles using an outdoor telescope, which is connected via optical fiber to an indoor spectrometer (Ocean Optics MAYA Pro). The spectrometer transmits spectral data to a computer for processing through a CCD detector. A temperature controller maintains the spectrometer at 20 °C to ensure the stability of its optical properties. The instrument covers a wavelength range of 290–429 nm, with a full width at half maximum (FWHM) resolution of 0.5 nm. The MAX-DOAS operates at elevation angles of 2, 3, 4, 6, 8, 10, 15, 30, and 90°, requiring approximately 15 min to complete a full measurement sequence. The integration time for each spectrum varies depending on incident light intensity.
The spectral data were processed with QDOAS software, which applied the DOAS technique (Platt and Stutz, 2008; Danckaert et al., 2017). Differential Slant Column Densities (DSCDs) of BrO and O4 were retrieved using the parameter settings listed in Table 1. Reference spectra for the retrievals were taken from observations towards the zenith within each measurement sequence. Only spectra with a solar zenith angle (SZA) less than 86° were included in the analysis.
Table 1MAX-DOAS spectral setting for BrO and O4 analysis.
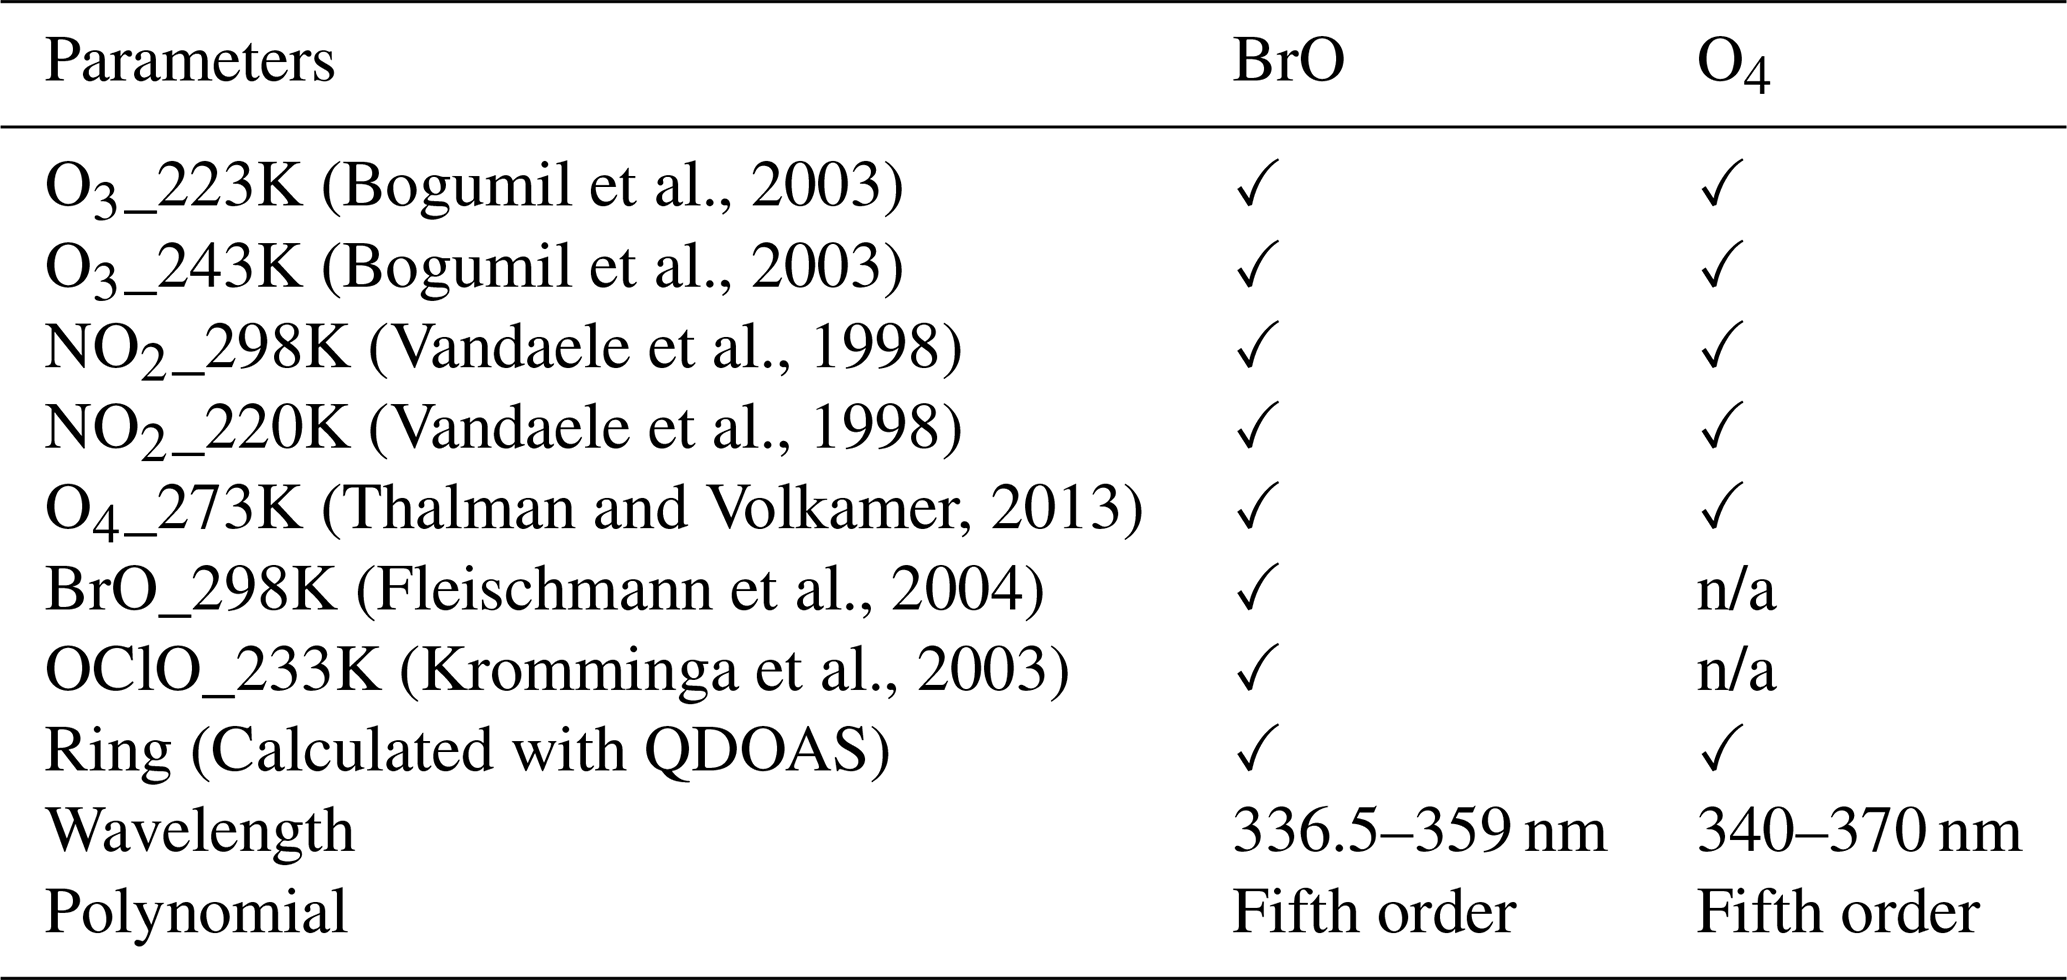
n/a – not applicable.
The BrO and aerosol extinction vertical profiles were retrieved using the HEIPRO algorithm, which is based on the Optimal Estimation Method (OEM) (Rodgers, 2000; Frieß et al., 2006, 2011). In this retrieval, the most probable atmospheric state was determined by minimizing the cost function χ2, expressed as:
Here, the measurement vector y represents the observed DSCDs of BrO and O4. The function F(x,b) denotes the atmospheric radiative transfer model (SCIATRAN, Rozanov et al., 2005), where x refers to the retrieved BrO and aerosol extinction vertical profiles, and b refers to meteorological parameters including pressure and temperature. The pressure and temperature profile data were obtained from climatological databases (Brühl and Crutzen, 1993). xa denotes the a priori state vector, while Sϵ and Sa are covariance matrices representing the uncertainties of the measurement and a priori states, respectively. In the retrieval, key parameters for evaluating the results are the averaging kernel matrix ( and the degrees of freedom for signal (DOFS). The averaging kernel matrix A describes the sensitivity of the retrieved profile to the true atmospheric state, while the DOFS, defined as the sum of the diagonal elements of A, quantifies the amount of independent information in the retrieval. Following the approach of Frieß et al. (2011), a two-step retrieval was applied. The aerosol extinction profile was first derived from the observed O4 DSCDs and subsequently used as input for the forward model to retrieve the vertical profile of BrO. In both steps, SCIATRAN was used as the forward model.
A vertical 200 m-resolution grid was employed to retrieve aerosol extinction and BrO profiles, covering altitudes up to 4 km with a total of 20 vertical layers. The surface albedo was set to 0.1 (Chen et al., 2022). In contrast to satellite observations, MAX-DOAS sensitivity is almost independent of the surface albedo and hardly decreases at large SZAs (Wagner et al., 2007). The a priori aerosol extinction profile followed an exponential distribution with a surface extinction of 0.05 km−1 and a scale height of 2 km. Similarly, the a priori BrO profile was exponential, with a surface concentration of 1 × 10⁹ molec. cm−3 and a scale height of 0.7 km. For both profiles, the a priori uncertainty was set to 100 % of the a priori value, and the vertical correlation length was 0.5 km. To ensure sufficient information content in the retrievals, only results with DOFS greater than 0.7 for both aerosol and BrO were retained (Peterson et al., 2015; Bognar et al., 2020). The 0–4 km BrO partial columns, obtained by integrating the vertical profile within this altitude range, reliably represented the amount and variability of BrO observed from the MAX-DOAS instrument (Zhao et al., 2016; Bognar et al., 2020). Figure 2 shows the averaging kernels for aerosol and BrO under clear-sky conditions. Below 2 km, the retrievals of both aerosol and BrO exhibits good sensitivity, with peak averaging kernel values of approximately 0.8 near the surface. Above 2 km, the averaging kernel for BrO is very small, indicating low sensitivity to the true atmospheric state and a stronger influence of the a priori profile in this altitude range. The DOFS values were 2.80 for the aerosol extinction profile and 2.25 for the BrO profile, indicating that a substantial amount of independent information was obtained from the MAX-DOAS observations.
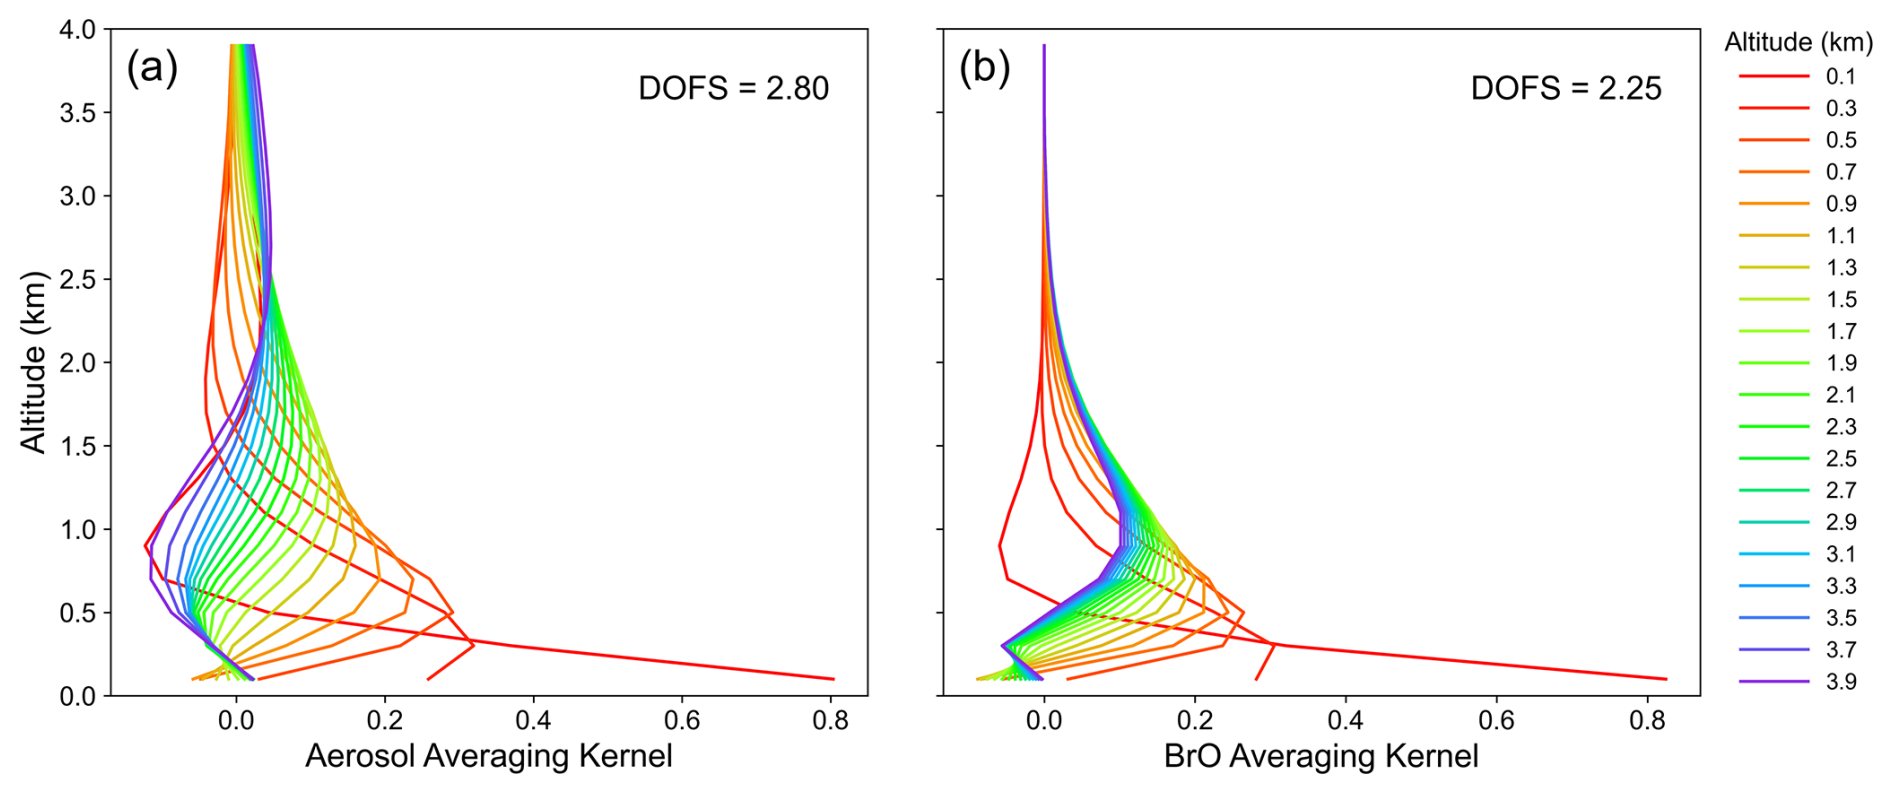
Figure 2Averaging kernels for aerosol (a) and BrO (b) at 10:22 UTC on 2 April 2020. The AOD is 7.73 × 10⁻². The DOFS are 2.80 for the aerosol extinction profile and 2.25 for the BrO profile. Curves of different colours represent the averaging kernels at different altitude layers.
Cloud effects are indeed an important issue for both ground-based and satellite observations in polar regions. For the MAX-DOAS measurements, no cloud filter was applied to the retrieved profiles because clouds and aerosol (including blowing snow SSA) cannot be clearly distinguished. Applying a cloud filter would therefore prevent a reliable investigation of the impact of blowing snow SSA on BrO. As a result, part of the reported aerosol optical depth (AOD) in this study may be attributed to extinction by clouds rather than by aerosols or snow particles (Frieß et al., 2023).
2.2.2 GOME-2B
The BrO tropospheric Vertical Column Densities (VCDtrop) from the Global Ozone Monitoring Experiment–2B (GOME-2B) were retrieved according to Bougoudis et al. (2020). The total Slant Column Densities (SCDs) of BrO were retrieved using the DOAS method (Burrows et al., 2011) with a fitting window of 338–360 nm. Stratospheric correction was applied according to Theys et al. (2009). This O3, NO2, and time depending climatology of stratospheric BrO vertical columns was derived with the BASCOE model (Errera and Fonteyn, 2001). Using a stratospheric air mass factor, the stratospheric BrO slant column was derived and subtracted from the total slant column to obtain the tropospheric BrO slant column. Finally, a tropospheric air mass factor was applied to derive the BrO VCDtrop. The GOME-2B satellite crosses the equator at 09:30 local time, with a spatial resolution of 80 km × 40 km (Bougoudis et al., 2020). In polar regions, extreme observational geometry enhances scattering and attenuation, resulting in reduced radiance signals. According to Bougoudis et al. (2020), the daily average root mean square error (RMSE) of retrievals typically remained below 2.0 × 10⁻³. The GOME-2B BrO VCDtrop values used in this study were those within 45 km of Ny-Ålesund. The GOME-2B BrO VCDtrop refers to the vertical column below the tropopause, which is typically located between 7.5 and 9.5 km in the Arctic, depending on meteorological conditions (Seo et al., 2020).
The comparison between the 0–4 km BrO partial columns retrieved by MAX-DOAS and the GOME-2B BrO VCDtrop is presented in Fig. S1 in the Supplement. As shown, there was a significant correlation between the MAX-DOAS and GOME-2B BrO observations, with a r of 0.74 (p<0.001, N=506). On average, the GOME-2B BrO VCDtrop values are higher than the MAX-DOAS BrO partial columns by 1.28 × 10¹³ molec. cm−2. This difference is at least partially explained by the fact that GOME-2B BrO represents the entire troposphere, whereas MAX-DOAS only captures the lowest 0–4 km. However, during periods of substantial BrO enhancement – such as 17–20 March 2017, 2–3 April 2019, and 16 and 23 March 2020 – the MAX-DOAS BrO partial columns occasionally exceeded the GOME-2B BrO VCDtrop. This is likely due to the higher sensitivity of MAX-DOAS to near-surface BrO, while satellite observations may underestimate the enhancement of reactive bromine close to the surface (Sihler et al., 2012) or due to the low spatial resolution of GOME-2B.
For the GOME-2B satellite data, clouds are neither filtered nor corrected in the BrO product. Over dark surfaces, the absence of cloud filtering can lead to a substantial underestimation of near-surface BrO. Over bright surfaces, photons can penetrate cloud layers, undergo absorption below the clouds, and return through the cloud with a certain probability. Although clouds affect the air mass factors of satellite retrievals, the magnitude of this impact depends on surface albedo, viewing geometry, and the vertical distribution of BrO and clouds, and is generally smaller than might be expected. As demonstrated in previous studies (e.g., Blechschmidt et al., 2016), the impact of clouds on BrO retrievals is much smaller over bright surfaces.
As noted above, passive remote sensing has limitations when studying BrO under low visibility conditions, as it does not account for cloud effects. However, it remains valuable for long-term observations.
2.3 Emission parameterisations
2.3.1 Blowing-snow-sourced emissions in p-TOMCAT model
The Cambridge Parallelised Tropospheric Offline Model of Chemistry and Transport (p-TOMCAT) is a global three-dimensional chemical transport model employed to study tropospheric chemistry. The model has a coarse horizontal resolution of 2.825° × 2.825°. While ERA5 provides 37 levels, p-TOMCAT setups commonly use a reduced number of hybrid sigma-pressure levels (e.g., 31 levels reaching up to ∼ 10 hPa) with a spacing of approximately 100 m in the boundary layer (∼ 60 m in the surface layer) and 1–1.5 km in the vicinity of the tropopause. Meteorological fields driving the model – such as temperature, humidity, wind speed, and humidity – were obtained from the 6-hourly ERA5 dataset provided by the European Centre for Medium-Range Weather Forecasts (ECMWF). In our simulations, ERA5 fields at their native horizontal resolution (0.25° × 0.25°) were first regridded to match the p-TOMCAT horizontal resolution (2.825° × 2.825°). Monthly sea ice coverage and sea surface temperature were sourced from the Hadley Centre Sea Ice and Sea Surface Temperature dataset (Rayner et al., 2003). The tropospheric bromine chemistry scheme in the model was described in detail by Yang et al. (2005, 2010, 2020). The parameterization of SSA emissions from the open ocean followed the formulations of Gong (2003) and Jaeglé et al. (2011), while SSA emissions from blowing snow over sea ice were based on the parameterizations of Yang et al. (2008, 2019). Snow salinity values over FYI used in the study were obtained from the MOSAiC measurements (Macfarlane et al., 2023); over MYI, half the FYI salinity is applied, which accounts for the two opposing effects: lower snow salinity but higher bromine enrichment. As shown in Fig. S2, the calculated blowing-snow-sourced bromine emissions during 2017–2023 BEEs indicate that bromine flux over MYI accounts for an average of 54 % (35 %–67 %) of total bromine flux over sea ice. Model settings for representing blowing-snow-sourced bromine were identical to those used by Ranjithkumar et al. (2025), except for applying a mean snow age of 1.5 d. This snow age was shorter than the previously suggested 3 d for the Arctic (Huang et al., 2020), as measurements performed at Eureka, Canada, accounted for non-traceable precipitation events, which substantially increased precipitation frequency and consequently reduced surface snow age. The representation of SSAs from both open ocean and sea ice comprised 21 size bins, with particle diameters ranging from 0.02 to 12 µm. In addition to model outputs of BrO and SSA, the same SSA production parameterization was applied along the back-trajectory track to calculate cumulative bromine emission fluxes (for more details, see Sect. 2.4) for further analysis in Sect. 3. These bromine emission fluxes are not taken directly from p-TOMCAT model output; instead, they are calculated using native-resolution ERA5 meteorology along backward trajectories. In addition to p-TOMCAT's coarse horizontal resolution, monthly sea-ice coverage (Rayner et al., 2003) was used without distinguishing between MYI and FYI; areas where sea ice persisted through the preceding summer are therefore treated as MYI in a coarse approximation. As a result, p-TOMCAT cannot precisely distinguish fluxes between MYI and FYI, so the bromine emission fluxes are calculated using ERA5 meteorology. The comparison shows that blowing-snow-sourced bromine fluxes calculated directly from ERA5 can be 2–3 times larger than those from p-TOMCAT outputs, which is likely due to differences in meteorological resolution and sea-ice representation (see Fig. S3).
2.3.2 Snowpack emissions
Following the approach of Toyota et al. (2011), the dry deposition flux of ozone over FYI snowpack was used to estimate the Br2 emission flux. In this study, a simplified method was used to describe surface bromine emission flux, assuming a constant ozone concentration of 30 ppbv and a dry deposition velocity of 0.01 cm s−1. As suggested, the Br2 yield depended on the SZA: a value of 0.001 was used when the SZA exceeded 85°, and 0.075 was applied when the SZA was less than or equal to 85°. The calculated emission flux was then combined with back-trajectory results (Sect. 2.4) to estimate cumulative emission fluxes under different conditions for further analysis in Sect. 3. Four experimental groups were designed to investigate reactive bromine release under varying environmental conditions. The first group (Fbr_snow_FYI) represents reactive bromine emissions from snow over FYI regions when air temperature °C. The second group (Fbr_snow_Seaice) is identical to the first but includes both MYI regions and FYI regions. The third group () is identical to the second but restricted to low wind speeds (≤7 m s−1). Finally, the fourth group () is identical to the third but applied only to high wind speeds (>7 m s−1).
2.4 Airmass trajectory model and analyses
The Hybrid Single-Particle Lagrangian Integrated Trajectory model (HYSPLIT) (Stein et al., 2015) was employed to investigate the sources of reactive bromine during BEEs in Ny-Ålesund. A BrO VMR greater than 12 pptv was used as the threshold for defining a BEE occurrence (Schofield et al., 2006). Meteorological data for driving the model were provided from the Global Data Assimilation System (GDAS) at a spatial resolution of 1° × 1° (Kleist et al., 2009). The HYSPLIT model computed 120 h backward trajectories of air masses arriving at Ny-Ålesund. Hourly backward trajectories were generated with endpoints at 15 vertical levels below 3 km, with the lowest level at 100 m and subsequent levels at 200 m intervals.
For each trajectory, the contact time of the air mass with various surface types – such as sea ice, open ocean, land, and free troposphere – was calculated. When the air mass was located below 500 m and encountered sea ice, open ocean, or land surfaces, the contact time with these surfaces was accumulated. If the air mass was above 500 m, it was considered to be in contact with the free troposphere. Sea ice age data were provided by the NASA National Snow and Ice Data Center (NSIDC) (Tschudi et al., 2020), and sea ice concentration data from the ERA5 dataset (Hersbach et al., 2020). Sea ice older than one year was classified as MYI, whereas ice younger than one year was classified as FYI. Sea ice concentration values ranged from 0 to 1, with values above 0.15 considered sea ice and values below 0.15 considered open ocean (Dukhovskoy et al., 2015). Along the trajectories, whenever the air mass encountered open ocean or sea ice surfaces (i.e., below 500 m), the corresponding bromine emission flux from SSA generated by open ocean and blowing snow was calculated and accumulated by applying a given lifetime and weighting each hourly bromine emission flux along the backward trajectory using an exponential decay factor , where ti is the time in hours from the trajectory endpoint and τ is the lifetime of reactive bromine. In this study, τ was set to 5 d (120 h, Yang et al., 2005). The total accumulated emission flux F was therefore calculated as:
Here, 120 represents the total number of hourly points along the backward trajectory. A similar approach was applied to accumulate the reactive bromine emission flux from snowpack along the backward trajectories. In addition, a longer lifetime e.g., 30 d was also used to test the sensitivity of F, see discussion in Sect. 3.5.
3.1 Monthly variation of BrO, AOD, and Ozone
From the monthly results of MAX-DOAS-retrieved BrO partial columns, MAX-DOAS-retrieved AOD, and surface ozone in Fig. 3, it is evident that, despite clear year-to-year perturbations, March exhibits the highest BrO enhancement, while May records the lowest (Fig. 3a). This declining trend from March to May is reflected in all central-tendency metrics (mean, median, 75th, and 95th percentiles) (Fig. 3b). For example, the seven-year average decreasing rate is 2.7 × 10¹¹ molec. cm−2 d−1 from March to April and 1.23 × 10¹¹ molec. cm−2 d−1 from April to May, yielding an overall rate of 1.97 × 10¹¹ molec. cm−2 d−1 from March to May. This value is close to, but slightly smaller than, the Eureka 2019 rate of 3.03 × 10¹¹ molec. cm−2 d−1 (Yang et al., 2024). The declining trend in GOME-2B BrO from March to May is also reflected in all central-tendency metrics (mean, median, 75th, and 95th percentiles) (Fig. 3d). For example, the seven-year average decreasing rate is 4.63 × 10¹¹ molec. cm−2 d−1 from March to April and 2.40 × 10¹¹ molec. cm−2 d−1 from April to May, yielding an overall rate of 3.52 × 10¹¹ molec. cm−2 d−1 from March to May. The mean inter-annual variability in the BrO partial column is largest in March, consistent with observations from Eureka, Canada (Bognar et al., 2020). In Ny-Ålesund, the BrO partial column in March 2020 is the highest, coinciding with high AOD and low surface ozone (Fig. 3e and g). By contrast, March 2018 exhibited an extremely low BrO partial column, accompanied by low AOD and high surface ozone. Bognar et al. (2020) reported a similar phenomenon at Eureka, likely attributable to unusually calm weather conditions in March 2018.
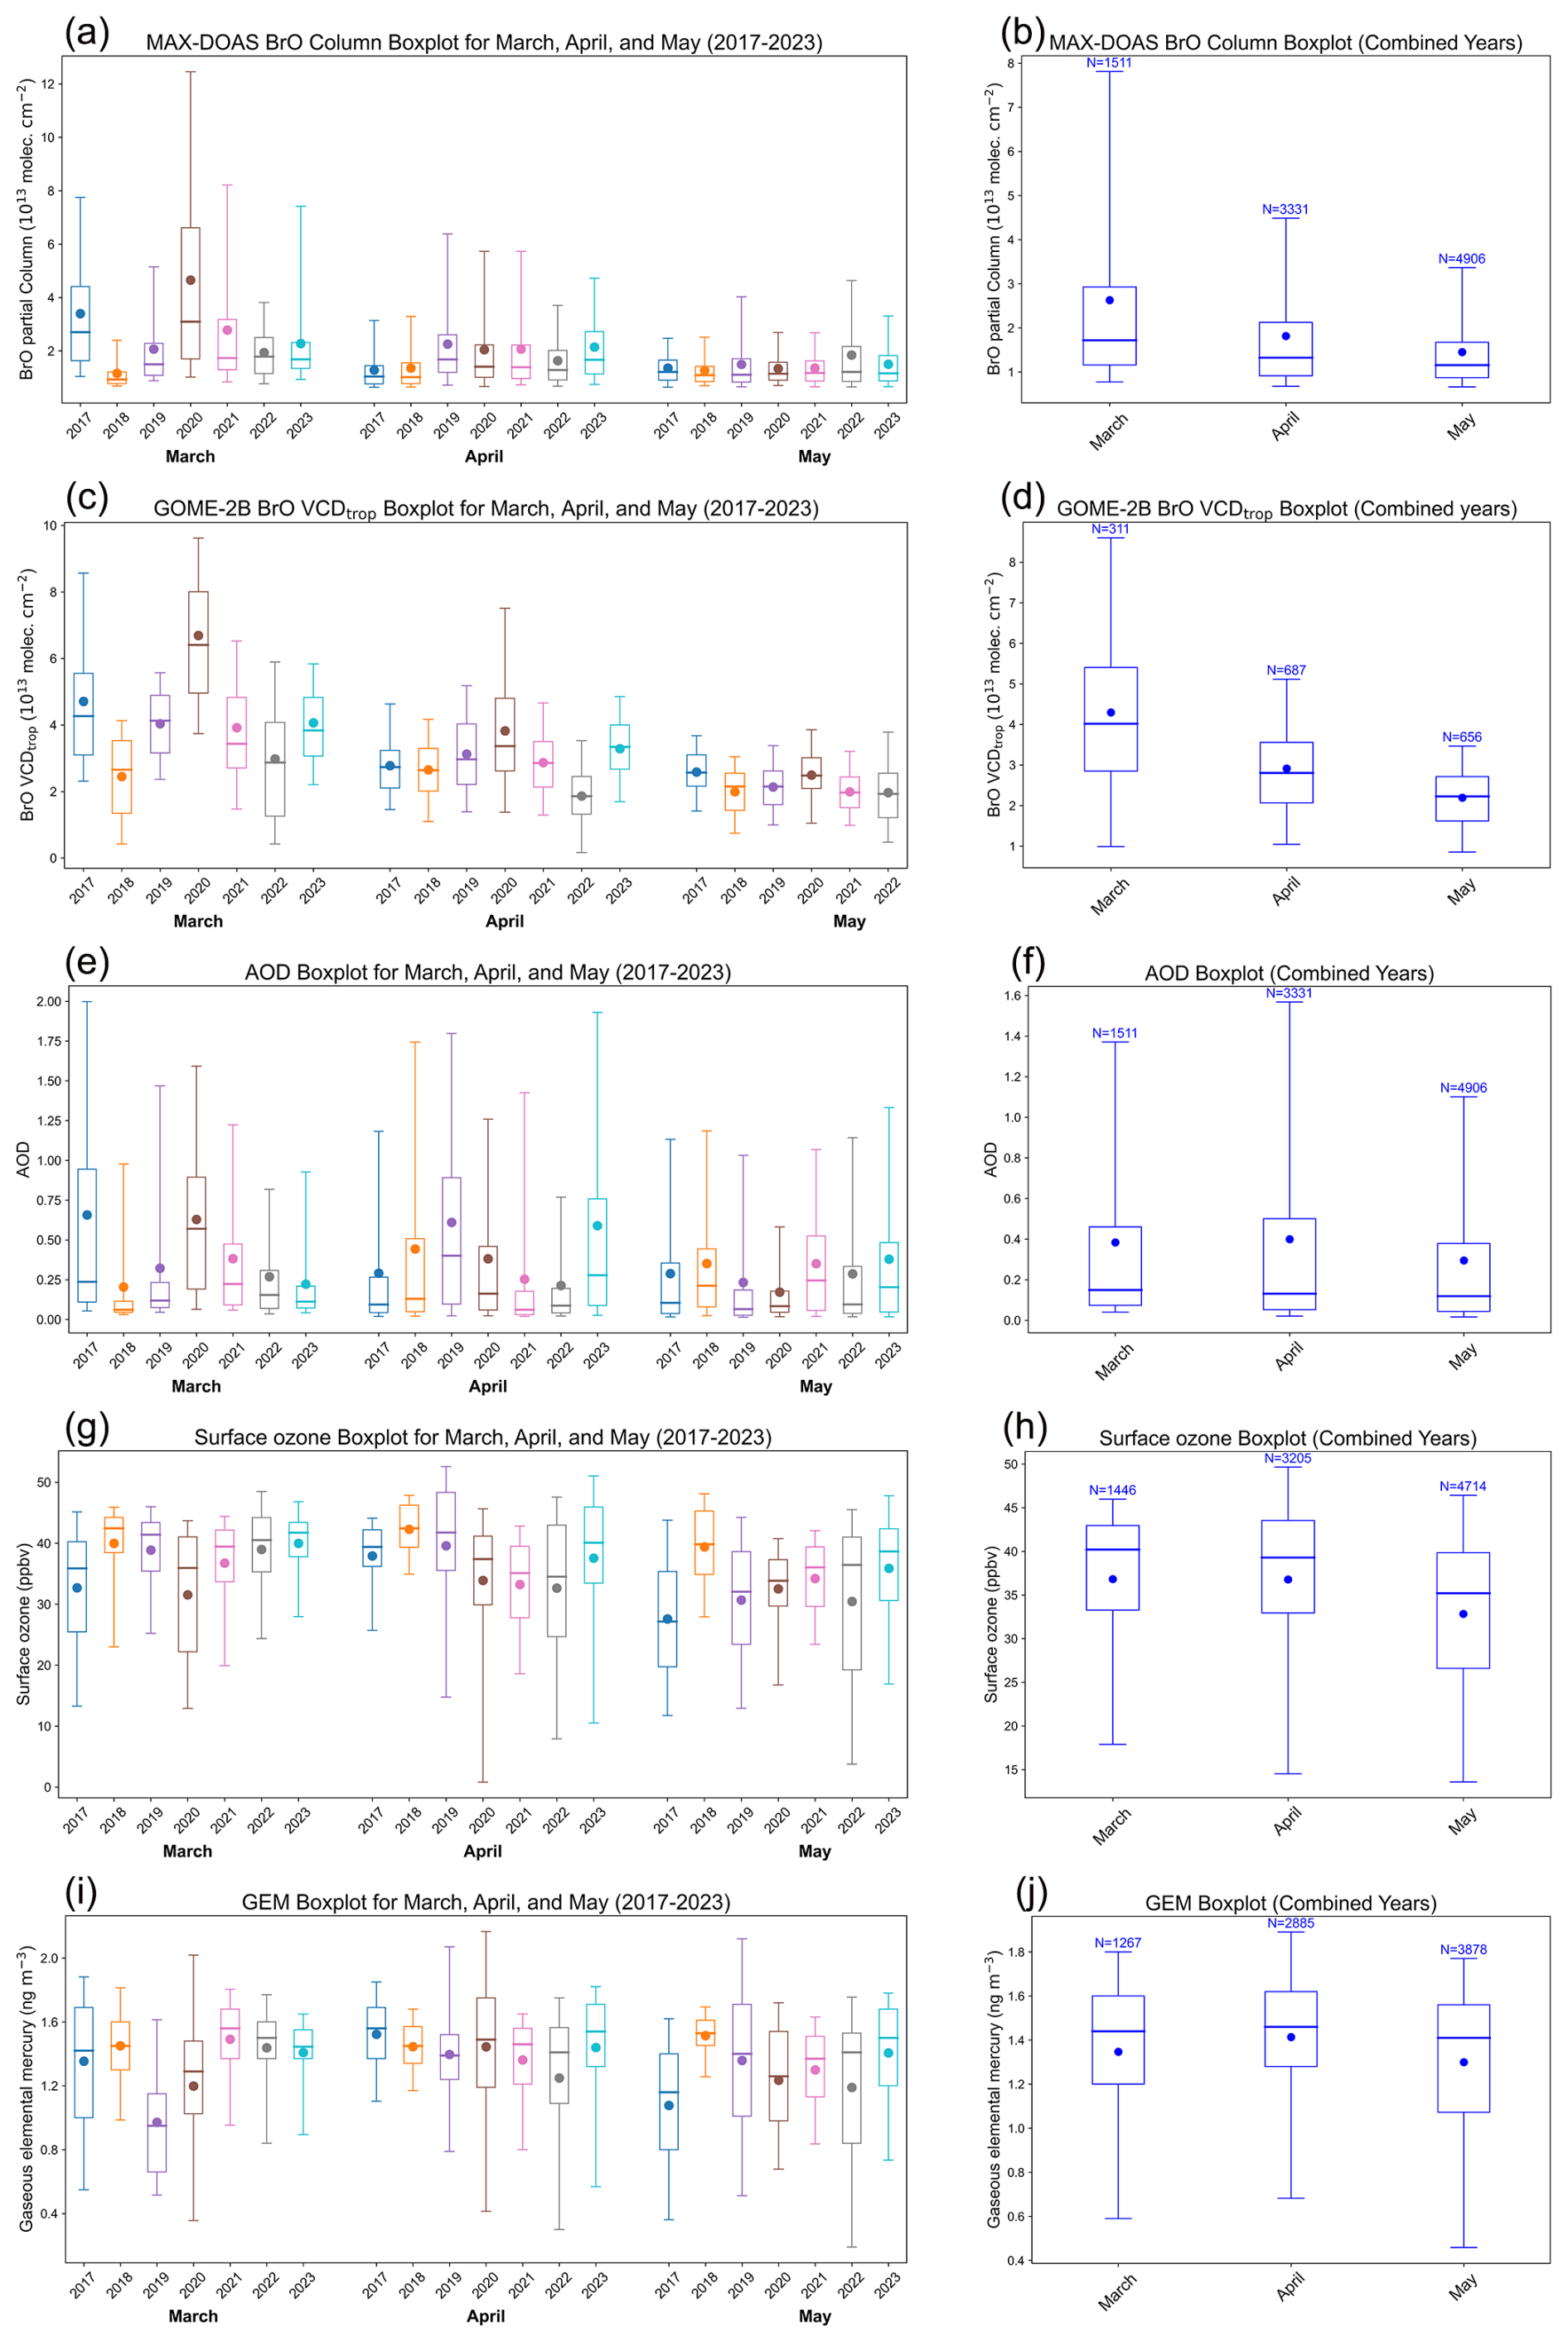
Figure 3Left panel: boxplots of monthly MAX-DOAS-retrieved BrO partial columns (a), GOME-2B tropospheric BrO columns (c), MAX-DOAS-retrieved AOD (e), surface ozone (g), and GEM (i) for March–May in each year from 2017 to 2023 in Ny-Ålesund; right panel: multiyear monthly MAX-DOAS BrO (b), GOME-2B BrO (d), MAX-DOAS AOD (f), ozone (h), and GEM (j). The boxes represent the 25th–75th percentile range, the whiskers indicate the 5th–95th percentile range, the dots represent the mean values, and the horizontal lines in the boxes indicate the median values. N is the number of hours counted. To ensure consistency with the MAX-DOAS BrO observations, only hours with valid surface ozone and GEM data during BrO observation periods were considered. Note that MAX-DOAS and GOME-2B BrO are not sampled at exactly the same times.
The median AOD from March to May exhibits a slight downward trend (Fig. 3f). A detailed analysis of the relationship between BrO and aerosol extinction is provided in Sect. 3.5. At the monthly scale, surface ozone variations do not show a clear relationship with BrO partial columns. This was expected, as surface ozone is generally controlled by background ozone levels, except during BEEs that lead to ODEs, which occur only during a small fraction of the time. However, in certain months, BrO partial columns were closely associated with surface ozone. For instance, in March 2020, enhanced BrO partial columns corresponded to the lowest median and mean surface ozone values, whereas in March 2018, the lowest BrO partial columns coincided with higher surface ozone, close to background levels. Overall, median surface ozone decreases from March to May (Fig. 3h), consistent with the trend observed at Zeppelin Station during 1993–2019 (Law et al., 2023). This seasonality may be attributed to enhanced surface ozone photolysis, decreased NOx emissions limiting photochemical ozone production, and potential effects of iodine compounds (Engvall Stjernberg et al., 2011; Schmale et al., 2018; Benavent et al., 2022), which are beyond the scope of this study.
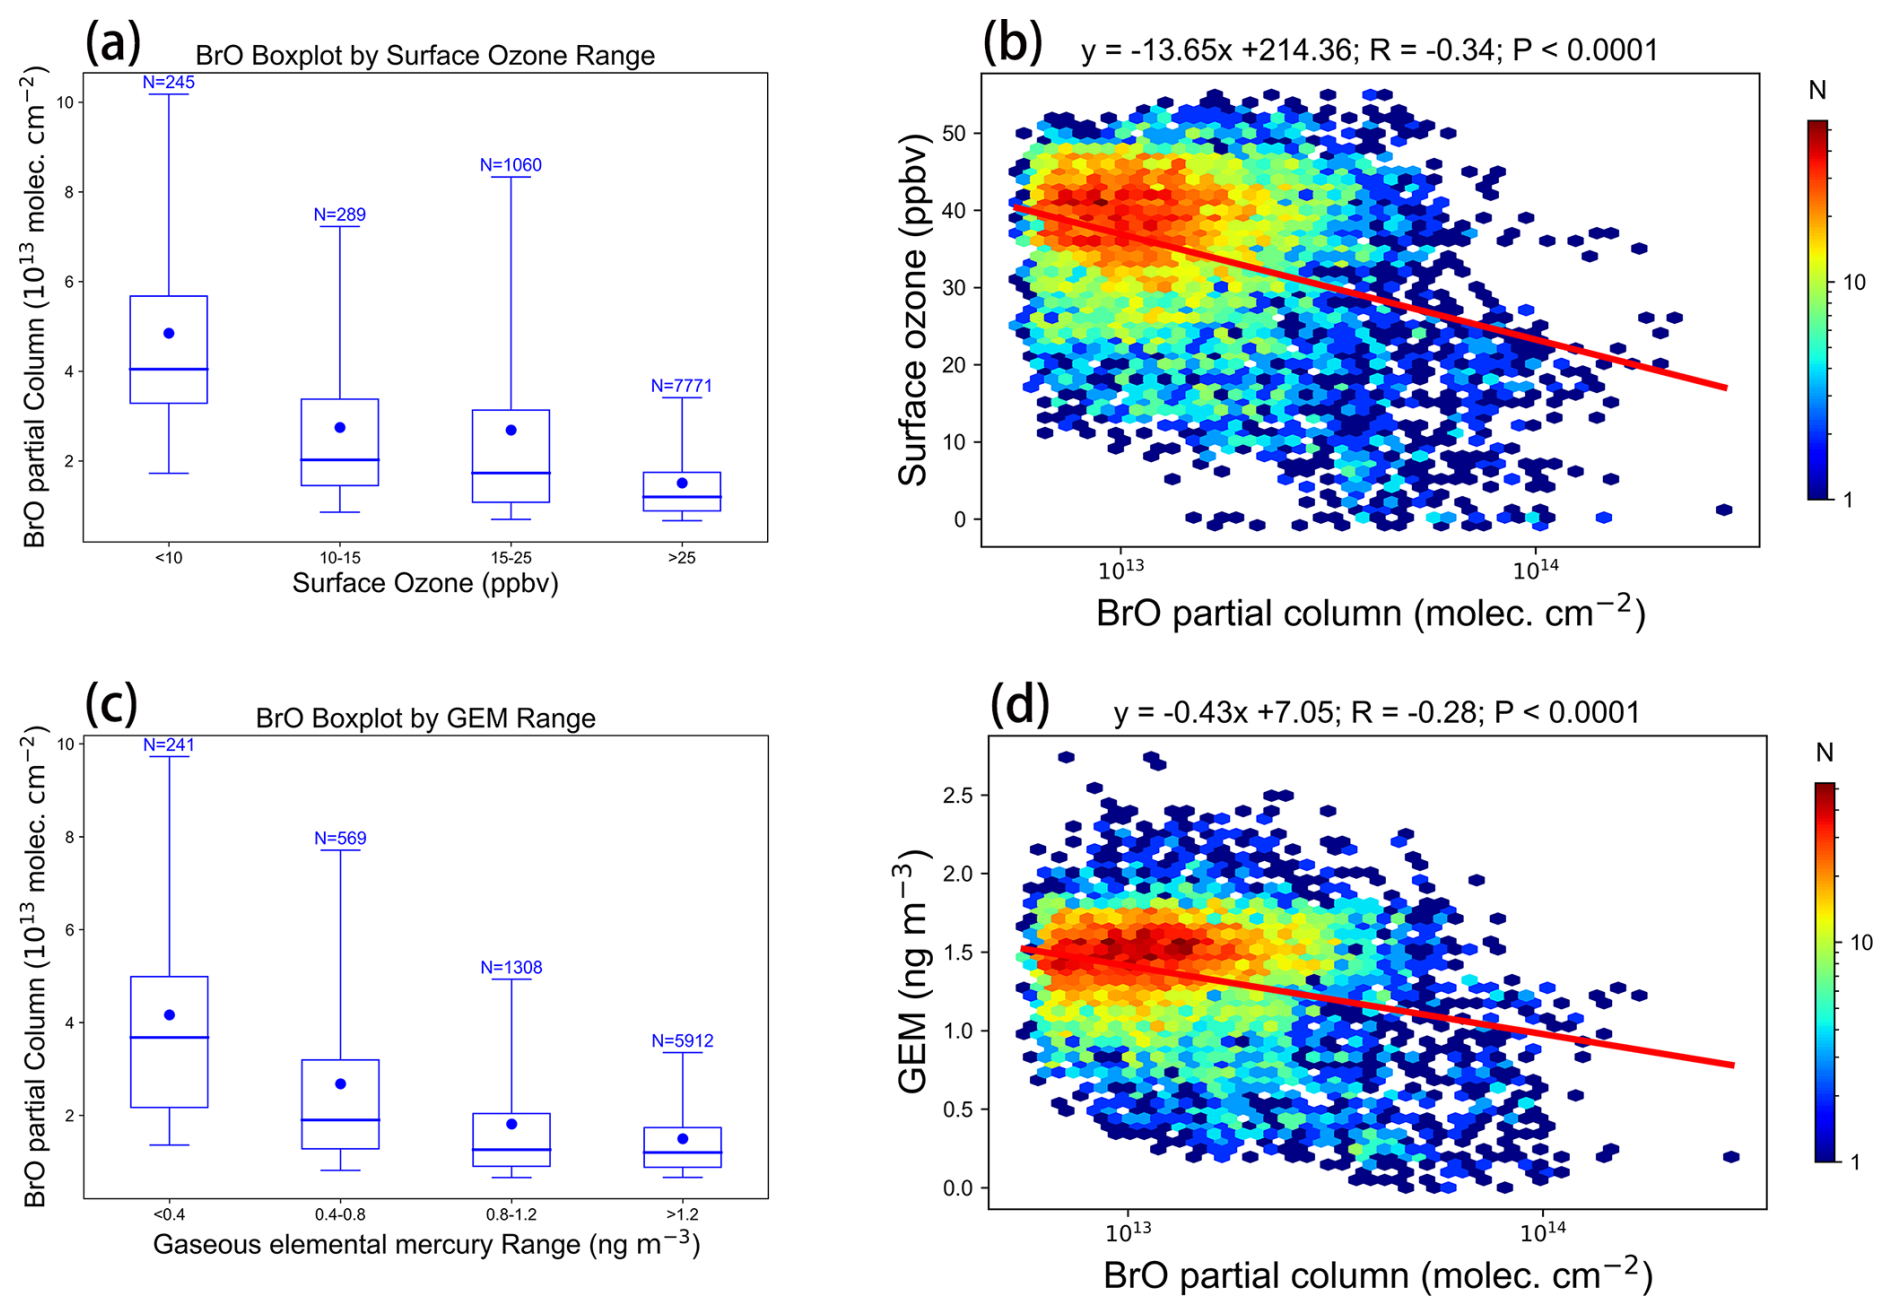
Figure 4Relationship between BrO partial columns and surface ozone and gaseous elemental mercury (GEM) from March to May during 2017–2023. (a) Boxplots of BrO partial columns corresponding to different surface ozone concentration ranges. (b) Correlation analysis between BrO partial column and surface ozone. (c) Boxplots of BrO partial columns corresponding to different GEM concentration ranges. (d) Correlation analysis between BrO partial column and GEM. The boxes represent the 25th–75th percentile range, the whiskers indicate the 5th–95th percentile range, the dots represent the mean values, and the horizontal lines in the boxes indicate the median values. N is the number of hours counted.
The impact of bromine on surface ozone is also shown in Fig. 4. When surface ozone concentrations are low, the corresponding mean and median BrO partial columns are generally higher than those observed when ozone concentrations are high. Figure 4a presents boxplots of BrO partial columns categorized by different surface ozone concentration ranges (<10, 10–15, 15–25, and >25 ppbv). The highest mean and median BrO partial columns occur in the lowest ozone range (<10 ppbv) and decrease progressively with increasing ozone concentrations. The correlation coefficient between MAX-DOAS BrO partial columns and surface ozone for the whole time series is (p<0.0001) (Fig. 4b), further supporting that enhanced BrO partial columns are closely associated with the depletion of surface ozone. These results indicate that enhanced BrO partial columns are closely associated with the depletion of surface ozone.
Previous studies have suggested that a large proportion of springtime atmospheric mercury depletion events observed at Ny-Ålesund is likely associated with the long-range transport of air masses containing depleted Hg(0) from regions over the Arctic Ocean (Gauchard et al., 2005; Sommar et al., 2007; Berg et al., 2013). During 2017–2023, the mean GEM concentration in spring was 1.35 ng m−3 (Fig. 3i–j), which is comparable to the mean value of 1.38 ng m−3 observed at Ny-Ålesund during 2011–2015 (Angot et al., 2016). At the monthly scale, GEM variations also do not show a clear relationship with BrO partial columns. The impact of bromine on GEM is shown in Fig. 4c–d. When GEM concentrations are low, the corresponding mean and median BrO partial columns are generally higher than those observed when GEM are high. Figure 4c presents boxplots of BrO partial columns categorized by different GEM concentration ranges (<0.4, 0.4–0.8, 0.8–1.2, and >1.2 ng m−3). The highest mean and median BrO partial columns occur in the lowest GEM range (<0.4 ng m−3) and decrease progressively with increasing GEM concentrations. In addition, BrO partial columns exhibit significant negative correlations with GEM (, p<0.0001; Fig. 4d). These results indicate that enhanced BrO partial columns are closely associated with the depletion of GEM, underscoring the key role of bromine chemistry in Arctic springtime atmospheric processes.
3.2 Vertical distribution of BrO
The vertical distributions of BrO VMR at various SZA during March, April, and May are shown in Fig. 5, which presents the 95th percentile of the monthly BrO VMR. From March to May, BrO in Ny-Ålesund was primarily distributed below 2.5 km. In March, the 95th percentile of BrO VMR values exceeding 12 pptv was mainly observed below 900 m; in April, below 500 m; and in May, below 300 m, with maximum values generally occurring within the bottom 100 m. Over this period, the median, mean, and maximum BrO VMR values in the bottom 100 m layer gradually decreased; for example, the mean value declined from approximately 40 pptv in March to around 10 pptv in May (Fig. 5b, d, and f). Generally, BrO VMR decreased progressively with increasing altitude. Figure 5 shows a clear diurnal variation in BrO, with higher BrO VMR observed shortly after sunrise and before sunset, and a minimum around local noon. This pattern was generally in line with observations by Frieß et al. (2023) at the Neumayer and Arrival Heights stations. The noon minimum in BrO VMR is likely influenced by strong solar radiation, which enhances photochemical activity such as HO2 production, thereby promoting BrO removal via the BrO + HO2 → HOBr + O2 reaction (Pöhler et al., 2010). The morning enhancement of BrO is likely due to the nighttime accumulation of Br2, formed by the reaction of HOBr with Br−, which is photolyzed after sunrise to produce BrO. The enhancement of BrO before sunset is likely caused by the faster photolysis of Br2 compared with O3 at dusk, followed by the reaction of bromine atoms with ozone; it is also promoted by the reduced efficiency of BrO loss processes under low solar radiation, both contributing to BrO accumulation (Buys et al., 2013). In addition, the stabilization of the boundary layer before sunset can further favour the accumulation of reactive bromine near the surface (Simpson et al., 2007a).
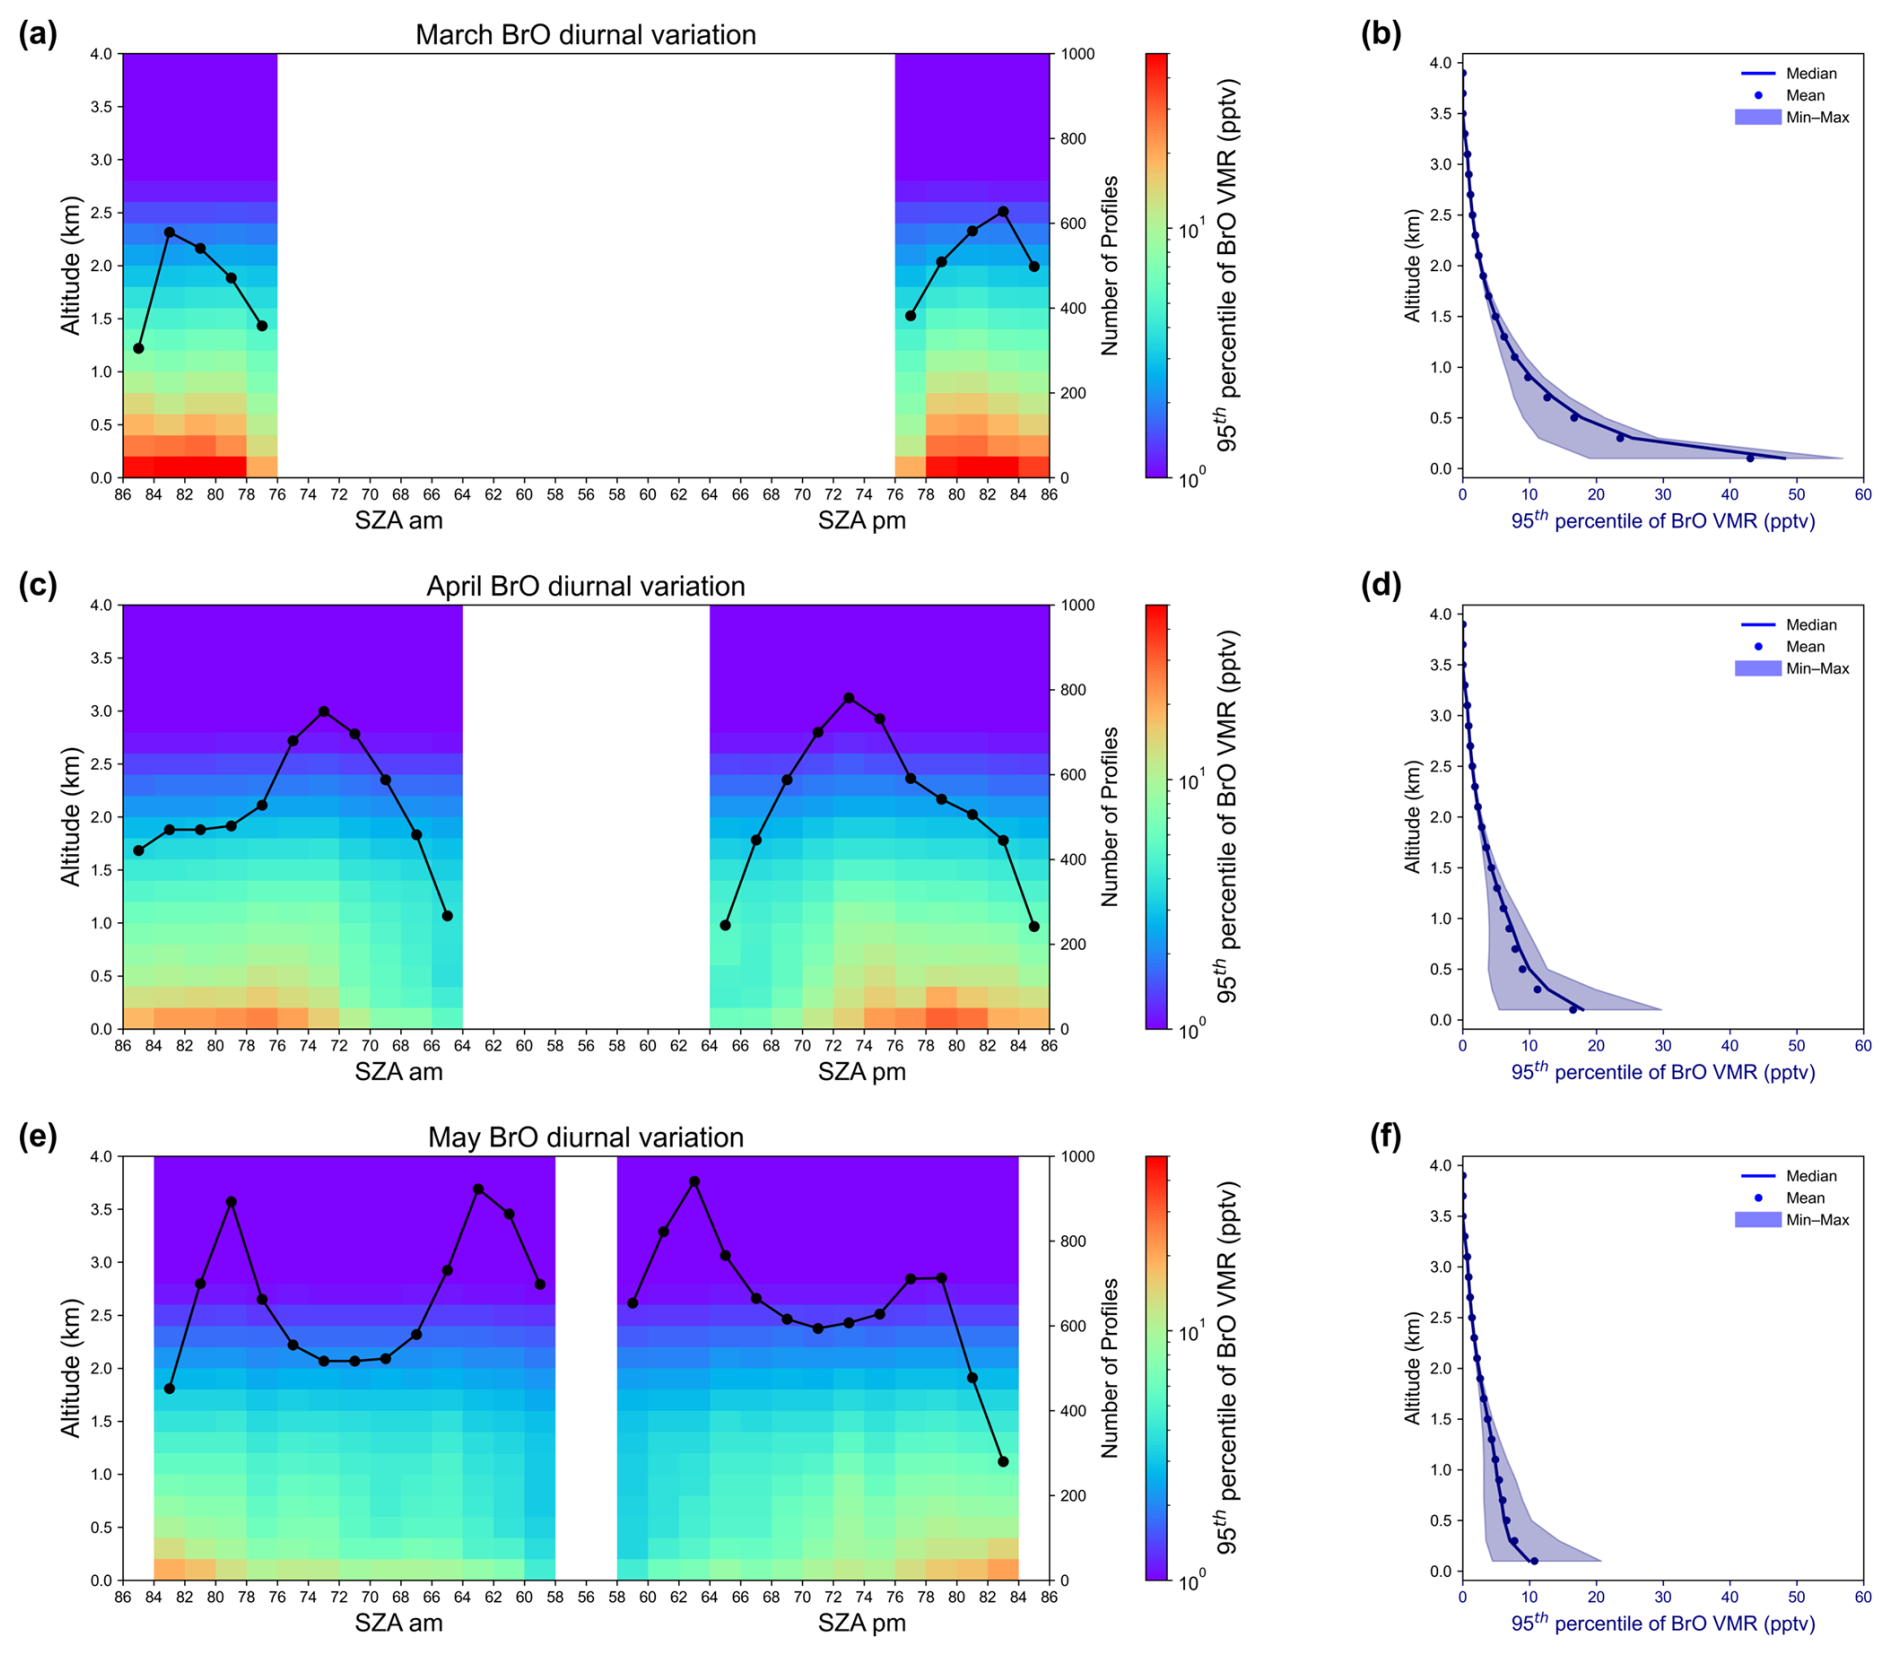
Figure 5The 95th percentile vertical distributions of BrO VMR in Ny-Ålesund during spring (2017–2023) for March (a, b), April (c, d), and May (e, f), respectively. Panels (a), (c), (e) show vertical profiles of the 95th percentile BrO VMR as a function of SZA. The black dots indicate the number of profiles (shown on the right y-axis) in each SZA bin; SZA bins with fewer than 200 profiles are excluded. Panels (b), (d), (f) show the statistical summary of the 95th percentile BrO VMR at each altitude across all SZA values: median (lines), mean (dots), and range (shaded area between minimum and maximum values), and BrO VMR is shown in blue.
High SZAs generally corresponded to data collected at the beginning of the month, whereas low SZAs corresponded to data collected at the end of the month. Given the clear decreasing trend in BrO VMR from March to May (Fig. 3b), the reductions in BrO at lower SZA values (i.e., around local noon) may partly be attributable to the overall monthly decline in BrO. Another factor that could influence the diurnal variation is the number of profiles used in the analysis. For instance, in April, the number of profiles for each SZA bin gradually decreased from an SZA of 72 to 64°. A greatly reduced number of profiles could have introduced statistical uncertainty, for example, by lowering the 95th percentile BrO VMR. For this reason, Fig. 5 presents only results derived from profiles where the number in each SZA bin exceeds 200. In addition, The double-peak structure (Fig. 5e) in May mainly arises from the seasonal expansion of the observable SZA range and the slower SZA variation at specific SZA intervals, which leads to enhanced sampling at two distinct SZA ranges (78–80 and 62–64°; see Figs. S4 and S5).
3.3 The relation between BrO, aerosol, and air mass history
In this section, spring (March–May) 2020 was selected for detailed analysis because the number of BEE hours in March 2020 was the highest (∼ 120 h) among all years (Fig. S6). This peak frequency made spring 2020 a particularly relevant period for investigating the relation between BrO, aerosols, and air mass history. BrO and aerosol extinction profiles, MYI, FYI, total sea ice, and open-ocean contact along air mass history trajectories, surface ozone, gaseous mercury, BrO partial column, and key meteorological parameters are presented in Fig. 6. The relationships between BrO and these parameters are presented in Fig. 7. BrO partial columns exhibits strong negative correlations with surface ozone (, p<0.0001) and GEM (, p<0.0001), supporting previous conclusions that enhanced BrO is associated with severe depletion of both ozone and GEM. Notably, BrO also exhibits negative correlations with key meteorological parameters, such as air temperature (, p<0.0001) and pressure (, p<0.0001). The temperature dependence may reflect the influence of temperature on bromine activation chemistry, as heterogeneous reactions leading to BrO release are more efficient at lower temperatures (Burd et al., 2017) or on air mass origin. Conversely, the strong negative correlation with air pressure suggests a role for atmospheric dynamical processes. For example, BrO shows a positive correlation with wind speed (r=0.21, p<0.0001), consistent with the proposed mechanism of reactive bromine release from blowing-snow-sourced SSA (Yang et al., 2008). These observed relationships are consistent with the discussion in Zilker et al. (2023), which focused on ozone depletion events in Ny-Ålesund and demonstrated a clear association with cold air masses originating from the central Arctic, typically accompanied by anomalous low pressure over the Barents Sea, enhanced wind speeds, and unstable boundary-layer conditions. While their analysis focused on ODEs, our findings highlight that BrO enhancement shows similar links to these meteorological situations. In addition, the strong positive correlation between BrO VMR profiles and aerosol extinction profiles (r=0.58, p<0.0001) indicates that atmospheric particles may play a key role in sustaining elevated BrO levels, either by serving as a direct source of reactive bromine or by recycling inactive bromine species through heterogeneous processes. The correlation with relative humidity (Fig. 7h) is very weak but positive (r=0.10, p<0.0001); the underlying causality, if any, remains unclear.
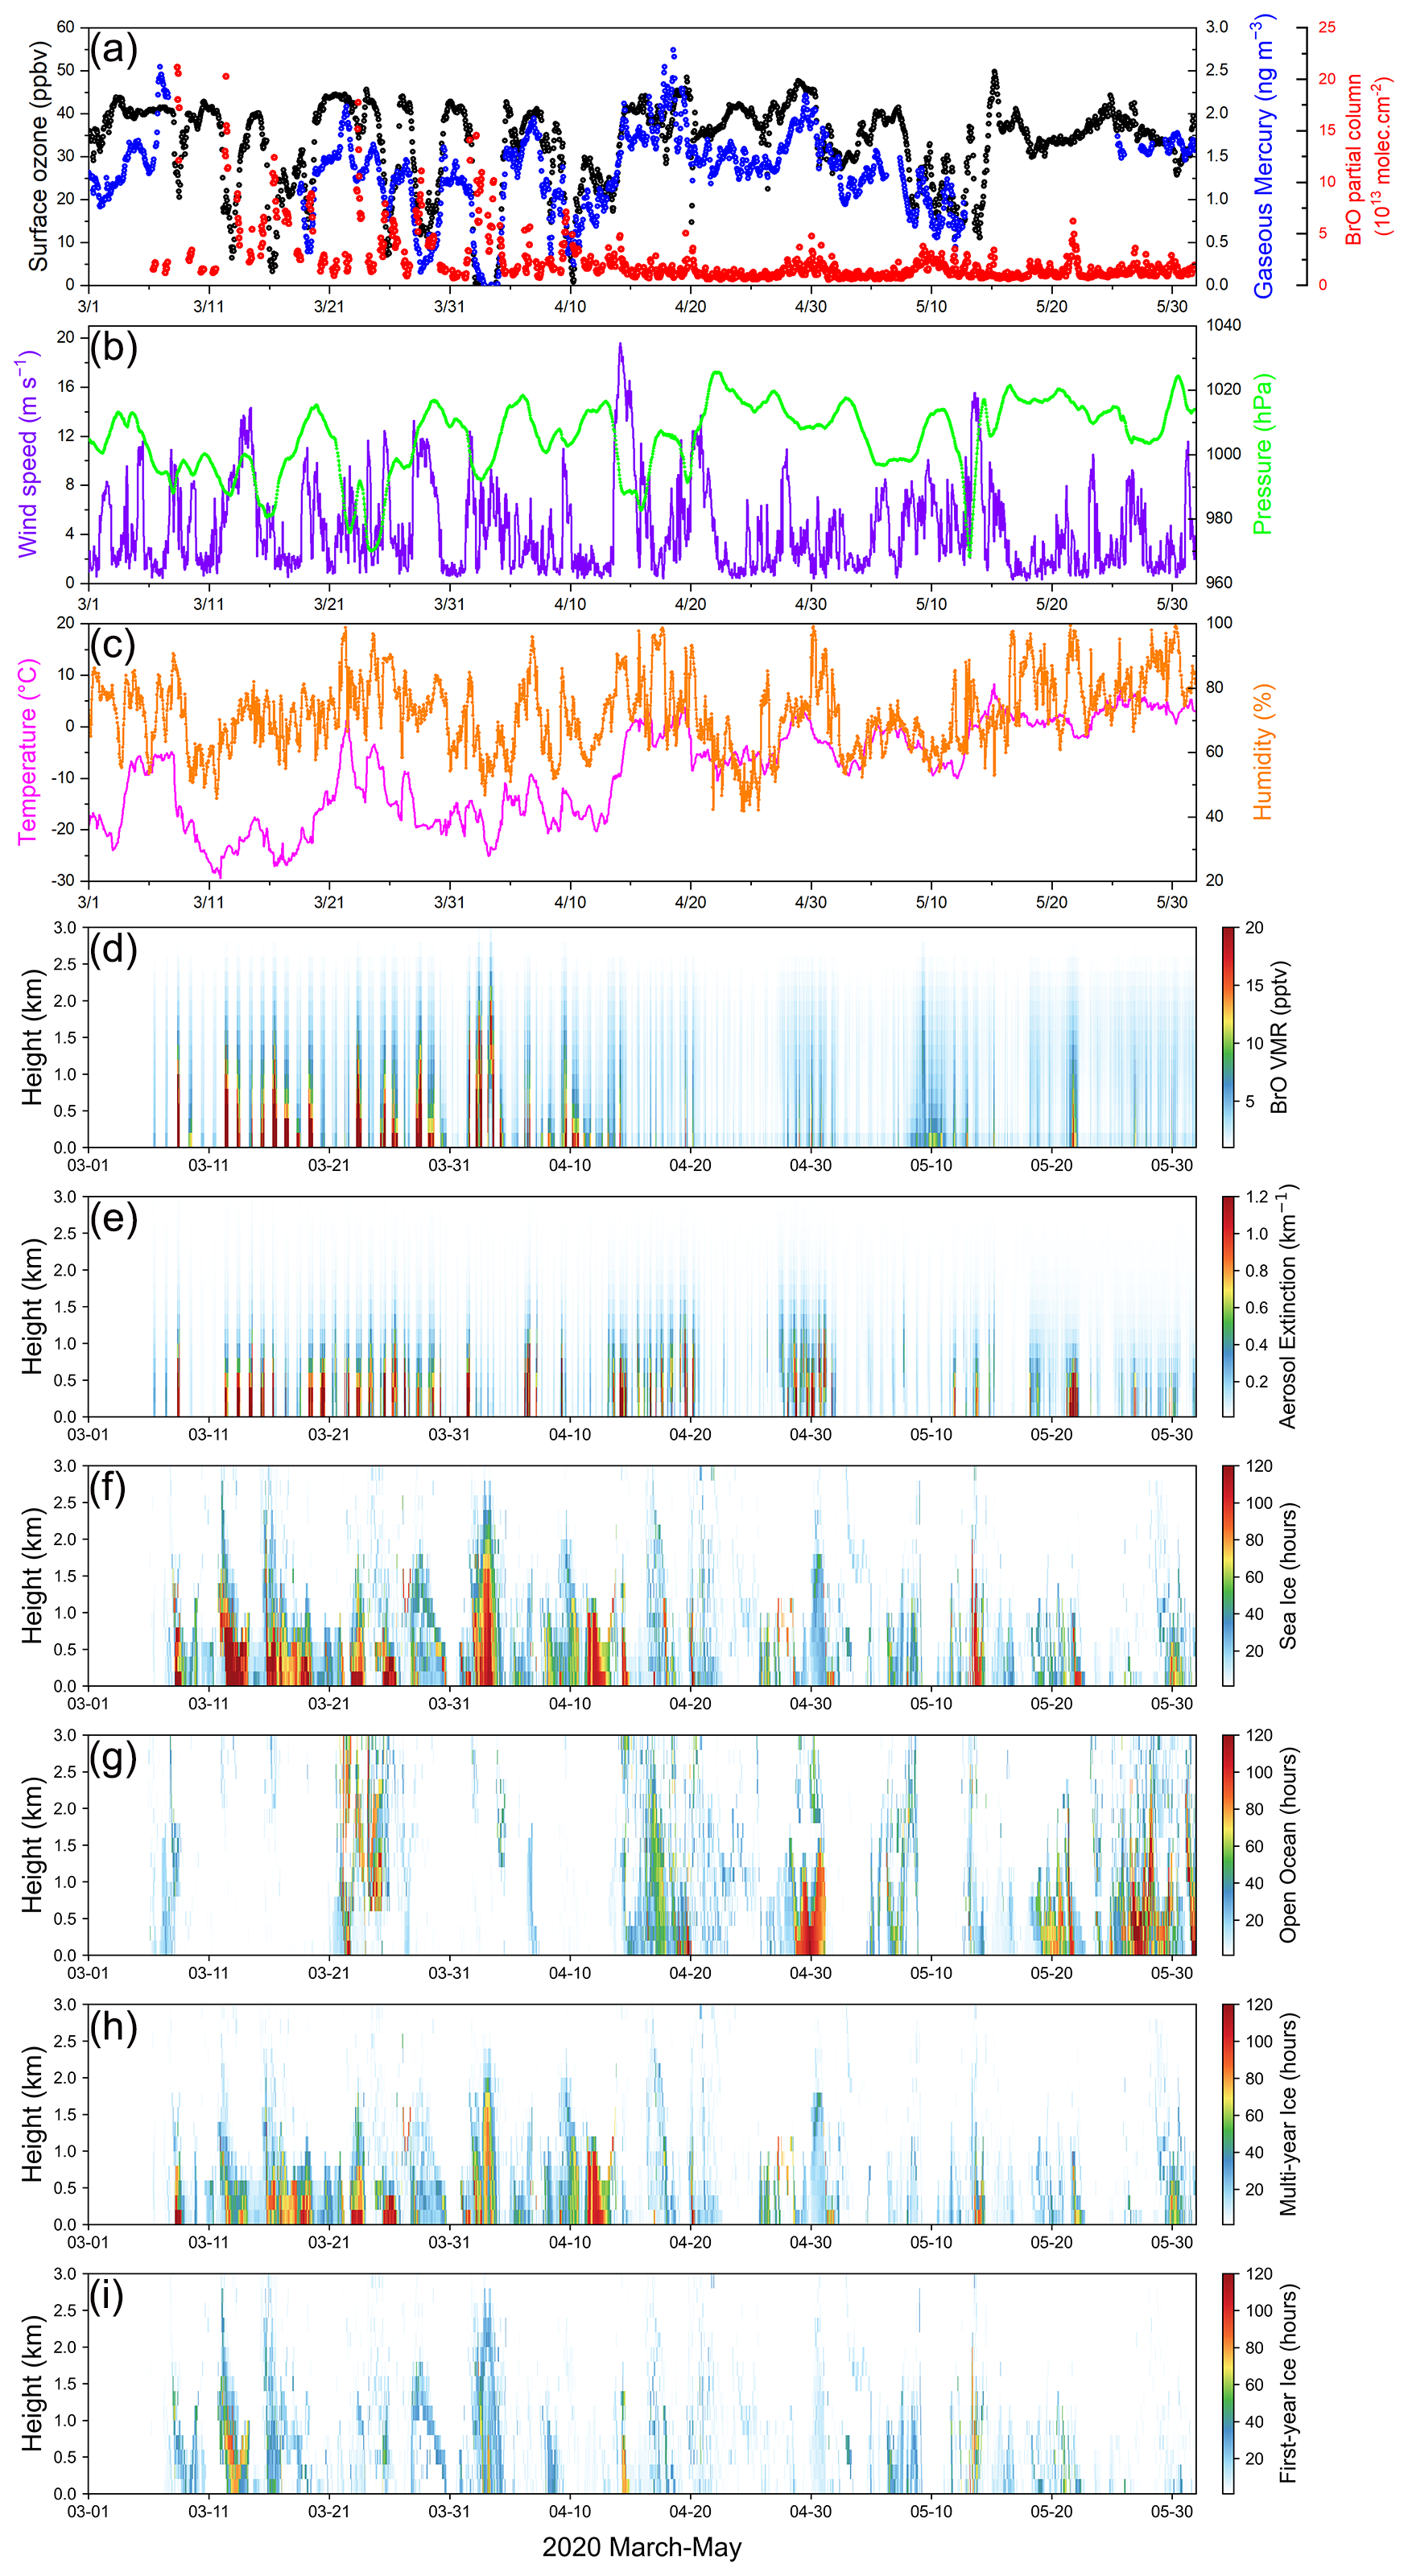
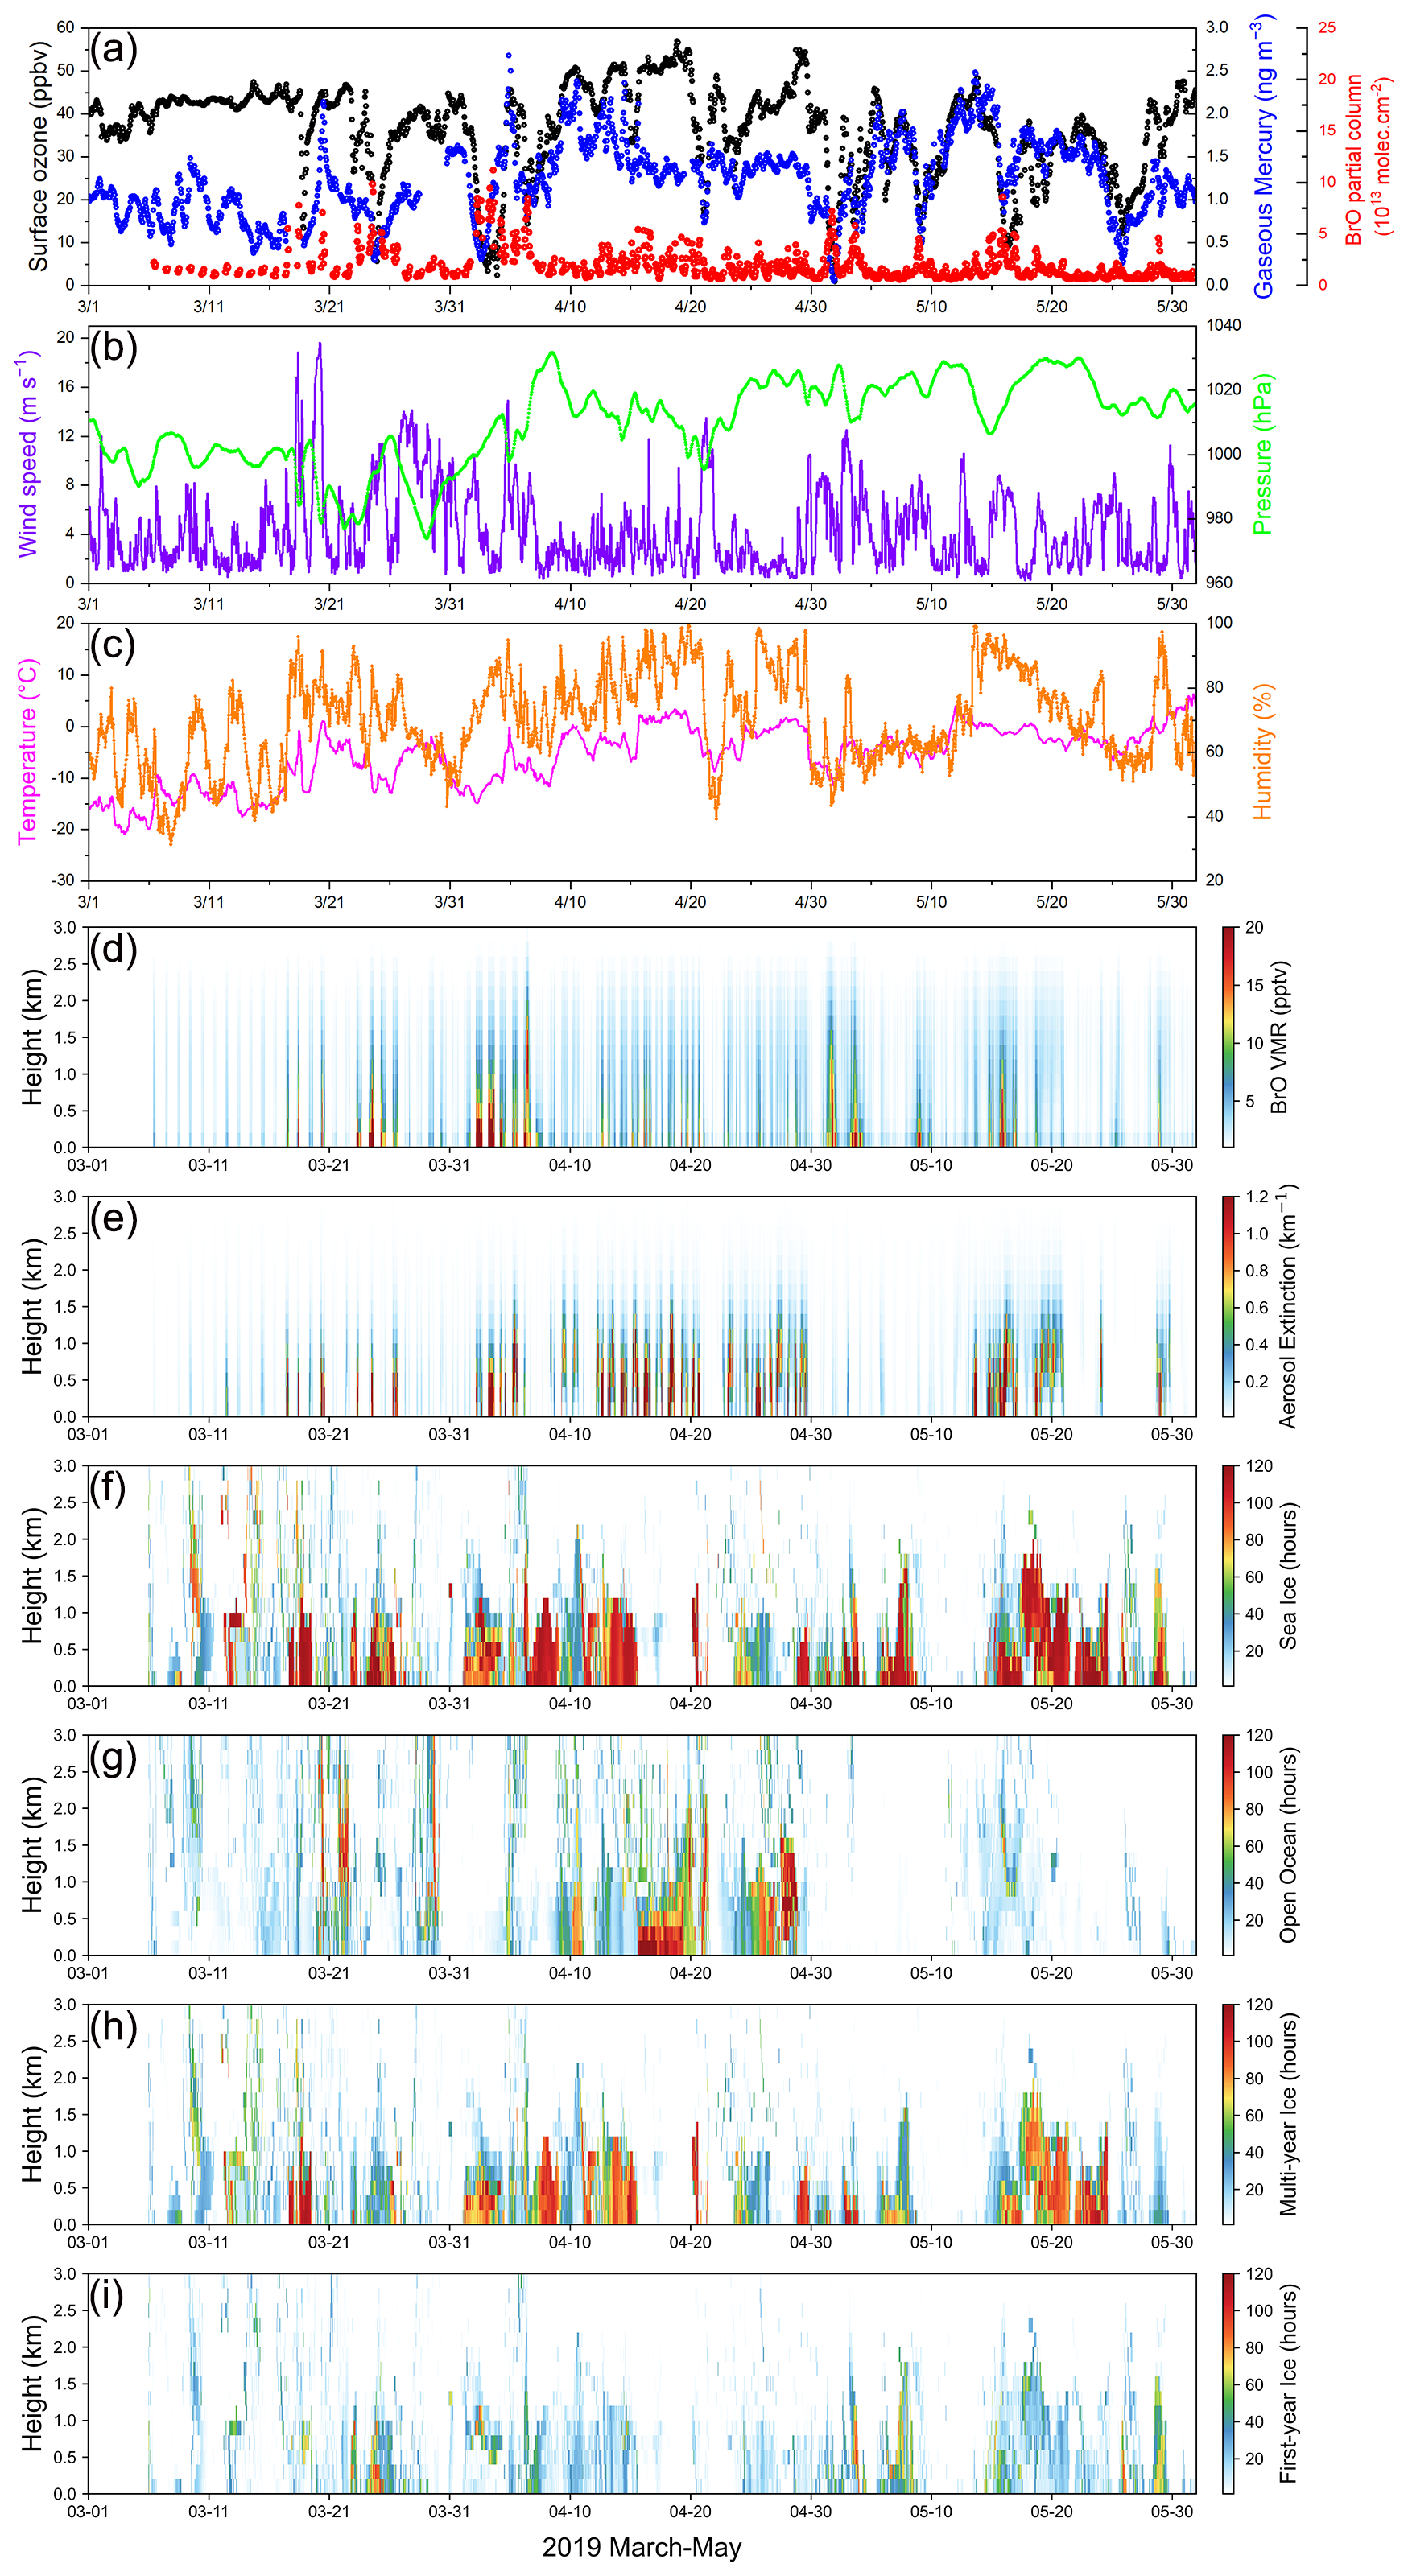
Figure 6Panel (a) surface ozone (black dots), gaseous mercury (Hg(0)) (blue dots) and BrO partial column (red dots); (b) wind speed (purple line), pressure (green line); (c) temperature (pink line), relative humidity (orange line); (d) BrO profiles; (e) aerosol extinction profiles; (f) total sea-ice contact time profiles; (g) open-ocean contact time profiles; (h) MYI contact time profiles; and (i) FYI contact time profiles between March and May 2020 in Ny-Ålesund. All data are shown at hourly resolution.
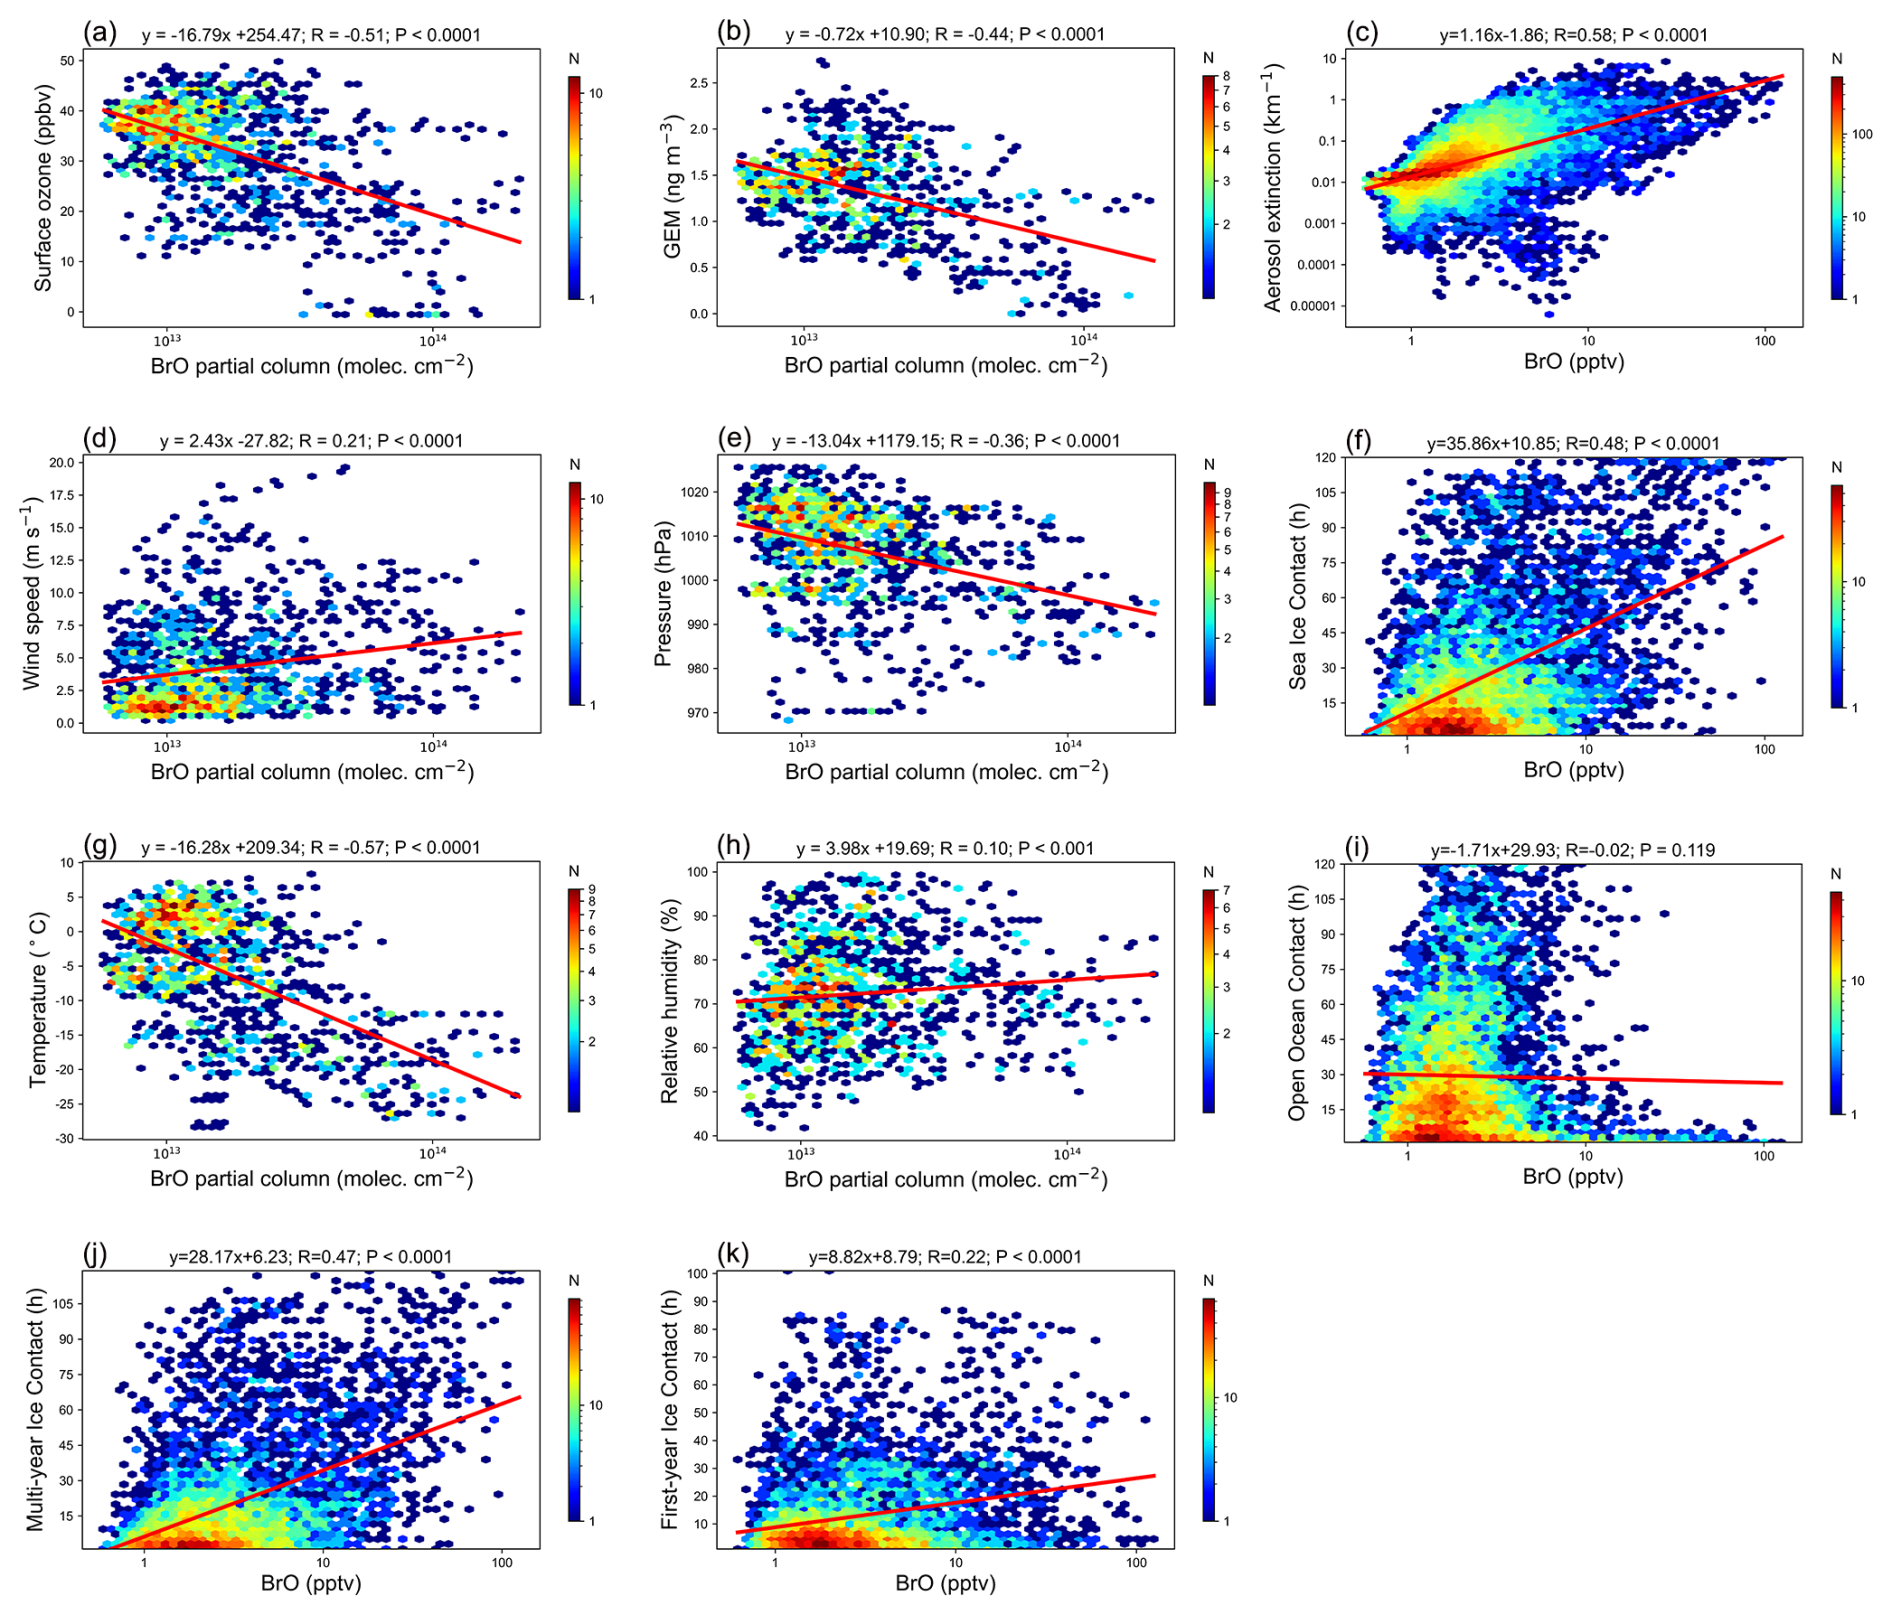
Figure 7Correlation analysis between BrO and various parameters during March–May 2020. BrO partial column correlations are shown for surface ozone (a), GEM (b), wind speed (d), pressure (e), temperature (g), and relative humidity (h). BrO VMR profile correlations are shown for aerosol profiles (c), total sea-ice contact time (f), open-ocean contact time (i), MYI contact time (j), and FYI contact time (k).
Moving to the back-trajectory-based analysis, BrO shows a significant positive correlation with total sea-ice contact time (including both MYI and FYI; r=0.48, p<0.0001), whereas no significant correlation was found with open-ocean contact (, p=0.145). When separated by ice type, BrO exhibits a statistically significant positive correlation with MYI contact time (r=0.47, p<0.0001), stronger than its correlation with FYI (r=0.22, p<0.0001). These results suggest that BrO observed in Ny-Ålesund during the spring of 2020 originated predominantly from sea ice regions.
To examine whether the identified relationships are robust under different atmospheric conditions, we further analyzed data from 2019, which is characterized by relatively lower BrO levels. Figures 8 and 9 present the time series and correlation analyses for March–May 2019. In 2019, BrO partial columns still exhibited negative correlations with surface ozone () and GEM (), as well as with air temperature () and pressure (). A positive correlation with wind speed was also observed (r=0.18), indicating a continued influence of blowing-snow-sourced SSA on reactive bromine release. Similar to 2020, BrO VMR in 2019 showed a strong positive correlation with aerosol extinction (r=0.52), further supporting a close link between atmospheric particles and elevated BrO levels. In addition, BrO exhibited a significant positive correlation with relative humidity in 2019 (r=0.36). This positive relationship may be associated with enhanced heterogeneous uptake of HOBr on acidified sea-salt aerosols under humid conditions, as the reactive uptake coefficient increases with relative humidity and reaches a maximum at a relative humidity of approximately 75 %–80 % (Pratte and Rossi, 2006; Roberts et al., 2014). Moreover, hygroscopic growth of sea-salt aerosols at high humidity may further influence heterogeneous reaction efficiencies (Zieger et al., 2017; Tang et al., 2019).
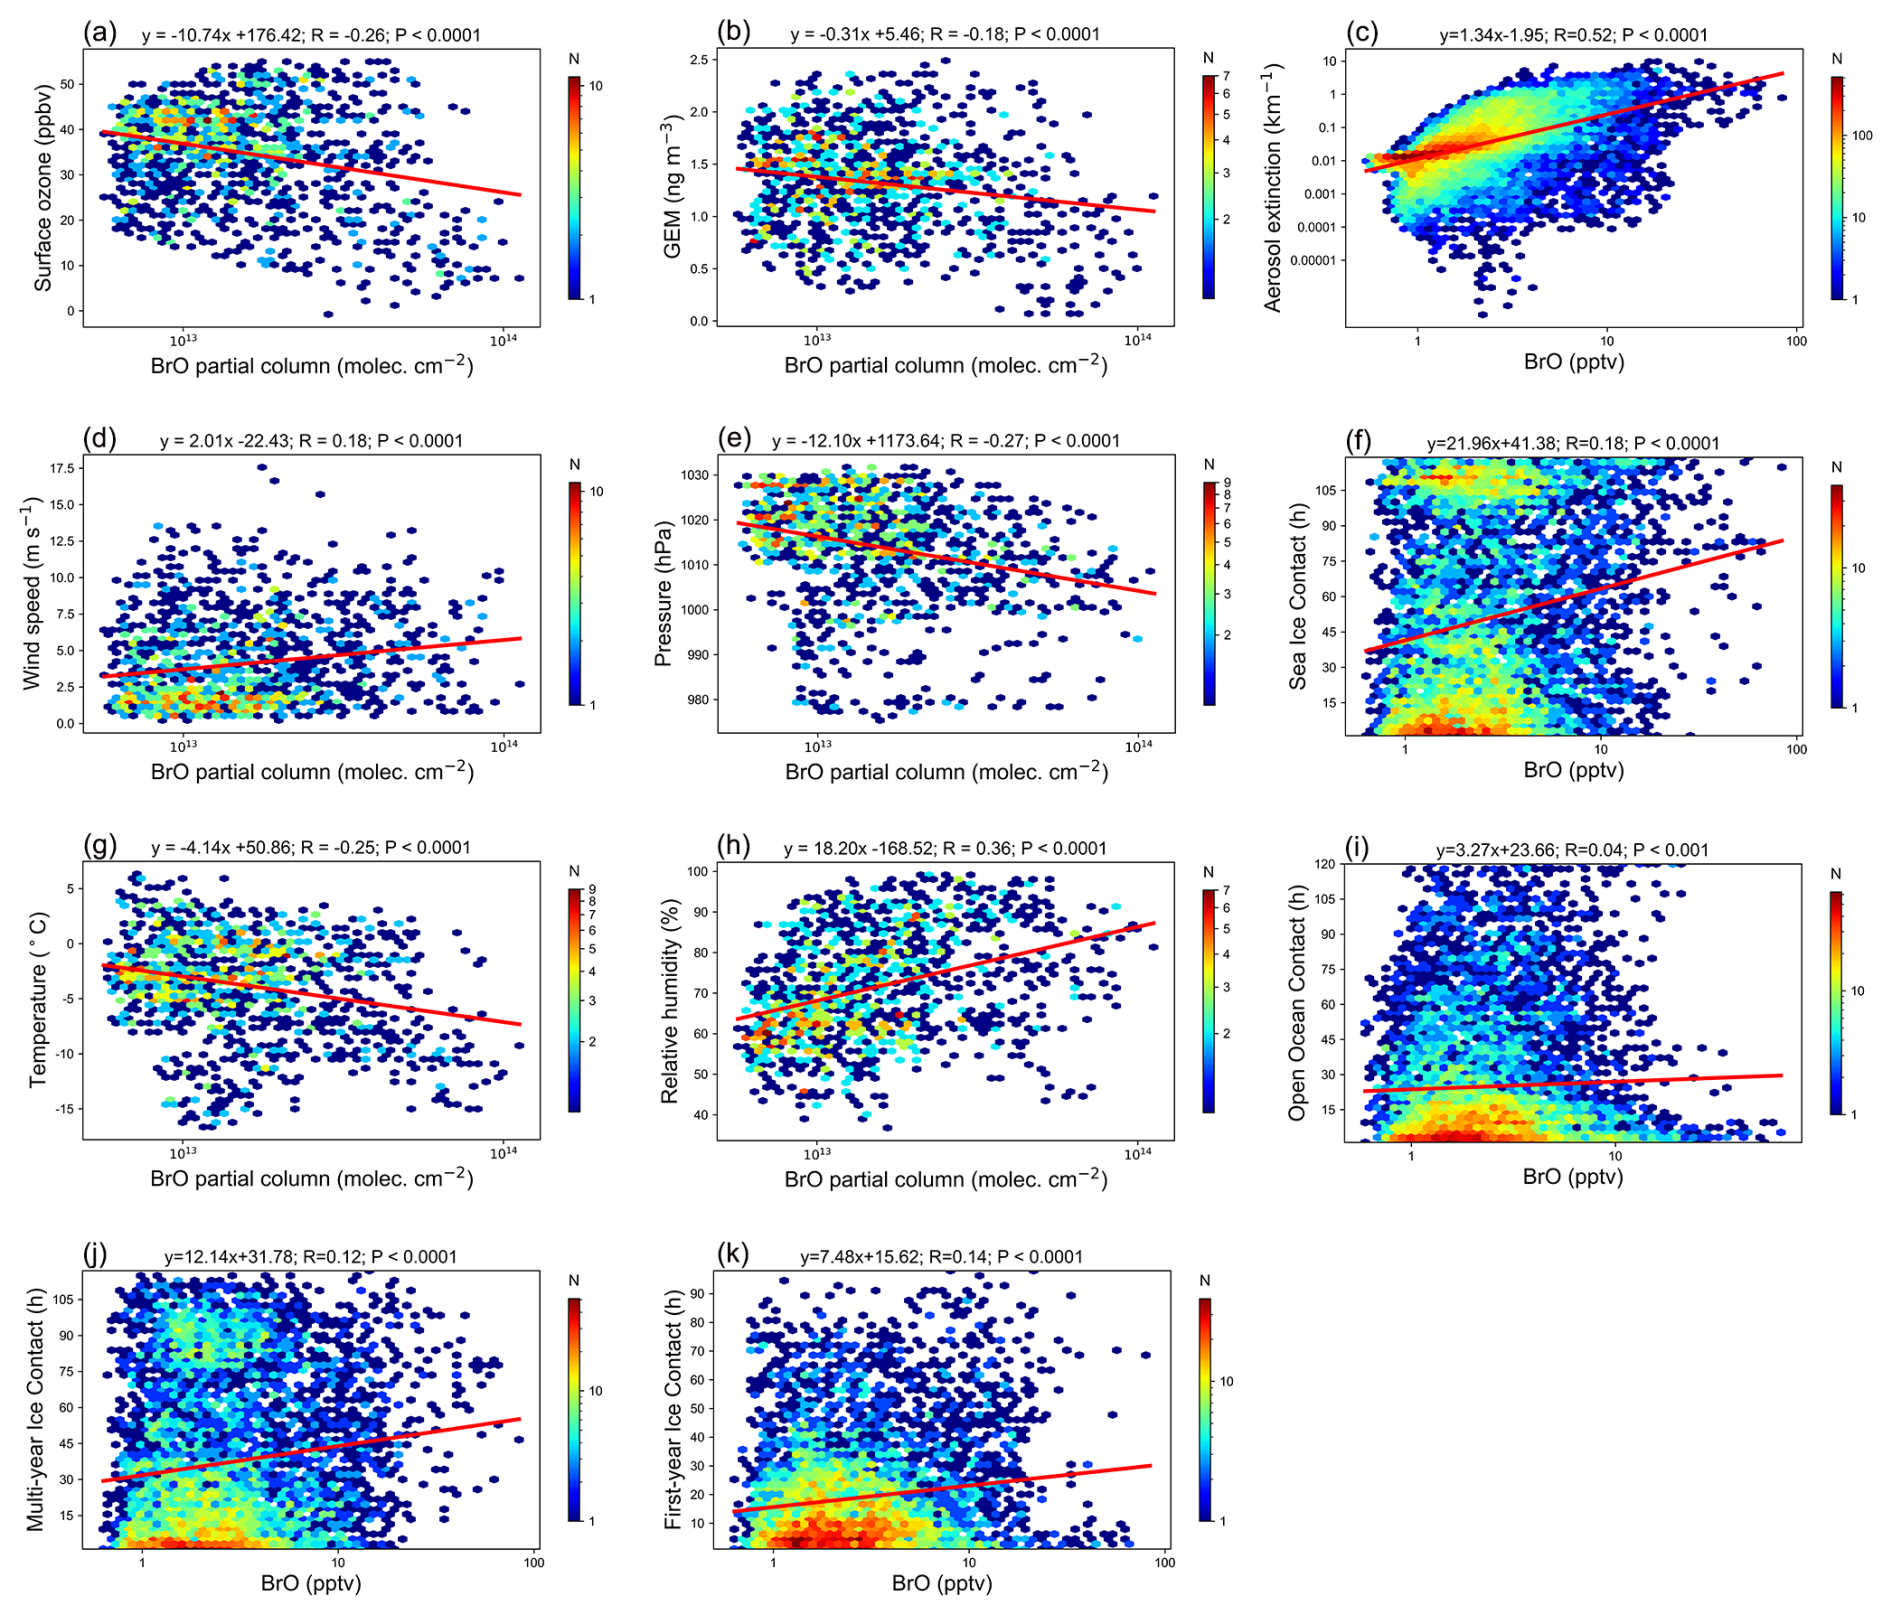
Back-trajectory analysis for 2019 also revealed positive correlations between BrO and total sea-ice contact time (r=0.18), as well as with MYI (r=0.12) and FYI (r=0.14), whereas no significant correlation was found with open-ocean contact (r=0.04). Although these correlations were weaker than those observed in 2020, they consistently indicate that sea ice regions remained an important source of reactive bromine in both years. Overall, the comparison between 2019 and 2020 demonstrates that, despite substantial interannual differences in BrO abundance, the dominant relationships among BrO, aerosols, sea ice contact, and meteorological conditions are consistent, indicating robust underlying physical-chemical processes that determine polar bromine chemistry across different years.
Then, we conducted separate correlation analyses for the first and second halves of the observation period, and the results are shown in Figs. S7–S10. For both 2019 and 2020, BrO VMR exhibits a stronger positive correlation with sea-ice contact time during the first half of the period (1 March–15 April) than during the second half (16 April–31 May). In 2020, the correlation decreases from 0.52 in the first half to 0.21 in the second half, and in 2019 from 0.39 to 0.07. This suggests that sea-ice contact is more closely associated with BrO variability in early spring. In contrast, during the second half of the period, BrO VMR and aerosol extinction tend to show enhanced positive correlations with open-ocean contact time. For example, in 2020, the correlation between BrO VMR and open-ocean contact increases from −0.31 in the first half to 0.27 in the second half, while that for aerosol extinction increases from −0.14 to 0.34. Similar tendencies are also observed in 2019. These differences are related to the seasonal evolution of sea ice conditions. In early spring, extensive and stable sea ice coverage, associated with photochemical processes in surface snow and blowing snow, may lead to a stronger association between BrO and sea-ice contact. Toward late spring, gradual sea ice melting and retreat increase the extent of open ocean, which may enhance the influence of open ocean regions on reactive bromine and aerosol variability. Overall, our time series analysis suggests a seasonal shift in the relative influence of sea-ice and open-ocean contact on BrO and aerosol variability from early to late spring.
We also analyzed correlations between BrO partial columns and AOD, using total sea-ice and open-ocean contact time summed vertically over 0–3 km, as shown in Figs. S11–S14. For both 2019 and 2020, BrO partial columns exhibit stronger positive correlations with total sea-ice contact in the first half of the period (1 March–15 April) than in the second half (16 April–31 May), while correlations with total open-ocean contact tend to increase in the second half. AOD shows generally weaker correlations and a somewhat different seasonal pattern than BrO. These vertically integrated results are generally consistent with the profile analysis (Figs. S7–S10) and indicate a seasonal shift in the relative influence of sea-ice and open-ocean contact on BrO and aerosol variability.
In addition, we compared MAX-DOAS AOD with collocated AERONET Level 2.0 observations at Ny-Ålesund (https://aeronet.gsfc.nasa.gov/, last access: 6 May 2026). MAX-DOAS AOD was retrieved at 361 nm, while AERONET AODs at 340 and 380 nm were converted to 361 nm using the Ångström exponent and then averaged. During March–May (2017–2023), only a weak correlation was found (R=0.14, p<0.001) (Fig. S15). However, under clear-sky conditions, MAX-DOAS AOD shows a strong positive correlation with AERONET AOD (R = 0.72–0.83) (Fig. S16a–b), whereas under cloudy or low-visibility conditions the correlation becomes insignificant (Fig. S16c–d). The discrepancy is mainly attributed to AERONET measuring the total AOD (including both tropospheric and stratospheric contributions), whereas MAX-DOAS mainly retrieves aerosol extinction in the lower troposphere (0–4 km). AERONET relies on direct-sun measurements, whereas MAX-DOAS is based on scattered sunlight and measures air masses extending horizontally over several kilometers. Consequently, the two instruments generally sample different atmospheric air masses. These results indicate that AERONET AOD may be suitable for evaluating MAX-DOAS AOD only under clear-sky conditions, when aerosol extinction in the boundary layer dominates the tropospheric AOD (Frieß et al., 2016; Davis et al., 2020). Furthermore, significant positive correlations were found between MAX-DOAS BrO partial columns and MAX-DOAS AOD (R = 0.54) as well as AERONET AOD (R = 0.32) during March–May (2017–2023) (Fig. S17), indicating a close association between BrO enhancements and airborne particles.
In Sect. 3.5, we further investigate the origins of reactive bromine air masses and quantify contributions from various sources, including snow over FYI and MYI regions, snowpack emissions, open ocean, and free-tropospheric air.
3.4 Comparison with p-TOMCAT results
The hourly MAX-DOAS BrO partial columns and p-TOMCAT BrO partial columns from March to May 2020 are presented in Fig. 10a. Overall, the MAX-DOAS BrO partial columns show good agreement with the p-TOMCAT BrO partial columns, with a correlation coefficient of 0.65 (p<0.0001) in 2020 (Fig. 10b). During BEEs, p-TOMCAT generally captures the enhancement of BrO, coinciding with the occurrence of ODEs. The modelled BrO partial columns are, on average, approximately 60 % higher than the MAX-DOAS BrO partial columns, which is in line with Yang et al. (2020), who reported that p-TOMCAT simulated BrO tropospheric columns during BEEs were about twice as high as observations. This discrepancy could be attributed to using the entire snowpack salinity, rather than the surface layer salinity, in the SSA parameterization, as bromine release from blowing-snow-sourced SSA responds almost linearly to snow salinity. Another factor that may have influenced bromine emissions is snow age. For instance, increasing the snow age from 1.5 to 3 d is estimated to reduce BrO loading by approximately 30 %. Other processes could also affect bromine chemistry, including the form of emitted reactive bromine. Following our previous modelling setups, we assumed that all emitted bromine was in the form of Br2; however, measurements have shown that it could also be BrCl (Buys et al., 2013; Pratt et al., 2013). In addition to chemical processes, model dynamical processes – such as the representation of the polar boundary layer – could also significantly influence near-surface BrO and ozone simulations (Yang et al., 2020).
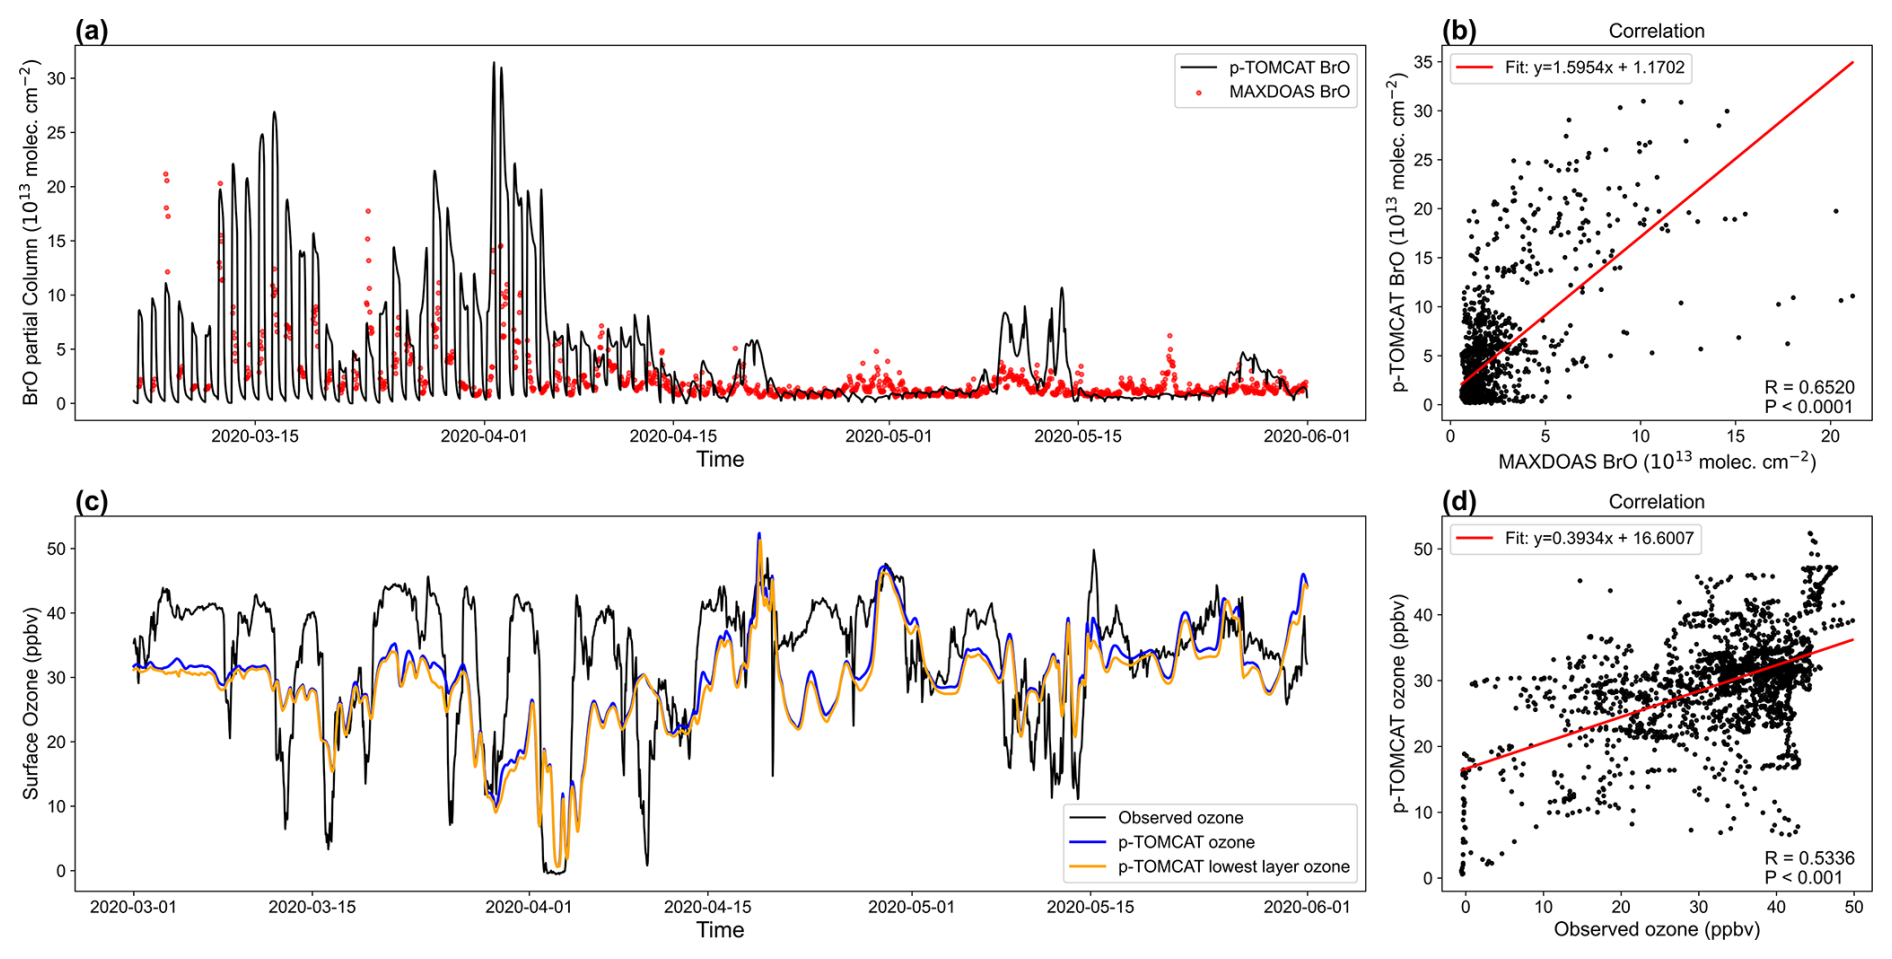
Figure 10Time series of MAX-DOAS (red dots) and p-TOMCAT (black line) BrO partial columns in Ny-Ålesund from March to May 2020 (a), and their correlation with a line fit function (b). Time series of observed surface ozone (black line) at the Zeppelin station (474 m altitude) and p-TOMCAT ozone (blue line) at the corresponding altitude, as well as ozone in the lowest model layer (orange line) (c). Panel (d) shows the correlation between the observations and the corresponding ozone with a line fit function.
Figure 10c presents the hourly surface ozone observations at the Zeppelin station, the corresponding p-TOMCAT ozone at the station height, and the ozone values in the model's lowest layer from March to May 2020. As shown in Fig. 10d, the p-TOMCAT ozone for 2020 is significantly correlated with the ozone observations (r=0.53, p<0.0001), and the model successfully captured major ODEs, such as those on 28–29 March and 2–4 April 2020. However, for short-term ODEs lasting less than one day – such as those on 12, 16, and 25 March – the model fails to capture them accurately. This limitation is likely due to the coarse model resolution, which tends to overlook small-scale events (Yang et al., 2020).
In addition, we performed a sensitivity experiment for the period of March–May 2020 using p-TOMCAT, in which heterogeneous reactivation on aerosols was disabled, while the initial release of reactive bromine from blowing snow was retained. During the March–May 2020 BEEs, the mean BrO partial column (0–4 km) without heterogeneous reactivation was 1.788 × 10¹³ molec. cm−2, only about 15 % of the value with heterogeneous reactivation. The mean surface BrO VMR was 14.45 pptv in the simulation with heterogeneous reactivation, compared to 3.99 pptv without heterogeneous reactivation, corresponding to an enhancement factor of 3.62. This indicates that the initial release alone is insufficient to sustain elevated BrO levels without heterogeneous recycling on aerosols. When heterogeneous reactivation was included, the total inorganic bromine Bry (including BrO, Br, Br2, BrNO2, BrONO2, HBr, and HOBr) increased by ∼ 20 % (Fig. S18a), and the ratio increased by a factor of ∼ 6.7, from 0.06 to 0.40 (Fig. S18b). This demonstrates that heterogeneous reactivation substantially enhances both the total inorganic bromine level and the partitioning of BrO within Bry. Heterogeneous reactivation affects bromine chemistry in two ways: (i) efficient conversion of bromine reservoir species into reactive bromine, leading to increased BrO partitioning, and (ii) consequently reduced depositional loss of Br-containing species from the air. Overall, while the initial release of reactive bromine serves as a reservoir of bromine, heterogeneous recycling on aerosols plays a dominant role in sustaining high BrO levels.
3.5 Source analysis of BrO
3.5.1 Origins of air mass during BEEs and non-BEEs
Figure 11 illustrates the proportion of air-mass contact time with different surface types (<500 m) along the 5 d backward trajectories of air masses during BEEs and non-BEEs in Ny-Ålesund. Air masses located above 500 m were classified as belonging to the free troposphere. From March to May, air masses associated with BEEs exhibited the highest contact time with sea ice, accounting for approximately half of the total time (54.7 % in March, 50.9 % in April, and 48.8 % in May; see Table S1 in the Supplement). The free troposphere represented about one-third of the total time (34.9 %). When the boundary layer height was set to 1000 m, the proportion of free troposphere contact time decreased substantially to ∼ 15 %, while the sea-ice contact time increased to 65.9 % (see Table S2). Throughout March to May, the contact time of BEE-related air masses with the open ocean and land remained low, at approximately 6.8 % and 6.3 %, respectively, indicating that BEEs in Ny-Ålesund were primarily influenced by sea ice. In contrast, about 80 % of non-BEE-related air masses were located in the free troposphere, with relatively low contact times with open ocean and sea ice over the same period.
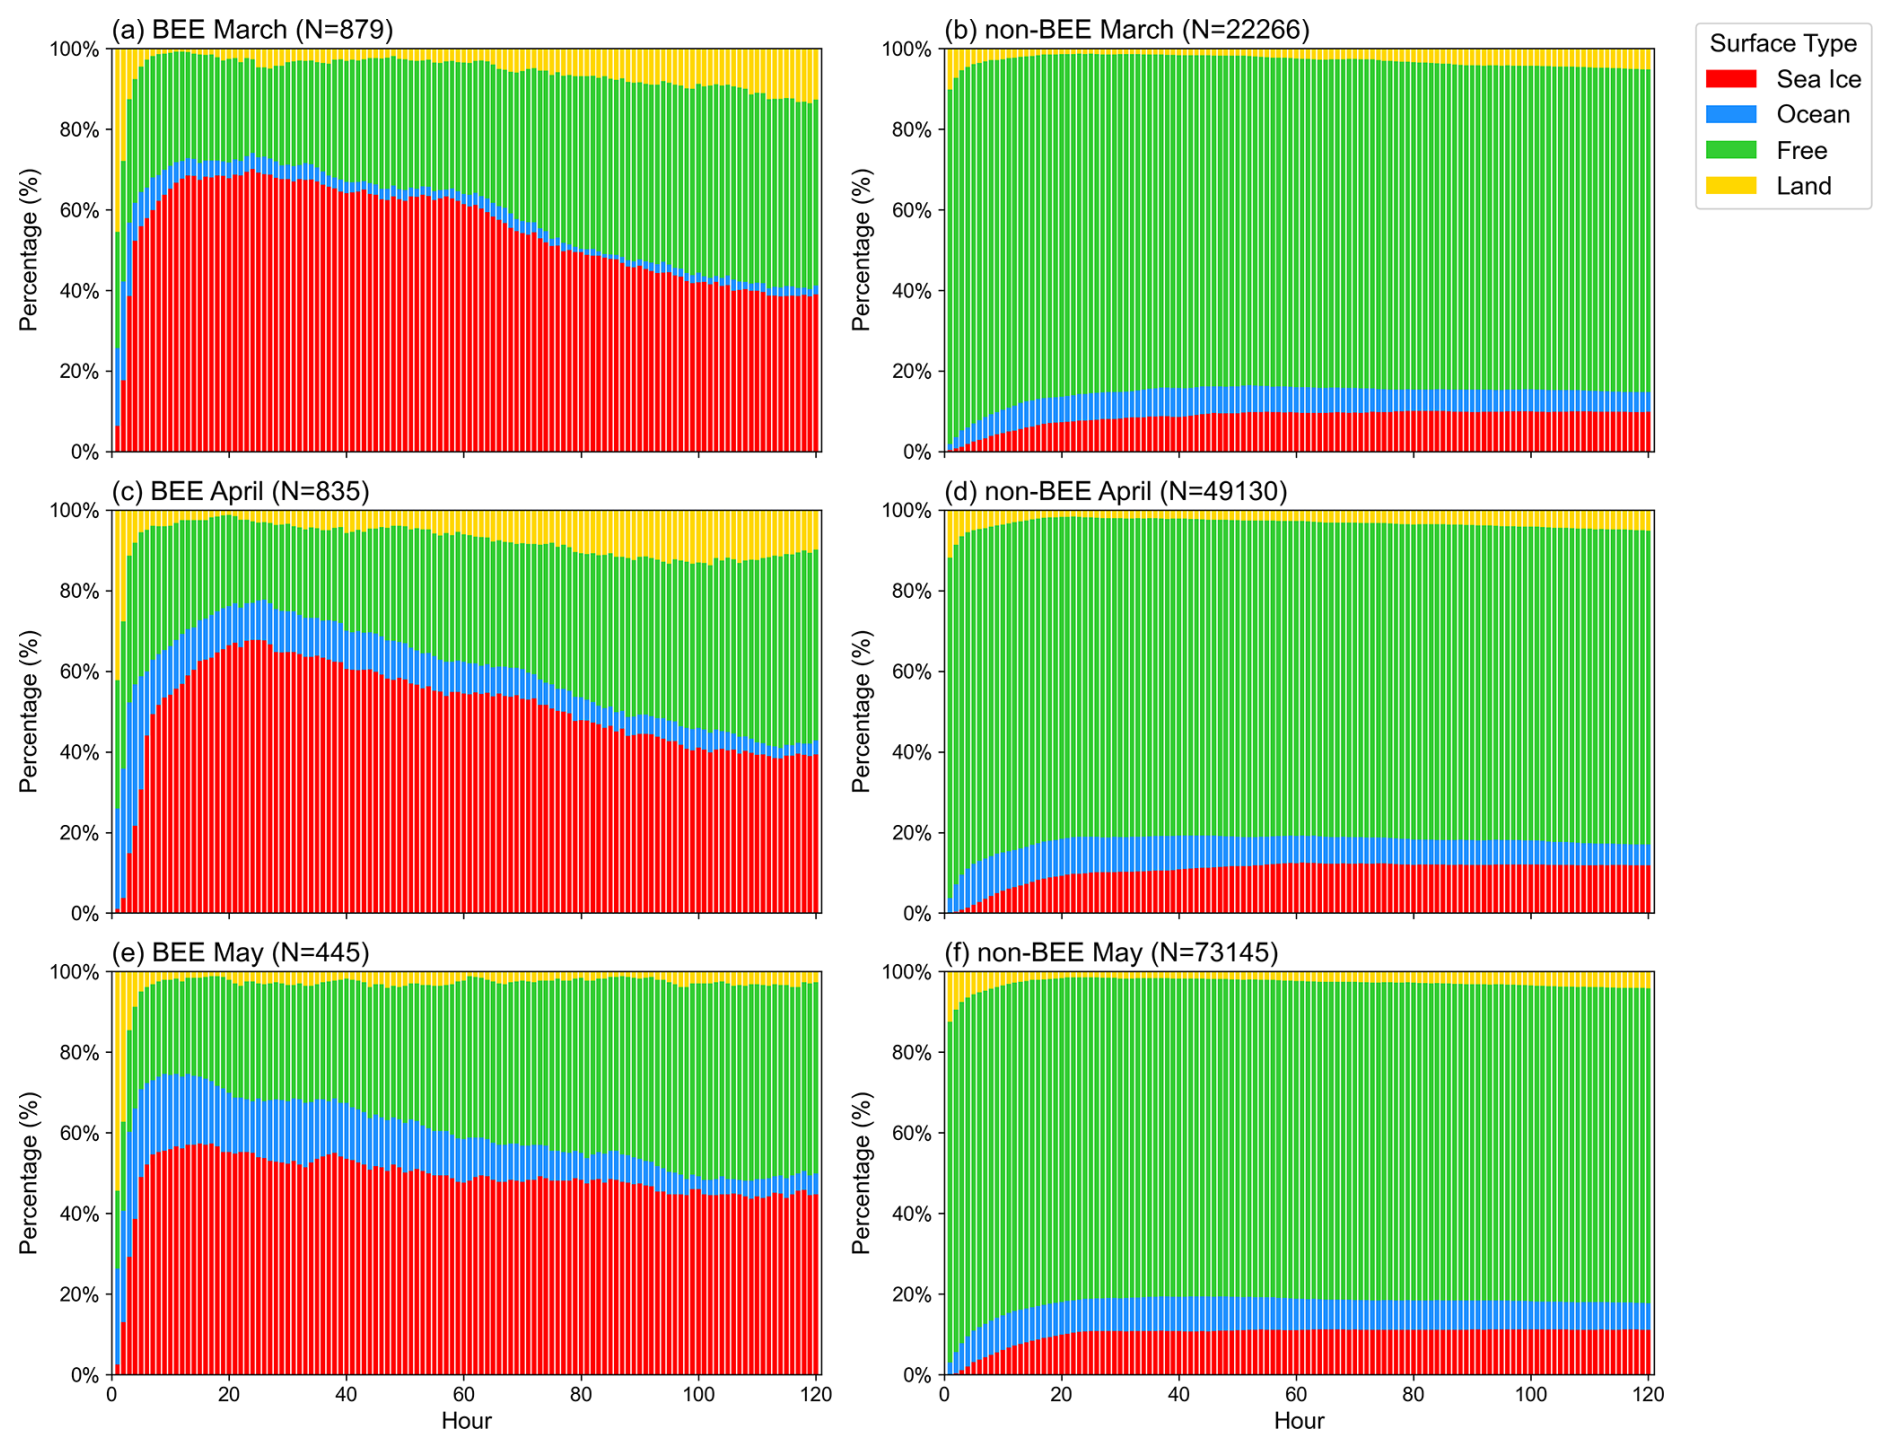
Figure 11Percentage of air-mass contact times with sea ice, open ocean, free troposphere and land along the 5 d backward trajectories during the identified BEEs and non-BEEs in Ny-Ålesund in March (a, b), April (c, d), and May (e, f) for the period of 2017 to 2023. The number N in each panel represents the monthly cumulative total of hours for air mass in each 200 m altitude interval within the 0–3 km range.
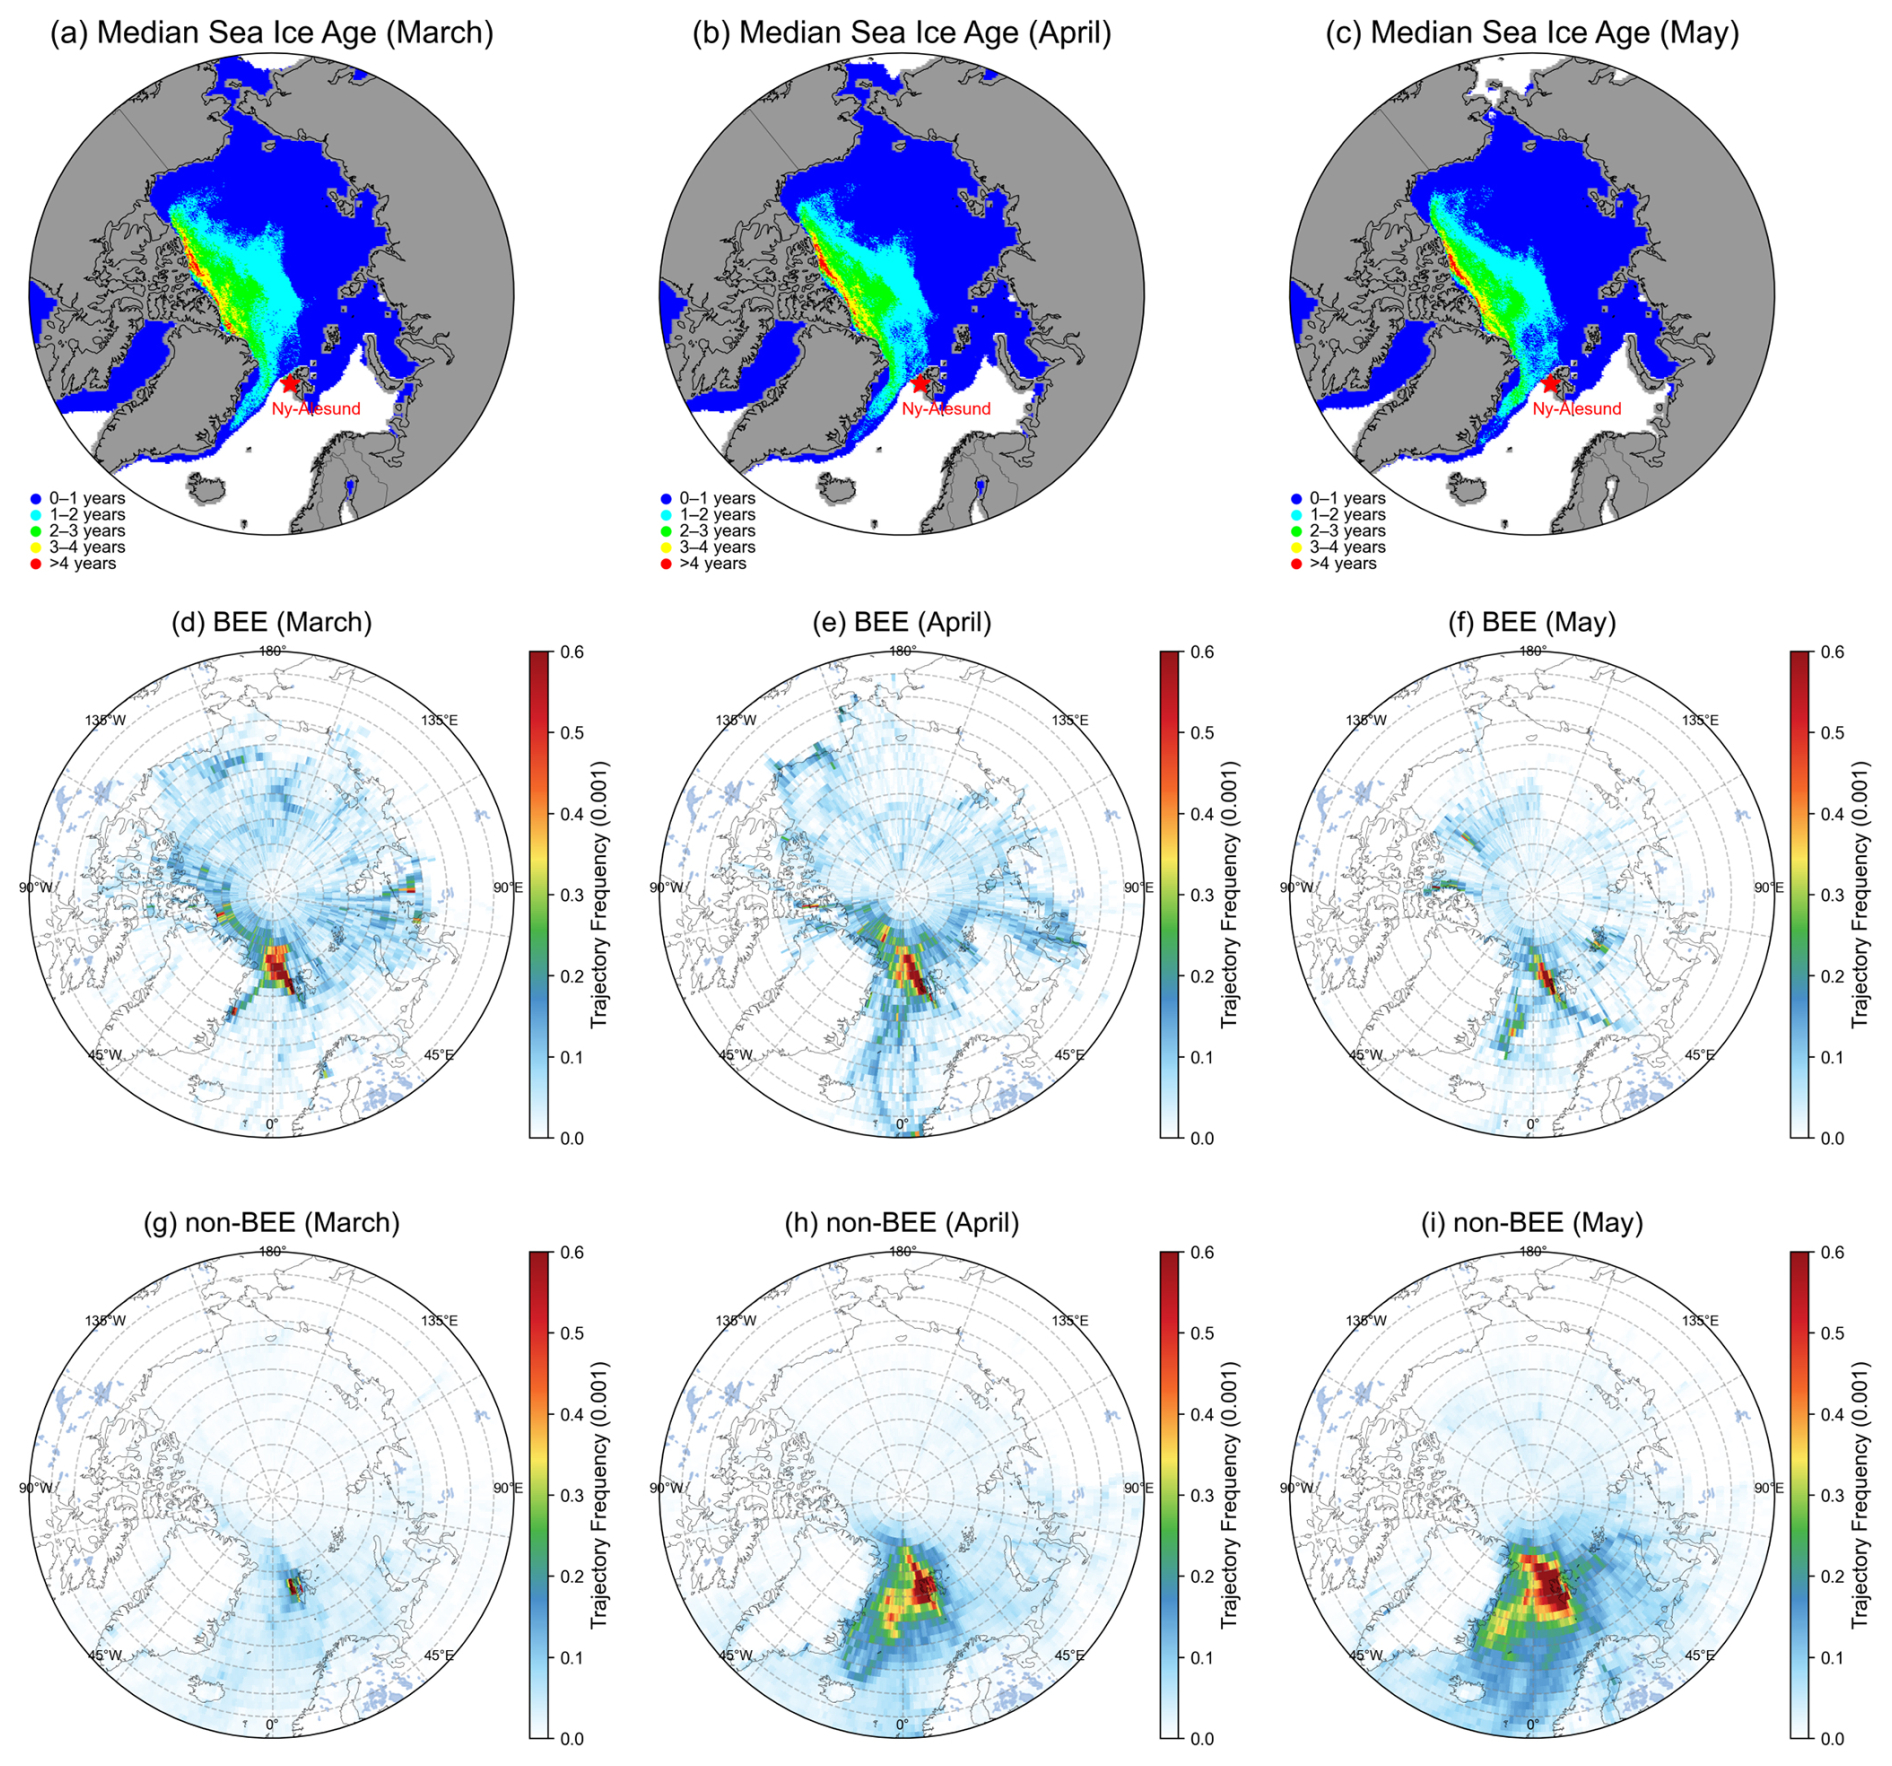
Figure 12Monthly median sea ice age (a–c) and the frequency of air masses along the 5 d backward trajectories when the air masses are below 500 m during BEEs (d–f) and non-BEEs (g–i) in Ny-Ålesund for March, April, and May during 2017–2023.
To investigate the sources of reactive bromine in Ny-Ålesund, we followed the approach used in previous studies to determine air mass origins from the back-trajectory outputs of the HYSPLIT model (Pernov et al., 2024; Frieß et al., 2023). If any hourly trajectory point of an air mass associated with a BEE was located below 500 m, that point was included in the analysis. For each specific month, the total number of hourly trajectory points in each 1° × 1° surface grid was divided by the total number of hourly trajectory points in all grids during the three-month period (March–May), yielding the trajectory frequency distributions for each month during BEE events (Fig. 12d–f). The same procedure was applied to non-BEE events, with the results shown in Fig. 12g–i. To highlight the underlying land types, the monthly median distributions of sea ice age for March to May are shown in Fig. 12a–c. During BEEs, more than half of the air-mass contact time within the boundary layer was associated with MYI, with air masses mainly originating from MYI regions rather than FYI regions (e.g., 56.1 % vs. 23.8 %; Fig. S19). During non-BEEs, over 30 % of the contact time was still associated with MYI (Fig. S19). Air masses within the boundary layer along the backward trajectories during BEEs primarily contacted northern sea ice, with more than two-thirds of the sea-ice contact time linked to MYI and only one-third to FYI (Fig. S19). The fractions of MYI and FYI contact within the total sea-ice contact time did not change substantially during non-BEEs (Fig. S19). In contrast, during non-BEEs, the percentage of air-mass contact time (below 500 m) with open ocean increased significantly, rising from 10.5 % during BEEs to 35.5 % (Fig. S19). These results indicate that, throughout spring, reactive bromine arriving in Ny-Ålesund was primarily influenced by snow over MYI regions rather than younger ice, suggesting that snow over MYI regions may serve as a significant source of reactive bromine in the region.
Ny-Ålesund lies in a valley that typically channels local winds into northwesterly and southeasterly directions. Figure S20 shows the wind distribution measured in Ny-Ålesund from March to May during 2017–2023 for BEE and non-BEE periods. During BEEs, the wind rose exhibits a bimodal distribution, with nearly 50 % of the time associated with northwesterly winds (270–360°) and approximately 30 % with southeasterly winds (90–180°). Compared to southeasterly winds, northwesterly winds are associated with a higher proportion of strong winds. For BEEs, the 5 d backward trajectories of air masses arriving from the northwest show an average contact with sea ice of ∼ 60 % and with open ocean of less than 5 %, while air masses from the southeast also exhibit a substantial sea-ice contact of ∼ 40 % and an average open-ocean contact of ∼ 10 %. In contrast, during non-BEE periods, more than half the time is dominated by southeasterly winds, with only ∼ 20 % coming from the northwest, and the average contact of these air masses with sea ice and open ocean is both less than 10 %, which may explain the absence of BEEs. These results further support the conclusion that BEEs in Ny-Ålesund were primarily influenced by sea ice.
Noted that our analysis focuses only on influences within the past 5 d. In a recent study, Yang et al. (2024) reported a longer lifetime for atmospheric reactive bromine (as a family) of approximately 17–42 d, which is significantly longer than the 4–10 d suggested in their earlier studies (von Glasow et al., 2004; Yang et al., 2005). The potential contribution of air masses beyond 5 d is not considered in this study, and the accuracy of backward trajectories decreases significantly for periods longer than 5 d (Humphries et al., 2016; Rößler et al., 2018). To assess the sensitivity of our results, we repeated the calculation with a longer lifetime of 30 d. Minor changes are found in correlations between BrO and the cumulative bromine emission fluxes when the longer 30 d lifetime is used compared with 5 d, e.g. from values of r = 0.14–0.32 (5 d) to 0.12–0.29 (30 d) in the blowing snow flux calculation, and from r = 0.21–0.29 (5 d) to 0.18–0.26 (30 d) in the snowpack flux calculation under high wind speeds, see the section below for details.
3.5.2 Relationships with sea ice
Correlation analyses were performed among BrO VMR (0–3 km), aerosol extinction profiles, contact times over various surface types, and the corresponding bromine emission fluxes calculated from snowpack and SSA over the open ocean and blowing snow. The variables used in these analyses are detailed in Table 2. Pearson correlation coefficients (PCC) were calculated to quantify these relationships (Fig. 13). The most notable finding is that aerosol extinction exhibits the strongest correlation with BrO among all variables, with r values ranging from 0.51 to 0.76 (p<0.0001) from March to May, indicating a close association between airborne particles and the enhancement of reactive bromine in Ny-Ålesund.
Table 2Variables considered in the correlation analysis. BrO, Aer, Fbr, Fbr_si, Fbr_oo, Fbr_snow_FYI, Fbr_snow_Seaice, , , Ssa_si, Ssa_oo, and Ssa were used in logarithmic form when calculating their PCC with other variables. Note that the boundary height is set to 500 m.
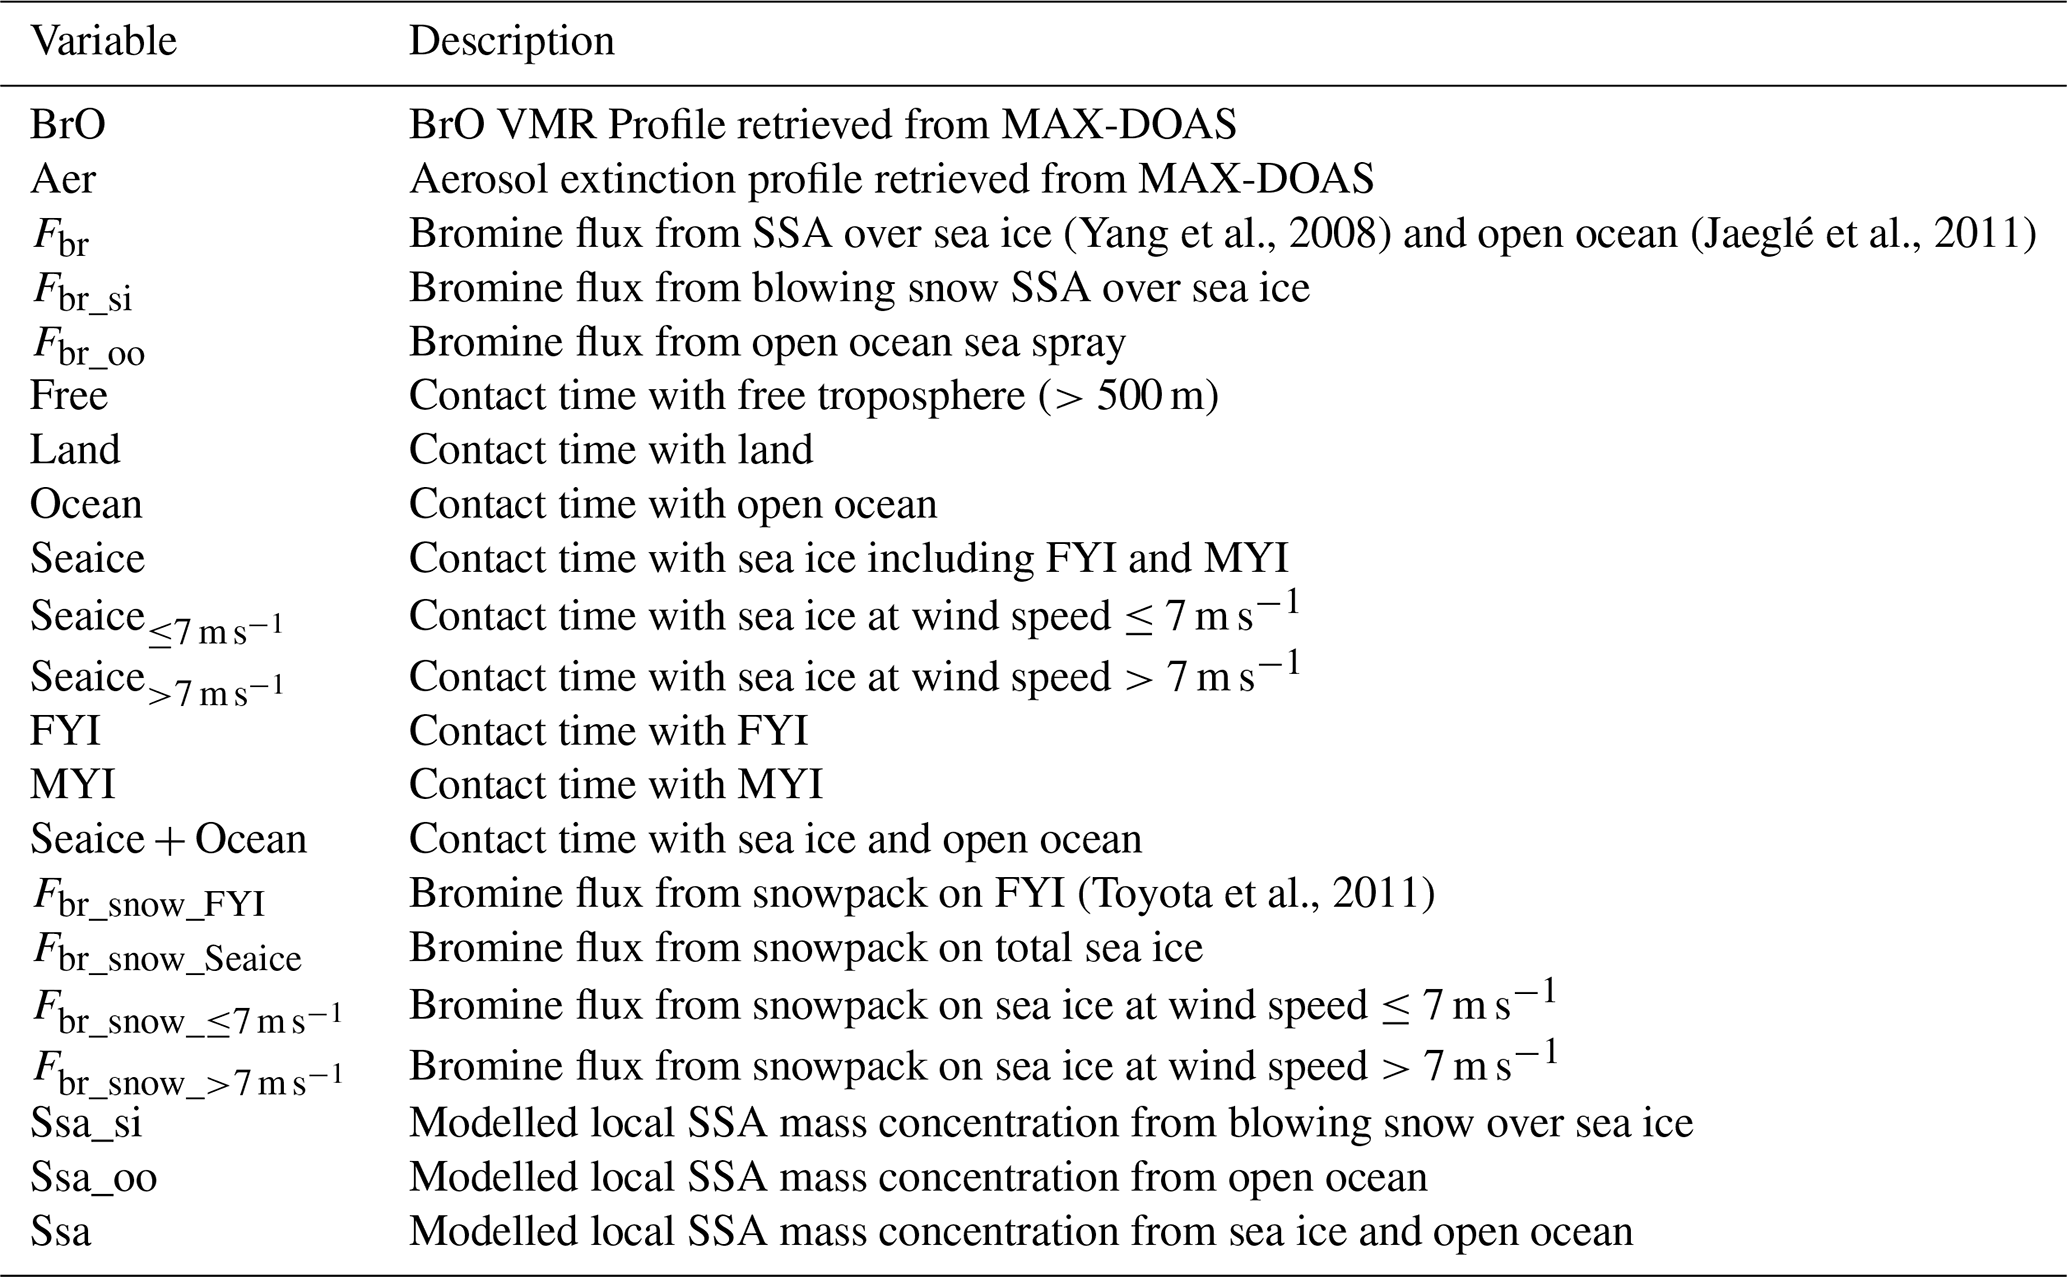
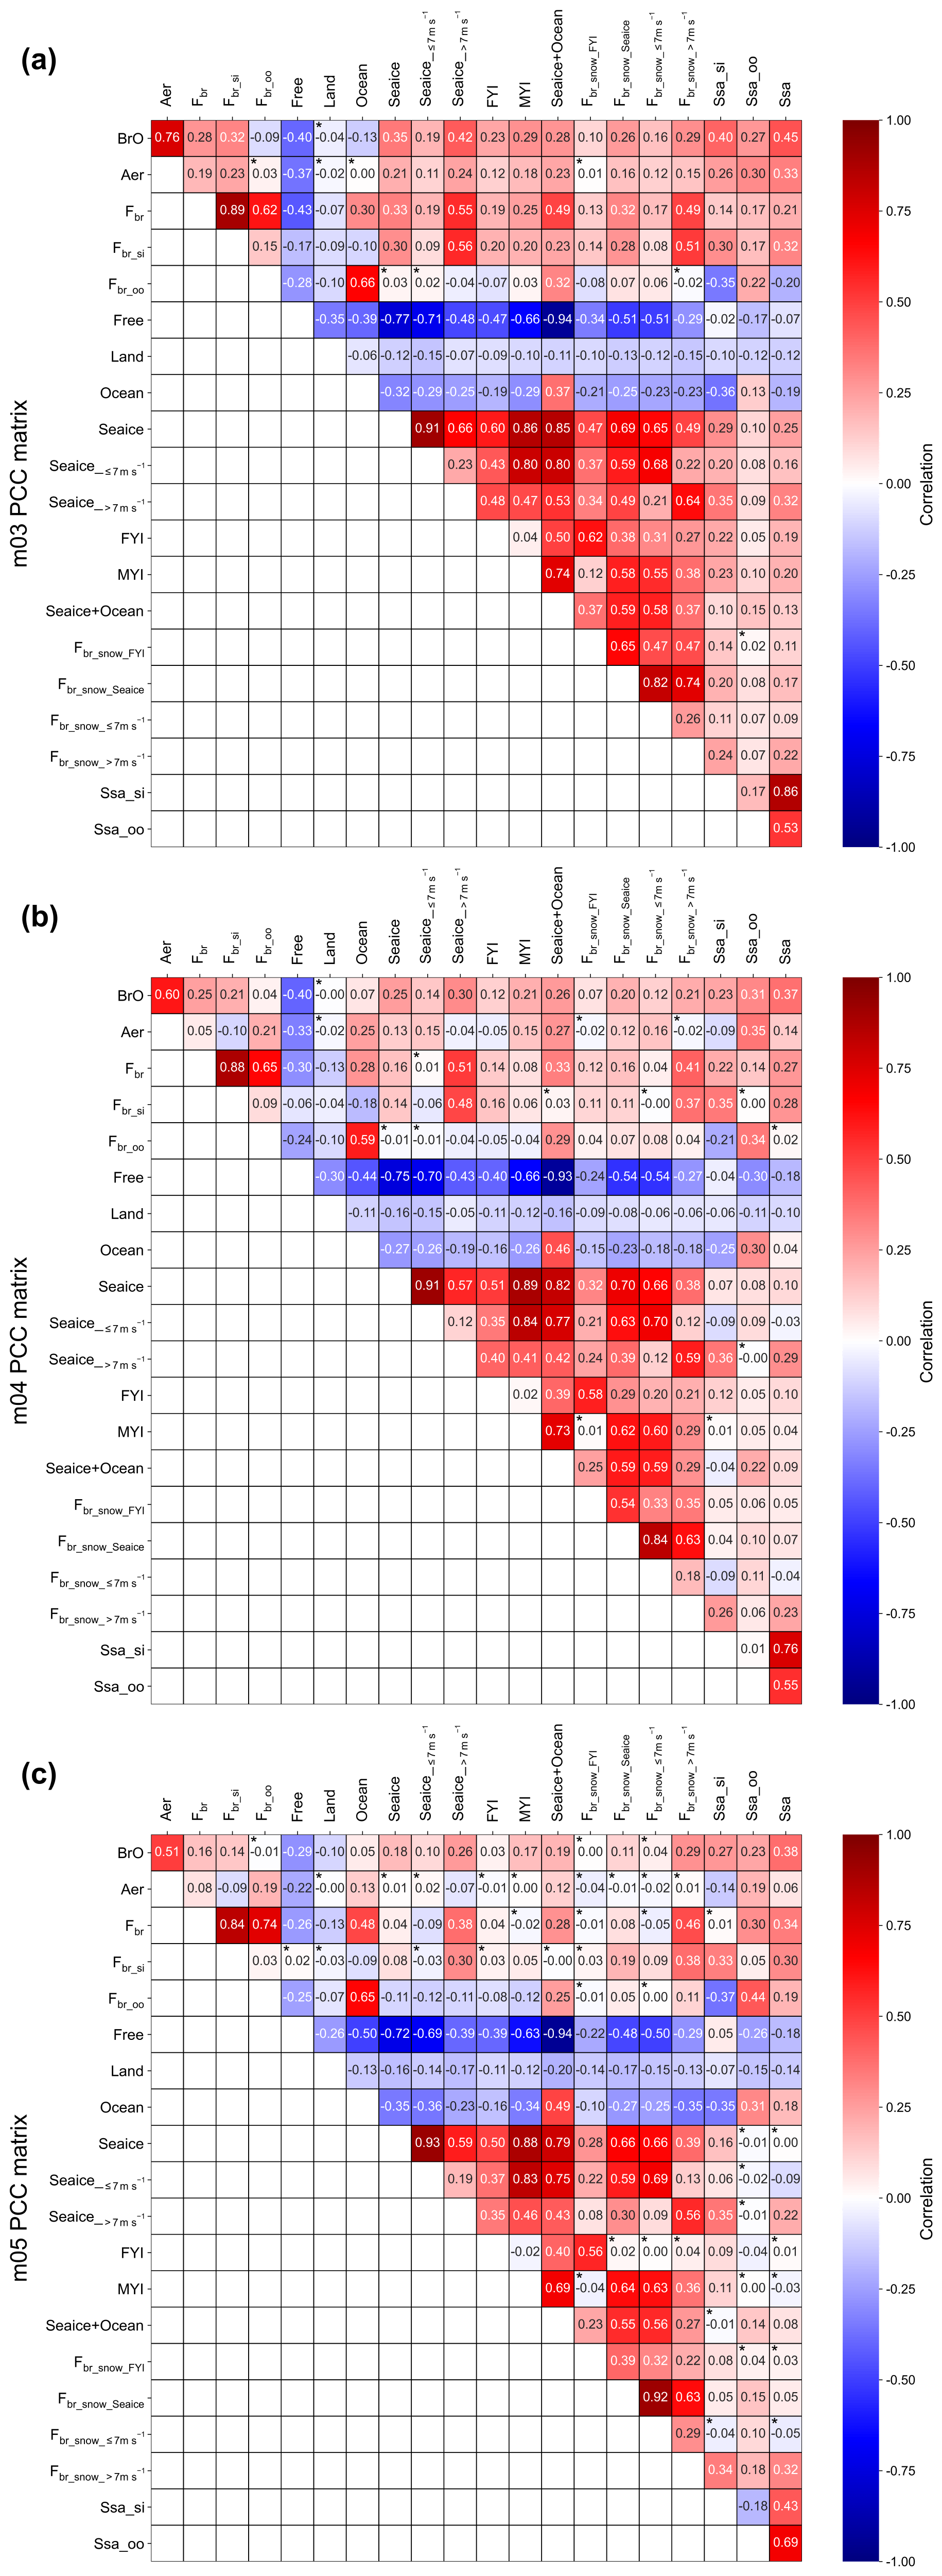
Figure 13Pearson correlation matrix of MAX-DOAS BrO VMR and related variables in Ny-Ålesund for March (a), April (b), and May (c), based on data from 2017–2023 (2017–2022 for Ssa_si, Ssa_oo, and Ssa). Note that Ssa_si, Ssa_oo, and Ssa are local variables, rather than accumulated values along the 5 d backward trajectories. Descriptions of the variables are provided in Table 2. An asterisk (*) indicates cases where the relations are not significant at p-value (of the Pearson correlation) ≥0.0001.
BrO is positively correlated with the contact time of air masses with sea ice, with r ranging from 0.18 to 0.35 (p<0.0001). Similarly, the cumulative bromine emission flux, calculated from blowing snow along the back-trajectories, also exhibits a positive correlation with BrO, with r ranging from 0.14 to 0.32 (p<0.0001). In addition, two further analyses were conducted by segregating sea-ice contact time according to wind speed: one for wind speeds ≤7 m s−1 and another for wind speeds >7 m s−1. The correlation analysis revealed that the r values under high wind speed conditions range from 0.26 to 0.42 (p<0.0001), and are higher than the values of 0.10 to 0.19 (p<0.0001) observed under low wind speed conditions (Fig. S21). These results suggest that strong winds favour reactive bromine release, with one proposed mechanism being SSA production from blowing snow (Yang et al., 2008, 2019). The small positive correlation coefficients under low wind speeds appear to support snowpack-based bromine emissions via photochemical processes. However, this could also be explained by the retention of reactive bromine in the near-surface layer following the cessation of blowing snow events. Based on the combined 2017–2023 data, BrO correlations with open-ocean contact time are generally weak across March–May, with only minor differences between low and high wind conditions (Fig. S22). These results suggest that, unlike the case for sea ice, wind speed does not strongly influence the relationship between BrO and open-ocean contact when all years are considered together.
To further investigate this mechanism, we analyzed the correlations between BrO, aerosol extinction, and modelled SSA mass concentrations from the p-TOMCAT model. BrO is significantly correlated with modelled blowing-snow-sourced SSA (Ssa_si) at Ny-Ålesund, with r ranging from 0.23 to 0.40 (p<0.0001). When open-ocean-derived SSA is included, the correlation coefficients increase to 0.37–0.45 (p<0.0001), providing strong support for SSA as a direct source of reactive bromine. Moreover, aerosol extinction retrieved from MAX-DOAS exhibits a notable positive correlation with modelled blowing-snow-sourced SSA in March (r=0.26, p<0.0001). However, this correlation becomes negative in April () and May (), which may be attributed to enhanced transport of non-sea-salt aerosols from lower latitudes and increased biological activity along with strengthened vertical mixing within the lower troposphere during these months (Xian et al., 2022; Ji et al., 2025).
In addition, BrO is positively correlated with both FYI and MYI from March to May, with correlation coefficients between BrO and contact time with MYI (0.17–0.29, p<0.0001) slightly higher than those with FYI (0.03–0.23, p<0.0001). These indicate that snow over MYI regions could play an important role, as snow over FYI does, in determining BEEs at Ny-Ålesund.
3.5.3 Relationship with open ocean, land and free troposphere
Previous studies have identified the open ocean as a potential source of reactive bromine (Sander et al., 2003). In this study, the correlation between BrO and the contact time of air masses with the open ocean is generally weak or negative, with r ranging from −0.13 to 0.07 (Fig. 13). Similarly, no significant correlation was found between BrO and the cumulative bromine emission flux calculated from the open ocean ( to 0.04). This is primarily due to the relatively small proportion of air masses (<10 % of total trajectory time from March to May; Table S1) that contacted the open ocean during BEEs. An exception occurred in May 2017, when the proportion of air-mass contact time with the open ocean increased markedly to 37 %. This enhanced contact corresponded to a notable positive correlation between BrO and open-ocean contact time (r=0.19, p<0.0001), as well as between BrO and the cumulative bromine emission flux from the open ocean (r=0.23, p<0.0001).
From March to May, BrO is negatively or negligibly correlated with the contact time of air masses with land, with r ranging from 0.00 to −0.10. In contrast, BrO exhibits significant negative correlations with the contact time of air masses with the free troposphere, with r ranging from −0.29 to −0.40 (p<0.0001). These results indicate that neither the free troposphere nor land served as sources of reactive bromine, and that increased air mass influence from the free troposphere may have reduced atmospheric BrO levels.
3.5.4 Relationship with snowpack-sourced bromine
In addition to SSA, snowpack on sea ice has been proposed as reactive bromine source, and this mechanism was examined in this study. Using the parameterization scheme of Toyota et al. (2011), cumulative snowpack bromine emissions were calculated along 5 d back-trajectories from March to May on FYI (denoted as Fbr_snow_FYI) and on total sea ice (denoted as Fbr_snow_Seaice), and these were directly compared with retrieved BrO. The results (Fig. 13) show that BrO exhibits no correlation with Fbr_snow_FYI (r = 0.00–0.10). However, when both FYI and MYI are included (i.e., Fbr_snow_Seaice), a positive correlation emerges, with r values of 0.11–0.26 (p<0.0001), indicating the importance of snow over MYI regions. Under low wind speed conditions (≤7 m s−1, denoted as ), the correlation between BrO and cumulative snowpack bromine flux remains weak (r = 0.04–0.16). In contrast, under high wind speed conditions (), the correlation is stronger (r = 0.21–0.29, p<0.0001), suggesting that snowpack-related bromine emissions may be enhanced by high wind speeds.
3.6 Potential role of MYI in BEEs
To further investigate the importance of snow over MYI regions to BEEs, we present a representative case study of BrO enhancement. This BEE, occurring between the afternoon of 1 April 2020 and 3 April 2020 over Ny-Ålesund, was captured by both GOME-2B satellite observations and ground-based MAX-DOAS measurements as well as p-TOMCAT model (Figs. 14, 15b–c). This BEE event was also well captured by p-TOMCAT model (Fig. 14).
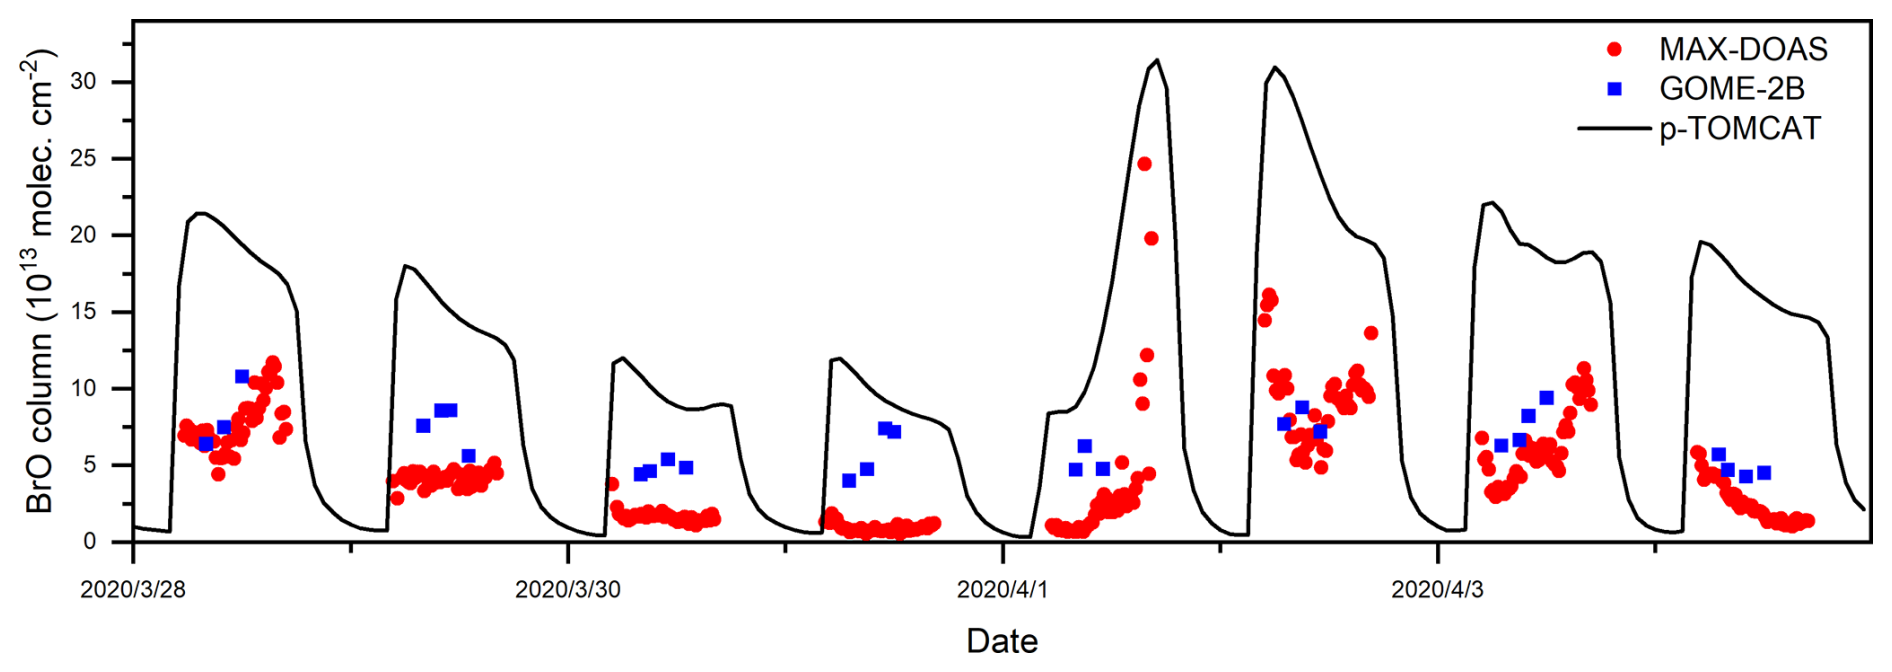
Figure 14MAX-DOAS BrO partial columns (red scatters), GOME-2B tropospheric BrO columns (blue scatters) and p-TOMCAT BrO partial columns (black line) between 28 March and 4 April in 2020 at Ny-Ålesund.
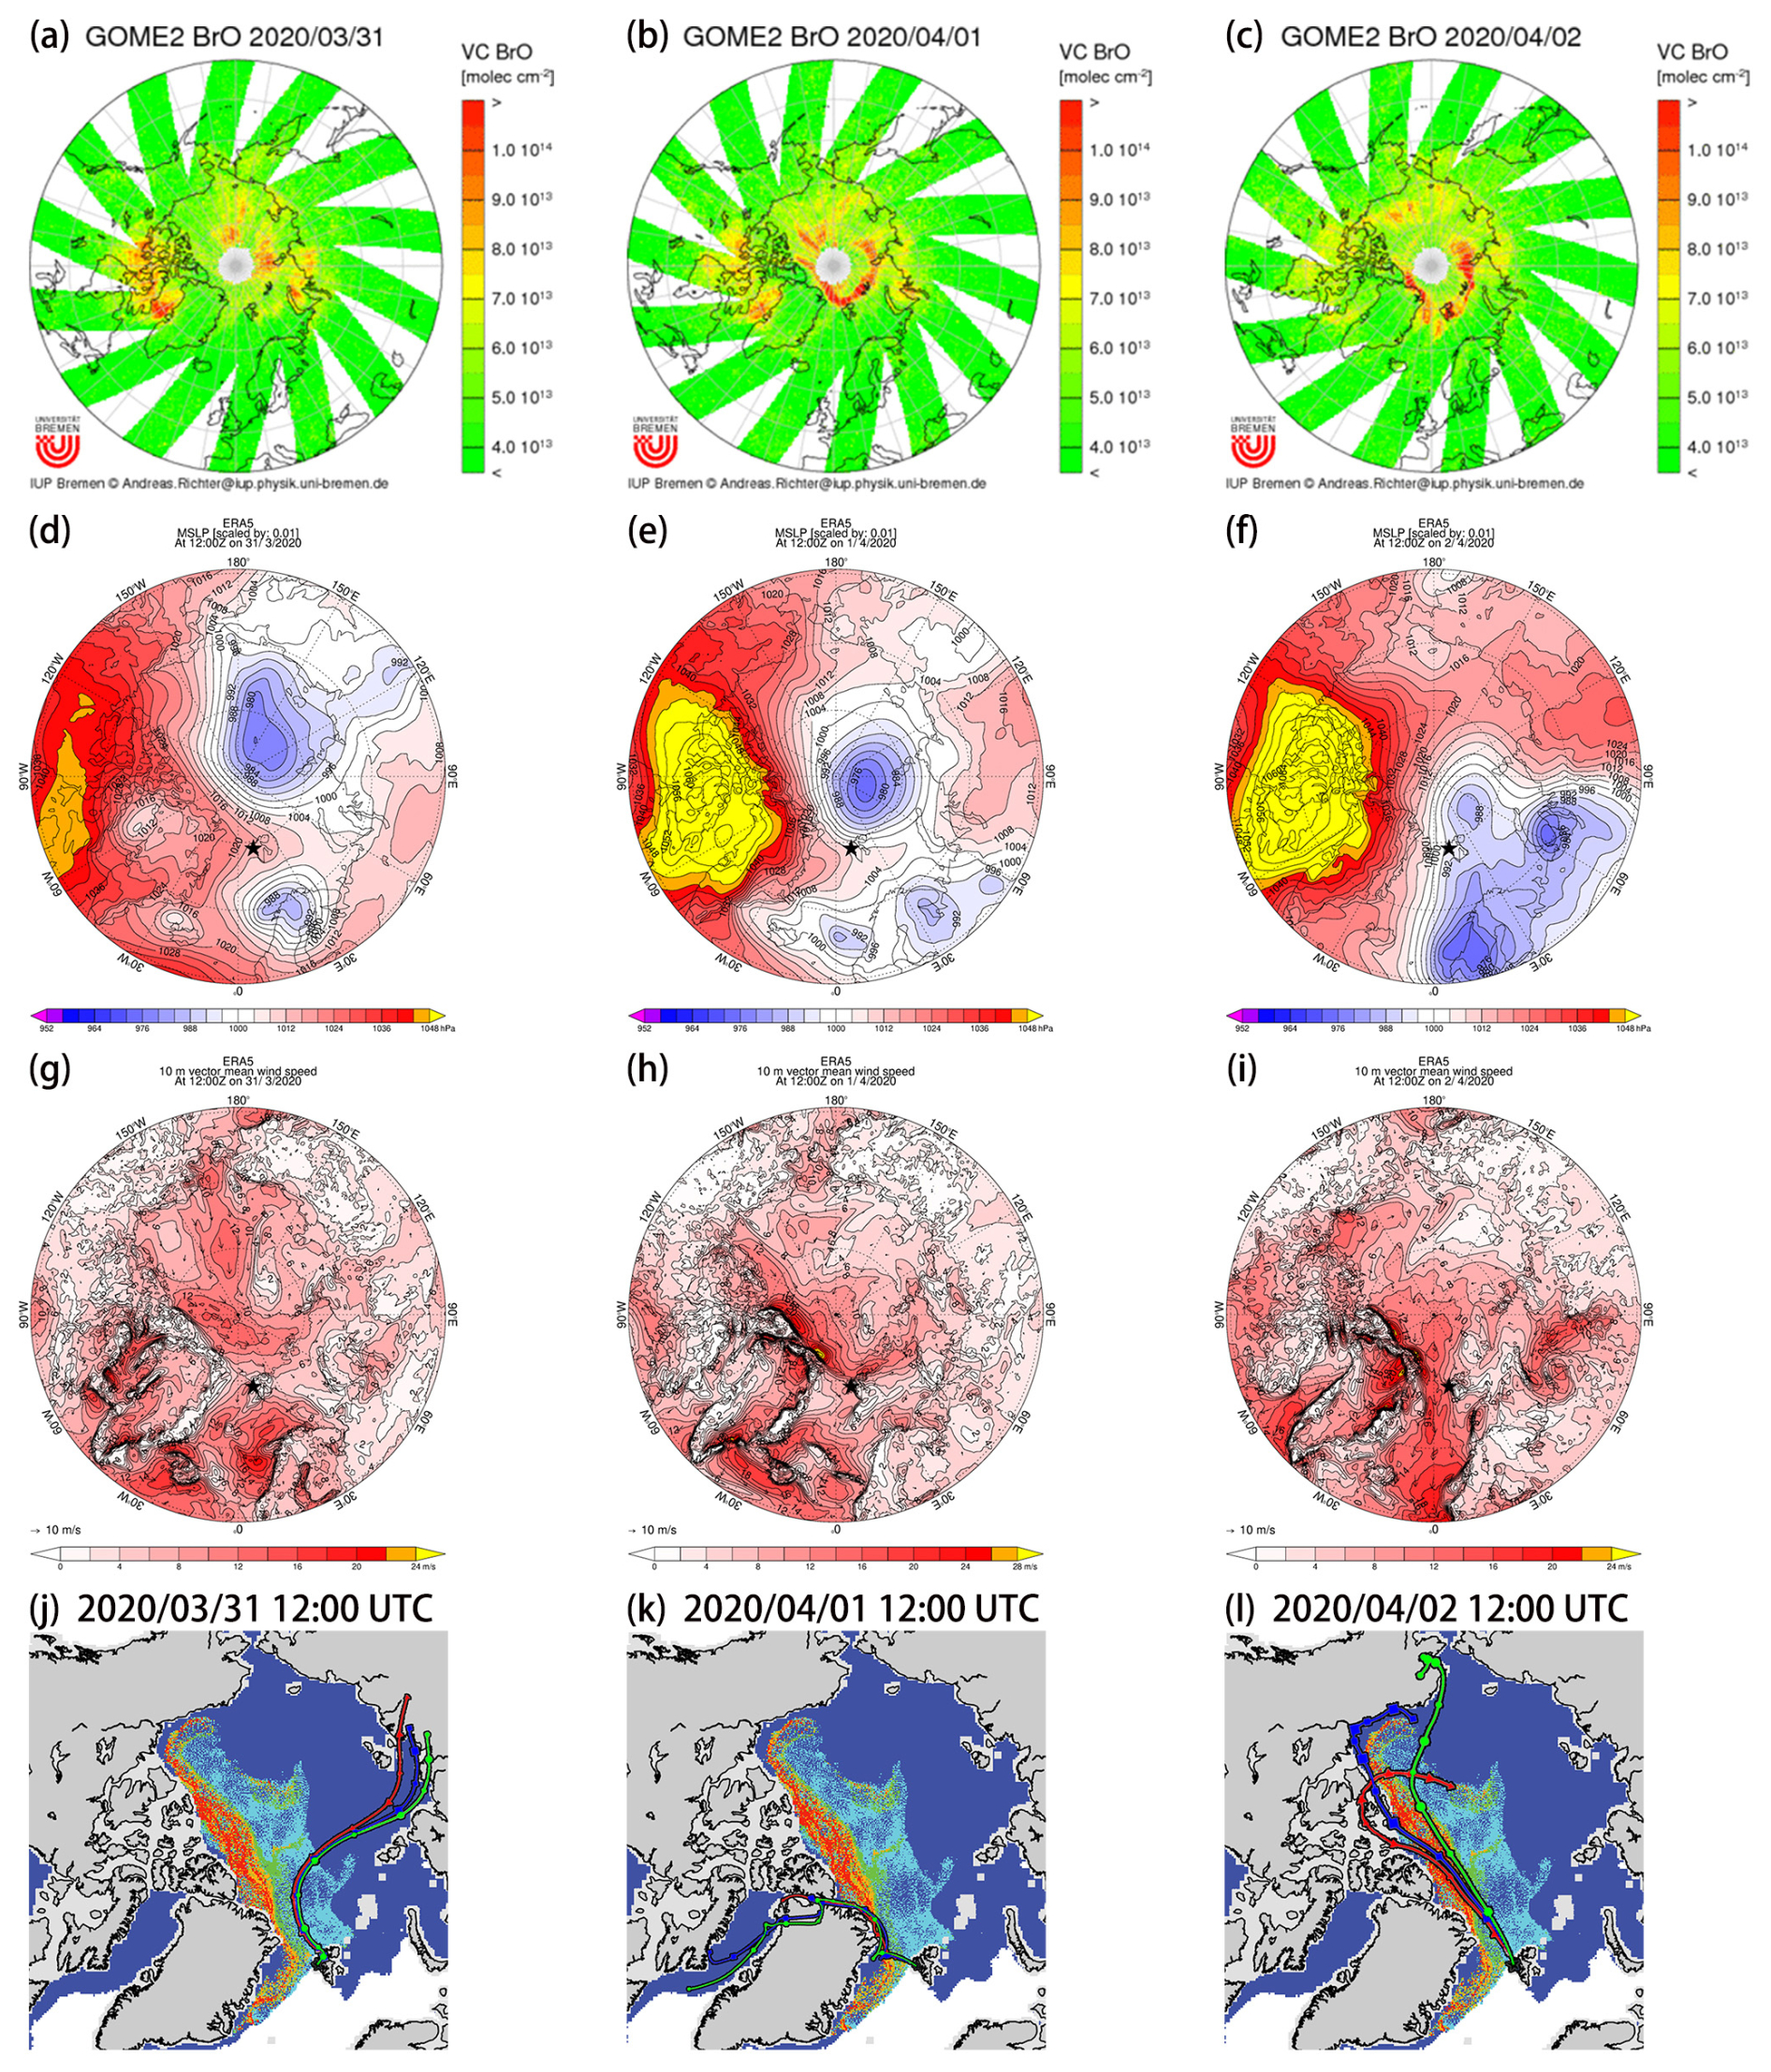
Figure 15(a, b, c) GOME-2B tropospheric BrO columns; (d, e, f) Mean sea level pressure; (g, h, i) wind speed; (j, k, l) Air mass trajectories at 10 m (red line), 200 m (blue line), and 500 m (green line) combined with sea ice, from 31 March 2020, 12:00 UTC to 2 April 2020, 12:00 UTC in Ny-Ålesund.
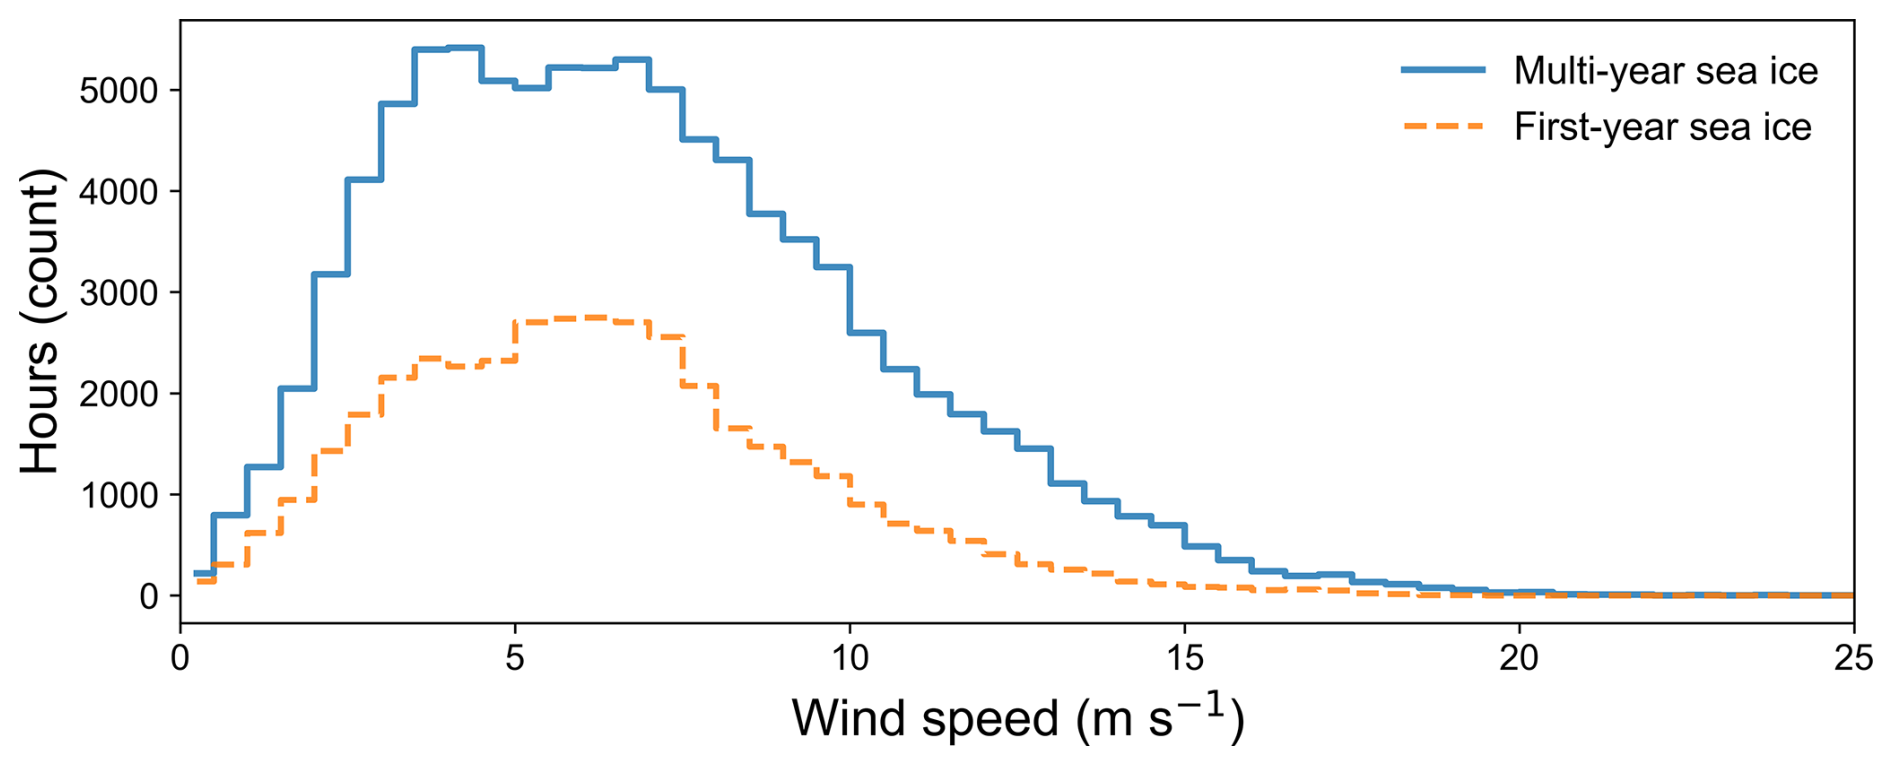
Figure 16Wind speed distributions along backward trajectories of air masses arriving at Ny-Ålesund during BEEs, separated by trajectory segments over MYI and FYI. The distribution represents combined statistics for March–May during 2017–2023, expressed as the total number of hours in each wind-speed bin.
To investigate the source regions of this BrO enhancement, we performed analyses for surface meteorological conditions (Fig. 15d–i) and ran 5 d backward trajectories arriving at Ny-Ålesund at 10, 200, and 500 m altitude, with results shown alongside the sea ice distribution (Fig. 15j–l). As shown, this BEE is associated with an approaching low-pressure system moving from the central Arctic (Fig. 15d–f). Under this system, air masses over the MYI regions were constrained by Greenland's topography and experienced enhanced surface winds (Fig. 15g–i). Before the low-pressure system approached Ny-Ålesund (ahead of 12:00 1 April), air masses were mainly from FYI (Fig. 15j–k), where no significant BrO enhancements were measured despite strong winds. However, when air masses passed over the MYI regions (as shown in Fig. 15l), enhanced BrO was detected. The same case was also reported in Zilker et al. (2023), who performed FLEXPART-WRF backward trajectory analyses of near-surface air masses arriving at Ny-Ålesund on 2 April 2020 at 11:00 UTC. Their 0–50 m backward analysis showed that particles arriving at Ny-Ålesund originated mainly from the northern MYI-covered regions. This suggests that the enhanced BrO observed at Ny-Ålesund is likely related to the transport of reactive bromine associated with sea-salt aerosols produced over MYI regions.
We also derived wind speed distributions over MYI and FYI regions for all BEEs (2017–2023) based on 5 d backward trajectories. Figure 16 shows that during BEEs, air masses generally take about 2.4 times longer contact time over MYI regions than over FYI regions across the full wind-speed range (0–30 m s−1). For wind speeds exceeding 7 m s−1, air masses generally take about 2.8 times longer contact time over MYI regions (41 522 h) than over FYI regions (14 886 h).
Furthermore, snow over MYI regions accounts for an average of 54 % of the total bromine flux over sea ice during 2017–2023 BEEs (Fig. S2), indicating that it is a significant source of bromine activation. This value exceeds the contribution (approximately 20 %–30 %) reported in previous modelling studies for MYI-related blowing-snow-sourced SSA emissions to Arctic springtime tropospheric BrO enhancement (Huang et al., 2020). The importance of snow over MYI regions in driving BEEs at Ny-Ålesund may be attributed to two key factors. (i) This is likely due to Ny-Ålesund's geographic location, which places it downwind of southward-flowing air masses approaching Ny-Ålesund, thereby allowing them to encounter snow over MYI regions north of Greenland. (ii) Enhanced winds may uplift deposited bromide into the air and reactivate it as a source of reactive bromine. The recent measurement from offshore and onshore sites at Eureka, Canada in early spring (Yang et al., 2024) showed very low salinities and highly enriched bromide (up to a factor of 10) in the surface layer (<1 cm), indicating their potential to be a source of reactive bromine once airborne. In conclusion, our results indicate that MYI regions may play an important, previously underappreciated role in determining BEEs at Ny-Ålesund.
In this study, we integrated seven years (2017–2023) of MAX-DOAS BrO observations in Ny-Ålesund with GOME-2B measurements, meteorological data, p-TOMCAT simulations, and HYSPLIT backward trajectories to explore the sources and causes of variability in tropospheric BrO during polar spring (March to May). The MAX-DOAS BrO partial columns (0–4 km) show good agreement with overpassing GOME-2B tropospheric columns. The mean monthly BrO partial column exhibits a decreasing trend from March to May (1.97 × 10¹¹ molec. cm−2 d−1) with pronounced interannual variability. The most substantial short-term perturbations occur in early spring (March). Episodes of enhanced BrO frequently coincide with ODEs, highlighting the role of reactive bromine in Arctic atmospheric chemistry. In addition, BrO partial columns exhibit a significant negative correlation with GEM, with higher BrO generally associated with lower GEM concentrations, suggesting that enhanced bromine is closely involved in springtime atmospheric mercury depletion.
Strong correlations between MAX-DOAS–retrieved BrO and aerosol extinction were observed at Ny-Ålesund, indicating a potential link between airborne particles and enhanced reactive bromine. Sensitivity simulations using p-TOMCAT further demonstrate that heterogeneous recycling of inactive bromine species (like HBr, HOBr and BrONO2) on aerosols plays a dominant role in sustaining elevated BrO levels. For example, when heterogeneous reactivation was disabled, BrO partial columns were only about 15 % of those when heterogeneous reactivation was enabled, and ratios changed by a factor of 6.7 times, strongly indicating that, without heterogeneous reactivation, pure gaseous-phase photochemical reactions alone are insufficient to maintain BEEs.
Backward trajectory analyses further revealed that enhanced BrO during BEEs is positively correlated with total sea-ice contact time. Notably, the correlation coefficients between BrO and sea-ice contact time are substantially larger (0.26–0.42) under high wind speeds (>7 m s−1) than under low wind speeds (0.10–0.19, ≤ 7 m s−1). These results suggest that strong winds enhance reactive bromine release from the sea ice surface, likely through the production of SSA from blowing snow, as previously proposed. This interpretation is further supported by the significant correlations between p-TOMCAT modelled SSA and retrieved BrO, and between the corresponding bromine emission fluxes from blowing snow and retrieved BrO, as shown in Fig. 13.
During BEEs, total sea-ice surface snow contact accounts for more than 50 % of air-mass contact time, whereas open-ocean contact accounts for less than 10 %. Moreover, more than half of the air masses within the boundary layer originate from regions covered by MYI during BEEs, particularly areas north of Greenland and the Canadian Arctic Archipelago. This is likely due to Svalbard's geographic location, which places it downwind of southward-flowing air masses approaching Ny-Ålesund. Further analyses show that air masses during BEEs spend approximately 2.4 times longer in contact with MYI regions than with FYI regions; this ratio increases to about 2.8 under strong wind conditions (>7 m s−1). Accumulated blowing-snow-sourced bromine emissions over MYI regions contribute, on average, about 54 % of the total sea-ice-sourced bromine. These results indicate that snow over MYI regions plays an important, previously underappreciated role, in determining BEEs at Ny-Ålesund, comparable to snow over FYI regions. Due to limitations in the model's representation of sea-ice types and the lack of field data to constrain key parameters, such as snow salinity over MYI and FYI, we could not quantify their relative contributions to Ny-Ålesund BEEs or to BEEs across the whole Arctic. However, our findings still provide informative insights into the mechanisms and controlling factors of polar BEEs, which may be relevant for other coastal sites or across the pan-Arctic.
Note that this work could not rule out direct emissions of reactive bromine from the sea-ice surface or the snowpack above it, given positive correlations between observed BrO and ice contact time, and between BrO and the reactive bromine flux from the snowpack. Notably, under strong wind conditions, the correlation coefficients increase markedly relative to calm conditions, underscoring the dynamical influence on reactive bromine release, though the underlying microphysical processes remain unclear. Currently, the debate centres on two compelling mechanisms: the so-called “air-pumping” effect (Toyota et al., 2011) and the blowing-snow effect (Yang et al., 2008). Our findings highlight the need for quantitative measurements of snowpack emissions over sea ice, as well as polar boundary layer bromine budget analyses (Yang et al., 2024), to improve our understanding of the relevant processes. This is crucial in terms of accurately constraining models in reproducing polar springtime BEEs and ODEs, and assessing their climate impacts through effects on atmospheric oxidizing capacity.
Surface ozone and GEM observations at the Zeppelin station are available from the EBAS database (ozone: https://doi.org/10.48597/87NH-HWSM, Aas et al., 1989–2024; GEM: https://doi.org/10.48597/RKPP-ZA3R, Aspmo et al., 2000–2025). Meteorological data from the atmospheric observatory in Ny-Ålesund are provided by AWI-Potsdam and accessed via the PANGAEA database (e.g., https://doi.org/10.1594/PANGAEA.914808, Maturilli, 2020). Sea ice age data are available from the NSIDC (https://daacdata.apps.nsidc.org/pub/DATASETS/nsidc0611_seaice_age_v4/, last access: 6 May 2026, login required). The MAX-DOAS BrO and aerosol profiles, GOME-2 tropospheric BrO column data, and p-TOMCAT simulation results in Ny-Ålesund will be available at https://doi.org/10.17632/ww9392dn3k.1 (Li, 2026).
The supplement related to this article is available online at https://doi.org/10.5194/acp-26-6165-2026-supplement.
QL was responsible for data analysis, interpretation, and writing the original draft. YL provided funding support, contributed to data analysis, interpretation, and participated in manuscript review and editing. XY provided p-TOMCAT model results, contributed to data analysis, interpretation, and participated in manuscript review and editing. BZ and AR provided the GOME-2B satellite data, and AR also participated in manuscript review and editing. KD, HZ and KZ were responsible for the operation and maintenance of the MAX-DOAS instrument. FS contributed to resource provision and project management. WL supervised the overall research. QL prepared the initial draft of the manuscript with contributions from all co-authors.
At least one of the (co-)authors is a member of the editorial board of Atmospheric Chemistry and Physics. The peer-review process was guided by an independent editor, and the authors also have no other competing interests to declare.
Publisher's note: Copernicus Publications remains neutral with regard to jurisdictional claims made in the text, published maps, institutional affiliations, or any other geographical representation in this paper. The authors bear the ultimate responsibility for providing appropriate place names. Views expressed in the text are those of the authors and do not necessarily reflect the views of the publisher.
We gratefully acknowledge the Polar Research Institute of China, and the Chinese Arctic Yellow River Station for their support. We acknowledge the NASA NSIDC for providing sea ice information. Meteorological data were obtained from the PANGAEA database, and ERA5 reanalysis data were provided by the ECMWF. Surface ozone and GEM data were accessed from the EBAS database, which is managed by NILU. We thank BIRA for providing the QDOAS analysis software. We gratefully acknowledge Dr. Udo Frieß from IUP, University of Heidelberg for providing the HEIPRO retrieval algorithm. We acknowledge the Norwegian Polar Institute for providing the Zeppelin Webcamera Time Series dataset. We also gratefully acknowledge the NOAA Air Resources Laboratory (ARL) for the provision of the HYSPLIT transport model used in this study. We gratefully acknowledge Victoria E. Cachorro Revilla and Christoph Ritter for their efforts in establishing and maintaining the Ny-Ålesund site and for providing AERONET Level 2.0 data.
This research was financially supported by the National Natural Science Foundation of China (grant nos. 41941011 and 41676184), the Youth Innovation Promotion Association of CAS (grant no. 2020439), the Hefei Institutes of Physical Science Director's Fund (grant no. BJPY2023B01), and the Program of China Scholarship Council (grant no. 202506340069). This work has received support from the NERC National Capability International grant SURface FluxEs In AnTarctica (SURFEIT): NE/X009319/1. A. Richter and B. Zilker acknowledge support by the Deutsche Forschungsgemeinschaft (DFG, German Research Foundation) project no. 268020496-TRR 172, within the Transregional Collaborative Research Center “ArctiC Amplification: Climate Relevant Atmospheric and SurfaCe Processes, and Feedback Mechanisms (AC)3”.
This paper was edited by Rolf Müller and reviewed by four anonymous referees.
Aas, W., NILU, GAW-WDCRG, EMEP, and AMAP: Ozone at Zeppelin mountain (Ny-Ålesund), EBAS at NILU [data set], https://doi.org/10.48597/87NH-HWSM, 1989–2024.
Abbatt, J. P. D., Thomas, J. L., Abrahamsson, K., Boxe, C., Granfors, A., Jones, A. E., King, M. D., Saiz-Lopez, A., Shepson, P. B., Sodeau, J., Toohey, D. W., Toubin, C., von Glasow, R., Wren, S. N., and Yang, X.: Halogen activation via interactions with environmental ice and snow in the polar lower troposphere and other regions, Atmos. Chem. Phys., 12, 6237–6271, https://doi.org/10.5194/acp-12-6237-2012, 2012.
Angot, H., Dastoor, A., De Simone, F., Gårdfeldt, K., Gencarelli, C. N., Hedgecock, I. M., Langer, S., Magand, O., Mastromonaco, M. N., Nordstrøm, C., Pfaffhuber, K. A., Pirrone, N., Ryjkov, A., Selin, N. E., Skov, H., Song, S., Sprovieri, F., Steffen, A., Toyota, K., Travnikov, O., Yang, X., and Dommergue, A.: Chemical cycling and deposition of atmospheric mercury in polar regions: review of recent measurements and comparison with models, Atmos. Chem. Phys., 16, 10735–10763, https://doi.org/10.5194/acp-16-10735-2016, 2016.
Aspmo, K., EMEP, NILU, AMAP, and CAMP: Mercury_GEM at Zeppelin mountain (Ny-Ålesund), EBAS at NILU [data set], https://doi.org/10.48597/RKPP-ZA3R, 2000–2025.
Barrie, L. and Platt, U.: Arctic tropospheric chemistry: An overview, Tellus B, 49, 450–454, https://doi.org/10.3402/tellusb.v49i5.15984, 1997.
Barrie, L., Bottenheim, J., Schnell, R. C., Crutzen, P. J., and Rasmussen, R.: Ozone destruction and photochemical reactions at Polar sunrise in the lower Arctic atmosphere, Nature, 334, 138–141, 1988.
Begoin, M., Richter, A., Weber, M., Kaleschke, L., Tian-Kunze, X., Stohl, A., Theys, N., and Burrows, J. P.: Satellite observations of long range transport of a large BrO plume in the Arctic, Atmos. Chem. Phys., 10, 6515–6526, https://doi.org/10.5194/acp-10-6515-2010, 2010.
Benavent, N., Mahajan, A. S., Li, Q., Cuevas, C. A., Schmale, J., Angot, H., Jokinen, T., Quéléver, L. L. J., Blechschmidt, A.-M., Zilker, B., Richter, A., Serna, J. A., Garcia-Nieto, D., Fernandez, R. P., Skov, H., Dumitrascu, A., Simões Pereira, P., Abrahamsson, K., Bucci, S., Duetsch, M., Stohl, A., Beck, I., Laurila, T., Blomquist, B., Howard, D., Archer, S. D., Bariteau, L., Helmig, D., Hueber, J., Jacobi, H.-W., Posman, K., Dada, L., Daellenbach, K. R., and Saiz-Lopez, A.: Substantial contribution of iodine to Arctic ozone destruction, Nat. Geosci., 15, 770–773, https://doi.org/10.1038/s41561-022-01018-w, 2022.
Berg, T., Pfaffhuber, K. A., Cole, A. S., Engelsen, O., and Steffen, A.: Ten-year trends in atmospheric mercury concentrations, meteorological effects and climate variables at Zeppelin, Ny-Ålesund, Atmos. Chem. Phys., 13, 6575–6586, https://doi.org/10.5194/acp-13-6575-2013, 2013.
Blanchard-Wrigglesworth, E., Farrell, S. L., Newman, T., and Bitz, C. M.: Snow cover on Arctic sea ice in observations and an Earth System Model, Geophys. Res. Lett., 42, 10342–10348, https://doi.org/10.1002/2015GL066049, 2015.
Blechschmidt, A.-M., Richter, A., Burrows, J. P., Kaleschke, L., Strong, K., Theys, N., Weber, M., Zhao, X., and Zien, A.: An exemplary case of a bromine explosion event linked to cyclone development in the Arctic, Atmos. Chem. Phys., 16, 1773–1788, https://doi.org/10.5194/acp-16-1773-2016, 2016.
Bocquet, M., Fleury, S., Rémy, F., and Piras, F.: Arctic and Antarctic Sea Ice Thickness and Volume Changes From Observations Between 1994 and 2023, J. Geophys. Res.-Oceans, 129, e2023JC020848, https://doi.org/10.1029/2023jc020848, 2024.
Bognar, K., Zhao, X., Strong, K., Chang, R. Y. W., Frieß, U., Hayes, P. L., McClure-Begley, A., Morris, S., Tremblay, S., and Vicente-Luis, A.: Measurements of Tropospheric Bromine Monoxide Over Four Halogen Activation Seasons in the Canadian High Arctic, J. Geophys. Res.-Atmos., 125, e2020JD033015, https://doi.org/10.1029/2020jd033015, 2020.
Bogumil, K., Orphal, J., Homann, T., Voigt, S., Spietz, P., Fleischmann, O. C., Vogel, A., Hartmann, M., Kromminga, H., Bovensmann, H., Frerick, J., and Burrows, J. P.: Measurements of molecular absorption spectra with the SCIAMACHY pre-flight model: instrument characterization and reference data for atmospheric remote-sensing in the 230–2380 nm region, Journal of Photochemistry and Photobiology A: Chemistry, 157, 167–184, https://doi.org/10.1016/s1010-6030(03)00062-5, 2003.
Bottenheim, J. W., Gallant, A. G., and Brice, K. A.: Measurements of NOy species and O3 at 82° N latitude, Geophys. Res. Lett., 13, 113–116, 1986.
Bougoudis, I., Blechschmidt, A.-M., Richter, A., Seo, S., Burrows, J. P., Theys, N., and Rinke, A.: Long-term time series of Arctic tropospheric BrO derived from UV–VIS satellite remote sensing and its relation to first-year sea ice, Atmos. Chem. Phys., 20, 11869–11892, https://doi.org/10.5194/acp-20-11869-2020, 2020.
Brockway, N., Peterson, P. K., Bigge, K., Hajny, K. D., Shepson, P. B., Pratt, K. A., Fuentes, J. D., Starn, T., Kaeser, R., Stirm, B. H., and Simpson, W. R.: Tropospheric bromine monoxide vertical profiles retrieved across the Alaskan Arctic in springtime, Atmos. Chem. Phys., 24, 23–40, https://doi.org/10.5194/acp-24-23-2024, 2024.
Brühl, C. and Crutzen, P. J.: MPIC two-dimensional model, in: The Atmospheric Effects of Stratospheric Aircraft, NASA Ref. Publ, 1292, 103–104, https://ntrs.nasa.gov/citations/19930015969 (last access: 6 May 2026), 1993.
Burd, J. A., Peterson, P. K., Nghiem, S. V., Perovich, D. K., and Simpson, W. R.: Snowmelt onset hinders bromine monoxide heterogeneous recycling in the Arctic, J. Geophys. Res.-Atmos., 122, 8297–8309, https://doi.org/10.1002/2017jd026906, 2017.
Burrows, J. P., Platt, U., and Borrell, P. (Eds.): Tropospheric remote sensing from space, in: The remote sensing of tropospheric composition from space, Springer-Verlag, Berlin Heidelberg, 1–65, https://doi.org/10.1007/978-3-642-14791-3, 2011.
Buys, Z., Brough, N., Huey, L. G., Tanner, D. J., von Glasow, R., and Jones, A. E.: High temporal resolution Br2, BrCl and BrO observations in coastal Antarctica, Atmos. Chem. Phys., 13, 1329–1343, https://doi.org/10.5194/acp-13-1329-2013, 2013.
Cao, Y., Wang, Z., Liu, J., Ma, Q., Li, S., Liu, J., Li, H., Zhang, P., Chen, T., Wang, Y., Chu, B., Zhang, X., Saiz-Lopez, A., Francisco, J. S., and He, H.: Spontaneous Molecular Bromine Production in Sea-Salt Aerosols, Angew. Chem. Int. Edit., 63, e202409779, https://doi.org/10.1002/anie.202409779, 2024.
Chen, D., Luo, Y., Yang, X., Si, F., Dou, K., Zhou, H., Qian, Y., Hu, C., Liu, J., and Liu, W.: Study of an Arctic blowing snow-induced bromine explosion event in Ny-Alesund, Svalbard, Sci. Total Environ., 839, 156335, https://doi.org/10.1016/j.scitotenv.2022.156335, 2022.
Choi, S., Theys, N., Salawitch, R. J., Wales, P. A., Joiner, J., Canty, T. P., Chance, K., Suleiman, R. M., Palm, S. P., Cullather, R. I., Darmenov, A. S., da Silva, A., Kurosu, T. P., Hendrick, F., and Van Roozendael, M.: Link Between Arctic Tropospheric BrO Explosion Observed From Space and Sea-Salt Aerosols From Blowing Snow Investigated Using Ozone Monitoring Instrument BrO Data and GEOS-5 Data Assimilation System, J. Geophys. Res.-Atmos., 123, 6954–6983, https://doi.org/10.1029/2017jd026889, 2018.
Comiso, J. C., Meier, W. N., and Gersten, R.: Variability and trends in the Arctic Sea ice cover: Results from different techniques, J. Geophys. Res.-Oceans, 122, 6883–6900, https://doi.org/10.1002/2017jc012768, 2017.
Criscitiello, A. S., Geldsetzer, T., Rhodes, R. H., Arienzo, M., McConnell, J., Chellman, N., Osman, M. B., Yackel, J. J., and Marshall, S.: Marine Aerosol Records of Arctic Sea-Ice and Polynya Variability From New Ellesmere and Devon Island Firn Cores, Nunavut, Canada, J. Geophys. Res.-Oceans, 126, e2021JC017205, https://doi.org/10.1029/2021jc017205, 2021.
Custard, K. D., Raso, A. R. W., Shepson, P. B., Staebler, R. M., and Pratt, K. A.: Production and Release of Molecular Bromine and Chlorine from the Arctic Coastal Snowpack, ACS Earth Space Chem., 1, 142–151, https://doi.org/10.1021/acsearthspacechem.7b00014, 2017.
Danckaert, T., Fayt, C., Van Roozendael, M., De Smedt, I., Letocart, V., Merlaud, A., and Pinardi, G.: QDOAS Software user manual, Belgian Institute for Space Aeronomy (3.2 ed.) [Computer software manual], https://uv-vis.aeronomie.be/software/QDOAS/ (last access: 6 May 2026), 2017.
Davis, Z. Y. W., Frieß, U., Strawbridge, K. B., Aggarwaal, M., Baray, S., Schnitzler, E. G., Lobo, A., Fioletov, V. E., Abboud, I., McLinden, C. A., Whiteway, J., Willis, M. D., Lee, A. K. Y., Brook, J., Olfert, J., O'Brien, J., Staebler, R., Osthoff, H. D., Mihele, C., and McLaren, R.: Validation of MAX-DOAS retrievals of aerosol extinction, SO2, and NO2 through comparison with lidar, sun photometer, active DOAS, and aircraft measurements in the Athabasca oil sands region, Atmos. Meas. Tech., 13, 1129–1155, https://doi.org/10.5194/amt-13-1129-2020, 2020.
Domine, F., Sparapani, R., Ianniello, A., and Beine, H. J.: The origin of sea salt in snow on Arctic sea ice and in coastal regions, Atmos. Chem. Phys., 4, 2259–2271, https://doi.org/10.5194/acp-4-2259-2004, 2004.
Dukhovskoy, D. S., Ubnoske, J., Blanchard-Wrigglesworth, E., Hiester, H. R., and Proshutinsky, A.: Skill metrics for evaluation and comparison of sea ice models, J. Geophys. Res.-Oceans, 120, 5910–5931, https://doi.org/10.1002/2015jc010989, 2015.
Engvall Stjernberg, A.-C., Skorokhod, A., Paris, J.-D., Elansky, N., Nédélec, P., and Stohl, A.: Low concentrations of near-surface ozone in Siberia, Tellus, 63, 011607, https://doi.org/10.3402/tellusb.v64i0.11607, 2011.
Errera, Q. and Fonteyn, D.: Four-dimensional variational chemical assimilation of CRISTA stratospheric measurements, J. Geophys. Res.-Atmos., 106, 12253–12265, https://doi.org/10.1029/2001jd900010, 2001.
Falk, S. and Sinnhuber, B.-M.: Polar boundary layer bromine explosion and ozone depletion events in the chemistry–climate model EMAC v2.52: implementation and evaluation of AirSnow algorithm, Geosci. Model Dev., 11, 1115–1131, https://doi.org/10.5194/gmd-11-1115-2018, 2018.
Fan, S.-M. and Jacob, D. J.: Surface ozone depletion in Arctic spring sustained by bromine reactions on aerosols, Nature, 359, 522–524, https://doi.org/10.1038/359522a0, 1992.
Fleischmann, O. C., Hartmann, M., Burrows, J. P., and Orphal, J.: New ultraviolet absorption cross-sections of BrO at atmospheric temperatures measured by time-windowing Fourier transform spectroscopy, Journal of Photochemistry and Photobiology A: Chemistry, 168, 117–132, https://doi.org/10.1016/j.jphotochem.2004.03.026, 2004.
Frey, M. M., Norris, S. J., Brooks, I. M., Anderson, P. S., Nishimura, K., Yang, X., Jones, A. E., Nerentorp Mastromonaco, M. G., Jones, D. H., and Wolff, E. W.: First direct observation of sea salt aerosol production from blowing snow above sea ice, Atmos. Chem. Phys., 20, 2549–2578, https://doi.org/10.5194/acp-20-2549-2020, 2020.
Frieß, U., Hollwedel, J., König-Langlo, G., Wagner, T., and Platt, U.: Dynamics and chemistry of tropospheric bromine explosion events in the Antarctic coastal region, J. Geophys. Res.-Atmos., 109, D06305, https://doi.org/10.1029/2003JD004133, 2004.
Frieß, U., Monks, P. S., Remedios, J. J., Rozanov, A., Sinreich, R., Wagner, T., and Platt, U.: MAX-DOAS O4 measurements: A new technique to derive information on atmospheric aerosols: 2. Modeling studies, J. Geophys. Res.-Atmos., 111, D14203, https://doi.org/10.1029/2005jd006618, 2006.
Frieß, U., Sihler, H., Sander, R., Pöhler, D., Yilmaz, S., and Platt, U.: The vertical distribution of BrO and aerosols in the Arctic: Measurements by active and passive differential optical absorption spectroscopy, J. Geophys. Res.-Atmos., 116, D00R04, https://doi.org/10.1029/2011jd015938, 2011.
Frieß, U., Klein Baltink, H., Beirle, S., Clémer, K., Hendrick, F., Henzing, B., Irie, H., de Leeuw, G., Li, A., Moerman, M. M., van Roozendael, M., Shaiganfar, R., Wagner, T., Wang, Y., Xie, P., Yilmaz, S., and Zieger, P.: Intercomparison of aerosol extinction profiles retrieved from MAX-DOAS measurements, Atmos. Meas. Tech., 9, 3205–3222, https://doi.org/10.5194/amt-9-3205-2016, 2016.
Frieß, U., Kreher, K., Querel, R., Schmithüsen, H., Smale, D., Weller, R., and Platt, U.: Source mechanisms and transport patterns of tropospheric bromine monoxide: findings from long-term multi-axis differential optical absorption spectroscopy measurements at two Antarctic stations, Atmos. Chem. Phys., 23, 3207–3232, https://doi.org/10.5194/acp-23-3207-2023, 2023.
Gauchard, P.-A., Aspmo, K., Temme, C., Steffen, A., Ferrari, C., Berg, T., Ström, J., Kaleschke, L., Dommergue, A., Bahlmann, E., Magand, O., Planchon, F., Ebinghaus, R., Banic, C., Nagorski, S., Baussand, P., and Boutron, C.: Study of the origin of atmospheric mercury depletion events recorded in Ny-Ålesund, Svalbard, spring 2003, Atmos. Environ., 39, 7620–7632, https://doi.org/10.1016/j.atmosenv.2005.08.010, 2005.
General, S., Pöhler, D., Sihler, H., Bobrowski, N., Frieß, U., Zielcke, J., Horbanski, M., Shepson, P. B., Stirm, B. H., Simpson, W. R., Weber, K., Fischer, C., and Platt, U.: The Heidelberg Airborne Imaging DOAS Instrument (HAIDI) – a novel imaging DOAS device for 2-D and 3-D imaging of trace gases and aerosols, Atmos. Meas. Tech., 7, 3459–3485, https://doi.org/10.5194/amt-7-3459-2014, 2014.
Gong, S. L.: A parameterization of sea-salt aerosol source function for sub- and super-micron particles, Global Biogeochem. Cy., 17, 1097, https://doi.org/10.1029/2003gb002079, 2003.
Gong, X., Zhang, J., Croft, B., Yang, X., Frey, M. M., Bergner, N., Chang, R. Y.-W., Creamean, J. M., Kuang, C., Martin, R. V., Ranjithkumar, A., Sedlacek, A. J., Uin, J., Willmes, S., Zawadowicz, M. A., Pierce, J. R., Shupe, M. D., Schmale, J., and Wang, J.: Arctic warming by abundant fine sea salt aerosols from blowing snow, Nat. Geosci., 16, 768–774, https://doi.org/10.1038/s41561-023-01254-8, 2023.
Haas, C., Hendricks, S., and Doble, M.: Comparison of the sea-ice thickness distribution in the Lincoln Sea and adjacent Arctic Ocean in 2004 and 2005, Ann. Glaciol., 44, 247–252, https://doi.org/10.3189/172756406781811781, 2006.
Haas, C., Hendricks, S., Eicken, H., and Herber, A.: Synoptic airborne thickness surveys reveal state of Arctic sea ice cover, Geophys. Res. Lett., 37, L09501, https://doi.org/10.1029/2010GL042652, 2010.
Halfacre, J. W., Knepp, T. N., Shepson, P. B., Thompson, C. R., Pratt, K. A., Li, B., Peterson, P. K., Walsh, S. J., Simpson, W. R., Matrai, P. A., Bottenheim, J. W., Netcheva, S., Perovich, D. K., and Richter, A.: Temporal and spatial characteristics of ozone depletion events from measurements in the Arctic, Atmos. Chem. Phys., 14, 4875–4894, https://doi.org/10.5194/acp-14-4875-2014, 2014.
Halfacre, J. W., Shepson, P. B., and Pratt, K. A.: pH-dependent production of molecular chlorine, bromine, and iodine from frozen saline surfaces, Atmos. Chem. Phys., 19, 4917–4931, https://doi.org/10.5194/acp-19-4917-2019, 2019.
Hausmann, M. and Platt, U.: Spectroscopic measurement of bromine oxide and ozone in the high Arctic during Polar Sunrise Experiment 1992, J. Geophys. Res., 99, 25399–25413, https://doi.org/10.1029/94JD01314, 1994.
Hersbach, H., Bell, B., Berrisford, P., Hirahara, S., Horányi, A., Muñoz-Sabater, J., Nicolas, J., Peubey, C., Radu, R., Schepers, D., Simmons, A., Soci, C., Abdalla, S., Abellan, X., Balsamo, G., Bechtold, P., Biavati, G., Bidlot, J., Bonavita, M., De Chiara, G., Dahlgren, P., Dee, D., Diamantakis, M., Dragani, R., Flemming, J., Forbes, R., Fuentes, M., Geer, A., Haimberger, L., Healy, S., Hogan, R. J., Hólm, E., Janisková, M., Keeley, S., Laloyaux, P., Lopez, P., Lupu, C., Radnoti, G., de Rosnay, P., Rozum, I., Vamborg, F., Villaume, S., and Thépaut, J. N.: The ERA5 global reanalysis, Q. J. Roy. Meteor. Soc., 146, 1999–2049, https://doi.org/10.1002/qj.3803, 2020.
Hönninger, G., Leser, H., Sebastián, O., and Platt, U.: Ground-based measurements of halogen oxides at the Hudson Bay by active longpath DOAS and passive MAX-DOAS, Geophys. Res. Lett., 31, L04111, https://doi.org/10.1029/2003gl018982, 2004.
Huang, J., Jaeglé, L., Chen, Q., Alexander, B., Sherwen, T., Evans, M. J., Theys, N., and Choi, S.: Evaluating the impact of blowing-snow sea salt aerosol on springtime BrO and O3 in the Arctic, Atmos. Chem. Phys., 20, 7335–7358, https://doi.org/10.5194/acp-20-7335-2020, 2020.
Humphries, R. S., Klekociuk, A. R., Schofield, R., Keywood, M., Ward, J., and Wilson, S. R.: Unexpectedly high ultrafine aerosol concentrations above East Antarctic sea ice, Atmos. Chem. Phys., 16, 2185–2206, https://doi.org/10.5194/acp-16-2185-2016, 2016.
Jacobi, H. W., Kaleschke, L., Richter, A., Rozanov, A., and Burrows, J. P.: Observation of a fast ozone loss in the marginal ice zone of the Arctic Ocean, J. Geophys. Res.-Atmos., 111, D15309, https://doi.org/10.1029/2005jd006715, 2006.
Jaeglé, L., Quinn, P. K., Bates, T. S., Alexander, B., and Lin, J.-T.: Global distribution of sea salt aerosols: new constraints from in situ and remote sensing observations, Atmos. Chem. Phys., 11, 3137–3157, https://doi.org/10.5194/acp-11-3137-2011, 2011.
Ji, D., Palm, M., Buschmann, M., Ebell, K., Maturilli, M., Sun, X., and Notholt, J.: Hygroscopic aerosols amplify longwave downward radiation in the Arctic, Atmos. Chem. Phys., 25, 3889–3904, https://doi.org/10.5194/acp-25-3889-2025, 2025.
Jones, A. E., Anderson, P. S., Wolff, E. W., Turner, J., Rankin, A. M., and Colwell, S. R.: A role for newly forming sea ice in springtime polar tropospheric ozone loss? Observational evidence from Halley station, Antarctica, J. Geophys. Res.-Atmos., 111, D08306, https://doi.org/10.1029/2005jd006566, 2006.
Jones, A. E., Anderson, P. S., Begoin, M., Brough, N., Hutterli, M. A., Marshall, G. J., Richter, A., Roscoe, H. K., and Wolff, E. W.: BrO, blizzards, and drivers of polar tropospheric ozone depletion events, Atmos. Chem. Phys., 9, 4639–4652, https://doi.org/10.5194/acp-9-4639-2009, 2009.
Kaleschke, L., Richter, A., Burrows, J., Afe, O., Heygster, G., Notholt, J., Rankin, A. M., Roscoe, H. K., Hollwedel, J., Wagner, T., and Jacobi, H. W.: Frost flowers on sea ice as a source of sea salt and their influence on tropospheric halogen chemistry, Geophys. Res. Lett., 31, L16114, https://doi.org/10.1029/2004gl020655, 2004.
Kirpes, R. M., Bonanno, D., May, N. W., Fraund, M., Barget, A. J., Moffet, R. C., Ault, A. P., and Pratt, K. A.: Wintertime Arctic Sea Spray Aerosol Composition Controlled by Sea Ice Lead Microbiology, ACS Cent. Sci., 5, 1760–1767, https://doi.org/10.1021/acscentsci.9b00541, 2019.
Kleist, D. T., Parrish, D. F., Derber, J. C., Treadon, R., Wu, W., and Lord, S.: Introduction of the GSI into the NCEP Global Data Assimilation System, Weather Forecast., 24, 1691–1705, https://doi.org/10.1175/2009WAF2222201.1, 2009.
Krnavek, L., Simpson, W. R., Carlson, D., Domine, F., Douglas, T. A., and Sturm, M.: The chemical composition of surface snow in the Arctic: Examining marine, terrestrial, and atmospheric influences, Atmos. Environ., 50, 349–359, https://doi.org/10.1016/j.atmosenv.2011.11.033, 2012.
Kromminga, H., Orphal, J., Spietz, P., Voigt, S., and Burrows, J. P.: New measurements of OClO absorption cross-sections in the 325–435 nm region and their temperature dependence between 213 and 293 K, Journal of Photochemistry and Photobiology A: Chemistry, 157, 149–160, https://doi.org/10.1016/s1010-6030(03)00071-6, 2003.
Langendörfer, U., Lehrer, E., Wagenbach, D., and Platt, U.: Observation of filterable bromine variabilities during Arctic tropospheric ozone depletion events in high (1 hour) time resolution, J. Atmos. Chem., 34, 39–54, https://doi.org/10.1023/A:1006217001008, 1999.
Law, K. S., Hjorth, J. L., Pernov, J. B., Whaley, C. H., Skov, H., Collaud Coen, M., Langner, J., Arnold, S. R., Tarasick, D., Christensen, J., Deushi, M., Effertz, P., Faluvegi, G., Gauss, M., Im, U., Oshima, N., Petropavlovskikh, I., Plummer, D., Tsigaridis, K., Tsyro, S., Solberg, S., and Turnock, S. T.: Arctic tropospheric ozone trends, Geophys. Res. Lett., 50, e2023GL103096, https://doi.org/10.1029/2023GL103096, 2023.
Lehrer, E., Hönninger, G., and Platt, U.: A one dimensional model study of the mechanism of halogen liberation and vertical transport in the polar troposphere, Atmos. Chem. Phys., 4, 2427–2440, https://doi.org/10.5194/acp-4-2427-2004, 2004.
Maturilli, M.: Continuous meteorological observations at station Ny-Ålesund (2020-03), Alfred Wegener Institute – Research Unit Potsdam, PANGAEA [data set], https://doi.org/10.1594/PANGAEA.914808, 2020.
Li, Q.: Tropospheric bromine monoxide in Ny-Ålesund: source analysis and impacts on atmospheric chemistry, V1, Mendeley Data [data set], https://doi.org/10.17632/ww9392dn3k.1, 2026.
Liao, J., Sihler, H., Huey, L. G., Neuman, J. A., Tanner, D. J., Friess, U., Platt, U., Flocke, F. M., Orlando, J. J., Shepson, P. B., Beine, H. J., Weinheimer, A. J., Sjostedt, S. J., Nowak, J. B., Knapp, D. J., Staebler, R. M., Zheng, W., Sander, R., Hall, S. R., and Ullmann, K.: A comparison of Arctic BrO measurements by chemical ionization mass spectrometry and long path-differential optical absorption spectroscopy, J. Geophys. Res.-Atmos., 116, D00R02, https://doi.org/10.1029/2010jd014788, 2011.
Liao, J., Huey, L. G., Tanner, D. J., Flocke, F. M., Orlando, J. J., Neuman, J. A., Nowak, J. B., Weinheimer, A. J., Hall, S. R., Smith, J. N., Fried, A., Staebler, R. M., Wang, Y., Koo, J. H., Cantrell, C. A., Weibring, P., Walega, J., Knapp, D. J., Shepson, P. B., and Stephens, C. R.: Observations of inorganic bromine (HOBr, BrO, and Br2) speciation at Barrow, Alaska, in spring 2009, J. Geophys. Res.-Atmos., 117, D00R16, https://doi.org/10.1029/2011jd016641, 2012.
Lieb-Lappen, R. M. and Obbard, R. W.: The role of blowing snow in the activation of bromine over first-year Antarctic sea ice, Atmos. Chem. Phys., 15, 7537–7545, https://doi.org/10.5194/acp-15-7537-2015, 2015.
Luo, Y., Si, F., Zhou, H., Dou, K., Liu, Y., and Liu, W.: Observations and source investigations of the boundary layer bromine monoxide (BrO) in the Ny-Ålesund Arctic, Atmos. Chem. Phys., 18, 9789–9801, https://doi.org/10.5194/acp-18-9789-2018, 2018.
Macfarlane, A. R., Schneebeli, M., Dadic, R., Tavri, A., Immerz, A., Polashenski, C., Krampe, D., Clem ens-Sewall, D., Wagner, D. N., Perovich, D. K., Henna-Reetta, H., Raphael, I., Matero, I., Regnery, J., Smith, M. M., Nicolaus, M., Jaggi, M., Oggier, M., Webster, M. A., Lehning, M., Kolabutin, N., Itkin, P., Naderpour, R., Pirazzini, R., Hämmerle, S., Arndt, S., and Fons, S.: A database of snow on sea ice in the central Arctic collected during the MOSAiC expedition, Sci. Data, 10, 398, https://doi.org/10.1038/s41597-023-02273-1, 2023.
Marelle, L., Thomas, J. L., Ahmed, S., Tuite, K., Stutz, J., Dommergue, A., Simpson, W. R., Frey, M. M., and Baladima, F.: Implementation and Impacts of Surface and Blowing Snow Sources of Arctic Bromine Activation Within WRF-Chem 4.1.1, J. Adv. Model Earth Sy., 13, e2020MS002391, https://doi.org/10.1029/2020MS002391, 2021.
Maturilli, M.: Continuous meteorological observations at station Ny-Ålesund (2017-03), Alfred Wegener Institute – Research Unit Potsdam, PANGAEA [data set], https://doi.org/10.1594/PANGAEA.894597, 2018.
Nandan, V., Geldsetzer, T., Yackel, J., Mahmud, M., Scharien, R., Howell, S., King, J., Ricker, R., and Else, B.: Effect of Snow Salinity on CryoSat-2 Arctic First-Year Sea Ice Freeboard Measurements, Geophys. Res. Lett., 44, 10419–10426, https://doi.org/10.1002/2017GL074506, 2017.
Nghiem, S. V., Rigor, I. G., Richter, A., Burrows, J. P., Shepson, P. B., Bottenheim, J., Barber, D. G., Steffen, A., Latonas, J., Wang, F., Stern, G., Clemente-Colón, P., Martin, S., Hall, D. K., Kaleschke, L., Tackett, P., Neumann, G., and Asplin, M. G.: Field and satellite observations of the formation and distribution of Arctic atmospheric bromine above a rejuvenated sea ice cover, J. Geophys. Res.-Atmos., 117, D00S05, https://doi.org/10.1029/2011jd016268, 2012.
Obbard, R. W., Roscoe, H. K., Wolff, E. W., and Atkinson, H. M.: Frost flower surface area and chemistry as a function of salinity and temperature, J. Geophys. Res.-Atmos., 114, D20305, https://doi.org/10.1029/2009jd012481, 2009.
Oltmans, S. J. and Komhyr, W. D.: Surface ozone distributions and variations from 1973–1984: Measurements at the NOAA Geophysical Monitoring for Climatic Change Baseline Observatories, J. Geophys. Res.-Atmos., 91, 5229–5236, https://doi.org/10.1029/JD091iD04p05229, 1986.
Oum, K. W., Lakin, M. J., and Finlayson-Pitts, B. J.: Bromine activation in the troposphere by the dark reaction of O3 with seawater ice, Geophys. Res. Lett., 25, 3923–3926, https://doi.org/10.1029/1998gl900078, 1998.
Pernov, J. B., Hjorth, J. L., Sørensen, L. L., and Skov, H.: On the dynamics of ozone depletion events at Villum Research Station in the High Arctic, Atmos. Chem. Phys., 24, 13603–13631, https://doi.org/10.5194/acp-24-13603-2024, 2024.
Peterson, P. K., Simpson, W. R., Pratt, K. A., Shepson, P. B., Frieß, U., Zielcke, J., Platt, U., Walsh, S. J., and Nghiem, S. V.: Dependence of the vertical distribution of bromine monoxide in the lower troposphere on meteorological factors such as wind speed and stability, Atmos. Chem. Phys., 15, 2119–2137, https://doi.org/10.5194/acp-15-2119-2015, 2015.
Peterson, P. K., Simpson, W. R., and Nghiem, S. V.: Variability of bromine monoxide at Barrow, Alaska, over four halogen activation (March–May) seasons and at two on-ice locations, J. Geophys. Res.-Atmos., 121, 1381–1396, https://doi.org/10.1002/2015JD024094, 2016.
Peterson, P. K., Pöhler, D., Sihler, H., Zielcke, J., General, S., Frieß, U., Platt, U., Simpson, W. R., Nghiem, S. V., Shepson, P. B., Stirm, B. H., Dhaniyala, S., Wagner, T., Caulton, D. R., Fuentes, J. D., and Pratt, K. A.: Observations of bromine monoxide transport in the Arctic sustained on aerosol particles, Atmos. Chem. Phys., 17, 7567–7579, https://doi.org/10.5194/acp-17-7567-2017, 2017.
Peterson, P. K., Hartwig, M., May, N. W., Schwartz, E., Rigor, I., Ermold, W., Steele, M., Morison, J. H., Nghiem, S. V., and Pratt, K. A.: Snowpack measurements suggest role for multi-year sea ice regions in Arctic atmospheric bromine and chlorine chemistry, Elementa, 7, 14, https://doi.org/10.1525/elementa.352, 2019.
Platt, S. M., Hov, Ø., Berg, T., Breivik, K., Eckhardt, S., Eleftheriadis, K., Evangeliou, N., Fiebig, M., Fisher, R., Hansen, G., Hansson, H.-C., Heintzenberg, J., Hermansen, O., Heslin-Rees, D., Holmén, K., Hudson, S., Kallenborn, R., Krejci, R., Krognes, T., Larssen, S., Lowry, D., Lund Myhre, C., Lunder, C., Nisbet, E., Nizzetto, P. B., Park, K.-T., Pedersen, C. A., Aspmo Pfaffhuber, K., Röckmann, T., Schmidbauer, N., Solberg, S., Stohl, A., Ström, J., Svendby, T., Tunved, P., Tørnkvist, K., van der Veen, C., Vratolis, S., Yoon, Y. J., Yttri, K. E., Zieger, P., Aas, W., and Tørseth, K.: Atmospheric composition in the European Arctic and 30 years of the Zeppelin Observatory, Ny-Ålesund, Atmos. Chem. Phys., 22, 3321–3369, https://doi.org/10.5194/acp-22-3321-2022, 2022.
Platt, U. and Stutz, J.: Differential Optical Absorption Spectroscopy: Principles and Applications, Springer-Verlag, Berlin Heidelberg, https://doi.org/10.1007/978-3-540-75776-4, 2008.
Pöhler, D., Vogel, L., Friess, U., and Platt, U.: Observation of halogen species in the Amundsen Gulf, Arctic, by active long-path differential optical absorption spectroscopy, P. Natl. Acad. Sci. USA, 107, 6582–6587, https://doi.org/10.1073/pnas.0912231107, 2010.
Pratt, K. A., Custard, K. D., Shepson, P. B., Douglas, T. A., Pöhler, D., General, S., Zielcke, J., Simpson, W. R., Platt, U., Tanner, D. J., Gregory Huey, L., Carlsen, M., and Stirm, B. H.: Photochemical production of molecular bromine in Arctic surface snowpacks, Nat. Geosci., 6, 351–356, https://doi.org/10.1038/ngeo1779, 2013.
Pratte, P. and Rossi, M. J.: The heterogeneous kinetics of HOBr and HOCl on acidified sea salt and model aerosol at 40–90 % relative humidity and ambient temperature, Phys. Chem. Chem. Phys., 8, 3988–4001, 2006.
Ranjithkumar, A., Duncan, E., Yang, X., Partridge, D. G., Lachlan-Cope, T., Gong, X., Nishimura, K., and Frey, M. M.: Direct observation of Arctic Sea salt aerosol production from blowing snow and modeling over a changing sea ice environment, Elem. Sci. Anth., 13, https://doi.org/10.1525/elementa.2024.00006, 2025.
Rayner, N. A., Parker, D. E., Horton, E. B., Folland, C. K., Alexander, L. V., Rowell, D. P., Kent, E. C., and Kaplan, A.: Global analyses of sea surface temperature, sea ice, and night marine air temperature since the late nineteenth century, J. Geophys. Res.-Atmos., 108, 4407, https://doi.org/10.1029/2002jd002670, 2003.
Richter, A., Wittrock, F., Eisinger, M., and Burrows, J. P.: GOME observations of tropospheric BrO in northern hemispheric spring and summer 1997, Geophys. Res. Lett., 25, 2683–2686, https://doi.org/10.1029/98gl52016, 1998.
Roberts, T. J., Jourdain, L., Griffiths, P. T., and Pirre, M.: Re-evaluating the reactive uptake of HOBr in the troposphere with implications for the marine boundary layer and volcanic plumes, Atmos. Chem. Phys., 14, 11185–11199, https://doi.org/10.5194/acp-14-11185-2014, 2014.
Rodgers, C. D.: Inverse methods for atmospheric sounding, theory and practice, Series on Atmospheric, Oceanic and Planetary Physics, edited by: Taylor, F. W., World Scientific, https://doi.org/10.1142/3171, 2000.
Rozanov, A., Bovensmann, H., Bracher, A., Hrechanyy, S., Rozanov, V., Sinnhuber, B.-M., Stroh, F., and Burrows, J. P.: NO2 and BrO vertical profile retrieval from SCIAMACHY limb measurements: Sensitivity studies, Adv. Space Res., 36, 846–854, https://doi.org/10.1016/j.asr.2005.03.013, 2005.
Rößler, T., Stein, O., Heng, Y., Baumeister, P., and Hoffmann, L.: Trajectory errors of different numerical integration schemes diagnosed with the MPTRAC advection module driven by ECMWF operational analyses, Geosci. Model Dev., 11, 575–592, https://doi.org/10.5194/gmd-11-575-2018, 2018.
Salawitch, R. J., Canty, T., Kurosu, T., Chance, K., Liang, Q., da Silva, A., Pawson, S., Nielsen, J. E., Rodriguez, J. M., Bhartia, P. K., Liu, X., Huey, L. G., Liao, J., Stickel, R. E., Tanner, D. J., Dibb, J. E., Simpson, W. R., Donohoue, D., Weinheimer, A., Flocke, F., Knapp, D., Montzka, D., Neuman, J. A., Nowak, J. B., Ryerson, T. B., Oltmans, S., Blake, D. R., Atlas, E. L., Kinnison, D. E., Tilmes, S., Pan, L. L., Hendrick, F., Van Roozendael, M., Kreher, K., Johnston, P. V., Gao, R. S., Johnson, B., Bui, T. P., Chen, G., Pierce, R. B., Crawford, J. H., and Jacob, D. J.: A new interpretation of total column BrO during Arctic spring, Geophys. Res. Lett., 37, L21805, https://doi.org/10.1029/2010gl043798, 2010.
Sander, R., Keene, W. C., Pszenny, A. A. P., Arimoto, R., Ayers, G. P., Baboukas, E., Cainey, J. M., Crutzen, P. J., Duce, R. A., Hönninger, G., Huebert, B. J., Maenhaut, W., Mihalopoulos, N., Turekian, V. C., and Van Dingenen, R.: Inorganic bromine in the marine boundary layer: a critical review, Atmos. Chem. Phys., 3, 1301–1336, https://doi.org/10.5194/acp-3-1301-2003, 2003.
Schmale, J., Arnold, S. R., Law, K. S., Thorp, T., Anenberg, S., Simpson, W. R., Mao, J., and Pratt, K. A.: Local Arctic Air Pollution: A Neglected but Serious Problem, Earth's Future, 6, 1385–1412, https://doi.org/10.1029/2018ef000952, 2018.
Schofield, R., Johnston, P. V., Thomas, A., Kreher, K., Connor, B. J., Wood, S., Shooter, D., Chipperfield, M. P., Richter, A., von Glasow, R., and Rodgers, C. D.: Tropospheric and stratospheric BrO columns over Arrival Heights, Antarctica, 2002, J. Geophys. Res.-Atmos., 111, D22310, https://doi.org/10.1029/2005jd007022, 2006.
Schroeder, W. H., Anlauf, K. G., Barrie, L. A., Lu, J. Y., Steffen, A., Schneeberger, D. R., and Berg, T.: Arctic springtime depletion of mercury, Nature, 394, 331–332, https://doi.org/10.1038/28530, 1998.
Seo, S., Richter, A., Blechschmidt, A.-M., Bougoudis, I., and Burrows, J. P.: First high-resolution BrO column retrievals from TROPOMI, Atmos. Meas. Tech., 12, 2913–2932, https://doi.org/10.5194/amt-12-2913-2019, 2019.
Seo, S., Richter, A., Blechschmidt, A.-M., Bougoudis, I., and Burrows, J. P.: Spatial distribution of enhanced BrO and its relation to meteorological parameters in Arctic and Antarctic sea ice regions, Atmos. Chem. Phys., 20, 12285–12312, https://doi.org/10.5194/acp-20-12285-2020, 2020.
Sihler, H., Platt, U., Beirle, S., Marbach, T., Kühl, S., Dörner, S., Verschaeve, J., Frieß, U., Pöhler, D., Vogel, L., Sander, R., and Wagner, T.: Tropospheric BrO column densities in the Arctic derived from satellite: retrieval and comparison to ground-based measurements, Atmos. Meas. Tech., 5, 2779–2807, https://doi.org/10.5194/amt-5-2779-2012, 2012.
Simpson, W. R., von Glasow, R., Riedel, K., Anderson, P., Ariya, P., Bottenheim, J., Burrows, J., Carpenter, L. J., Frieß, U., Goodsite, M. E., Heard, D., Hutterli, M., Jacobi, H.-W., Kaleschke, L., Neff, B., Plane, J., Platt, U., Richter, A., Roscoe, H., Sander, R., Shepson, P., Sodeau, J., Steffen, A., Wagner, T., and Wolff, E.: Halogens and their role in polar boundary-layer ozone depletion, Atmos. Chem. Phys., 7, 4375–4418, https://doi.org/10.5194/acp-7-4375-2007, 2007a.
Simpson, W. R., Carlson, D., Hönninger, G., Douglas, T. A., Sturm, M., Perovich, D., and Platt, U.: First-year sea-ice contact predicts bromine monoxide (BrO) levels at Barrow, Alaska better than potential frost flower contact, Atmos. Chem. Phys., 7, 621–627, https://doi.org/10.5194/acp-7-621-2007, 2007b.
Simpson, W. R., Brown, S. S., Saiz-Lopez, A., Thornton, J. A., and Glasow, R.: Tropospheric halogen chemistry: sources, cycling, and impacts, Chem. Rev., 115, 4035–4062, https://doi.org/10.1021/cr5006638, 2015.
Simpson, W. R., Peterson, P. K., Frieß, U., Sihler, H., Lampel, J., Platt, U., Moore, C., Pratt, K., Shepson, P., Halfacre, J., and Nghiem, S. V.: Horizontal and vertical structure of reactive bromine events probed by bromine monoxide MAX-DOAS, Atmos. Chem. Phys., 17, 9291–9309, https://doi.org/10.5194/acp-17-9291-2017, 2017.
Sommar, J., Wängberg, I., Berg, T., Gårdfeldt, K., Munthe, J., Richter, A., Urba, A., Wittrock, F., and Schroeder, W. H.: Circumpolar transport and air-surface exchange of atmospheric mercury at Ny-Ålesund (79° N), Svalbard, spring 2002, Atmos. Chem. Phys., 7, 151–166, https://doi.org/10.5194/acp-7-151-2007, 2007.
Steffen, A., Douglas, T., Amyot, M., Ariya, P., Aspmo, K., Berg, T., Bottenheim, J., Brooks, S., Cobbett, F., Dastoor, A., Dommergue, A., Ebinghaus, R., Ferrari, C., Gardfeldt, K., Goodsite, M. E., Lean, D., Poulain, A. J., Scherz, C., Skov, H., Sommar, J., and Temme, C.: A synthesis of atmospheric mercury depletion event chemistry in the atmosphere and snow, Atmos. Chem. Phys., 8, 1445–1482, https://doi.org/10.5194/acp-8-1445-2008, 2008.
Stein, A. F., Draxler, R. R., Rolph, G. D., Stunder, B. J. B., Cohen, M. D., and Ngan, F.: NOAA's HYSPLIT atmospheric transport and dispersion modeling system, B. Am. Meteorol. Soc., 96, 2059–2077, https://doi.org/10.1175/BAMS-D-14-00110.1, 2015.
Stutz, J., Thomas, J. L., Hurlock, S. C., Schneider, M., von Glasow, R., Piot, M., Gorham, K., Burkhart, J. F., Ziemba, L., Dibb, J. E., and Lefer, B. L.: Longpath DOAS observations of surface BrO at Summit, Greenland, Atmos. Chem. Phys., 11, 9899–9910, https://doi.org/10.5194/acp-11-9899-2011, 2011.
Tang, M., Chan, C. K., Li, Y. J., Su, H., Ma, Q., Wu, Z., Zhang, G., Wang, Z., Ge, M., Hu, M., He, H., and Wang, X.: A review of experimental techniques for aerosol hygroscopicity studies, Atmos. Chem. Phys., 19, 12631–12686, https://doi.org/10.5194/acp-19-12631-2019, 2019.
Thalman, R. and Volkamer, R.: Temperature dependent absorption cross-sections of O2-O2 collision pairs between 340 and 630 nm and at atmospherically relevant pressure, Phys. Chem. Chem. Phys., 15, 15371–15381, https://doi.org/10.1039/c3cp50968k, 2013.
Theys, N., Van Roozendael, M., Errera, Q., Hendrick, F., Daerden, F., Chabrillat, S., Dorf, M., Pfeilsticker, K., Rozanov, A., Lotz, W., Burrows, J. P., Lambert, J.-C., Goutail, F., Roscoe, H. K., and De Mazière, M.: A global stratospheric bromine monoxide climatology based on the BASCOE chemical transport model, Atmos. Chem. Phys., 9, 831–848, https://doi.org/10.5194/acp-9-831-2009, 2009.
Theys, N., Van Roozendael, M., Hendrick, F., Yang, X., De Smedt, I., Richter, A., Begoin, M., Errera, Q., Johnston, P. V., Kreher, K., and De Mazière, M.: Global observations of tropospheric BrO columns using GOME-2 satellite data, Atmos. Chem. Phys., 11, 1791–1811, https://doi.org/10.5194/acp-11-1791-2011, 2011.
Toyota, K., McConnell, J. C., Lupu, A., Neary, L., McLinden, C. A., Richter, A., Kwok, R., Semeniuk, K., Kaminski, J. W., Gong, S.-L., Jarosz, J., Chipperfield, M. P., and Sioris, C. E.: Analysis of reactive bromine production and ozone depletion in the Arctic boundary layer using 3-D simulations with GEM-AQ: inference from synoptic-scale patterns, Atmos. Chem. Phys., 11, 3949–3979, https://doi.org/10.5194/acp-11-3949-2011, 2011.
Toyota, K., McConnell, J. C., Staebler, R. M., and Dastoor, A. P.: Air–snowpack exchange of bromine, ozone and mercury in the springtime Arctic simulated by the 1-D model PHANTAS – Part 1: In-snow bromine activation and its impact on ozone, Atmos. Chem. Phys., 14, 4101–4133, https://doi.org/10.5194/acp-14-4101-2014, 2014.
Tschudi, M. A., Meier, W. N., and Stewart, J. S.: An enhancement to sea ice motion and age products at the National Snow and Ice Data Center (NSIDC), The Cryosphere, 14, 1519–1536, https://doi.org/10.5194/tc-14-1519-2020, 2020.
Tuckermann, M., Ackermann, R., Gölz, C., Lorenzen-Schmidt, H., Senne, T., Stutz, J., Trost, B., Unold, W., and Platt, U.: DOAS-observation of halogen radical-catalysed arctic boundary layer ozone destruction during the ARCTOC-campaigns 1995 and 1996 in Ny-Ålesund, Spitsbergen, Tellus B, 49, 533–555, https://doi.org/10.3402/tellusb.v49i5.16005, 1997.
Vandaele, A. C., Hermans, C., Simon, P. C., Carleer, M., Colin, R., Fally, S., Merienne, M.-F., Jenouvrier, A., and Coquart, B.: Measurements of the NO2 absorption cross-section from 42 000 cm−1 to 10 000 cm−1 (238–1000 nm) at 220 K and 294 K, J. Quant. Spectrosc. Ra., 59, 171–184, https://doi.org/10.1016/S0022-4073(97)00168-4, 1998.
Vogt, R., Crutzen, P. J., and Sander, R.: A mechanism for halogen release from sea-salt aerosol in the remote marine boundary layer, Nature, 383, 327–330, https://doi.org/10.1038/383327a0, 1996.
von Glasow, R. and Crutzen, P. J.: Tropospheric Halogen Chemistry, in: Treatise on Geochemistry, vol. 4.02, edited by: Holland, H. D. and Turekian, K. K., Pergamon, Oxford, 1–67, https://doi.org/10.1016/B0-08-043751-6/04141-4, 2007.
von Glasow, R., von Kuhlmann, R., Lawrence, M. G., Platt, U., and Crutzen, P. J.: Impact of reactive bromine chemistry in the troposphere, Atmos. Chem. Phys., 4, 2481–2497, https://doi.org/10.5194/acp-4-2481-2004, 2004.
Wagner, T. and Platt, U.: Satellite mapping of enhanced BrO concentrations in the troposphere, Nature, 395, 486–490, https://doi.org/10.1038/26723, 1998.
Wagner, T., Ibrahim, O., Sinreich, R., Frieß, U., von Glasow, R., and Platt, U.: Enhanced tropospheric BrO over Antarctic sea ice in mid winter observed by MAX-DOAS on board the research vessel Polarstern, Atmos. Chem. Phys., 7, 3129–3142, https://doi.org/10.5194/acp-7-3129-2007, 2007.
Webster, M. A., Rigor, I. G., Nghiem, S. V., Kurtz, N. T., Farrell, S. L., Perovich, D. K., and Sturm, M.: Interdecadal changes in snow depth on Arctic sea ice, J. Geophys. Res.-Oceans., 119, 5395–5406, https://doi.org/10.1002/2014JC009985, 2014.
Wennberg, P.: Bromine explosion, Nature, 397, 299–300, 1999.
Wren, S. N., Donaldson, D. J., and Abbatt, J. P. D.: Photochemical chlorine and bromine activation from artificial saline snow, Atmos. Chem. Phys., 13, 9789–9800, https://doi.org/10.5194/acp-13-9789-2013, 2013.
Xian, P., Zhang, J., O'Neill, N. T., Toth, T. D., Sorenson, B., Colarco, P. R., Kipling, Z., Hyer, E. J., Campbell, J. R., Reid, J. S., and Ranjbar, K.: Arctic spring and summertime aerosol optical depth baseline from long-term observations and model reanalyses – Part 1: Climatology and trend, Atmos. Chem. Phys., 22, 9915–9947, https://doi.org/10.5194/acp-22-9915-2022, 2022.
Yang, X., Cox, R. A., Warwick, N. J., Pyle, J. A., Carver, G. D., O'Connor, F. M., and Savage, N. H.: Tropospheric bromine chemistry and its impacts on ozone: A model study, J. Geophys. Res., 110, D23311, https://doi.org/10.1029/2005JD006244, 2005.
Yang, X., Pyle, J. A., and Cox, R. A.: Sea salt aerosol production and bromine release: Role of snow on sea ice, Geophys. Res. Lett., 35, L16815, https://doi.org/10.1029/2008gl034536, 2008.
Yang, X., Pyle, J. A., Cox, R. A., Theys, N., and Van Roozendael, M.: Snow-sourced bromine and its implications for polar tropospheric ozone, Atmos. Chem. Phys., 10, 7763–7773, https://doi.org/10.5194/acp-10-7763-2010, 2010.
Yang, X., Frey, M. M., Rhodes, R. H., Norris, S. J., Brooks, I. M., Anderson, P. S., Nishimura, K., Jones, A. E., and Wolff, E. W.: Sea salt aerosol production via sublimating wind-blown saline snow particles over sea ice: parameterizations and relevant microphysical mechanisms, Atmos. Chem. Phys., 19, 8407–8424, https://doi.org/10.5194/acp-19-8407-2019, 2019.
Yang, X., Blechschmidt, A.-M., Bognar, K., McClure-Begley, A., Morris, S., Petropavlovskikh, I., Richter, A., Skov, H., Strong, K., Tarasick, D. W., Uttal, T., Vestenius, M., and Zhao, X.: Pan-Arctic surface ozone: modelling vs. measurements, Atmos. Chem. Phys., 20, 15937–15967, https://doi.org/10.5194/acp-20-15937-2020, 2020.
Yang, X., Strong, K., Criscitiello, A. S., Santos-Garcia, M., Bognar, K., Zhao, X., Fogal, P., Walker, K. A., Morris, S. M., and Effertz, P.: Surface snow bromide and nitrate at Eureka, Canada, in early spring and implications for polar boundary layer chemistry, Atmos. Chem. Phys., 24, 5863–5886, https://doi.org/10.5194/acp-24-5863-2024, 2024.
Zhao, X., Strong, K., Adams, C., Schofield, R., Yang, X., Richter, A., Friess, U., Blechschmidt, A.-M., and Koo, J.-H.: A case study of a transported bromine explosion event in the Canadian high arctic, J. Geophys. Res.-Atmos., 121, 457–477, https://doi.org/10.1002/2015JD023711, 2016.
Zieger, P., Vaisanen, O., Corbin, J. C., Partridge, D. G., Bastelberger, S., Mousavi-Fard, M., Rosati, B., Gysel, M., Krieger, U. K., Leck, C., Nenes, A., Riipinen, I., Virtanen, A., and Salter, M. E.: Revising the hygroscopicity of inorganic sea salt particles, Nat. Commun., 8, 15883, https://doi.org/10.1038/ncomms15883, 2017.
Zilker, B., Richter, A., Blechschmidt, A.-M., von der Gathen, P., Bougoudis, I., Seo, S., Bösch, T., and Burrows, J. P.: Investigation of meteorological conditions and BrO during ozone depletion events in Ny-Ålesund between 2010 and 2021, Atmos. Chem. Phys., 23, 9787–9814, https://doi.org/10.5194/acp-23-9787-2023, 2023.