the Creative Commons Attribution 4.0 License.
the Creative Commons Attribution 4.0 License.
 | 08 May 2026
Measurement report: Assessing the ammonia characteristics over a high-altitude mountain site in Shanxi province, China: a comparison with the observations in the North China Plain
Weiwei Pu
Jing Xu
Lingyun Zhu
Chao Liu
Liyan Zhou
Jian Dong
Shuangshuang Ge
Zhiqiang Ma
Ammonia (NH3) acts as the dominant alkaline gas and plays a crucial role in atmospheric chemistry, thereby influencing air quality and ecological systems. Previous NH3 measurement studies have primarily focused on near-ground environments or relied on passive sampling methods; however, continuous, high-resolution NH3 observations at high-altitude sites remain scarce. This study investigated NH3 characteristics at a high-altitude mountain site (Mountain Wutai, WTM) in northern China, using high-resolution and real-time measurement data spanning a full annual cycle. It also compared a regional background site (Shangdianzi, SDZ) with an urban site (Beijing Meteorological Service, BMS) to better understand the regional features of NH3 in northern China. A multi-method approach was employed, integrating in situ NH3 measurements, meteorological data analyses, Convergent Cross Mapping (CCM), Potential Source Contribution Function (PSCF), and WRF-Chem modeling, to identify NH3 source regions and clarify underlying transport mechanisms. The results indicated that NH3 emissions from the North China Plain (NCP) can reach WTM and SDZ through distinct circulation patterns: mountain-plain circulations for WTM, and primary mountain-valley circulations for SDZ. Notably, despite significant differences in altitude, geography, and pollutant transport mechanisms between WTM and SDZ, regional agricultural emissions in the NCP were the dominant factor driving the similarity in NH3 levels at the two sites. This study enhances the understanding of how surface emissions influence NH3 concentrations at high-altitude mountain site and highlights the critical role of NCP emissions in influencing regional NH3 levels, thereby providing insights for formulating strategies to mitigate regional NH3 pollution.
- Article
(7449 KB) - Full-text XML
-
Supplement
(1376 KB) - BibTeX
- EndNote


Ammonia (NH3) mainly comes from fertilizers and animals, and other sources include industry, fossil fuels, crops, soils, oceans, and biomass burning (Warner et al., 2017, 2016). As the most important gas-phase alkaline species, NH3 contributes considerably to the formation and development of fine particles (PM2.5), which have implications for human health, degrade regional air quality, and influence the global radiation budgets. However, NH3 emission control would mitigate nitrogen deposition and haze pollution but worsen acid rain (Liu et al., 2019). The atmospheric lifetime of NH3 ranges from hours to days, depending on factors like deposition processes and the presence of other reactive species (Baek and Aneja, 2004); the global average atmospheric lifetime is about 11 h (Xu and Penner, 2012).
Due to its short lifetime, NH3 is highly concentrated in the planetary boundary layer and near emission sources. Therefore, most of the current NH3 measurements were implemented at near-surface sites (Pu et al., 2023; Kuang et al., 2020; Zhang et al., 2023; Elser et al., 2018). However, aircraft measurements revealed there were NH3 pollution layers, where the concentrations were comparable to that of the surface, within the lower free troposphere (FT) over the North China Plain (NCP) (Pu et al., 2020a). Aircraft-borne campaign measurements over the US obtained concentration profiles in the FT reaching altitudes of about 6 km (Nowak et al., 2007, 2010, 2012; Leen et al., 2013; Schiferl et al., 2016). Although aircraft could capture the vertical distribution of NH3 in FT, only for the limited durations of measurement campaigns. Satellite NH3 observations complement current ground and airborne measurements by providing unique insights on NH3 distributions from regional to global scales, such as the Tropospheric Emission Spectrometer (TES) instrument on the NASA Aura satellite (Shephard et al., 2011), the Infrared Atmospheric Sounding Interferometer (IASI) instrument on the MetOp-A and MetOp-B satellites (Van Damme et al., 2014), and the Cross-track Infrared Sounder (CrIS) instrument on the NASA satellite (Dammers et al., 2019). However, the vertical sensitivity of these satellite retrievals is mainly limited to the lower troposphere up to approximately 3 km, and no altitude resolution is achieved (Höpfner et al., 2016). These findings underscore the significance of studying ammonia at high-altitude sites, where its impact on large-scale pollution may be even more pronounced.
High-altitude mountain sites have long been recognized as suitable places for characterizing the chemical composition of the lower troposphere. These sites allow for measurements that are representative of continental to hemispheric scales by focusing on air masses that have travelled far from emission sources and had sufficient time to mix. Although NH3 concentration observations have been conducted at mountain sites in previous studies, the relevant data remain relatively limited. Among these, continuous observation data with high-resolution is particularly scarce. Such continuous measurements offer an opportunity to establish connections between NH3 concentrations and the dynamic changes in source emissions as well as transport patterns.
To improve our understanding of the characteristics and influencing factors of NH3 in the lower FT, a one-year measurement was conducted at a high-altitude mountain site (Mountain Wutai, WTM) in northern China. Because WTM is located to the west of the NCP, one of the NH3 high-emission regions in the world (Van Damme et al., 2018), it provides an opportunity to compare its patterns with those of other sites within the NCP. Overall, the primary goals of this work were to characterize NH3 levels at WTM and other sites in NCP and to further interpret the similarities or different transport patterns between these sites.
2.1 Experimental site and Instrument
From June 2020 to May 2021, continuous in situ measurements were carried out at a mountain site in Shanxi province, a background site and an urban site in Beijing. The mountain site, Mountain Wutai (WTM; 38.95° N, 113.52° E; 2208 m a.s.l.) is located in the northeast Shanxi province (Fig. 1), which is connected to the continental plateau extending to the west. Due to its high altitude and remote location, there are no major pollution sources, making it an appropriate site for characterizing lower FT NH3. The fluctuations in the hourly and daily average for temperature (T), relative humidity (RH), wind direction (WD), wind speed (WS), and precipitation, are depicted in Fig. S1 in the Supplement. The annual average T, RH, and total precipitation are 2.5 °C, 62.6 %, and 892.7 mm, respectively. Prevailing winds are generally westerly, with an average speed of 5.8 m s−1.
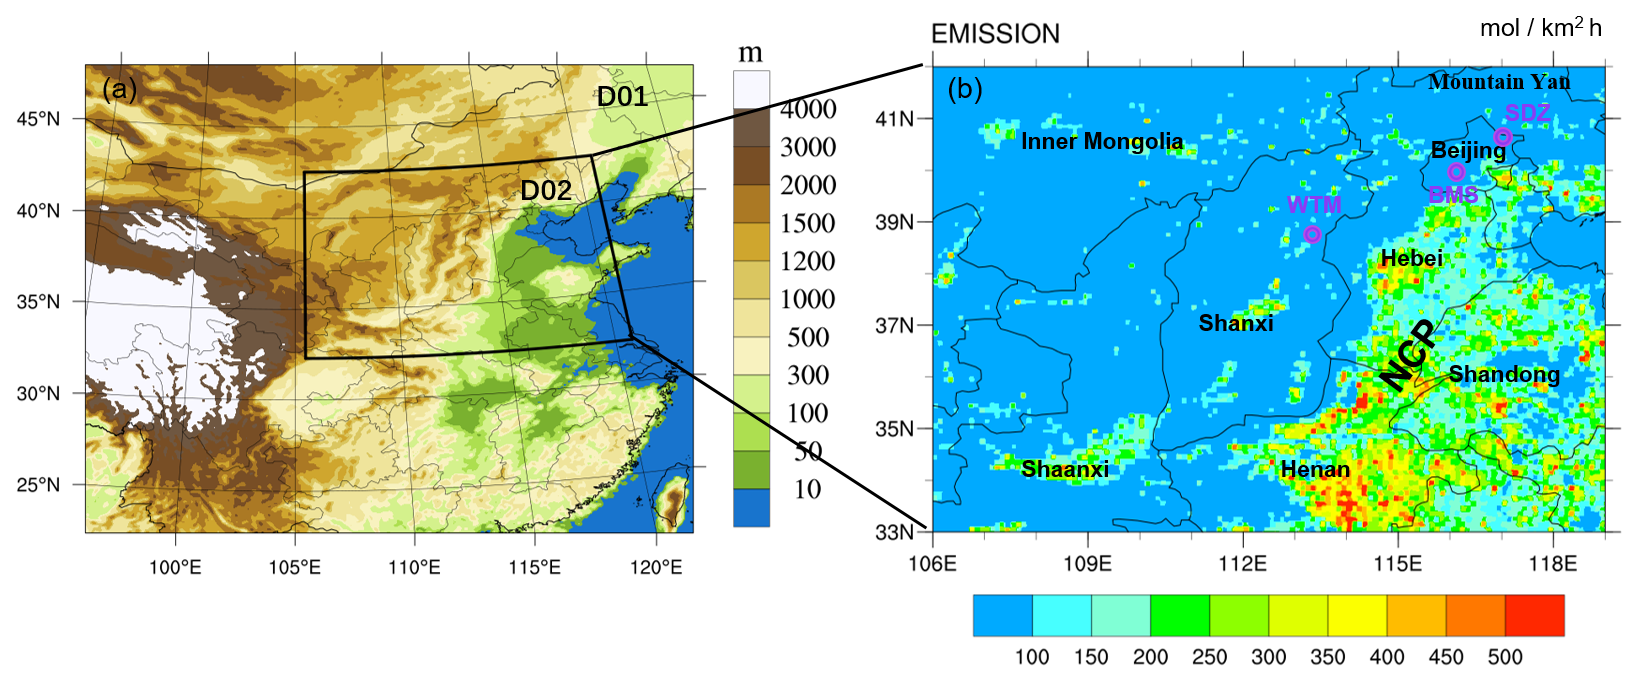
Figure 1Simulation domains and topographic distribution (a); spatial distribution of NH3 emission intensity and locations of the measurement sites (indicated by purple open circles) (b).
The background site, Shangdianzi (SDZ; 40.65° N, 117.11° E; 293.9 m a.s.l.), lies in the transitional region between the NCP and the Mountain Yan area (Fig. 1). It acts as both a regional background station in China and a regional site under the Global Atmosphere Watch program. The mountainous areas around the SDZ station only contain small villages, where populations are sparse and anthropogenic emission sources are negligible. Therefore, the station's atmospheric pollution levels can represent the background concentration of air pollutants in North China. Nevertheless, orchards surrounding SDZ may have ammonium dibasic phosphate and urea applied as soil fertilizers during spring.
The urban site is situated at the Beijing Meteorological Service (BMS; 39.93° N, 116.27° E; 90 m a.s.l.) (Fig. 1), which lies in the northwestern sector of the Beijing urban area, surrounded by various land use types (commercial areas, park, residential areas, and traffic areas).
Real-time NH3 concentrations at the above-mentioned stations were measured using three analyzers (907, Los Gatos Research Inc., USA). To ensure data accuracy and reliability, rigorous quality assurance (QA) and quality control (QC) procedures, including daily zero and span checks, monthly multi-point calibrations using certified NH3 standard gas, were implemented throughout the campaign (Pu et al., 2020b). Other than NH3 observations, methane (CH4) was also measured at SDZ by a Picarro G2401 CO2/CO/CH4 cavity-ringdown spectrometer during summer 2020 and spring 2021. Meteorological data of the surface in this study were achieved from the China Meteorological Data Service Center (http://data.cma.cn/en, last access: 10 March 2025). The planetary boundary layer height (BLH) and U, V, and W winds are achieved from the ERA5 (https://cds.climate.copernicus.eu/datasets, last access: 20 April 2025), a fifth-generation European Centre for Medium-Range Weather Forecasts (ECMWF) reanalysis data with a spatial resolution of 0.25° × 0.25°.
2.2 Convergence cross mapping (CCM) method
Given the complex interactions in atmospheric environments and the strong nonlinearity of atmospheric systems, simple correlation analyses (e.g., Pearson correlation, which is only applicable to linear systems) cannot effectively quantify the causal effects of individual meteorological factors on NH3 concentrations. To address this limitation, Sugihara et al. (2012) developed Convergent Cross Mapping (CCM) – a robust causal analysis approach – designed to extract the coupling relationships between individual variables in complex systems. This method serves as a suitable alternative for identifying nonlinear associations within the same system and evaluating weak-to-moderate coupling effects, while also enabling the determination of interaction directionality. Therefore, it has been widely adopted in related studies.
In CCM, the predictive skill of variable A for variable B is calculated and denoted as ρ (ranging from 0 to 1). This metric provides a quantitative basis for comparing the influence magnitudes of different variables on a target variable. Detailed descriptions of the CCM algorithm have been published in previous literature (Chen et al., 2022, 2018; Rawat et al., 2024). The CCM analysis in this study was conducted using R software (version 4.3.1), with the support of the rEDM package (Sugihara et al., 2012) and the multispatialCCM package (Clark et al., 2015).
2.3 Potential source contribution function (PSCF)
To identify the locations of sources influencing different pollutant concentrations, PSCF analysis was applied, with its calculation relying on measured concentrations and associated trajectory data. A high PSCF value denotes that the corresponding region transports substantial amounts of the target atmospheric pollutant to the receptor site. In contrast, a low PSCF value may reflect either minimal emissions from the region or the absence of pollutant transport pathways from that region to the receptor site.
From June 2020 to May 2021, 48 h backward trajectories were calculated 24 times per day (00:00 to 23:00 UTC, with initiation at 10 m above ground surface) using the HYSPLIT model developed by the National Oceanic and Atmospheric Administration Air Resource Lab (NOAA; https://www.arl.noaa.gov/hysplit/, last access: 15 January 2025). Meteorological input data were derived from the FNL global analysis data – generated by the National Center for Environmental Prediction (NCEP) model and processed by the Global Data Assimilation System (GDAS) with a spatial resolution of 1° × 1° (https://www.ready.noaa.gov/data/archives/gdas1/, last access: 15 January 2025). Detailed methodologies for the PSCF approach and weighted potential source contribution function (WPSCF) analysis have been reported in previous studies (Wang, 2014; Pu et al., 2019). The 70th percentile of NH3 concentrations over the entire observation period was used as the criterion value.
2.4 WRF-Chem
The WRF-Chem model (version 4.2.1) was employed to simulate NH3 concentrations and meteorological conditions in this study. A detailed description of WRF-Chem is provided by Grell et al. (2005). The model uses the CBM-Z gas phase chemical mechanism (Zaveri and Peters, 1999) to represent the transformation reactions of NH3 in the atmosphere.
In this study, two nested domains with horizontal resolutions of 9 and 3 km were established within the WRF-Chem model, centered at 116° E, 39° N (Fig. 1). The inner domain (D02, shown in Fig. 1a) covers the primary agricultural region of the North China Plain, which includes three major crop-producing provinces: Henan, Hebei, and Shandong. In the vertical direction, the model was configured with 30σ-pressure layers extending from the surface up to 50 hPa, 12 of which are located within the atmospheric boundary layer. Meteorological initial and boundary conditions were derived from the NCEP Final Operational Global Analysis (FNL) dataset, which has a spatial resolution of 1.0° × 1.0° and a temporal resolution of 6 h. Anthropogenic emissions were based on the inventory developed by Zhang et al. (2009), which was subsequently updated to a resolution of 0.1° × 0.1° for the year 2019 (MEIC-2019, Qiang Zhang, personal communication, 2021). Biomass burning emissions were obtained from the Fire Inventory from NCAR (FINNv1.5, Wiedinmyer et al., 2011). Chemical initial and boundary conditions were initialized using model-default idealized profiles. The simulation was conducted from 1 to 12 May 2021, with the first 11 d considered as model spin-up and results from 12 May 2021, used for subsequent analysis.
3.1 Overall features of NH3 concentration
The continuous variability of NH3 concentrations at WTM during 2020 and 2021 is shown in Fig. 2. The hourly NH3 concentration ranged from 1 to 52.7 ppb, with a year-round average of 9.0 ± 6.7 ppb. The NH3 concentrations in this study exhibited a seasonal variation (Table S1 in the Supplement), with means of 8.9 ± 6.3, 15.9 ± 5.4, 8.8 ± 4.2, and 2.1 ± 1.2 ppb in spring, summer, autumn, and winter, respectively. Compared with other high-altitude sites (Table S2), the average concentration of NH3 at WTM is obviously higher than most of the sites, particularly at Rocky Mountain National Park, Beaver Meadows, Timber Creek, and Gore Pass in the USA and the Happo site in Japan. In contrast, NH3 levels at WTM were substantially lower than those recorded at rural and agricultural sites, such as Wuwei in China and Greeley and Kersey in the United States, highlighting the influence of anthropogenic emissions. Notably, within the same type of observation site, forest or grassland, the NH3 concentrations measured at WTM are elevated. These discrepancies imply that local sources, atmospheric transport processes, or topographical factors may contribute to enhanced ammonia accumulation at this site compared to similar ecological settings.
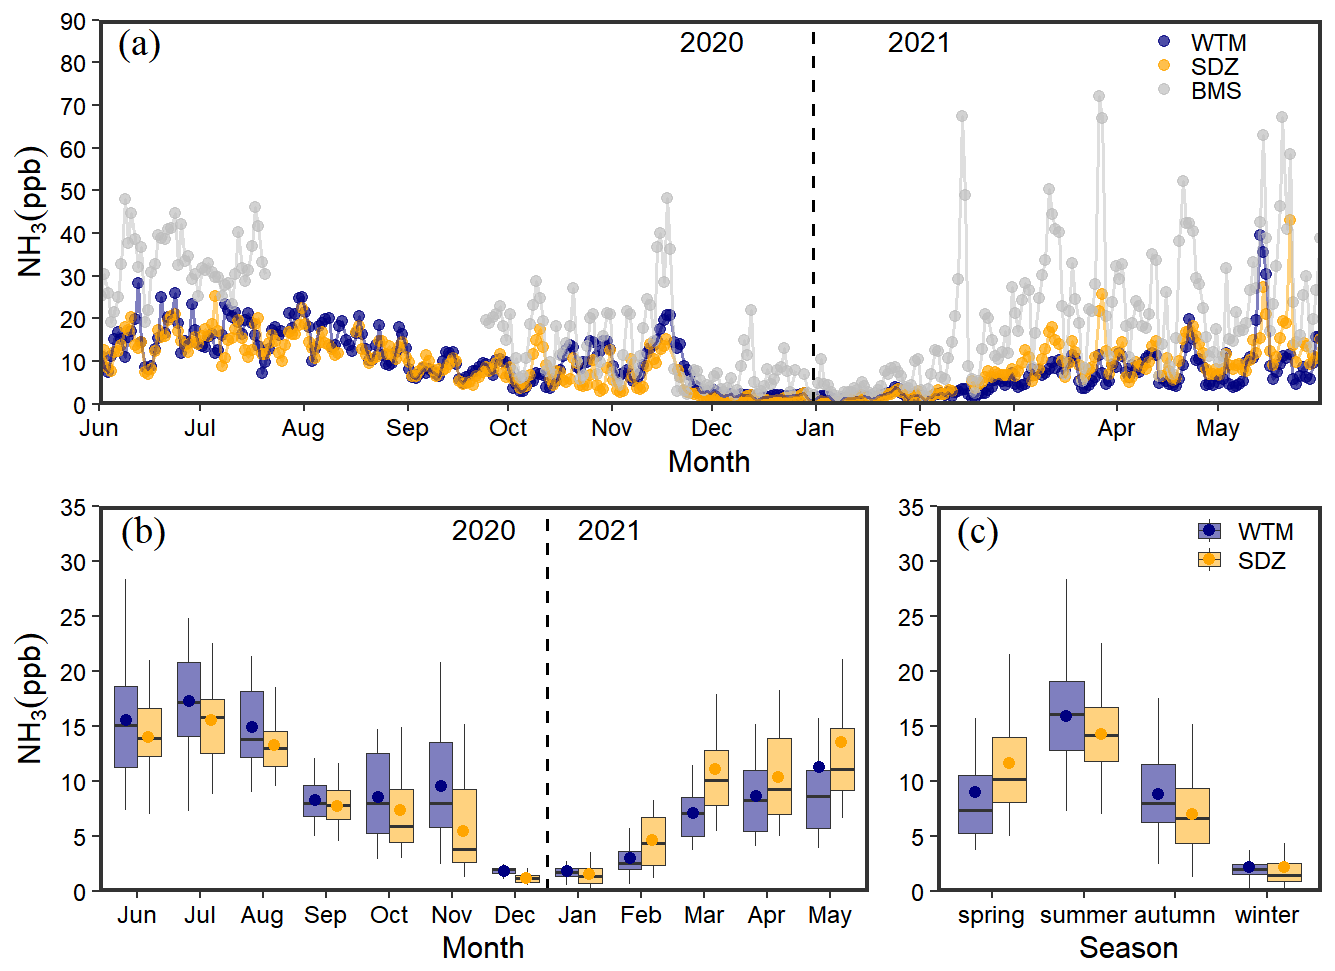
Figure 2Daily (a), monthly (b) and seasonal (c) variation of NH3 concentration from 1 June 2020 to 31 May 2021. The solid dots represent the mean values, the horizontal lines in the box denote the median, the limits of the boxes correspond to the 25th and 75th percentiles, and the whiskers of the boxes are the 10th and 90th percentiles (b, c).
Situated in a remote, high-altitude area to the west of the NCP, this unique location enables comparative studies between WTM and other sites located in the NCP. As can be seen from Fig. 2a, the NH3 concentration and its variation pattern at the WTM site exhibit a high degree of similarity to those at the SDZ site, while showing significant differences from the BMS site, where the NH3 concentration levels are notably higher. To further quantify the similarity of NH3 variation tendency among the sites, this study employed a variety of analytical methods, including Dynamic Time Warping (DTW), Euclidean distance, Pearson correlation coefficient (r), Root Mean Square Deviation (RMSD), and Mean Absolute Bias (MAB) (Table S3). The DTW was processed in R version 4.3.1, along with the dtw R package (Giorgino, 2009). It is noteworthy that despite the greater spatial straight-line distance (350 km) between the SDZ and WTM sites compared to the BMS and WTM distance, as well as an altitude difference of 1.9 km, the values of DTW, Euclidean distance, RMSD, and MAB between WTM and SDZ are all lower than those between WTM and BMS. Meanwhile, the r between WTM and SDZ is significantly higher than that between WTM and other sites. These comprehensive quantitative analysis results fully demonstrate a high degree of consistency in the variation trends and numerical distributions of the NH3 concentration time series at the WTM and SDZ sites.
Since WTM is in a remote area, emission sources in its vicinity are relatively scarce. In contrast, the BMS site is located in an urban area, with obvious emission sources such as vehicle exhaust emissions (Pu et al., 2023) and residential emissions. These complex local emission sources significantly influence the NH3 concentration level and its variation pattern at this site, leading to distinct differences from the WTM. Interestingly, despite considerable altitude and spatial separation between WTM and SDZ, they exhibited similar NH3 variation characteristics and close concentration. The subsequent sections will conduct analyses from meteorological effects, potential source regions, and transport patterns to illustrate the primary factors driving this similarity.
3.2 Effects of meteorological factors
Local meteorological conditions exert a significant impact on the NH3 levels (Zhang et al., 2018). Given the complex interactions within atmospheric environments, it remains challenging to quantify how individual meteorological factors affect local NH3 concentrations. In order to solve this problem, CCM was employed to examine the coupling relationships between these factors and NH3. The CCM analysis based on hourly data is shown in Table 1, and the influence of local meteorological factors – including WS, WD, T, RH, pressure (P), and BLH – on NH3 in different seasons is determined. The convergent cross maps were used to explain the quantitative coupling between NH3 concentration and each individual meteorological factor (Fig. S2). The ρ-value from CCM methods is designed to understand the coupling between two variables by excluding influences from other factors. Nevertheless, it lacks the ability to directly identify the positive or negative nature of the causality between the two variables.
Table 1Seasonal correlations and causal relationships between individual meteorological parameters and NH3 concentration.
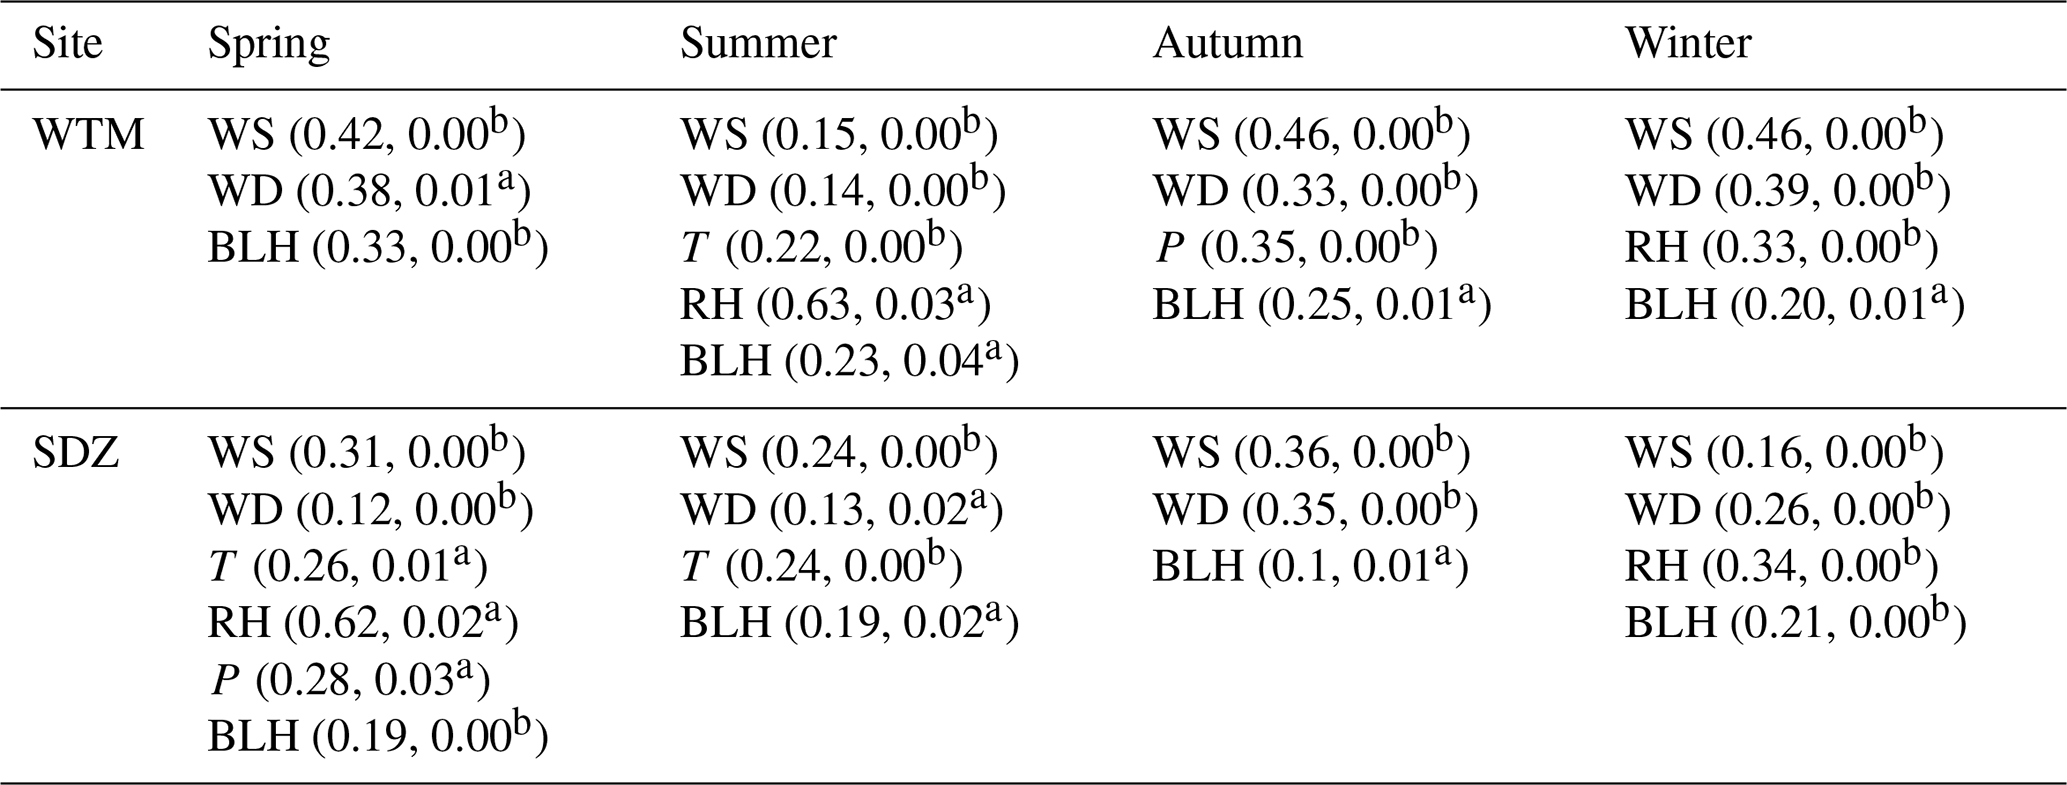
The causality of different meteorological factors on NH3 is presented predictive skill (ρ) from the CCM method with p-values (p). a and b denote the p less than 0.05 and 0.01, respectively.
CCM analysis reveals that RH and T are found to show strong influence on WTM NH3 during summer, while RH and T are also found to have strong effect on SDZ NH3 during spring. However, high NH3 levels are generally associated with high temperature and humidity (Lan et al., 2021). P shows a strong impact on NH3 concentrations of WTM and SDZ NH3 in autumn and spring, respectively. That could be attributed to P mainly affecting the transport and accumulation of pollutants by indirectly influencing other meteorological factors (e.g., wind and humidity) (Chen et al., 2020). Although various meteorological parameters affect NH3 concentrations differently across seasons at different sites, WS, WD, and BLH significantly impact NH3 concentrations at both WTM and SDZ year-round (Table 1). This indicates that wind-driven processes (e.g., atmospheric transport or dispersion) along with the boundary layer variation play crucial roles in governing NH3 levels at these sites throughout the year.
A bivariate polar plot is presented in Fig. 3 to analyze the function of WS and WD in each season. Despite the prevailing wind being westerly (Fig. S1), the higher NH3 concentrations at WTM were observed in the southeast and southwest sectors in spring and summer, while elevated levels mainly occurred in the easterly direction during autumn and winter. In spring and summer, the higher concentrations were accompanied by a wide range of WS between 0 and 15 m s−1, suggesting that local emissions and air masses transported from intense NH3 emission regions (Fig. 1b) were important factors affecting NH3 concentrations at WTM during warm seasons. However, in autumn and winter, higher NH3 concentrations were detected with a WS of 5–10 m s−1, indicating that WTM was mainly under the influence of long-distance transport during cold seasons. Unlike WTM, higher SDZ NH3 concentrations were mainly concentrated in the southwest direction. Based on NH3 concentration variations and WS in each season at SDZ, the site was affected by both local emissions and air mass transport. Nevertheless, the impact of transport on NH3 was more significant, as elevated concentrations corresponded to WS exceeding 2 m s−1. Notably, the NCP is located to the southeast of WTM and to the southwest of SDZ – directions that directly correspond to the WD associated with higher levels at both sites. This spatial alignment strongly suggests that the NCP might act as a potential emission area for both WTM and SDZ.
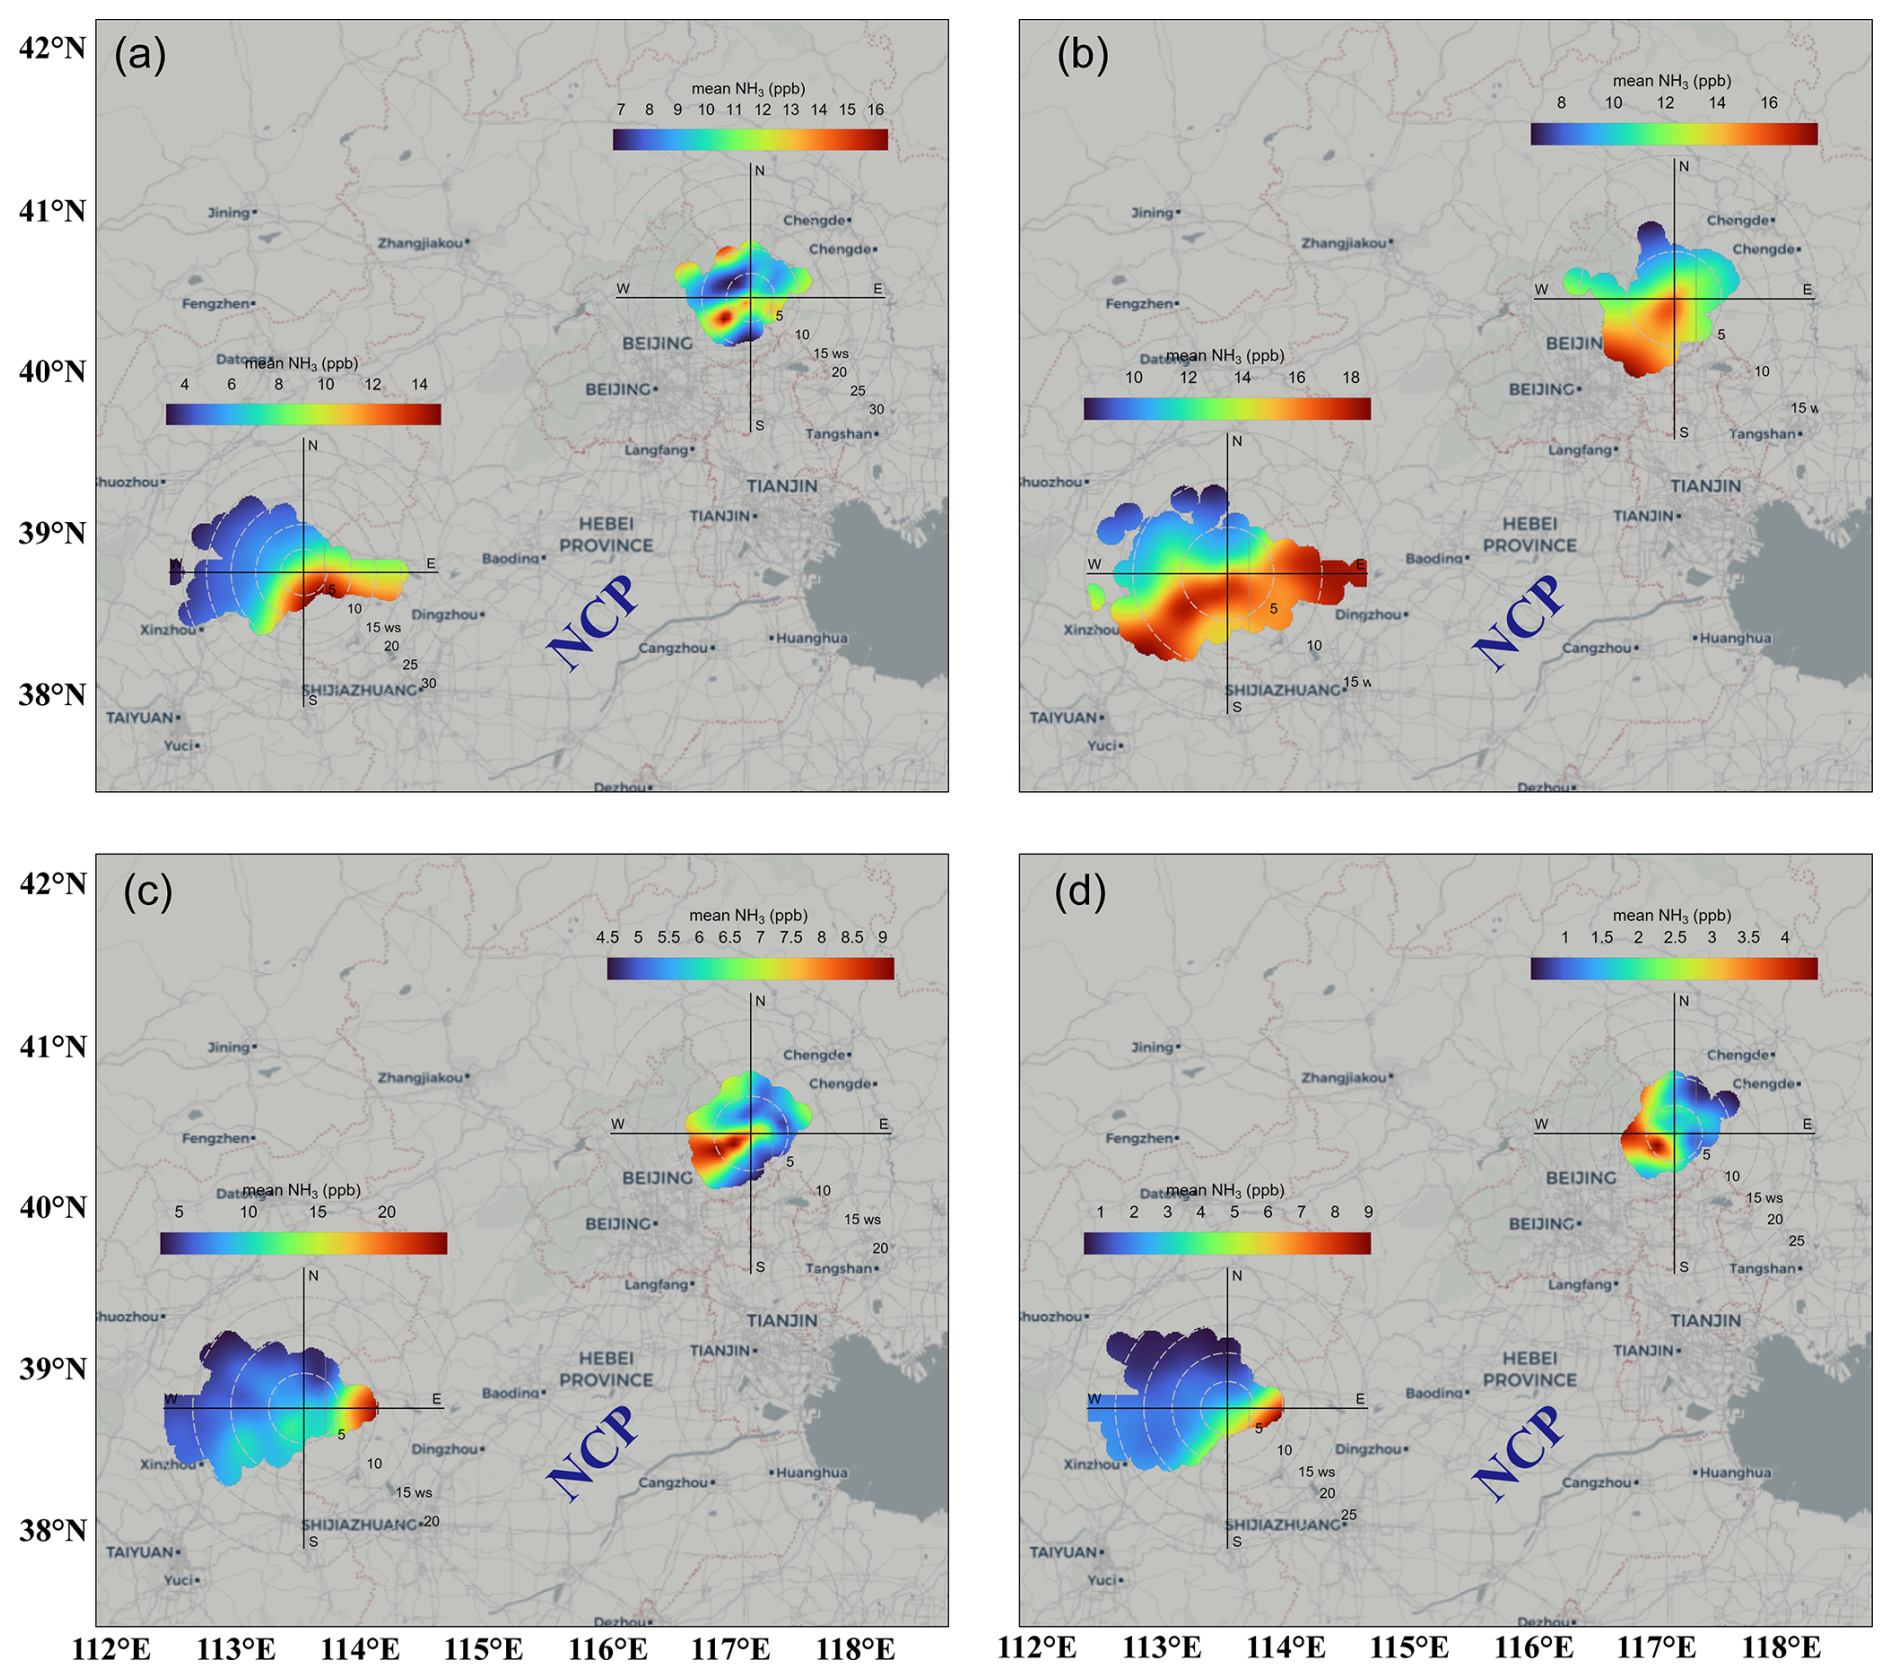
Figure 3Bivariate polar plots of NH3 concentrations at WTM and SDZ in four seasons (a: spring, b: summer, c: autumn, and d: winter).
3.3 Potential sources identified
To confirm whether NCP was a potential emission area for WTM and SDZ, PSCF analysis was performed. The PSCF map distributions of WTM and SDZ during the study period and each season are examined (Figs. 4 and S3). Grid cells characterized by high PSCF values (i.e., >0.7) were identified as regions with a high likelihood of being NH3 source areas for the receptor sites. Figure 3 indicates that the potential sources for WTM and SDZ were primarily in the broader NCP, particularly in southern Hebei, western Shandong, and eastern Henan. Importantly, these locations corresponded with the NH3 emission distribution in the NCP, as shown in Fig. 1b. This region is characterized by elevated anthropogenic emissions of NH3, largely from agricultural activities (Li et al., 2021). In addition to NCP, SDZ was also affected by emissions from the Bohai Sea. This might be attributed to the ocean-going vessels that installed the marine selective catalytic reduction technology (SCR) system to reduce NOx emissions. As catalyst activity decreases over time, NH3 slip increases (Zhang et al., 2021). In spring and summer, the potential source ranges of both sites were more scattered in NCP; however, during autumn and winter, these ranges were more concentrated in the south or east of Hebei (Fig. S3). Under the impact of southerly wind, emissions originating from NCP can be transported to WTM and SDZ.
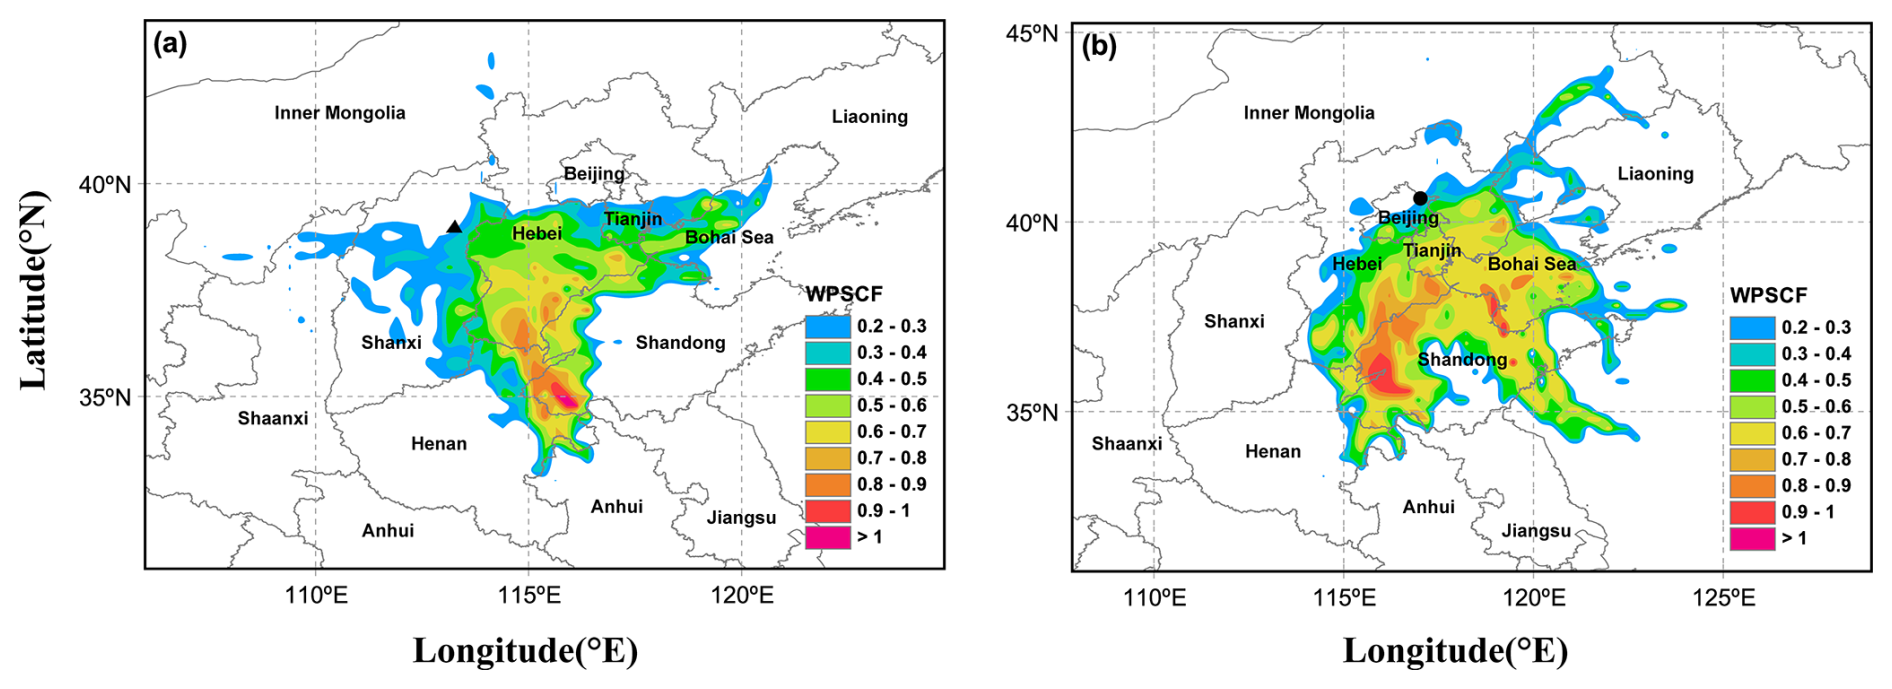
Figure 4Weighted potential sources contribution analysis (PSCF) of NH3 at WTM (a) and SDZ (b) (triangle and circle denote WTM and SDZ, respectively).
3.4 Transport patterns of NH3
3.4.1 Diurnal variation of the atmospheric circulation
Atmospheric circulation determines the migration and transport patterns of pollutants, so to study its impact on the distribution of NH3 concentration, the east–west cross-sections of seasonal mean wind vectors and vertical velocity were first analyzed. As shown in Fig. 5, during the daytime, low-level winds close to mountain slopes warm early, resulting in upward movement from the plain toward the mountains. At night, this pattern switches to downslope motions due to the pressure difference between mountains and plains. Therefore, although WTM is at a high altitude, local sources from NCP can still have an influence, depending largely on the vertical transport and associated convective mixing. Owing to ground surface heating, the magnitude of vertical velocity varies seasonally, peaking in summer (∼ 16 cm s−1) and reaching its lowest in winter (∼ −20 cm s−1). This mountain-plain circulation directly affects the day and night difference in NH3 concentrations at WTM throughout the year, following those variations.
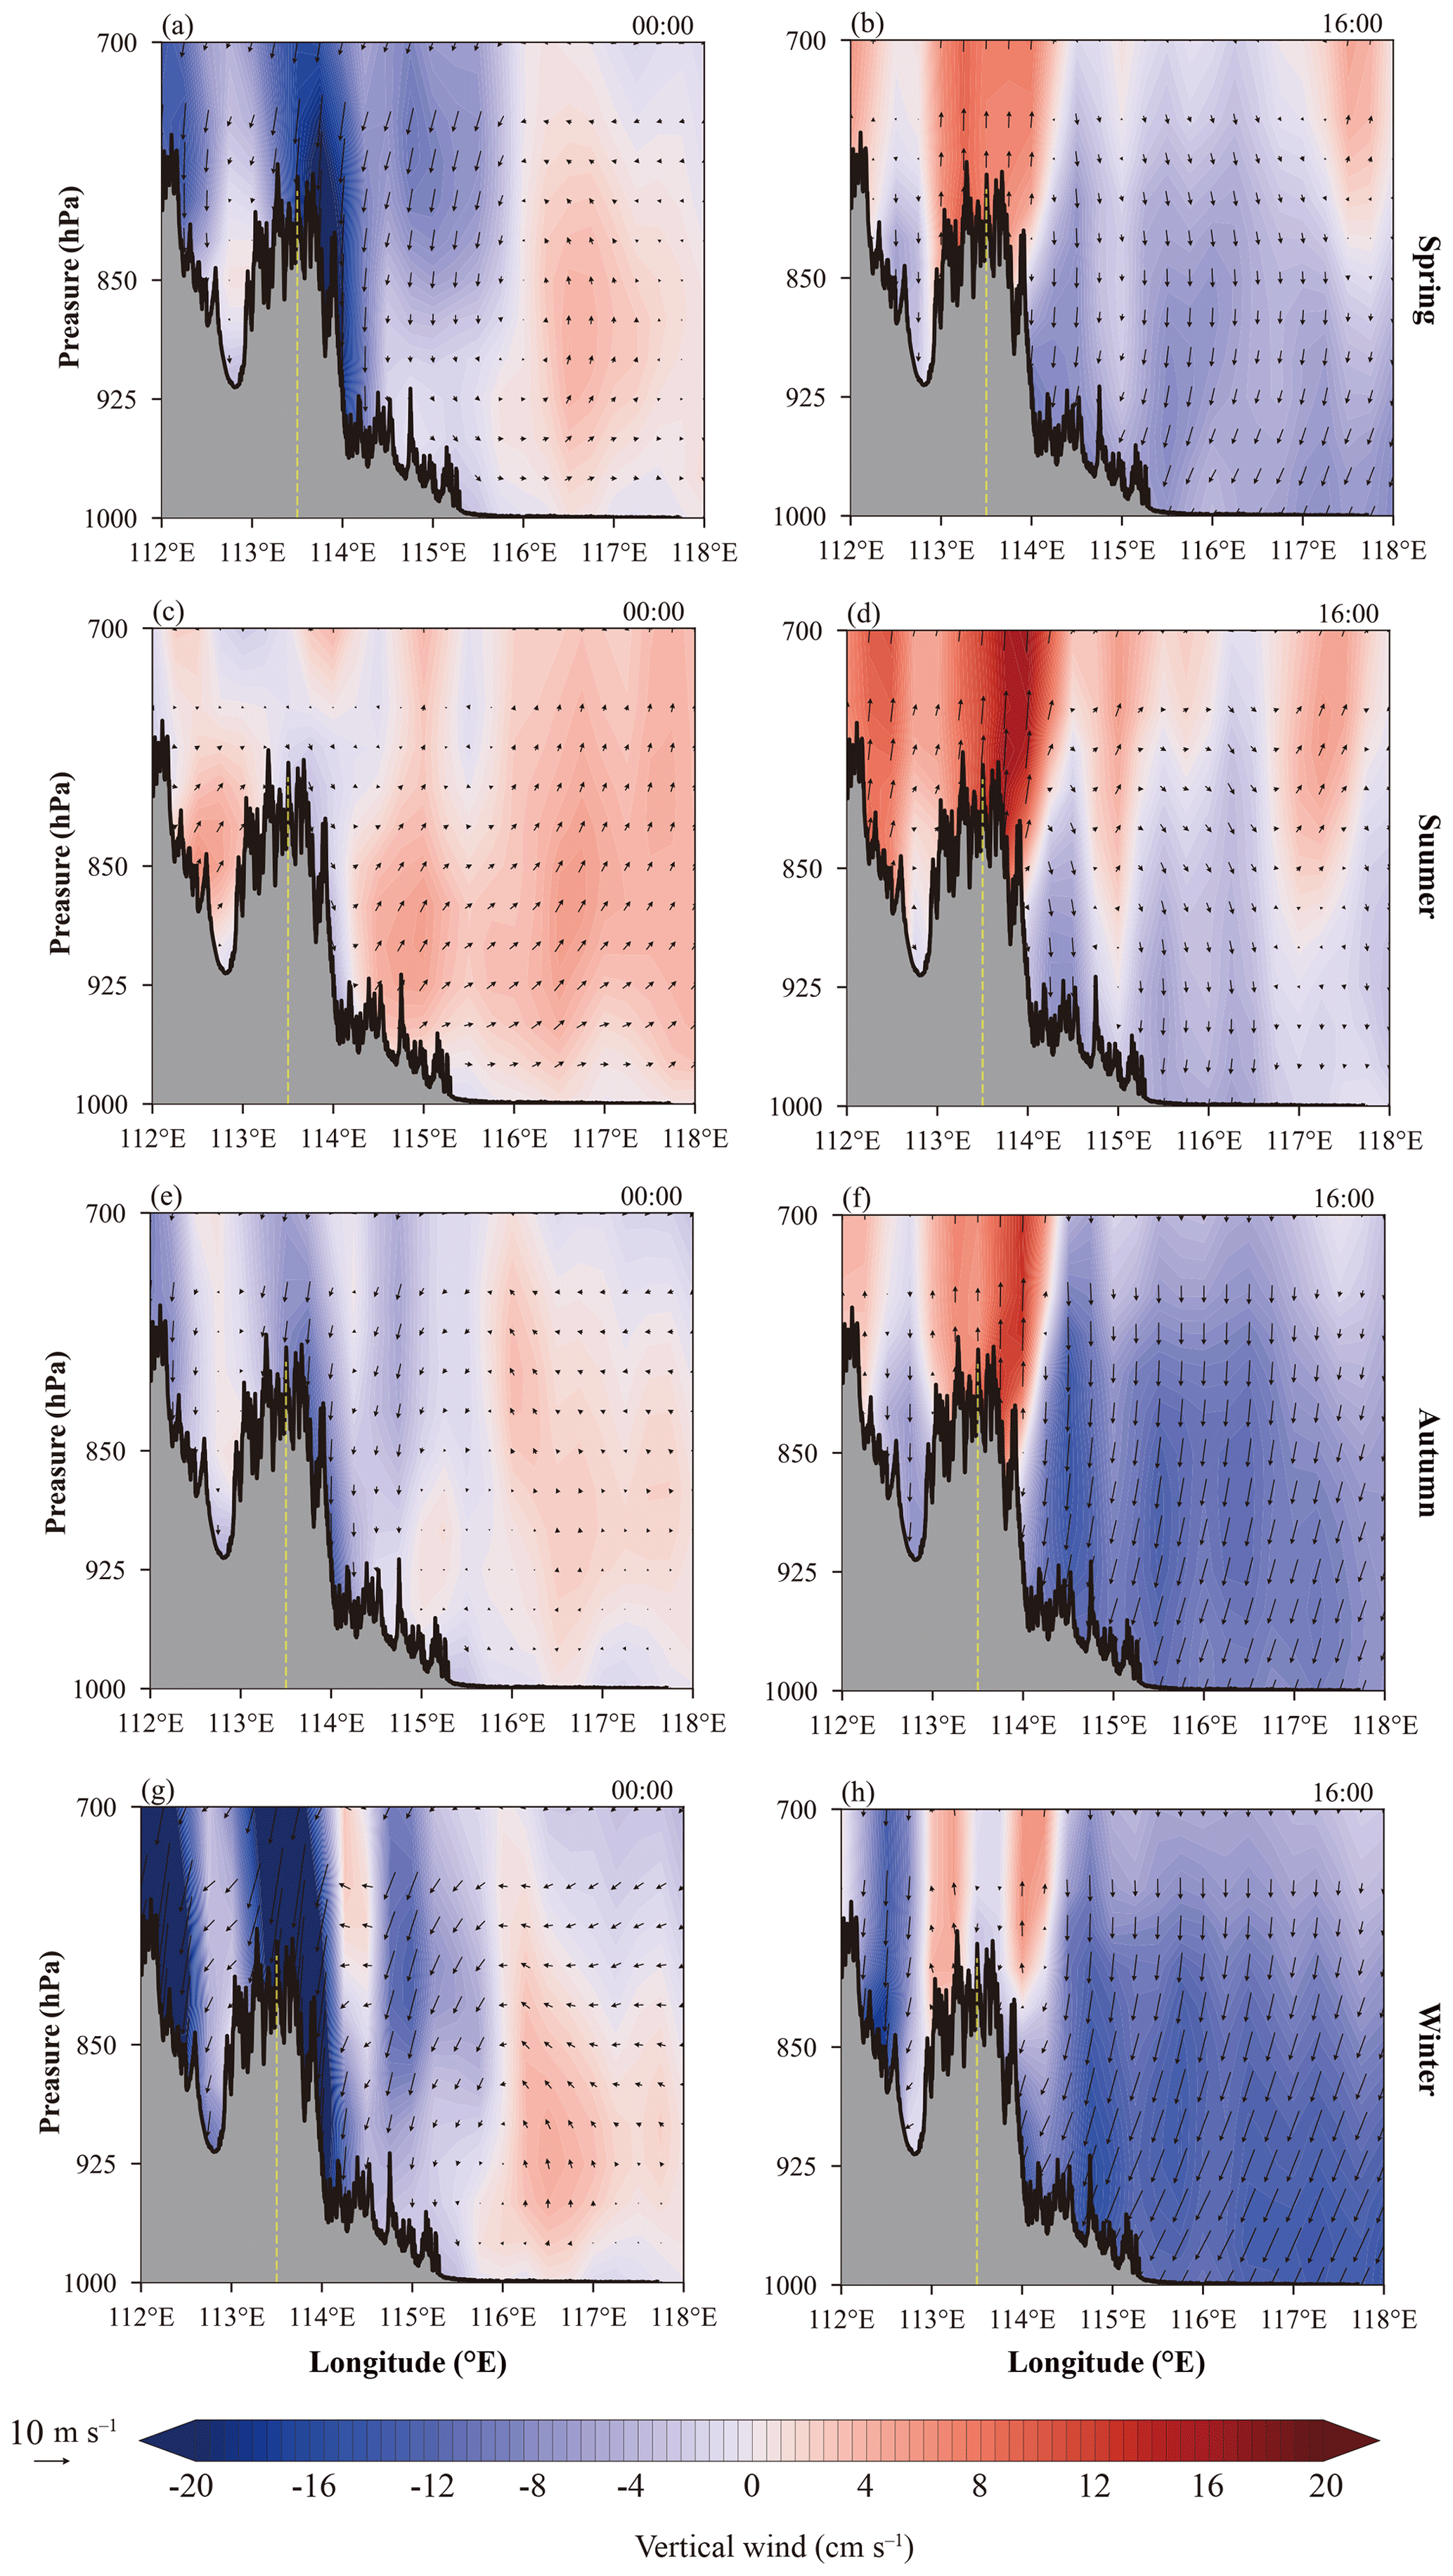
Figure 5Meridional cross-section of vertical velocity (contour region) with superimposed wind vectors. The yellow dotted lines represent the location of WTM. The four rows are the different seasons, including spring (a–b), summer (c–d), autumn (e–f), and winter (g–h).
3.4.2 Relationship between the diurnal variations of NH3 and BLH
As mentioned in Sect. 3.3, NCP, especially in the south of Hebei, the west of Shandong, and the east of Henan provinces, represents the shared common source area influencing WTM and SDZ. To figure out how the emissions emitted from this region affected two sites, diurnal variation of NH3 and boundary layer height were analyzed (Fig. 6). In order to better illustrate the diurnal variation of NH3 at these two sites more clearly, the normalized concentrations were applied. As shown in Fig. 6, NH3 concentrations at SDZ didn't rise as the BLH elevated, except in winter. This might be due to the good dispersion and dilution conditions as the BLH increases that reduces the NH3 levels. Since SDZ lies in the transitional zone between the NCP and the Mountain Yan area, it is primarily influenced by mountain-valley circulation (Lin et al., 2008). In the afternoon, under the impact of valley wind, lots of the pollutants from NCP were transported to SDZ by the southerly wind, leading to a peak concentration of NH3 around 18:00 in seasons. However, apart from the late afternoon peak, morning spikes of NH3 can also be found during summer and autumn. Based on previous studies, the morning NH3 enhancement can be linked to dew evaporation since dew is a nighttime reservoir and morning source for NH3 (Wentworth et al., 2016; Kuang et al., 2020).
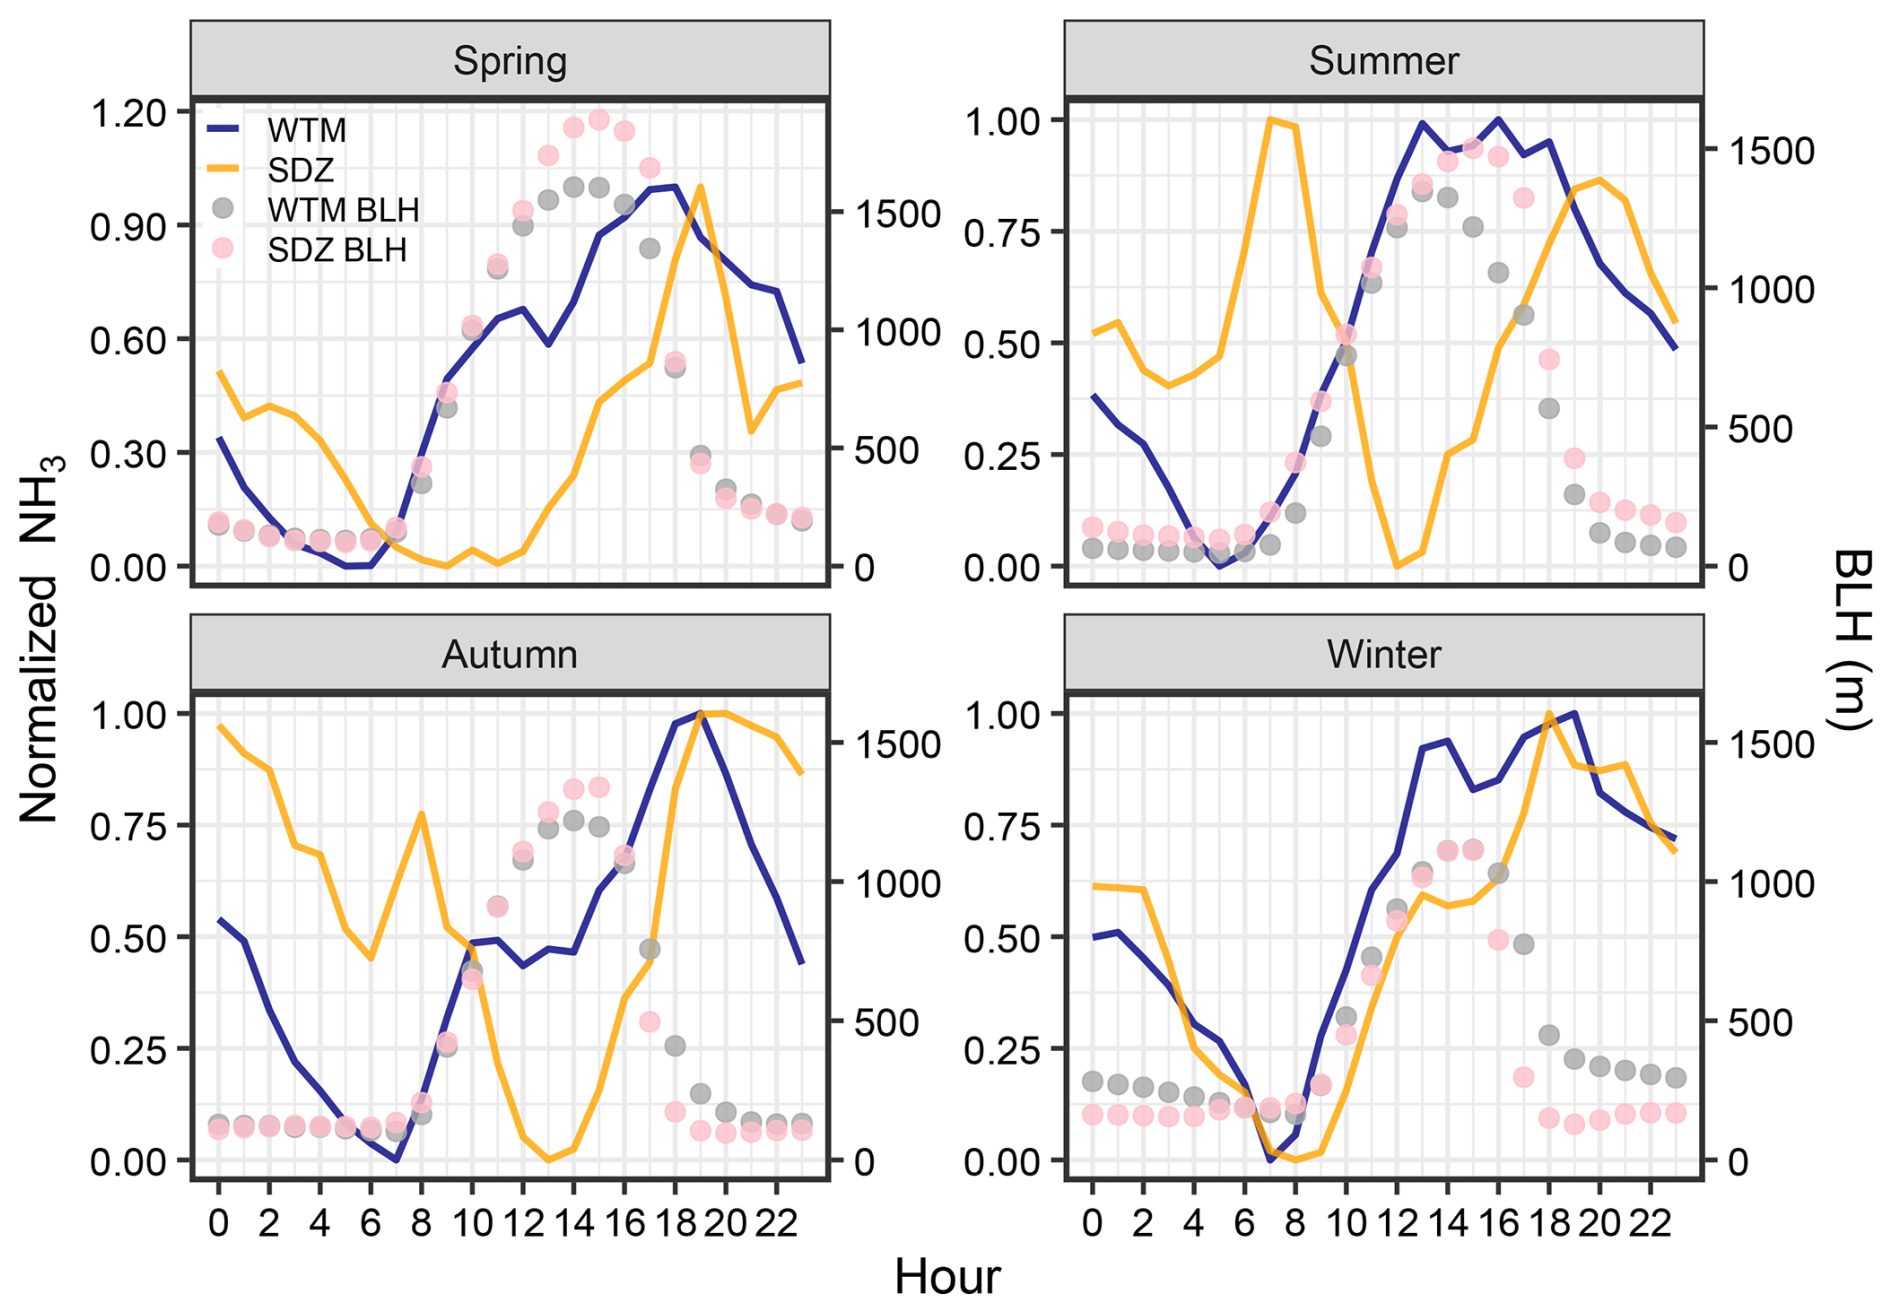
Figure 6Diurnal variation of normalized NH3 concentration and BLH at WTM (blue line and grey dots) and SDZ (orange line and pink dots), respectively.
However, different from the diurnal behavior of SDZ, NH3 levels at WTM began to rise steadily around 08:00. During spring and autumn, peaks occurred around 18:00, while in winter and summer, peak durations were longer (12:00–18:00), followed by a rapid decline. It is particularly noteworthy that the diurnal variation of NH3 concentration at WTM shows good consistency with the diurnal variation of BLH compared to SDZ, showing an increase in concentration as BLH rises and a decrease as BLH falls. This consistency might suggest that the mountain wind system transports the pollutants to the mountaintop during the day via upslope winds, along with the development of BLH through convective mixing. Conversely, nighttime downslope winds lead to the dispersion of these pollutants.
However, despite the fact that the distance between WTM and SDZ is more than 350 km and they are controlled by different transport patterns (i.e., mountain-plain and mountain-valley circulations in WTM and SDZ, respectively), their NH3 levels still exhibit a high similarity. To find out the underlying factor driving this convergence, CH4 data at SDZ was used to explain.
Figure 7a presents the variations in the NH3 concentration difference between SDZ and WTM, along with the average CH4 concentration across different periods. During Stage I (summer to early autumn), the fluctuation of the NH3 concentration difference is relatively small, ranging approximately from −5 to 5 ppb. In contrast, during Stage II (spring), the fluctuation amplitude of the difference increases significantly, and the values are mostly positive except for the period from 12 to 15 May 2021 (Fig. 7b), indicating that the NH3 concentration at SDZ is higher than that at WTM during this period. Corresponding to these patterns, the CH4 concentration at SDZ is higher in stage I and lower in stage II.
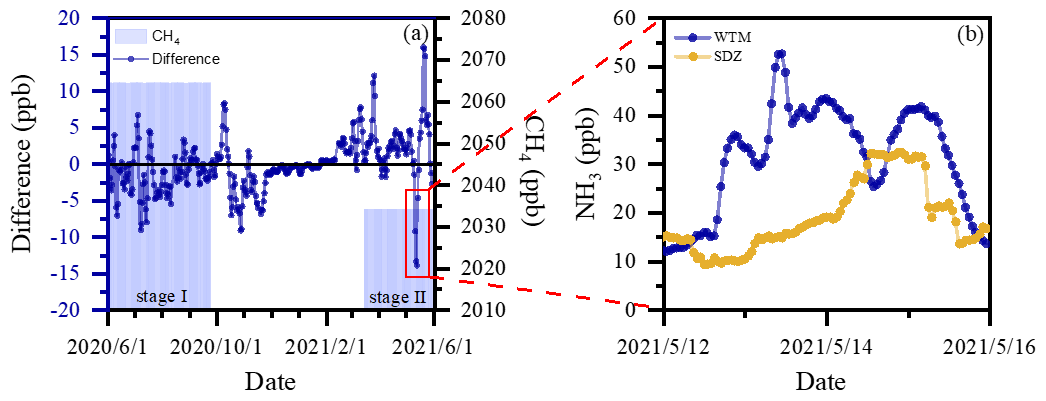
Figure 7Time series of average CH4 concentration at SDZ and daily concentration difference between SDZ and WTM (a) and hourly concentration at each site (b).
As CH4 is a key indicator of agricultural emissions, and the CH4 concentration at SDZ can represent the background level of agricultural emissions in North China, the relationship between the NH3 concentration difference and CH4 levels in stages I and II can be interpreted as follows: during stage I, when regional agricultural emissions are strong, the NH3 concentrations at WTM and SDZ are more closely aligned, reflecting the dominant role of agricultural sources in homogenizing the concentrations at the two sites. Conversely, during stage II, when regional agricultural emissions are weak, the NH3 concentration at SDZ is significantly affected by emissions from urban Beijing due to the transport of southerly winds. This leads to a larger concentration difference between the two sites, while the lower CH4 concentration at SDZ further confirms the reduced influence of agricultural sources during this period.
3.4.3 A typical case simulation
To find out why NH3 at WTM exhibited a higher level than that at SDZ in stage II, a typical case of 12 May 2021, was simulated to more clearly illustrate how NH3 concentration varies with the evolution of the wind field and BLH at WTM. Figure S4a and b show the simulated and observed hourly mean NH3 concentration, WD, and WS at the WTM and SDZ on 12 May 2021. Although the model has evident deviations in simulating the concentration values, it accurately captures the diurnal variations in NH3 levels and surface wind fields at both stations. Consequently, the simulation results are deemed reliable for further analysis of transport characteristics.
As shown in Fig. S4, on 12 May 2021, the prevailing wind direction in the NCP region was southeast, with a strong east wind system traversing the mountainous areas west of the NCP. NH3 concentration exhibited a transport pattern from the eastern plain to the western mountains, significantly impacting the WTM. During this period, the air mass affecting the SDZ station mainly originated from the Bohai Sea area, with no significant pollutant transport from the NCP, thus maintaining consistently low NH3 levels (Fig. S4b).
In addition to the transport effect of the southeasterly wind in the horizontal direction, the lifting of the boundary layer height also plays a crucial role in the increase in NH3 concentration at the WTM station. To more finely illustrate the process of NH3 concentration varying with the evolution of wind fields and boundary layer height, an east-to-west cross section (shown in Fig. S4b) has been selected for detailed analysis. As shown in Fig. 8, although similarly affected by the easterly wind, the NH3 emitted from the plain area on the morning of 12 May was trapped in the plain area due to the lower BLH, resulting in low concentrations at the WTM (Fig. 8a). In the afternoon, air masses with higher NH3 levels from the eastern plain region rise upward with the increase of BLH and are simultaneously pushed up along the slope by the prevailing easterly winds within the boundary layer, gradually affecting the WTM area (Fig. 8b). At the same time, both observations and simulations at WTM showed a rapid increase in ground-level NH3 concentrations (Fig. S4a). After nightfall, this high concentration situation persisted at WTM in the absence of strong weather systems (Fig. 8c). Our simulation result validates the aforementioned analysis that anthropogenic emissions from NCP, influenced by the regional transport and boundary layer lifting, would lead to an increase in NH3 levels in the relatively distant mountain areas with high altitude.
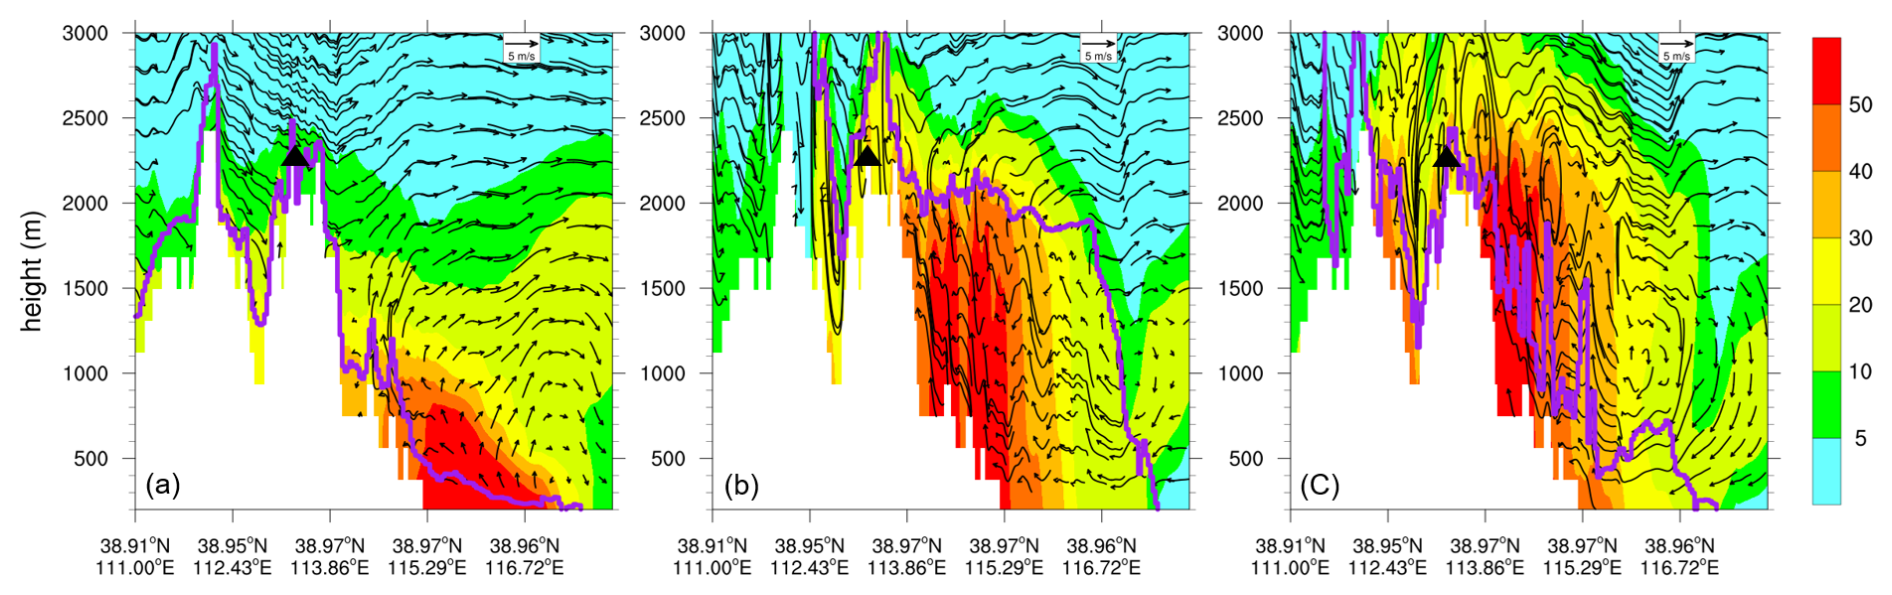
Figure 8West–east vertical distributions of NH3 mixing ratios (ppb) and vertical wind velocity (cm s−1) at (a) 08:00 LST, (b) 16:00 LST, and (c) 19:00 LST on 12 May 2021. Note that vertical velocities are scaled by a factor of 100 in the wind vectors. The cross-section location is indicated by the solid black line in Fig. S4b. Wind vectors are overlaid on the NH3 distributions. The thick purple curves denote the top of the atmospheric boundary layer. The approximate location of the WTM site is marked with a black triangle.
It is noteworthy that the modeling study of the typical case on 12 May 2021 was designed to corroborate the analysis based on observational data and to qualitatively elucidate the horizontal and vertical transport pathways of NH3, as well as their relationship with boundary layer dynamics. However, the simulation results have limitations in accurately capturing NH3 concentrations within a regional area and in the quantitative assessment of transport impacts. These aspects will be the focus of further investigation in future work.
Continuous high-resolution and real-time NH3 observations made from 1 June 2020 to 31 May 2021 were simultaneously conducted at WTM, SDZ, and BMS. The average concentration of NH3 at WTM was 9.0 ± 6.7 ppb during the study period. Compared to the same type of observation site in previous studies (e.g., forest or grassland mountain sites), the NH3 concentration measured at WTM was much higher than those reported by Pan et al. (2018), Ban et al. (2016), and Benedict et al. (2013). On the other hand, although WTM is located in a remote area, its NH3 levels were very close to those at the background station (SDZ) in the northern edge of NCP, while being much lower than those at the megacity station (BMS) in NCP. To identify the primary factors driving the similarity in NH3 levels between WTM and SDZ, meteorological effects, potential source regions, and transport patterns were analyzed.
CCM analysis between NH3 and meteorological variables revealed that WD, WS, and BLH significantly regulate NH3 levels at both WTM and SDZ across all seasons. The relationships of wind and NH3 concentration as well as PSCF results suggested that these sites were influenced by a shared common source area in the NCP, especially in the south of Hebei, the west of Shandong, and the east of Henan provinces.
The influence of pollutants emitted from NCP on WTM and SDZ was different. NH3 concentrations at SDZ were primarily controlled by the mountain-valley circulation, which could transport the NH3 from NCP to it by valley wind. For WTM, under the effect of mountain-plain circulation and the diurnal variation of BLH, the pollutant from NCP was carried up to the top of the mountain by the vertical transport and convective mixing. This transport pattern was further confirmed by WRF-Chem simulation.
Furthermore, the correlation between CH4 concentrations and the NH3 level difference between SDZ and WTM indicated that regional agricultural emissions in NCP were the dominant factor contributing to the NH3 similarity between these two sites – even though the two sites differed significantly in altitude and geography.
Our study provides a full annual cycle of measurements at a location that is underrepresented in the global ammonia monitoring network, and highlights that emissions from the NCP can influence NH3 concentrations at both high-altitude and background areas in northern China by different transport mechanisms. These results could help policymakers develop effective strategies for mitigating regional air pollution. However, our results cannot distinguish specific NH3 sources and their quantitative contributions. Therefore, additional δ15N isotope measurements are needed in future studies.
The data are available at https://doi.org/10.5281/zenodo.17089450 (Pu et al., 2025).
The supplement related to this article is available online at https://doi.org/10.5194/acp-26-6133-2026-supplement.
WP analyzed the data and prepared the manuscript. JX revised the manuscript. LZ and JD conducted the measurements. ZM supervised the project. All co-authors discussed the results and commented on the manuscript.
The contact author has declared that none of the authors has any competing interests.
Publisher's note: Copernicus Publications remains neutral with regard to jurisdictional claims made in the text, published maps, institutional affiliations, or any other geographical representation in this paper. The authors bear the ultimate responsibility for providing appropriate place names. Views expressed in the text are those of the authors and do not necessarily reflect the views of the publisher.
The authors would like to acknowledge the Beijing Meteorological Information Center for supporting the meteorological data collection.
This research has been supported by the National Natural Science Foundation of China (grant nos. 42275188, 42005094, and 42177091).
This paper was edited by Amos Tai and reviewed by two anonymous referees.
Baek, B. and Aneja, V.: Measurement and analysis of the relationship between ammonia, acid gases, and fine particles in eastern North Carolina, J. Air Waste Manage. Assoc., 54, 623–633, https://doi.org/10.1080/10473289.2004.10470933, 2004.
Ban, S., Matsuda, K., Sato, K., and Ohizumi, T.: Long-term assessment of nitrogen deposition at remote EANET sites in Japan, Atmos. Environ., 146, 70–78, https://doi.org/10.1016/j.atmosenv.2016.04.015, 2016.
Benedict, K. B., Day, D., Schwandner, F. M., Kreidenweis, S. M., Schichtel, B., Malm, W. C., and Collett, J. L.: Observations of atmospheric reactive nitrogen species in Rocky Mountain National Park and across northern Colorado, Atmos. Environ., 64, 66–76, https://doi.org/10.1016/j.atmosenv.2012.08.066, 2013.
Chen, Z., Xie, X., Cai, J., Chen, D., Gao, B., He, B., Cheng, N., and Xu, B.: Understanding meteorological influences on PM2.5 concentrations across China: a temporal and spatial perspective, Atmos. Chem. Phys., 18, 5343–5358, https://doi.org/10.5194/acp-18-5343-2018, 2018.
Chen, Z., Chen, D., Zhao, C., Kwan, M.-p., Cai, J., Zhuang, Y., Zhao, B., Wang, X., Chen, B., Yang, J., Li, R., He, B., Gao, B., Wang, K., and Xu, B.: Influence of meteorological conditions on PM2.5 concentrations across China: A review of methodology and mechanism, Environ. Int., 139, 105558, https://doi.org/10.1016/j.envint.2020.105558, 2020.
Chen, Z., Xu, M., Gao, B., Sugihara, G., Shen, F., Cai, Y., Li, A., Wu, Q., Yang, L., Yao, Q., Chen, X., Yang, J., Zhou, C., and Li, M.: Causation inference in complicated atmospheric environment, Environ. Pollut., 303, 119057, https://doi.org/10.1016/j.envpol.2022.119057, 2022.
Clark, A. T., Ye, H., Isbell, F., Deyle, E. R., and Sugihara, G. J. E.: Spatial 'convergent cross mapping' to detect causal relationships from short time-series, Ecology, 96, 1174–1181, https://doi.org/10.1890/14-1479.1, 2015.
Dammers, E., McLinden, C. A., Griffin, D., Shephard, M. W., Van Der Graaf, S., Lutsch, E., Schaap, M., Gainairu-Matz, Y., Fioletov, V., Van Damme, M., Whitburn, S., Clarisse, L., Cady-Pereira, K., Clerbaux, C., Coheur, P. F., and Erisman, J. W.: NH3 emissions from large point sources derived from CrIS and IASI satellite observations, Atmos. Chem. Phys., 19, 12261–12293, https://doi.org/10.5194/acp-19-12261-2019, 2019.
Elser, M., El-Haddad, I., Maasikmets, M., Bozzetti, C., Wolf, R., Ciarelli, G., Slowik, J. G., Richter, R., Teinemaa, E., Hüglin, C., Baltensperger, U., and Prévôt, A. S. H.: High contributions of vehicular emissions to ammonia in three European cities derived from mobile measurements, Atmos. Environ., 175, 210–220, https://doi.org/10.1016/j.atmosenv.2017.11.030, 2018.
Giorgino, T.: Computing and Visualizing Dynamic Time Warping Alignments in R: The dtw Package, J. Stat. Softw., 31, 1–24, https://doi.org/10.18637/jss.v031.i07, 2009.
Grell, G. A., Peckham, S. E., Schmitz, R., McKeen, S. A., Frost, G., Skamarock, W. C., and Eder, B.: Fully coupled “online” chemistry within the WRF model, Atmos. Environ., 39, 6957–6975, https://doi.org/10.1016/j.atmosenv.2005.04.027, 2005.
Höpfner, M., Volkamer, R., Grabowski, U., Grutter, M., Orphal, J., Stiller, G., von Clarmann, T., and Wetzel, G.: First detection of ammonia (NH3) in the Asian summer monsoon upper troposphere, Atmos. Chem. Phys., 16, 14357–14369, https://doi.org/10.5194/acp-16-14357-2016, 2016.
Kuang, Y., Xu, W., Lin, W., Meng, Z., Zhao, H., Ren, S., Zhang, G., Liang, L., and Xu, X.: Explosive morning growth phenomena of NH3 on the North China Plain: Causes and potential impacts on aerosol formation, Environ. Poll., 257, 113621, https://doi.org/10.1016/j.envpol.2019.113621, 2020.
Lan, Z., Lin, W., Pu, W., and Ma, Z.: Measurement report: Exploring NH3 behavior in urban and suburban Beijing: comparison and implications, Atmos. Chem. Phys., 21, 4561–4573, https://doi.org/10.5194/acp-21-4561-2021, 2021.
Leen, J. B., Yu, X.-Y., Gupta, M., Baer, D. S., Hubbe, J. M., Kluzek, C. D., Tomlinson, J. M., and Hubbell, M. R.: Fast In Situ Airborne Measurement of Ammonia Using a Mid-Infrared Off-Axis ICOS Spectrometer, Environ. Sci. Technol., 47, 10446–10453, https://doi.org/10.1021/es401134u, 2013.
Li, B., Chen, L., Shen, W., Jin, J., Wang, T., Wang, P., Yang, Y., and Liao, H.: Improved gridded ammonia emission inventory in China, Atmos. Chem. Phys., 21, 15883–15900, https://doi.org/10.5194/acp-21-15883-2021, 2021.
Lin, W., Xu, X., Zhang, X., and Tang, J.: Contributions of pollutants from North China Plain to surface ozone at the Shangdianzi GAW Station, Atmos. Chem. Phys., 8, 5889–5898, https://doi.org/10.5194/acp-8-5889-2008, 2008.
Liu, M., Huang, X., Song, Y., Tang, J., Cao, J., Zhang, X., Zhang, Q., Wang, S., Xu, T., Kang, L., Cai, X., Zhang, H., Yang, F., Wang, H., Yu, J. Z., Lau, A. K. H., He, L., Huang, X., Duan, L., Ding, A., Xue, L., Gao, J., Liu, B., and Zhu, T.: Ammonia emission control in China would mitigate haze pollution and nitrogen deposition, but worsen acid rain, P. Natl. Acad. Sci., 116, 7760–7765, https://doi.org/10.1073/pnas.1814880116, 2019.
Nowak, J. B., Neuman, J. A., Kozai, K., Huey, L. G., Tanner, D. J., Holloway, J. S., Ryerson, T. B., Frost, G. J., McKeen, S. A., and Fehsenfeld, F. C.: A chemical ionization mass spectrometry technique for airborne measurements of ammonia, J. Geophys. Res.-Atmos., 112, https://doi.org/10.1029/2006JD007589, 2007.
Nowak, J. B., Neuman, J. A., Bahreini, R., Brock, C. A., Middlebrook, A. M., Wollny, A. G., Holloway, J. S., Peischl, J., Ryerson, T. B., and Fehsenfeld, F. C.: Airborne observations of ammonia and ammonium nitrate formation over Houston, Texas, J. Geophys. Res.-Atmos., 115, https://doi.org/10.1029/2010JD014195, 2010.
Nowak, J. B., Neuman, J. A., Bahreini, R., Middlebrook, A. M., Holloway, J. S., McKeen, S. A., Parrish, D. D., Ryerson, T. B., and Trainer, M.: Ammonia sources in the California South Coast Air Basin and their impact on ammonium nitrate formation, Geophys. Res. Lett., 39, https://doi.org/10.1029/2012GL051197, 2012.
Pan, Y., Tian, S., Zhao, Y., Zhang, L., Zhu, X., Gao, J., Huang, W., Zhou, Y., Song, Y., Zhang, Q., and Wang, Y.: Identifying Ammonia Hotspots in China Using a National Observation Network, Environ. Sci. Technol., 52, 3926–3934, https://doi.org/10.1021/acs.est.7b05235, 2018.
Pu, W., Shi, X., Wang, L., Xu, J., and Ma, Z.: Potential source regions of air pollutants at a regional background station in Northern China, Environ. Technol., 40, 3412–3421, https://doi.org/10.1080/09593330.2018.1476593, 2019.
Pu, W., Guo, H., Ma, Z., Qiu, Y., Tang, Y., Liu, Q., Wang, F., and Sheng, J.: Aircraft measurements reveal vertical distribution of atmospheric ammonia over the North China Plain in early autumn, Environ. Chem. Lett., 18, 2149–2156, https://doi.org/10.1007/s10311-020-01051-4, 2020a.
Pu, W., Ma, Z., Collett Jr., J. L., Guo, H., Lin, W., Cheng, Y., Quan, W., Li, Y., Dong, F., and He, D.: Regional transport and urban emissions are important ammonia contributors in Beijing, China, Environ. Poll., 265, 115062, https://doi.org/10.1016/j.envpol.2020.115062, 2020b.
Pu, W., Sheng, J., Tian, P., Huang, M., Liu, X., Collett, J. L., Li, Z., Zhao, X., He, D., Dong, F., Zhang, N., Quan, W., Qiu, Y., Song, Y., Lin, W., Pan, Y., and Ma, Z.: On-road mobile mapping of spatial variations and source contributions of ammonia in Beijing, China, Sci. Total Environ., 864, 160869, https://doi.org/10.1016/j.scitotenv.2022.160869, 2023.
Pu, W., Xu, J., Zhu, L., Liu, C., Zhou, L., Dong, J., Ge, S., and Ma, Z.: Hourly measurement dataset of ammonia, Zenodo [data set], https://doi.org/10.5281/zenodo.17089450, 2025.
Rawat, V., Singh, N., Singh, J., Rajput, A., Dhaka, S. K., Matsumi, Y., Nakayama, T., and Hayashida, S.: Assessing the high-resolution PM2.5 measurements over a Central Himalayan site: impact of mountain meteorology and episodic events, Air Qual. Atmos. Hlth., 17, 51–70, https://doi.org/10.1007/s11869-023-01429-7, 2024.
Schiferl, L. D., Heald, C. L., Van Damme, M., Clarisse, L., Clerbaux, C., Coheur, P.-F., Nowak, J. B., Neuman, J. A., Herndon, S. C., Roscioli, J. R., and Eilerman, S. J.: Interannual variability of ammonia concentrations over the United States: sources and implications, Atmos. Chem. Phys., 16, 12305–12328, https://doi.org/10.5194/acp-16-12305-2016, 2016.
Shephard, M. W., Cady-Pereira, K. E., Luo, M., Henze, D. K., Pinder, R. W., Walker, J. T., Rinsland, C. P., Bash, J. O., Zhu, L., Payne, V. H., and Clarisse, L.: TES ammonia retrieval strategy and global observations of the spatial and seasonal variability of ammonia, Atmos. Chem. Phys., 11, 10743–10763, https://doi.org/10.5194/acp-11-10743-2011, 2011.
Sugihara, G., May, R., Ye, H., Hsieh, C.-H., Deyle, E., Fogarty, M., and Munch, S.: Detecting Causality in Complex Ecosystems, Science, 338, 496–500, https://doi.org/10.1126/science.1227079, 2012.
Van Damme, M., Clarisse, L., Heald, C. L., Hurtmans, D., Ngadi, Y., Clerbaux, C., Dolman, A. J., Erisman, J. W., and Coheur, P. F.: Global distributions, time series and error characterization of atmospheric ammonia (NH3) from IASI satellite observations, Atmos. Chem. Phys., 14, 2905–2922, https://doi.org/10.5194/acp-14-2905-2014, 2014.
Van Damme, M., Clarisse, L., Whitburn, S., Hadji-Lazaro, J., Hurtmans, D., Clerbaux, C., and Coheur, P.-F.: Industrial and agricultural ammonia point sources exposed, Nature, 564, 99–103, https://doi.org/10.1038/s41586-018-0747-1, 2018.
Wang, Y. Q.: MeteoInfo: GIS software for meteorological data visualization and analysis, Meteorol. Appl., 21, 360–368, https://doi.org/10.1002/met.1345, 2014.
Warner, J. X., Wei, Z., Strow, L. L., Dickerson, R. R., and Nowak, J. B.: The global tropospheric ammonia distribution as seen in the 13-year AIRS measurement record, Atmos. Chem. Phys., 16, 5467–5479, https://doi.org/10.5194/acp-16-5467-2016, 2016.
Warner, J. X., Dickerson, R. R., Wei, Z., Strow, L. L., Wang, Y., and Liang, Q. J.: Increased atmospheric ammonia over the world's major agricultural areas detected from space, Geophys. Res. Lett., 44, 2875–2884, 2017.
Wentworth, G. R., Murphy, J. G., Benedict, K. B., Bangs, E. J., and Collett Jr., J. L.: The role of dew as a night-time reservoir and morning source for atmospheric ammonia, Atmos. Chem. Phys., 16, 7435–7449, https://doi.org/10.5194/acp-16-7435-2016, 2016.
Wiedinmyer, C., Akagi, S. K., Yokelson, R. J., Emmons, L. K., Al-Saadi, J. A., Orlando, J. J., and Soja, A. J.: The Fire INventory from NCAR (FINN): a high resolution global model to estimate the emissions from open burning, Geosci. Model Dev., 4, 625–641, https://doi.org/10.5194/gmd-4-625-2011, 2011.
Xu, L. and Penner, J. E.: Global simulations of nitrate and ammonium aerosols and their radiative effects, Atmos. Chem. Phys., 12, 9479–9504, https://doi.org/10.5194/acp-12-9479-2012, 2012.
Zaveri, R. A. and Peters, L. K. J. J. o. G. R. A.: A new lumped structure photochemical mechanism for large-scale applications, J. Geophys. Res.-Atmos., 104, 30387–30415, https://doi.org/10.1029/1999JD900876, 1999.
Zhang, G., Yan, H., Li, T., Zhu, Y., Zhou, S., Feng, Y., and Zhou, W.: Relation analysis on emission control and economic cost of SCR system for marine diesels, Sci. Total Environ., 788, 147856, https://doi.org/10.1016/j.scitotenv.2021.147856, 2021.
Zhang, Q., Streets, D. G., Carmichael, G. R., He, K. B., Huo, H., Kannari, A., Klimont, Z., Park, I. S., Reddy, S., Fu, J. S., Chen, D., Duan, L., Lei, Y., Wang, L. T., and Yao, Z. L.: Asian emissions in 2006 for the NASA INTEX-B mission, Atmos. Chem. Phys., 9, 5131–5153, https://doi.org/10.5194/acp-9-5131-2009, 2009.
Zhang, Y., Tang, A., Wang, D., Wang, Q., Benedict, K., Zhang, L., Liu, D., Li, Y., Collett Jr., J. L., Sun, Y., and Liu, X.: The vertical variability of ammonia in urban Beijing, China, Atmos. Chem. Phys., 18, 16385–16398, https://doi.org/10.5194/acp-18-16385-2018, 2018.
Zhang, Y., Ma, X., Tang, A., Fang, Y., Misselbrook, T., and Liu, X.: Source Apportionment of Atmospheric Ammonia at 16 Sites in China Using a Bayesian Isotope Mixing Model Based on δ15N–NHx Signatures, Environ. Sci. Technol., 57, 6599–6608, https://doi.org/10.1021/acs.est.2c09796, 2023.