the Creative Commons Attribution 4.0 License.
the Creative Commons Attribution 4.0 License.
 | 06 May 2026
Insights on ozone formation sensitivity in Southeast and East Asian megacities during ASIA-AQ
Changmin Cho
Alessandro Franchin
Frank Flocke
Kirk Lesko
Courtney Owen
Samuel R. Hall
Kirk Ullmann
Eric C. Apel
Alan J. Hills
Rebecca S. Hornbrook
Behrooz Roozitalab
Daun Jeong
Glenn S. Diskin
Yonghoon Choi
Joshua P. DiGangi
Jason Miech
Glenn M. Wolfe
Thomas F. Hanisco
Jason M. St. Clair
Jin Liao
Erin R. Delaria
Abby Sebol
Reem A. Hannun
Paul O. Wennberg
Katherine Ball
Young Ro Lee
L. Gregory Huey
David J. Tanner
Linda Arterburn
Donald R. Blake
Nicola J. Blake
Barbara Barletta
Simone Meinardi
Kyung-Eun Min
Heejoo Kang
Woohui Nam
Armin Wisthaler
Felix Piel
Wojciech Wojnowski
Jack Dibb
James Crawford
Controlling ozone (O3) in rapidly urbanizing megacities in Southeast and East Asia remains a challenge. O3 is a secondary pollutant formed through nonlinear photochemical reactions with its precursors: nitrogen oxides (NOx) and volatile organic compounds (VOCs). Observation-based quantification of precursor sensitivity remains scarce, limiting actionable O3 control. To address this, we leverage airborne observations from the NASA DC-8 during the ASIA-AQ campaign conducted in February and March 2024 across four Asian megacities: Metro Manila, the Seoul Metropolitan Area, the Tainan–Kaohsiung Metropolitan Area, and the Bangkok Metropolitan Region. These extensive measurements of various trace gases were used to constrain a zero-dimensional box model and estimate the net production rates of Ox (POx, Ox = O3 + NO2). Precursor sensitivity regimes were characterized for each megacity by generating isopleths of POx across varying levels of NOx and VOCs. The analysis revealed that Manila and Tainan–Kaohsiung exhibited predominantly NOx-sensitive conditions, favoring NOx reduction as an effective O3 mitigation strategy, while Bangkok showed a more mixed sensitivity, suggesting combined NOx and VOC reductions. In contrast, Seoul exhibited a primarily VOC-sensitive regime associated with its higher NOx conditions relative to the other cities, underscoring the importance of VOC-focused strategies. In addition, to quantitatively assess sensitivity transitions, we computed orthogonal distances from the isopleth transition boundaries for all four study areas. Diurnal analyses of these distances revealed a shift from more VOC-sensitive conditions in the morning toward more NOx-sensitive regimes in the afternoon. These findings provide critical insights for formulating effective, city-specific O3 control policies in urban environments.
- Article
(3224 KB) - Full-text XML
-
Supplement
(3262 KB) - BibTeX
- EndNote


Megacities in Southeast and East Asia, such as those in the Philippines, Thailand, Taiwan, and South Korea, have undergone rapid urbanization and industrialization in recent decades, leading to severe air quality issues. These Asian megacities are characterized by high population densities, diverse emission profiles, and unique meteorological conditions associated with the timing of monsoon dynamics and transboundary transport of pollutants, making their air pollution issues complex and multifaceted (Chin et al., 2017). High levels of primary and secondary pollutants, particularly ozone (O3), in these densely populated areas pose significant risks to public health and agricultural production (Dörter et al., 2022; Gaudel et al., 2018; Gu et al., 2024; Wang et al., 2022b).
Surface O3 is produced through the photochemical reactions of nitrogen oxides (NOx) and volatile organic compounds (VOCs) involving radical propagation reactions (Finlayson-Pitts and Pitts, 2000). The net production of O3 is driven by the reactions of nitric oxide (NO) with peroxyl radicals formed from the oxidation of VOCs by hydroxyl radicals (OH), leading to the formation of nitrogen dioxide (NO2), which subsequently photolyzes to produce O3.
The balance between the mixing ratios of the precursors, VOCs and NOx, alongside meteorological conditions such as wind, temperature, humidity, and sunlight intensity, influences O3 mixing ratios. Particularly, the nonlinear dependence of O3 formation on its precursors causes O3 to respond differently to changes in VOC and NOx emissions depending on local atmospheric conditions, leading to either NOx-sensitive or VOC-sensitive regimes (Cohan et al., 2005; Liu and Shi, 2021; Shen et al., 2021). In NOx-sensitive areas, reducing NOx emissions leads to a marked decrease in O3 production. In VOC-sensitive regimes (also referred to as NOx-saturated), reductions in VOC emissions are effective at controlling O3 levels in the short term. If VOC mixing ratios are reduced in a NOx-sensitive regime (or vice versa) O3 production can remain constant or even increase rather than decrease, causing a counterproductive effect. It is therefore critical to identify the prevailing sensitivity regime, while recognizing that sustainable long-term O3 mitigation ultimately requires reductions in both NOx and VOCs emissions. Between these two regimes, transitional conditions may occur when precursor levels lie near the ridge line separating NOx- and VOC-sensitive regimes. Under such conditions, ozone formation sensitivity can shift as precursor levels and photochemical conditions evolve, even on local and diurnal scales (Mazzuca et al., 2016; Guo et al., 2021; Tan et al., 2018; Stockwell et al., 2025). This nonlinearity makes it more difficult to navigate and inform the direction of emission reduction strategies (Ojha et al., 2022; Yarwood et al., 2013). Therefore, a thorough understanding of the chemical sensitivity of O3 formation to these precursor levels is essential for policy makers to develop effective control strategies.
The complexity of O3 formation, due to nonlinear relationships with precursor levels, has been the subject of extensive research. Three-dimensional (3-D) chemical transport models (CTMs) have been widely used to simulate O3 formation by combining emission inventories, meteorological conditions, and chemical processes (Wang and Jacob, 1998; Lee et al., 2014; Li et al., 2020; Dang et al., 2023). Although CTMs can simulate large spatial and temporal scales, allowing for testing of emission reduction scenarios and their effects on air quality over extensive regions, the accuracy of model evaluations is often limited by large uncertainties in boundary layer dynamics, emission inventories, and chemical mechanisms (Choi and Souri, 2015; Liu and Shi, 2021). Satellites have become an increasingly important tool for studying O3 precursors across wide geographic areas. Formaldehyde (HCHO) and NO2 are often used as proxies for VOCs and NOx, respectively (Tonnesen and Dennis, 2000), and the ratio of HCHO NO2 is widely used to diagnose whether O3 production is in a NOx- or VOC-sensitive regime (Martin et al., 2004; Duncan et al., 2010; Jin and Holloway, 2015; Souri et al., 2017; Jin et al., 2017; Ren et al., 2022). However, using HCHO as a substitute for total VOC reactivity carries intrinsic uncertainty, since direct HCHO emissions and secondary production may not fully capture the diversity of reactive VOC species. This limitation is further compounded when the ratio is derived from satellite retrievals, where both retrieval errors and the reliance on models to relate total column abundances to near-surface conditions can introduce discrepancies (Schroeder et al., 2017; Souri et al., 2020, 2023). In addition, the HCHO NO2 ratio can vary substantially between environments, so regime classifications based on a single threshold value should be treated with caution (Schroeder et al., 2017; Roozitalab et al., 2022). Therefore, to minimize uncertainties in O3 formation sensitivities, various ground-based observations (Sillman and He, 2002; Chen and Brune, 2012; Chen et al., 2022; Wang et al., 2022a) and airborne campaigns (Mazzuca et al., 2016; Schroeder et al., 2017, 2020; Womack et al., 2019; Nussbaumer et al., 2024) have been performed with comprehensive sets of measurements of O3 and its precursors. Ground-based measurements provide continuous monitoring of pollutant levels over time, while airborne observations offer detailed vertical profiles and capture spatial variability, bridging the gap between total column satellite measurements and near-surface conditions.
In this study, we investigate the precursor sensitivities of the chemical production rates of ozone (POx; Ox = NO2 + O3) in four Asian megacities during the Airborne and Satellite Investigation of Asian Air Quality (ASIA-AQ) campaign from February to March 2024. Using comprehensive airborne measurements from the NASA DC-8 aircraft, we constrain a zero-dimensional chemical box model to estimate the POx. Isopleths of POx across a varying range of NOx and VOC levels are used to show the sensitivity regimes of ozone formation in each megacity to their precursors. These results offer a scientific basis for informing region-specific precursor control strategies across different urban atmospheres in Asia.
2.1 The ASIA-AQ Campaign
The ASIA-AQ campaign, conducted in February and March 2024, targeted specific regions across major urban centers in Southeast and East Asia: the Philippines (6–15 February), South Korea (17 February–11 March), Thailand (16–25 March), and Taiwan (15 February, 13 and 27 March). The timing of the campaign was determined by the broader scientific objectives of ASIA-AQ as described in the ASIA-AQ white paper (https://espo.nasa.gov/asia-aq/document/ASIA-AQ_White_Paper, last access: 23 April 2026).
Briefly, for the Southeast Asian regions (Philippines and Thailand), this period corresponds to the pre-monsoon season, characterized by dry conditions and enhanced solar radiation, which are favorable for active ozone (Toh et al., 2013; Marvin et al., 2021). In Taiwan, the campaign period represents a transitional phase prior to the peak ozone season, during which photochemical activity is already significant (Lin et al., 2014). In contrast, South Korea was in its late winter season, outside the typical peak ozone season, with generally reduced photochemical activity compared to the other regions (Lee and Park, 2022; Kim et al., 2023). Despite these seasonal differences, the campaign sampled a broad range of NOx and VOC conditions across the studied regions, enabling characterization of ozone production sensitivity across diverse chemical environments.
We conducted a total of 16 research flights with the NASA DC-8 aircraft, including 4 flights over the Philippines, 5 over South Korea, 4 over Thailand, and 3 over Taiwan (Table S1 in the Supplement). The DC-8 was equipped with 26 state-of-the-art instruments to measure over 100 trace gases, aerosol properties, and meteorological parameters (Table S2). The full ASIA-AQ dataset has been archived and is publicly available from the NASA LaRC Airborne Science Data for Atmospheric Composition (Project DOI: https://doi.org/10.5067/SUBORBITAL/ASIA-AQ/DATA001, ASIA-AQ Science Team, 2025).
This study focuses on the data collected during the flights over four Asian megacities: Metro Manila (MM), the Seoul Metropolitan Area (SMA), the Tainan–Kaohsiung Metropolitan Area (TKMA), and the Bangkok Metropolitan Region (BMR), shown in Fig. 1. It is important to note that measurements in TKMA were conducted during transit flights between other country deployments, therefore early morning sampling was not performed, and flight dates over TKMA were sparser compared to other cities (see Sect. 3.1). The DC-8 regularly executed missed-approaches, in which the aircraft flew over several regional airport runways without landing to obtain vertical profiles of trace gases from a few tens of meters to several kilometers. The flight paths were centered on each megacity, ensuring that the aircraft flew over the city center at least twice per flight pattern. This pattern was repeated two to three times during each research flight at different times of day (typically morning, midday, and/or afternoon) to identify key patterns in chemical evolution of pollutants as a function of both altitude and time of day.
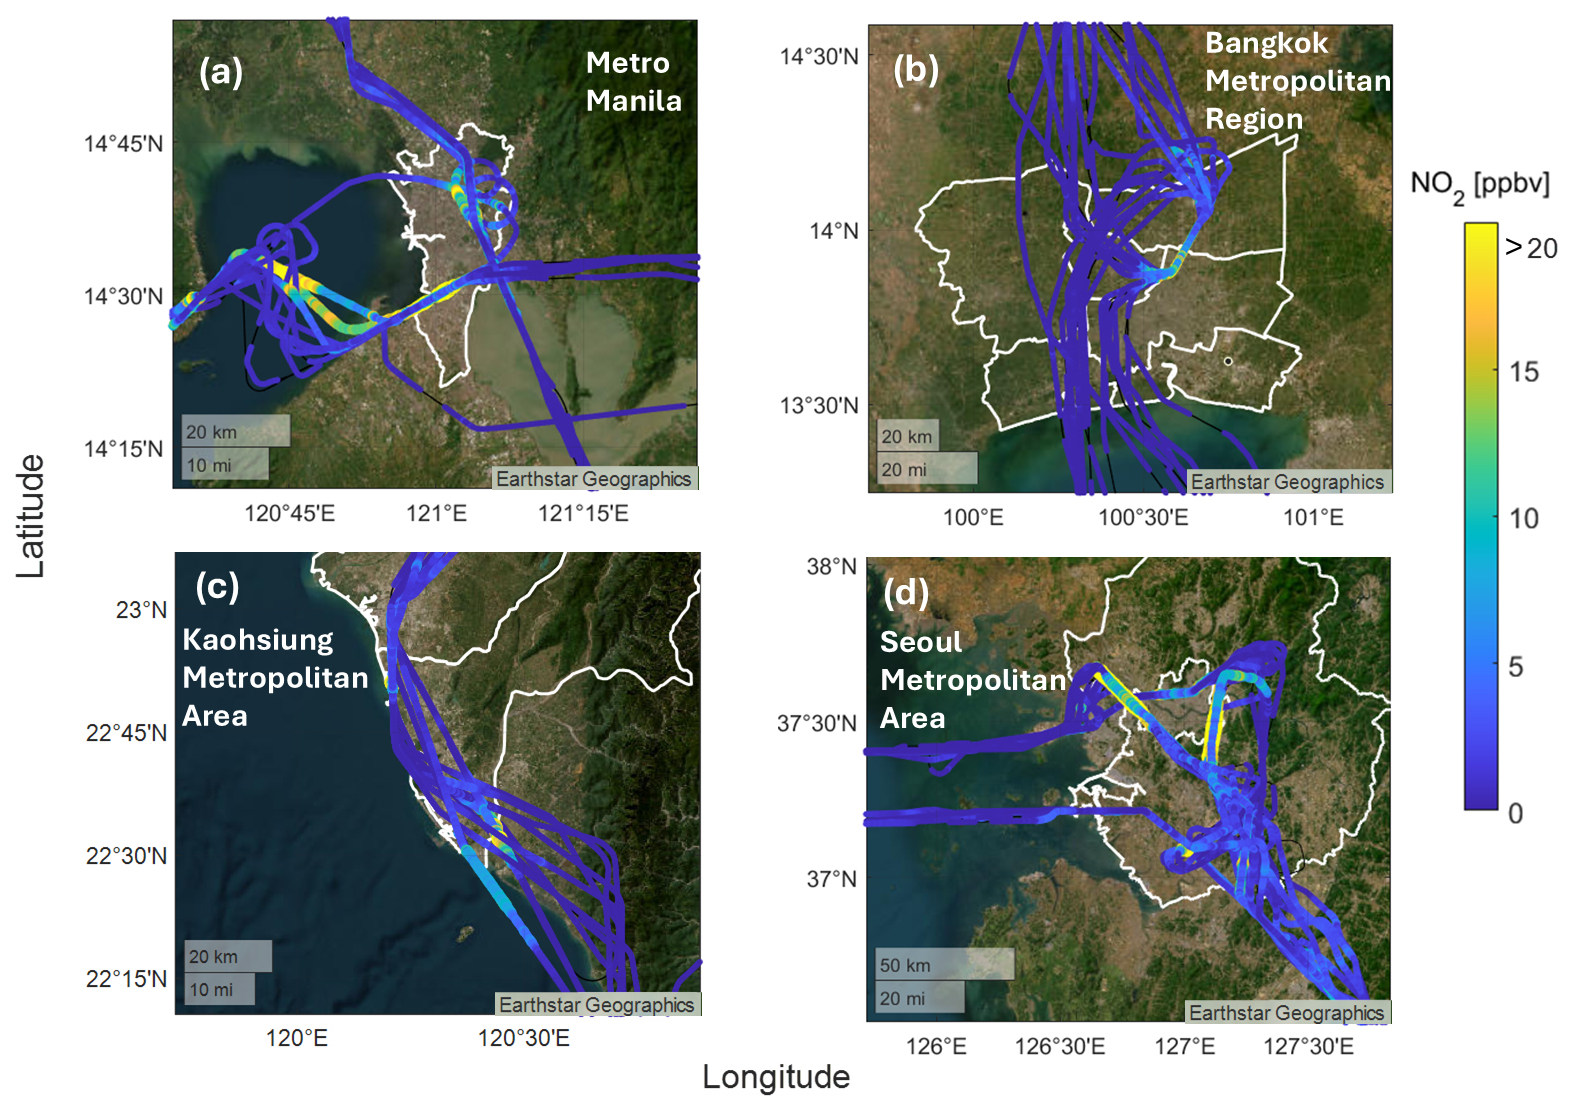
Figure 1Flight tracks (Thin black lines) during the ASIA-AQ campaign over four major Asian megacities: (a) Metro Manila, Philippines; (b) Bangkok Metropolitan Region, Thailand; (c) Tainan–Kaohsiung Metropolitan Area, Taiwan; and (d) Seoul Metropolitan Area, South Korea. The flight tracks are colored by the observed NO2 mixing ratios from the DC-8. White boundaries indicate the administrative or urban extents of each megacity. Basemap source: Esri, Maxar, Earthstar Geographics, and the GIS User Community | Powered by Esri.
2.2 Box Model Setup
We used the Framework for zero-dimensional Atmospheric Modeling (F0AM v4.3; Wolfe et al., 2016) to simulate POx and examine the sensitivity of ozone formation to the changes in precursor mixing ratios (e.g., NOx and VOCs) constrained by the airborne observations from the DC-8 (Table S2).
The model was constrained using near-surface observations below 750 m (pressure altitude above sea level) over each megacity, including trace gases (e.g., O3, CO, NOx, H2O, and VOCs), photolysis frequencies, and meteorological conditions such as temperature and pressure (Table S2). The altitude threshold was chosen to focus on air masses most representative of near-surface conditions typically influenced by local emissions. Inspection of precursor vertical profiles (Fig. 2) and sensitivity tests with different altitude cuts (see Sect. S2 and Table S3 in the Supplement) support 750 m as a sensible and conservative choice that keeps the analysis centered on boundary-layer chemistry.
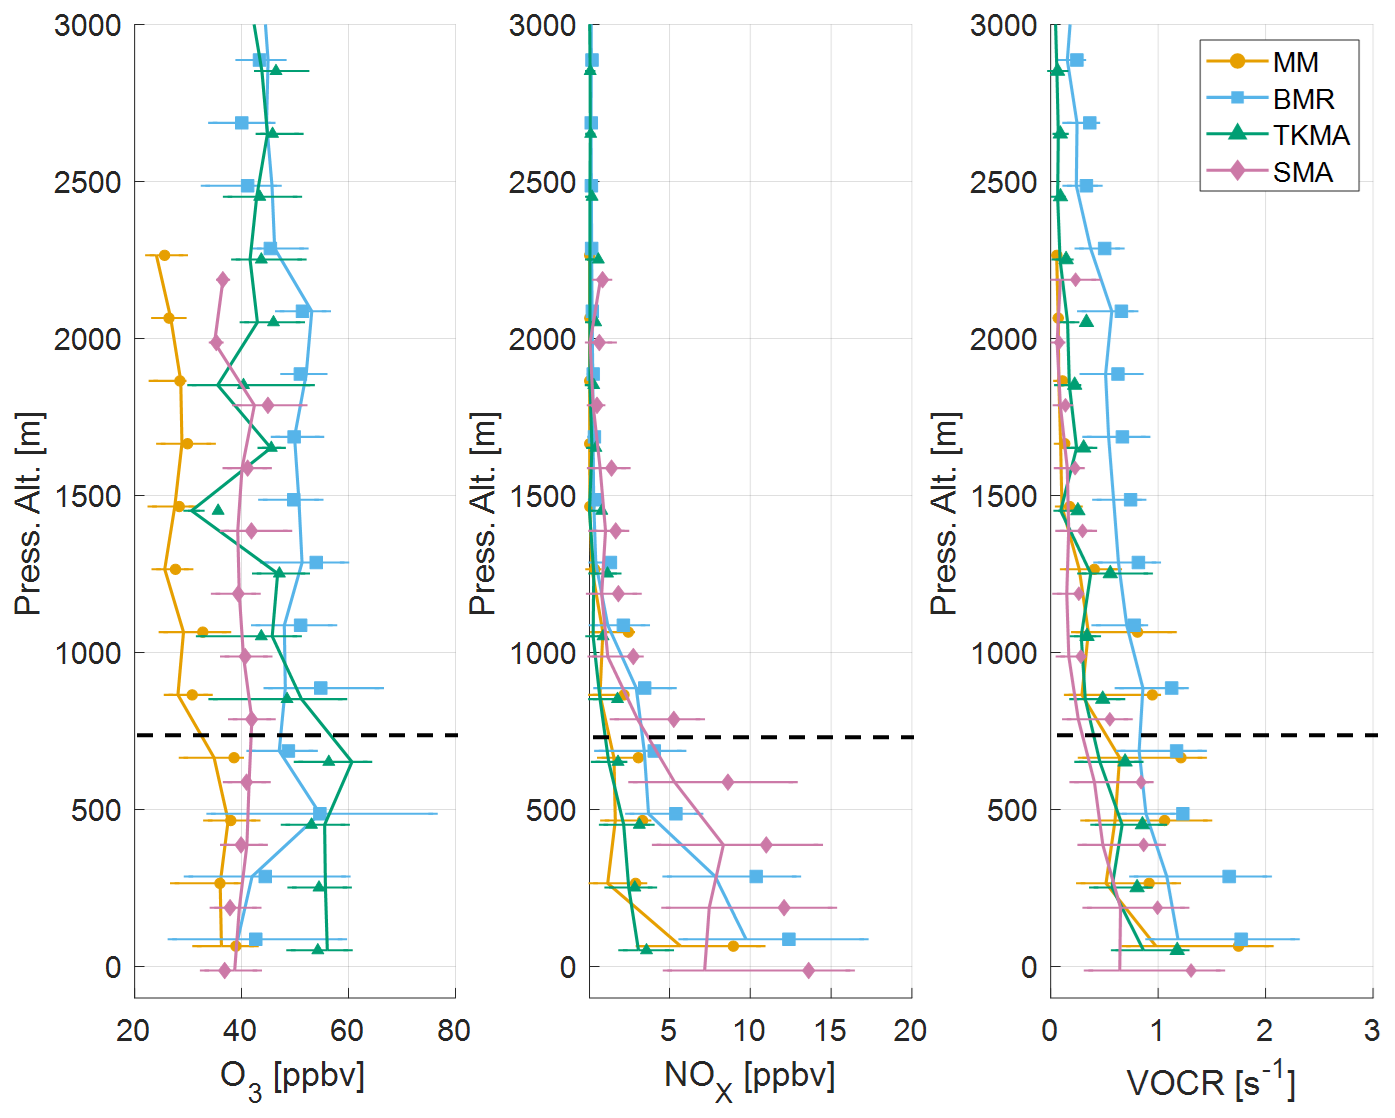
Figure 2Average vertical profiles of the mixing ratios of O3, NOx, and non-methane VOC reactivity (VOCR) observed over Asian megacities (MM: Metro Manila, BMR: Bangkok Metropolitan Region, TKMA: Tainan–Kaohsiung Metropolitan Area, SMA: Seoul Metropolitan Area) during ASIA-AQ. Markers indicate mean values, and vertical solid lines represent medians. Horizontal error bars denote the interquartile range (25th–75th percentiles). The black dashed line indicates the altitude cut-off (750 m); only data below this level were used in the analysis.
For gas-phase chemical reactions, the Master Chemical Mechanism (MCMv3.3.1; Jenkin et al., 2015), a near-explicit chemical mechanism widely used for atmospheric box modeling, was applied to represent VOC oxidation chemistry and its role in ozone formation. Processes not represented in the current gas-phase mechanism (e.g., heterogeneous radical uptake or updated halogen chemistry) may influence radical budgets under certain conditions and therefore represent a potential source of uncertainty.
To achieve a steady-state representation of radical species and other unmeasured compounds, the concentrations of these species were allowed to evolve over a 3 d period, using the diurnal steady-state mode. In this configuration, the measured photolysis frequencies were adjusted according to the evolving solar zenith angle every 20 min intervals. This approach yielded results within ±5 % of those obtained using the convergence mode, where simulations are continued until each species stabilizes within 1 % (Schroeder et al., 2020; Brune et al., 2022; Nault et al., 2024; Lee et al., 2026). In addition, the first-order physical loss lifetime for dilution is set to 12 h, similar to studies from the Korea-U.S. air quality (KORUS-AQ) field campaign using the DC-8 over South Korea (Brune et al., 2022; Nault et al., 2024).
For the calculation of POx, the model-estimated turnover rates of reactions contributing to the production or destruction of Ox are summed up from the model output following Eq. (1):
where k and α indicate the reaction rate coefficient and organic nitrate yield from MCMv3.3.1, respectively. φ is the fraction of O(1D) reacting with H2O. Effective NO2 loss due to PAN production subtracting the thermal dissociation of PAN (netPPAN) is also included in the calculation of POx.
For the construction of POx isopleths, the model was constrained over each megacity using precursor concentrations averaged within each flight track (typically spanning ∼ 1–2 h per track). A gridded parameter space was created by scaling the observed mean mixing ratios of NOx and total VOCs from 1 % to 300 %. Total VOCs were scaled linearly in 10 % increments, with all individual VOC species adjusted proportionally to preserve VOC speciation. NOx was scaled using a step size of 0.2 in log space, while maintaining a fixed NO NO2 ratio. Each NOx–VOC grid point was used as input to the box model to compute POx. The NOx–VOC grid enabled simulation of a wide range of conditions, reflecting both low and high precursor levels, while holding their speciation constant.
In addition to the isopleth simulations, a flight steady-state (FSS) configuration was implemented using the same chemical mechanism and constraint strategy described above (see Sect. S2 in the Supplement for details). Unlike the isopleth approach, which applies track-averaged precursor constraints to construct a gridded NOx–VOC scaling space, the FSS simulations were performed using time-resolved in situ observations along the aircraft track (1 min average). For each data point, the model was run to achieve steady state using the corresponding observed constraints to diagnose instantaneous POx along the flight track. This configuration enables evaluation of POx without applying precursor scaling or track-averaging, thereby providing a complementary perspective on how the 1–2 h averaging and scaling assumptions used in the isopleth framework influence the inferred POx values.
2.3 Isopleth projection and orthogonal distance calculation
To diagnose the sensitivity of POx to its precursors, we constructed POx isopleths as a function of NOx and total VOC mixing ratios using the box model setup described in Sect. 2.2. Each grid point in the two-dimensional NOx–VOC space was individually used as an input to the box model to calculate POx (Eq. 1). The resulting POx matrix was compiled into the two-dimensional surface, and contour plots of this surface were generated to produce isopleths (Sect. 3.2). The ridge of the POx surface was identified by locating the POx maxima along both NOx and VOC dimensions of the grid, and the resulting ridge points were fit using a least-squares linear regression to define the transition line. Observed data points were then overlaid onto this space to quantify their position relative to the transition line and associated POx sensitivity regimes.
For each observed data point at (x0, y0) in the isopleth, the shortest orthogonal distance to the transition line was calculated as follows:
where ax + by + c is the linear form of the transition line. Distances were defined as negative on the NOx-sensitive side and positive on the VOC-sensitive side. The absolute, unitless magnitude of |d| reflects the strength of the precursor sensitivity, with larger values indicating a more robust regime and smaller values indicating proximity to the transition.
3.1 Overview of vertical distributions and diurnal patterns
The comprehensive measurements collected during the ASIA-AQ campaign, including multiple missed-approaches over the studied megacities, provide a detailed view of the chemical conditions as a function of both altitude (Fig. 2) and time of day (Fig. 3).
Figure 2 illustrates the average vertical profiles of O3, NOx, and non-methane VOC reactivity (VOCR), the OH loss rate due to VOCs (see Sect. S1), observed over the four megacities, MM, BMR, TKMA, and SMA, during the entire campaign. In MM, O3 exhibits the lowest mixing ratios of the four locations at all altitudes, increasing from about 25 ppbv near 2 km to 39 ppbv close to the surface. BMR and TKMA show generally higher O3 in the range of 40–60 ppbv with a 1 min-averaged maximum of 91 and 72 ppbv, respectively. At lower altitudes (< 750 m), O3 mixing ratios at TKMA remain nearly constant at around 55 ppbv, whereas in BMR they decrease from about 55 to 42 ppbv due to O3 titration by NO. SMA shows comparatively uniform O3 mixing ratios of about 40 ppbv throughout the lower 3 km. The vertical distributions of NOx display a steep decline with altitude in all cities, indicative of dominant near-surface-level sources and rapid chemical processes. SMA and BMR exhibited high NOx mixing ratios at low altitudes (< 750 m), with averages of 9.2 and 7.5 ppbv, respectively, whereas MM and TKMA showed lower levels on average, at 4 and 2.6 ppbv, respectively. VOCR exhibits distinct characteristics specific to each city. Below 750 m, MM and BMR exhibited the highest VOCR values of the four cities, on average 1.3 and 1.4 s−1, respectively, followed by TKMA (1.0 s−1). SMA showed the lowest VOCR values, on average 0.8 s−1 below 750 m, likely attributed to reduced VOC emissions during the colder and low solar irradiance conditions, when lower biogenic VOC (BVOCs) emissions (Fig. S4) and limited VOC evaporation are expected.
Beyond the differences in VOCR levels, their compositions also varied among cities. Across the study domain, oxygenated VOCs (OVOCs), especially aldehydes and alcohols, were consistently dominant contributors to overall reactivity (Figs. S1–S4), due to both direct urban emissions (e.g., fuel use, solvents) and secondary formation from VOC oxidation, highlighting their importance in urban photochemistry. Isoprene made a notable contribution to VOCR, particularly in MM (15 %; Fig. S1). BMR and TKMA showed stronger contributions from OVOCs (62 % and 66 %, respectively; Figs. S2 and S3), mainly driven by HCHO and acetaldehyde. In SMA (Fig. S4), VOCR is distinguished by enhanced contributions from alcohols (26 %) and elevated alkenes (15 %) and aromatics (16 %), while aldehydes contribute less than in the other cities.
Figure 3 shows the diurnal variations of mixing ratios of O3, NO, NOx, and total VOC along with VOCR below 750 m. In the BMR panel, the two open symbols indicate data collected during low altitude legs (450–750 m) rather than near-surface missed approaches (50–750 m) as for all the other points. While these measurements are included for completeness, the higher altitude sampling may not fully represent conditions near the surface and is thus marked differently to distinguish them from the other data points. As noted in Sect. 2.2, measurements in TKMA were obtained with a limited local-time window of approximately 11:00–14:30 local time (LT).
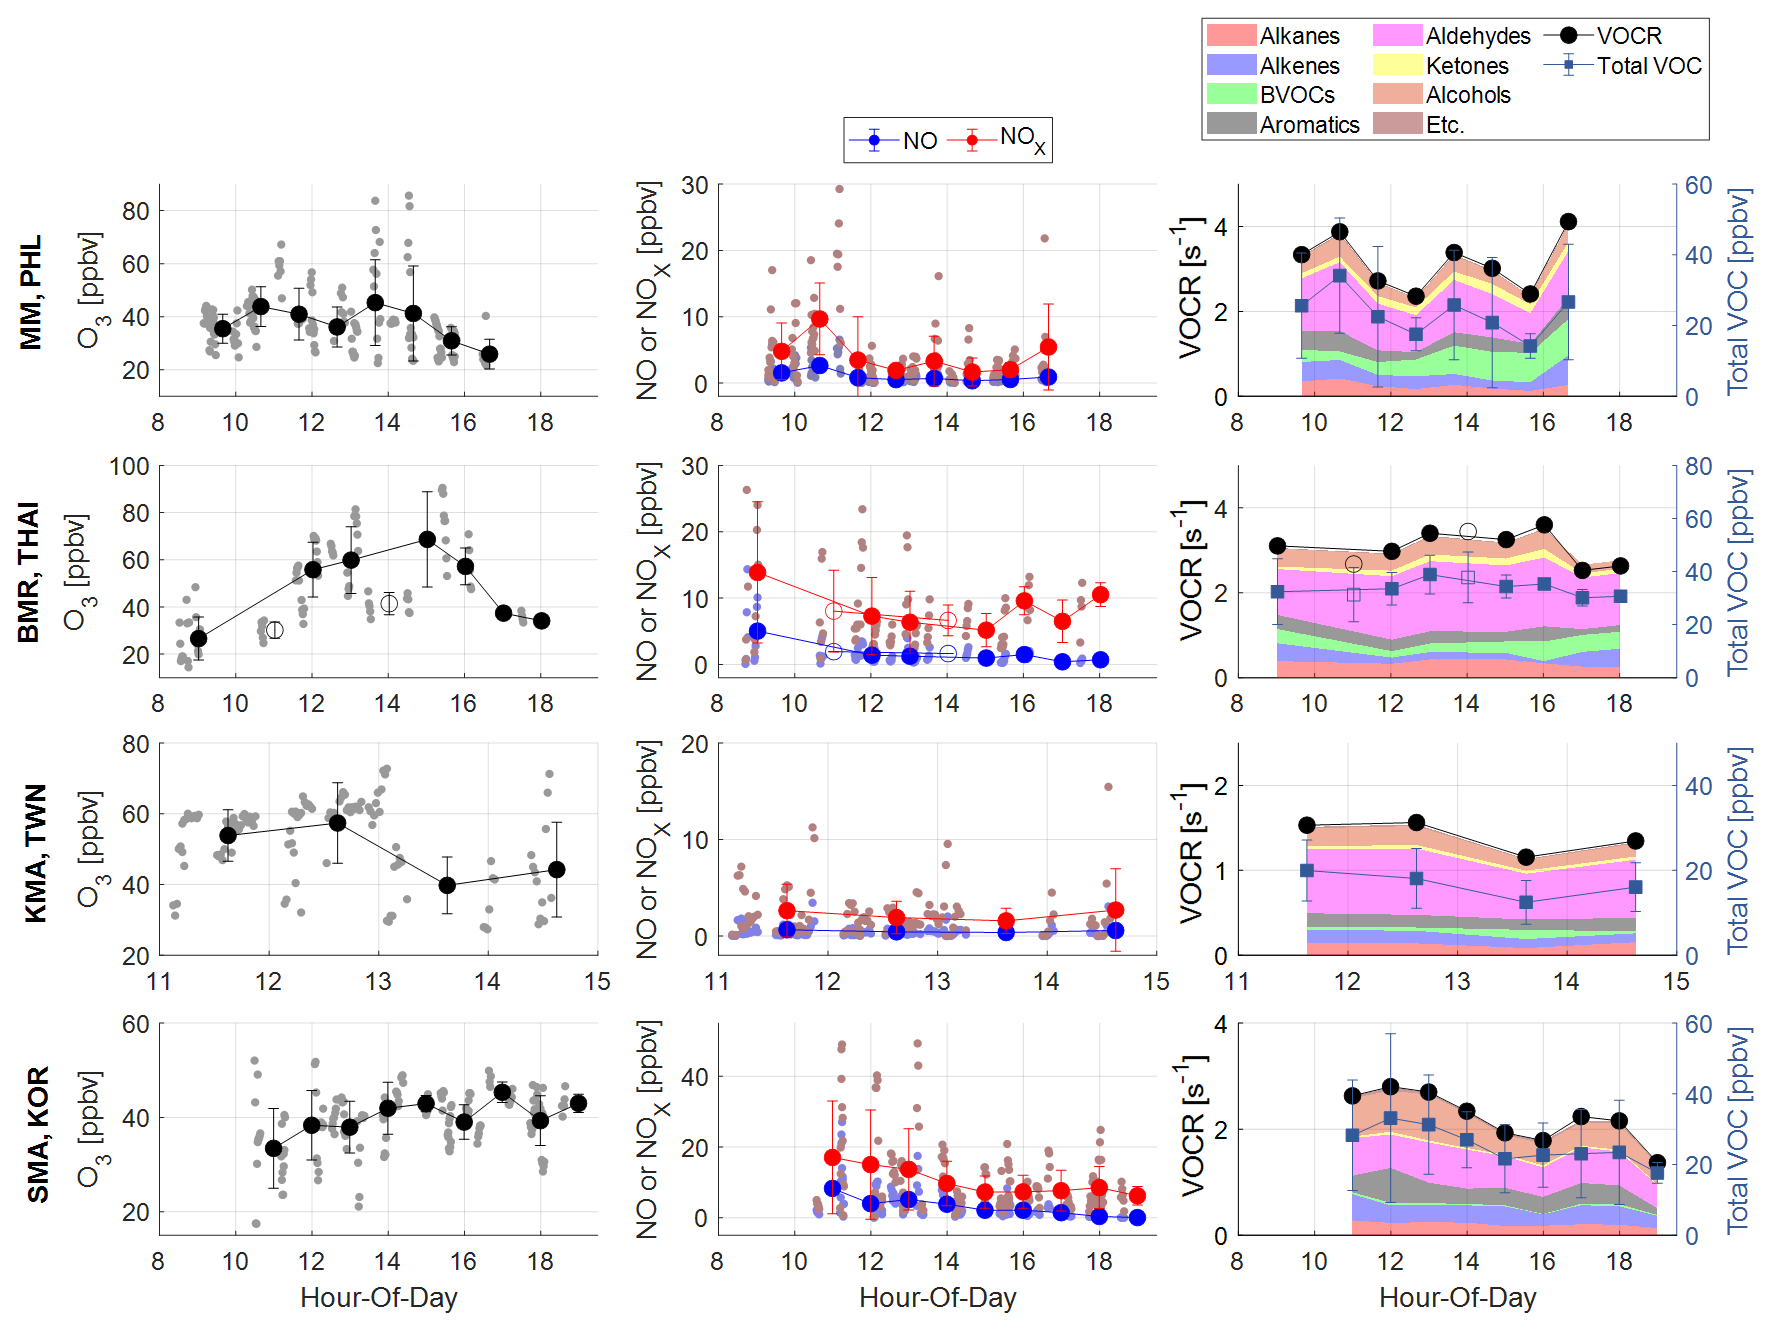
Figure 3Mean diurnal patterns of the mixing ratios of O3, NO, NOx, VOCs, and non-methane VOC reactivity (VOCR) near the surface (< 750 m) in Asian megacities. Pale-colored dots represent 1 min averaged observations. Colored dots and error bars denote hourly averages and standard deviations. Stacked colored areas indicate the contributions of different VOC classes to VOCR. The open circles in the BMR panel indicate data that were sampled at relatively high altitudes. All times are local time (LT).
The amplitude of the diurnal NOx and O3 cycle varies across cities. A distinct afternoon enhancement of O3 is most pronounced in the BMR (13:00–16:00 LT), where it is likely facilitated by efficient O3 formation from the oxidation of elevated VOC and NOx levels. In contrast, the other cities show weaker diurnal variations. In MM, BMR, and SMA, NOx mixing ratios were higher during the morning rush hours, decreased through midday, and increased again toward the afternoon rush hour, while NO exhibited a clearer morning maximum. In contrast, in TKMA, NOx levels remained consistently low (< 3 ppbv on average) throughout the limited sampling window. This limitation and its implications for POx sensitivity are further discussed in Sect. 4.1.1.
Within each city, the diurnal pattern of total VOC mixing ratios is similar to that of VOCR. This noteworthy relationship supports using total VOC as a practical proxy for reactivity in subsequent analyses (Sect. 3.2). As mentioned above, in all cities, overall VOCR is dominated by low carbon (< C3) aldehydes and alcohols, throughout the day (Figs. S1–S4). In MM, both total VOC mixing ratios and VOCR exhibit three distinct peaks: during the morning rush hour (10:00–11:00 LT), early afternoon (13:00–15:00 LT), and late-afternoon rush hour (after 16:00 LT), where these enhancements were associated with different source contributions. The morning peak is primarily driven by anthropogenic VOCs (AVOCs) such as alkanes, aromatics, and alkenes, the early-afternoon peak is associated with enhanced biogenic contributions, mainly isoprene (Fig. S1), and the late-afternoon peak reflects contributions from both anthropogenic and biogenic VOCs. In BMR, total VOC mixing ratios and VOCR are relatively steady but show a modest afternoon enhancement driven by aldehydes. In contrast, TKMA exhibits overall lower total VOC mixing ratios and VOCR than other tropical Asian cities during the observed time window. Lastly, in SMA, VOCR showed distinct peaks around noon (12:00 LT) and near sunset (after 17:00 LT) coincided with enhancements of alkene and aromatic levels.
3.2 Ozone production sensitivities in megacities
To investigate the sensitivity of O3 formation to precursor levels, we generated isopleths of the POx as a function of NOx and total VOC mixing ratios as described in Sect. 2.3. Figures 4a, 5a, 6a, and 7a show the model-generated POx isopleths (background) with overlaid observations (red dots). The dashed black line marks the transition line between two regimes. In the NOx-sensitive regime (left side of the transition line), increasing NOx leads to a sharp increase in Ox production, while in the VOC-sensitive regime (right side of the transition line), Ox production becomes limited by the availability of radicals, which are produced from the oxidation of reactive VOCs.
In the following sections (Sect. 3.2.1–3.2.4), for the general isopleth representation of POx sensitivity to the VOCs and NOx levels in each city (Figs. 4a, 5a, 6a, and 7a), we used observations below 750 m across flights, regardless of flight date and time of day, and constrained the model using the values of chemical and meteorological parameters, averaged over all the flights at a given location. While the averaged isopleths cannot capture the instantaneous POx sensitivity to precursors, they provide a more generalized view of chemical regimes that is useful for broader interpretation and policy discussions. However, this averaging process may introduce biases in precise POx estimations and therefore their sensitivities to precursors, as it smooths out variations caused by diurnal changes and differences in meteorological conditions between research flights and time of day. To assess the potential bias from this large-scale averaging, we conducted additional model runs using data averaged within each flight track for each research flight (typically spanning ∼ 1–2 h per track; Sect. S3). Because each flight track was repeated two to three times per day, we categorized the model simulations into distinct time periods: morning and afternoon for BMR and TKMA, and morning, noon, and afternoon for MM and SMA. Given the large number of resulting isopleths, the individual figures are provided in the Supplement (Sect. S3). Although we primarily utilize the representative isopleths shown in Figs. 4a, 5a, 6a, and 7a for general visualization and interpretation in the following sections, it is important to note that all chemical sensitivity identifications (Table 1) and orthogonal distance-based calculations using Eq. (2) (Figs. 4b, 5b, 6b, and 7b) are based on the time- and flight-specific model outputs shown in Figs. S7–S10.
In addition, as noted in Sect. 2.2, the representativeness of this isopleth-based POx estimation was further evaluated by comparison with POx simulated from the FSS box model (Sects. 2.2 and Sect. S2). The two approaches showed generally good agreement across regions, indicating that the key features of the inferred POx sensitivity are not strongly affected by the 1–2 h temporal averaging used in the isopleth framework (Fig. S5). Using the FSS box model results, the contributions of each Ox production or destruction term in Eq. (1) were computed and are shown in Fig. S6. City-specific POx budget features are discussed in Sect. 3.2.
3.2.1 Ozone production sensitivity in Metro Manila
Figure 4a presents the POx isopleth, generated using averaged observations below 750 m in MM. The simulated POx ranges up to 45 ppbv h−1, with regions of the highest POx (e.g., > 40 ppbv h−1) occurring under high NOx (> 15 ppbv) and high VOC conditions (> 70 ppbv). Individual isopleths in Fig. S7 illustrate how the shape and gradient of the isopleths vary across different research flights and flight tracks at different times of day. The absolute levels of precursors and POx vary between flights, and the isopleth shapes and transition lines likewise exhibit clear diurnal changes among morning, noon, and afternoon flight tracks (Figs. S7 and S11). Morning isopleths (Track 1 in Fig. S7) generally show broader VOC-sensitive regions and steeper POx transition line slopes (Fig. S11), driven by elevated NOx levels and fresh anthropogenic VOC emissions (Fig. 3). In noon and afternoon tracks (Tracks 2 and 3 in Fig. S7), the transition-line slopes become progressively smaller (Fig. S11) under lower NOx but sustained VOCR with an increasing biogenic (isoprene) influence (Figs. 3 and S1).
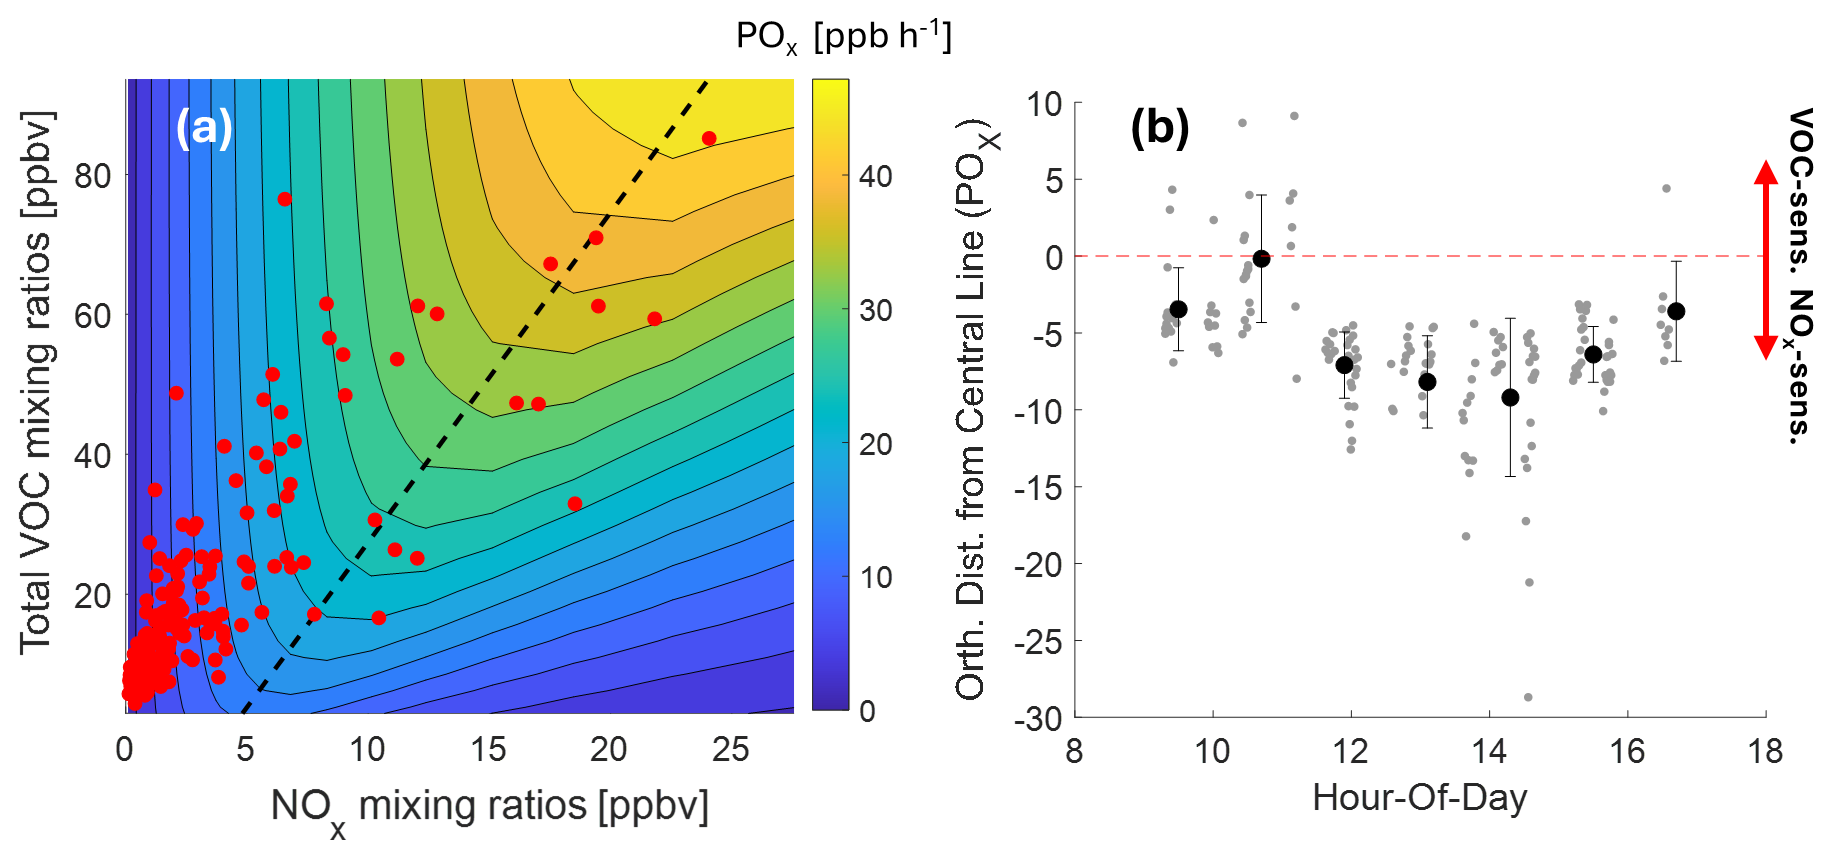
Figure 4(a) Colored isopleth of ozone production rate (POx) as functions of NOx and VOC mixing ratios in Metro Manila (MM), Philippines. The dashed lines denote the transition between NOx-sensitive (left area of the transition) and VOC-sensitive (right area of the transition) regimes. Red dots indicate the observed data points (1 min average) sampled below 750 m. (b) Diurnal variation of the orthogonal distance of observation from the POx transition line (negative values: NOx-sensitive; positive values: VOC-sensitive). The red dashed lines denote the transition line. Grey dots indicate individual data points (1 min average), and black dots and error bars represent the hourly mean values and standard deviations, respectively. All times are local time (LT).
As summarized in Table 1, 93 % of the observed data points fall within the NOx-sensitive regime, contributing 79 % of total POx, where the POx contribution is defined as the sum of POx values over all NOx-sensitive points divided by the sum over all observations. Even among the highest POx-producing conditions (upper 50 % in the POx distribution), the NOx-sensitive regime remains dominant, with 85 % of the data points contributing 74 % of total POx, but these proportions are lower than those for the full dataset. This shift suggests that although data points in the VOC-sensitive condition are relatively few (7 %), they tend to be associated with higher POx. These VOC-sensitive points are clustered in the morning (∼ 11:00 LT; Figs. 4b and S7, Track 1), when POx levels are highest (Fig. S6a). It is important to note that all numbers in Table 1 are derived from individual isopleths generated for different flights and tracks (Fig. S7), rather than from the composite isopleths shown in Fig. 4a to ensure a more precise representation of varying atmospheric conditions throughout different flights and times of day. As a result, there are some discrepancies between Table 1 and Fig. 4a. For example, Fig. 4a shows fewer VOC-sensitive data points (5 % of all data points), whereas Table 1 indicates that slightly more observed data points (7 %) fall within the VOC-sensitive regime.
Table 1Fractions of NOx-sensitive and VOC-sensitive regimes for POx in each megacity.
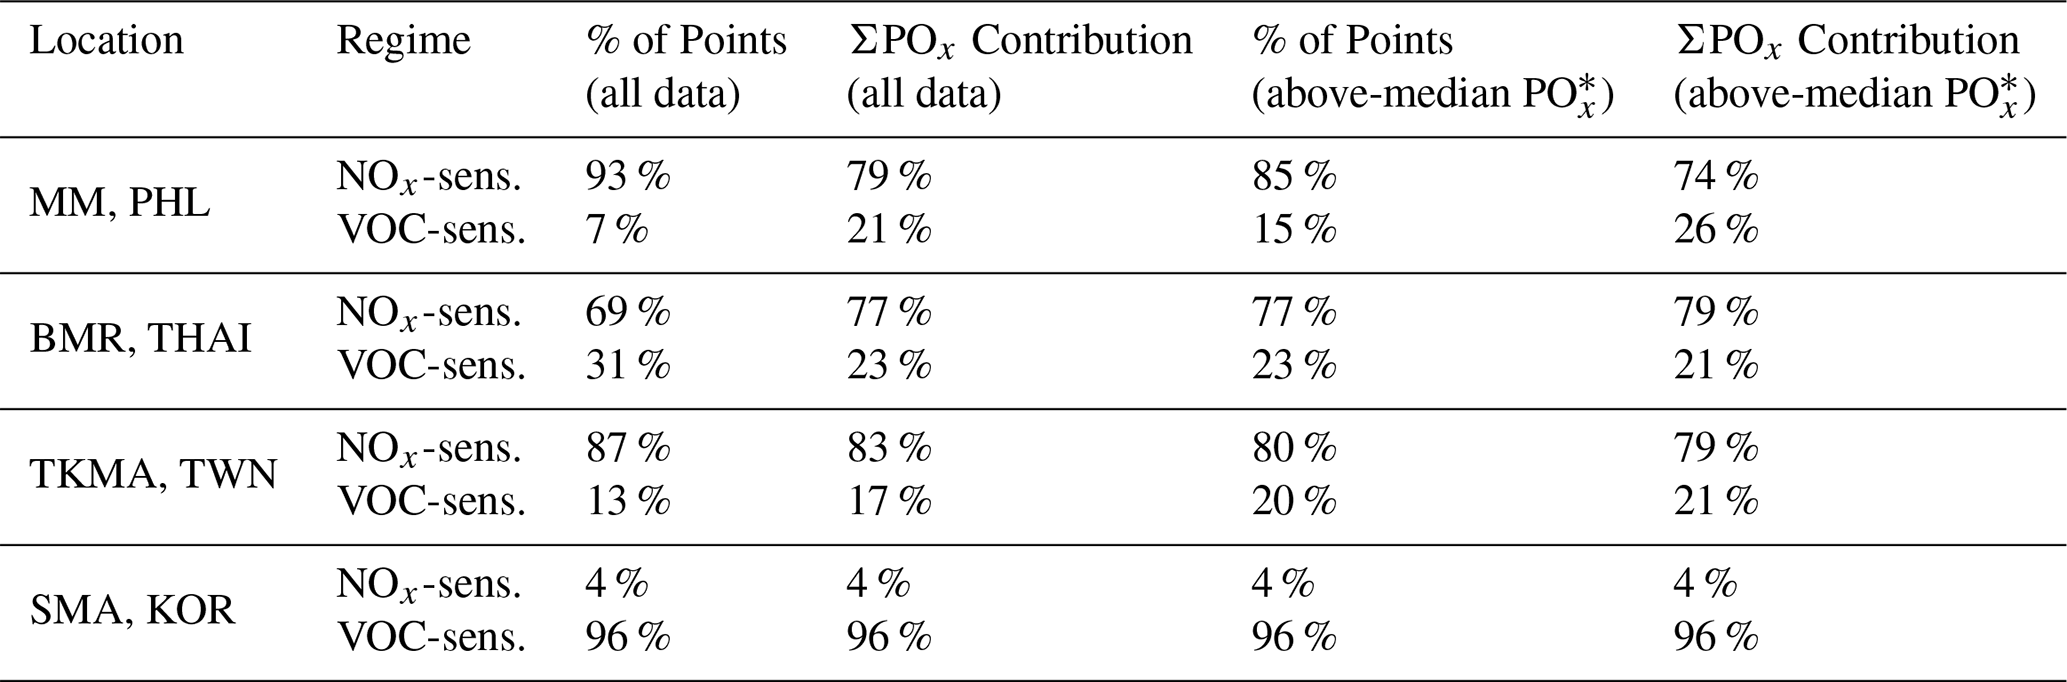
* Above-median POx refers to POx values greater than the median of the observed data points (shown as dots in the isopleth figures) for each region.
Figure 4b presents the diurnal variation of the orthogonal distance calculated using Eq. (2). While most observations remain in the NOx-sensitive regime (negative distances), some exhibit smaller negative distances or even fall into the VOC-sensitive regime (positive distances) in the morning (∼ 10:00–12:00 LT) and late afternoon (after 14:30 LT). This is most likely associated with high NOx levels (Fig. 3) from traffic and urban sources during rush hour, temporarily shifting the chemical environment toward the transition boundary. As the day progresses and photochemical activity increases, ozone production shifts further into the NOx-sensitive regime, with distances becoming more negative toward the afternoon. Near sunset, the distances shift slightly toward the transition, likely due to the evening rush hour emissions introducing additional NOx.
3.2.2 Ozone production sensitivity in Bangkok Metropolitan Region
Figure 5a presents the generalized POx isopleth for BMR where simulated POx ranges up to 25 ppbv h−1. Regions of the highest POx (e.g., > 20 ppbv h−1) occur under moderate-to-high NOx (7–18 ppbv) and moderate-to-high VOC mixing ratios (> 40 ppbv). As summarized in Table 1, BMR exhibits a more evenly distributed chemical regime compared to MM, with a notable fraction of data points falling in both NOx-sensitive (69 %) and VOC-sensitive regimes (31 %). NOx-sensitive and VOC-sensitive data points contribute to 77 % and 23 % of total POx, respectively. However, among the highest POx-producing conditions (upper 50 % in the POx distribution), NOx-sensitive data points are even more dominant (77 % of the data points), accounting for 79 % of total POx. Consistent with this, the diurnal pattern of POx (Fig. S6b) shows an increasing trend from morning to late afternoon and peaking around 16:00 LT, when NOx-sensitive conditions dominate (Fig. 5b). This suggests that while VOC-sensitive conditions are not negligible, ozone production in BMR is primarily limited by NOx availability, particularly during peak photochemical periods.
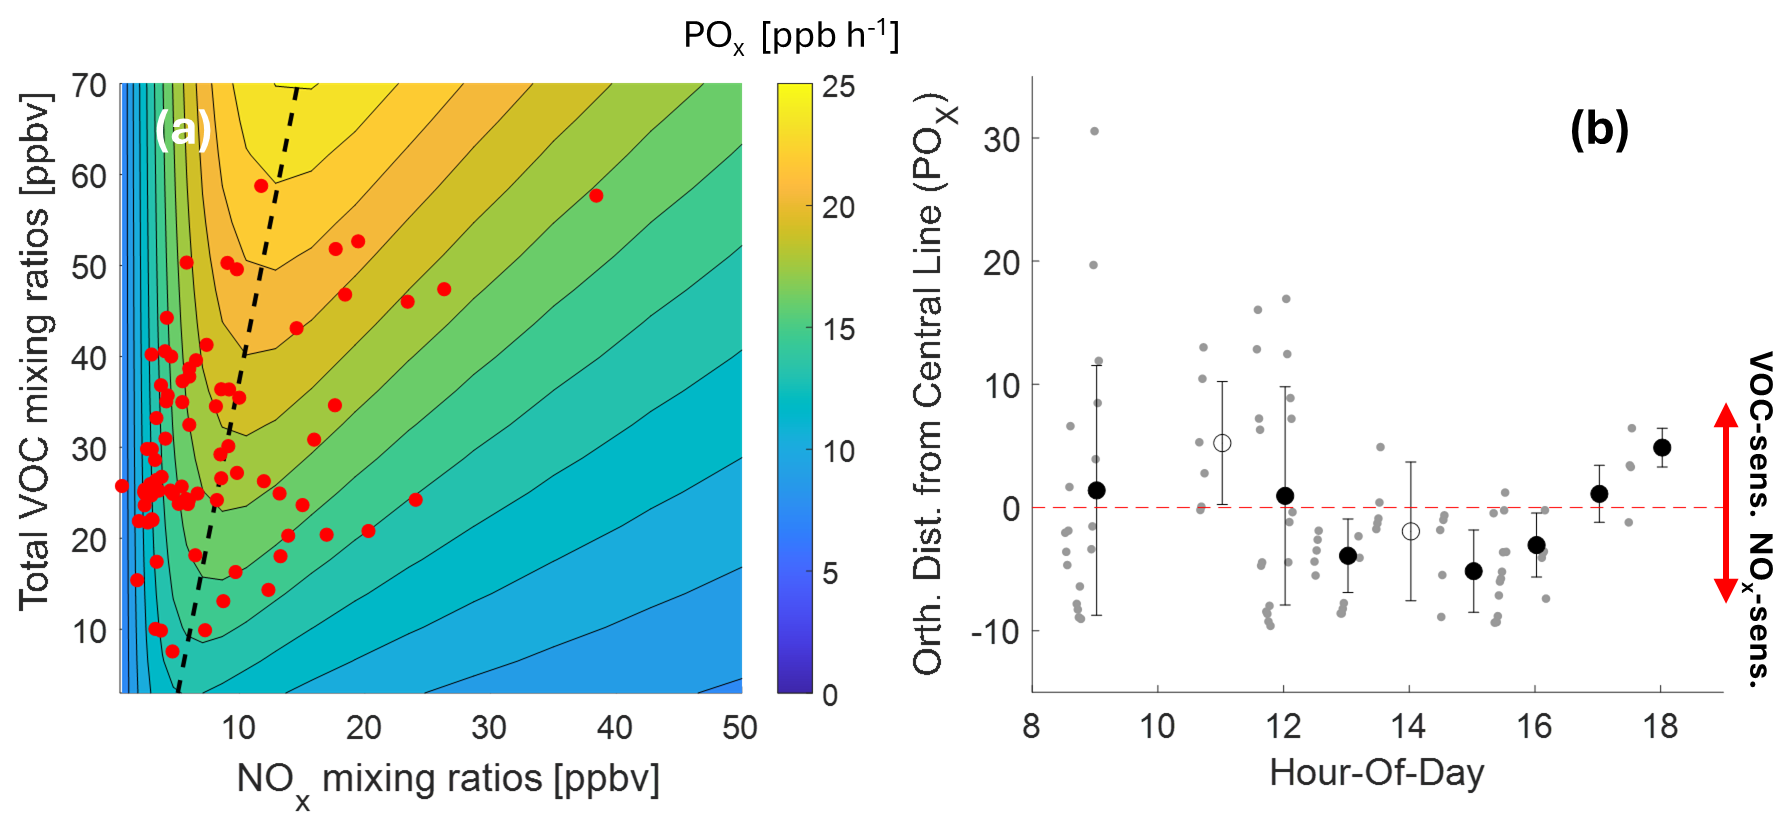
Figure 5(a) Colored isopleth of ozone production rate (POx) as functions of NOx and VOC mixing ratios in the Bangkok Metropolitan Region (BMR), Thailand. The dashed lines denote the transition between NOx-sensitive (left area of the transition) and VOC-sensitive (right area of the transition) regimes. Red dots indicate the observed data points (1 min average) sampled below 750 m. (b) Diurnal variation of the orthogonal distance of observation from the POx transition line (negative values: NOx-sensitive; positive values: VOC-sensitive). The red dashed lines denote the transition line. Grey dots indicate individual data points (1 min average), and black dots and error bars represent the hourly mean values and standard deviations, respectively. The open circles at 11:00 and 14:00 LT indicates the data were sampled at relatively high altitude. All times are local time (LT).
Compared to MM, BMR shows relatively less variability in POx levels (Fig. S8) and transition-line slopes (Fig. S11) across both flight days and tracks. In Track 1 (09:00–13:00 LT, Fig. S8), all flights exhibit similarly shaped isopleths, with the NOx levels at which POx is maximized and ridge lines appearing in comparable positions, though RF13 and RF15 (defined in Table S1) show higher POx values under comparable NOx and VOC levels. In Track 2 (13:00–18:00 LT, Fig. S8), the isopleths maintain consistent curvature with slightly reduced POx levels.
To examine diurnal variations in POx sensitivity, Fig. 5b illustrates the orthogonal distance of observed data points from the transition line within the POx isopleths. The diurnal pattern shows a clear transition from VOC sensitive conditions in the morning to NOx sensitive conditions later in the day, likely driven by high NOx levels from rush hour emissions (Fig. 3). Decreasing NOx and increasing VOC levels in the afternoon result in the shift into the NOx-sensitive regime. As mentioned in Sect. 3.1, a brief increase in the distance is observed around 11:00 and 14:00 LT (open circles). These are based on observations sampled at relatively higher altitudes with slightly different chemical conditions aloft than near-surface observations.
3.2.3 Ozone production sensitivity in Tainan–Kaohsiung Metropolitan Area
Figure 6a shows the averaged POx isopleth for TKMA, showing the simulated POx ranges up to 20 ppbv h−1. Regions of the highest POx values (> 15 ppbv h−1) occur at low-to-moderate NOx (4–10 ppbv) and moderate-to-high VOC mixing ratios (> 40 ppbv). TKMA exhibits a predominantly NOx-sensitive regime, with 87 % of total data points falling within this condition, contributing 83 % of total POx (Table 1). However, similar to MM (Table 1 and Sect. 3.2.1), on the upper 50 % POx values, NOx-sensitive points are less dominant (80 % of data points, contributing 79 % of total POx), and points in the VOC-sensitive regime becomes significant, contributing 21 % of total POx. As noted in Sect. 3.1, Table 1 does not include any early morning (∼ 11:00 LT) and late afternoon (17:00–18:00 LT) data due to the constraints of the transit flights. Given that early morning and late afternoon points tend to be more VOC-sensitive due to high NOx emissions from rush hour traffic, as observed in MM (Fig. 4b) and BMR (Fig. 5b), the actual VOC-sensitive contribution to POx in TKMA may be underestimated by the values reported in Table 1.
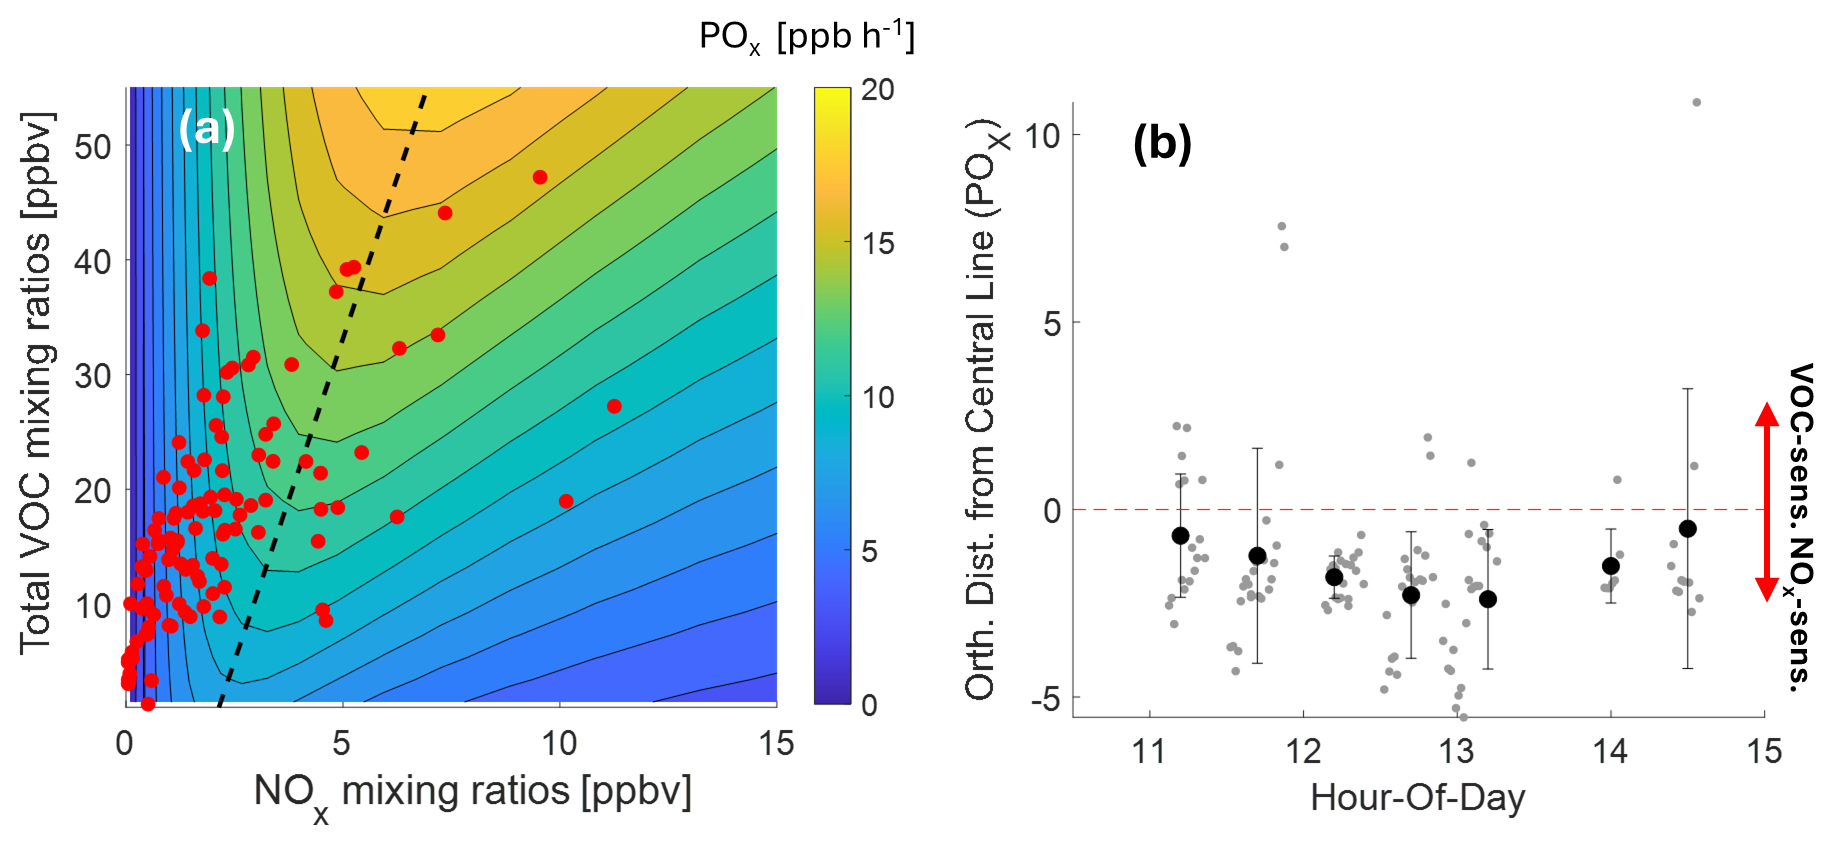
Figure 6(a) Colored isopleth of ozone production rate (POx) as functions of NOx and VOC mixing ratios in the Tainan–Kaohsiung Metropolitan Area (KMA), Taiwan. The dashed lines denote the transition between NOx-sensitive (left area of the transition) and VOC-sensitive (right area of the transition) regimes. Red dots indicate the observed data points (1 min average) sampled below 750 m. (b) Diurnal variation of the orthogonal distance of observation from the POx transition line (negative values: NOx-sensitive; positive values: VOC-sensitive). The red dashed lines denote the transition line. Grey dots indicate individual data points (1 min average), and black dots and error bars represent the hourly mean values and standard deviations, respectively. All times are local time (LT).
The individual POx isopleths for TKMA (Fig. S9) exhibit quite consistent contour shapes and transition-line slopes within each individual flight (Fig. S11), while the absolute POx levels vary significantly between flights, with RF16 showing notably higher production rates than RF05 and RF11. This pronounced variability in POx magnitude is likely driven by large day-to-day differences in meteorological and photochemical conditions associated with the sparse flight dates in TKMA (Sect. 3.1).
Figure 6b illustrates the diurnal variations (11:00–15:00 LT) of the POx based on orthogonal distances of observed data points from the transition line. As noted above, TKMA illustrates less pronounced diurnal variations in POx sensitivity compared to MM and BMR due to the limited flight sampling times without early morning data. Although most data points fall on the NOx-sensitive side, the distances tend to decrease from morning to afternoon, consistent with the patterns observed in MM (Fig. 4b) and BMR (Fig. 5b).
3.2.4 Ozone production sensitivity in Seoul Metropolitan Area
As mentioned above, the Seoul Metropolitan Area (SMA) deployment during the ASIA-AQ campaign was under low-temperature and limited solar radiation, in contrast to the tropical and subtropical Asian cities (MM, BMR, and TKMA), resulting in reduced reaction rates (Fig. S6d).
Figure 7a presents the generalized isopleths of POx for SMA. The simulated POx ranges from near zero to 6 ppbv h−1, which is notably lower than those found in other cities. A distinct feature of the SMA isopleths is that the transition line is highly inclined toward the VOC axis, implyng a generally stronger VOC dependence compared to NOx. The background isopleth shows that regions of highest POx occur at low NOx levels below 5 ppbv and high VOC conditions (> 65 ppbv), with ozone production rapidly declining as NOx increases. The observed data shows that overall POx levels were below 2 ppbv h−1 and most of them are in VOC-sensitive regime, with 96 % of all data points falling in the VOC-sensitive zone, contributing 96 % of total POx (Table 1).
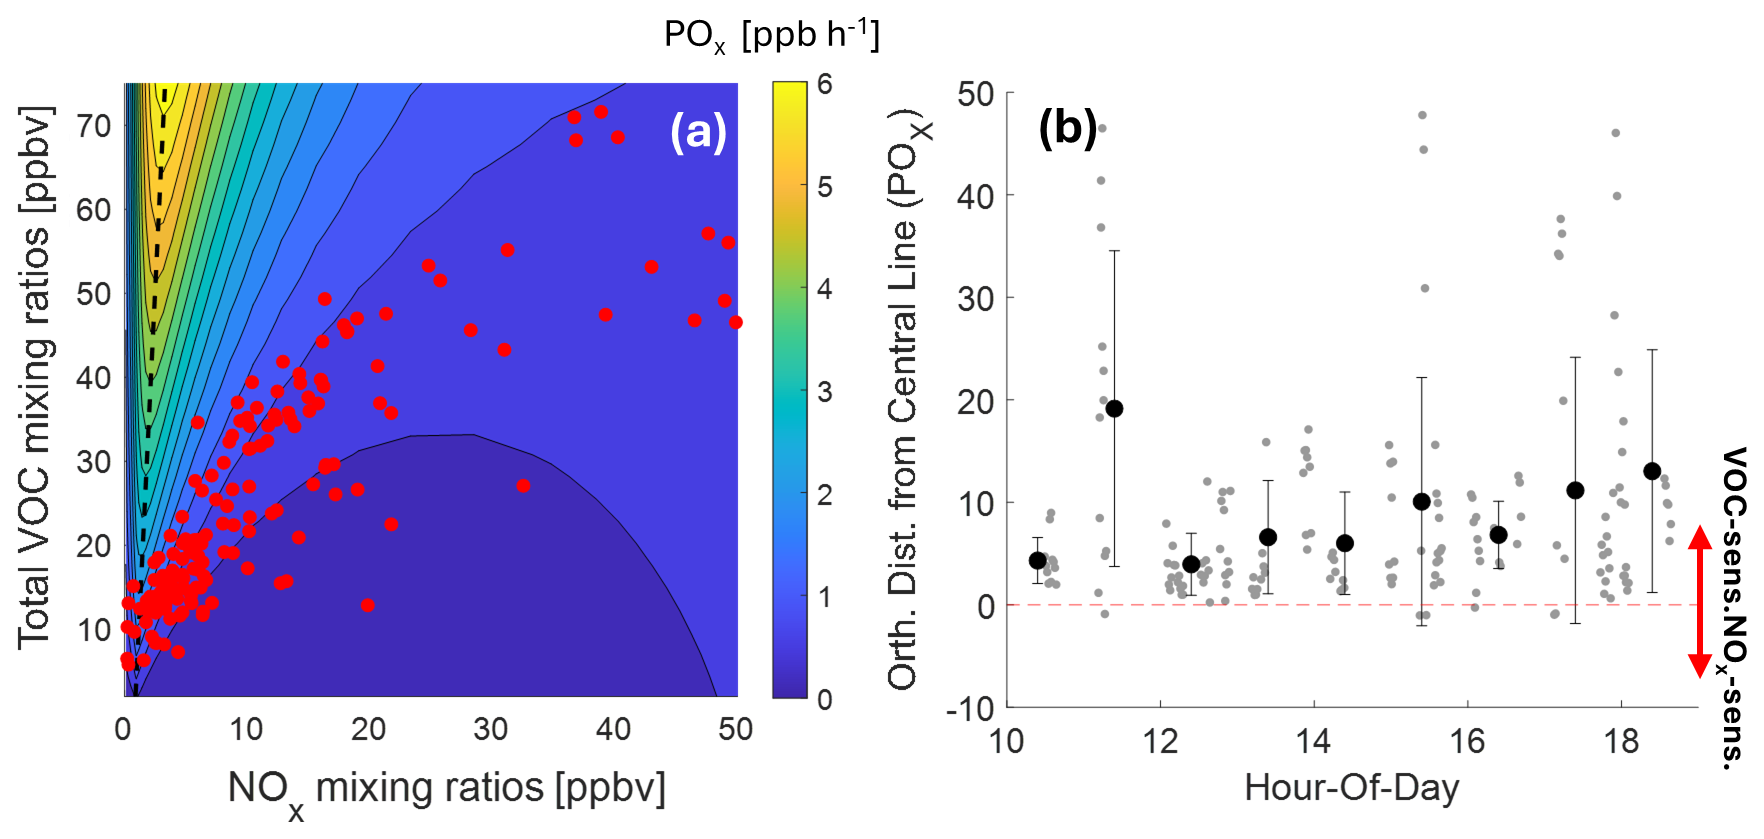
Figure 7(a) Colored isopleth of ozone production rate (POx) as functions of NOx and VOC mixing ratios in Seoul Metropolitan Area (SMA), South Korea. The dashed lines denote the transition between NOx-sensitive (left area of the transition) and VOC-sensitive (right area of the transition) regimes. Red dots indicate the observed data points (1 min average) sampled below 750 m. (b) Diurnal variation of the orthogonal distance of observation from the POx transition line (negative values: NOx-sensitive; positive values: VOC-sensitive). The red dashed lines denote the transition line. Grey dots indicate individual data points (1 min average), and black dots and error bars represent the hourly mean values and standard deviations, respectively. All times are local time (LT).
Consistent with the general isopleth, the individual POx isopleths for SMA (Fig. S10) exhibit highly inclined ridgelines and transition lines across all flights and tracks in SMA, with slopes more than twice those in other cities (Fig. S11). Notably, the absolute POx production rates are substantially lower than those observed in the other megacities, with most observations remaining under the contours below 2 ppbv h−1 except for RF06 and further decreasing as the day progresses. In Track 3 (15:00–18:00 LT, Fig. S10), POx levels decline even more markedly, likely due to diminished photochemical activity and precursor availability during the late winter afternoon.
Correspondingly, the orthogonal distances in Fig. 7b show consistently large positive values, indicating that most observations remained well within the VOC-sensitive regime regardless of time. While there is some hour-to-hour variability, no clear diurnal trend or regime transition is observed, unlike in the more dynamic tropical cities.
3.2.5 Comparative overview of POx isopleths across cities and times of day
Across the four megacities, the POx isopleths differ systematically, as reflected in differences in transition-line slopes (Fig. S11), the background isopleth patterns (Figs. 4a–7a and S7–S10), and the distributions of observed data points (Figs. 4b–7b).
The slopes of the transition line calculated from the POx isopleths range from approximately 3 to 40 across the four cities. MM shows the shallowest transition line (slope = 4.71, Fig. S11), followed by progressively steeper slopes in BMR (7.01) and TKMA (11.24). SMA exhibits a substantially steeper transition line (30.27), indicating a markedly different background isopleth geometry under colder conditions. In addition, a clear diurnal variation in the individual isopleths is evident primarily in MM, with larger transition slopes during morning tracks and decrease toward afternoon tracks. In contrast, BMR and TKMA show relatively minor diurnal changes within individual flights (except for RF12 Track 2), with transition-line slopes remaining broadly consistent across tracks. SMA shows no systematic diurnal pattern in the transition-line slopes.
The distributions of the observed data points further highlight differences in how each city samples on its isopleths. In MM, the morning tracks exhibit a relatively broad spread of observed points across the NOx–VOC space, whereas observations during later tracks become more concentrated and are largely confined to a narrow NOx range, predominantly below 5 ppbv, on the NOx-sensitive side of the transition line. In contrast, BMR and TKMA show a more dispersed distribution of observed points across the NOx–VOC space, spanning a wider range of precursor conditions relative to the transition line. In SMA, the observed points also appear widely distributed in NOx–VOC space. However, because of the substantially steeper transition line, nearly all observations fall on the VOC-sensitive side of the isopleths despite this apparent spread.
4.1 Ozone reduction strategies
As described in Sect. 3.2, the analysis of ozone production rates reveals distinct precursor sensitivity regimes across the four studied megacities, emphasizing the need for location-specific precursor control strategies. In this section, we discuss the effectiveness of NOx and VOC reductions in mitigating ozone formation depending on NOx or VOC reduction scenario across the four megacities (Fig. 8). It should be noted that the analysis diagnoses local photochemical ozone production across the NOx–VOC precursor space. Transport processes such as regional advection or vertical mixing may influence the observed ozone mixing ratios but are not explicitly represented in this study.
To evaluate the sensitivity of total POx reduction to NOx or VOC reductions, we used the individual POx isopleths from each city (Sect. S3). For each isopleth, we first computed the baseline total POx by summing POx values at all observed data point locations in the isopleth. We then applied hypothetical reductions of NOx or VOC levels from 0 % to 50 %, adjusting the location of each data point accordingly along the relevant axis (NOx or VOC). At each reduction level, the total POx was recalculated for each reduction scenario by summing the POx value at the shifted positions. The resulting curves (Fig. 8) show the percentage change in total POx as a function of precursor reduction. Here, positive percentage changes indicate that POx decreases relative to the baseline, whereas negative percentage changes indicate that POx increases, reflecting a counterproductive response to the applied precursor reduction.
4.1.1 Ozone reduction strategies in MM and TKMA
MM and TKMA exhibit a predominantly NOx-sensitive ozone formation regime with 93 % and 87 % of the observed data, respectively (Table 1). This NOx-sensitive dominance in MM and TKMA is further supported by Fig. 8a and c, where POx reduction shows a stronger response to NOx reductions than to VOC reductions with slightly steeper slopes of NOx- and VOC-response curves in MM than in TKMA. A 20 % reduction in NOx levels would result in 9 % and 7 % decreases in POx in MM and TKMA, respectively. However, the impact of VOC reductions would not be negligible. As shown in Table 1, under high-O3-producing conditions, the contribution of VOC-sensitive points increases to 26 % in MM and 21 % in TKMA. Particularly in MM, the morning POx maximum aligns with relatively frequent VOC-sensitive conditions (Figs. 4, S6a, and S7) and enhanced contributions from anthropogenic alkanes, alkenes, and aromatics (Fig. 3). This indicates that VOC controls targeting morning anthropogenic VOC emissions could be especially effective in reducing peak ozone production. The reduction of VOCs would result in approximately half the POx decrease compared to NOx reduction in both MM and TKMA (Fig. 8a and c). Given these findings, a combined NOx and VOC control strategy would be the most effective approach for O3 mitigation in MM and TKMA, with priority given to NOx reductions due to their dominant influence on POx formation.
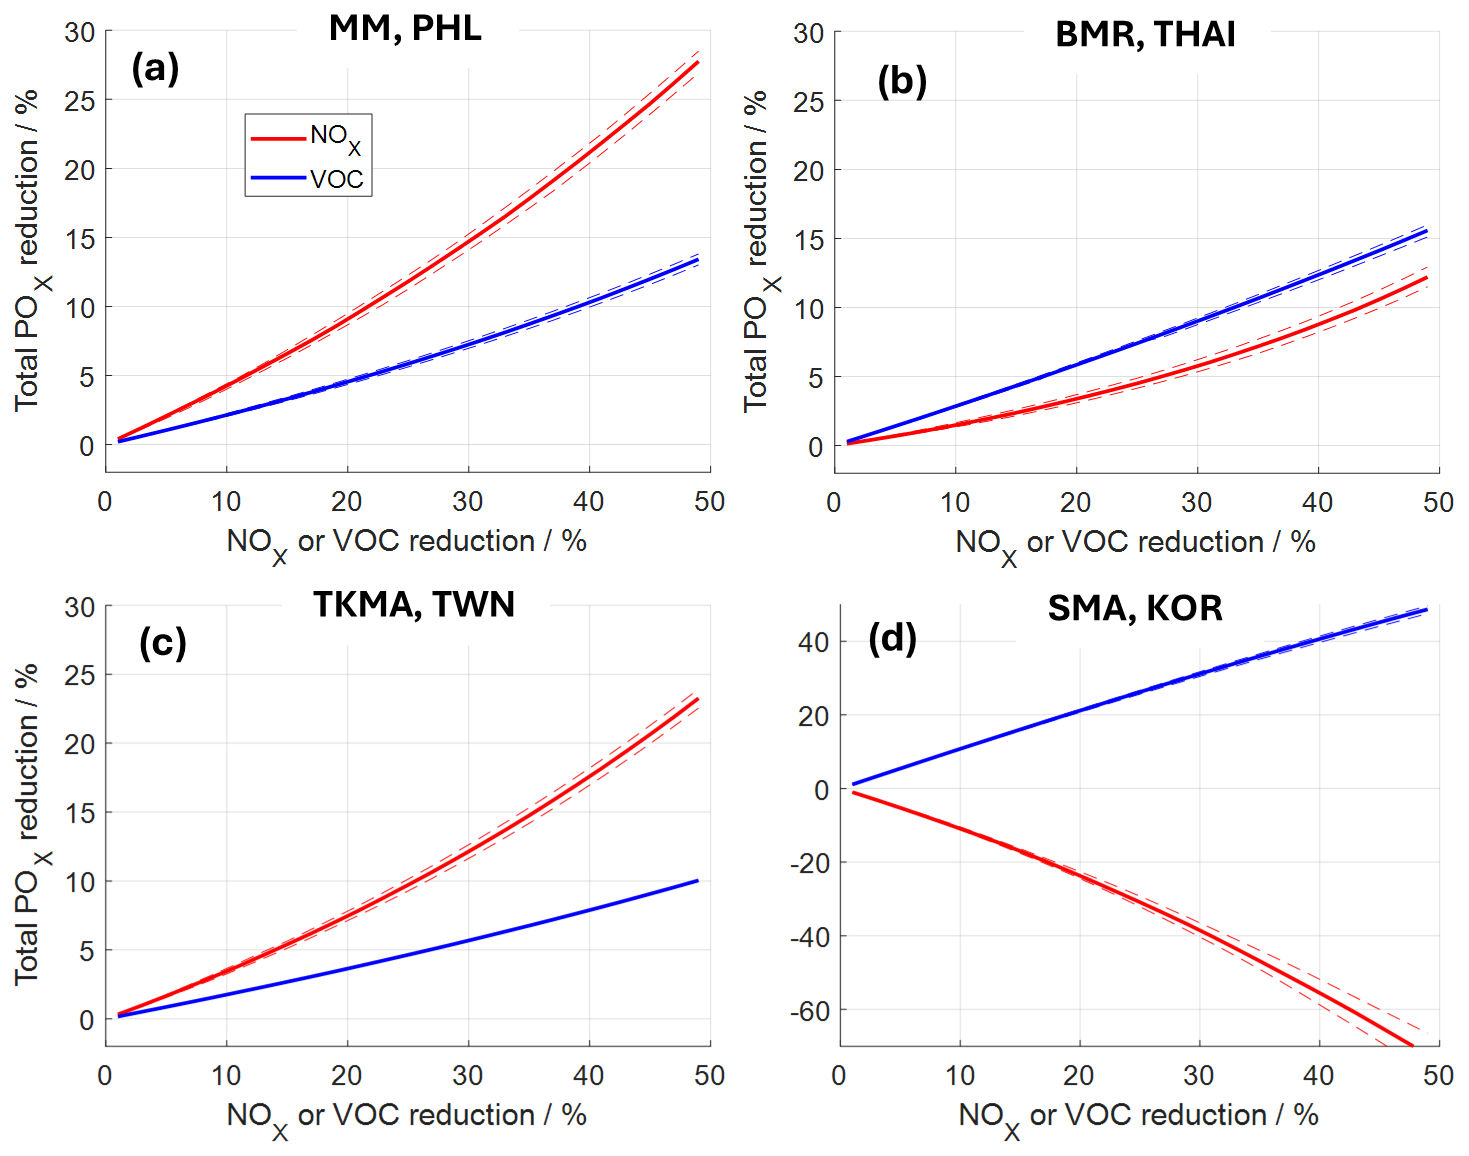
Figure 8Sensitivity of total POx reduction (%) to NOx and VOC reductions (%) in four megacities: (a) Metro Manila (MM), (b) the Bangkok Metropolitan Region (BMR), (c) the Tainan–Kaohsiung Metropolitan Area (TKMA), and (d) the Seoul Metropolitan Area (SMA). Red and blue lines represent the response of POx to NOx and VOC reductions, respectively. The dashed lines indicate the range of POx reduction responses obtained by propagating measurement uncertainties in NOx and VOC observations.
It is important to recognize that the sampling window in TKMA was restricted to 11:00–15:00 LT, meaning that early morning and late afternoon data were not included (Figs. 6b and S9). This limitation could have a significant impact on the characterization of O3 sensitivity shown in Fig. 8c. As shown in tropical Asian megacities (MM and BMR), early morning and late afternoon periods tend to exhibit higher NOx mixing ratios (Fig. 3), leading to an increased occurrence of VOC-sensitive conditions or points closer to the transition line (Figs. 4a and 5a). The absence of these time periods in the TKMA dataset suggests that VOC-sensitive conditions in Table 1 and the effect of VOC reduction to POx in Fig. 8c may be underestimated, potentially leading to an overemphasis on NOx reduction in TKMA, particularly when investigating the statistical distribution of POx sensitivities in Table 1 and evaluating the potential impact of precursor reductions in Fig. 8. This potential bias is discussed in detail in the Supplement (Sects. S4 and S5).
4.1.2 Ozone reduction strategies in BMR
As described in Sect. 3.2.2, BMR exhibits a mixed sensitivity regime, with NOx-sensitive conditions prevailing overall (69 % of the observed data classified as NOx-sensitive and 31 % as VOC-sensitive). However, under higher POx conditions, NOx-sensitive regime becomes more predominant (Table 1), suggesting that ozone formation remains predominantly NOx-driven during peak O3 build-up periods. Based on this, it appears that NOx reductions would be the most effective strategy for O3 mitigation in BMR, similarly to MM and TKMA.
Figure 8b presents a contrasting perspective to the above, however, showing that POx reduction in BMR responds more strongly to VOC reductions than to NOx reductions, particularly at higher precursor reduction levels. A 20 % reduction in VOC levels results in a 6 % decrease in POx, while the same reduction in NOx leads to only a 3 % decrease. Compared to the results in MM and TKMA, the greater effectiveness of VOC reductions in BMR is attributed to the higher proportion of data points classified as VOC-sensitive. Additionally, the presence of multiple VOC-sensitive points implies that reducing NOx levels can, in some cases, lead to an increase in POx (Figs. 5a and S8), which partially offsets the POx reductions achieved by the NOx-sensitive points and thus moderates the net POx decrease. This counteracting effect is due to the nature of POx isopleth geometry in VOC-sensitive regime in BMR. A slight upward curvature of the contour lines in the VOC-sensitive area can shift data points toward regions of higher POx, when NOx decreases. This can be explained by an increased OH level driven by reduced OH loss via the OH + NO2 reaction, which facilitates VOC oxidation and enhances ozone production. This counterbalancing effect explains why NOx reductions are less effective in BMR than in other (sub)tropical Asian cities (MM and TKMA).
Moreover, considering the sampling inhomogeneity (Sect. S5), the effect of VOC reduction on POx decrease may be underestimated. The sampling distribution shown in Figs. 5b and S14 indicates that data collection was relatively sparse in 16:00–18:00 LT with several observations near the transition line, which may correspond to transitional or VOC-sensitive conditions, further shifting its classification toward a more balanced NOx-VOC sensitivity regime. This suggests that while the statistics in Table 1 alone make BMR appear predominantly NOx-sensitive, a more comprehensive analysis incorporating Fig. 8b and the sampling biases indicates that VOC reductions may be more effective than initially perceived.
4.1.3 Ozone reduction strategies in SMA
As shown in Sect. 3.2.4, the SMA exhibits a distinctly VOC-sensitive regime for ozone formation (see Table 1 and Fig. 7). This behavior is clearly illustrated in Fig. 8d, where a VOC reduction results in a decrease in POx, while a NOx reduction leads to an increase in POx. This highlights that NOx reductions could be counterproductive in VOC-sensitive environments like wintertime SMA if not accompanied by VOC controls.
However, since winter photochemistry in the SMA is less active, and O3 pollution is typically less severe, it is important to assess whether this VOC sensitivity persists during periods of stronger O3 formation. To address this, we applied the same isopleth analysis used for ASIA-AQ to the observations from the KORUS-AQ campaign conducted in April–June 2016, a time of enhanced photochemical activity (Crawford et al., 2021). The isopleth diagram in Fig. S17 shows that, although the isopleths and central transition line are slightly less severe than during ASIA-AQ, the majority of the observed data points are located in the VOC-sensitive regime. According to Table S4, SMA remains VOC-sensitive even during KORUS-AQ, with 59 % of observations classified as VOC-sensitive and contributing 63 % of total POx. The importance of VOC-sensitive cases is amplified under high-O3 producing conditions, where 68 % of the upper 50 % POx cases (above median) fall in the VOC-sensitive regime, contributing 68 % of total POx. Further quantitative support comes from Fig. S18, which shows the response of total POx to precursor reductions. A VOC reduction effectively reduces the ozone production, while a NOx reduction leads to a counteractive increase in POx.
Such precursor control strategies for ozone pollution are consistent with major findings from the KORUS-AQ campaign. For example, the KORUS-AQ overview study (Crawford et al., 2021) highlighted the complexity of ozone formation in the SMA, emphasizing the importance of local VOC emissions and regional transport as drivers of elevated O3 pollution. More specifically, Schroeder et al. (2020) investigated regional O3 formation by comparing observations from SMA with those from a downwind remote site (Taehwa Forest), focusing on chemical evolution driven by precursor oxidation. The comparison indicated that O3 production in SMA was in the VOC-sensitive regime, particularly influenced by oxidation of C7+ aromatics, isoprene, and anthropogenic alkenes. Consistent with this study, the counteracting effects of NOx reduction in O3 production were found in Seoul, but areas outside of Seoul were found to be in the transition regime. In addition, Kim et al. (2020) reported high O3 episodes and their controlling factors at a ground site in Seoul during KORUS-AQ study. They showed that the O3 formation for high surface-level O3 cases was sensitive to VOC, consistent with our findings. Furthermore, Cho et al. (2021) and Fried et al. (2020) quantified VOC emissions from a large petrochemical complex located on the coast of the West Sea and traced their downwind effects on formaldehyde and O3 production, demonstrating how local VOC-rich plumes can significantly influence the oxidation capacity and O3 levels in urban regions of South Korea (Lee et al., 2022). Together, these studies build a compelling case that ozone production in SMA is consistently VOC-sensitive, regardless of the method or platform used.
Taken together, the results from ASIA-AQ (late winter) and KORUS-AQ (spring through early summer) demonstrate a seasonally consistent VOC-sensitive POx regime in SMA. Despite variations in photochemical activity and emission dynamics between seasons and years, both campaigns consistently identify VOC reductions as the most effective pathway for mitigating ozone formation in SMA. However, this VOC-sensitive classification reflects the marginal response of ozone under current conditions and should not be interpreted as an absence of NOx pollution, as NOx mixing ratios in Seoul remain elevated. VOC-focused controls are therefore needed to avoid short-term ozone disbenefits when NOx emissions are reduced, while sustained NOx reductions remain essential as part of a long-term air-quality strategy.
4.1.4 Policy-relevant framing of VOC controls
The POx-reduction curves in Fig. 8 apply uniform reductions to all VOC classes and should therefore be interpreted as an upper bound of achievable VOC control benefits. In practice, regulations affect AVOCs, whereas BVOCs are not directly controllable. Guided by the VOC speciation (Figs. S1–S4), the sum of primary VOCs (alkanes, alkenes, and aromatics) comprises approximately 30 % (MM), 29 % (BMR), 28 % (TKMA), and 29 % (SMA) of total VOCR. Accordingly, real-world VOC benefits will generally be smaller than those indicated by the all-VOC curves. Importantly, OVOCs dominate VOCR, and they are only partially controllable. A portion is primary anthropogenic (e.g., solvent/industry sources) and a substantial portion is secondarily produced, which will decline indirectly as AVOCs are reduced. Consequently, the attainable VOC impact should be viewed as less than the upper bound represented by the all-VOC curves (Fig. 8). As a forward step, combining this sensitivity framework with VOC source apportionment (e.g., PMF analysis; He et al., 2019; Chen et al., 2022) could more clearly identify the specific controllable source factors dominating VOCR in each city, enabling source-targeted VOC controls that translate sensitivity into actionable policy.
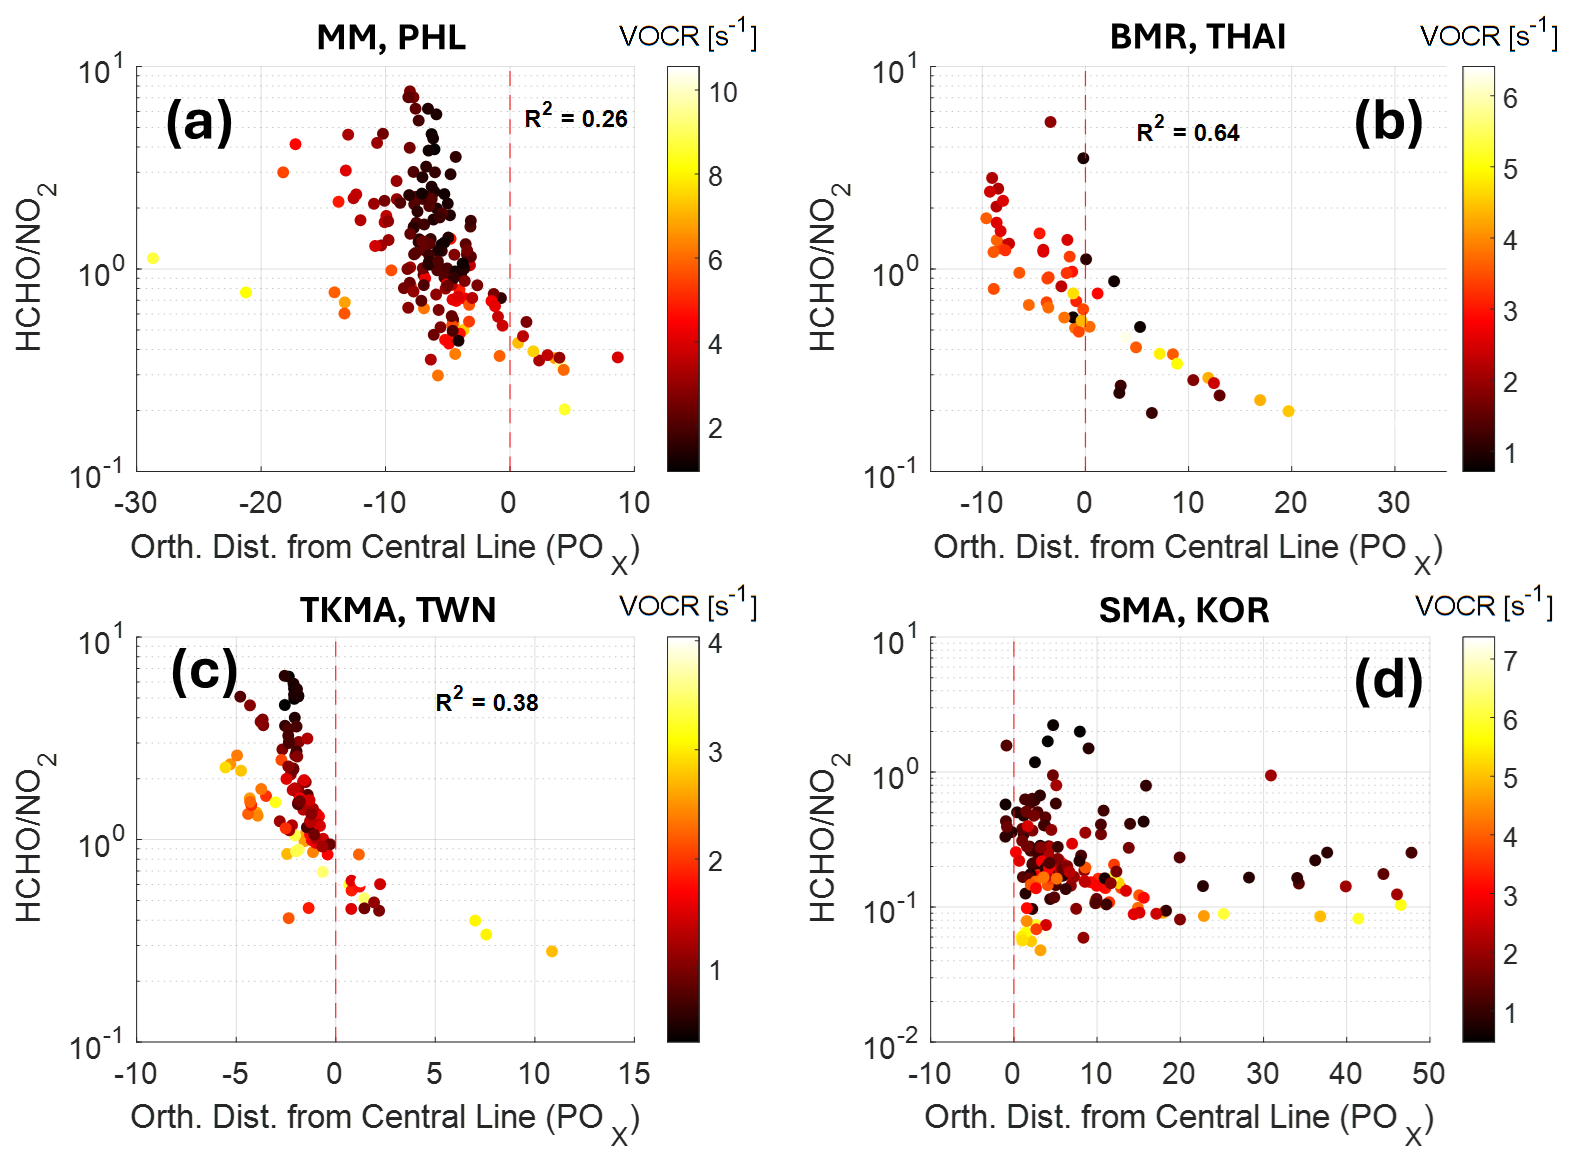
Figure 9Comparisons between in situ HCHO NO2 ratios and orthogonal distances (negative: NOx-sensitive; positive: VOC-sensitive) from the POx transition line (red dashed line) for (a) MM, (b) BMR, (c) TKMA, and (d) SMA. Colors denote VOCR values. All data points are based on 1 min average.
4.2 Comparison with in situ HCHO NO2 ratio
The HCHO NO2 ratio has been widely used as an empirical indicator to diagnose ozone production sensitivity. Many previous studies have suggested a transition range of approximately 1–2 for HCHO NO2, although this value can vary depending on chemical environment (e.g., VOC speciation, direct HCHO emission) (Martin et al., 2004; Duncan et al., 2010; Chang et al., 2016; Jin et al., 2017; Schroeder et al., 2017; Souri et al., 2020, 2023). In contrast, the orthogonal distance obtained from the isopleth approach inherently accounts for VOC speciation and radical chemistry based on box model simulations. This offers a more mechanistic and potentially robust diagnostic, conceptually similar to LNOx LROx (total NOx loss total ROx radical loss) approach, which is often used to verify HCHO NO2 thresholds (Kleinman, 2005; Tonnesen and Dennis, 2000; Duncan et al., 2010; Schroeder et al., 2017; Souri et al., 2020, 2023). While the primary focus of this study is to diagnose POx sensitivity in different Asian megacities, we further examine how our derived sensitivity regimes compare with the widely used empirical indicator, the HCHO NO2 ratio.
Figure 9 shows in situ HCHO NO2 ratios from DC-8 observations as a function of the orthogonal distances from the POx transition line obtained from the isopleth analysis. Across tropical and subtropical Asian megacities (MM, BMR, and TKMA), we observed a generally negative correlation, indicating that HCHO NO2 ratios decrease as the orthogonal distance shifts toward VOC sensitivity. This relationship is strongest in BMR (r2 = 0.64) and moderate in MM and TKMA (r2 = 0.26 and 0.38, respectively). In contrast, SMA shows a low correlation, which we attribute to low photochemical activity during the wintertime. Interestingly, the data with very low VOCR (< 2 s−1) show both a broader vertical spread in orthogonal distance and a steeper slope compared to higher-VOCR conditions. This suggests that when overall VOCR is extremely low, HCHO NO2 ratios become less reliable in delineating sensitivity regimes. This finding aligns with the results of Souri et al. (2020), who showed that HCHO does not fully capture VOCR in pristine or heavily polluted environments.
In our analysis, the transition point (orthogonal distance = 0) occurs at an HCHO NO2 ratio of about 0.3–1.0, which is notably lower than the conventional range reported in previous studies. This discrepancy likely arises from methodological differences: we use in situ HCHO and NO2 mixing ratios from the DC-8 observations within the boundary layer, whereas most previous studies employed satellite column densities.
Understanding the nonlinear responses of ozone formation to its precursors such as NOx and VOCs is essential for designing effective air quality management strategies. In rapidly urbanizing regions of Asia, particularly in urban centers or major megacities, where emissions from transportation, industry, and biomass burning are intense and diverse, the nonlinearity poses a major challenge for targeted policy implementation.
Previous studies have examined ozone formation sensitivity in urban environments using a variety of observational and modeling approaches. Building on these studies, we use airborne observations and an isopleth approach to diagnose ozone formation sensitivity and its diurnal variation. Specifically, this study utilizes measurements from the NASA DC-8 aircraft during the Airborne and Satellite Investigation of Asian-Air Quality (ASIA-AQ) for a comprehensive assessment of the sensitivity of ozone production (POx) to NOx and VOCs across four Asian megacities in Metro Manila (MM), Bangkok Metropolitan Region (BMR), Tainan–Kaohsiung Metropolitan Area (TKMA), and Seoul Metropolitan Area (SMA).
Across all four cities, extensive observations were collected within the lower boundary layer below 750 m through multiple missed approaches during aircraft operations over megacities, providing high-resolution vertical profiles of NOx, VOCs, and O3 down to near-surface levels with daytime diurnal information. The three (sub)tropical Asian cities (MM, BMR, and TKMA) were sampled during the dry hot season, characterized by active photochemistry. MM exhibited relatively low NOx and high VOC reactivity (VOCR), BMR showed high NO and high VOCR, and TKMA displayed low NOx and moderate VOCR. In contrast, SMA was sampled under conditions with high NOx and low VOCR, reflecting suppressed photochemistry typical of cold-season urban environments.
Using a chemical box model constrained by the averages from in situ observations, we constructed isopleths of POx as a function of NOx and VOC mixing ratios. Observed data points were then overlaid onto the model-generated isopleths to diagnose the chemical sensitivity regimes for each city. The isopleth analysis revealed clear regional contrasts in ozone production sensitivity, and based on this analysis, ozone reduction strategies were derived for each city.
In MM and TKMA, most data points fell into the NOx-sensitive regimes. Therefore, NOx reduction should be prioritized to mitigate ozone pollution. However, under high POx conditions, in MM, the fraction of VOC-sensitive points increased significantly, indicating that VOC controls may still yield considerable benefits.
BMR displayed a more mixed sensitivity regime than in MM and TKMA. Despite a larger proportion of NOx-sensitive data points, ozone formation shows greater responsiveness to VOC reductions due to the counteractive effects of NOx reductions under high-POx and VOC-sensitive conditions. Therefore, a simultaneous reduction of both NOx and VOCs would be the most effective strategy for addressing ozone pollution in BMR.
SMA was consistently VOC-sensitive under both wintertime (ASIA-AQ) and springtime (KORUS-AQ) conditions. VOC reductions yielded clear decreases in POx, while NOx reductions alone led to increased ozone production.
We calculated the orthogonal distance, defined as the shortest distance of each observation from the POx transition line on the isopleth. This metric indicates both the regime and the degree of sensitivity relative to the transition line. Using the distances, we analyzed the diurnal variations of POx sensitivity and found a general pattern across tropical and subtropical Asian megacities: distances were closer to the transition line or slightly VOC-sensitive in the morning but shifted toward stronger NOx sensitivity in the afternoon. In addition, we applied the orthogonal distance to compare with the widely used HCHO NO2 ratio derived from in situ observations for identifying the POx sensitivity regime. The relationship between the two indicators showed negative correlation with transition occurring at an HCHO NO2 range of approximately 0.3–1.0, notably lower than the previously reported HCHO NO2 thresholds (1–2).
While this study provides important insights into the chemical sensitivity of ozone formation, several limitations should be noted. The analysis is based on changes in precursor concentrations rather than emission-based controls, and it focuses on chemical production rates rather than ambient mixing ratios that also influenced by transport, mixing, and meteorology. As a result, the inferred control responses should be interpreted as chemical tendencies rather than direct predictions of surface ozone changes. Future work using 3-D chemical transport models will be necessary to fully capture the impacts on real-world air quality by perturbing precursor emission controls. In addition, given that only a subset of VOCs is realistically controllable, rigorous VOC source apportionment is required to identify and prioritize the controllable, high-reactivity sources and to bound the attainable benefits. Nevertheless, this study highlights ozone formation sensitivity varies substantially across Asian megacities, emphasizing that coordinated NOx and/or VOC reductions are essential to effectively mitigate urban O3 pollution.
The airborne observational data from the ASIA-AQ campaign used in this study are publicly available at https://doi.org/10.5067/SUBORBITAL/ASIA-AQ/DATA001 (ASIA-AQ Science Team, 2025).
The supplement related to this article is available online at https://doi.org/10.5194/acp-26-6097-2026-supplement.
CC and AF designed the analysis, performed the POx isopleth and sensitivity calculations, and led the interpretation of the results. CC wrote the first draft of the manuscript with substantial inputs from AF. KEM and FF provided additional scientific guidance on the POx isopleth analysis and contributed to the discussion and revision of the manuscript. JD and JC, as ASIA-AQ principal investigators, led the overall planning and execution of the campaign. KL, CO, SH, KU, ECA, AJH, RSH, BR, DJ, GSD, YC, JPD, JM, GMW, TFH, JMSC, ERD, AS, RAH, POW, KB, YRL, LGH, DJT, LA, DRB, NJB, BB, SM, KEM, HK, WN, AW, FP, and WW contributed to the execution of the campaign and to the provision and quality control of the observational datasets used in this study. All authors discussed the results, commented on the manuscript, and contributed to its final version.
The contact author has declared that none of the authors has any competing interests.
Publisher's note: Copernicus Publications remains neutral with regard to jurisdictional claims made in the text, published maps, institutional affiliations, or any other geographical representation in this paper. The authors bear the ultimate responsibility for providing appropriate place names. Views expressed in the text are those of the authors and do not necessarily reflect the views of the publisher.
We gratefully acknowledge the ASIA-AQ science team, the flight and ground crews, and all instrument teams for their extensive efforts in planning, executing, and supporting the ASIA-AQ field campaign.
This material is based upon work supported by the NSF National Center for Atmospheric Research, which is a major facility sponsored by the U.S. National Science Foundation under Cooperative Agreement No. 1852977. CC, AF, FF, KL, and CO were funded in part by NASA Award No. 80NSSC23K0824. SRH and KU were supported by NASA Grant No. 80NSSC23K0825. ECA, AJH, and RSH were funded in part by NASA Award No. 80NSSC23K0818. JD was supported by NASA grant No. 80NSSC23K0822. YRL was supported by NASA Grant No. 80NSSC21K1704. LA, DT and LGH were supported by NASA Grant No. 80NSSC23K0826. DRB, NJB, BB, and SM were funded by NASA Grant No. 80NSSC23K0819. POW was supported by NASA Grant No. 80NSSC21K1704. KB was supported by NASA FINESST Grant No. 80NSSC24K0005. GMW, TFH, JMSC, JL, ERD, AS, and RAH acknowledge support from the NASA Tropospheric Composition Program. PTR-ToF-MS measurements aboard the NASA DC-8 during ASIA-AQ were partially funded by the Austrian Federal Ministry for Climate Action, Environment, Energy, Mobility, Innovation, and Technology (BMK), represented by the Austrian Research Promotion Agency (FFG), through the Austrian Space Applications Programme (ASAP 2022, #FO999900547). IONICON Analytik is acknowledged for supplying a FUSION PTR-ToF-MS analyzer and providing staff support and Tomas Mikoviny is acknowledged for technical support. WW gratefully acknowledges the support from Gdańsk University of Technology through the DEC-4/1/2024/IDUB/II.1b/Am grant under the Americium International Career Development – “Excellence Initiative – Research University” program.
This paper was edited by Benjamin A Nault and reviewed by two anonymous referees.
ASIA-AQ Science Team: Airborne and Satellite Investigation of Asian Air Quality Campaign Data, NASA Langley Atmospheric Science Data Center Distributed Active Archive Center [data set], https://doi.org/10.5067/SUBORBITAL/ASIA-AQ/DATA001, 2025.
Brune, W. H., Miller, D. O., Thames, A. B., Brosius, A. L., Barletta, B., Blake, D. R., Blake, N. J., Chen, G., Choi, Y., Crawford, J. H., Digangi, J. P., Diskin, G., Fried, A., Hall, S. R., Hanisco, T. F., Huey, G. L., Hughes, S. C., Kim, M., Meinardi, S., Montzka, D. D., Pusede, S. E., Schroeder, J. R., Teng, A., Tanner, D. J., Ullmann, K., Walega, J., Weinheimer, A., Wisthaler, A., and Wennberg, P. O.: Observations of atmospheric oxidation and ozone production in South Korea, Atmos. Environ., 269, 118854, https://doi.org/10.1016/j.atmosenv.2021.118854, 2022.
Chang, C.-Y., Faust, E., Hou, X., Lee, P., Kim, H. C., Hedquist, B. C., and Liao, K.-J.: Investigating ambient ozone formation regimes in neighboring cities of shale plays in the Northeast United States using photochemical modeling and satellite retrievals, Atmos. Environ., 142, 152–170, https://doi.org/10.1016/j.atmosenv.2016.06.058, 2016.
Chen, G., Liu, T., Ji, X., Xu, K., Hong, Y., Xu, L., Li, M., Fan, X., Chen, Y., Yang, C., Lin, Z., Huang, W., and Chen, J.: Source Apportionment of VOCs and O3 Production Sensitivity at Coastal and Inland Sites of Southeast China, Aerosol Air Qual. Res., 22, 220289, https://doi.org/10.4209/aaqr.220289, 2022.
Chen, S. and Brune, W. H.: Global sensitivity analysis of ozone production and O3–NOx–VOC limitation based on field data, Atmos. Environ., 55, 288–296, https://doi.org/10.1016/j.atmosenv.2012.03.061, 2012.
Chin, M., Bian, H., Kucsera, T., Diehl, T., Tao, Z., Kim, D., and Pan, X.: Connection Between East Asian Air Pollution and Monsoon System, in: Air Pollution in Eastern Asia: An Integrated Perspective, edited by: Bouarar, I., Wang, X., and Brasseur, G. P., Springer International Publishing, Cham, 87–103, https://doi.org/10.1007/978-3-319-59489-7_5, 2017.
Cho, C., Clair, J. M. St., Liao, J., Wolfe, G. M., Jeong, S., Kang, D. il, Choi, J., Shin, M.-H., Park, J., Park, J.-H., Fried, A., Weinheimer, A., Blake, D. R., Diskin, G. S., Ullmann, K., Hall, S. R., Brune, W. H., Hanisco, T. F., and Min, K.-E.: Evolution of formaldehyde (HCHO) in a plume originating from a petrochemical industry and its volatile organic compounds (VOCs) emission rate estimation, Elementa: Science of the Anthropocene, 9, 00015, https://doi.org/10.1525/elementa.2021.00015, 2021.
Choi, Y. and Souri, A. H.: Chemical condition and surface ozone in large cities of Texas during the last decade: Observational evidence from OMI, CAMS, and model analysis, Remote Sens. Environ., 168, 90–101, https://doi.org/10.1016/j.rse.2015.06.026, 2015.
Cohan, D. S., Hakami, A., Hu, Y., and Russell, A. G.: Nonlinear Response of Ozone to Emissions: Source Apportionment and Sensitivity Analysis, Environ. Sci. Technol., 39, 6739–6748, https://doi.org/10.1021/es048664m, 2005.
Crawford, J. H., Ahn, J.-Y., Al-Saadi, J., Chang, L., Emmons, L. K., Kim, J., Lee, G., Park, J.-H., Park, R. J., Woo, J. H., Song, C.-K., Hong, J.-H., Hong, Y.-D., Lefer, B. L., Lee, M., Lee, T., Kim, S., Min, K.-E., Yum, S. S., Shin, H. J., Kim, Y.-W., Choi, J.-S., Park, J.-S., Szykman, J. J., Long, R. W., Jordan, C. E., Simpson, I. J., Fried, A., Dibb, J. E., Cho, S., and Kim, Y. P.: The Korea–United States Air Quality (KORUS-AQ) field study, Elementa: Science of the Anthropocene, 9, 00163, https://doi.org/10.1525/elementa.2020.00163, 2021.
Dang, R., Jacob, D. J., Zhai, S., Coheur, P., Clarisse, L., Van Damme, M., Pendergrass, D. C., Choi, J., Park, J., Liu, Z., and Liao, H.: Diagnosing the Sensitivity of Particulate Nitrate to Precursor Emissions Using Satellite Observations of Ammonia and Nitrogen Dioxide, Geophys. Res. Lett., 50, e2023GL105761, https://doi.org/10.1029/2023GL105761, 2023.
Dörter, M., Mağat-Türk, E., Döğeroğlu, T., Özden-Üzmez, Ö., Gaga, E. O., Karakaş, D., and Yenisoy-Karakaş, S.: An assessment of spatial distribution and atmospheric concentrations of ozone, nitrogen dioxide, sulfur dioxide, benzene, toluene, ethylbenzene, and xylenes: ozone formation potential and health risk estimation in Bolu city of Turkey, Environ. Sci. Pollut. R., 29, 53569–53583, https://doi.org/10.1007/s11356-022-19608-x, 2022.
Duncan, B. N., Yoshida, Y., Olson, J. R., Sillman, S., Martin, R. V., Lamsal, L., Hu, Y., Pickering, K. E., Retscher, C., Allen, D. J., and Crawford, J. H.: Application of OMI observations to a space-based indicator of NOx and VOC controls on surface ozone formation, Atmos. Environ., 44, 2213–2223, https://doi.org/10.1016/j.atmosenv.2010.03.010, 2010.
Finlayson-Pitts, B. J. and Pitts Jr., J. N.: Chemistry of the upper and lower atmosphere, Academic Press, Academic Press, https://doi.org/10.1016/B978-0-12-257060-5.X5000-X, 2000.
Fried, A., Walega, J., Weibring, P., Richter, D., Simpson, I. J., Blake, D. R., Blake, N. J., Meinardi, S., Barletta, B., Hughes, S. C., Crawford, J. H., Diskin, G., Barrick, J., Hair, J., Fenn, M., Wisthaler, A., Mikoviny, T., Woo, J.-H., Park, M., Kim, J., Min, K.-E., Jeong, S., Wennberg, P. O., Kim, M. J., Crounse, J. D., Teng, A. P., Bennett, R., Yang-Martin, M., Shook, M. A., Huey, G., Tanner, D., Knote, C., Kim, J., Park, R., and Brune, W.: Airborne formaldehyde and volatile organic compound measurements over the Daesan petrochemical complex on Korea's northwest coast during the Korea-United States Air Quality study: Estimation of emission fluxes and effects on air quality, Elementa: Science of the Anthropocene, 8, 121, https://doi.org/10.1525/elementa.2020.121, 2020.
Gaudel, A., Cooper, O. R., Ancellet, G., Barret, B., Boynard, A., Burrows, J. P., Clerbaux, C., Coheur, P.-F., Cuesta, J., Cuevas, E., Doniki, S., Dufour, G., Ebojie, F., Foret, G., Garcia, O., Granados-Muñoz, M. J., Hannigan, J. W., Hase, F., Hassler, B., Huang, G., Hurtmans, D., Jaffe, D., Jones, N., Kalabokas, P., Kerridge, B., Kulawik, S., Latter, B., Leblanc, T., Le Flochmoën, E., Lin, W., Liu, J., Liu, X., Mahieu, E., McClure-Begley, A., Neu, J. L., Osman, M., Palm, M., Petetin, H., Petropavlovskikh, I., Querel, R., Rahpoe, N., Rozanov, A., Schultz, M. G., Schwab, J., Siddans, R., Smale, D., Steinbacher, M., Tanimoto, H., Tarasick, D. W., Thouret, V., Thompson, A. M., Trickl, T., Weatherhead, E., Wespes, C., Worden, H. M., Vigouroux, C., Xu, X., Zeng, G., and Ziemke, J.: Tropospheric Ozone Assessment Report: Present-day distribution and trends of tropospheric ozone relevant to climate and global atmospheric chemistry model evaluation, Elementa: Science of the Anthropocene, 6, 39, https://doi.org/10.1525/elementa.291, 2018.
Gu, Y., Fang, T., and Yim, S. H. L.: Source emission contributions to particulate matter and ozone, and their health impacts in Southeast Asia, Environ. Int., 186, 108578, https://doi.org/10.1016/j.envint.2024.108578, 2024.
Guo, F., Bui, A. A. T., Schulze, B. C., Yoon, S., Shrestha, S., Wallace, H. W., Sakai, Y., Actkinson, B. W., Erickson, M. H., Alvarez, S., Sheesley, R., Usenko, S., Flynn, J., and Griffin, R. J.: Urban core-downwind differences and relationships related to ozone production in a major urban area in Texas, Atmos. Environ., 262, 118624, https://doi.org/10.1016/j.atmosenv.2021.118624, 2021.
He, Z., Wang, X., Ling, Z., Zhao, J., Guo, H., Shao, M., and Wang, Z.: Contributions of different anthropogenic volatile organic compound sources to ozone formation at a receptor site in the Pearl River Delta region and its policy implications, Atmos. Chem. Phys., 19, 8801–8816, https://doi.org/10.5194/acp-19-8801-2019, 2019.
Jenkin, M. E., Young, J. C., and Rickard, A. R.: The MCM v3.3.1 degradation scheme for isoprene, Atmos. Chem. Phys., 15, 11433–11459, https://doi.org/10.5194/acp-15-11433-2015, 2015.
Jin, X. and Holloway, T.: Spatial and temporal variability of ozone sensitivity over China observed from the Ozone Monitoring Instrument, J. Geophys. Res.-Atmos., 120, 7229–7246, https://doi.org/10.1002/2015JD023250, 2015.
Jin, X., Fiore, A. M., Murray, L. T., Valin, L. C., Lamsal, L. N., Duncan, B., Folkert Boersma, K., De Smedt, I., Abad, G. G., Chance, K., and Tonnesen, G. S.: Evaluating a Space-Based Indicator of Surface Ozone-NO-VOC Sensitivity Over Midlatitude Source Regions and Application to Decadal Trends, J. Geophys. Res.-Atmos., 122, 10439–10461, https://doi.org/10.1002/2017JD026720, 2017.
Kim, H., Gil, J., Lee, M., Jung, J., Whitehill, A., Szykman, J., Lee, G., Kim, D.-S., Cho, S., Ahn, J.-Y., Hong, J., and Park, M.-S.: Factors controlling surface ozone in the Seoul Metropolitan Area during the KORUS-AQ campaign, Elementa: Science of the Anthropocene, 8, 46, https://doi.org/10.1525/elementa.444, 2020.
Kim, S.-W., Kim, K.-M., Jeong, Y., Seo, S., Park, Y., and Kim, J.: Changes in surface ozone in South Korea on diurnal to decadal timescales for the period of 2001–2021, Atmos. Chem. Phys., 23, 12867–12886, https://doi.org/10.5194/acp-23-12867-2023, 2023.
Kleinman, L. I.: The dependence of tropospheric ozone production rate on ozone precursors, Atmos. Environ., 39, 575–586, https://doi.org/10.1016/j.atmosenv.2004.08.047, 2005.
Lee, H.-M. and Park, R. J.: Factors determining the seasonal variation of ozone air quality in South Korea: Regional background versus domestic emission contributions, Environ. Pollut., 308, 119645, https://doi.org/10.1016/j.envpol.2022.119645, 2022.
Lee, H.-M., Henze, D. K., Alexander, B., and Murray, L. T.: Investigating the sensitivity of surface-level nitrate seasonality in Antarctica to primary sources using a global model, Atmos. Environ., 89, 757–767, https://doi.org/10.1016/j.atmosenv.2014.03.003, 2014.
Lee, Y. R., Huey, L. G., Tanner, D. J., Takeuchi, M., Qu, H., Liu, X., Ng, N. L., Crawford, J. H., Fried, A., Richter, D., Simpson, I. J., Blake, D. R., Blake, N. J., Meinardi, S., Kim, S., Diskin, G. S., Digangi, J. P., Choi, Y., Pusede, S. E., Wennberg, P. O., Kim, M. J., Crounse, J. D., Teng, A. P., Cohen, R. C., Romer, P. S., Brune, W., Wisthaler, A., Mikoviny, T., Jimenez, J. L., Campuzano-Jost, P., Nault, B. A., Weinheimer, A., Hall, S. R., and Ullmann, K.: An investigation of petrochemical emissions during KORUS-AQ: Ozone production, reactive nitrogen evolution, and aerosol production, Elementa: Science of the Anthropocene, 10, 00079, https://doi.org/10.1525/elementa.2022.00079, 2022.
Lee, Y. R., Arterburn, L., Takeuchi, M., Tanner, D. J., Roberts, J. M., Roozitalab, B., Jeong, D., Hills, A. J., Hornbrook, R. S., Apel, E. C., Meinardi, S., Barletta, B., Blake, N. J., Blake, D. R., Kim, S., Wojnowski, W., Piel, F., Wisthaler, A., Ball, K., Crounse, J. D., Wennberg, P. O., Miech, J., Choi, Y., DiGangi, J. P., Diskin, G. S., Sebol, A., Delaria, E. R., Hannun, R. A., St. Clair, J. M., Wolfe, G. M., Cho, C., Owen, C., Lesko, K., Franchin, A., Winstead, E. L., Ziemba, L. D., Moore, R., Wiggins, E. B., Symonds, G., Kim, D., Day, D. A., Campuzano-Jost, P., Jimenez, J. L., Ullmann, K., Hall, S. R., Crawford, J. H., and Huey, L. G.: Wintertime photochemistry of acyl peroxynitrates and ozone in South Korea during the ASIA-AQ campaign, EGUsphere [preprint], https://doi.org/10.5194/egusphere-2025-6264, 2026.
Li, J., Wang, Z., Chen, L., Lian, L., Li, Y., Zhao, L., Zhou, S., Mao, X., Huang, T., Gao, H., and Ma, J.: WRF-Chem simulations of ozone pollution and control strategy in petrochemical industrialized and heavily polluted Lanzhou City, Northwestern China, Sci. Total Environ., 737, 139835, https://doi.org/10.1016/j.scitotenv.2020.139835, 2020.
Lin, C.-Y., Zhao, C., Liu, X., Lin, N.-H., and Chen, W.-N.: Modelling of long-range transport of Southeast Asia biomass-burning aerosols to Taiwan and their radiative forcings over East Asia, Tellus B, 66, 23733, https://doi.org/10.3402/tellusb.v66.23733, 2014.
Liu, C. and Shi, K.: A review on methodology in O3-NOx-VOC sensitivity study, Environ. Pollut., 291, 118249, https://doi.org/10.1016/j.envpol.2021.118249, 2021.
Martin, R. V., Fiore, A. M., and Van Donkelaar, A.: Space-based diagnosis of surface ozone sensitivity to anthropogenic emissions, Geophys. Res. Lett., 31, https://doi.org/10.1029/2004GL019416, 2004.
Marvin, M. R., Palmer, P. I., Latter, B. G., Siddans, R., Kerridge, B. J., Latif, M. T., and Khan, M. F.: Photochemical environment over Southeast Asia primed for hazardous ozone levels with influx of nitrogen oxides from seasonal biomass burning, Atmos. Chem. Phys., 21, 1917–1935, https://doi.org/10.5194/acp-21-1917-2021, 2021.
Mazzuca, G. M., Ren, X., Loughner, C. P., Estes, M., Crawford, J. H., Pickering, K. E., Weinheimer, A. J., and Dickerson, R. R.: Ozone production and its sensitivity to NOx and VOCs: results from the DISCOVER-AQ field experiment, Houston 2013, Atmos. Chem. Phys., 16, 14463–14474, https://doi.org/10.5194/acp-16-14463-2016, 2016.
Nault, B. A., Travis, K. R., Crawford, J. H., Blake, D. R., Campuzano-Jost, P., Cohen, R. C., DiGangi, J. P., Diskin, G. S., Hall, S. R., Huey, L. G., Jimenez, J. L., Min, K.-E., Lee, Y. R., Simpson, I. J., Ullmann, K., and Wisthaler, A.: Using observed urban NOx sinks to constrain VOC reactivity and the ozone and radical budget in the Seoul Metropolitan Area, Atmos. Chem. Phys., 24, 9573–9595, https://doi.org/10.5194/acp-24-9573-2024, 2024.
Nussbaumer, C. M., Kohl, M., Pozzer, A., Tadic, I., Rohloff, R., Marno, D., Harder, H., Ziereis, H., Zahn, A., Obersteiner, F., Hofzumahaus, A., Fuchs, H., Künstler, C., Brune, W. H., Ryerson, T. B., Peischl, J., Thompson, C. R., Bourgeois, I., Lelieveld, J., and Fischer, H.: Ozone Formation Sensitivity to Precursors and Lightning in the Tropical Troposphere Based on Airborne Observations, J. Geophys. Res.-Atmos., 129, e2024JD041168, https://doi.org/10.1029/2024JD041168, 2024.
Ojha, N., Soni, M., Kumar, M., Gunthe, S. S., Chen, Y., and Ansari, T. U.: Mechanisms and Pathways for Coordinated Control of Fine Particulate Matter and Ozone, Current Pollution Reports, 8, 594–604, https://doi.org/10.1007/s40726-022-00229-4, 2022.
Ren, J., Guo, F., and Xie, S.: Diagnosing ozone–NOx–VOC sensitivity and revealing causes of ozone increases in China based on 2013–2021 satellite retrievals, Atmos. Chem. Phys., 22, 15035–15047, https://doi.org/10.5194/acp-22-15035-2022, 2022.
Roozitalab, B., Carmichael, G. R., Guttikunda, S. K., and Abdi-Oskouei, M.: Elucidating the impacts of COVID-19 lockdown on air quality and ozone chemical characteristics in India, Environmental Science: Atmospheres, 2, 1183–1207, https://doi.org/10.1039/D2EA00023G, 2022.
Schroeder, J. R., Crawford, J. H., Fried, A., Walega, J., Weinheimer, A., Wisthaler, A., Müller, M., Mikoviny, T., Chen, G., Shook, M., Blake, D. R., and Tonnesen, G. S.: New insights into the column CH2ONO2 ratio as an indicator of near-surface ozone sensitivity, J. Geophys. Res.-Atmos., 122, 8885–8907, https://doi.org/10.1002/2017JD026781, 2017.
Schroeder, J. R., Crawford, J. H., Ahn, J.-Y., Chang, L., Fried, A., Walega, J., Weinheimer, A., Montzka, D. D., Hall, S. R., Ullmann, K., Wisthaler, A., Mikoviny, T., Chen, G., Blake, D. R., Blake, N. J., Hughes, S. C., Meinardi, S., Diskin, G., Digangi, J. P., Choi, Y., Pusede, S. E., Huey, G. L., Tanner, D. J., Kim, M., and Wennberg, P.: Observation-based modeling of ozone chemistry in the Seoul metropolitan area during the Korea-United States Air Quality Study (KORUS-AQ), Elementa: Science of the Anthropocene, 8, 3, https://doi.org/10.1525/elementa.400, 2020.
Shen, H., Sun, Z., Chen, Y., Russell, A. G., Hu, Y., Odman, M. T., Qian, Y., Archibald, A. T., and Tao, S.: Novel Method for Ozone Isopleth Construction and Diagnosis for the Ozone Control Strategy of Chinese Cities, Environ. Sci. Technol., 55, 15625–15636, https://doi.org/10.1021/acs.est.1c01567, 2021.
Sillman, S. and He, D.: Some theoretical results concerning O3-NO-VOC chemistry and NO-VOC indicators, J. Geophys. Res.-Atmos., 107, ACH 26-1–ACH 26-15, https://doi.org/10.1029/2001JD001123, 2002.
Souri, A. H., Choi, Y., Jeon, W., Woo, J.-H., Zhang, Q., and Kurokawa, J.: Remote sensing evidence of decadal changes in major tropospheric ozone precursors over East Asia, J. Geophys. Res.-Atmos., 122, 2474–2492, https://doi.org/10.1002/2016JD025663, 2017.
Souri, A. H., Nowlan, C. R., Wolfe, G. M., Lamsal, L. N., Chan Miller, C. E., Abad, G. G., Janz, S. J., Fried, A., Blake, D. R., Weinheimer, A. J., Diskin, G. S., Liu, X., and Chance, K.: Revisiting the effectiveness of HCHO NO2 ratios for inferring ozone sensitivity to its precursors using high resolution airborne remote sensing observations in a high ozone episode during the KORUS-AQ campaign, Atmos. Environ., 224, 117341, https://doi.org/10.1016/j.atmosenv.2020.117341, 2020.
Souri, A. H., Johnson, M. S., Wolfe, G. M., Crawford, J. H., Fried, A., Wisthaler, A., Brune, W. H., Blake, D. R., Weinheimer, A. J., Verhoelst, T., Compernolle, S., Pinardi, G., Vigouroux, C., Langerock, B., Choi, S., Lamsal, L., Zhu, L., Sun, S., Cohen, R. C., Min, K.-E., Cho, C., Philip, S., Liu, X., and Chance, K.: Characterization of errors in satellite-based HCHONO2 tropospheric column ratios with respect to chemistry, column-to-PBL translation, spatial representation, and retrieval uncertainties, Atmos. Chem. Phys., 23, 1963–1986, https://doi.org/10.5194/acp-23-1963-2023, 2023.
Stockwell, C. E., Coggon, M. M., Schwantes, R. H., Harkins, C., Verreyken, B., Lyu, C., Zhu, Q., Xu, L., Gilman, J. B., Lamplugh, A., Peischl, J., Robinson, M. A., Veres, P. R., Li, M., Rollins, A. W., Zuraski, K., Baidar, S., Liu, S., Kuwayama, T., Brown, S. S., McDonald, B. C., and Warneke, C.: Urban ozone formation and sensitivities to volatile chemical products, cooking emissions, and NOx upwind of and within two Los Angeles Basin cities, Atmos. Chem. Phys., 25, 1121–1143, https://doi.org/10.5194/acp-25-1121-2025, 2025.
Tan, Z., Lu, K., Dong, H., Hu, M., Li, X., Liu, Y., Lu, S., Shao, M., Su, R., Wang, H., Wu, Y., Wahner, A., and Zhang, Y.: Explicit diagnosis of the local ozone production rate and the ozone-NOx-VOC sensitivities, Sci. Bull., 63, 1067–1076, https://doi.org/10.1016/j.scib.2018.07.001, 2018.
Toh, Y. Y., Lim, S. F., and von Glasow, R.: The influence of meteorological factors and biomass burning on surface ozone concentrations at Tanah Rata, Malaysia, Atmos. Environ., 70, 435–446, https://doi.org/10.1016/j.atmosenv.2013.01.018, 2013.
Tonnesen, G. S. and Dennis, R. L.: Analysis of radical propagation efficiency to assess ozone sensitivity to hydrocarbons and NOx: 2. Long-lived species as indicators of ozone concentration sensitivity, J. Geophys. Res.-Atmos., 105, 9227–9241, https://doi.org/10.1029/1999JD900372, 2000.
Wang, X., Yin, S., Zhang, R., Yuan, M., and Ying, Q.: Assessment of summertime O3 formation and the O3-NOX-VOC sensitivity in Zhengzhou, China using an observation-based model, Sci. Total Environ., 813, 152449, https://doi.org/10.1016/j.scitotenv.2021.152449, 2022a.
Wang, X., Fu, T.-M., Zhang, L., Lu, X., Liu, X., Amnuaylojaroen, T., Latif, M. T., Ma, Y., Zhang, L., Feng, X., Zhu, L., Shen, H., and Yang, X.: Rapidly Changing Emissions Drove Substantial Surface and Tropospheric Ozone Increases Over Southeast Asia, Geophys. Res. Lett., 49, e2022GL100223, https://doi.org/10.1029/2022GL100223, 2022b.
Wang, Y. and Jacob, D. J.: Anthropogenic forcing on tropospheric ozone and OH since preindustrial times, J. Geophys. Res.-Atmos., 103, 31123–31135, https://doi.org/10.1029/1998JD100004, 1998.
Wolfe, G. M., Marvin, M. R., Roberts, S. J., Travis, K. R., and Liao, J.: The Framework for 0-D Atmospheric Modeling (F0AM) v3.1, Geosci. Model Dev., 9, 3309–3319, https://doi.org/10.5194/gmd-9-3309-2016, 2016.
Womack, C. C., McDuffie, E. E., Edwards, P. M., Bares, R., de Gouw, J. A., Docherty, K. S., Dubé, W. P., Fibiger, D. L., Franchin, A., Gilman, J. B., Goldberger, L., Lee, B. H., Lin, J. C., Long, R., Middlebrook, A. M., Millet, D. B., Moravek, A., Murphy, J. G., Quinn, P. K., Riedel, T. P., Roberts, J. M., Thornton, J. A., Valin, L. C., Veres, P. R., Whitehill, A. R., Wild, R. J., Warneke, C., Yuan, B., Baasandorj, M., and Brown, S. S.: An Odd Oxygen Framework for Wintertime Ammonium Nitrate Aerosol Pollution in Urban Areas: NOx and VOC Control as Mitigation Strategies, Geophys. Res. Lett., 46, 4971–4979, https://doi.org/10.1029/2019GL082028, 2019.
Yarwood, G., Emery, C., Jung, J., Nopmongcol, U., and Sakulyanontvittaya, T.: A method to represent ozone response to large changes in precursor emissions using high-order sensitivity analysis in photochemical models, Geosci. Model Dev., 6, 1601–1608, https://doi.org/10.5194/gmd-6-1601-2013, 2013.