the Creative Commons Attribution 4.0 License.
the Creative Commons Attribution 4.0 License.
 | 05 May 2026
Inferring processes governing cloud transition during mid-latitude marine cold-air outbreaks from satellite
David Painemal
Jung-Sub Lim
Armin Sorooshian
Graham Feingold
Cloud morphological transitions strongly influence radiative effects and the regional radiation budget. Marine cold-air outbreaks (MCAOs) over the northwestern Atlantic feature such transitions. Characterizing these transitions requires an understanding of the thermodynamic and dynamical evolution of the marine boundary layer and the interplay between warm- and cold-phase cloud processes. Using a novel “space-time exchange” approach, we construct instantaneous trajectories using reanalysis winds and extract geophysical variable traces along these trajectories from GOES-16 satellite snapshots for five MCAO events. Directionality of traces in liquid water path (LWP)-droplet number (Nd) space reveals sequential dominance of drop activation, condensational growth, and collision-coalescence during cloud thickening. Traces in domain-mean LWP-IWP (ice water path) space exhibit two distinct couplings between liquid and ice, consistent with different mixed-phase process fingerprints: (i) gradual liquid depletion dominated by vapor deposition and (ii) rapid liquid depletion driven by collisional freezing, aided by precipitation and dynamical feedbacks. NASA-ACTIVATE in-situ measurements provide independent evidence supporting the interpretation of these process fingerprints. Delayed cloud breakup during the 29 March 2022 event is consistent with a shift from precipitation- to entrainment-driven cloud breakup under high Nd conditions. During the transition to a broken cloud field, two distinct scalings between shortwave albedo and cloud fraction emerge, consistent with the identified mixed-phase process fingerprints, with the degree of cloud organization converging toward the end of the transition. These results demonstrate an effective “space-time exchange” framework for process inference from satellite snapshots, enabling a new pathway for synergistic characterization of mixed-phase microphysics in models and observations.
- Article
(8886 KB) - Full-text XML
-
Supplement
(9748 KB) - BibTeX
- EndNote


About one-third of the sunlight-absorbing ocean surface is covered by marine boundary layer clouds (Klein and Hartmann, 1993). Their close proximity to the sea surface and high reflectivity of sunlight result in a net cooling effect on the Earth's energy budget (Forster et al., 2021). The radiative properties of these clouds are governed collectively by the available water surface of cloud droplets at the microscopic scale and the amount and areal extent of the water condensate at the macrophysical scale (Twomey, 1974; Wood, 2012). As the ocean surface continues to warm in response to increasing greenhouse gas (GHG) emissions, these clouds can act as either a buffer or an amplifier to the warming, depending on how they adjust to the changing boundary layer conditions. Therefore, understanding the processes that govern boundary layer clouds and representing them in large-scale models becomes critical to predicting future warming rates. To date, Earth system models continue to struggle on this front, in part due to the insufficient grid spacing needed to resolve these clouds and the simplified representation of the intricate interactions between clouds and their environment (Zelinka et al., 2020; Bellouin et al., 2020).
Morphological transitions of boundary layer clouds, particularly the transition from overcast to broken cloud fields have been extensively studied to understand the processes governing cloud evolution and their profound radiative impacts (McCoy et al., 2017; Goren et al., 2022). These transitions are typically associated with a deepening marine boundary layer (MBL) driven by gradients in sea surface temperature (SST). One such example is the stratocumulus-to-cumulus transition, which occurs as clouds are advected from subtropical ocean upwelling regions toward warmer tropical waters (Albrecht et al., 1995; Bretherton, 1992; Sandu et al., 2010). Another distinct class of transitions is associated with marine cold-air outbreaks (MCAOs), in which cold continental air masses are advected over relatively warm ocean surfaces (Brümmer, 1996, 1999; Fletcher et al., 2016a, b; Pithan et al., 2018). During MCAO events, strong temperature contrasts between the ocean surface and the overlying cold air generate intense buoyancy fluxes that rapidly deepen the MBL. This rapid expansion of the MBL entrains free-tropospheric air, which can eventually decouple the cloud layer from the surface moisture sources and lead to cloud breakup (Tornow et al., 2023). Concurrently, cloud thickening during MCAOs leads to rapid accumulation of liquid condensate, enhancing collision-coalescence processes and eventually triggering precipitation-driven cloud breakup (Abel et al., 2017). Furthermore, subfreezing cloud-top temperatures are common during MCAO events, making frozen hydrometeors prevalent. As a result, mixed-phase processes such as riming can further accelerate condensate removal and, thereby, cloud breakup (Abel et al., 2017; Tornow et al., 2021; Karalis et al., 2022; Chellappan et al., 2024). Consequently, accurately capturing cloud morphological transitions during MCAOs remains challenging even for process-resolving models, owing to the strong sensitivity of transition onset to the representation of microphysical processes (e.g. Abel et al., 2017; de Roode et al., 2019).
Polar-orbiting satellites offer detailed observations of boundary layer clouds at (sub-)kilometer resolution (e.g. Platnick et al., 2003), but the lack of temporal coverage prevents the tracking of the spatiotemporally evolving cloud system to study the time-dependent processes governing cloud evolution. Geostationary satellites offer such capability and have been used to study subtropical stratocumulus-to-cumulus transitions (e.g. Christensen et al., 2020), but the reliance of their cloud microphysical retrievals, e.g. cloud droplet number concentration (Nd), on shortwave channels limits the temporal coverage to sunlit hours. Given the timescale at which cloud transitions occur, 𝒪(∼day), a complete characterization of the transition proves to be challenging.
In this study, we apply a “space-time exchange” to geostationary satellite snapshots to construct “instantaneous” trajectories that approximate Lagrangian cloud transitions, enabling us to capture the complete closed-to-open cloud transition during MCAO events. Derived from the original concept of ergodicity (Boltzmann, 1884) – the mean state of the system can be characterized by either a collection of individual realizations of the system or, equivalently, by tracking one realization over time – this “space-time exchange” approach has been applied in the field of atmospheric science, particularly in studies aiming at cloud process characterization (e.g. Feingold et al., 2025; Goren et al., 2022; Murray-Watson et al., 2023).
Cloud systems are complex, multi-scale, dynamic by nature, and are slaved to the large-scale meteorological conditions. The large number of degrees of freedom and intertwined processes makes process-inference from snapshot observation particularly difficult. On this front, recent studies have made promising advances in inferring cloud microphysical processes from snapshots of cloud systems using carefully selected combinations of geophysical variables (GVs), such as cloud fraction – albedo, liquid water path (LWP) – Nd, and optical depth – radar reflectivity (e.g. Suzuki et al., 2010; Glassmeier et al., 2019; Hoffmann et al., 2020; Zhang et al., 2022; Zhang and Feingold, 2023; Feingold et al., 2016, 2025).
Here we use satellite-retrieved in-cloud LWP-Nd and areal-mean LWP-IWP (ice water path) relationships to articulate the manifestation of cloud microphysical processes in the context of deepening marine boundary layers as part of MCAO events occurring over the northwestern Atlantic Ocean during boreal winter. Instead of building statistics from a large sample of satellite snapshots, we illustrate the capability of this process-inference approach with selected MCAO case studies, supported by airborne in-situ measurements collected during the multi-year NASA Earth Venture Suborbital (EVS) campaign ACTIVATE (Aerosol Cloud meTeorology Interactions oVer the western ATlantic Experiment; Sorooshian et al., 2019, 2025). Using the “space-time exchange” approach, we reveal fingerprints of dominant cloud processes driving morphological transitions of the cloud field and identify distinct mixed-phase process fingerprints, indicating an important role for riming, consistent with recent findings in Tornow et al. (2021) and Chellappan et al. (2024). The “space-time exchange” approach along with its underlying assumptions and datasets is introduced in Sect. 2. Results and discussions are provided in Sect. 3, followed by conclusions (Sect. 4).
2.1 Geophysical variables from GOES-16 snapshots
The Advanced Baseline Imager (ABI) aboard the 16th Geostationary Operational Environment Satellite (GOES-16) is used to retrieve cloud properties based on the NASA Satellite ClOud and Radiation Property System (SatCORPS) algorithms, which primarily rely on the 0.65, 3.9, and 11.2 µm channels for derivation of cloud microphysical properties (Minnis et al., 2008, 2011, 2021). This study uses the SatCORPS produced cloud retrievals over a domain (29–46° N, 78–60° W) covering the ACTIVATE deployment region (Sorooshian et al., 2023). Cloud variables, including cloud mask and thermodynamic phase, temperature, height, and pressure, particle effective radius (ice and liquid), cloud water path (ice and liquid), optical depth, and broadband shortwave albedo, are produced at the native resolution of the infrared channels, which is 2 km at nadir. Nd is calculated using the (sub)adiabatic assumption (Szczodrak et al., 2001; Quaas et al., 2006) as
where τc is the cloud optical depth and re is the cloud (water) droplet effective radius. A value of 0.8 is assumed for k, the inverse of the width of the modified gamma droplet distribution (Martin et al., 1994; Painemal and Zuidema, 2011). The temperature-pressure-dependent condensation rate (cw) is calculated based on GOES-16 retrieved cloud temperature (T) and pressure (P) (Grosvenor and Wood, 2014). The adiabatic fraction (fad) is assumed to be 0.8 (Grosvenor et al., 2018). An extinction efficiency (Qext) of 2 (Bennartz, 2007) and a liquid water density (ρw) of 997 kg m−3 are used in the calculations. In order to minimize retrieval biases, additional filtering of re>1 µm, τc>1, cloud phase identified as either “water” or “suspected water” (i.e. Nd is only calculated for liquid cloud pixels), and solar zenith angle (SZA)<65° is applied (Grosvenor et al., 2018). We tested a stricter filtering of re>4 µm and τc>4 (e.g. Murray-Watson et al., 2023), which does not alter the resulting evolutionary characteristics in the LWP-Nd space. Therefore, to better capture the optically thin roll clouds at the western edge of the deck during cloud emergence, we adopt the relatively liberal thresholds for re and τc in Nd calculations.
For LWP, microwave imagery retrievals (e.g. Elsaesser et al., 2017) provide an independent constraint on visible imagery retrievals, which are known to be biased under high SZA (Maddux et al., 2010; Grosvenor and Wood, 2014; Grosvenor et al., 2018). By excluding pixels with SZA>65° and restricting our analysis to 09:00–15:00 LT, we largely remove the nonlinear biases associated with high SZA. The remaining biases at lower SZA appear to be systematic when evaluated against independent microwave imagery retrievals (Smalley and Lebsock, 2023). Because the primary quantities of interest for process inference in this study are the spatiotemporal gradients and tendencies of cloud properties, rather than their absolute magnitudes, the impact of the remaining systematic biases in LWP on identifying process fingerprints is minimal.
The (sub)adiabaticity assumption used in Nd retrievals has been widely applied to global marine single-level clouds (e.g. Quaas et al., 2006; Gryspeerdt et al., 2019a) and has been shown to perform well for stratiform clouds, though less so for more convective and broken cloud fields (Gryspeerdt et al., 2022; Grosvenor et al., 2018; Painemal et al., 2021). Importantly, this retrieval method has been extended to MCAO clouds, particularly in the polar regions (e.g. Murray-Watson et al., 2023) and mid-latitude regions including the North Atlantic (e.g. Chellappan et al., 2024). An adiabatic cloud model assumes that cloud liquid water content (LWC) increases linearly with height above cloud base, modified by an adiabatic fraction factor (i.e. fad) to account for entrainment-mixing. In-situ LWC and re profiles measured during the ACTIVATE campaign (e.g. in Chellappan et al., 2024) generally support the validity of this assumption. To assess the robustness of our results to the subadiabatic assumption, we conducted sensitivity tests using different fad values in Nd calculations. Figure S1 in the Supplement shows that varying cloud subadiabaticity, representing different degrees of entrainment-mixing, quantitatively affects the cloud evolution in LWP-Nd space, as expected. However, the qualitative characteristics of these evolutions, which reflect underlying cloud and boundary-layer processes, remain robust. Thus, variations in the adiabatic assumption primarily influence the absolute magnitude of retrieved Nd, while preserving the spatial and temporal patterns that are the focus of this study.
A limitation in SatCORPS pixel-based thermodynamic phase classification is that mixed-phase clouds are not reported as a distinct class. The classification identifies a single, radiatively dominant cloud phase (liquid or ice) that best explains the observed top-of-atmosphere radiances, using iterative model-observation matching which is further constrained by retrieved cloud-top temperature through a series of logical tests (Minnis et al., 2008, 2011, 2021). Therefore, the GOES-16 cloud phase classification used in this work should be interpreted as “the radiatively dominant cloud phase that best explains the observed multispectral radiances at the top of the atmosphere”. Although to the best of our knowledge no validation work has specifically targeted MCAO clouds, this retrieval algorithm has been validated against active sensors (e.g. Yost et al., 2021) and in-situ measurements (e.g. Painemal et al., 2021; Kang et al., 2021) under broad range of cloud regimes. The cloudy scene type investigated in this study, i.e. non-polar, snow-/ice-free scenes, exhibit the highest hit rate (0.971) and the highest Hanssen–Kuipers' skill score (HKSS; 0.941) across all scene types when compared to phase classifications based on an active sensor (Yost et al., 2021). For IWP retrievals, a cloud reflectance and emittance model based on adding-doubling radiative transfer is used to compute reflectance lookup tables for ice crystals with effective diameters varying from 6 to 135 µm (Minnis et al., 1998, 2011, 2021). This model assumes randomly distributed hexagonal ice columns with roughened surfaces having the normalized roughness parameter set equal to 1.0 and asymmetry factors g between 0.77–0.81 at 0.65 µm. As a result, the satellite-retrieved IWP is not able to resolve different morphologies of frozen hydrometeors.
Given the limitations of satellite retrieved cloud properties, we characterize the cloud system evolution, including its hydrometeor mixing states, from a domain-mean perspective through spatial aggregation. This approach focuses on the characteristic system evolution, rather than on detailed spatial structure, as appropriate for the satellite view.
2.2 Meteorological reanalysis from ERA5
Meteorological reanalysis fields, including SST, temperature and humidity profiles, surface latent and sensible heat fluxes (LHF and SHF), horizontal winds at 1000 hPa, and vertical velocity at 700 hPa, are obtained hourly at 0.25° from the European Centre for Medium-Range Weather Forecasts (ECMWF) fifth-generation atmospheric reanalysis (ERA5; Hersbach et al., 2020). The marine cold-air outbreak index (M-index; Kolstad and Bracegirdle, 2008), a measure of the strength of the MCAO event and the stability of the marine boundary layer, is calculated as the difference between the potential temperature at 800 hPa and the sea surface temperature (Fletcher et al., 2016a). Buoyancy fluxes (QB) are calculated following Chellappan et al. (2024) as
where q2 m and T2 m are the specific humidity and temperature at a height of 2 m, and values of 1004 and are used for the specific heat of air at constant pressure (cp) and latent heat of vaporization (Lv), respectively, in the calculations.
2.3 In-situ cloud sampling from FCDP and 2D-S
ACTIVATE featured two spatially coordinated aircraft, a low-flying HU-25 Falcon and high-flying King Air, that conducted 162 joint flights across multiple seasons in each year between 2020–2022. In-situ measurements of liquid and frozen hydrometeors in clouds are collected by a fast cloud droplet probe (FCDP; Knop et al., 2021; Kirschler et al., 2022) and a 2-dimensional stereo imager (2D-S; Lawson et al., 2006; Kirschler et al., 2023), both manufactured by SPEC Inc. and operated by the Deutsches Zentrum für Luft- und Raumfahrt (DLR). The FCDP covers hydrometeors with diameter size spanning 3–50 µm, and the 2D-S covers diameter size spanning 11.4–1465 µm. Together, Liquid water content (LWC) and ice water content (IWC) are derived from these two probes by assuming particles <100 µm are liquid droplets and by discriminating ice from liquid particles based on particle asphericity for hydrometeors with diameter great than 100 µm (Kirschler et al., 2023). An area-to-mass parameterization in Baker and Lawson (2006) is used to calculate IWC. Corrections are applied for 2D-S image distortion, sample area, and shattering. A deeper discussion of the ACTIVATE campaign's flight and instrument details is provided in Sorooshian et al. (2023).
2.4 Instantaneous trajectories – a “space-time exchange”
A key focus of this work is to characterize the driving processes for the morphological transition from closed-cellular, overcast to open-cellular, broken cloud fields during mid-latitude MCAO events. Therefore, it is crucial to capture the complete cloud transition considering the limitation that satellite microphysical properties are only derived during daytime due to the algorithm reliance on visible and near-infrared channels. However, given a typical boundary layer wind speed of 15 m s−1 during a mid-latitude MCAO event (Chellappan et al., 2024), Lagrangian trajectories typically travel less than 500 km in fetch during sunlit hours, which covers the cloud street and closed-cell stages well, but often falls short for the open-cell stage. For example, on 24 January 2021, the fetch of the Lagrangian trajectories (solid red lines), initialized in the morning from the western edge of the cloud street, reaches the open-cell stage during the night (Fig. 1b). Therefore, a real Lagrangian approach would limit our capability in characterizing the full transition due to the reliance of cloud microphysical retrievals on shortwave channels.
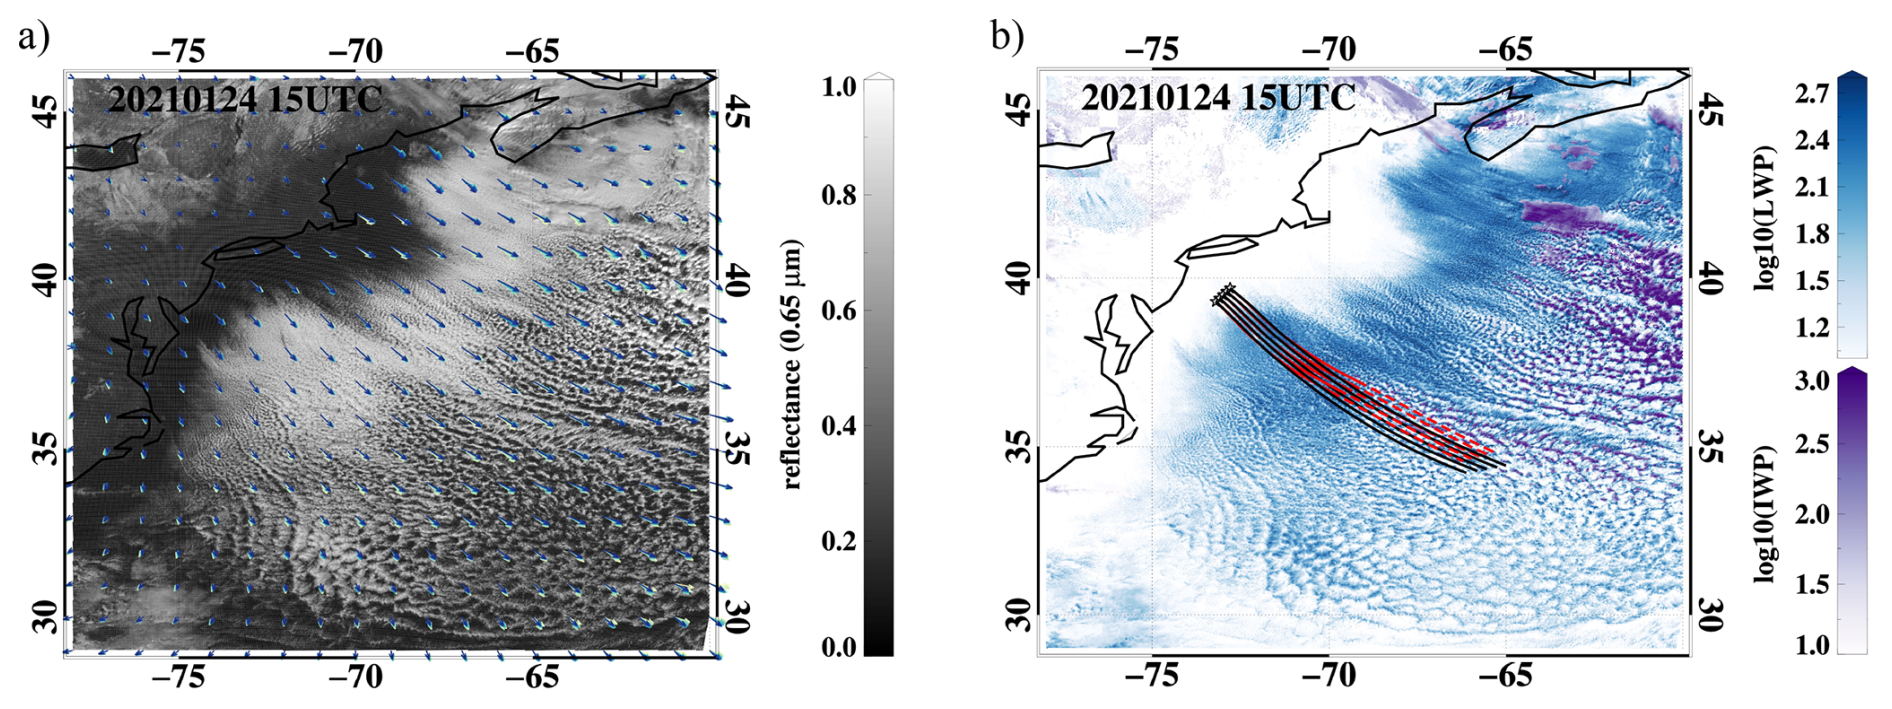
Figure 1GOES-16 images and SatCORPS retrievals of the MCAO event at 15:00 UTC on 24 January 2021. (a) Reflectance at 0.65 µm, overlaid with 1000 hPa wind vectors from ERA5 (07:00–15:00 UTC, from warm to cold colors). (b) Common logarithm of cloud liquid water path (LWP; shades of blue) and ice water path (IWP; shades of purple), overlaid with five 1000 hPa-wind-advected isobaric, forward Lagrangian trajectories starting from western cloud edge at 13:00 UTC for 15 h (locations indicated by the black open stars), with solid red indicating trajectories during sunlit hours (13:00–21:00 UTC) and dashed red indicating the remaining nighttime hours. Instantaneous trajectories, based on the wind field at 15:00 UTC for 15 h, are indicated in black solid lines.
A unique feature of MCAO is the persistence of the boundary layer wind field during the event, evident in the overlapping of time-evolving wind vectors in Fig. 1a. Taking advantage of this feature, we examine the idea of representing cloud transition by sampling cloud variables from a single GOES-16 snapshot along forward trajectories advected by the wind field present at that time. Here, two types of forward, isobaric trajectories were generated for comparison using 1000 hPa winds for advection, following Gryspeerdt et al. (2019b) and Murray-Watson et al. (2023) based on their success in tracking the movement of low-level clouds. (i) Lagrangian trajectory: initialized at the western edge of the cloud street at 13:00 UTC and subsequently advected by time-evolving wind fields based on the hourly ERA5 wind data (e.g. red lines in Fig. 1). (ii) Instantaneous trajectory: initialized at the western edge of the cloud street and subsequently advected by a time-invariant ERA5 wind field fixed at the time of the GOES-16 snapshot (e.g. black lines in Fig. 1). As evident during the MCAO event on 24 January 2021 (Fig. 1), the close proximity between the Lagrangian trajectories and the instantaneous trajectories supports the validity of this “space-time exchange” approach, in which a time-evolving evolution is represented by a trace in the spatial dimension at a given time.
To further demonstrate the validity of the “space-time exchange”, we examine gradients in additional large-scale meteorological conditions beyond surface winds, including SST, LHF, SHF, buoyancy flux, the M-index, and subsidence and RH at 700 hPa, along instantaneous trajectories for each MCAO event (Fig. 2). Diurnal variations (between 14:00–20:00 UTC; denoted by colors in Fig. 2) are minimal for most meteorological conditions, with subsidence and RH at 700 hPa exhibiting the strongest diurnal variability. The steady gradients in surface buoyancy flux and temperature support the applicability of the “space-time exchange”, while diurnal variations in the dynamical environment are used to interpret the observed diurnal variations in process fingerprints discussed in Sect. 3.6.
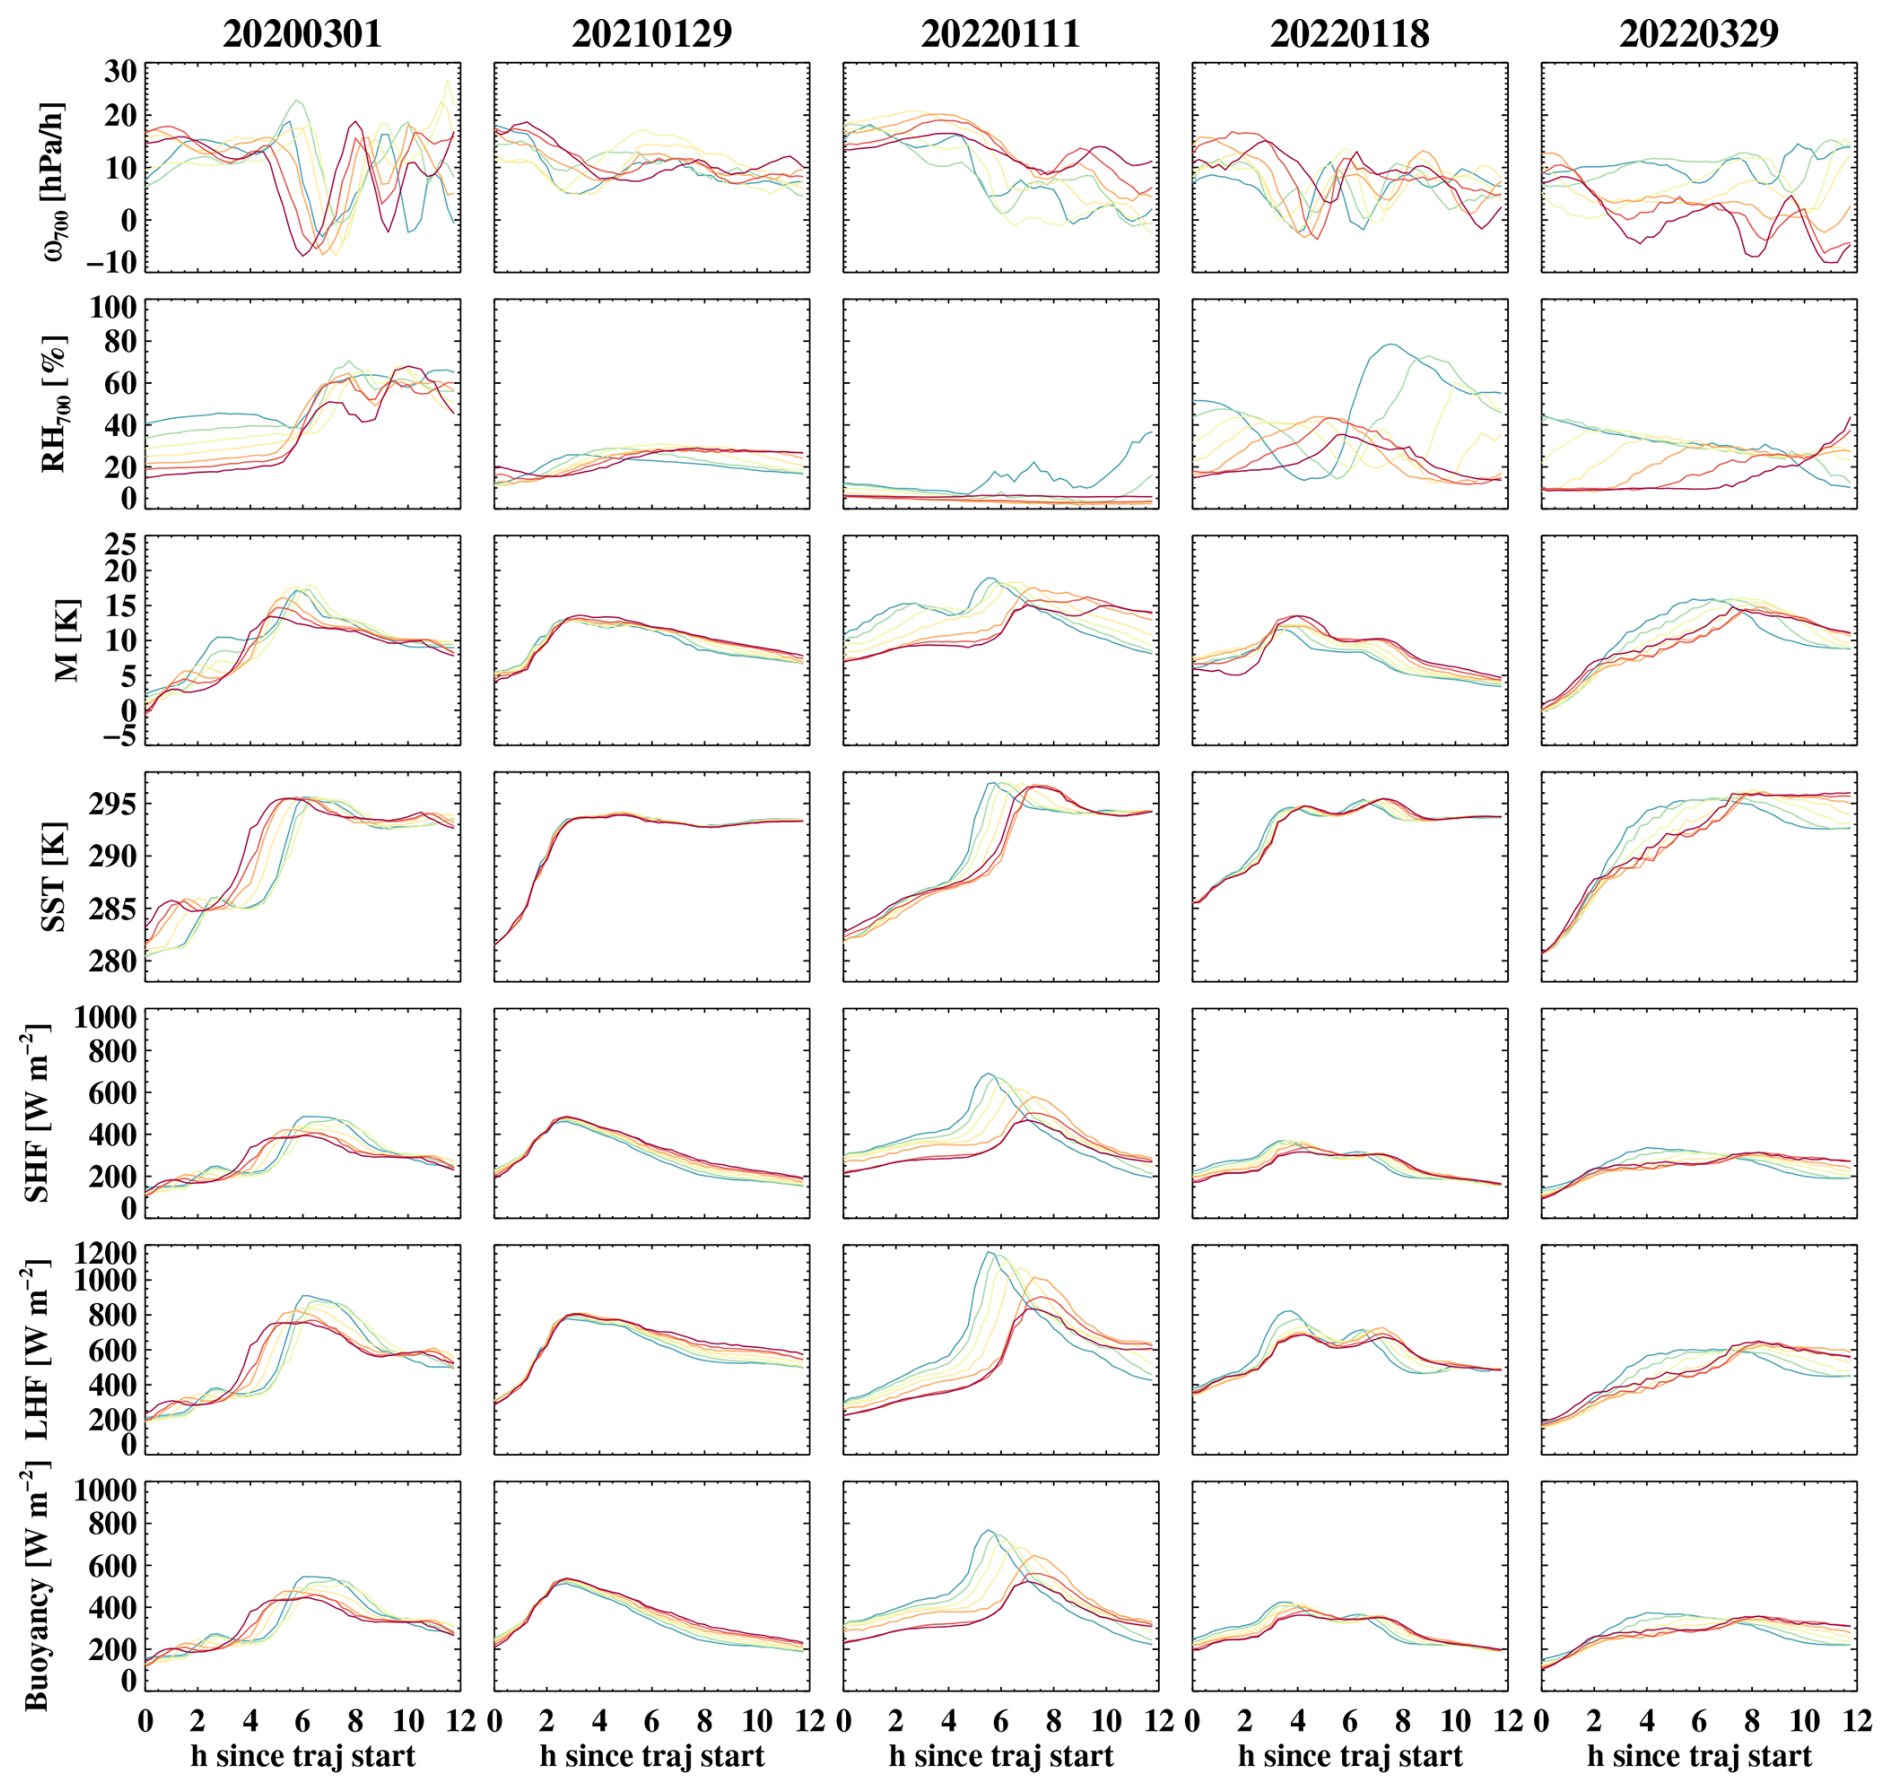
Figure 2Steadiness of large-scale meteorological conditions along instantaneous trajectories between 14:00–20:00 UTC for the five MCAO events. Meteorological conditions include: subsidence and relative humidity at 700 hPa (ω700 and RH700), M-index, SST, sensible heat flux (SHF), latent heat flux (LHF), and buoyancy flux. UTCs from 14:00 to 20:00 UTC are denoted by cold to warm colors.
2.5 Case selection
The validity of “space-time exchange” hinges on whether the timescale of the process of investigation (τproc) is much shorter than the timescale of large-scale meteorology evolution (τmet) (Feingold et al., 2025). In our case, the slowly-evolving, relatively persistent boundary layer wind field and spatial gradients in large-scale meteorological conditions (i.e. SST, surface fluxes, and free-tropospheric subsidence) throughout the MCAO event are key underlying conditions that satisfy this requirement. Based on this prerequisite of the “space-time exchange”, we screen MCAO events that occurred during ACTIVATE winter deployments between 2020–2022 for these large-scale conditions, yielding five events for further investigation (Table 1). These cases are also included in the library of MCAO events surveyed by Tornow et al. (2025b) and are identified as strong cases for Lagrangian modeling case studies. All five events show the presence of liquid and frozen hydrometeors, as well as the presence of drizzle- and rain-sized particles (Tornow et al., 2025b). Further contextual large-scale meteorological conditions during these MCAO events are described Sect. 3.1, as well as in Table 2 of Sorooshian et al. (2023) and in Tornow et al. (2025b).
Table 1Selected MCAO events during ACTIVATE (2020–2022), including date, initial location (central of the five) and duration of the instantaneous trajectories.
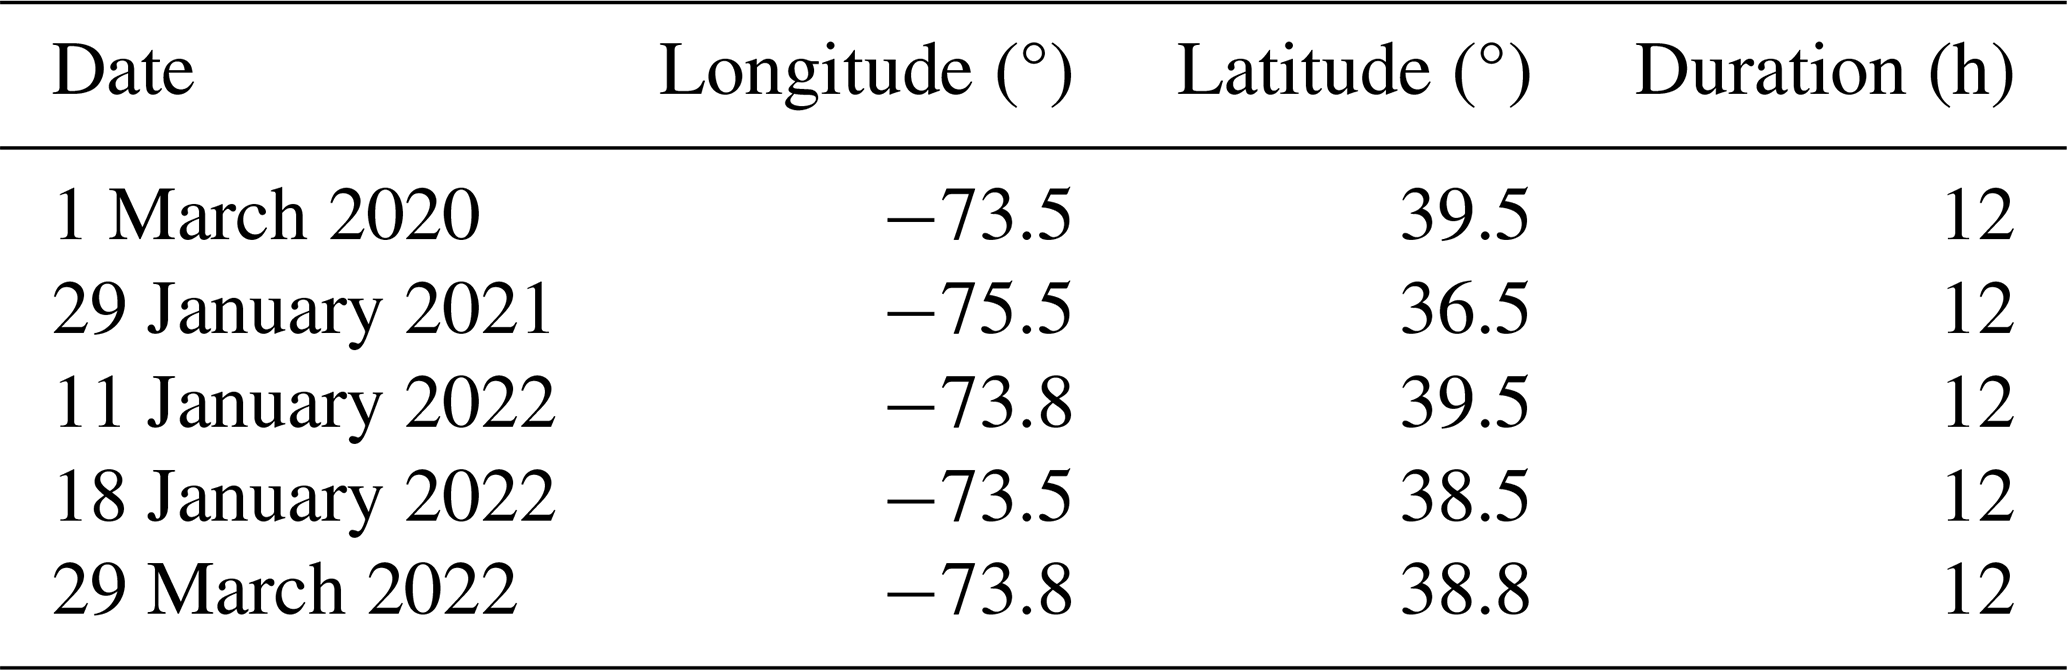
For each event, seven GOES-16 snapshots at the top of each hour between 14:00–20:00 UTC (09:00–15:00 LT) are analyzed to investigate the cloud evolution (Fig. 3). To characterize the mean transition within each snapshot, five closely aligned (separated by a 0.1° increment in both latitude and longitude) 12 h instantaneous trajectories are generated, initialized at the western edge of the cloud deck with their locations manually selected to overlap with ACTIVATE flight paths (locations detailed in Table 1; see also Fig. S2 in the Supplement for flight path and instantaneous trajectories overlaid on GOES-16 snapshots). Figure 3 shows the GOES-16 0.65 µm reflectance along the instantaneous trajectories at the top of each hour between 14:00–20:00 UTC for the five MCAO events (7 snapshots per event). Rather persistent patterns of cloud evolution throughout sunlit hours are observed, except for the 11 January 2022 case where an extended overcast cloud deck is evident later in the day (Fig. 3), consistent with the increasing subsidence over time (Fig. 2). GOES-16 retrieved cloud properties and ERA5 meteorological fields within a 1°×1° area centered at each point along the trajectory are averaged across the 5 spatially separated starting points and across the 7 snapshots at the top of each hour during daytime to characterize the mean evolution of each event. Cloud properties are averaged over cloudy pixels (a cloudy average), except when examining the mixed-phase evolution of the cloud field, for which LWP and IWP are averaged over 1°×1° areas (a domain average). Water (ice) cloud fraction is calculated as the fraction of pixels within the 1°×1° area that are identified as either “water (ice)” or “suspected water (ice)”.
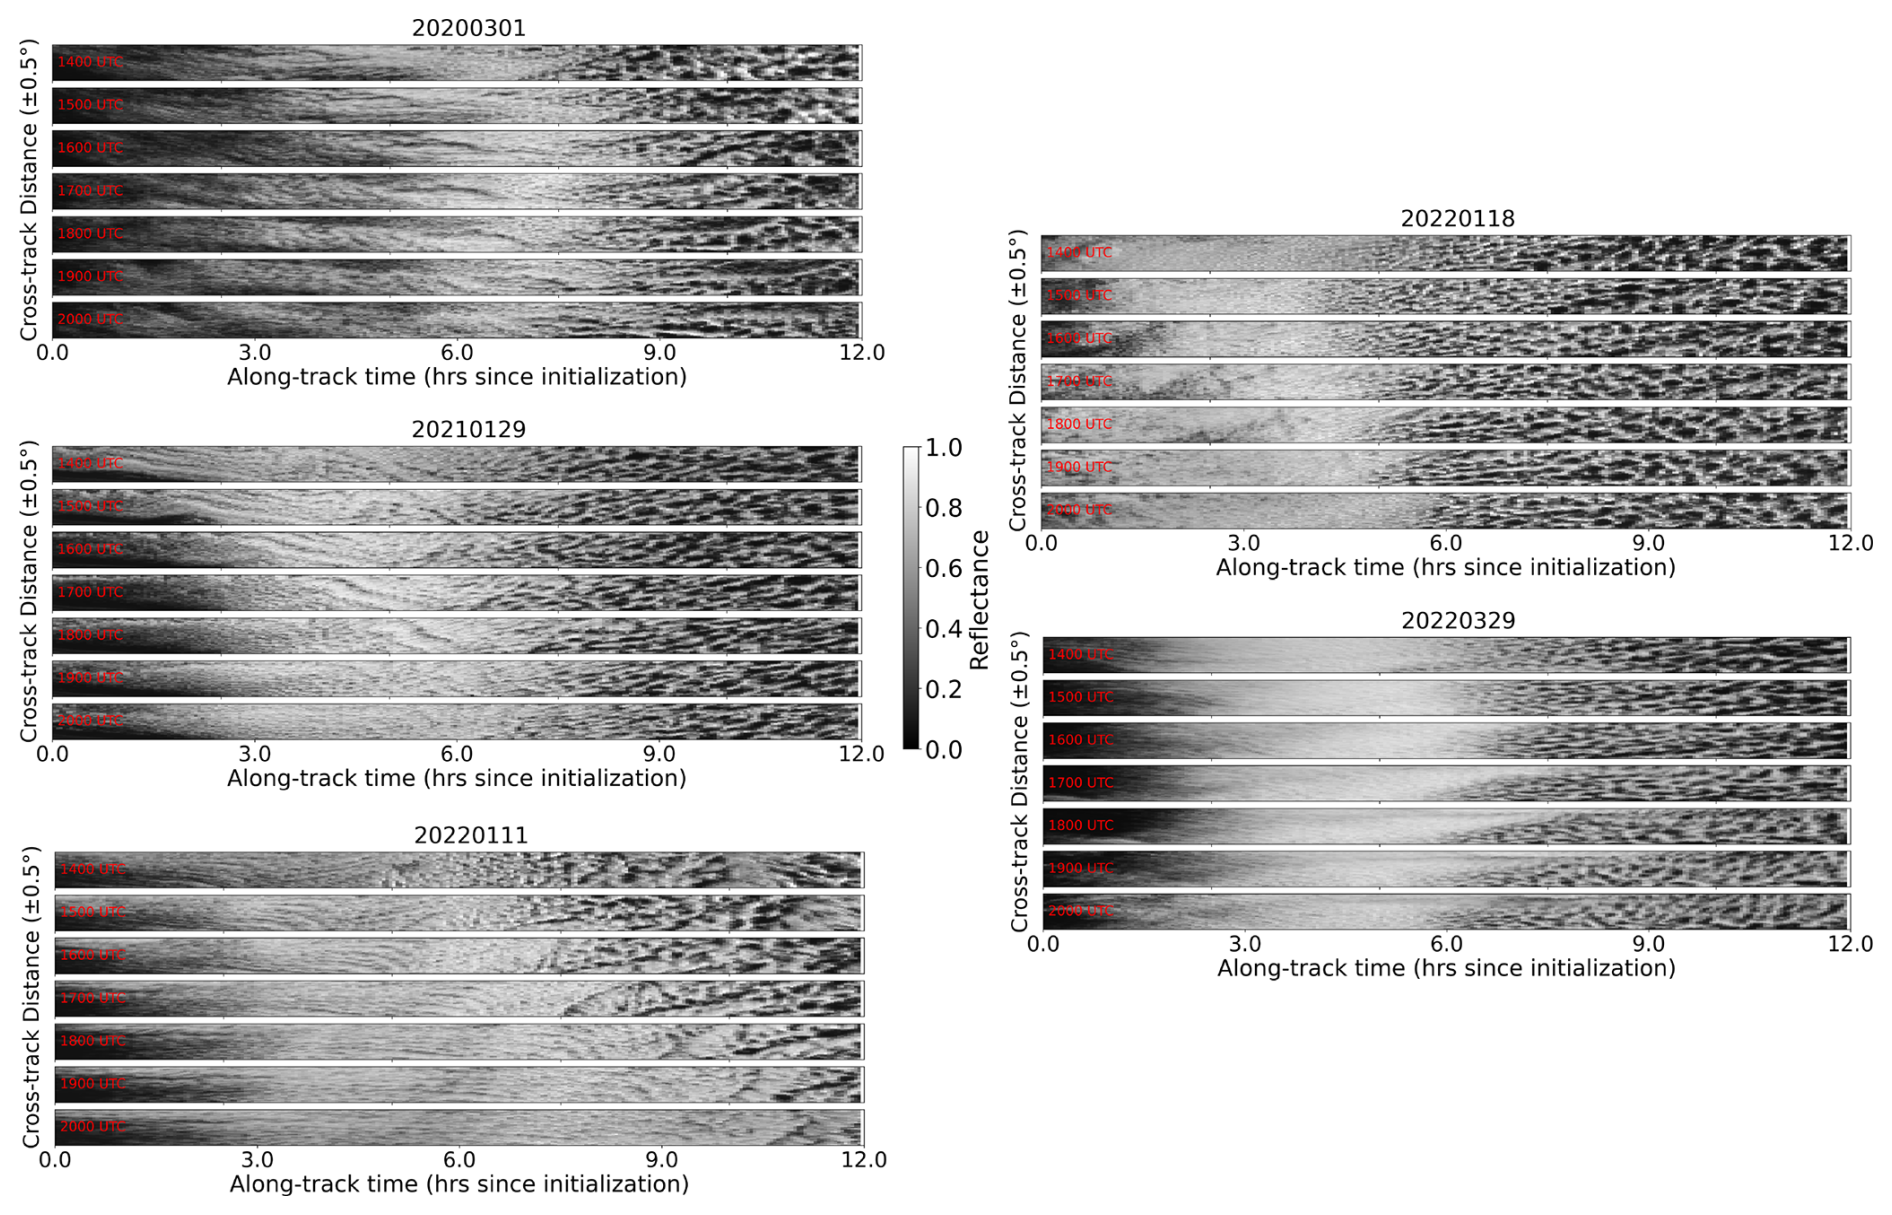
Figure 3GOES-16 images of 0.65 µm reflectance oriented along 12 h instantaneous trajectories during sunlit hours from 14:00 to 20:00 UTC, for the five MCAO events.
3.1 Large-scale meteorological evolution
The clouds embedded in mid-latitude MCAO events off the east coast of North America typically undergo substantial boundary layer deepening as air masses move offshore across the Gulf Stream (GS). This evolution is marked by increasing SST, surface buoyancy fluxes, cloud LWP, and cloud-top height (Figs. 2 and 4), as well as the emergence of frozen hydrometeors (e.g. Chellappan et al., 2024; Tornow et al., 2021). Across the five MCAO events examined here, large-scale meteorological conditions along the instantaneous trajectories exhibit similar evolutionary patterns, albeit with different magnitudes, as air masses advect offshore and downstream across the GS (Fig. 4). This behavior is consistent with the canonical evolution of boundary-layer thermodynamic and dynamical structure under MCAO conditions (Pithan et al., 2018; Abel et al., 2017; Murray-Watson et al., 2023).
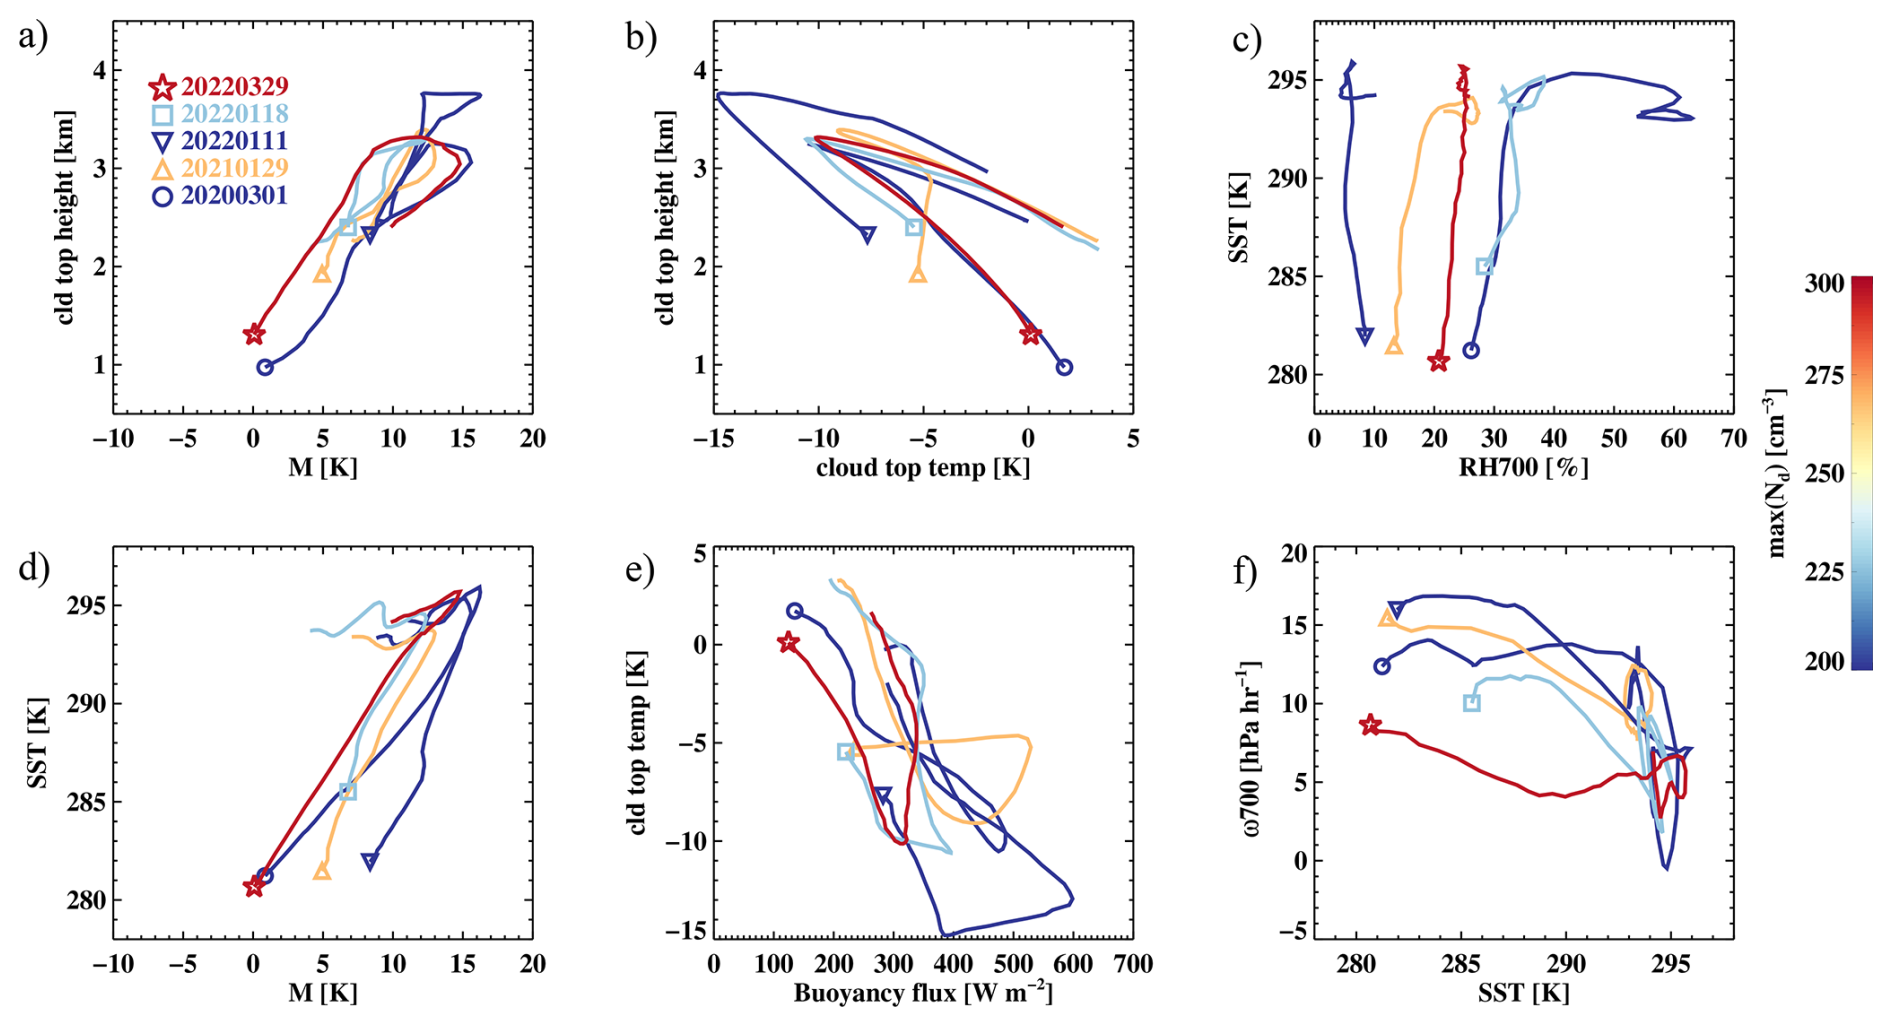
Figure 4Mean evolution in boundary layer and large-scale meteorological conditions along instantaneous trajectories through MCAO scenes in (a) cloud top height vs. M-index, (b) cloud-top height vs. cloud-top temperature, (c) SST vs. RH700, (d) SST vs. M-index, (e) cloud-top temperature vs. buoyancy flux, and (f) ω700 vs. SST spaces. Color of the trace denotes the maximum Nd of each event. Markers represent event date with its location indicating the start of the trajectory.
Specifically, this evolution is characterized by an initial increase in SST and M-index, which is associated with enhanced buoyancy fluxes and boundary-layer deepening that lift cloud tops to subfreezing temperatures (Fig. 4). As the transition progresses toward a broken cloud field, mean cloud tops subsequently become shallower and warmer. This shallowing and warming of cloud tops results from a combination of factors, including weakened buoyancy fluxes (Figs. 2 and 4) and cloud thinning induced by entrainment-mixing and precipitation. The nearly invariant cloud top temperature during the cloud-thickening stage on 29 January 2021 is likely due to trajectories being very close to land, where clouds abruptly dissipate. Large-scale subsidence and free-tropospheric RH are the key variables that distinguishing the five MCAO cases, with RH700 ranging from less than 10 %–∼40 % and ω700 spanning ∼5 to ∼15 hPa h−1 (Fig. 4). Both RH700 and ω700 remain relatively invariant as SST rapidly increases along the trajectories.
With the spatial patterns in meteorological conditions establishing the large-scale environment for cloud field evolution (Fig. 4), we next examine traces in LWP-Nd space (Fig. 5), domain-mean LWP-IWP space (Fig. 6), and the albedo vs. cloud fraction space (Fig. 8) to infer the underlying boundary layer and microphysical (liquid and mixed-phase) processes governing the cloud evolutions. We note that, in this study, LWP denotes cloud liquid water path.
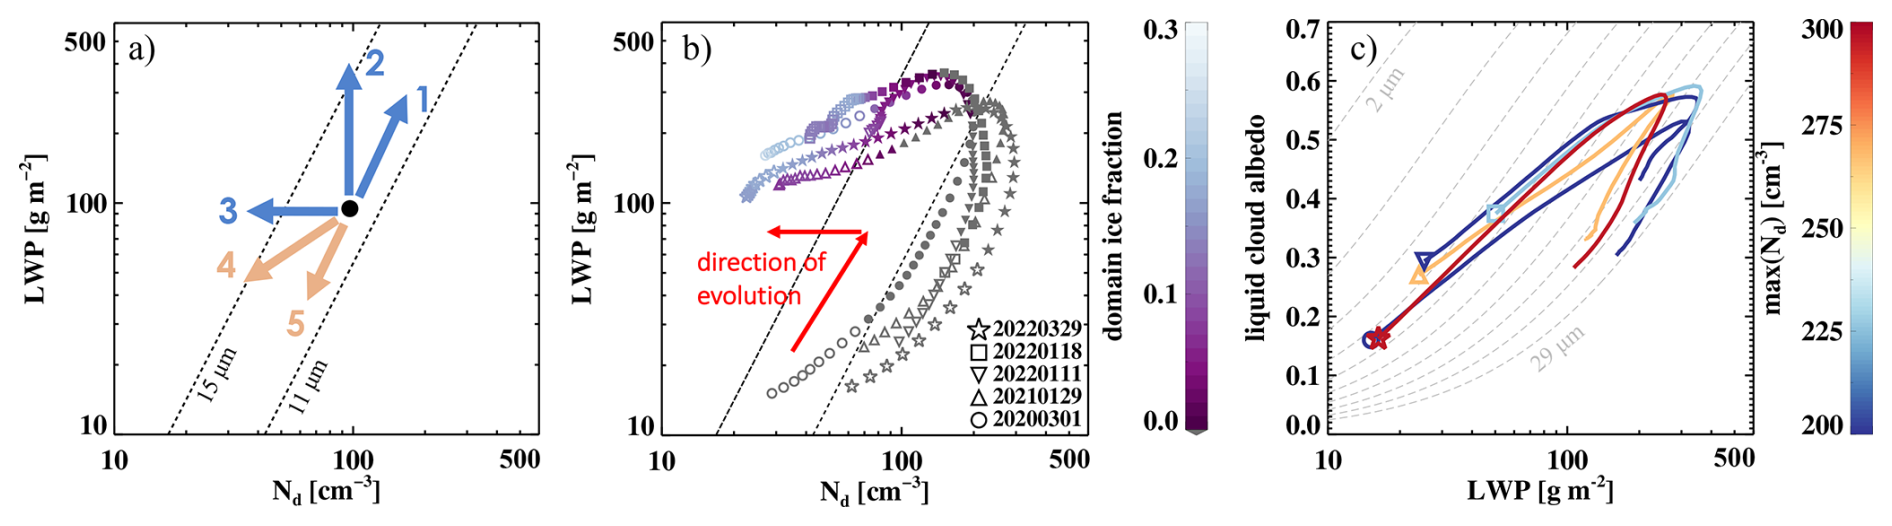
Figure 5Cloud evolution along instantaneous trajectories during MCAO, based on GOES-16 SatCORPS retrievals. (a) A diagram identifying how individual processes drive the system in LWP-Nd space ((1) activation-growth, (2) condensational-growth, (3) collision-coalescence, (4) precipitation, (5) entrainment (mixing and/or dilution)). Isolines of re of 11 and 14 µm based on an adiabatic condensation rate of are indicated in black dashed lines. (b) Mean traces, averaged across 14:00–20:00 UTC, through the scene in LWP-Nd space. Each MCAO event is labeled with different symbols, with open (filled) symbols indicating broken (overcast) conditions. Fraction of ice-phase pixels within the 1°×1° domain is indicated by color, with gray color indicating a liquid-only scene. (c) Mean traces through the scene in SatCORPS-retrieved liquid cloud albedo – LWP space. Colors of the traces indicate the maximum Nd of the event. Symbol represents event date with its location indicating the start of the trajectory. Gray, dashed isolines indicate constant re values, ranging from 2 to 29 µm (increment of 3) based on 2-stream approximation.
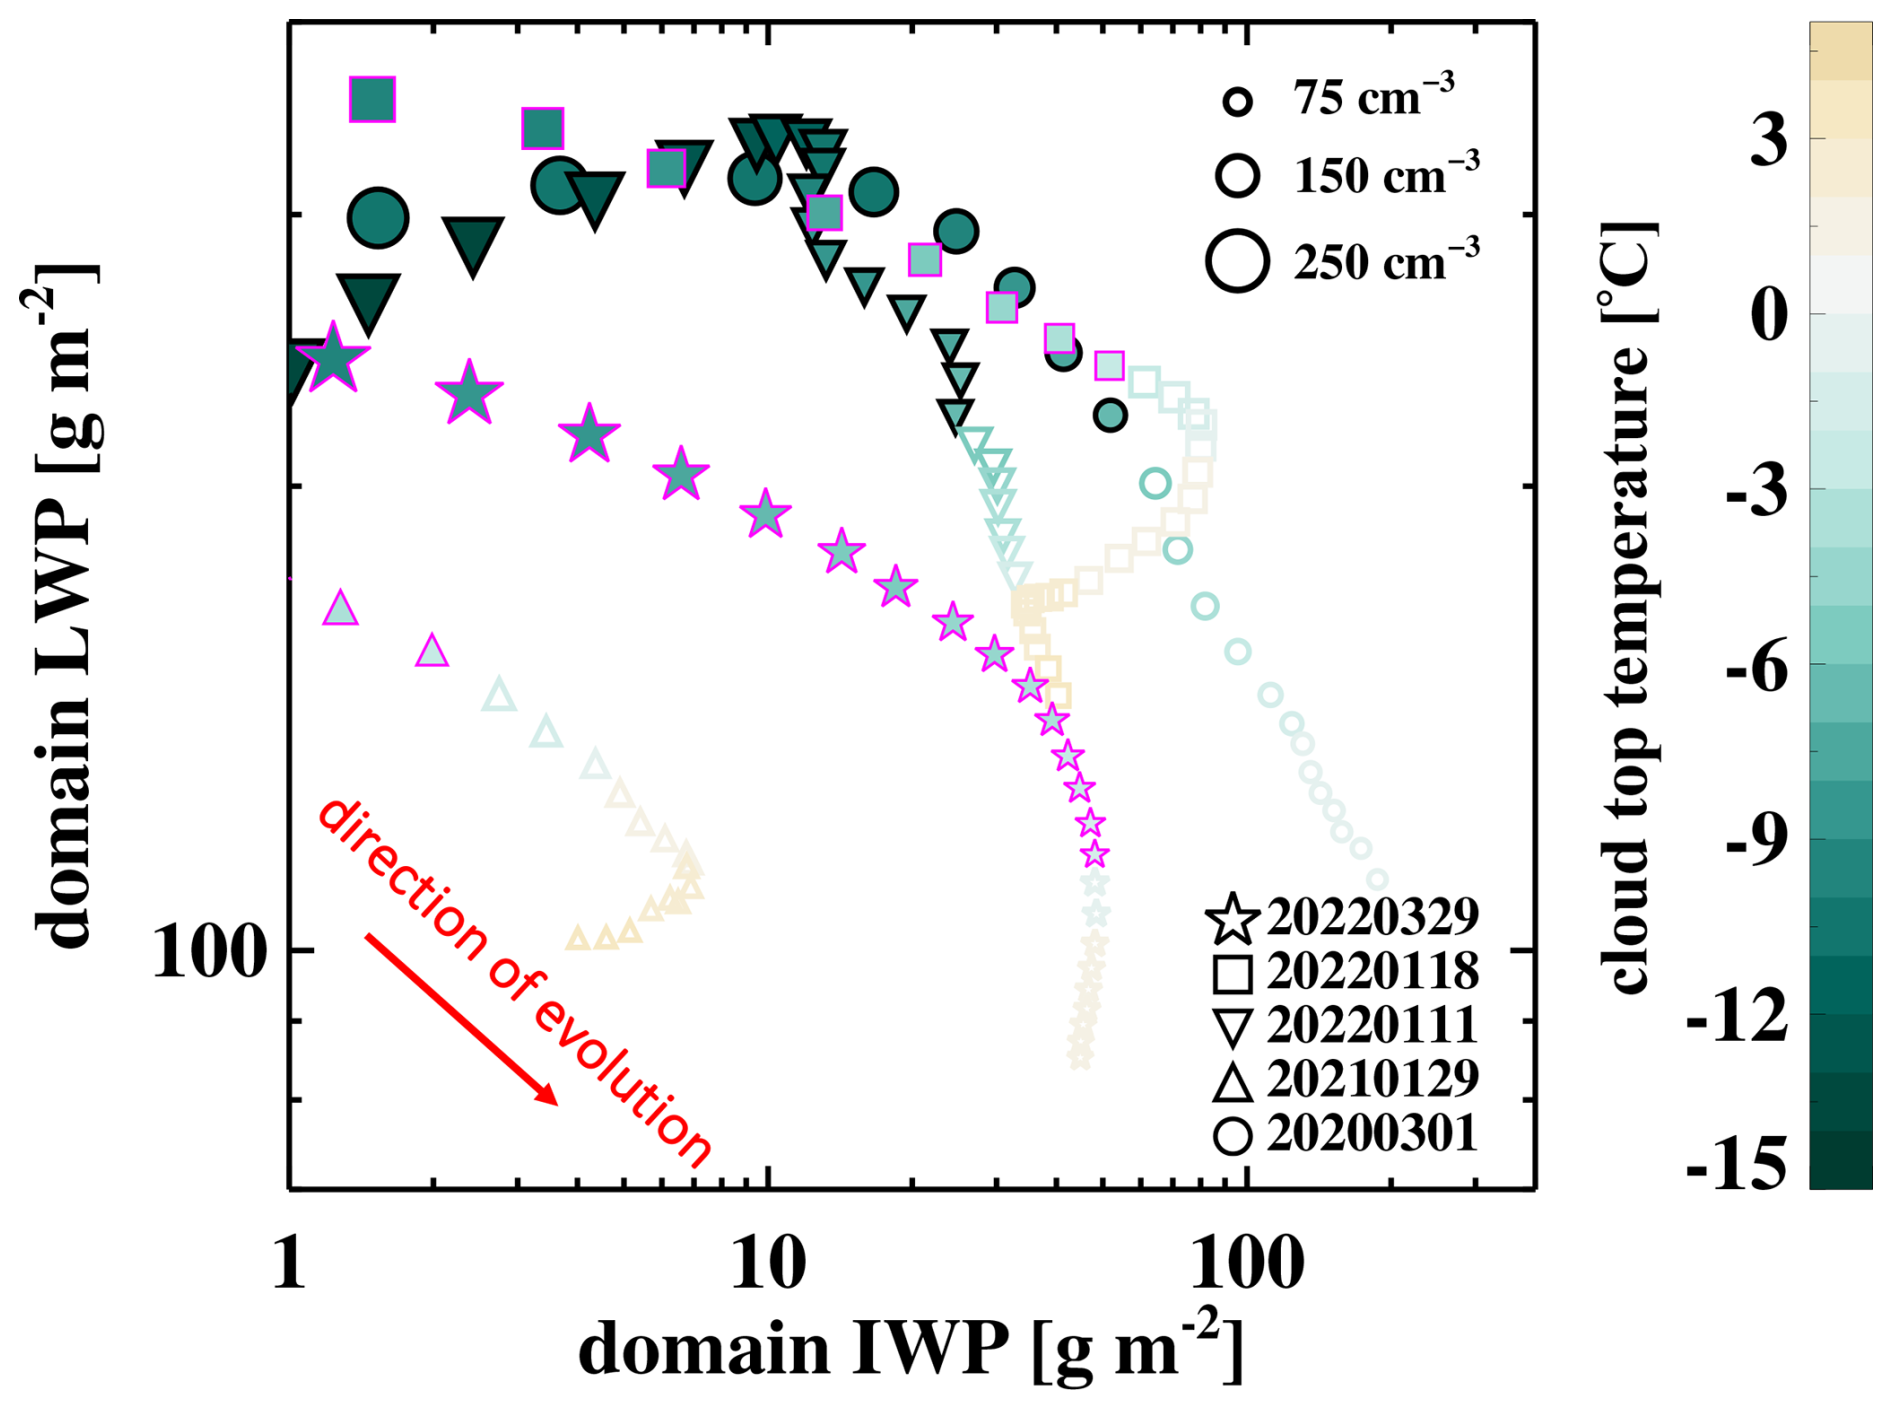
Figure 6Traces of cloud evolution since ice formation along instantaneous trajectories through MCAO scenes in domain-LWP-vs-domain-IWP space. Colors indicate cloud top temperature. Symbols represent event dates, with open (filled) symbols indicating broken (overcast) conditions and their sizes indicating Nd.
3.2 Liquid phase cloud evolution – LWP-Nd
A common feature among the five MCAO cases is the cloud thickening stage supported by the strengthening of buoyancy flux as the air moves across the GS to warmer ocean surfaces. This stage is marked by increases in both cloud LWP and droplet number concentration (Fig. 5b). A key feature of the LWP-Nd phase space is the inference of cloud microphysical processes using isolines of re calculated by invoking the (sub)adiabatic assumption for stratiform warm clouds (e.g. Glassmeier et al., 2019; Zhang et al., 2022; Goren et al., 2022). In particular, the 11 and 15 µm re isolines approximately delineate the transition from non-precipitating to precipitating regimes governed by collision-coalescence processes (Gerber, 1996; vanZanten et al., 2005). Furthermore, one can underpin cloud processes based on the directionality of a trace in this space. These include microphysical processes: (i) droplet activation, marked by increases in LWP and Nd at constant re (i.e. along an re isoline; arrow 1 in Fig. 5a); (ii) condensational growth, marked by an increase in LWP at constant Nd (arrow 2); (iii) collision-coalescence, marked by a decrease in Nd at constant LWP (arrow 3); (iv) precipitation and evaporation, marked by decreases in both Nd and LWP (arrow 4); and (v) entrainment-mixing, also marked by decreases in both Nd and LWP (arrow 5). We note that these directionalities (arrows) are intended to conceptually illustrate the characteristic effects of a given process; other processes may also contribute to or amplify the observed behavior. For example, during MCAO events, rapid expansion of the MBL can lead to dilution of liquid condensate through entrainment of drier air, reducing both LWP and Nd. In addition, mixing between the MBL and free-tropospheric air masses can further dilute cloud condensation nuclei concentrations within the MBL, thereby limiting cloud droplet formation (e.g. Tornow et al., 2022). It is evident that based on the directionality of the traces, these clouds have gone through a combination of droplet activation and condensational growth during the cloud thickening stage, as indicated by the gray symbols in Fig. 5b. These two processes (arrow 1 and 2), driven by the increasing SST and buoyancy flux, together allow the clouds to grow to their maxima in water condensate and shortwave albedo (Fig. 5b and c).
The process of water condensing onto existing droplets leads to larger cloud droplets (arrow 2), which increases the likelihood of collision-coalescence that will decrease Nd (arrow 3). This microphysical transition is evident in all 5 MCAO cases investigated here (Fig. 5b). Larger droplet sizes reduce the total water surface area available to reflect incoming photons, making clouds less reflective of shortwave radiation at a given LWP and thereby causing a steeper decline in liquid cloud albedo as LWP reduces (Fig. 5c). The breakup of overcast cloud fields, defined as cloud fraction <0.99 and indicated by the transition from filled to open markers in Fig. 5b, occurs at re between 11–15 µm for all cases, suggesting a precipitation-driven cloud breakup, except on 29 March 2022 (star markers). The event on 29 March 2022 is marked by the highest peak-Nd and the lowest peak-LWP among the 5 cases (Fig. 5b and c). The suppressed cloud thickening is in line with cloud-top entrainment feedbacks, whereby smaller cloud droplets promote entrainment-mixing by evaporating more rapidly and remaining longer within the entrainment interface layer due to reduced gravitational sedimentation, ultimately leading to reduced LWP (Wang et al., 2003; Xue and Feingold, 2006; Bretherton et al., 2007). Meanwhile, a clear delay in cloud breakup is evident on this day (Fig. 5b, star markers), suggesting a shift from precipitation-driven to entrainment-driven cloud breakup mechanisms (e.g. Yamaguchi et al., 2017; Goren et al., 2019; Christensen et al., 2020).
3.3 Mixed phase cloud evolution – LWP-IWP
As the MBL deepens and clouds thicken, cloud top height rises and temperatures drop below freezing. This often leads to the formation of frozen hydrometeors, occurring approximately when the cloud attains its maximum LWP (colored symbols in Fig. 5b). Given the formation of ice, mixed-phase processes such as the growth of ice particles at the expense of liquid condensate complicate the interpretation of trace-directionality in liquid-only phase spaces (i.e. LWP-Nd and albedo-LWP). Therefore, we further investigate the directionality of traces in the domain-LWP vs. domain-IWP space to infer mixed-phase processes. Satellite-based IWP retrievals are inherently challenging due to assumptions regarding ice particle shape and their associated radiative properties. We therefore circumvent the reliance on absolute IWP magnitudes by extracting physical information on process signatures through the “rate” of change, using the “space-time exchange” approach that leverages the broad spatial coverage of geostationary satellites at a given instance. Given that the rates at which liquid and ice evolve also depend on height, updraft speed, and ice-liquid partitioning (Ervens et al., 2011), instead of parsing individual processes, we focus on identifying fingerprints of the prevailing processes based on trace directionality in satellite-derived GV spaces.
Figure 6 zooms into the mixed-phase stage of cloud evolution, depicting traces in LWP-IWP space beginning with the first appearance of frozen hydrometeors (domain IWP>1 g m−2; colored symbols in Fig. 5b). Because GOES-16 retrievals provide only a single radiatively dominant cloud phase for each pixel, we use the combination of domain-mean LWP and IWP to characterize the “mixing state” in a spatial, rather than a column, sense. This approach exploits the rich spatial information contained in a satellite snapshot while circumventing the need for a vertically resolved mixing state. Thus, cloud evolution in domain-mean LWP-IWP GV space is interpreted in a qualitative manner, focusing on characteristic behaviors. For readability and clarity, the ranges of instantaneous trajectories (see Sect. 2.5) are shown as gray bars in Fig. S3 in the Supplement. Figures 5 and 6 share the same symbol conventions and symbol size represents Nd and color denotes cloud top temperature in Fig. 6. Among the five MCAO cases, two distinct types of traces emerge (magenta vs. black in Fig. 6): (a) in the magenta group, ice forms at the expense of liquid, while (b) in the black group, ice and liquid grow simultaneously at first, after which ice continues to grow while liquid begins to decline rapidly. A key distinction between the two groups is the ratio between changes in LWP and IWP (i.e. ) as domain IWP increases. While ice emergence begins at different LWP values, which reflects variations in large-scale meteorological conditions (Fig. 4), the inferred is nonetheless similar across the magenta group. Here, the less negative suggests the prevalence of a diffusional process where water vapor migrates from droplets to ice through evaporation and deposition, known as the Wegener–Bergeron–Findeisen (WBF) process (Wegener, 1912; Bergeron, 1935; Findeisen, 1938). In contrast, the black group is characterized by rapid liquid depletion (i.e. a more negative ) preceded by the co-growth of ice and liquid, a signature of riming where existing ice particles collect droplets through collisional freezing (Pruppacher and Klett, 2010; Tornow et al., 2021). In this regime, liquid loss is further accelerated by precipitation fallout associated with the fast sedimentation of rimed ice, as well as by dynamical feedbacks whereby latent heat release from freezing promotes cloud-top entrainment-mixing. While riming- and precipitation-driven liquid depletion likely occur in both cases of the black group, as evident by the large effective radius (Fig. 5b), dynamical feedbacks further amplify liquid loss during the 11 January 2021 event (the most negative ; downward triangles) as a result of the dry free troposphere (Fig. 4c). The existence of riming in the black group is further supported by the coldest cloud-top temperatures (symbol colors in Figs. 6 and 4b), which favor the presence of abundant supercooled liquid water, and by the highest LWP (Figs. 5b and 6), which accelerates the riming rate (Pruppacher and Klett, 2010). Furthermore, cases in the black group are the cleanest (lowest Nd) among the five (Fig. 5), which facilitates maintenance of a relatively high supersaturation, a condition that favors the co-growth of liquid and ice.
To evaluate the process fingerprints inferred from satellite snapshots, we seek in-situ evidence for distinct microphysical signatures between the black and magenta groups. A useful metric for distinguishing rapid collisional growth from slower diffusional growth of ice particles is the duration of ice-liquid coexistence, quantified as the fraction of in-cloud sampling time during which both LWC and IWC exceed 0.01 g m−3 (Kirschler et al., 2023). Falcon in-cloud sampling includes above-cloud-base (ACB), ascent, below-cloud-top (BCT), and descent legs, and the data are binned by longitude as a proxy for the stage of cloud evolution during MCAO events. Figure 7 shows that as MCAO clouds evolve farther downstream from the coast, the magenta group exhibits systematically longer ice-liquid coexistence durations than the black group, consistent with slower diffusional growth. In contrast, the shorter coexistence times in the black group suggest cloud evolution dominated by riming and rapid precipitation fallout of rimed ice.
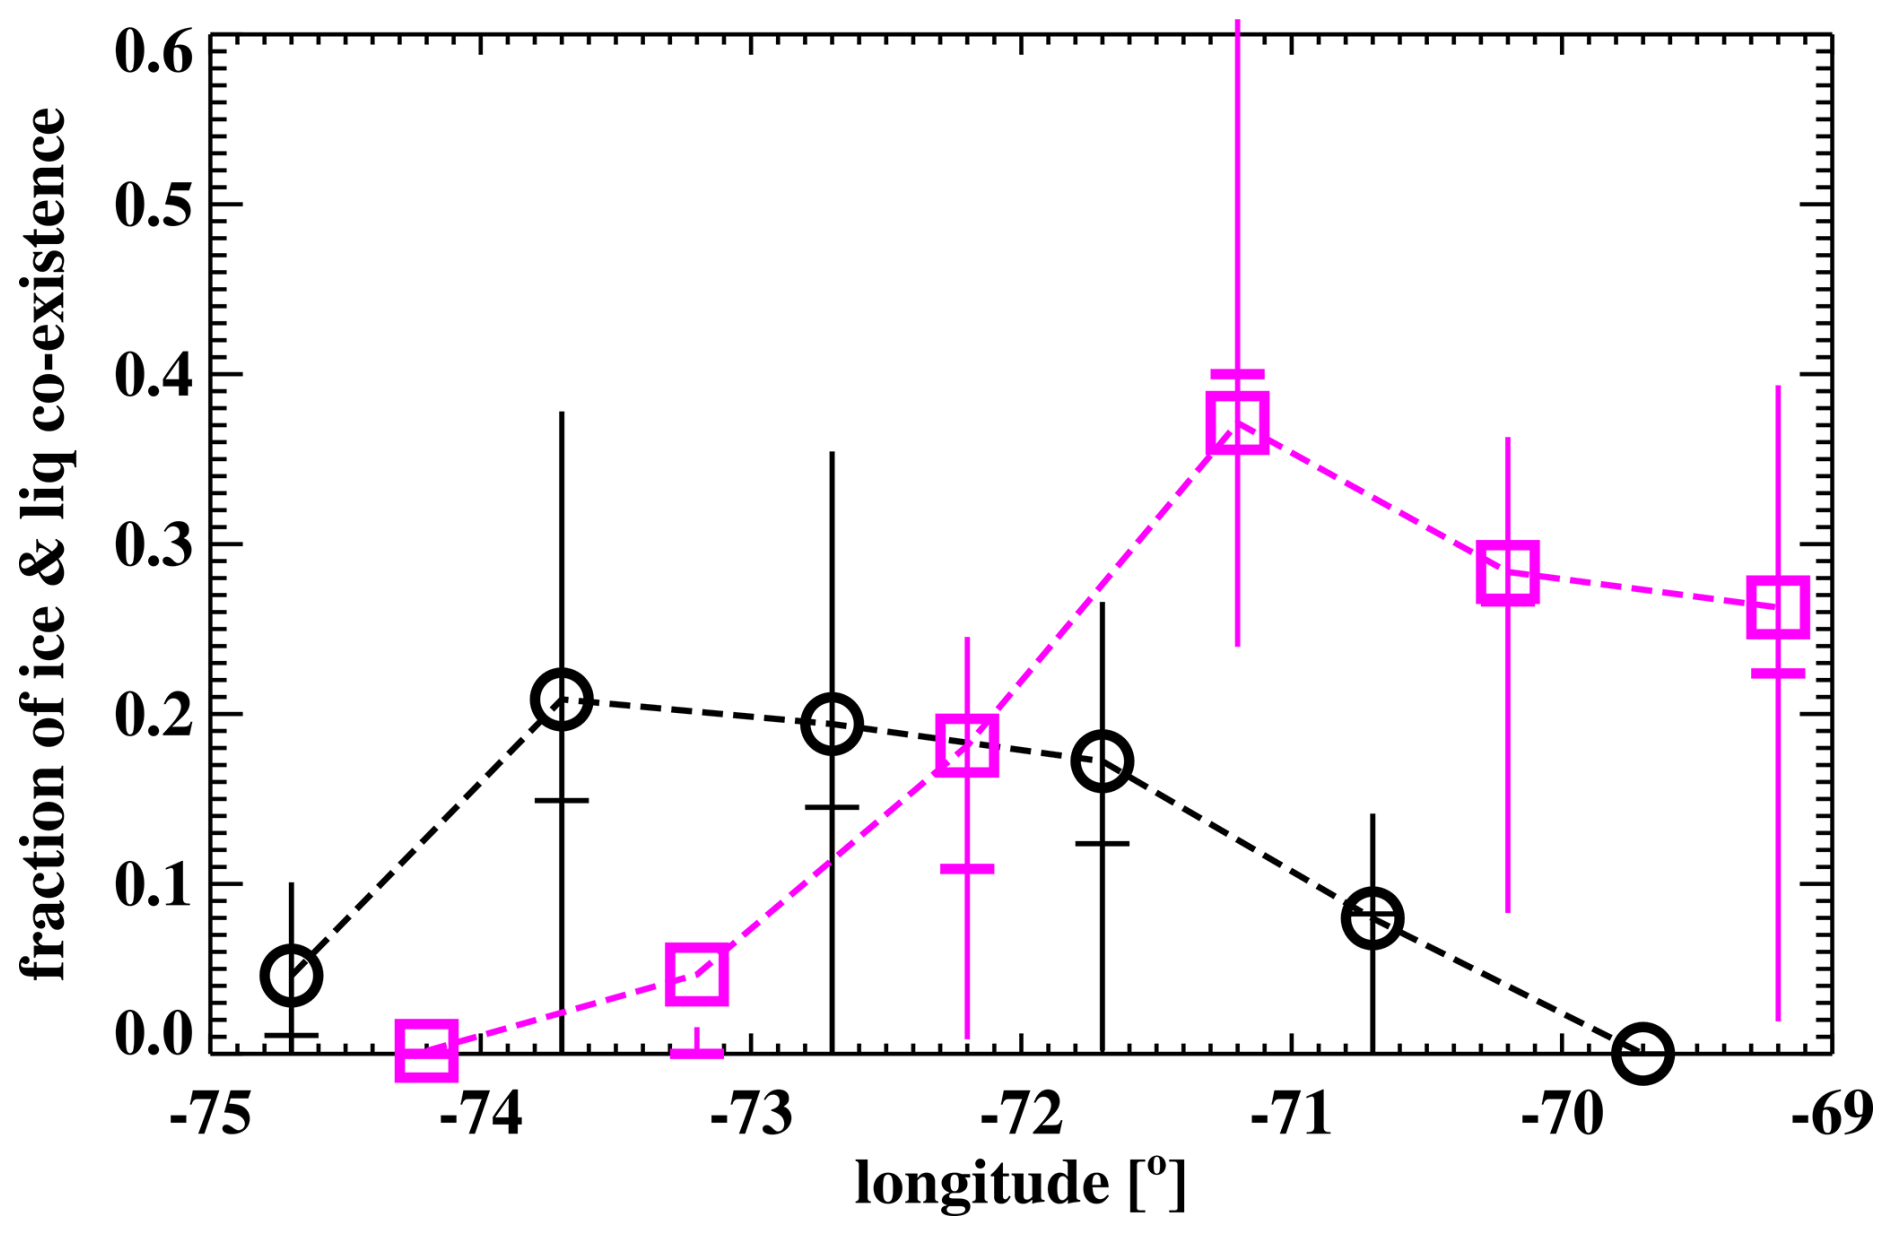
Figure 7The duration of ice-liquid coexistence, quantified as the fraction of time within each in-cloud leg (including ACB, Ascent, BCT, and Descent) during which both LWC and IWC exceed 0.01 g m−3, is shown as a function of MCAO fetch, approximated by longitude. In-situ liquid water content (LWC) and ice water content (IWC) are obtained from the FCDP and 2D-S probes onboard the Falcon aircraft. Data is binned by longitude with an increment of 1°. The black group includes events: 1 March 2020 and 11 January 2022; the magenta group includes events: 29 January 2021, 18 January 2022, and 29 March 2022. Vertical lines denote interquartile ranges, markers denote mean, and horizontal lines denote median. See text for discussion.
We note that frozen hydrometeors do not always emerge (defined as domain IWP>1 g m−2) when cloud LWP is at its highest (indicated by the change of color from gray to violet in Fig. 5b). This behavior can be partly explained by the minimum cloud-top temperature (CTT) reached as clouds deepen along their trajectories, such that the coldest minimum-CTT ( °C; 11 January 2022; Fig. 4) is associated with the earliest ice emergence, occurring while liquid mass is still growing, whereas the warmest minimum-CTT ( °C; 29 January 2021) corresponds to the latest onset of ice formation, when liquid condensate has already begun to deplete through warm precipitation and entrainment. In general, for mixed-phase clouds governed either by the slower diffusional growth process (magenta group) or the nonlinear, collisional growth process (black group), a higher LWP at the onset of ice formation typically leads to a subsequent higher IWP (Fig. 6).
Previous studies have demonstrated that secondary ice production can play a non-negligible role in shaping the evolution of MCAO clouds (e.g. Abel et al., 2017; Chellappan et al., 2024). However, because space-retrieved ice particle number concentrations are highly uncertain, we do not attempt to infer this process here. Importantly, the occurrence of secondary ice production does not affect the trace evolution in the mass-centric LWP-IWP GV space (Fig. 6). In addition, uncertainties in IWP retrievals arising from the assumed ice crystal shapes and related radiative transfer parameters prevent us from resolving small-scale structures and variations in frozen hydrometeor morphology, which may also exhibit distinct signatures across these MCAO events (e.g. Chellappan et al., 2024). In-situ aircraft measurements are clearly the best tool for that. Nevertheless, we do maintain that the domain-mean perspective (i.e. the 1° areal mean) still allows us to extract distinct characteristics of system evolution from the satellite view. We do concede, however, that our interpretations are contingent on the realism of the IWP retrievals.
3.4 Cloud breakup – albedo-cloud fraction (CF)
The shortwave albedo of a cloudy scene scales almost linearly with cloud fraction for warm clouds, especially warm stratiform clouds (Bender et al., 2011, 2017; Engström et al., 2015). It becomes increasingly nonlinear when the convective cloud regime is included (Feingold et al., 2017; McCoy et al., 2017, 2023). For mixed-phase clouds, at a given cloud fraction, the scene-albedo is governed by the liquid-ice partition of the cloud as a result of the contrasting shortwave (SW) transmissivity between ice and liquid. Therefore, the albedo-CF scaling in mixed-phase clouds is expected to be nonlinear as well. Indeed we observe nonlinear behavior as the overcast cloud field breaks up in Fig. 8, which zooms into the broken stage of MCAO evolution (beginning from the open markers). In particular, distinguishable albedo-CF scaling is evident between the magenta (triangle, star, and square markers) and black (upside-down triangle and circle markers) groups (as categorized in Fig. 6), with the black group showing a steeper scaling between albedo and cloud fraction. This behavior is consistent with the mixed-phase fingerprints identified in Fig. 6, where inferred collisional freezing in the black group helps accelerate liquid condensate depletion (the key lever on cloud albedo), leading to a rapid decline in scene albedo. In addition, the continued growth of frozen hydrometeors after breakup, evident on 1 March 2020 (Fig. 6, circle marker), further contributes to the decline in scene albedo.
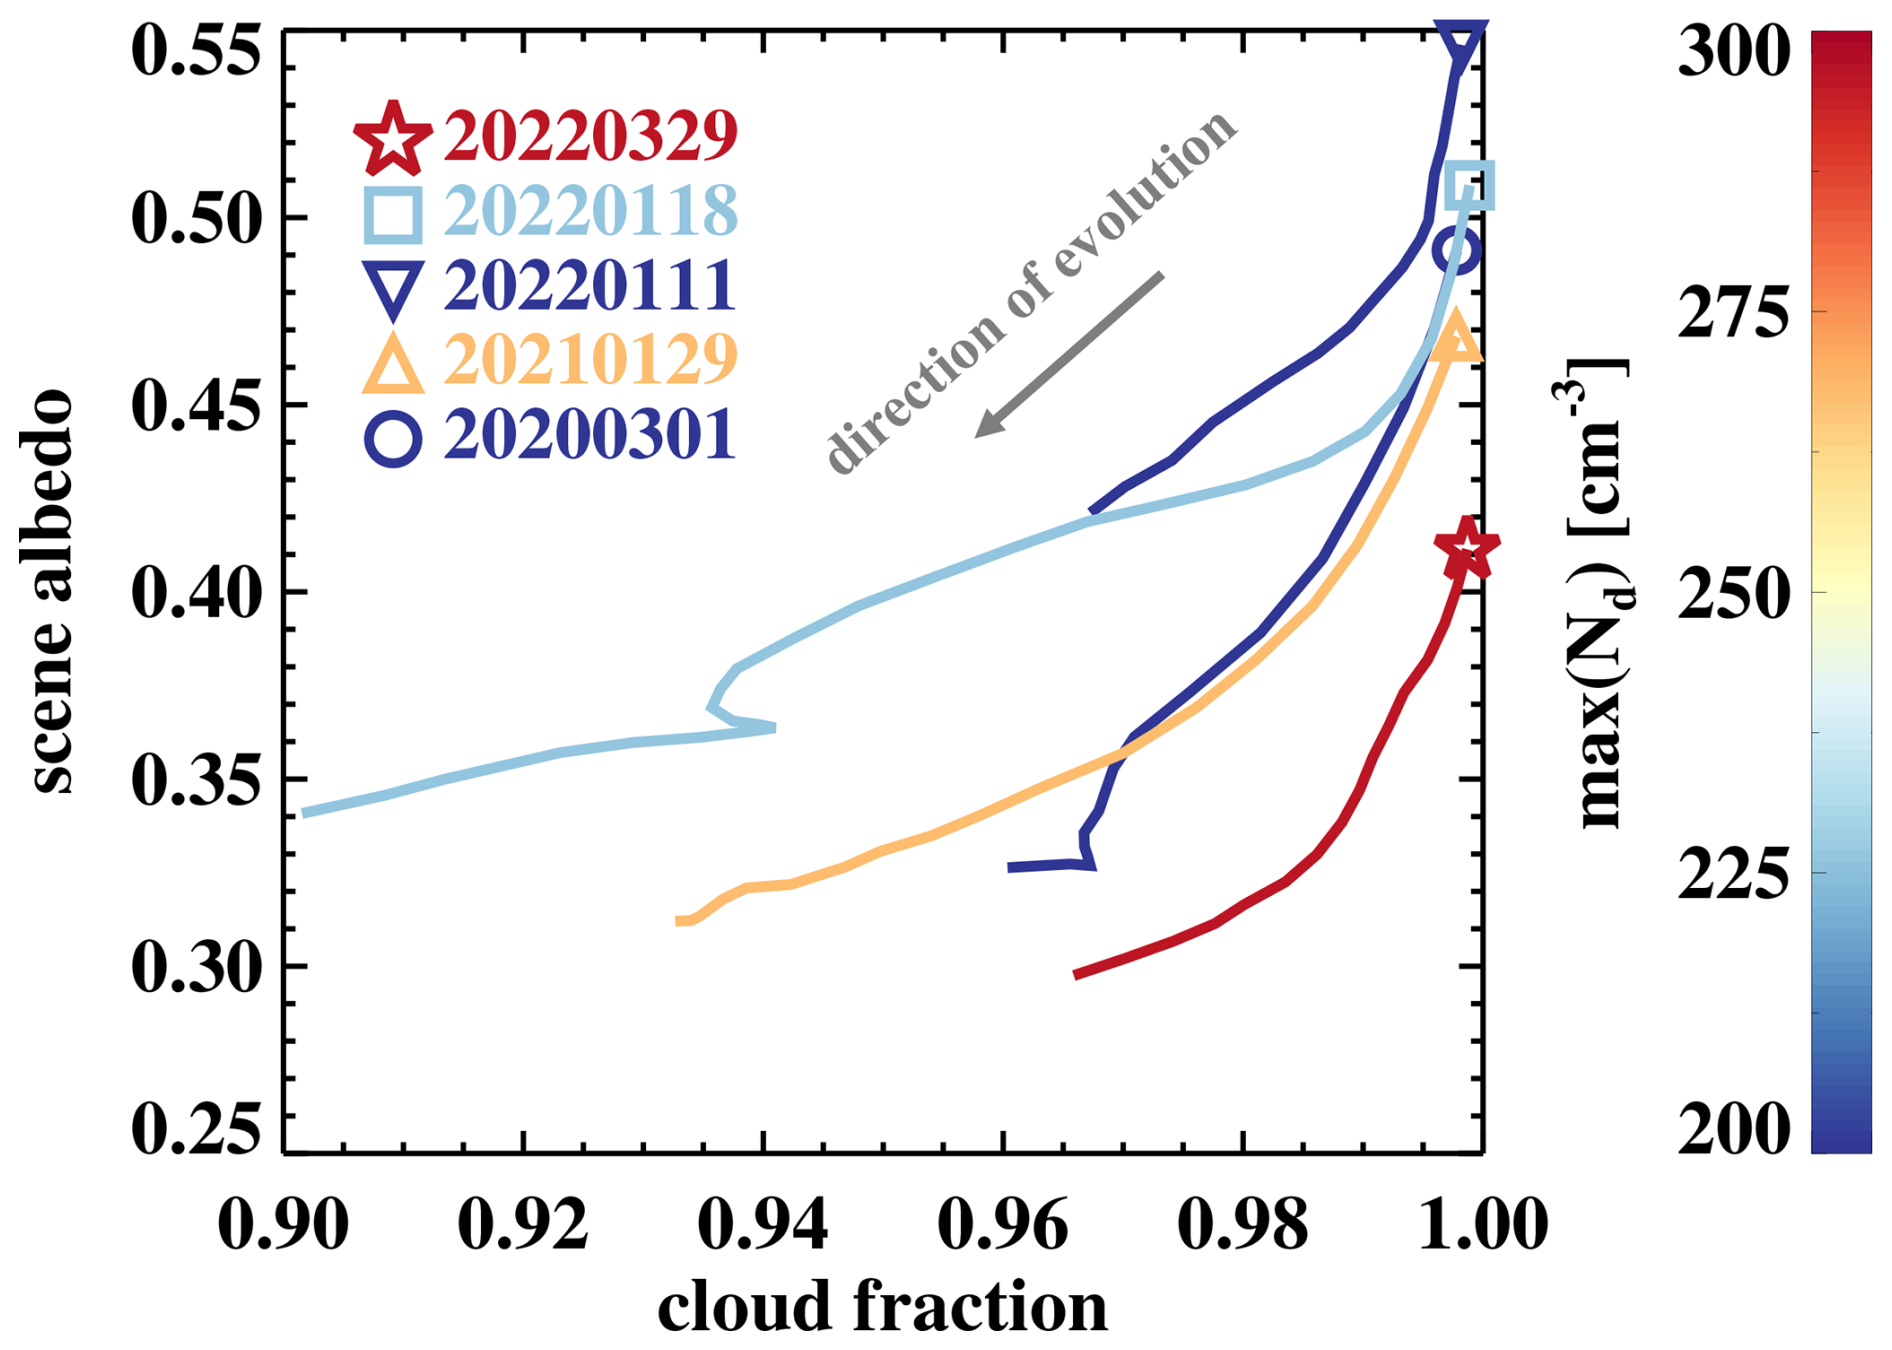
Figure 8Traces of cloud evolution since cloud breakup along instantaneous trajectories through MCAO scenes in SatCORPS-retrieved scene albedo vs. cloud fraction. Color of the trace denotes the maximum Nd of each event. Markers represent event date with open markers denoting the beginning of cloud breakup.
Contrary to the Twomey effect, where higher Nd leads to brighter clouds (Twomey, 1974, 1977), we observe the opposite behavior: scene albedo is negatively correlated with Nd, with the highest peak-Nd coinciding with the lowest albedo at cloud breakup (Fig. 8). This arises because clouds are thinner at breakup in cases with the highest peak-Nd, as reflected by the negative correlation between peak-LWP and peak-Nd (Fig. 5b). Overall, for a given cloud fraction, we find a large spread in scene albedo during the transition from an overcast cloud deck to a broken cloud field (Fig. 8). This spread is consistent with LWP acting as the primary control on cloud albedo, with additional contributions arising from differences in the amount of ice present within the cloud. As a result, the albedo-CF scaling in the presence of mixed-phase clouds appears highly nonlinear.
3.5 Evolution of cloud morphology and organization
The cloud radiative effect is closely tied to cloud morphology and the organization of the cloud field, such as the self-aggregation patterns found in trade cumulus (Bony et al., 2020; Eastman et al., 2024) and the precipitation-driven oscillation between open- and closed-cellular structures in marine stratocumulus (Wang and Feingold, 2009; Feingold et al., 2010; Glassmeier and Feingold, 2017). For marine warm clouds, distinct cloud albedo-fraction relationships have been observed for different mesoscale cloud morphologies (McCoy et al., 2023). As discussed in Sect. 3.4, this relationship is further influenced by mixed-phase microphysical processes, given the strong dependence of shortwave reflectivity on hydrometeor phase (Fig. 8). Wu and Ovchinnikov (2022) investigated the evolution of cloud morphological properties during two Arctic cold-air-outbreaks using a watershed approach applied to satellite observations, and found a convergence in the scaling between “cloud size” and “nearest-neighbor distance” (the distance between two adjacent cloud objects) as the cloud field transitions into cellular structures.
Here we examine cloud organizational evolution during the overcast-to-broken transition as described by a measure of deviation from randomness, following Koren et al. (2024). Essentially, this approach assesses the departure of a given 2D cloud field from a predefined, “perfectly” random cloud field constructed using a Bernoulli random matrix (Papoulis, 1984). Specifically, a cloud field is first converted into a binary cloud mask based on a τc threshold of 5. The distributions of cloud-chord length (analogous to cloud size) and void-chord length (analogous to nearest-neighbor distance) in this binary mask are then compared against those from a random cloud mask, which is defined by a single parameter, the observed cloud fraction calculated from the original cloud field. This comparison yields a Goodness-of-Fit score based on the Kolmogorov–Smirnov (KS) test (Justel et al., 1997), defining the deviation from randomness, which ranges from 0 (perfectly random) to 1. Figure 9 depicts the evolution in cloud organization since the transition as a function of cloud fraction, with cases colored by minimum cloud top temperature. The degree of organization (or deviation from randomness) in cloud size (or cloud-chord length) scales linearly with CF (Fig. 9a), whereas organization in void size (or nearest-neighbor distance) remains relatively invariant throughout the transition (Fig. 9b). The scaling between cloud-size organization and CF is slightly separated by cloud-top temperature, such that the coldest (and highest) cloud tops are associated with the highest degree of organization and highest scene albedo during the transition (Figs. 4, 8, and 9). Nevertheless, the degree of organization in both cloud size and void size converges to a common range of 0.3–0.4 (Fig. 9a and b), despite differences in boundary layer thermodynamic and dynamical structures, Nd, LWP, IWP, CRE, and even the visual pattern of the cloud field (Figs. 4, 5, and 9c–e). This convergence is consistent with the findings of Wu and Ovchinnikov (2022). We note a relatively large spread in cloud organization under high cloud-fraction conditions (CF>0.9; Fig. 9a–c). This is likely due to the 2°×2° cloud-mask domain, which inevitably includes a mixture of overcast and broken conditions. In addition, the τc-based cloud mask is particularly sensitive to the domain ice fraction, which varies considerably across the five events (Figs. 5 and 6).
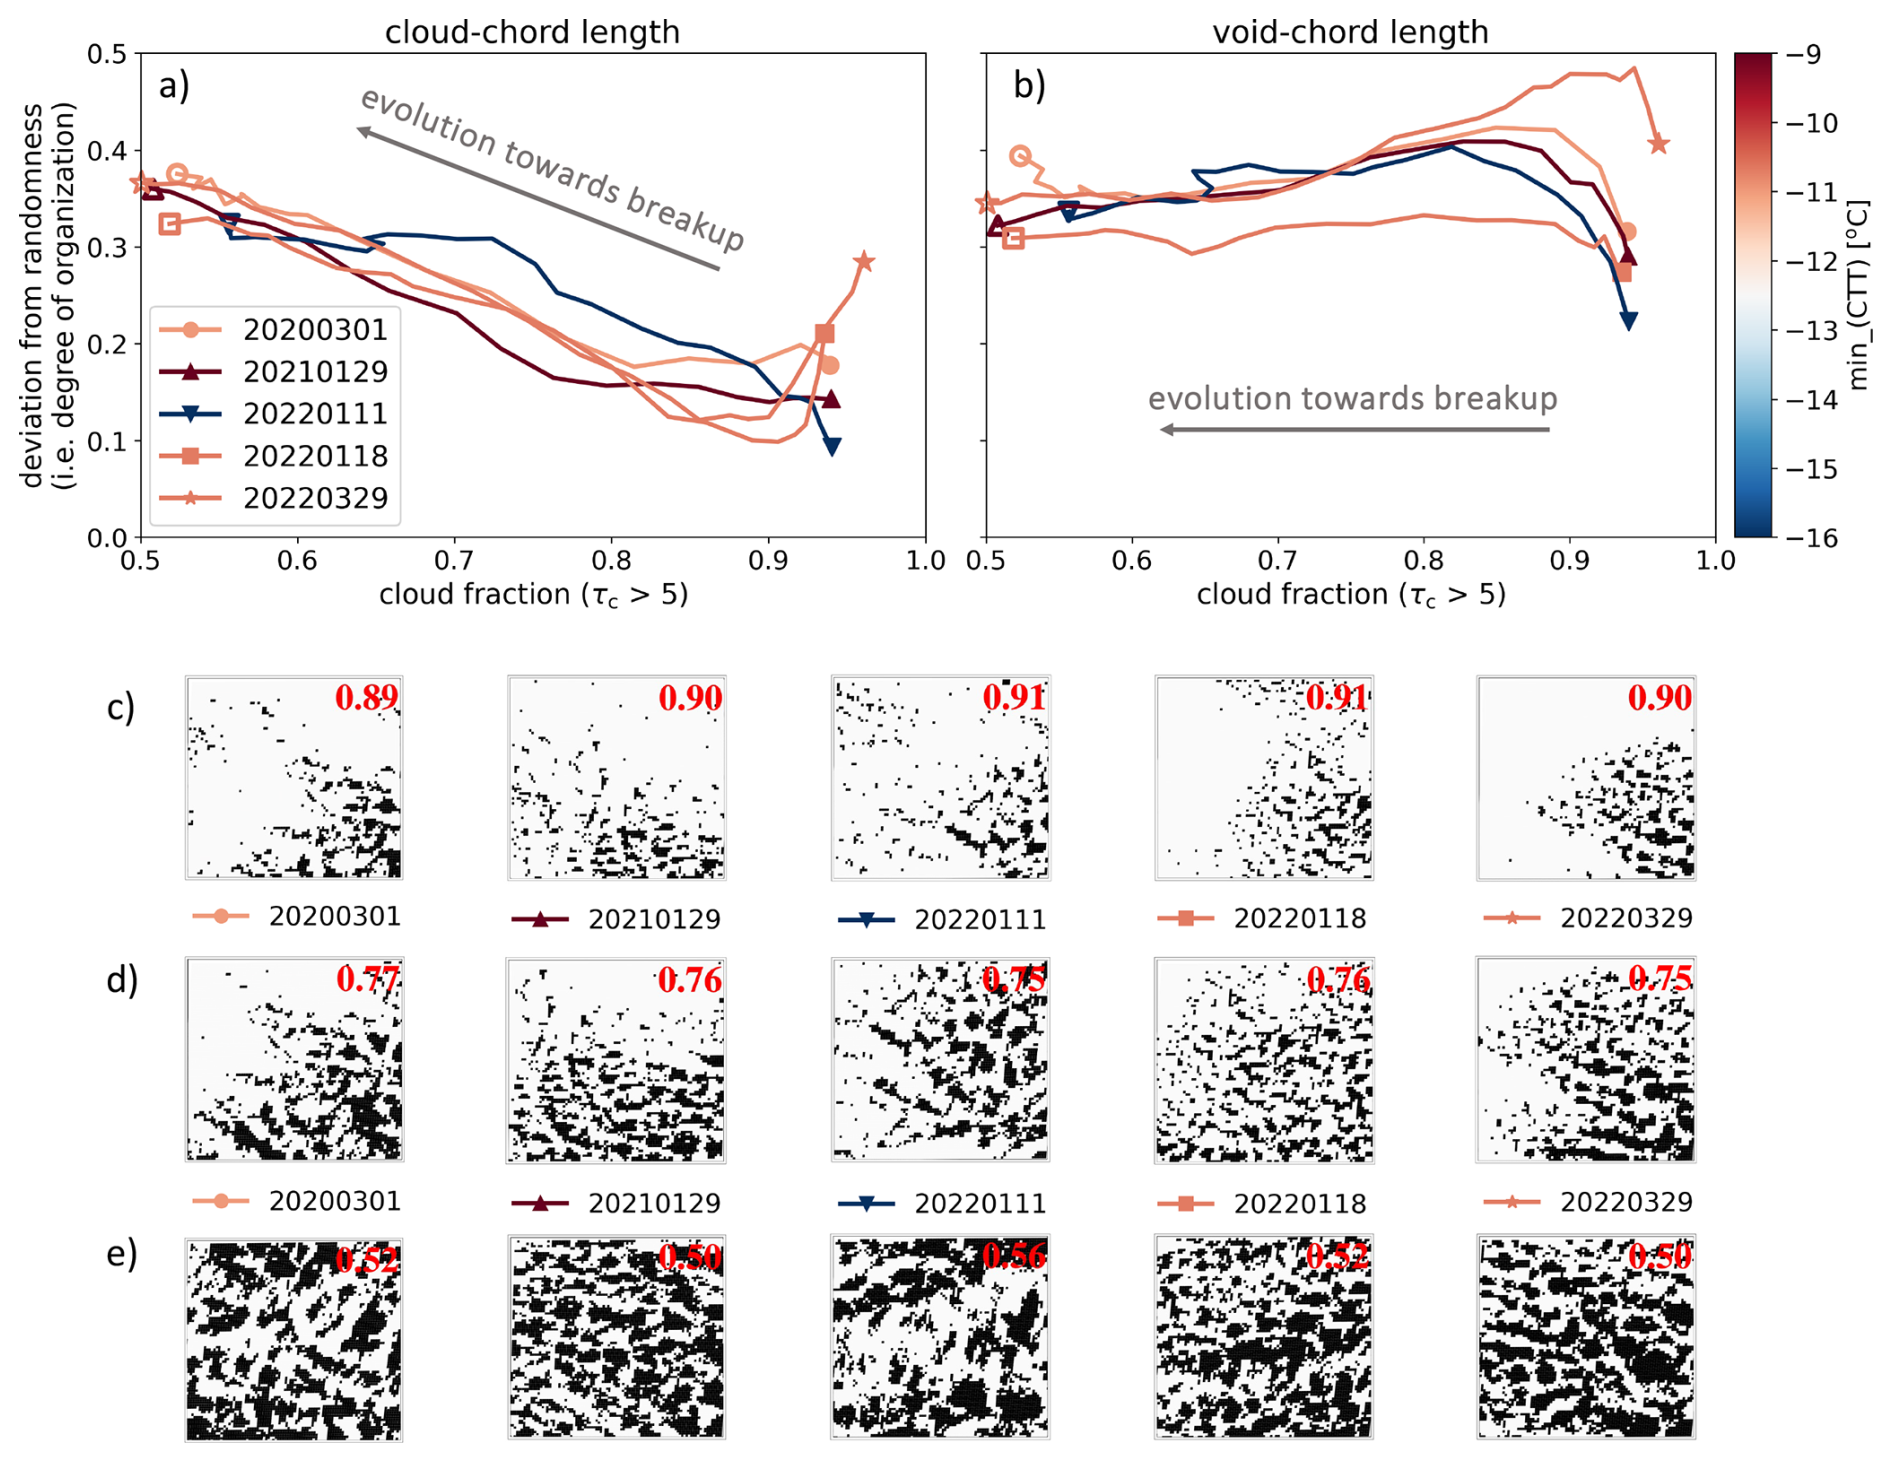
Figure 9Metrics of cloud organization as a function of cloud fraction during cloud transition from overcast to broken fields for the five MCAO events at 15:00 UTC. Color of the trace denotes the minimum cloud top temperature reached, with beginning (end) of the trace indicated by filled (open) symbols. Degree of organization is expressed in the form of deviation from randomness for (a) cloud-chord length and (b) void-chord length, following Koren et al. (2024). 2° by 2° binary cloud mask fields at cloud fraction of (c) ∼0.9, (d) ∼0.75, and (e) the end of each transition, with white areas indicating cloudy pixels, defined as GOES-16 retrieved cloud optical depth (τc)>5. Cloud fraction is noted in red on each snapshot.
3.6 Daytime variations in cloud evolution
Leveraging the high temporal coverage of GOES-16 satellite, we examine variations in cloud evolution along instantaneous trajectories between 14:00–20:00 UTC (09:00–15:00 LT) as indicators of the diurnal cycle. Figure 10 shows the traces in LWP-Nd (column A), cloud-top height vs. temperature (column B), buoyancy flux vs. M-index (column C), and 700 hPa subsidence vs. SST (column D) spaces, as a function of time (colors). Overall, traces in LWP-Nd space exhibit similar patterns of evolution throughout the day for each event (Fig. 10 column A). However, more noticeable differences emerge during the cloud-thickening stage, also evident in cloud-top characteristics (Fig. 10 column B). This diurnal variation is marked by a cyclic pattern centered around local noon, with a clear directionality in re: traces around noon (yellow-ish) tend to begin with larger re (i.e. higher LWP and lower Nd), compared to morning (green) and late afternoon (red). For a given cloud-top height, cloud tops become warmer later during sunlit hours (Fig. 10 column B). Buoyancy flux, M-index, and SST gradients along the evolution trajectories remain highly invariant throughout sunlit hours, whereas subsidence at 700 hPa varies the most across the large-scale conditions (Fig. 10 columns C and D). Together, these observations underscore the coupled roles of large-scale dynamics, cloud microphysics, and solar radiation in shaping process fingerprints during sunlit hours.
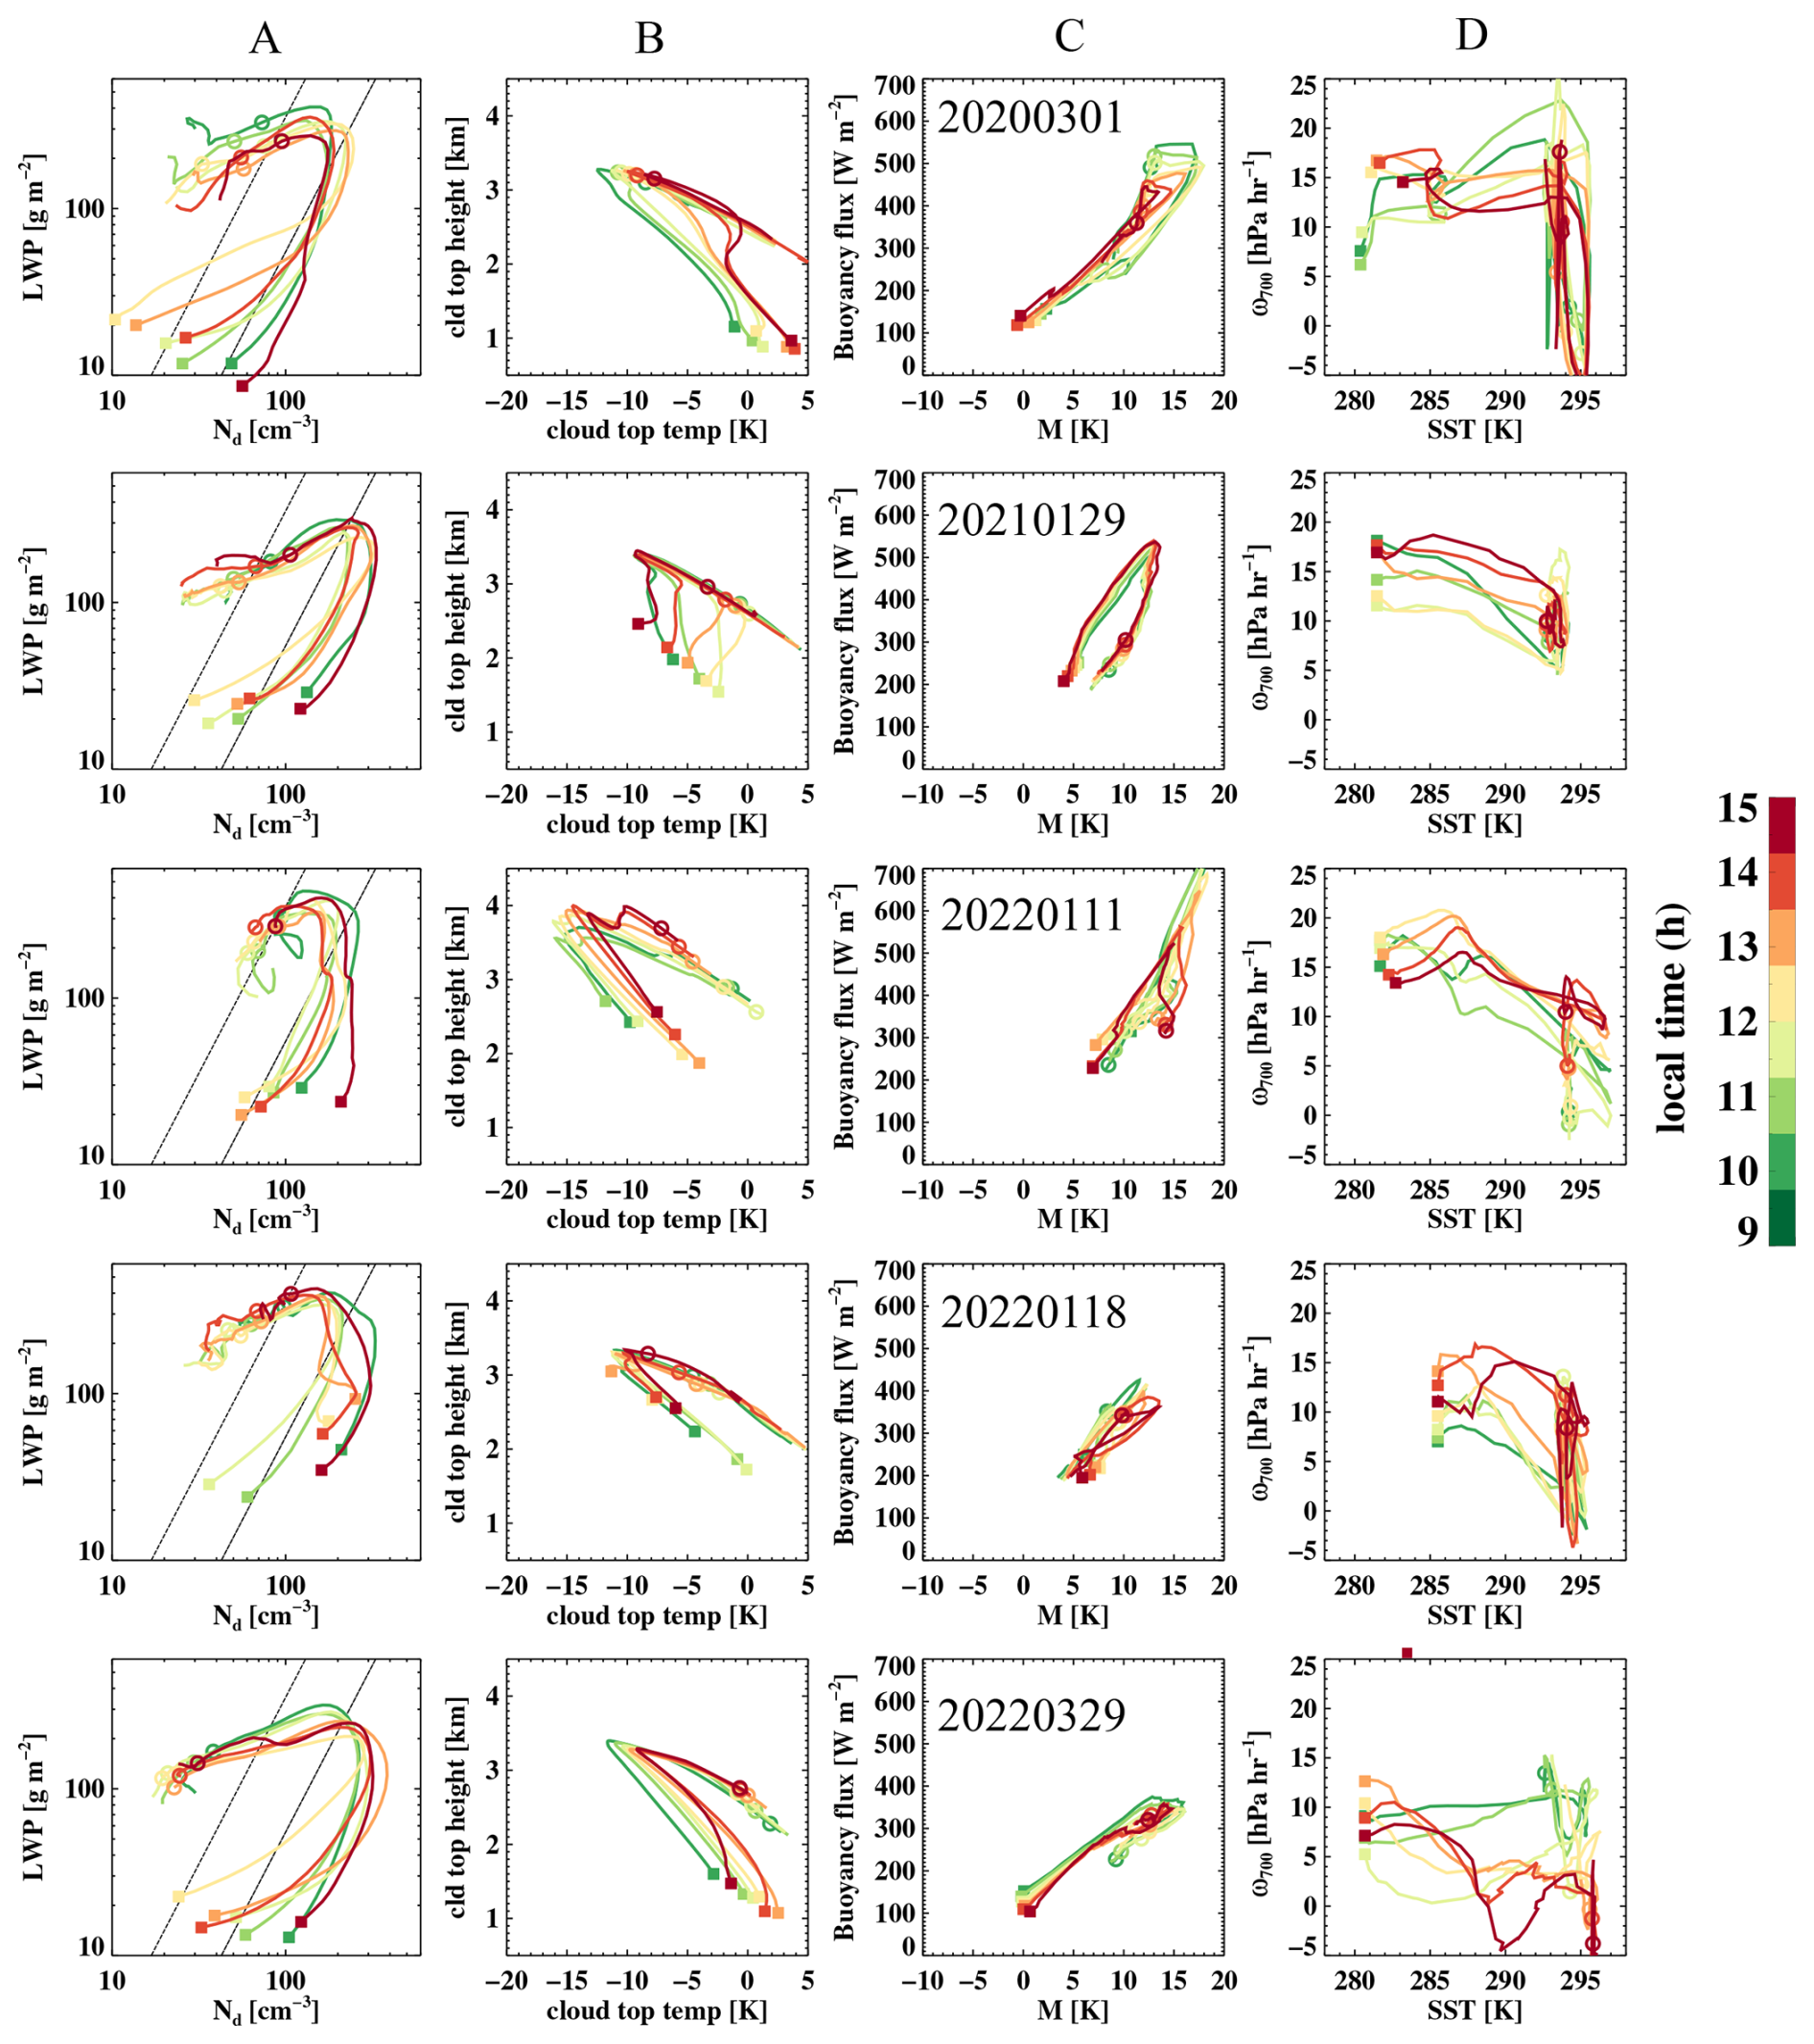
Figure 10Daytime evolution of cloud evolution traces in LWP-Nd (column A), cloud-top height vs. cloud-top temperature (column B), buoyancy flux vs. M-index (column C), and large-scale subsidence at 700 hPa (ω700) vs. SST (column D) spaces for the five MCAO events. Color of the trace denotes local time from 9 to 15, and the beginning of the trace is indicated by filled squares, with open circles representing the onset of cloud breakup (overcast-to-broken transition).
This daytime evolution in the developing stage of MCAO subsequently leads to a similar cyclic pattern in the albedo-CF scaling (not shown) and in the timing of cloud breakup (open circles in Fig. 10), with cloud transitions occurring later (or farther downstream) in near-noon traces. One possible explanation for this delayed transition is the shortwave heating induced cloud thinning (e.g. Zhang et al., 2024; Chen et al., 2024). Alternatively, this pattern may reflect a diurnally evolving aerosol size distribution in the MBL prior to cloud formation so that prescribing the observed afternoon size distribution in simulations leads to delayed precipitation (Tornow et al., 2025a).
As discussed in Sect. 2.1, SZA-dependent biases can potentially contribute to the observed diurnal variations in cloud evolution. By restricting our analysis to 09:00–15:00 LT, we largely constrain SZA-dependent biases in LWP (Smalley and Lebsock, 2023), with the aim of attributing the observed variations to physical processes rather than retrieval artifacts. That said, we acknowledge that differences between traces in the early morning (09:00 LT) or later afternoon (15:00 LT) and those near midday may still be affected by residual SZA-related artifacts.
Boundary layer clouds embedded in marine cold-air outbreaks are recognized by their characteristic morphological evolution, transitioning from overcast, stratiform clouds to broken, cumuliform cloud field downwind. The timing of this transition, along with the frequent coexistence of frozen and liquid hydrometeors, gives MCAO clouds substantial leverage in modulating the top-of-atmosphere radiation budget. This characteristic evolution remains a challenge for models to capture due to the multi-scale nature of MCAO events and the intricate interactions among hydrometeors of different phases. Airborne in-situ measurements provide rich detail on the micro- and macro-physical evolution of the cloud field, but are constrained by the limited range of deployed aircraft. Geostationary satellites, in contrast, offer extensive spatiotemporal coverage but provide only two-dimensional views, limiting their utility for process-level inference. To overcome these limitations, this study introduces an innovative “space-time exchange” framework that generates instantaneous trajectories from individual satellite snapshots (Figs. 1–3). These trajectories are then used to infer the warm- and mixed-phase microphysical processes governing the cloud transition by tracking evolution in carefully selected geophysical variable spaces that target liquid-phase, mixed-phase, and cloud breakup, individually.
Using this framework, we investigate five MCAO events, all sampled by the NASA ACTIVATE field campaign between 2020–2022. The findings on the processes influencing cloud evolution are summarized as follows:
-
Clear directionality of traces in LWP-Nd space indicate a progressing dominance of different warm-phase processes, from droplet activation to condensational growth to collision-coalescence, during the cloud-thickening stage (Fig. 5).
-
Setting aside differences in large-scale meteorological conditions, a negative correlation between peak-LWP and peak-Nd is observed across the five cases, consistent with entrainment and dilution in non-precipitating warm clouds. Elevated Nd also leads to a delayed cloud transition during the 29 March 2022 event (Fig. 5).
-
Fingerprints of two distinct mixed-phase processes are identified using the LWP-IWP space: (i) a diffusional process that migrates vapor from liquid to ice depletes water condensate at a slow, steady pace; and (ii) a collisional freezing process that initiates rapid water depletion through precipitation and dynamical feedbacks (e.g. entrainment-mixing) (Fig. 6).
-
During cloud breakup, we identify two distinct albedo-cloud-fraction scalings across the five events, consistent with the identified mixed-phase process signatures, with the group characterized by collisional freezing exhibiting a steeper decline in albedo for a given decrease in cloud fraction (Fig. 8).
-
Cloud organizational evolution, depicted in the form deviation from randomness, converges among the five cases, despite differences in cloud micro- and macro-physical properties and in boundary layer characteristics (Fig. 9).
-
Daytime variations in cloud evolution indicate a cyclic pattern centered around noon, at which cloud transition is marked by delayed breakup driven by evidence of entrainment processes (Fig. 10).
These findings stress the critical need to accurately represent both warm- and cold-phase microphysical processes in models, in order to characterize the intricate cloud processes shaping cloud transition during mixed-phase MCAO events, whose potential role as a negative cloud-feedback agent remains uncertain.
The novel “space-time exchange” framework presented here, combined with the selected GV spaces, has the potential to be applied in Lagrangian modeling and model-observation synergy studies to benchmark process fingerprints using parcel models, or to characterize process importance using perturbation experiments. A follow-on study is planned to apply this framework to Lagrangian large-eddy simulations of the five selected MCAO events that are particularly well suited for Lagrangian modeling (Tornow et al., 2025a, b). Moreover, a hierarchy of modeling studies (e.g. Chen et al., 2022; Li et al., 2022, 2023; Tang et al., 2024; Tornow et al., 2021, 2023) conducted as part of the NASA ACTIVATE mission could be gathered and compared within the same geophysical variable spaces illustrated in this work, enabling an assessment of the fidelity of their process representations. Beyond the field campaign period, this framework also provides a means to characterize long-term trends in MCAO cloud evolution and radiative impacts over this region, in light of substantial regional changes in aerosol loading (Sorooshian et al., 2020b) and SST in recent decades (Park et al., 2024).
Leveraging the persistent large-scale meteorological gradients that characterize MCAO events, we have demonstrated the effectiveness of the “space-time exchange” approach by exploiting the extensive spatial coverage of satellite observations. While unambiguous parsing of processes remains challenging with this method, it effectively captures fingerprints of dominant processes over the spatial dimension of satellite snapshots and underscores the potential of “space-time exchange” for process inference (Feingold et al., 2025). The inferred process fingerprints serve as an additional line of evidence from the satellite perspective, complementing existing modeling and in-situ characterizations of mixed-phase processes during mid-latitude MCAOs (Tornow et al., 2021, 2022, 2023, 2025a, b; Chen et al., 2022; Li et al., 2022, 2023; Tang et al., 2024; Chellappan et al., 2024).
The ACTIVATE data, including GOES-16 retrievals and in-situ cloud probe measurements, are are publicly archived on NASA's Atmospheric Science Data Center (ASDC) Distributed Active Archive Center (DAAC; https://doi.org/10.5067/SUBORBITAL/ACTIVATE/DATA001, Sorooshian et al., 2020a) and are accessible via https://asdc.larc.nasa.gov/project/ACTIVATE, last access: December 2025. The fifth-generation ECMWF (ERA5) atmospheric reanalyses of the global climate data were obtained from the Copernicus Climate Change Service at https://cds.climate.copernicus.eu/, last access: December 2025 (Hersbach et al., 2020), and are accessible via https://doi.org/10.24381/cds.6860a573 (Hersbach et al., 2023a) and https://doi.org/10.24381/cds.f17050d7 (Hersbach et al., 2023b).
The supplement related to this article is available online at https://doi.org/10.5194/acp-26-6015-2026-supplement.
JZ conceived the ideas, carried out the data analysis, and wrote the first draft. DP provided the GOES-16 cloud retrievals. TD provided the code for characterizing cloud organization. All authors contributed to writing and editing.
At least one of the (co-)authors is a member of the editorial board of Atmospheric Chemistry and Physics. The peer-review process was guided by an independent editor, and the authors also have no other competing interests to declare.
Publisher's note: Copernicus Publications remains neutral with regard to jurisdictional claims made in the text, published maps, institutional affiliations, or any other geographical representation in this paper. The authors bear the ultimate responsibility for providing appropriate place names. Views expressed in the text are those of the authors and do not necessarily reflect the views of the publisher.
The work was funded by ACTIVATE, a NASA Earth Venture Suborbital-3 (EVS-3) investigation funded by NASA's Earth Science Division and managed through the Earth System Science Pathfinder Program Office. Graham Feingold and Jianhao Zhang acknowledge support from the NASA ACTIVATE program under Reimbursable Agreement number NNL23OB04A. David Painemal also acknowledges the support of the CERES program. Armin Sorooshian acknowledges support from NASA grant no. 80NSSC19K0442. Tom Dror was supported by the CIRES Visiting Fellows Program and the NOAA Cooperative Agreement with CIRES, NA17OAR4320101. Jung-Sub Lim acknowledges support from the NOAA Cooperative Agreement with CIRES, NA17OAR4320101, and the U.S. Department of Commerce, Earth's Radiation Budget grant, NOAA CPO Climate & CI #03-01-07-001. We thank Florian Tornow and two other anonymous reviewers for their insights and suggestions for improving our manuscript.
This research has been supported by the National Aeronautics and Space Administration (grant nos. NNL23OB04A and 80NSSC19K0442) and the National Oceanic and Atmospheric Administration (grant nos. NA17OAR4320101, NA17OAR4320101, and 03-01-07-001).
This paper was edited by Ivy Tan and reviewed by Florian Tornow and two anonymous referees.
Abel, S. J., Boutle, I. A., Waite, K., Fox, S., Brown, P. R. A., Cotton, R., Lloyd, G., Choularton, T. W., and Bower, K. N.: The role of precipitation in controlling the transition from stratocumulus to cumulus clouds in a Northern Hemisphere cold-air outbreak, J. Atmos. Sci., 74, 2293–2314, https://doi.org/10.1175/JAS-D-16-0362.1, 2017. a, b, c, d, e
Albrecht, B. A., Bretherton, C. S., Johnson, D., Scubert, W. H., and Frisch, A. S.: The Atlantic Stratocumulus Transition Experiment – ASTEX, B. Am. Meteorol. Soc., 76, 889–904, https://doi.org/10.1175/1520-0477(1995)076<0889:TASTE>2.0.CO;2, 1995. a
Baker, B. and Lawson, R. P.: Improvement in determination of ice water content from two-dimensional particle imagery. Part I: Image-to-mass relationships, J. Appl. Meteorol., 45, 1282–1290, https://doi.org/10.1175/JAM2398.1, 2006. a
Bellouin, N., Quaas, J., Gryspeerdt, E., Kinne, S., Stier, P., Watson-Parris, D., Boucher, O., Carslaw, K., Christensen, M., Daniau, A.-L., Dufresne, J.-L., Feingold, G., Fiedler, S., Forster, P., Gettelman, A., Haywood, J., Lohmann, U., Malavelle, F., Mauritsen, T., and Stevens, B.: Bounding global aerosol radiative forcing of climate change, Rev. Geophys., 58, e2019RG000660, https://doi.org/10.1029/2019RG000660, 2020. a
Bender, F. A.-M., Charlson, R. J., Ekman, A. M. L., and Leahy, L. V.: Quantification of monthly mean regional scale albedo of marine stratiform clouds in satellite observations and GCMs, J. Appl. Meteorol., 50, 2139–2148, https://doi.org/10.1175/JAMC-D-11-049.1, 2011. a
Bender, F. A.-M., Engström, A., Wood, R., and Charlson, R. J.: Evaluation of hemispheric asymmetries in marine cloud radiative properties, J. Climate, 30, 4131–4147, https://doi.org/10.1175/JCLI-D-16-0263.1, 2017. a
Bennartz, R.: Global assessment of marine boundary layer cloud droplet number concentration from satellite, J. Geophys. Res.-Atmos., 112, https://doi.org/10.1029/2006JD007547, 2007. a
Bergeron, T.: On the physics of cloud and precipitation, in: Proceedings of the 5th Assembly of the International Union of Geodesy and Geophysics (IUGG), Vol. 2, Lisbon, 156–178, 1935. a
Boltzmann, L.: Ueber die Eigenschaften monozyklischer und damit verwandter Systeme des zweiten Hauptsatzes der Wärmetheorie, Wissenschaftliche Abhandlungen, 3, 122–152, 1884. a
Bony, S., Schulz, H., Vial, J., and Stevens, B.: Sugar, gravel, fish, and flowers: dependence of mesoscale patterns of trade wind clouds on environmental conditions, Geophys. Res. Lett., 47, https://doi.org/10.1029/2019GL085988, 2020. a
Bretherton, C. S.: A conceptual model of the stratocumulus-trade-cumulus transition in the subtropical oceans, in: Proceeding of the 11th International Conference on Clouds and Precipitation, Vol. 1, 374–377, 1992. a
Bretherton, C. S., Blossey, P. N., and Uchida, J.: Cloud droplet sedimentation, entrainment efficiency, and subtropical stratocumulus albedo, Geophys. Res. Lett., 34, L03813, https://doi.org/10.1029/2006GL027648, 2007. a
Brümmer, B.: Boundary-layer modification in wintertime cold-air outbreaks from the Arctic sea ice, Bound.-Lay. Meteorol., 80, 109–125, https://doi.org/10.1007/BF00119014, 1996. a
Brümmer, B.: Roll and cell convection in wintertime Arctic cold-air outbreaks, J. Atmos. Sci., 56, 2613–2636, https://doi.org/10.1175/1520-0469(1999)056<2613:RACCIW>2.0.CO;2, 1999. a
Chellappan, S., Zuidema, P., Kirschler, S., Voigt, C., Cairns, B., Crosbie, E. C., Ferrare, R., Hair, J., Painemal, D., Shingler, T., Shook, M., Thornhill, K. L., Tornow, F., and Sorooshian, A.: Microphysical evolution in mixed-phase midlatitude marine cold-air outbreaks, J. Atmos. Sci., 81, 1725–1747, https://doi.org/10.1175/JAS-D-23-0203.1, 2024. a, b, c, d, e, f, g, h, i, j
Chen, J., Wang, H., Li, X., Painemal, D., Sorooshian, A., Thornhill, K. L., Robinson, C., and Shingler, T.: Impact of meteorological factors on the mesoscale morphology of cloud streets during a cold-air outbreak over the western North Atlantic, J. Atmos. Sci., 79, 2863–2879, https://doi.org/10.1175/JAS-D-22-0034.1, 2022. a, b
Chen, Y.-S., Zhang, J., Hoffmann, F., Yamaguchi, T., Glassmeier, F., Zhou, X., and Feingold, G.: Diurnal evolution of non-precipitating marine stratocumuli in a large-eddy simulation ensemble, Atmos. Chem. Phys., 24, 12661–12685, https://doi.org/10.5194/acp-24-12661-2024, 2024. a
Christensen, M. W., Jones, W. K., and Stier, P.: Aerosols enhance cloud lifetime and brightness along the stratus-to-cumulus transition, P. Natl. Acad. Sci. USA, 117, 17591–17598, https://doi.org/10.1073/pnas.1921231117, 2020. a, b
de Roode, S. R., Frederikse, T., Siebesma, A. P., Ackerman, A. S., Chylik, J., Field, P. R., Fricke, J., Gryschka, M., Hill, A., Honnert, R., Krueger, S. K., Lac, C., Lesage, A. T., and Tomassini, L.: Turbulent transport in the gray zone: a large eddy model intercomparison study of the CONSTRAIN cold air outbreak case, J. Adv. Model. Earth Sy., 11, 597–623, https://doi.org/10.1029/2018MS001443, 2019. a
Eastman, R., McCoy, I. L., Schulz, H., and Wood, R.: A survey of radiative and physical properties of North Atlantic mesoscale cloud morphologies from multiple identification methodologies, Atmos. Chem. Phys., 24, 6613–6634, https://doi.org/10.5194/acp-24-6613-2024, 2024. a
Elsaesser, G. S., O'Dell, C. W., Lebsock, M. D., Bennartz, R., Greenwald, T. J., and Wentz, F. J.: The Multisensor Advanced Climatology of Liquid Water Path (MAC-LWP), J. Climate, 30, 10193–10210, https://doi.org/10.1175/JCLI-D-16-0902.1, 2017. a
Engström, A., Bender, F. A., Charlson, R. J., and Wood, R.: The nonlinear relationship between albedo and cloud fraction on near global, monthly mean scale in observations and in the CMIP5 model ensemble, Geophys. Res. Lett., 42, 9571–9578, https://doi.org/10.1002/2015GL066275, 2015. a
Ervens, B., Feingold, G., Sulia, K., and Harrington, J.: The impact of microphysical parameters, ice nucleation mode, and habit growth on the ice/liquid partitioning in mixed-phase Arctic clouds, J. Geophys. Res., 116, https://doi.org/10.1029/2011JD015729, 2011. a
Feingold, G., Koren, I., Wang, H., Xue, H., and Brewer, W. A.: Precipitation-generated oscillations in open cellular cloud fields, Nature, 466, 849–852, https://doi.org/10.1038/nature09314, 2010. a
Feingold, G., McComiskey, A., Yamaguchi, T., Johnson, J. S., Carslaw, K. S., and Schmidt, K. S.: New approaches to quantifying aerosol influence on the cloud radiative effect, P. Natl. Acad. Sci. USA, 113, 5812–5819, https://doi.org/10.1073/pnas.1514035112, 2016. a
Feingold, G., Balsells, J., Glassmeier, F., Yamaguchi, T., Kazil, J., and McComiskey, A.: Analysis of albedo versus cloud fraction relationships in liquid water clouds using heuristic models and large eddy simulation, J. Geophys. Res.-Atmos., 122, 7086–7102, https://doi.org/10.1002/2017JD026467, 2017. a
Feingold, G., Glassmeier, F., Zhang, J., and Hoffmann, F.: Opinion: Inferring process from snapshots of cloud systems, Atmos. Chem. Phys., 25, 10869–10885, https://doi.org/10.5194/acp-25-10869-2025, 2025. a, b, c, d
Findeisen, W.: Kolloid-meteorologische Vorgänge bei Niederschlagsbildung, Meteorol. Z., 55, 121–133, 1938. a
Fletcher, J., Mason, S., and Jakob, C.: The climatology, meteorology, and boundary layer structure of marine cold air outbreaks in both hemispheres, J. Climate, 29, 1999–2014, https://doi.org/10.1175/JCLI-D-15-0268.1, 2016a. a, b
Fletcher, J. K., Mason, S., and Jakob, C.: A climatology of clouds in marine cold air outbreaks in both hemispheres, J. Climate, 29, 6677–6692, https://doi.org/10.1175/JCLI-D-15-0783.1, 2016b. a
Forster, P., Storelvmo, T., Armour, K., Collins, W., Dufresne, J.-L., Frame, D., Lunt, D. J., Mauritsen, T., Palmer, M. D., Watanabe, M., Wild, M., and Zhang, H.: The Earth's energy budget, climate feedbacks, and climate sensitivity, in: Climate Change 2021: The Physical Science Basis, Contribution of Working Group I to the Sixth Assessment Report of the Intergovernmental Panel on Climate Change, edited by: Masson-Delmotte, V., Zhai, P., Pirani, A., Connors, S. L., Péan, C., Berger, S., Caud, N., Chen, Y., Goldfarb, L., Gomis, M. I., Huang, M., Leitzell, K., Lonnoy, E., Matthews, J. B. R., Maycock, T. K., Waterfield, T., Yelekçi, O., Yu, R., and Zhou, B., Cambridge University Press, Cambridge, UK and New York, NY, USA, 923–1054, https://doi.org/10.1017/9781009157896.009, 2021. a
Gerber, H.: Microphysics of marine stratocumulus clouds with two drizzle modes, J. Atmos. Sci., 53, 1649–1662, https://doi.org/10.1175/1520-0469(1996)053<1649:MOMSCW>2.0.CO;2, 1996. a
Glassmeier, F. and Feingold, G.: Network approach to patterns in stratocumulus clouds, P. Natl. Acad. Sci. USA, 114, 10578–10583, https://doi.org/10.1073/pnas.1706495114, 2017. a
Glassmeier, F., Hoffmann, F., Johnson, J. S., Yamaguchi, T., Carslaw, K. S., and Feingold, G.: An emulator approach to stratocumulus susceptibility, Atmos. Chem. Phys., 19, 10191–10203, https://doi.org/10.5194/acp-19-10191-2019, 2019. a, b
Goren, T., Kazil, J., Hoffmann, F., Yamaguchi, T., and Feingold, G.: Anthropogenic air pollution delays marine stratocumulus breakup to open cells, Geophys. Res. Lett., 46, 14135–14144, https://doi.org/10.1029/2019GL085412, 2019. a
Goren, T., Feingold, G., Gryspeerdt, E., Kazil, J., Kretzschmar, J., Jia, H., and Quaas, J.: Projecting stratocumulus transitions on the albedo – cloud fraction relationship reveals linearity of albedo to droplet concentrations, Geophys. Res. Lett., 49, https://doi.org/10.1029/2022GL101169, 2022. a, b, c
Grosvenor, D. P. and Wood, R.: The effect of solar zenith angle on MODIS cloud optical and microphysical retrievals within marine liquid water clouds, Atmos. Chem. Phys., 14, 7291–7321, https://doi.org/10.5194/acp-14-7291-2014, 2014. a, b
Grosvenor, D. P., Sourdeval, O., Zuidema, P., Ackerman, A., Alexandrov, M. D., Bennartz, R., Boers, R., Cairns, B., Chiu, J. C., Christensen, M., Deneke, H., Diamond, M., Feingold, G., Fridlind, A., Hünerbein, A., Knist, C., Kollias, P., Marshak, A., McCoy, D., Merk, D., Painemal, D., Rausch, J., Rosenfeld, D., Russchenberg, H., Seifert, P., Sinclair, K., Stier, P., van Diedenhoven, B., Wendisch, M., Werner, F., Wood, R., Zhang, Z., and Quaas, J.: Remote sensing of droplet number concentration in warm clouds: a review of the current state of knowledge and perspectives, Rev. Geophys., 56, 409–453, https://doi.org/10.1029/2017RG000593, 2018. a, b, c, d
Gryspeerdt, E., Goren, T., Sourdeval, O., Quaas, J., Mülmenstädt, J., Dipu, S., Unglaub, C., Gettelman, A., and Christensen, M.: Constraining the aerosol influence on cloud liquid water path, Atmos. Chem. Phys., 19, 5331–5347, https://doi.org/10.5194/acp-19-5331-2019, 2019a. a
Gryspeerdt, E., Smith, T. W. P., O'Keeffe, E., Christensen, M. W., and Goldsworth, F. W.: The impact of ship emission controls recorded by cloud properties, Geophys. Res. Lett., 46, 12547–12555, https://doi.org/10.1029/2019GL084700, 2019b. a
Gryspeerdt, E., McCoy, D. T., Crosbie, E., Moore, R. H., Nott, G. J., Painemal, D., Small-Griswold, J., Sorooshian, A., and Ziemba, L.: The impact of sampling strategy on the cloud droplet number concentration estimated from satellite data, Atmos. Meas. Tech., 15, 3875–3892, https://doi.org/10.5194/amt-15-3875-2022, 2022. a
Hersbach, H., Bell, B., Berrisford, P., Hirahara, S., Horányi, A., Muñoz-Sabater, J., Nicolas, J., Peubey, C., Radu, R., Schepers, D., Simmons, A., Soci, C., Abdalla, S., Abellan, X., Balsamo, G., Bechtold, P., Biavati, G., Bidlot, J., Bonavita, M., De Chiara, G., Dahlgren, P., Dee, D., Diamantakis, M., Dragani, R., Flemming, J., Forbes, R., Fuentes, M., Geer, A., Haimberger, L., Healy, S., Hogan, R. J., Hólm, E., Janisková, M., Keeley, S., Laloyaux, P., Lopez, P., Lupu, C., Radnoti, G., de Rosnay, P., Rozum, I., Vamborg, F., Villaume, S., and Thépaut, J.-N.: The ERA5 global reanalysis, Q. J. Roy. Meteor. Soc., 146, 1999–2049, https://doi.org/10.1002/qj.3803, 2020. a, b
Hersbach, H., Bell, B., Berrisford, P., Biavati, G., Horányi, A., Muñoz Sabater, J., Nicolas, J., Peubey, C., Radu, R., Rozum, I., Schepers, D., Simmons, A., Soci, C., Dee, D., and Thépaut, J.-N.: ERA5 monthly averaged data on pressure levels from 1940 to present, Copernicus Climate Change Service (C3S) Climate Data Store (CDS) [data set], https://doi.org/10.24381/cds.6860a573, 2023a. a
Hersbach, H., Bell, B., Berrisford, P., Biavati, G., Horányi, A., Muñoz Sabater, J., Nicolas, J., Peubey, C., Radu, R., Rozum, I., Schepers, D., Simmons, A., Soci, C., Dee, D., and Thépaut, J.-N.: ERA5 monthly averaged data on single levels from 1940 to present, Copernicus Climate Change Service (C3S) Climate Data Store (CDS) [data set], https://doi.org/10.24381/cds.f17050d7, 2023b. a
Hoffmann, F., Glassmeier, F., Yamaguchi, T., and Feingold, G.: Liquid water path steady states in stratocumulus: insights from process-level emulation and mixed-layer theory, J. Atmos. Sci., 77, 2203–2215, https://doi.org/10.1175/JAS-D-19-0241.1, 2020. a
Justel, A., Peña, D., and Zamar, R.: A multivariate Kolmogorov-Smirnov test of goodness of fit, Stat. Probabil. Lett., 35, 251–259, https://doi.org/10.1016/S0167-7152(97)00020-5, 1997. a
Kang, L., Marchand, R., and Smith, W.: Evaluation of MODIS and Himawari 8 low clouds retrievals over the Southern Ocean with in situ measurements from the SOCRATES campaign, Earth and Space Science, 8, https://doi.org/10.1029/2020EA001397, 2021. a
Karalis, M., Sotiropoulou, G., Abel, S. J., Bossioli, E., Georgakaki, P., Methymaki, G., Nenes, A., and Tombrou, M.: Effects of secondary ice processes on a stratocumulus to cumulus transition during a cold-air outbreak, Atmos. Res., 277, 106302, https://doi.org/10.1016/j.atmosres.2022.106302, 2022. a
Kirschler, S., Voigt, C., Anderson, B., Campos Braga, R., Chen, G., Corral, A. F., Crosbie, E., Dadashazar, H., Ferrare, R. A., Hahn, V., Hendricks, J., Kaufmann, S., Moore, R., Pöhlker, M. L., Robinson, C., Scarino, A. J., Schollmayer, D., Shook, M. A., Thornhill, K. L., Winstead, E., Ziemba, L. D., and Sorooshian, A.: Seasonal updraft speeds change cloud droplet number concentrations in low-level clouds over the western North Atlantic, Atmos. Chem. Phys., 22, 8299–8319, https://doi.org/10.5194/acp-22-8299-2022, 2022. a
Kirschler, S., Voigt, C., Anderson, B. E., Chen, G., Crosbie, E. C., Ferrare, R. A., Hahn, V., Hair, J. W., Kaufmann, S., Moore, R. H., Painemal, D., Robinson, C. E., Sanchez, K. J., Scarino, A. J., Shingler, T. J., Shook, M. A., Thornhill, K. L., Winstead, E. L., Ziemba, L. D., and Sorooshian, A.: Overview and statistical analysis of boundary layer clouds and precipitation over the western North Atlantic Ocean, Atmos. Chem. Phys., 23, 10731–10750, https://doi.org/10.5194/acp-23-10731-2023, 2023. a, b, c
Klein, S. A. and Hartmann, D. L.: The seasonal cycle of low stratiform clouds, J. Climate, 6, 1587–1606, https://doi.org/10.1175/1520-0442(1993)006<1587:TSCOLS>2.0.CO;2, 1993. a
Knop, I., Bansmer, S. E., Hahn, V., and Voigt, C.: Comparison of different droplet measurement techniques in the Braunschweig Icing Wind Tunnel, Atmos. Meas. Tech., 14, 1761–1781, https://doi.org/10.5194/amt-14-1761-2021, 2021. a
Kolstad, E. W. and Bracegirdle, T. J.: Marine cold-air outbreaks in the future: an assessment of IPCC AR4 model results for the Northern Hemisphere, Clim. Dynam., 30, 871–885, https://doi.org/10.1007/s00382-007-0331-0, 2008. a
Koren, I., Dror, T., Altaratz, O., and Chekroun, M. D.: Cloud versus void chord length distributions (LvL) as a measure for cloud field organization, Geophys. Res. Lett., 51, https://doi.org/10.1029/2024GL108435, 2024. a, b
Lawson, R. P., O'Connor, D., Zmarzly, P., Weaver, K., Baker, B., Mo, Q., and Jonsson, H.: The 2D-S (stereo) probe: design and preliminary tests of a new airborne, high-speed, high-resolution particle imaging probe, J. Atmos. Ocean. Tech., 23, 1462–1477, https://doi.org/10.1175/JTECH1927.1, 2006. a
Li, X.-Y., Wang, H., Chen, J., Endo, S., George, G., Cairns, B., Chellappan, S., Zeng, X., Kirschler, S., Voigt, C., Sorooshian, A., Crosbie, E., Chen, G., Ferrare, R. A., Gustafson, W. I., Hair, J. W., Kleb, M. M., Liu, H., Moore, R., Painemal, D., Robinson, C., Scarino, A. J., Shook, M., Shingler, T. J., Thornhill, K. L., Tornow, F., Xiao, H., Ziemba, L. D., and Zuidema, P.: Large-eddy simulations of marine boundary layer clouds associated with cold-air outbreaks during the ACTIVATE campaign. Part I: Case setup and sensitivities to large-scale forcings, J. Atmos. Sci., 79, 73–100, https://doi.org/10.1175/JAS-D-21-0123.1, 2022. a, b
Li, X.-Y., Wang, H., Chen, J., Endo, S., Kirschler, S., Voigt, C., Crosbie, E., Ziemba, L. D., Painemal, D., Cairns, B., Hair, J. W., Corral, A. F., Robinson, C., Dadashazar, H., Sorooshian, A., Chen, G., Ferrare, R. A., Kleb, M. M., Liu, H., Moore, R., Scarino, A. J., Shook, M. A., Shingler, T. J., Thornhill, K. L., Tornow, F., Xiao, H., and Zeng, X.: Large-eddy simulations of marine boundary layer clouds associated with cold-air outbreaks during the ACTIVATE campaign. Part II: Aerosol–meteorology–cloud interaction, J. Atmos. Sci., 80, 1025–1045, https://doi.org/10.1175/JAS-D-21-0324.1, 2023. a, b
Maddux, B. C., Ackerman, S. A., and Platnick, S.: Viewing geometry dependencies in MODIS cloud products, J. Atmos. Ocean. Tech., 27, 1519–1528, https://doi.org/10.1175/2010JTECHA1432.1, 2010. a
Martin, G. M., Johnson, D. W., and Spice, A.: The measurement and parameterization of effective radius of droplets in warm stratocumulus clouds, J. Atmos. Sci., 51, 1823–1842, https://doi.org/10.1175/1520-0469(1994)051<1823:TMAPOE>2.0.CO;2, 1994. a
McCoy, I. L., Wood, R., and Fletcher, J. K.: Identifying meteorological controls on open and closed mesoscale cellular convection associated with marine cold air outbreaks, J. Geophys. Res.-Atmos., 122, 11678–11702, https://doi.org/10.1002/2017JD027031, 2017. a, b
McCoy, I. L., McCoy, D. T., Wood, R., Zuidema, P., and Bender, F. A.: The role of mesoscale cloud morphology in the shortwave cloud feedback, Geophys. Res. Lett., 50, https://doi.org/10.1029/2022GL101042, 2023. a, b
Minnis, P., Garber, D. P., Young, D. F., Arduini, R. F., and Takano, Y.: Parameterizations of reflectance and effective emittance for satellite remote sensing of cloud properties, J. Atmos. Sci., 55, 3313–3339, https://doi.org/10.1175/1520-0469(1998)055<3313:PORAEE>2.0.CO;2, 1998. a
Minnis, P., Nguyen, L., Palikonda, R., Heck, P. W., Spangenberg, D. A., Doelling, D. R., Kirk Ayers, J., Smith, W. L., Khaiyer, M. M., Trepte, Q. Z., Avey, L. A., Chang, F.-L., Yost, C. R., Chee, T. L., and Szedung, T. L.: Near-real time cloud retrievals from operational and research meteorological satellites, Proc. SPIE 7107, Remote Sensing of Clouds and the Atmosphere XIII, 710703, https://doi.org/10.1117/12.800344, 2008. a, b
Minnis, P., Sun-Mack, S., Young, D. F., Heck, P. W., Garber, D. P., Chen, Y., Spangenberg, D. A., Arduini, R. F., Trepte, Q. Z., Smith, W. L., Ayers, J. K., Gibson, S. C., Miller, W. F., Hong, G., Chakrapani, V., Takano, Y., Liou, K., Xie, Y., and Yang, P.: CERES edition-2 cloud property retrievals using TRMM VIRS and Terra and Aqua MODIS data–Part I: Algorithms, IEEE T. Geosci. Remote, 49, 4374–4400, https://doi.org/10.1109/TGRS.2011.2144601, 2011. a, b, c
Minnis, P., Sun-Mack, S., Chen, Y., Chang, F.-L., Yost, C. R., Smith, W. L., Heck, P. W., Arduini, R. F., Bedka, S. T., Yi, Y., Hong, G., Jin, Z., Painemal, D., Palikonda, R., Scarino, B. R., Spangenberg, D. A., Smith, R. A., Trepte, Q. Z., Yang, P., and Xie, Y.: CERES MODIS cloud product retrievals for edition 4 – Part I: Algorithm changes, IEEE T. Geosci. Remote, 59, 2744–2780, https://doi.org/10.1109/TGRS.2020.3008866, 2021. a, b, c
Murray-Watson, R. J., Gryspeerdt, E., and Goren, T.: Investigating the development of clouds within marine cold-air outbreaks, Atmos. Chem. Phys., 23, 9365–9383, https://doi.org/10.5194/acp-23-9365-2023, 2023. a, b, c, d, e
Painemal, D. and Zuidema, P.: Assessment of MODIS cloud effective radius and optical thickness retrievals over the southeast Pacific with VOCALS-REx in situ measurements, J. Geophys. Res.-Atmos., 116, 1–16, https://doi.org/10.1029/2011JD016155, 2011. a
Painemal, D., Spangenberg, D., Smith Jr., W. L., Minnis, P., Cairns, B., Moore, R. H., Crosbie, E., Robinson, C., Thornhill, K. L., Winstead, E. L., and Ziemba, L.: Evaluation of satellite retrievals of liquid clouds from the GOES-13 imager and MODIS over the midlatitude North Atlantic during the NAAMES campaign, Atmos. Meas. Tech., 14, 6633–6646, https://doi.org/10.5194/amt-14-6633-2021, 2021. a, b
Papoulis, A.: Bernoulli trials, in: Probability, Random Variables, and Stochastic Processes, McGraw-Hill, 57–63, ISBN 978-0070484689, 1984. a
Park, J. M., McComiskey, A. C., Painemal, D., and Smith, W. L.: Long term trends in aerosols, low clouds, and large scale meteorology over the western North Atlantic from 2003 to 2020, J. Geophys. Res.-Atmos., 129, https://doi.org/10.1029/2023JD039592, 2024. a
Pithan, F., Svensson, G., Caballero, R., Chechin, D., Cronin, T. W., Ekman, A. M. L., Neggers, R., Shupe, M. D., Solomon, A., Tjernström, M., and Wendisch, M.: Role of air-mass transformations in exchange between the Arctic and mid-latitudes, Nat. Geosci., 11, 805–812, https://doi.org/10.1038/s41561-018-0234-1, 2018. a, b
Platnick, S., King, M. D., Ackerman, S. A., Menzel, W. P., Baum, B. A., Riedi, J. C., and Frey, R. A.: The MODIS cloud products: algorithms and examples from Terra, IEEE T. Geosci. Remote, 41, 459–473, https://doi.org/10.1109/TGRS.2002.808301, 2003. a
Pruppacher, H. and Klett, J.: Microphysics of Clouds and Precipitation, Springer Netherlands, https://doi.org/10.1007/978-0-306-48100-0, 2010. a, b
Quaas, J., Boucher, O., and Lohmann, U.: Constraining the total aerosol indirect effect in the LMDZ and ECHAM4 GCMs using MODIS satellite data, Atmos. Chem. Phys., 6, 947–955, https://doi.org/10.5194/acp-6-947-2006, 2006. a, b
Sandu, I., Stevens, B., and Pincus, R.: On the transitions in marine boundary layer cloudiness, Atmos. Chem. Phys., 10, 2377–2391, https://doi.org/10.5194/acp-10-2377-2010, 2010. a
Smalley, K. M. and Lebsock, M. D.: Corrections for geostationary cloud liquid water path using microwave imagery, J. Atmos. Ocean. Tech., 40, 1049–1061, https://doi.org/10.1175/JTECH-D-23-0030.1, 2023. a, b
Sorooshian, A., Anderson, B., Bauer, S. E., Braun, R. A., Cairns, B., Crosbie, E., Dadashazar, H., Diskin, G., Ferrare, R., Flagan, R. C., Hair, J., Hostetler, C., Jonsson, H. H., Kleb, M. M., Liu, H., MacDonald, A. B., McComiskey, A., Moore, R., Painemal, D., Russell, L. M., Seinfeld, J. H., Shook, M., Smith, W. L., Thornhill, K., Tselioudis, G., Wang, H., Zeng, X., Zhang, B., Ziemba, L., and Zuidema, P.: Aerosol–cloud–meteorology interaction airborne field investigations: using lessons learned from the U.S. West Coast in the design of ACTIVATE off the U.S. East Coast, B. Am. Meteorol. Soc., 100, 1511–1528, https://doi.org/10.1175/BAMS-D-18-0100.1, 2019. a
Sorooshian, A., Corral, A., Diskin, G. S., Moore, R., Thornhill, K. L., Voigt, C., and Ziemba, L.: Aerosol Cloud meTeorology Interactions oVer the western ATlantic Experiment Data, Earth Data [data set], https://doi.org/10.5067/SUBORBITAL/ACTIVATE/DATA001, 2020a. a
Sorooshian, A., Corral, A. F., Braun, R. A., Cairns, B., Crosbie, E., Ferrare, R., Hair, J., Kleb, M. M., Hossein Mardi, A., Maring, H., McComiskey, A., Moore, R., Painemal, D., Scarino, A. J., Schlosser, J., Shingler, T., Shook, M., Wang, H., Zeng, X., Ziemba, L., and Zuidema, P.: Atmospheric research over the western North Atlantic ocean region and North American East Coast: a review of past work and challenges ahead, J. Geophys. Res.-Atmos., 125, https://doi.org/10.1029/2019JD031626, 2020b. a
Sorooshian, A., Alexandrov, M. D., Bell, A. D., Bennett, R., Betito, G., Burton, S. P., Buzanowicz, M. E., Cairns, B., Chemyakin, E. V., Chen, G., Choi, Y., Collister, B. L., Cook, A. L., Corral, A. F., Crosbie, E. C., van Diedenhoven, B., DiGangi, J. P., Diskin, G. S., Dmitrovic, S., Edwards, E.-L., Fenn, M. A., Ferrare, R. A., van Gilst, D., Hair, J. W., Harper, D. B., Hilario, M. R. A., Hostetler, C. A., Jester, N., Jones, M., Kirschler, S., Kleb, M. M., Kusterer, J. M., Leavor, S., Lee, J. W., Liu, H., McCauley, K., Moore, R. H., Nied, J., Notari, A., Nowak, J. B., Painemal, D., Phillips, K. E., Robinson, C. E., Scarino, A. J., Schlosser, J. S., Seaman, S. T., Seethala, C., Shingler, T. J., Shook, M. A., Sinclair, K. A., Smith Jr., W. L., Spangenberg, D. A., Stamnes, S. A., Thornhill, K. L., Voigt, C., Vömel, H., Wasilewski, A. P., Wang, H., Winstead, E. L., Zeider, K., Zeng, X., Zhang, B., Ziemba, L. D., and Zuidema, P.: Spatially coordinated airborne data and complementary products for aerosol, gas, cloud, and meteorological studies: the NASA ACTIVATE dataset, Earth Syst. Sci. Data, 15, 3419–3472, https://doi.org/10.5194/essd-15-3419-2023, 2023. a, b, c
Sorooshian, A., Siu, L. W., Butler, K., Brunke, M. A., Cairns, B., Chellappan, S., Chen, J., Choi, Y., Crosbie, E. C., Cutler, L., DiGangi, J. P., Diskin, G. S., Ferrare, R. A., Hair, J. W., Hostetler, C. A., Kirschler, S., Kleb, M. M., Li, X.-Y., Liu, H., McComiskey, A., Namdari, S., Painemal, D., Schlosser, J. S., Shingler, T., Shook, M. A., Silva, S., Sinclair, K., Smith, W. L., Soloff, C., Stamnes, S., Tang, S., Thornhill, K. L., Tornow, F., Tselioudis, G., Van Diedenhoven, B., Voigt, C., Vömel, H., Wang, H., Winstead, E. L., Xu, Y., Zeng, X., Zhang, B., Ziemba, L., and Zuidema, P.: The NASA ACTIVATE mission, B. Am. Meteorol. Soc., 106, E1517–E1538, https://doi.org/10.1175/BAMS-D-24-0136.1, 2025. a
Suzuki, K., Nakajima, T. Y., and Stephens, G. L.: Particle growth and drop collection efficiency of warm clouds as inferred from joint CloudSat and MODIS observations, J. Atmos. Sci., 67, 3019–3032, https://doi.org/10.1175/2010jas3463.1, 2010. a
Szczodrak, M., Austin, P. H., and Krummel, P. B.: Variability of optical depth and effective radius in marine stratocumulus clouds, J. Atmos. Sci., 58, 2912–2926, https://doi.org/10.1175/1520-0469(2001)058<2912:VOODAE>2.0.CO;2, 2001. a
Tang, S., Wang, H., Li, X.-Y., Chen, J., Sorooshian, A., Zeng, X., Crosbie, E., Thornhill, K. L., Ziemba, L. D., and Voigt, C.: Understanding aerosol–cloud interactions using a single-column model for a cold-air outbreak case during the ACTIVATE campaign, Atmos. Chem. Phys., 24, 10073–10092, https://doi.org/10.5194/acp-24-10073-2024, 2024. a, b
Tornow, F., Ackerman, A. S., and Fridlind, A. M.: Preconditioning of overcast-to-broken cloud transitions by riming in marine cold air outbreaks, Atmos. Chem. Phys., 21, 12049–12067, https://doi.org/10.5194/acp-21-12049-2021, 2021. a, b, c, d, e, f
Tornow, F., Ackerman, A. S., Fridlind, A. M., Cairns, B., Crosbie, E. C., Kirschler, S., Moore, R. H., Painemal, D., Robinson, C. E., Seethala, C., Shook, M. A., Voigt, C., Winstead, E. L., Ziemba, L. D., Zuidema, P., and Sorooshian, A.: Dilution of boundary layer cloud condensation nucleus concentrations by free tropospheric entrainment during marine cold air outbreaks, Geophys. Res. Lett., 49, https://doi.org/10.1029/2022GL098444, 2022. a, b
Tornow, F., Ackerman, A. S., Fridlind, A. M., Tselioudis, G., Cairns, B., Painemal, D., and Elsaesser, G.: On the impact of a dry intrusion driving cloud-regime transitions in a midlatitude cold-air outbreak, J. Atmos. Sci., 80, 2881–2896, https://doi.org/10.1175/JAS-D-23-0040.1, 2023. a, b, c
Tornow, F., Crosbie, E. C., Fridlind, A. M., Ackerman, A. S., Ziemba, L. D., Elsaesser, G., Cairns, B., Painemal, D., Chellappan, S., Zuidema, P., Voigt, C., Kirschler, S., and Sorooshian, A.: High accumulation mode aerosol concentration and moderate aerosol hygroscopicity limit impacts of recent particle formation on northwest Atlantic post frontal clouds, Geophys. Res. Lett., 52, https://doi.org/10.1029/2025GL116020, 2025a. a, b, c
Tornow, F., Fridlind, A., Tselioudis, G., Cairns, B., Ackerman, A., Chellappan, S., Painemal, D., Zuidema, P., Voigt, C., Kirschler, S., and Sorooshian, A.: Measurement report: A survey of meteorological and cloud properties during ACTIVATE's postfrontal flights and their suitability for Lagrangian case studies, Atmos. Chem. Phys., 25, 5053–5074, https://doi.org/10.5194/acp-25-5053-2025, 2025b. a, b, c, d, e
Twomey, S.: Pollution and the planetary albedo, Atmos. Environ., 8, 1251–1256, https://doi.org/10.1016/0004-6981(74)90004-3, 1974. a, b
Twomey, S.: The influence of pollution on the shortwave albedo of clouds, J. Atmos. Sci., 34, 1149–1152, https://doi.org/10.1175/1520-0469(1977)034<1149:TIOPOT>2.0.CO;2, 1977. a
vanZanten, M. C., Stevens, B., Vali, G., and Lenschow, D. H.: Observations of drizzle in nocturnal marine stratocumulus, J. Atmos. Sci., 62, 88–106, https://doi.org/10.1175/JAS-3355.1, 2005. a
Wang, H. and Feingold, G.: Modeling mesoscale cellular structures and drizzle in marine stratocumulus. Part I: Impact of drizzle on the formation and evolution of open cells, J. Atmos. Sci., 66, 3237–3256, https://doi.org/10.1175/2009JAS3022.1, 2009. a
Wang, S., Wang, Q., and Feingold, G.: Turbulence, condensation, and liquid water transport in numerically simulated nonprecipitating stratocumulus clouds, J. Atmos. Sci., 60, 262–278, https://doi.org/10.1175/1520-0469(2003)060<0262:TCALWT>2.0.CO;2, 2003. a
Wegener, A.: Thermodynamik der Atmosphäre, Nature, 90, https://doi.org/10.1038/090031a0, 1912. a
Wood, R.: Stratocumulus clouds, Mon. Wea. Rev., 140, 2373–2423, https://doi.org/10.1175/MWR-D-11-00121.1, 2012. a
Wu, P. and Ovchinnikov, M.: Cloud morphology evolution in arctic cold air outbreak: two cases during COMBLE period, J. Geophys. Res.-Atmos., 127, https://doi.org/10.1029/2021JD035966, 2022. a, b
Xue, H. and Feingold, G.: Large-eddy simulations of trade wind cumuli: investigation of aerosol indirect effects, J. Atmos. Sci., 63, 1605–1622, https://doi.org/10.1175/JAS3706.1, 2006. a
Yamaguchi, T., Feingold, G., and Kazil, J.: Stratocumulus to cumulus transition by drizzle, J. Adv. Model. Earth Sy., 9, 2333–2349, https://doi.org/10.1002/2017MS001104, 2017. a
Yost, C. R., Minnis, P., Sun-Mack, S., Chen, Y., and Smith, W. L.: CERES MODIS cloud product retrievals for edition 4 – Part II: Comparisons to CloudSat and CALIPSO, IEEE T. Geosci. Remote, 59, 3695–3724, https://doi.org/10.1109/TGRS.2020.3015155, 2021. a, b
Zelinka, M. D., Myers, T. A., McCoy, D. T., Po Chedley, S., Caldwell, P. M., Ceppi, P., Klein, S. A., and Taylor, K. E.: Causes of higher climate sensitivity in CMIP6 Models, Geophys. Res. Lett., 47, https://doi.org/10.1029/2019GL085782, 2020. a
Zhang, J. and Feingold, G.: Distinct regional meteorological influences on low-cloud albedo susceptibility over global marine stratocumulus regions, Atmos. Chem. Phys., 23, 1073–1090, https://doi.org/10.5194/acp-23-1073-2023, 2023. a
Zhang, J., Zhou, X., Goren, T., and Feingold, G.: Albedo susceptibility of northeastern Pacific stratocumulus: the role of covarying meteorological conditions, Atmos. Chem. Phys., 22, 861–880, https://doi.org/10.5194/acp-22-861-2022, 2022. a, b
Zhang, J., Chen, Y.-S., Yamaguchi, T., and Feingold, G.: Cloud water adjustments to aerosol perturbations are buffered by solar heating in non-precipitating marine stratocumuli, Atmos. Chem. Phys., 24, 10425–10440, https://doi.org/10.5194/acp-24-10425-2024, 2024. a