the Creative Commons Attribution 4.0 License.
the Creative Commons Attribution 4.0 License.
 | 24 Apr 2026
Satellite-based evidence of dust emission over Northern Canada
Ian Ashpole
Brian Boys
High-latitude dust (HLD) is receiving growing research interest for its relative impacts in the Arctic. Direct knowledge of HLD emission locations is limited, leading to a common lack of representation in global models. Using the Frequency of Occurrence (FoO) of extreme Dust Optical Depth (DOD > 0.5), derived at high resolution (0.1° × 0.1°) from twenty years (2002–2022) of MODIS data, we present semi-quantitative evidence that dust emission sources are widespread across the Canadian Arctic Archipelago. We also present qualitative supporting evidence from VIIRS and CALIPSO satellite aerosol type “dust” classifications, and some practical challenges of comparing MODIS data to two AERONET sites co-located with dust emission sources.
The HLD emission hotspots identified in the “Canadian Arctic Dust Belt” correspond to surfaces with high potential for dust emission in the G-SDS-SBM dataset. There are more areas where emission hotspots are observed but emission potential is low than the opposite case; additionally, three considerable areas of dust emission are identified at lower latitudes in mainland Canada. Spatially averaged across the “Canadian Arctic Dust Belt” (70–80° N, 125–75° W), annual mean time series (2003–2022) of FoO (DOD > 0.5) suggest some increase in the frequency of dustiness with time, consistent with our understanding that HLD emissions increase in a warming climate, but without statistically significant anti-correlation to snow cover. These results further motivate model development to include HLD sources, suggest future field observation locations, and provide a novel observational basis for evaluating them with satellite data, which can be further refined.
- Article
(13892 KB) - Full-text XML
-
Supplement
(7322 KB) - BibTeX
- EndNote


Mineral dust aerosols (herein “dust”) play an important role in the Earth System, for example, through modifying the atmospheric and surface radiative budgets (Kok et al., 2018), influencing cloud processes (Tobo et al., 2019), providing nutrients to terrestrial (Nogueira et al., 2021) and oceanic (Dansie et al., 2022) ecosystems, and reducing the albedo of snow and ice when deposited (Sarangi et al., 2020) on these surfaces. Dust can also pose a significant health risk when particles are inhaled, with increased risk found for populations living downwind of source regions (Yang et al., 2022).
Dust emission depends upon high wind speeds occurring over surfaces where dust-sized particles (<∼ 100 µm) are available for entrainment. Therefore, the most dominant global dust emission hotspots are the hot subtropical deserts (e.g. Prospero et al., 2002; Washington et al., 2003), where a lack of surface moisture and vegetation creates favourable conditions for emission to occur. However, dust sources in colder, mid-latitude regions have been shown to have a higher potential for interactions with high ice clouds, despite being much smaller dust emission sources (Wiacek et al., 2010). More recently, high-latitude regions have received growing research interest too, even though preferential dust source areas in the Arctic have been identified more than two decades ago (Tegen, 2003 and references therein). Although current best estimates suggest that they contribute only around 3 %–5 %, by mass, to the global dust cycle (Bullard et al., 2016; Groot Zwaaftink et al., 2016), there is evidence that high-latitude dust sources have a disproportionately large contribution to radiative forcing in the Arctic in comparison to dust from lower latitudes, due to being the dominant contributor to near-surface loadings and deposition there (Groot Zwaaftink et al., 2016; Kylling et al., 2018; Shi et al., 2022). High-latitude dust originates largely in glacial processes, which efficiently produce and deliver fine sediment to barren proglacial floodplains that are the prime emission hotspots when winds (which may be accelerated by regional ice sheets and glaciers) are strong enough (Bullard et al., 2016). It is likely that the high-latitude emissive areas will grow as a result of Arctic climate change impacts such as glacial retreat, decreased snow cover duration, and permafrost thaw (Bullard, 2013; Meinander et al., 2022), further justifying their continued study.
Meinander et al. (2022) provide a comprehensive overview of high-latitude dust, and use numerical modelling, data from the Global Sand and Dust Storms Source Base Map (G-SDS-SBM; Vukovic-Vimic, 2021, 2022), and case study analysis to make the case for a northern high-latitude dust belt. Of the 64 high-latitude dust sources documented in that study, only four are in Canada. However, presented source intensity (SI) data from the G-SDS-SBM dataset (Fig. 2 in Meinander et al., 2022) suggests that large portions of the land surface in Northern Canada have high potential to emit dust under favourable meteorological (i.e., wind speed) and surface (i.e., soil temperature and moisture) conditions. The study's conclusion calls for an increase in observational studies aimed at identifying new high-latitude dust sources, without which accurate modelling of known dust effects is not possible. That is the aim of this paper, with a focus on Northern Canada.
While products such as the G-SDS-SBM can highlight surfaces that have the potential to emit dust, observations of dust storms actually occurring are necessary to classify areas as sources. To this end, datasets derived from satellite instruments are crucial to understanding the global distribution of dust, with areas where dust is most frequently detected determined to be source locations (e.g. Prospero et al., 2002; Washington et al., 2003; Ginoux et al., 2012). Qualitative dust aerosol type detection by these remote sensing methods is based on the exceedance of threshold values in retrieval products that quantify the loading (amount) and size of aerosol particles present in the atmospheric column, such as aerosol optical depth (AOD) and Ångström exponent (α; e.g. Ginoux et al., 2012; Baddock et al., 2016), or binary presence/absence data based on retrieval criteria related to dust (e.g. Ashpole and Washington, 2012). Information on the vertical location of dust in the atmospheric column, provided by instruments such as the Cloud-Aerosol Lidar with Orthogonal Polarization (CALIOP), can also be used to determine the presence of dust source regions, with low altitude dust likely to be proximal to a source (Todd and Cavazos-Guerra, 2016). Since satellite measurements are sensitive to the influence of all aerosol types, not just dust, results are typically verified using additional independent data sources, such as ground observations (when available), retrievals from other satellite instruments, or simulated dust fields from numerical models. Unfortunately, ground observations are few and far between in many known or likely source regions owing to their remoteness, with the combination of environmental variables required for dust emission to occur in the first place being unfavourable for human habitation.
To date, satellite data have only been used to study individual source areas in northern Canada on a case study basis (Ranjbar et al., 2021; Huck et al., 2023). The key objective of this paper is to use satellite datasets to identify where extreme dust loadings are detected most frequently across the whole of northern Canada. The primary dataset used is derived from the Moderate Resolution Imaging Spectroradiometer (MODIS) AOD, which has been widely used to identify dust source areas on a global (Ginoux et al., 2012) and regional (Baddock et al., 2016) basis, but not at high latitudes. Covering a 20+ year period, data from MODIS also enabled our assessment of temporal changes in dustiness. Additionally, we use “Aerosol Type” data from the Visible Infrared Imaging Radiometer Suite (VIIRS) instrument, and information on the vertical location of “dust” aerosol type in the atmospheric column from CALIOP, as comparison datasets to qualitatively corroborate the results from MODIS. To this end, we also compare our findings to SI from G-SDS-SBM to assess whether the satellite-derived dust emission hotspots correspond to surfaces with high emissive capacity; and, finally, our MODIS data are compared to surface AOD observations from two Aerosol Robotic Network (AERONET) stations in northern Canada – one in the high Arctic (Resolute Bay, Cornwallis Island, Nunavut) and another near a known dust source (Kluane Lake, Yukon).
2.1 Satellite-derived aerosol datasets
2.1.1 MODIS
This study uses Dust Optical Depth (DOD), derived from Aerosol Optical Depth (AOD) data, to map the distribution of dust aerosol sources. DOD is a widely used quantity (e.g., most recently by Adebiyi et al., 2025) that estimates what portion of retrieved AOD is due to extinction by mineral dust particles alone, as opposed to the total contribution to AOD from all aerosols. First employed to map the distribution of dust sources on a global scale by Ginoux et al. (2012), DOD calculations use retrievals of Ångström exponent (α) and single scattering albedo (ω) to isolate the dust contribution to AOD; α is a measure of how AOD changes with wavelength and is highly sensitive to particle size (Eck et al., 1999). Dust aerosols are typically coarser (particle radius > 1 µm) than urban and biomass burning aerosols (particle radius < 1 µm, Dubovik et al., 2002), although the dust size distribution tends towards smaller radii as distance from source areas increases due to the gravitational settling of larger particles. For coarse mode particles, values of α are low or even negative. The fraction of light that is scattered compared to being extinguished by both scattering and absorption, is given by ω. Dust absorbs solar radiation and is therefore characterised by ω values <1, separating it from nearly purely scattering coarse aerosols such as a sea salt (in the visible, e.g., Bi et al., 2018).
There are various DOD formulations in the literature, and this study employs two of them:
-
DOD is calculated according to the method of Pu and Ginoux (2016; herein denoted as DODPG16), whereby DOD is calculated from every AOD retrieval based on an empirically derived continuous function relating α to AOD (Anderson et al., 2005):
-
DOD is simply taken as the AOD value for those retrievals where α is less than a threshold value. Different studies have used different α thresholds, and here the value of 0.3 is applied following Baddock et al. (2016; herein denoted DODB16), which employed DOD to precisely analyse dust sources in the Chihuahuan Desert, one of the most active dust regions in North America. For clarity:
Both DOD formulations are derived to highlight the coarse-mode fraction of dust only, optimising them for dust source identification since the coarse-mode is estimated to account for more than 90 % of particle mass at emission (Kok et al., 2017), and since coarse mode particles remain closer to source regions.
The DOD datasets used in this study are derived from MODIS aerosol products retrieved using the “Deep Blue” algorithm, in line with the objective of our study being the identification of land-based dust source regions. Although the validation of Deep Blue products in the high Arctic is sparse (Sayer et al., 2019), we are concerned primarily with the long-term frequency of occurrence of extreme dust events, not with creating an Arctic-wide climatology of DOD. Deep Blue employs radiance measurements in the blue channels to detect aerosols globally over land, even over bright surfaces such as deserts. The algorithm exploits the fact that because surface reflectance is low and less variable in blue channels, increases of reflectance and spectral contrast indicate the presence of aerosols (Hsu et al., 2013). Our study uses Deep Blue aerosol products from the MODIS instrument (Sayer et al., 2015) carried aboard the Aqua satellite, which passes the equator at around 13:30 local time (ascending node). Products (AOD, α, ω, and various quality flags – see below) are taken from the MODIS Level 2 Joint Atmosphere product (“ATML2”), collection 6.1 (Platnick et al., 2017), with aerosol parameters stored at 10 km spatial resolution in 5 min time interval swath files. For the Aqua satellite, these files are denoted “MYDATML2”. Data were downloaded from the NASA Level-1 and Atmosphere Archive and Distribution System (LAADS) Distributed Active Archive Centre (DAAC; https://ladsweb.modaps.eosdis.nasa.gov/search/order/2/MYDATML2--61, last access: 11 January 2024). For computational efficiency, only files that contained data in the region spanning (150–50° W, 40–85° N) were obtained, for the time period spanning 4 July 2002 to 31 December 2022 (the whole period covered by the MYDATML2 dataset at the time this study was undertaken). The products used in this study were regridded from their Level 2 swath files to a regular 0.1° × 0.1° grid using nearest neighbour interpolation and mosaiced daily, thereby creating a high-resolution Level 3 product optimised for this study.
It is recommended that only aerosol products flagged as “very good” (QA = 3) are used for scientific analysis (Hsu et al., 2013). However, Baddock et al. (2016) clearly demonstrate the detrimental effect that this has for dust source detection (because of highly variable AOD values over 10 × 10 pixels of 1 km each, upon which the data quality flags are based) proximal to dust sources. Filtering for QA = 3 resulted in a fivefold loss of data and far fewer source detections in their work. This study therefore follows the recommendation of Baddock et al. (2016) to include data of all quality levels (QA = 1–3) in the analysis. However, a sensitivity analysis is performed comparing results to those obtained by applying the QA = 3 filter (Sect. 3.1).
2.1.2 VIIRS
Information on aerosol type is obtained from Visible Infrared Imaging Radiometer Suite (VIIRS) Deep Blue aerosol products, which include an “aerosol type” classification. The classification is based on AOD and α retrievals, as well as a series of smoke tests, based on the spectral variation of measured reflectance. The algorithm is outlined in detail in Hsu et al. (2019) and verified against other satellite products/imagery and AERONET data by Sayer et al. (2019); as in the case of MODIS Deep Blue products, VIIRS Deep Blue Arctic validation is sparse. In brief, retrievals are given the aerosol type classification “dust” when:
-
AOD > 0.3,
-
Smoke tests determine the retrieval not to be smoke,
-
The AOD > 0.3 threshold is applied to minimise the effect of variable surface reflectance in the visible wavelengths; retrievals not meeting this threshold are given the “background” aerosol type. Where the AOD threshold is met, smoke is ruled out, and α>1, the aerosol type is set to “non-smoke fine mode”, while those retrievals with 0.5<α<1 are determined to be “mixed” aerosols. It should be noted that retrievals performed over clouds or snow/ice surfaces are excluded from the product, as are retrievals performed over coastal pixels, to avoid subpixel mixed surface-type issues (since the surface type determines whether aerosol retrievals are performed using the Deep Blue algorithm (land) or Satellite Ocean Aerosol Retrieval (SOAR) algorithm).
VIIRS aerosol products used in this study are from the VIIRS sensor carried onboard the Suomi National Polar-orbiting Partnership (S-NPP) satellite, which has an equator crossing time (ascending) of 13:30 local time. Level 2 “AERDB_L2_VIIRS_SNPP” files (VIIRS Atmosphere Science Team, 2023) were downloaded from the NASA LAADS DAAC (https://ladsweb.modaps.eosdis.nasa.gov/search/order/1/AERDB_L2_VIIRS_SNPP--5200, last access: 11 January 2024). Version 2.0 data are used. As with MODIS data, only files that contained data in the region spanning (150–50° W, 40–85° N) were obtained, for the period spanning 1 January 2020 to 31 December 2022 (a three-year subset of the period covered by MODIS data used in this study). Likewise, data were regridded from their Level 2 swath files (native resolution 6 × 6 km2) to a regular 0.1° × 0.1° grid using nearest neighbour interpolation and mosaiced daily.
2.1.3 CALIOP
To obtain information on the vertical distribution of dust in the atmosphere – specifically to address the question of whether it is close to the surface and therefore indicative of local emission – aerosol type classification data from the Cloud-Aerosol Lidar with Orthogonal Polarization (CALIOP) are used. CALIOP products have been used in global aerosol source attribution studies (Prijith et al., 2013), and the vertical information in retrievals has been exploited to detect dust emission at the surface in the Sahara Desert (Todd and Cavazos-Guerra, 2016). CALIOP is carried aboard the Cloud-Aerosol Lidar and Infrared Pathfinder Satellite Observations (CALIPSO) platform, which also has an equator crossing time of 13:30 local time (ascending). CALIOP has been making vertical profile measurements of the Earth's atmosphere on a global scale since June 2006 and provides information on layer types for both clouds and aerosols (Winker et al., 2010). Its aerosol classification algorithm uses altitude, location, surface type, estimated particulate depolarization ratio, and integrated attenuated backscatter to identify the aerosol subtype (Omar et al., 2009); aerosol type “dust” corresponds to an estimated depolarization ratio > 0.20, and all aerosol subtypes are now allowed over the polar regions (Kim et al., 2018).
For this study, the CALIPSO lidar Level 3 (L3) tropospheric aerosol profile “all sky” product, Version 4.20 is used (“CAL_LID_L3_Tropospheric_APro_AllSky-Standard-V4-20” files). Parameters included in the “all sky” L3 files are derived from the Version 4 CALIOP Level 2 (L2) aerosol profile product with a horizontal resolution of 5 km. Prior to aggregating, L2 data are quality screened to reduce the impact of, e.g., layer detection or classification errors, then aggregated monthly on a grid of dimensions 5° longitude × 2° latitude × 60 m vertical (for altitudes between −0.5 and 12 km) (Tackett et al., 2018). This ∼ 200 km × 200 km level of aggregation (at high latitudes) compensates for the narrow (i.e., 70 m) footprint of the laser on the ground, produced every km, during each orbit (narrow as compared to MODIS and VIIRS orbital swaths of 2330 and 3060 km, respectively). This study uses the “aerosol type” parameter from the L3 files. The “aerosol type” parameter stores the monthly sums of the number of Level 2 samples (“sample” equals the number of measurement opportunities within the grid cell) having the CALIPSO aerosol types “clean marine”, “dust”, “polluted continental/smoke”, “clean continental”, “polluted dust”, “elevated smoke”, and “dusty marine” within each L3 latitude/longitude/altitude grid cell. Results presented here are based only on analysis of the “dust_nsamples” parameter, i.e., “polluted dust” and “dusty marine” are excluded. Data were downloaded from the NASA Earthdata portal (https://search.earthdata.nasa.gov/search, last access: 11 January 2024), for the period spanning June 2006–July 2020 inclusive. Only daytime files were used in the analysis.
2.2 Other datasets
Data from the Global Sand and Dust Storms Source Base Map (“G-SDS-SBM”; Vukovic-Vimic, 2021, 2022) were used as an independent source of information to verify the dust emission potential of the satellite-identified dust emission hotspot areas. Specifically, the source intensity parameter was used, “SI”, with values from 0 (no capacity to emit dust) to 1 (capacity to emit at or above the 99th percentile level of soils, globally). G-SDS-SBM was developed by the United Nations Convention to Combat Desertification (UNCCD) in collaboration with the United Nations Environment Programme (UNEP) and World Meteorological Organization (WMO). It was derived using information on soil texture, bare land fraction, land cover, topography, and climatological extremes in topsoil moisture (low, 2014–2018) and temperature (high, 2014–2018). It assumes a spatiotemporally constant strong wind (friction velocity of 1 m s−1). As such, values of SI represent the normalized maximum potential of the surface to emit dust under favourable meterological (i.e., wind speed) and surface (i.e., soil moisture and temperature) conditions, and are available for the months of January, April, July, and October. SI data were regridded using bilinear interpolation in cdo from their native 30 arcsec resolution (∼ 0.008°) to 0.1° to match the MODIS data used in this study.
For verification of satellite-based AOD results, data from the Aerosol Robotic Network (AERONET; Holben et al., 1998) are used. AERONET is a network of ground-based sun photometers that retrieve AOD and other atmospheric properties in the column above the instrument, based on solar extinction within the column. This study uses data from two AERONET stations in the broad study region of northern Canada: Kluane Lake (Yukon; 61.027° N, 138.410° W) and Resolute Bay (Nunavut; 74.705° N, 94.969° W; station locations are marked on Fig. 11). The Kluane Lake AERONET station was intentionally located proximal to a known dust source with the purpose of monitoring emission processes there (e.g. Huck et al., 2023, Sayedain et al., 2023) and has been providing data between April and November since 2018 (with varying temporal coverage by year). Resolute Bay is an Arctic monitoring site, providing data since 2004 (also with varying temporal coverage, also restricted to the months of April – November). Arctic aerosol studies have demonstrated that the site detects transported Asian dust during the spring and smoke aerosols during the summer, and that during summer months the area is also subject to wind-induced sea-salt-spray aerosol and potentially dust derived from more localised sources, based on the analysis of retrieved particle size distributions (Tomasi et al., 2015; AboEl-Fetouh et al., 2020).
Data from both stations were downloaded from the AERONET website (https://aeronet.gsfc.nasa.gov/, last access: 11 January 2024), and this study analyses Level 1.5 cloud-screened AOD retrievals at 500 nm, processed by the Version 3 algorithm (Giles et al., 2019). Only retrievals performed within 11 am and 5 pm local time were considered for analysis (which roughly corresponds to a 6 h window centred on the local overpass time of both passive sensor satellites). The maximum retrieved AOD each day within this time window was retained for comparison to maximum satellite-derived parameters, in keeping with the objective of this study being to quantify the frequency of occurrence of extreme dust events as a proxy for emission sources.
Two additional datasets are used in this study. Firstly, wind fields discussed in Sect. 3.6 are taken from the European Centre for Medium-Range Weather Forecasts Reanalysis Version 5 (ERA5), with a spatial resolution of 0.28125° (∼ 31 × 31 km) and 137 vertical levels (Hersbach et al., 2017; downloaded from the Copernicus Climate Data Store at https://doi.org/10.24381/cds.143582cf). Surface elevation data, also discussed in Sect. 3.6, are taken from the Global Multi-resolution Terrain Elevation Data 2010 dataset (GMTED2010; Danielson and Gesch, 2011; downloaded from https://www.temis.nl/data/gmted2010/index.php, last access: 11 January 2024), at 0.0625° resolution.
3.1 Inferences about dust over Canada from MODIS
Since DOD values will be elevated by both locally sourced and long-range transported dust, this study applies a threshold to DOD data to identify areas of more frequent signatures of extreme dust loadings, which we assume to be largely undiluted and locally sourced dust. A high frequency of occurrence (FoO) of DOD above a specified threshold relative to the surrounding region is commonly used to indicate a local dust source region (e.g., Ginoux et al., 2012; Baddock et al., 2016). The FoO is simply the total number of observations in the time series that meet a given DOD threshold, expressed as either an absolute value or a relative value given the total number of observations in the time series. DOD threshold selection is somewhat subjective and depends upon the amount of long-range transported dust present in the atmosphere as well as the intensity of local emission. For example, Ginoux et al. (2012) applied a DOD threshold of 0.2 globally and experimented with higher and lower thresholds regionally; Baddock et al. (2016) applied a DOD threshold of 0.75 to pinpoint sources on a landscape-scale; and Pu et al. (2020) experimented with DOD thresholds ranging from 0.02 for less dusty regions to 0.5 for global dust emission hotspots such as North Africa. This paper shows results using DOD thresholds of 0.5 and 1, with the effect of other threshold choices (between 0.1 and 1.5) documented in Fig. S1 in the Supplement. The higher DOD threshold of 0.5 also helps to minimize thin cirrus contamination in the Arctic, as these typically have cloud optical depths of 0.03–0.30 (e.g., Pierce et al., 2010). A single event of active dust source emission targeted by our approach (including visible imagery) is included in Fig. S2, in the context of regional-scale AOD signals.
Maps of FoO DODPG16>0.5, which we stress are not comparable to climatologies of DOD itself, show several distinct features (Fig. 1a). There is a broad swath of FoO > ∼ 50 in southern Alberta and Saskatchewan, extending across the border with the United States; this feature is associated with croplands, as discussed more fully in Sect. 3.2. The remaining northern features are of direct interest to the high-latitude dust question: most notably, the numerous spatially discrete dust emission hotspots (FoO > 80) scattered across the islands (north of 70° N) that make up Canada's Arctic Archipelago. There are a few additional isolated FoO hotspots in continental northern Canada, for example in southern Northwest Territories close to the border with the Yukon Territory (MacKenzie Mountains, pink square in Fig. 11), in northwestern continental Nunavut (green square in Fig. 11), and at the border between northern Québec and Labrador (blue square in Fig. 11). Many of these emission hotspots correlate with “barren land” classifications in the Canadian Land Cover Atlas. Notably, the greatest FoO values are in the Arctic Archipelago, as opposed to further south where dust is perhaps more commonly expected to be present (e.g., due to higher temperatures and lower snow cover).
The pattern in FoO DODB16>0.5 (Fig. 1b) is qualitatively similar to that in FoO DODPG16 (Fig. 1a), with two exceptions. Firstly, FoO values are around 50 % lower in the DODB16 dataset, as can be seen from the colorbars; secondly, the northern FoO hotspots tend to be focussed east of 95° W in DODB16, whereas they are distributed more evenly across the full longitudinal extent of Canada's north in DODPG16. Lower FoO values may be expected in DODB16 than DODPG16 because the former is only reported for subsets of AOD retrievals that meet certain filtering criteria (if α<0.3 then AOD = DOD), whereas the latter is calculated for all AOD retrievals with no such α-based filtering applied (ω<1 is a filter applied to both DODPG16 and DODB16 datasets; see the DOD equations outlined in Sect. 2.1.1). We examined retrieved Ångström exponent and single scatter albedo values in our study region in summer (JJAS 2003–2022) and indeed find that α<0.3 (larger particles) and ω<1 (absorbing particles) occurs more frequently east of 95° W (Fig. S3), accounting for the differences between Fig. 1a and b.
MODIS AOD retrievals – upon which DOD is based – are more numerous at southern latitudes than in the far north (Fig. 1g–i) for reasons such as cloud and snow cover, and the lack of reflected visible radiation during northern winter (polar twilight and night of varying duration occurs north of 67° N) which is required for AOD retrievals. To account for this, FoO DOD > 0.5 values are normalised across the study domain by dividing the FoO count by the total number of available DOD retrievals. The resulting maps for both DOD datasets (Fig. 1d–e) show that the relative frequency of DOD > 0.5 is far greater in the north than for the broad emission hotspot across the Canada-US border, with values exceeding 50 % in DODPG16 in some locations and reaching 100 % in DODB16 (values closer to 100 % are more likely in DODB16 than DODPG16 due to its threshold-based derivation, as discussed above). However, the geographic mean of the relative FoO of DOD > 0.5 in the Pu and Ginoux (2016) formulation of dust optical depth (i.e., mean % FoO DODPG16>0.5) is just 9 % when averaged over the Canadian Arctic Archipelago (taken as 70–80° N, 125–75° W) over a 20-year period (Fig. S4). This compares well with the relative frequency of detectability of dust in the work of Sayedain et al. (2023), who examined dust events in May of 2019 at Kluane Lake (downstream of a known dust source). Specifically, Fig. 4 in that work shows “DRS” occurring on 16 of 31 d, where “DRS” represents the detectability by ground-based remote sensing (such as by AERONET techniques) of “optically significant” dust; the authors later reported that ∼ 11 % of the DODs associated with Fig. 4 were greater than 0.5 (Sayedain and O'Neill, 2025).
Next, we applied the same threshold of 0.5 to the “parent” AOD data (Fig. 1c, f). Overall FoO AOD > 0.5 values are greater across Canada, as expected, but the northern hotspots remain, with FoO exceeding 200 at some locations. The greater values for FoO AOD > 0.5 across Canada, in regions where FoO DOD is close to zero, shows the value of using DOD data to highlight the contribution of dust particles to the retrieved AOD value, against the contribution from other aerosols that are present in the atmosphere.
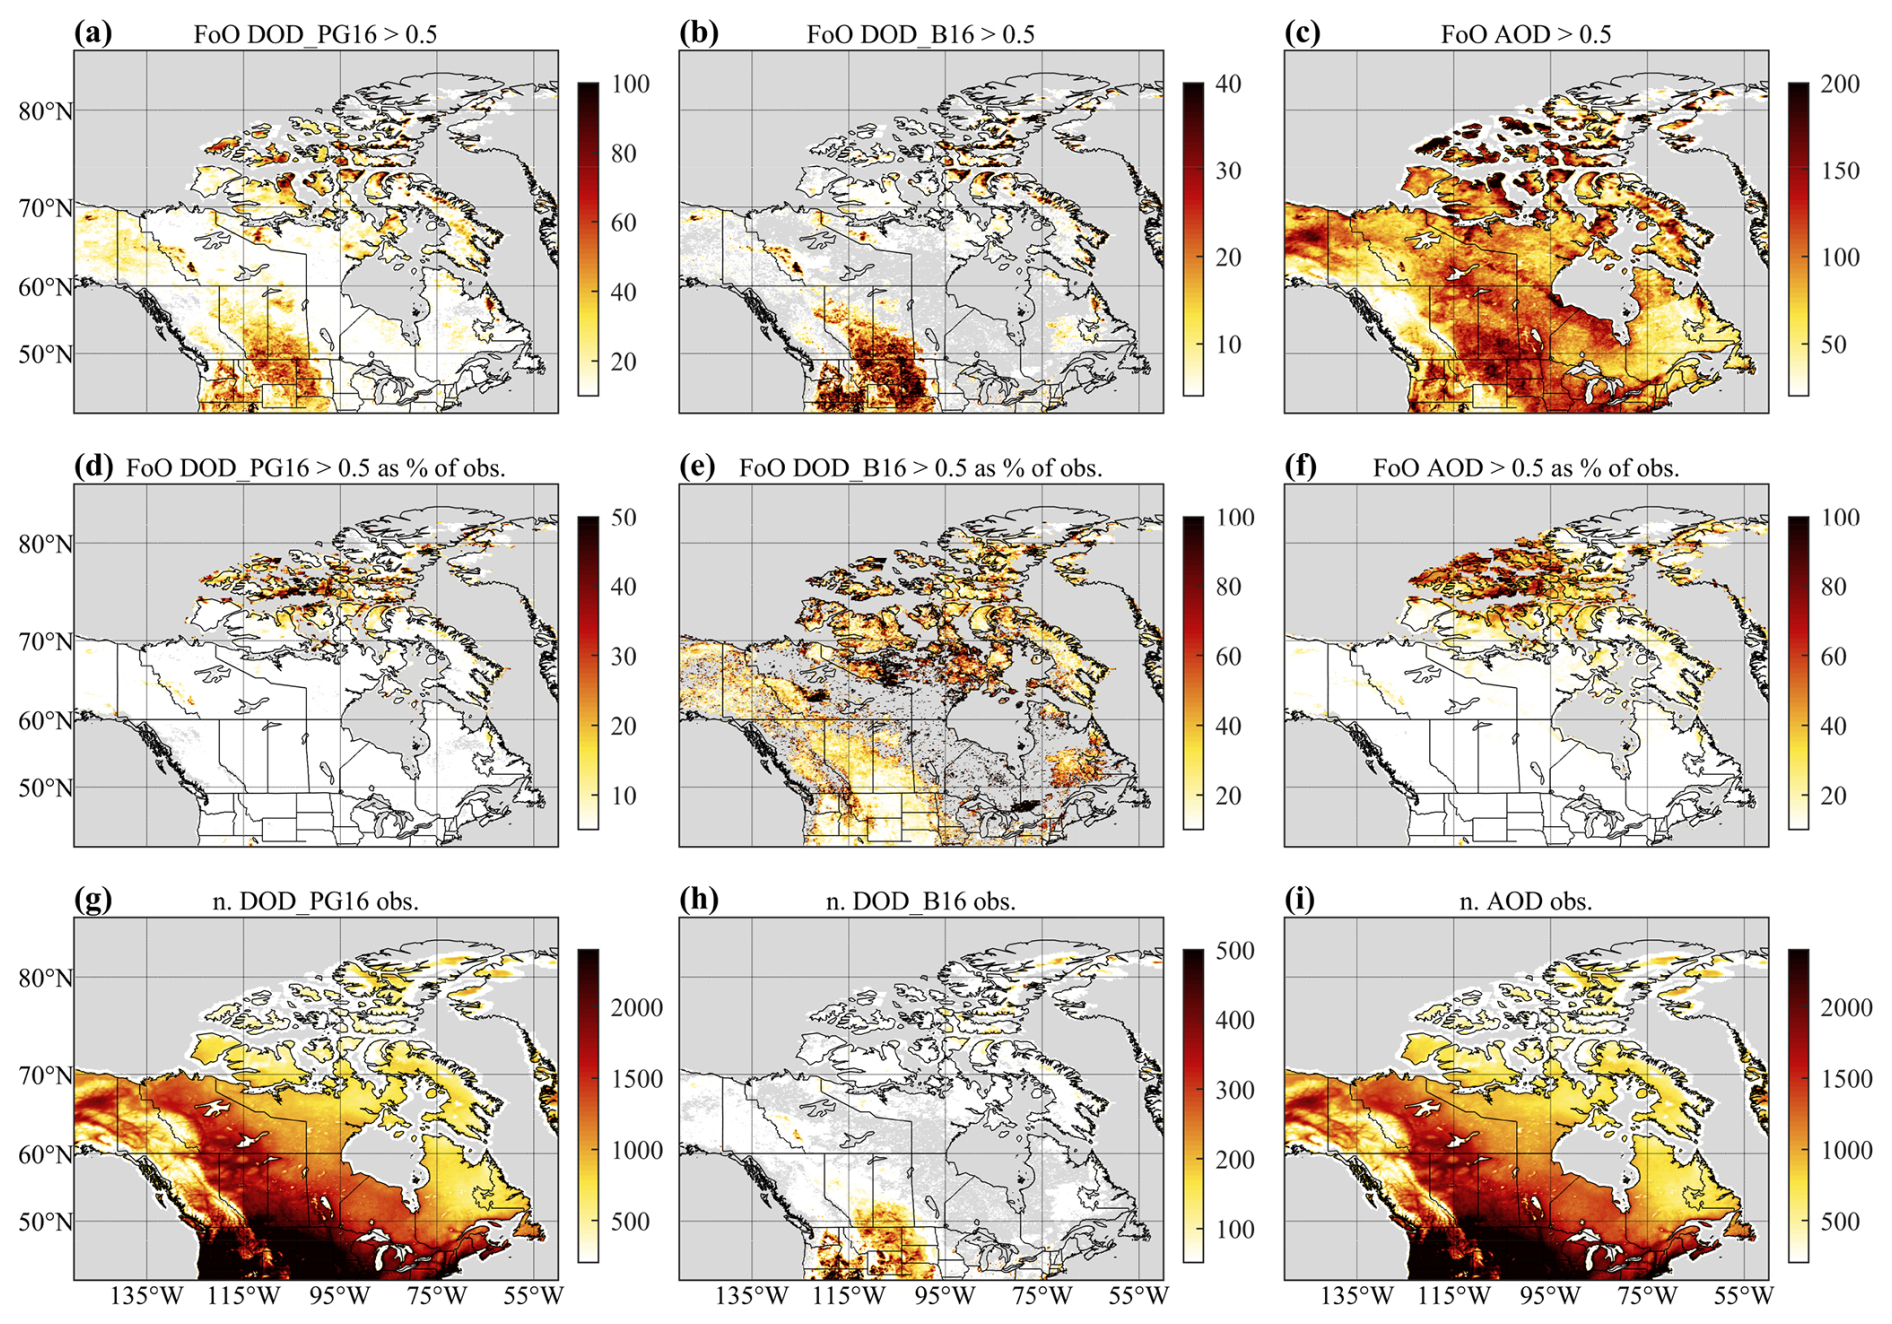
Figure 1Frequency of Occurrence (FoO) of (a) DODPG16 > 0.5, (b) DODB16 > 0.5, and (c) AOD > 0.5. FoO as a percentage of the number of retrievals available is shown in panels (d) DODPG16 > 0.5, (e) DODB16 > 0.5, and (f) AOD > 0.5, with corresponding number of retrievals available shown in panels (g) DODPG16, (h) DODB16, and (i) AOD. Note the different colour scales used. Grey shading corresponds to no data. All panels are based on MODIS data for 2003–2022.
If the DOD (or AOD) threshold is increased to 1, FoO values decrease (maximum values < 20) and the spatial extent of emission hotspots contracts (see Fig. 2a and b for a comparison of FoO DODPG16 with the thresholds of 0.5 and 1 respectively; note that maps for FoO DODB16 > 1 and FoO AOD > 1 are included in Fig. S5). However, many spatially discrete emission hotspots in the north remain in attenuated form (compare Fig. 2d, e).
There are no DOD products north of 70° N between the months of October and April inclusive (Fig. 3, left column). This is to be expected due to a combination of (a) polar night during parts of the winter preventing satellite AOD retrievals based on visible wavelengths and (b) the fact that much of the surface is frozen, which inhibits the atmospheric entrainment of surface-derived dust particles. For these reasons, DOD retrievals in the high Arctic predominantly occur during the months of June, July, and August (Fig. 3, right column), with May and September representing the shoulder seasons (Fig. 3, middle column).
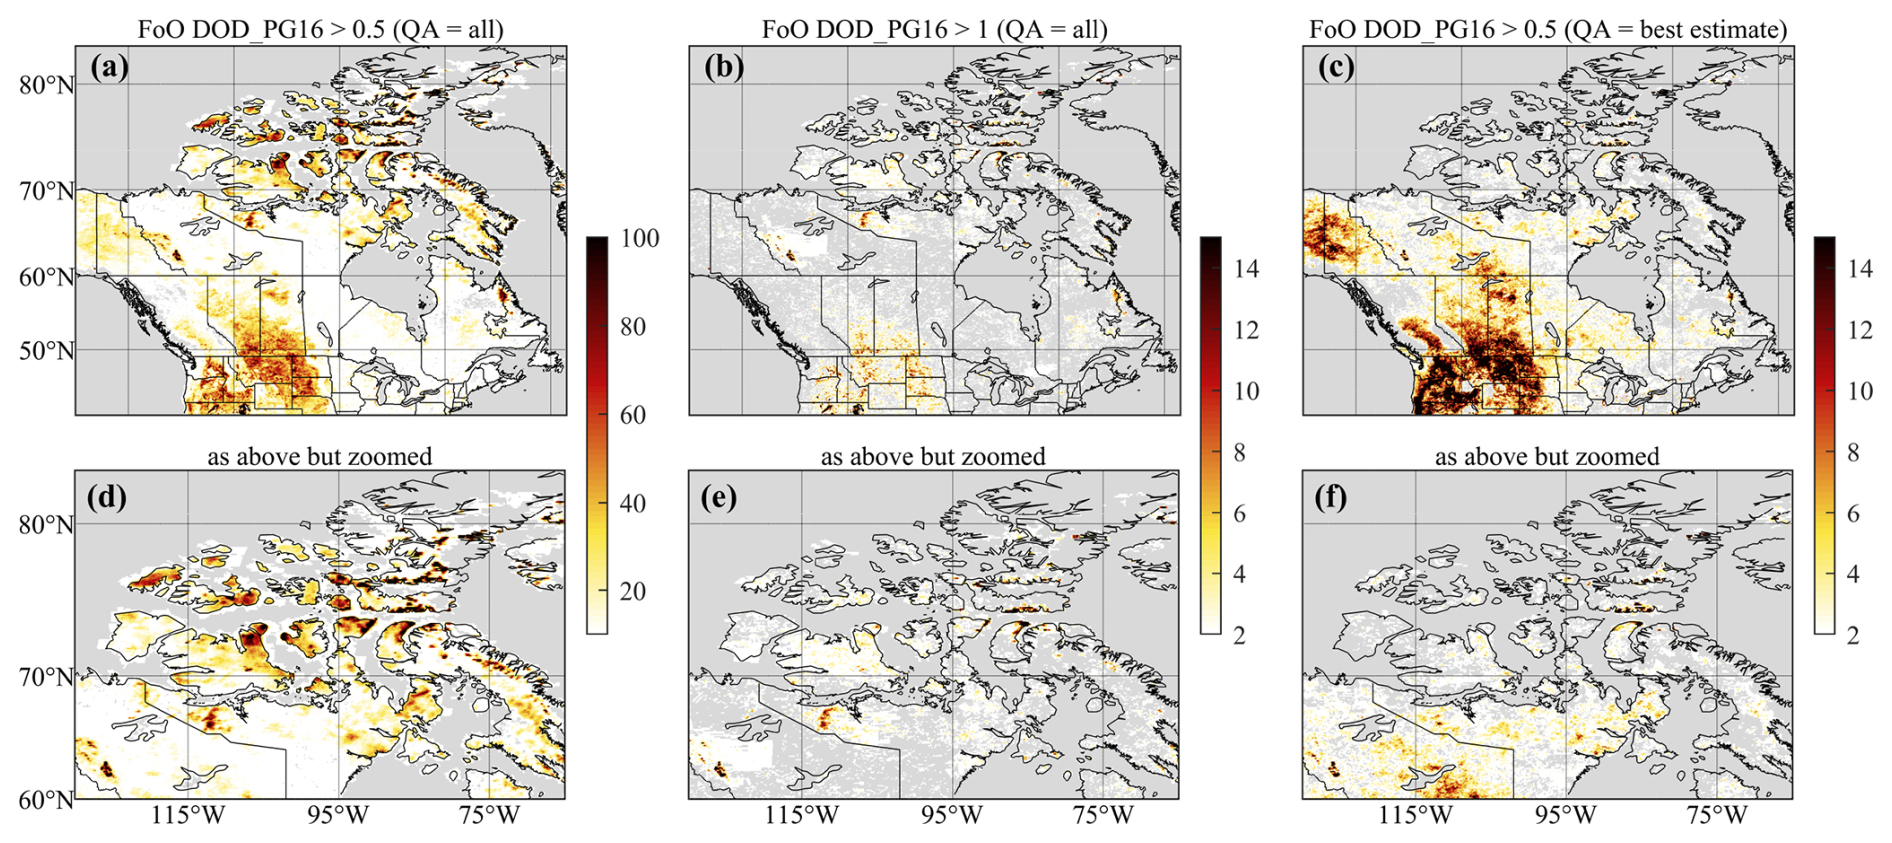
Figure 2(a) Frequency of Occurrence (FoO) of DODPG16 > 0.5, using data at all quality levels (i.e. not screened for “best estimate” quality flag). Note that this is a reproduction of Fig. 1a. (b) FoO DODPG16>1, using data at all quality levels. (c) FoO DODPG16>0.5, using data screened for “best estimate” quality flag. (d)–(f) as (a)–(c) but zoomed to better highlight northern emission hotspots. Grey shading corresponds to no data. All panels are from MODIS data for 2003–2022.
The results discussed in Figs. 1 and 2 thus far are based on AOD retrievals that are not filtered using the “best estimate” data quality flag that is distributed with the data. As discussed at the end of Sect. 2.1.1, this is based on the findings of Baddock et al. (2016), wherein the DOD based on the unfiltered AOD dataset was of greater value for dust source detection – a core aim of this paper – as opposed to DOD calculated using only the AOD retrievals that remain after filtering for the “best estimate” quality flag. The present analysis was replicated by applying the “best estimate” quality flag filter to the AOD data to test the effect of this choice. This resulted in a significant reduction in FoO DOD (and AOD) > 0.5 values and a consequent contraction of the emission hotspot areas (Fig. 2c and a show a comparison of FoO DODPG16>0.5 with and without the “best estimate” quality flag filter, respectively; note that equivalent maps for DODB16 and AOD are included in Fig. S6), however, many of the isolated emission hotspots in the high Arctic remain in attenuated form (compare Fig. 2d and f). Over the high Arctic, the magnitudes and spatial patterns in these maps (Fig. 2d and f) are similar to those of FoO DODPG16>1 created using data unfiltered by the quality flag (Fig. 2b and e).
The dust emission hotspots inferred in this section from MODIS DOD data will be evaluated against the dust emission potential map in Sect. 3.4, examined over time in Sect. 3.5, and evaluated against two AERONET stations in Sect. 3.6.
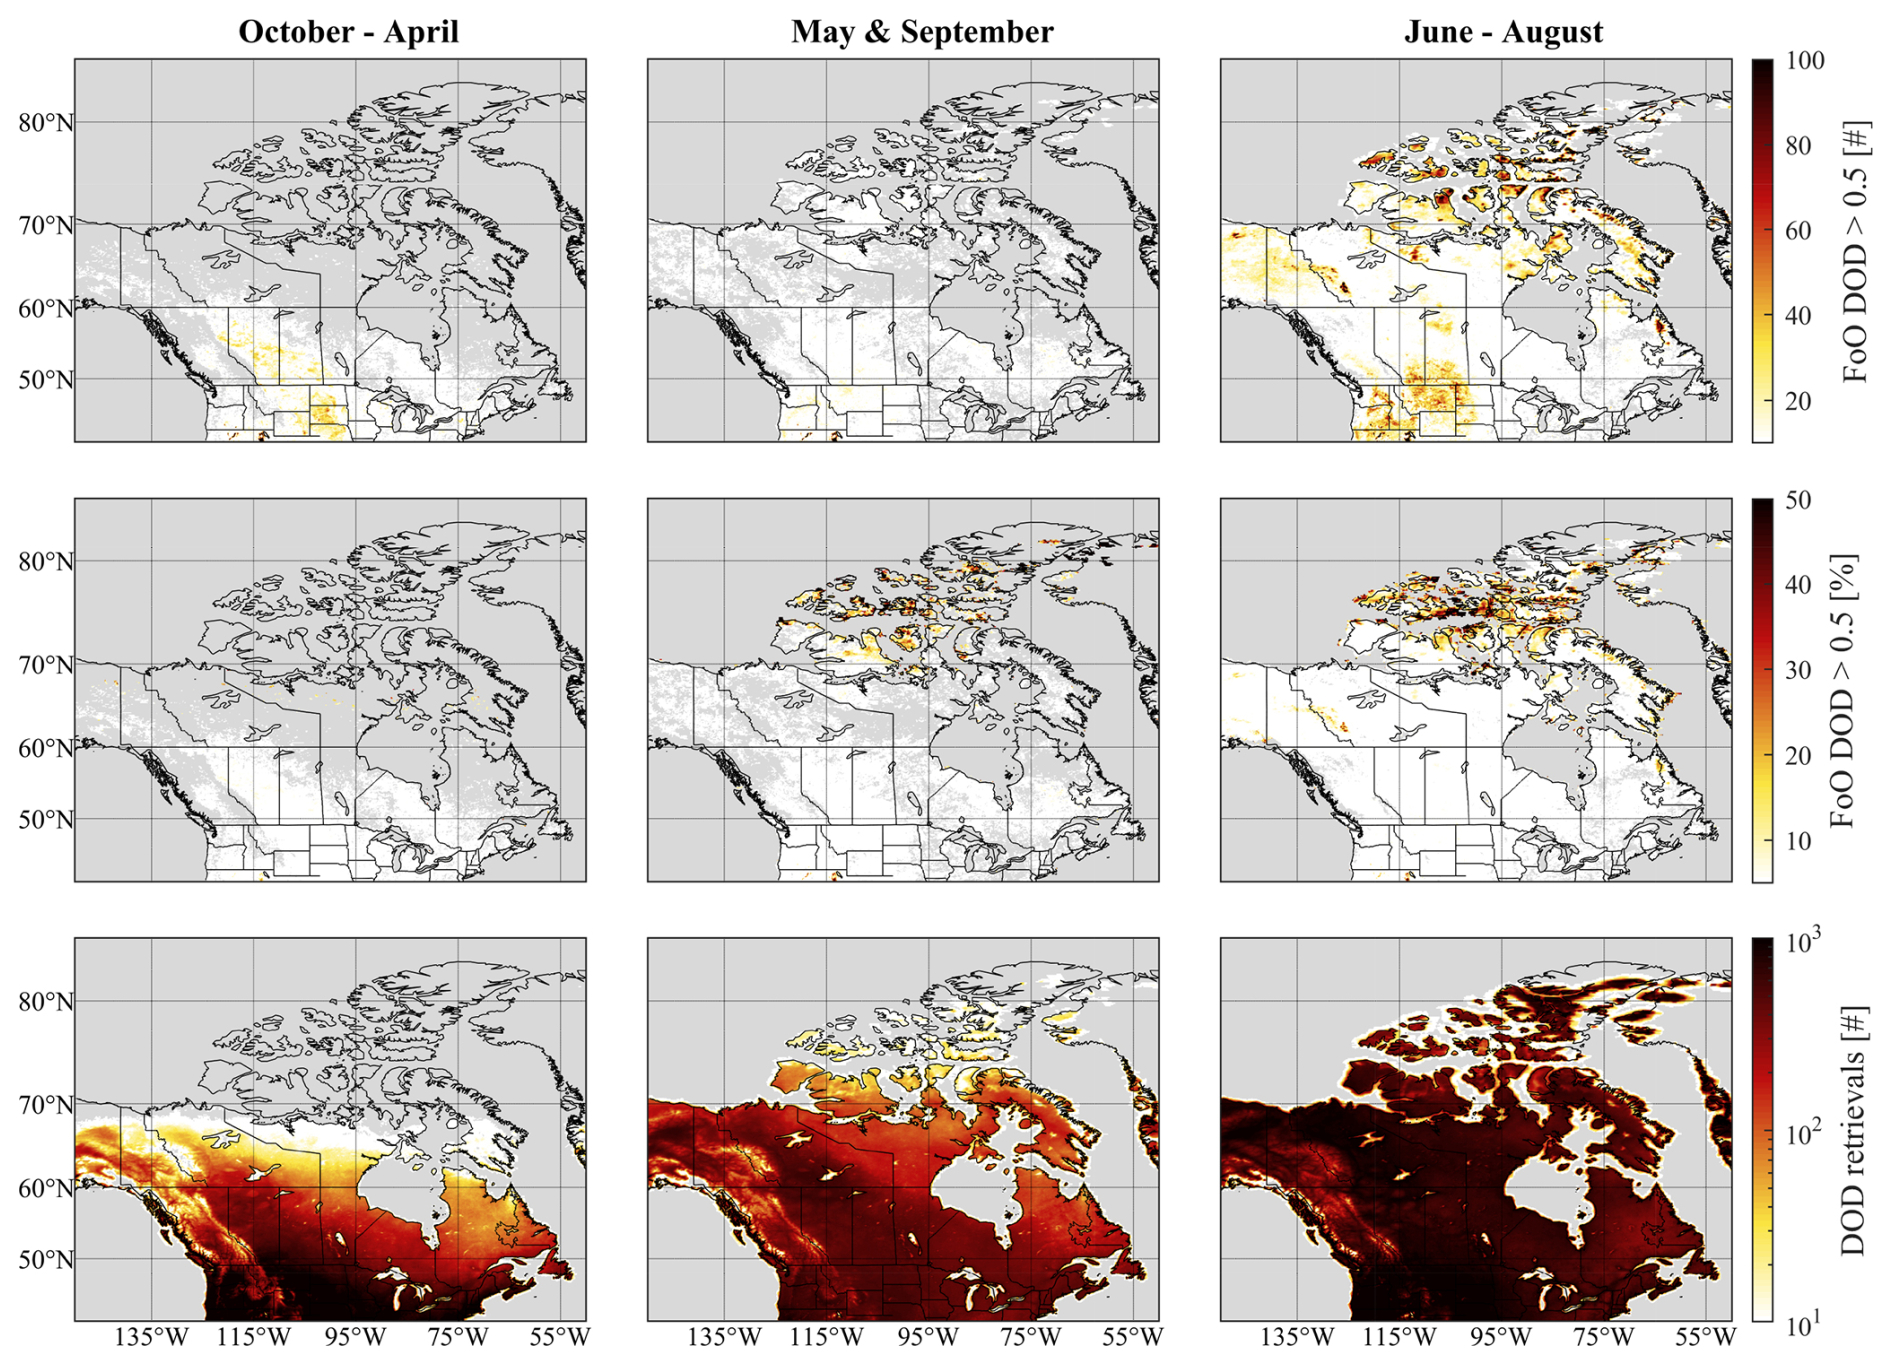
Figure 3Seasonal cycle in FoO DODPG16>0.5 over Canada (MODIS data spans 2003–2022). (Top row) FoO DODPG16>0.5, by season. (Middle row) FoO DODPG16>0.5 as a percentage of the number of DODPG16 retrievals, by season. (Bottom row) number of DODPG16 retrievals, by season. (Left column) October – April inclusive (winter season). (Middle column) May and September (shoulder season). (Right column) June – August inclusive (summer season). Grey shading corresponds to no data.
3.2 Inferences about dust over Canada from VIIRS
We now turn to a qualitative but independent comparison of our MODIS-based assessment of the FoO of extreme dust events (DOD > 0.5) by the FoO of VIIRS aerosol type “dust”. The frequency with which VIIRS aerosol retrievals were classified as aerosol type “dust” (FoO ATDUST) for the period 2020–2022 is shown in Fig. 4a. Greatest FoO ATDUST values are seen north of 65° N over land, with values exceeding 80 in some emission hotspot regions for the 3-year period. In absolute terms, this is comparable to the FoO of Fig. 1a, but when the shorter time period is accounted for in the MODIS dataset (Fig. 4c), then maximum FoO values of ATDUST are higher in the VIIRS dataset. When represented as a percentage of the number of all aerosol type retrievals, dust is clearly the dominant retrieval type over much of the land area of northern Canada (Figs. 4d and S6), accounting for >80 % of all aerosol type retrievals in some emission hotspots. However, we note that some of these high percentage areas have quite low FoO ATDUST (<10), and much lower numbers of retrievals compared to the MODIS dataset (cf. Fig. 3 bottom row and Fig. S6 bottom right). Figure 4a shows that ATDUST is also being retrieved over water (by the SOAR algorithm, as noted in Sect. 2.1.2) with increasing frequency towards lower latitudes and a stark land-water contrast (both over open salt water and inland fresh water like the Great Lakes). This FoO feature is attenuated in the relative representation of FoO in Fig. 4d, even though the land-water contrast remains; we do not interpret it as dust.
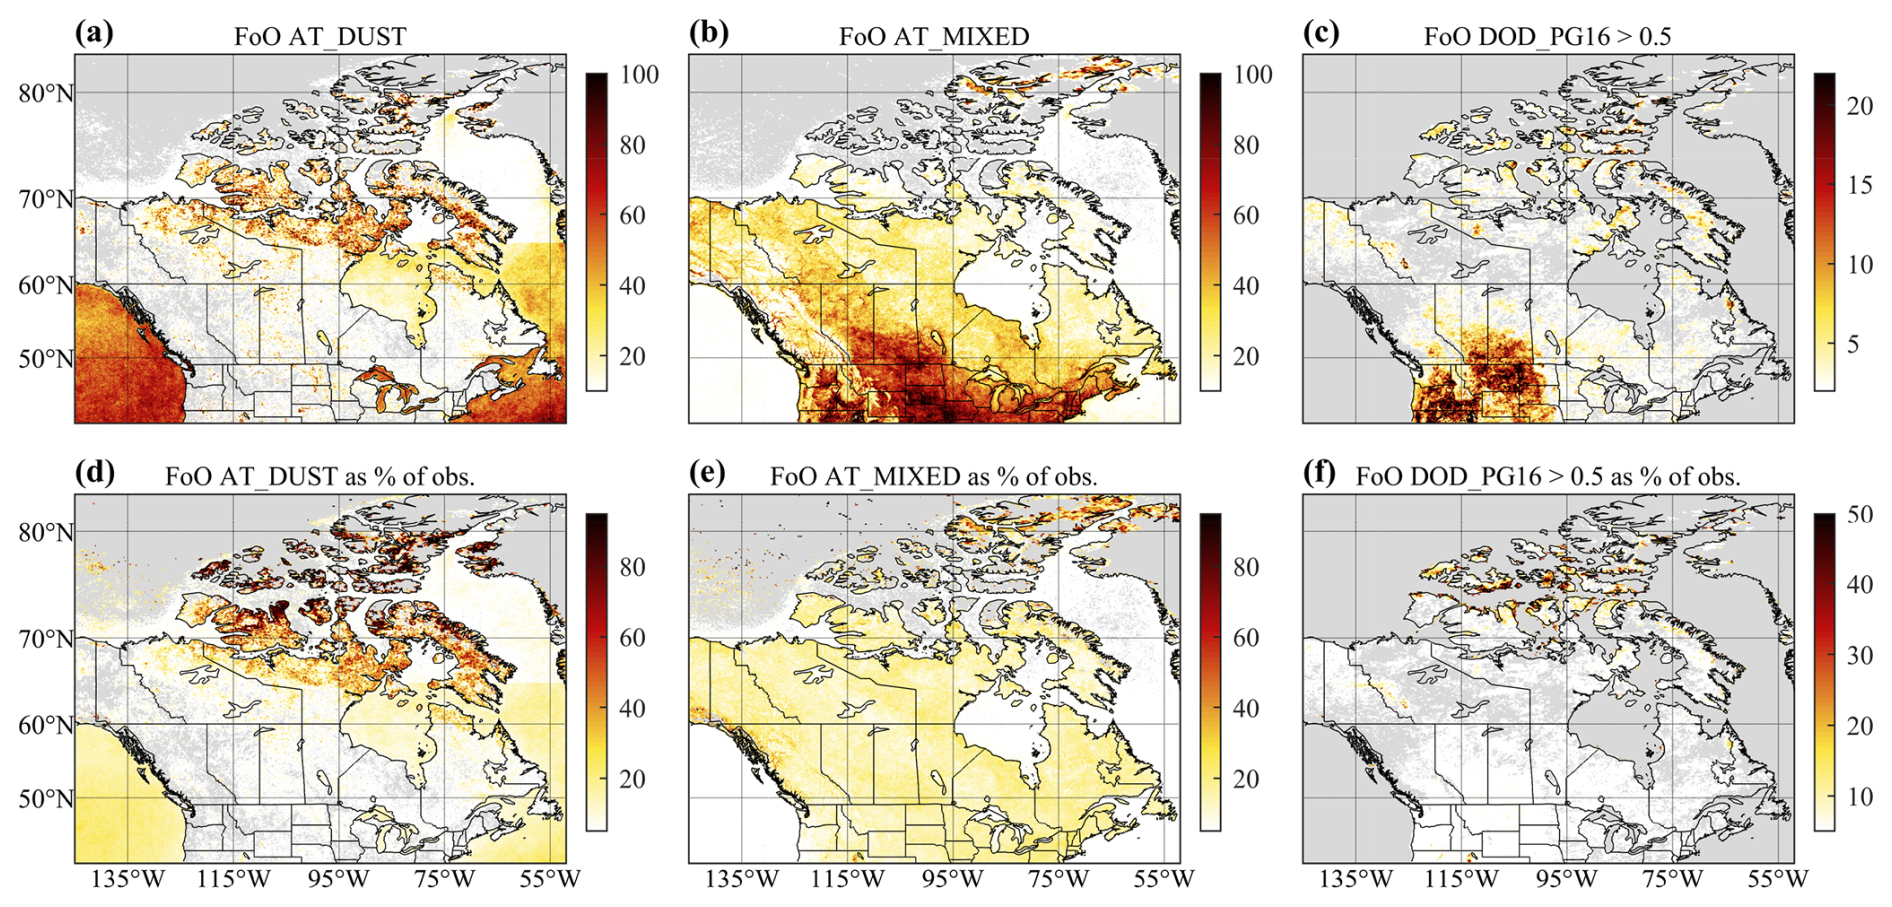
Figure 4Frequency of Occurrence (FoO) of (a) VIIRS aerosol type (AT) = “dust” (ATDUST), (b) VIIRS AT = “mixed” (ATMIXED), and (c) MODIS DODPG16>0.5. FoO expressed as a percentage of the number of available retrievals for (d) ATDUST, (e) ATMIXED, and (f) MODIS DODPG16>0.5. Note the different colour scales used. Grey shading corresponds to no data. All panels are from data only for the period 2020–2022 inclusive.
Aside from type “dust”, there are large areas with an aerosol type classification of “mixed” (FoO ATMIXED) north of ∼ 80° N on Ellesmere Island and in the surrounding region (Fig. 4b), accounting for a high proportion (>60 %) of total aerosol type retrievals there (Figs. 4e and S6). “Mixed” aerosol type is also widespread south of 70° N, reaching peak values in south-central Canada and extending across the border with the US, where it accounts for 20 %–30 % of all aerosol type retrievals (with most of the other retrievals being classified either as “smoke”, “non-smoke fine mode”, or “background” aerosol type – see Fig. S7 in the Supplement for an analysis of all VIIRS aerosol types in this dataset). “Mixed” aerosol type (0.5<α<1) is indicative of smaller particles than the large dust aerosol type (α<0.5), however, smaller clay fraction (<2 µm) dust particles do in fact dominate the emitted number size distribution (e.g., Kok, 2011; González-Flórez et al., 2023), and they can reasonably be expected to be found both close to sources and further away after long-range transport (e.g., Prospero, 1999; Zhao et al., 2022) because of their week-long lifetimes (Kok et al., 2017) – even though in remote sensing dust is generally taken as the coarse mode in order to avoid this ambiguity. While the polar dome isolates midlatitude pollutants from the high Arctic in summer (e.g., Gong et al., 2023), nevertheless, it is unknown what proportion of the “mixed” aerosol type is attributable to smaller dust and, therefore, we interpret VIIRS “mixed” aerosols as only potential dust indicators, especially where they occur as discrete source areas in the high Arctic (as opposed to a homogeneous background further south) and where they coincide with areas of high emission potential in the dust emission potential map (Sect. 3.4).
As noted above, for direct comparison, FoO DODPG16>0.5 is shown for the sub-period 2020–2022 (Fig. 4c, f). It is apparent that in the north, peak FoO ATDUST is greater than peak FoO DODPG16>0.5 and that the area of FoO ATDUST is larger than it is for FoO DODPG16>0.5. However, such differences are to be expected since these datasets are derived differently (as outlined in Sect. 2.1). Specifically, the FoO ATDUST map will include dust that did not pass the DODPG16>0.5 threshold (i.e., VIIRS ATDUST requires AOD > 0.3 with α < 0.5, while MODIS DODPG16>0.5 requires, based on Eq. (1), e.g., AOD > 0.74 if α=0.5 and AOD > 0.51 if α=0). Moreover, even if DODPG16 was calculated from VIIRS AOD data and compared directly to that based on MODIS AOD (either from Terra or Aqua), differences would still be expected because of sensor and algorithm differences leading to systematically lower VIIRS AOD values at high northern latitudes (Sayer et al., 2019, their Fig. 16) and more complex difference patterns (spatially) in the Ångström exponent (Sayer et al., 2019, their Fig. 17); a detailed analysis of these differences is outside the scope of this work. Nonetheless, there is qualitative agreement between the two datasets we presented on numerous emission hotspot areas across the high Arctic. Lastly, the large southern emission hotspot evident in FoO DODPG16>0.5 (Fig. 4c) is likely dust emitted and transported in the large-area dust sources of the Great Plains of Canada and the US (e.g., Lambert et al., 2020); this is consistent with the spatial coincidence with a peak in FoO ATMIXED in the Great Plains (Fig. 4b), where croplands are found, and where possibly finer dust is expected to be mixed with generally finer anthropogenic aerosols. The dust emission hotspots inferred in this section from VIIRS “dust” aerosol type data will be evaluated against the dust emission potential map in Sect. 3.4.
3.3 Inferences about dust over Canada from CALIOP
Additional qualitative but independent corroboration of our MODIS-based assessment of the FoO of extreme dust events (DODPG16>0.5) was made with the FoO of CALIOP aerosol type “dust”, which adds vertical distribution information. As outlined in Sect. 2.1.3, this product shows the number of times an aerosol of type “dust” (dust aerosol types “polluted dust” and “dusty marine” were excluded in this study) is detected in a bin of 5° longitude × 2° latitude × 60 m vertically (∼ 200 × 200 km in the Arctic, but based on individual 5 km L2 products) per month. The monthly totals were summed for JJA 2006–2020, inclusive, and these period-sum values were then averaged for the latitude band 60–80° N, due to their sparseness (Sect. 2.1.3). A longitude-height plot of the resulting data (Fig. 5) shows evidence of enhanced aerosol type “dust” detection frequency at low altitudes (<2 km) for the longitude range between 125–75° W, in good agreement with the longitudinal range spanned by the dust emission hotspot regions identified in both the MODIS and VIIRS datasets previously discussed. Low-altitude Arctic dust in summer is also in agreement with the source-tagged modelling work of Shi et al. (2022), who found that high-latitude dust constitutes 30.7 % of the total Arctic dust burden in the lower troposphere, on account of typically stable boundary layers and limited vertical transport; in JJA the origin of free tropospheric Arctic dust is approximately evenly split between east Asian sources, central Asian and Saudi Arabian sources, and north African sources. Dust detection frequency values that are lower at higher altitudes across this region, and lower immediately to the east and west of the region, suggest surface sources of dust emission in the region. The near-surface enhancements in dust detection frequency between ∼ 50 and 25° W (between 2.5 and 5 km), as well as between 25 and 15° W (below 2 km) are consistent with emission from sources in Greenland and Iceland, respectively, which have been documented elsewhere (see, e.g., Meinander et al., 2022). However, there are known issues with CALIOP aerosol misclassification of diamond dust (very small ice crystals in clear skies) as mineral dust, most prominent in winter (e.g., Zamora et al., 2022; Di Biagio et al., 2018), which we consider next. Even though Fig. 5 shows long-term data on aerosol type “dust” in JJA, when diamond dust is rare, we examined spatially and temporally matching meteorological reanalysis fields above Greenland, as well as to the east including Iceland and northeast Greenland, and to the west in the Canadian Arctic Archipelago. This analysis (Fig. S8 in the Supplement) shows mean temperatures below 2 km altitude as above the freezing point over the Arctic and “Iceland” region (see top right panel of Fig. S8 for geographic details), with air masses also subsaturated with respect to ice below 3 km altitude; the mean optical thickness of cloud ice was less than 0.005 at all altitudes below 3 km. Above Greenland, temperatures below 2 km altitude above ground level (a.g.l.) were above −10 ° C and air masses were still subsaturated with respect to ice below 3 km; the mean optical depth of cloud ice was less than 0.003 below 1.5 km a.g.l., and less than 0.03 below 3 km a.g.l. Given this analysis, the likelihood of diamond dust contamination of the CALIOP aerosol type “dust” is very low in the Arctic and “Iceland”, but it cannot be ruled out above Greenland without further study, e.g., of meteorological fields coincident with CALIOP overpasses, and individual (as opposed to mean) profiles of temperature and relative humidity over ice. Moreover, further study would be needed to determine the spatial origin of these elevated (in altitude and in terms of FoO) aerosol type “dust” signals over Greenland; their higher altitude (2.5–5 km) does not simply imply an Asian origin, as it might in the Canadian Arctic, particularly in JJA and combined with the clustering of FoO above Greenland instead of a zonal homogenization that would be expected after long-range transport. The flows around Greenland's extreme orography are complex, both near the surface (Gorter et al., 2014) and aloft (Moore et al., 2013), with a complex coupling of smaller-scale but intense “piteraq” (katabatic) winds, low-level jets, and synoptic-scale flows. It is possible that the Greenland plateau jets described by Moore et al. (2013, their Fig. 8 for JJA) contribute to a re-circulation of dust mobilized in lower, ice-free margins of Greenland, but this is speculative. To conclude this section, the qualitative “dust” type vertical distribution information from CALIOP informs our analysis and is consistent with active dust emission in the Arctic and eastern Greenland/Iceland; however, it is not suitable for direct comparison against the dust emission potential map (Sect. 3.4) on account of the coarse spatial aggregation necessary to compensate for the 70 m laser footprint of the CALIOP sensor (Sect. 2.1.3).
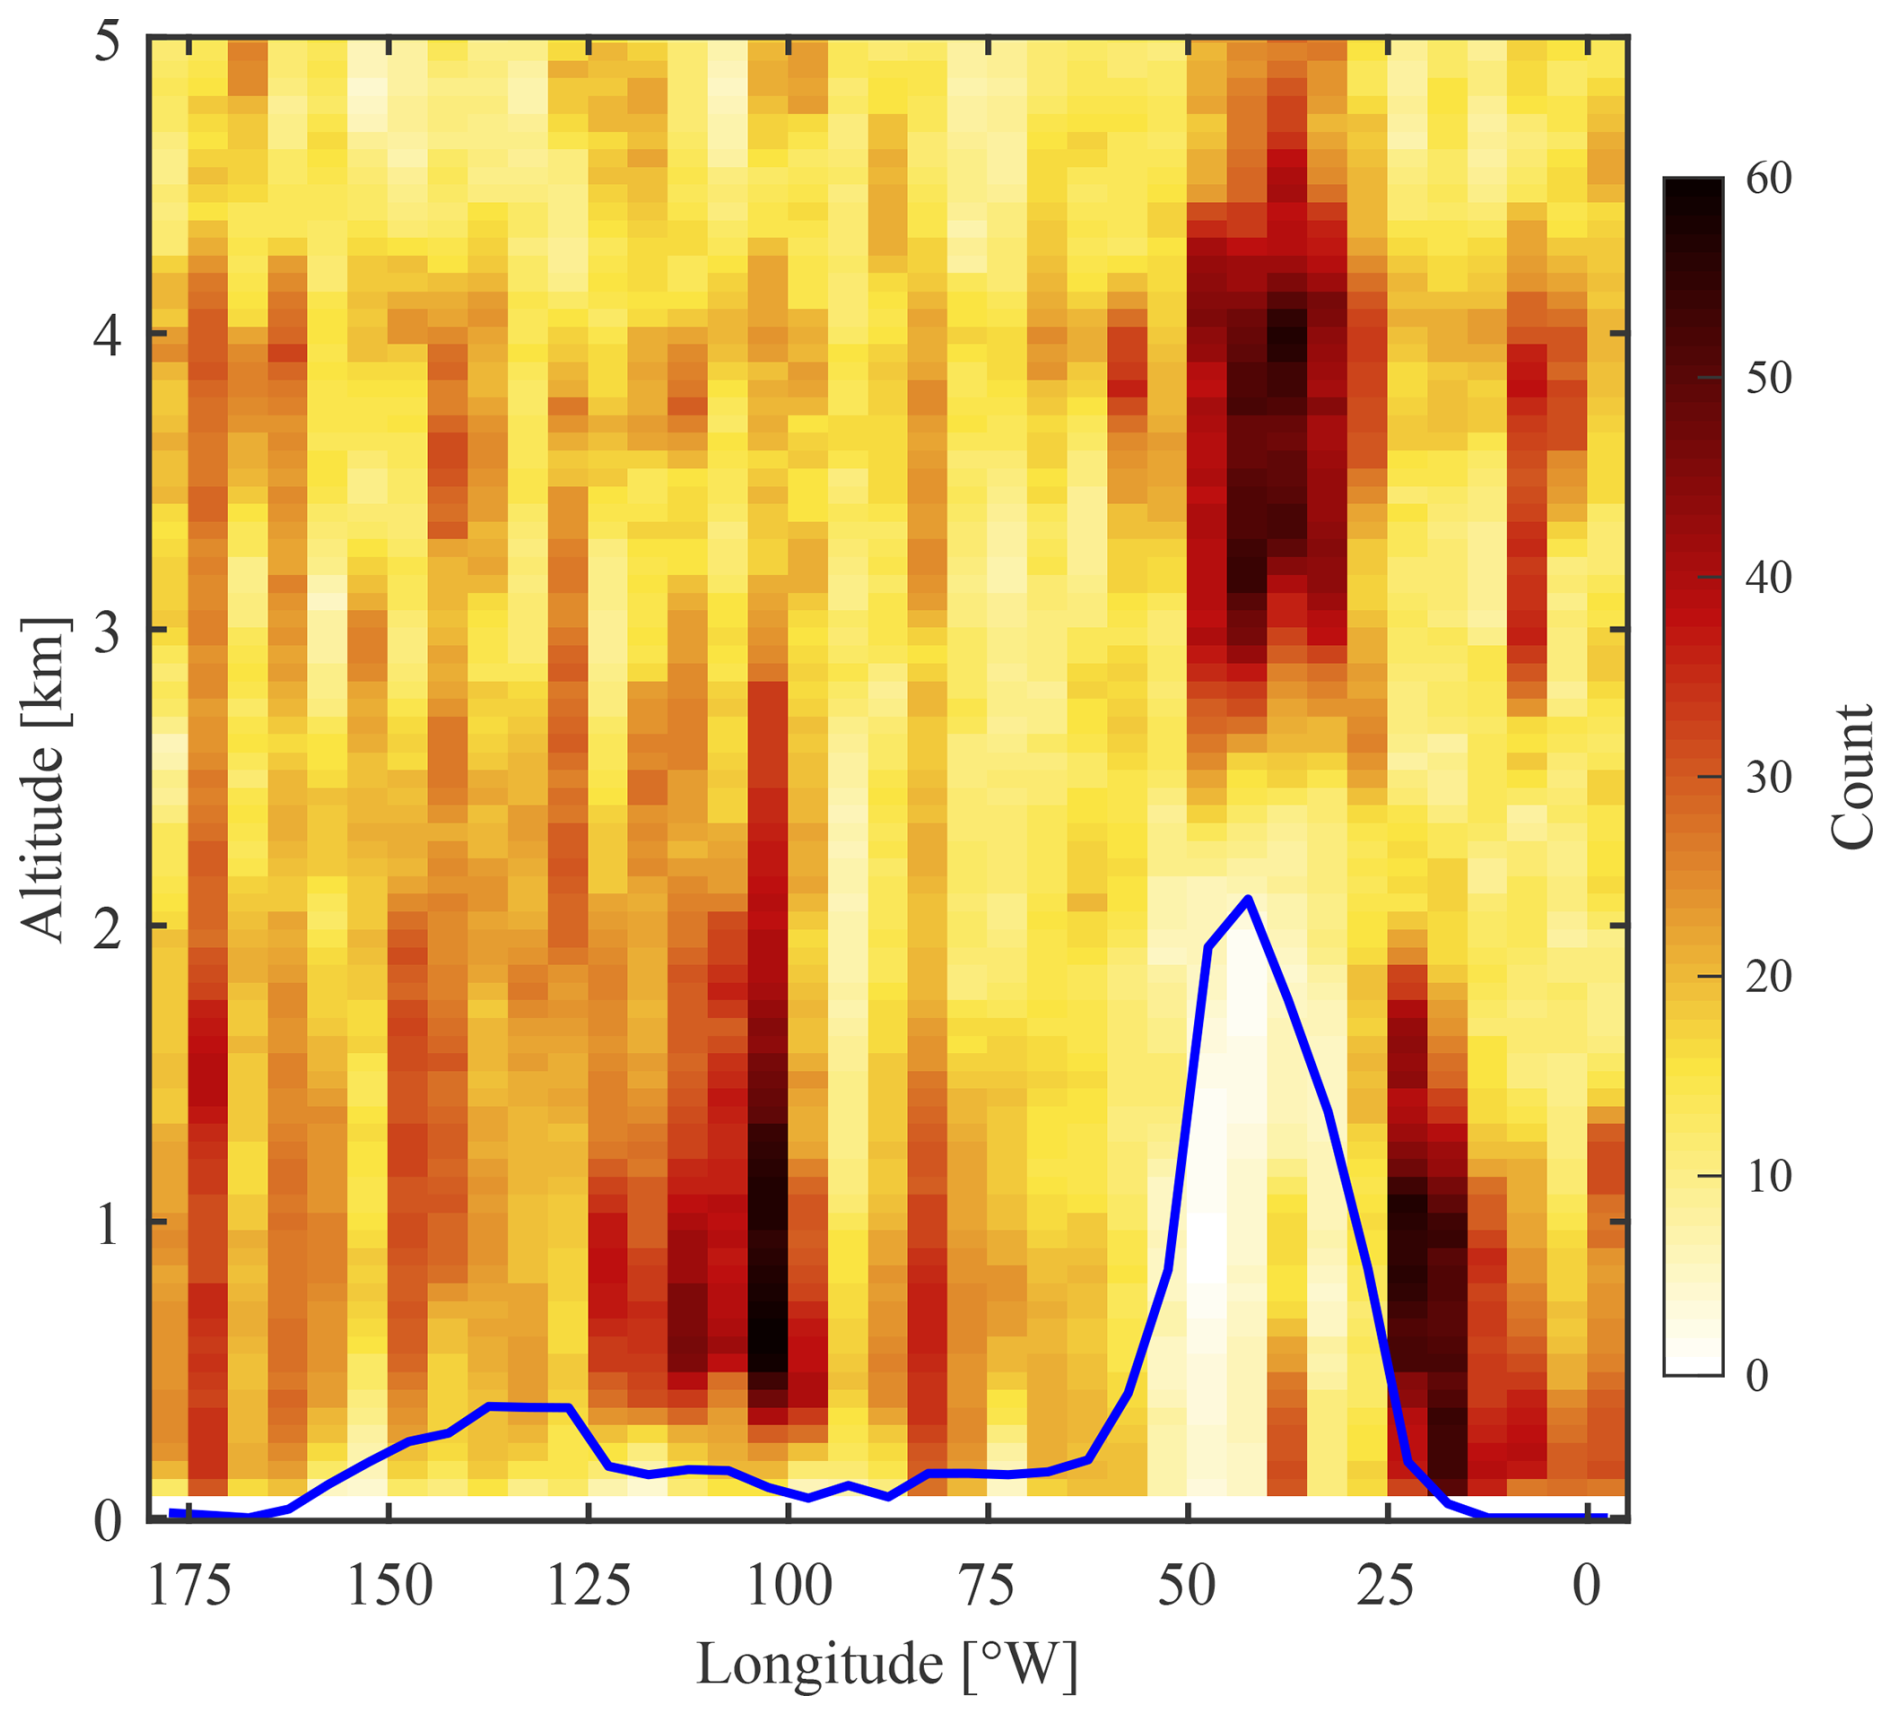
Figure 5Number of times (“count”) an aerosol is classified as “dust” in CALIOP L3 aerosol type data for the period JJA 2006–2020, averaged for the latitude band 60–80° N. The blue line shows the corresponding median surface elevation within the latitude band.
3.4 Evaluation of satellite dust emission hotspot results using the dust emission potential map
We turn now to comparing our satellite-based results with known information on dust emission potentials, the latter under favourable wind conditions. In Fig. 6 we compare MODIS FoO DODPG16>0.5 and VIIRS FoO ATDUST to source intensity (SI) for July from the G-SDS-SBM dataset. SI for July was chosen based on the results of the seasonal analysis in Sect. 3.1, where all-season FoO was dominated by June–July–August FoO in absolute terms and in spatial extent, and the fact that SI values are low for the other months (January, April, and October) provided in the G-SDS-SBM dataset (SI for other months is plotted in Fig. S9). The dust emission potential is high (SI > 0.5) in much of Canada's Arctic Archipelago (Fig. 6a), which is broadly consistent with MODIS FoO DODPG16>0.5 (Fig. 1a) and VIIRS FoO ATDUST (Fig. 4a). We quantified areas of SI overlap with both MODIS (Fig. 6b, red colour) and VIIRS (Fig. 6c, red colour) using threshold SI and FoO values as follows. Because SI is a relative measure of dust emission potential with values between 0 (no emission potential under any wind conditions) and 1 (maximum emission potential under sufficient wind conditions), we looked for areas where SI is greater than 0.5 while, simultaneously, MODIS FoO is greater than 10 %. This 10 % MODIS threshold, which does not match the SI threshold of 0.5 (50 %), was chosen because we are testing for the FoO of extreme dust emission events (DOD > 0.5), and it is reasonable to assume that, by definition, such conditions will be met in far less than 50 % of observational cases, i.e., 10 %. Red colours indicate agreement between dust emission potential (SI) and satellite observations of extreme events, while blue and green colours both indicate disagreement. Blue disagreement areas have high dust emission potential that is not matched with observations of dust, while green disagreement areas have low dust emission potential where satellites nevertheless see extreme DOD (>0.5) in at least 10 % of observations. For consistency we use the same 10 % threshold in VIIRS FoO ATDUST data, which leads to relatively prominent green areas (low emission potential but frequent VIIRS-observed dust) because, unlike MODIS FoO data, VIIRS FoO data considers only the presence of dust (VIIRS ATDUST) and not the intensity of events (i.e., MODIS DOD > 0.5); moreover, as discussed in Sect. 3.2, VIIRS thresholds for identifying aerosol type “dust” are lower and there are known differences between VIIRS and MODIS AOD and Ångström exponent Deep Blue products. While the thresholds can be shifted to influence the level of agreement and disagreement and thus the spatial colour patterns (which we experimented with), the salient point is that all three datasets have limitations, yet all three point to non-zero dust activity north of 60° N, in contrast to many model simulations of dust emission to date that have ignored these high-latitude dust sources, albeit reasonably so, e.g., on account of low model resolution or lack of input information. The key dust emission areas shared by all three datasets (shared orange and red colours) are found in a broad “Canadian Arctic Dust Belt” between western Baffin Island (70° N, 75° W) and northwest of Prince Patrick Island (80° N, 125° W), as marked also on Fig. 11. The same area also contains few blue colours (high emission potential but few observations of dust) but many green colours, where emission potential is low (<0.5) but satellite observations show strong (MODIS) and/or frequent (VIIRS) dust events. The “green” disagreement indicates areas where dust emission potential maps may benefit from re-examination and/or verification, i.e., also with new field measurements, challenging as they are.
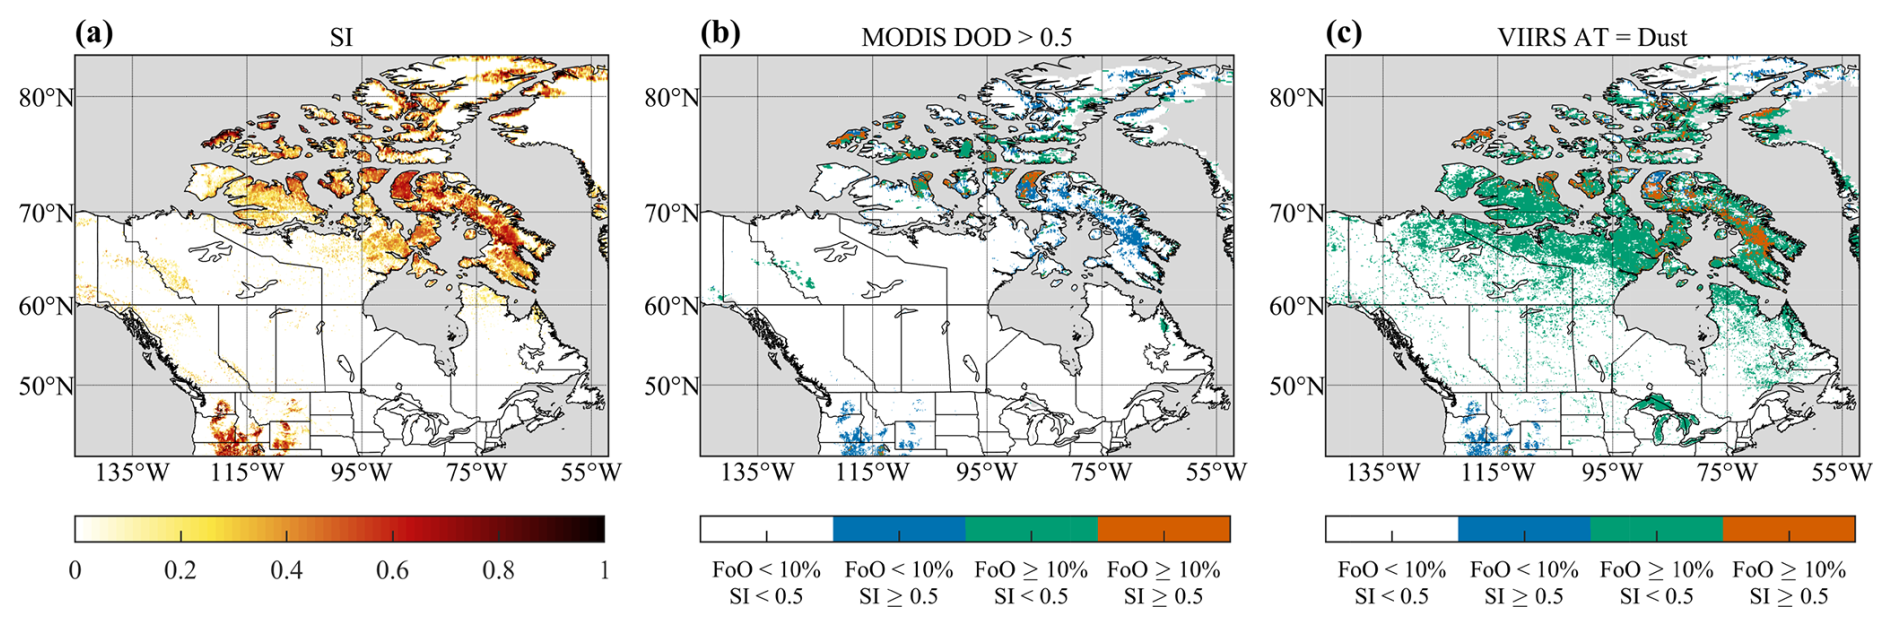
Figure 6(a) Source intensity (SI) from the G-SDS-SBM dataset for July. (b) Combined classification map based on SI and FoO MODIS DODPG16>0.5 as a percentage of the number of DODPG16 retrievals available; (c) Combined classification map based on SI and FoO VIIRS ATDUST as a percentage of the number of VIIRS Aerosol Type (AT) retrievals available. Grey shading indicates no data.
The notable inconsistencies in the Arctic Archipelago include eastern Baffin Island (∼<70° N, ∼<75° W), which is characterised by widespread high SI (except in areas permanently covered by snow and ice) but sparse MODIS FoO DODPG16>0.5 emission hotspots (blue colours in Fig. 6b) with more frequent VIIRS FoO ATDUST regions (red colours in Fig. 6c). The same is true for ice-free parts of Ellesmere Island and Axel Heiberg Island (∼ 80° N, ∼ 85° W). One explanation for such discrepancies, apart from thresholding choices, is that high SI values only show surfaces where the potential for dust emission is high; other conditions still need to be met for dust emission to actually occur, i.e., surface winds that are strong enough to entrain sediment. We examined a summertime 10 m wind speed climatology (Fig. S10) and find that where MODIS and VIIRS disagree on eastern Baffin Island mean winds are 4–6 m s−1 (14.4–21.6 km h−1), which is sufficient for dust mobilization. Another factor is that we have filtered MODIS data for DODPG16>0.5, which represents extreme (but infrequent) dust emission events for the Arctic, on par with Saharan dust in transport across the tropical Atlantic, whereas our VIIRS “dust” type data shows all observations of pure (unpolluted) dust where AOD > 0.3 and α<0.5, so that the corresponding DODPG16 (if calculated from VIIRS products) could be as low as 0.22 for AOD = 0.3 and α=0.5 (Eq. 1). On the other hand, it is plausible that the satellite datasets also do not capture the full extent of dustiness across the region, especially in the far north, due to frequent cloud coverage and dust misclassification as clouds (e.g., Huck et al., 2023; Sayedain et al., 2023; Ranjbar et al., 2021).
There are also a few notable areas south of the Arctic where FoO DODPG16>0.5 emission hotspots are not matched by high SI, e.g., green patches in Fig. 6b in the Northwest Territories (MacKenzie Mountains), close to the border with the Yukon Territory (∼ 126° W, ∼ 63° N) and at the border of northern Labrador and Québec (65° W, 58° N), as marked in Fig. 11. Reasons for such disagreements are unclear, but we stress again that the G-SDS-SBM SI mapping results are sensitive to the quality of the input data (soil texture, soil moisture, soil temperature, and bare land fraction), which all have limitations. In examining the visible imagery, average wind speeds, and geological features of these two discrepancy areas available from the Global Wind Atlas (Davis et al., 2023), there is strong indication that both, although geologically distinct, are likely unclassified dust emission source areas. The MacKenzie Mountains location (Fig. A1 in the Appendix) is an environment with strong weathering and erosion leading to extensive colluvial features with visible scree, comprising also finer sand, silt and clay. It is likely a result of a former river channel and/or a lakebed. The Labrador/Québec location (Fig. A2) is an exposed plateau that was recently deglaciated, in geological terms, leaving behind unconsolidated fine glacial sand, with scarce vegetation and soil formation to suppress dust mobilization. There is a third emission hotspot area that does not appear on the SI map (SI ∼ 0) and does not meet the 10 % FoO threshold but produces a prominent absolute FoO signal; it is a glacially scoured plateau in northwestern Nunavut (Fig. A3, green box in Fig. 11) that is windy, unvegetated, and covered with glacial lakes and debris (these features are visible most clearly in some areas where 10 m resolution Google imagery is available, e.g., 66.83369, −111.86699). Clearly, these are locations of large spatial extent where further investigation would be beneficial, including by field measurements.
Lastly, the spatially broad swath of only occasionally high FoO DODPG16>0.5 in the Great Plains of southern Canada and USA (connected to croplands and discussed in Sect. 3.2, Fig. 4b and c) is largely not matched by high SI; this is reasonable because this extensive pattern of dustiness in satellite observations disappears in a percentage-of-observations representation (Fig. 4e and f). The SI hotspots in this region (unlike the absolute FoO signature of Fig. 4b and c, found only in northwestern US and not southwestern Canada) are much more spatially restricted than the FoO signature and comprise a mixture of croplands (Washington, northern Oregon, Idaho, Montana, cf. https://www.croplands.org/app/map, last access: 11 January 2024) and arid regions (southern Oregon, Wyoming), but they do not correspond to either intense MODIS DODPG16>0.5 events (Fig. 6b, blue colours) or VIIRS ATDUST events (Fig. 6c, blue colours). Instead, they are associated with VIIRS ATMIXED events (Fig. 4b and e), which, again, makes sense if agricultural dust emissions of non-coarse-mode particles were mixed with anthropogenic aerosols.
Overall, the reasonable agreement between satellite-derived dust emission hotspots and areas with high SI values in the G-SDS-SBM dataset supports the use of satellite datasets in dust emission modelling development in the Canadian Arctic and in other high-latitude regions. This section also suggested regions where the SI dataset may benefit from further development (marked in Fig. 11), and where field measurements would be of help.
3.5 Temporal change in extreme dustiness frequency over Northern Canada in the 20-year MODIS record
The 20-year record of MODIS data enables an assessment of whether the frequency of dustiness over Northern Canada has changed over time. Time series of annual means of FoO DODPG16>0.5, FoO DODB16>0.5, and FoO AOD > 0.5, averaged for the region (70–80° N, 125–75° W) representing the “Canadian Arctic Dust Belt” identified in Sect. 3.4, are shown in Fig. 7. Note that this figure shows values of mean FoO of optical depth (normalized) rather than mean optical depth itself. There is clear interannual variability in each of the time series; however, the greatest annual mean FoO DODPG16>0.5 values all occur in the second half of the period, with 2015, 2017 and 2019 appearing to be active dust emission years. The same is true with FoO DODB16>0.5, although only 2015 and 2017 stand out as dust-active years in the region. By contrast, the annual mean FoO AOD > 0.5 time series is qualitatively different, with peaks and troughs relatively evenly distributed across the study period and no qualitative evidence of increasing AOD over time. We examined wind speed, soil temperature, soil moisture, and snow cover in 20 years of daily mean ERA5 meteorological fields for the same geographic region as Fig. 7 in summer (Fig. S11). There was a significant (p<0.03) and negative () correlation only between FoO (AOD > 0.5) and snow cover, but not with the FoO of either formulation of DOD > 0.5 (, p<0.20 for FoO (DODPG16 >0.5); , p<0.44 for FoO (DODB16>0.5)). As noted in Sect. 1, an increase in high-latitude dust emission is an expected consequence of climate change in the Arctic leading to glacial retreat, decreased snow cover duration, and permafrost thaw, all making exposed dust more available for mobilization (Bullard, 2013; Meinander et al., 2022). However, the results presented in this section are not a statistically significant indicator of such processes occurring in the Arctic (Gulev et al., 2021).
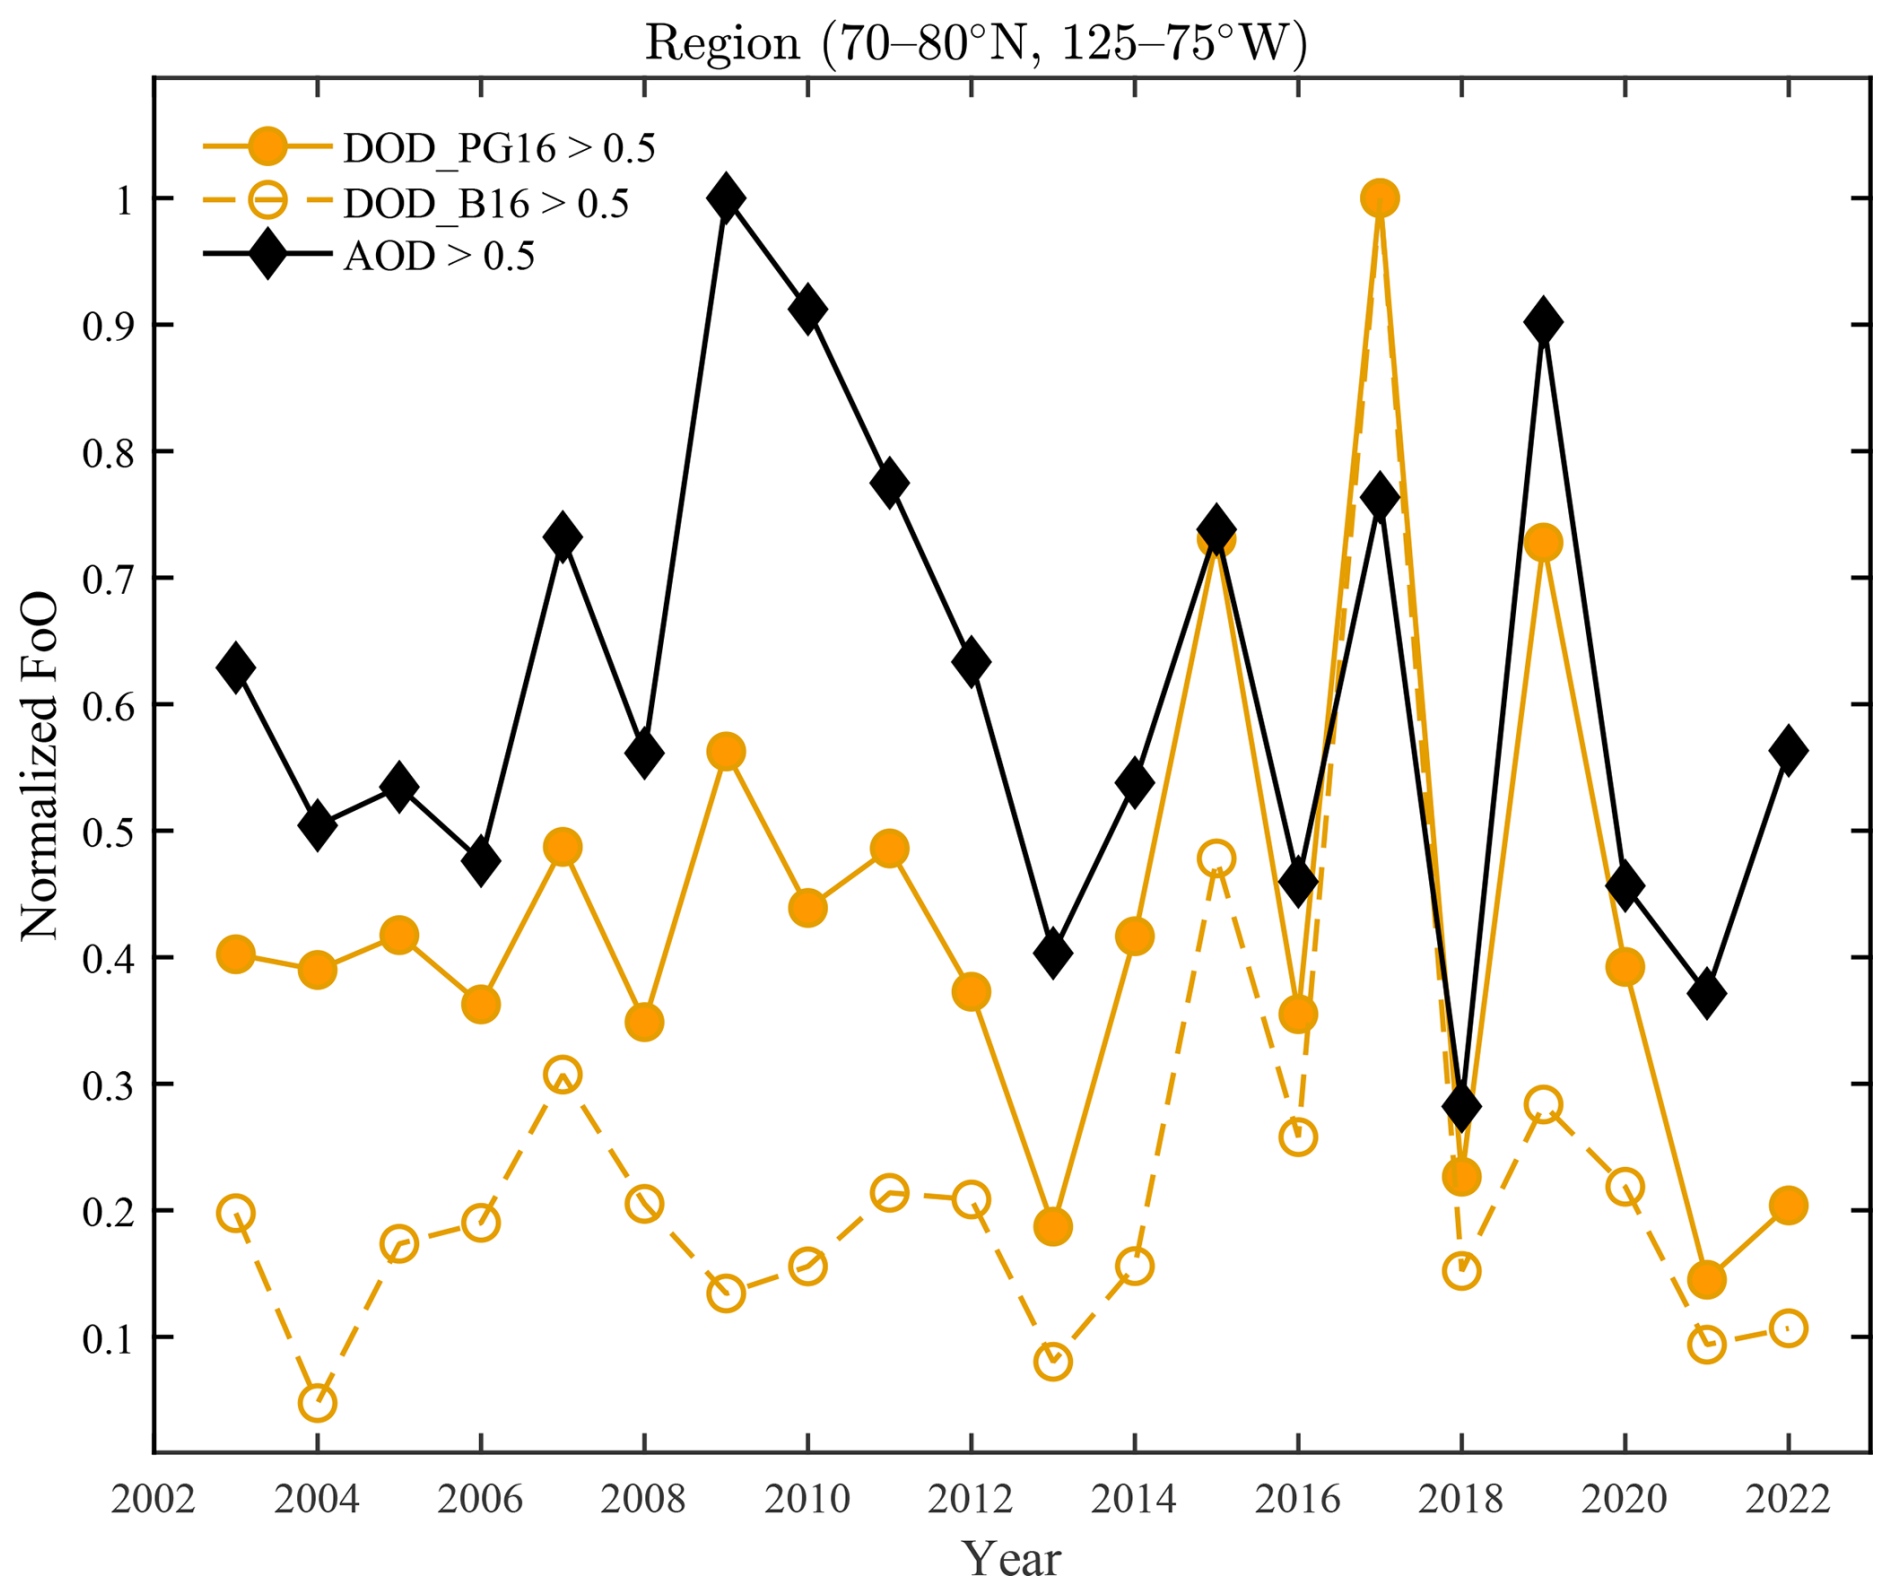
Figure 7Time series of annual mean FoO of MODIS optical depth > 0.5, averaged for the region (70–80° N, 125–75° W) and normalized to the highest value, for the years 2003–2022 inclusive. MODIS-derived optical depth datasets underlying the FoO values plotted are: DODPG16>0.5, DODB16>0.5, and AOD >0.5, with respective normalizing factors of 71 948, 38 220, and 209 963.
3.6 Evaluation of MODIS AOD using AERONET
In this section, AOD data from MODIS are evaluated against AOD data from AERONET stations at Kluane Lake (AODKL) and Resolute Bay (AODRB). The station locations are marked on Fig. 11. The Kluane Lake AERONET station was intentionally located proximal to a known dust source for the purpose of monitoring emission processes there (Huck et al., 2023; Sayedain et al., 2023). Curiously, the area is not identified as a strong dust emission source area by our satellite data analysis, which is on the one hand not very surprising given that Huck et al. (2023) document large discrepancies between remotely sensed dust (both by AERONET and by MODIS-MAIAC) and in situ remote camera images of dust at Kluane Lake. On the other hand, their “dust event days” (DEDs) have modal AOD values of 0.5 with a high tail extending out to an AOD of 3; in the context of such thick dust plumes, one may reasonably expect that in the analysis of 20 years of MODIS data in our study (Collection 6.1 at 10 km resolution) we would detect a stronger signal in FoO – yet we do not. However, the Kluane Lake region and the nearby mountainous regions are largely without satellite data due to the extremely variable and highest topography in North America (Mt. Logan in Canada stands at 6000 m and Denali in Alaska to the west stands at 6200 m), which presents difficult surface retrieval conditions (as shown in detail later in Fig. 10). Unlike Kluane Lake, the Resolute Bay AERONET station is situated adjacent to strong dust emission hotspots identified in our study on Cornwallis Island (as shown in detail later in Fig. 10); however, to the best of our knowledge, this is coincidental, i.e., the station location was not selected with the explicit purpose of monitoring dust aerosol. In this section, satellite data retrieved within both a 1° × 1° and 0.5° × 0.5° box centred on each AERONET station were considered. From MODIS, the maximum AOD values within the search box were retained, while from VIIRS the presence or absence of each aerosol classification type (AT) was recorded. For AERONET, only retrievals performed within 11 am and 5 pm local time were considered for analysis and the maximum retrieved AOD each day within this time window was retained for the comparison. Maximum values were chosen instead of mean values in line with the purpose of our analysis, which is to identify extreme DOD values near dust sources.
AOD comparison results are first considered using MODIS data detected within the 1° × 1° search box centred on each AERONET station. AOD values > 3 were filtered out (2 points at KL and 5 points at RB) given that DOD was found to be <2 at Kluane Lake (Sayedain and O'Neill, 2025). At Kluane Lake, six years of AODKL data correlates strongly with MODIS AOD (R=0.81 in Fig. 8a). These AOD correlation results are at odds with the work of Huck et al. (2023) at Kluane Lake who found weak mean AOD (unlike our maximum AOD) correlations on DEDs in 2018 and 2019 (R=0.11 and R=0.36), which improve on non-DEDs in 2018 and 2019 (R=0.35 and R=0.96). They classifed DEDs with threshold AOD and α parameters similar to our work (but from their AERONET data) and they use the mean MODIS-MAIAC AOD product at 470 nm with the mean AERONET AOD product at 500 nm. Given their in situ remote camera imagery verifying the presence of dust, they reasonably attribute the lack of correlation on “dust event days” to specific dust-cloud detection problems in AERONET and the lack of dust testing at high latitudes in the MODIS-MAIAC retrieval (rather than to the less important 470 nm vs. 500 nm wavelength mismatch between MODIS and AERONET AOD). Their sampling strategy is different and covers just 70 km2 with 1 km MODIS-MAIAC pixels as opposed to our 1° × 1° box based on 10 km resolution L2 MODIS data. While it is not possible to compare these results directly, it is nevertheless interesting to note both the range of choices and results in this apparently “similar” type of comparison carried out in our respective studies. Switching to the VIIRS sensor, three years of VIIRS AT data were available over the 1° × 1° region surrounding the Kluane Lake AERONET station, and ATDUST is detected on 18 % of days while ATMIXED and ATBACKGROUND are the two modal classifications, both detected on 27 % of days (Fig. 9). Unlike at Kluane Lake, 18 years of Resolute Bay AODRB has only a weak correlation (R=0.32) with MODIS AOD for the 1° × 1° search area (Fig. 8a). As Fig. 9 shows, VIIRS ATDUST is detected on 32 % of days here, with ATBACKGROUND being detected more frequently (44 % of days) and ATMIXED less frequently (12 % of days).
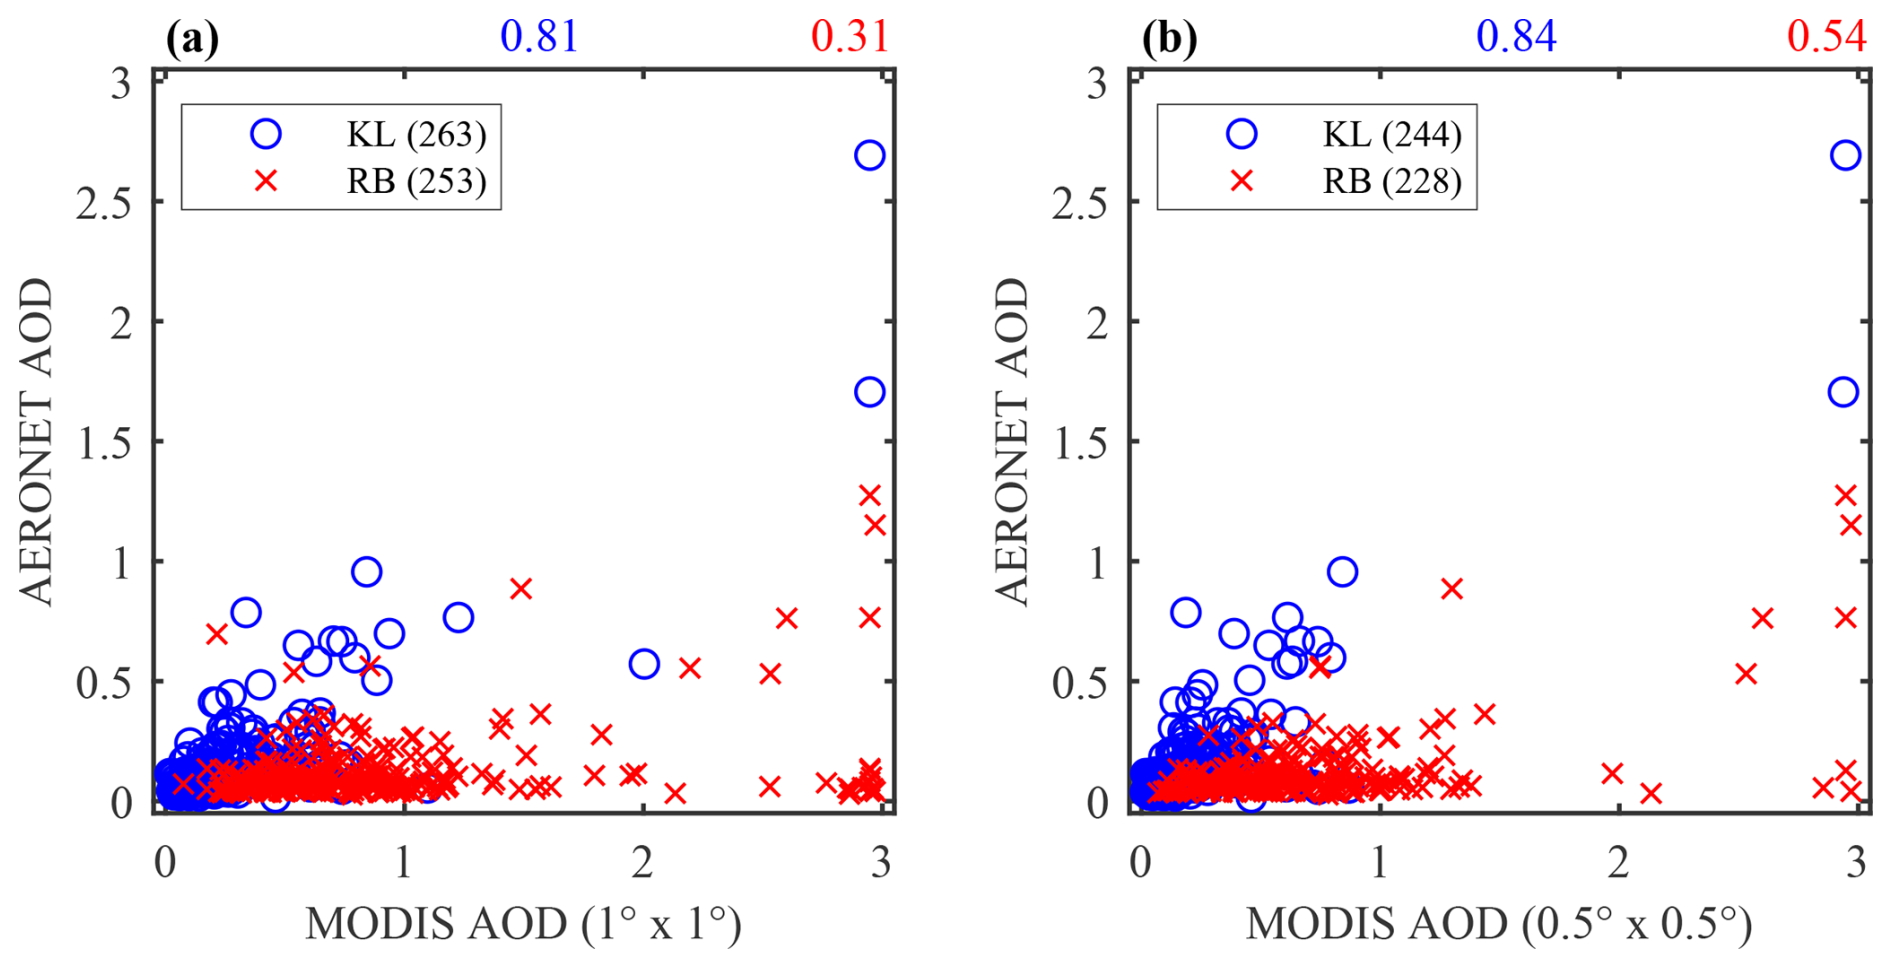
Figure 8Maximum AERONET AOD (500 nm) between 11 am and 5 pm local time at Kluane Lake (blue open circles) and Resolute Bay (red crosses) vs. maximum MODIS AOD from (a) a 1° × 1° box centred on each station and (b) a 0.5° × 0.5° box centred on each station. Numbers in blue (red) above each panel correspond to the Pearson's correlation coefficient, R, between Kluane Lake (Resolute Bay) AERONET AOD and the MODIS dataset in that panel. The number of matched maximum AOD days for each comparison is given in parentheses in the legends.
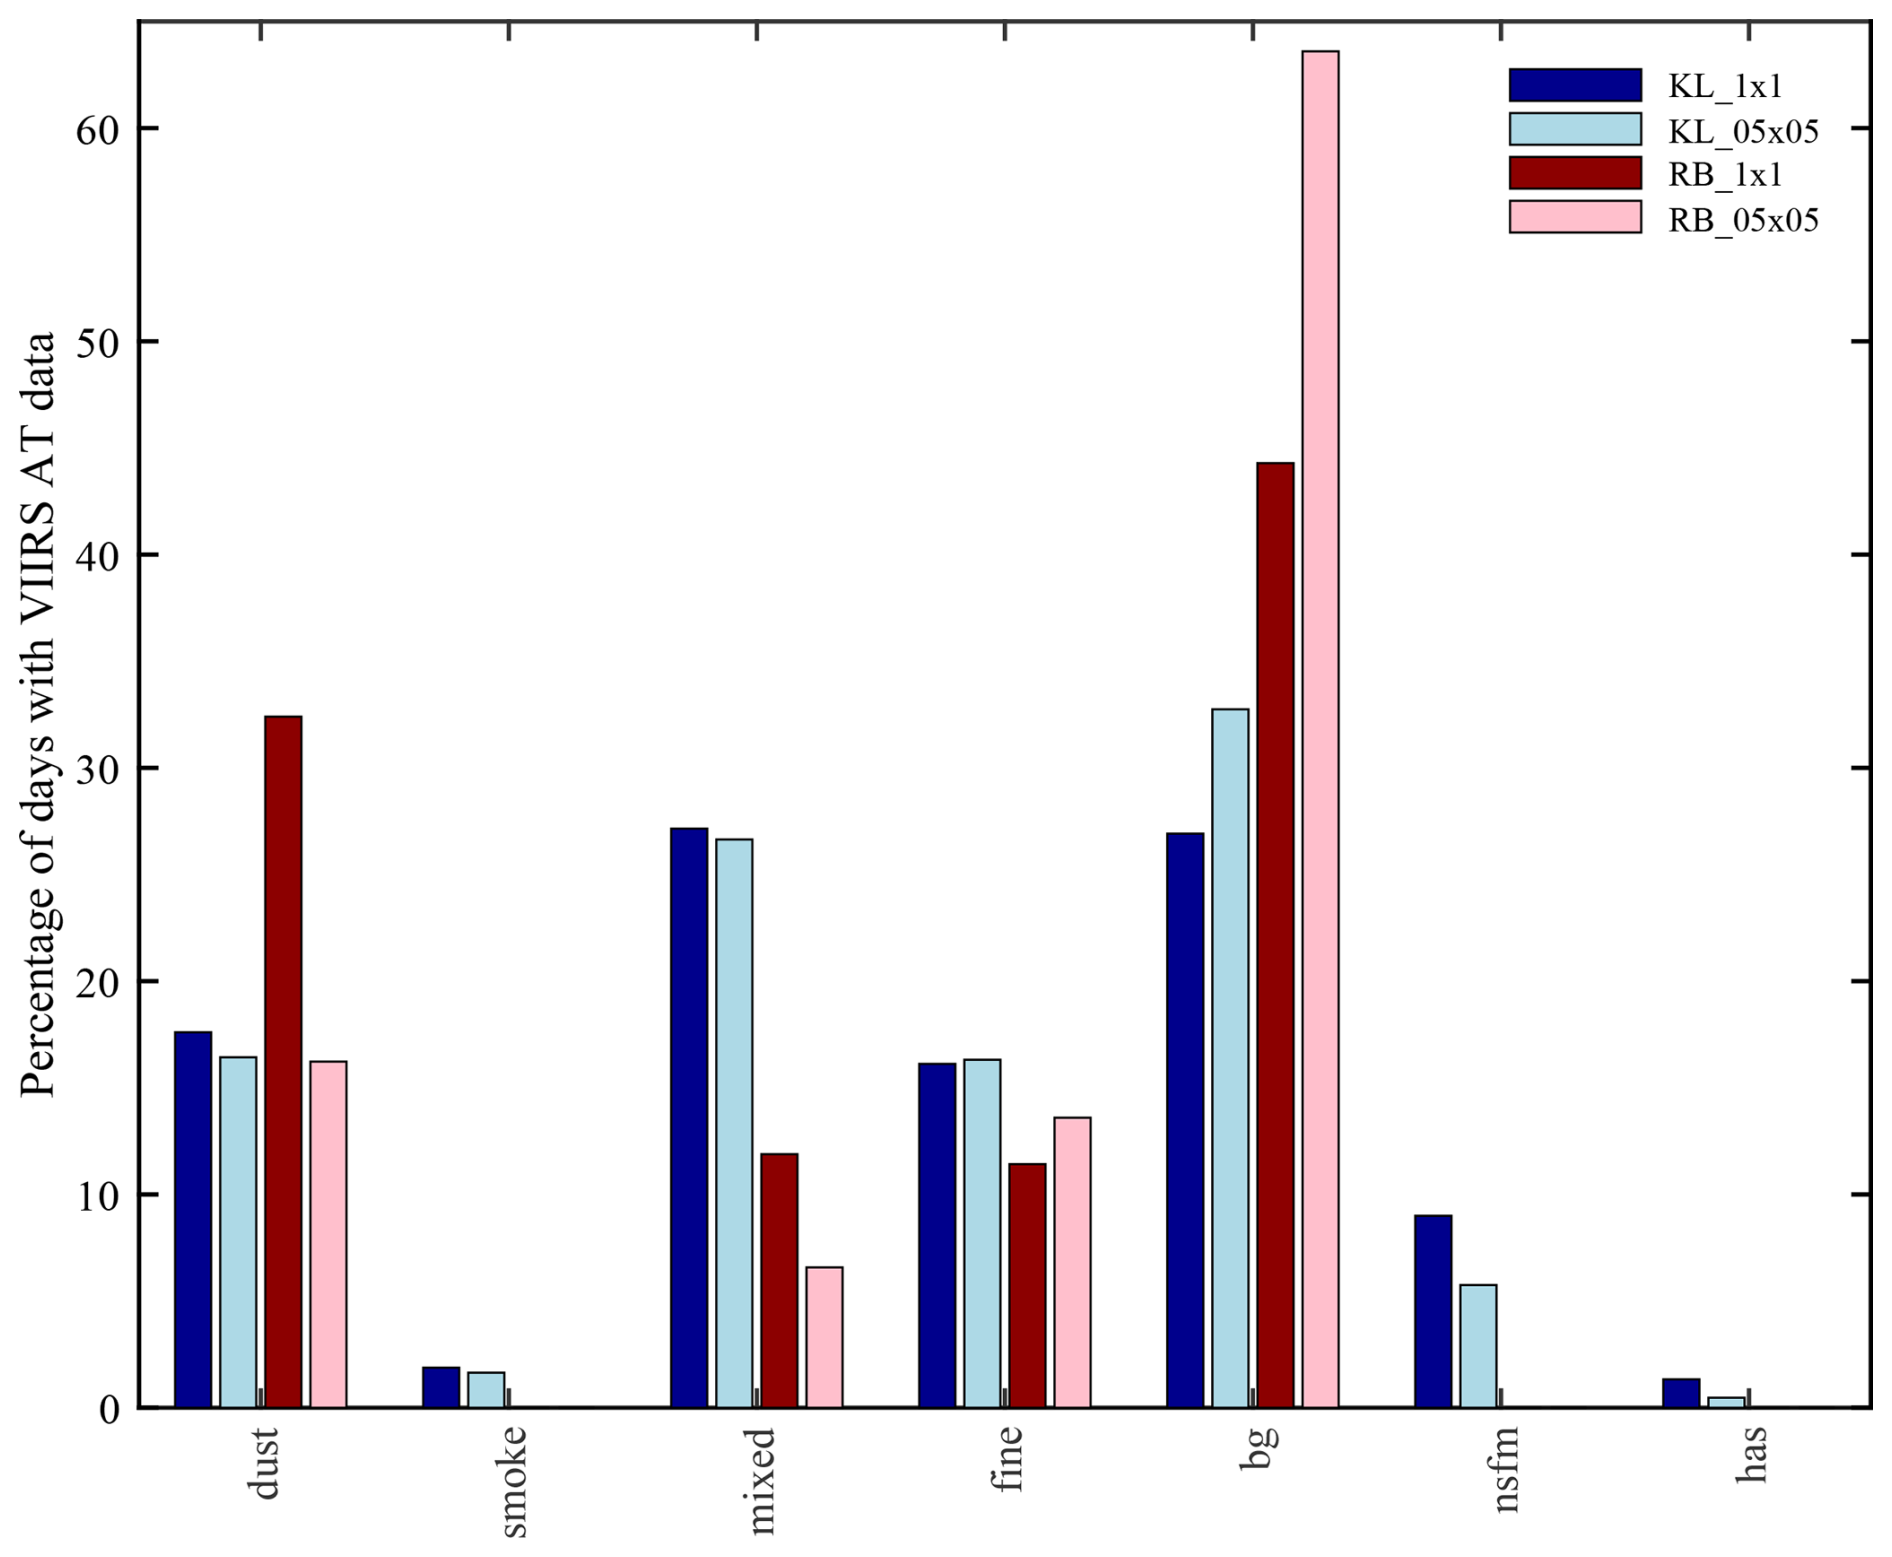
Figure 9Percentage of days with VIIRS Aerosol Type (AT) data that have at least one AT retrieval of the type indicated on the x-axis within the 1° × 1° and 0.5° × 0.5° boxes centred on AERONET stations at Kluane Lake (KL; dark and light blue, respectively) and Resolute Bay (RB; dark and light red, respectively). “bg” = background, “nsfm” = non-smoke fine mode, “has” = high-altitude smoke. The number of days with VIIRS AT data in the 1° × 1° (0.5° × 0.5°) box is 1278 (852) at Kluane Lake and 429 (228) at Resolute Bay, both for the period 2020–2022.
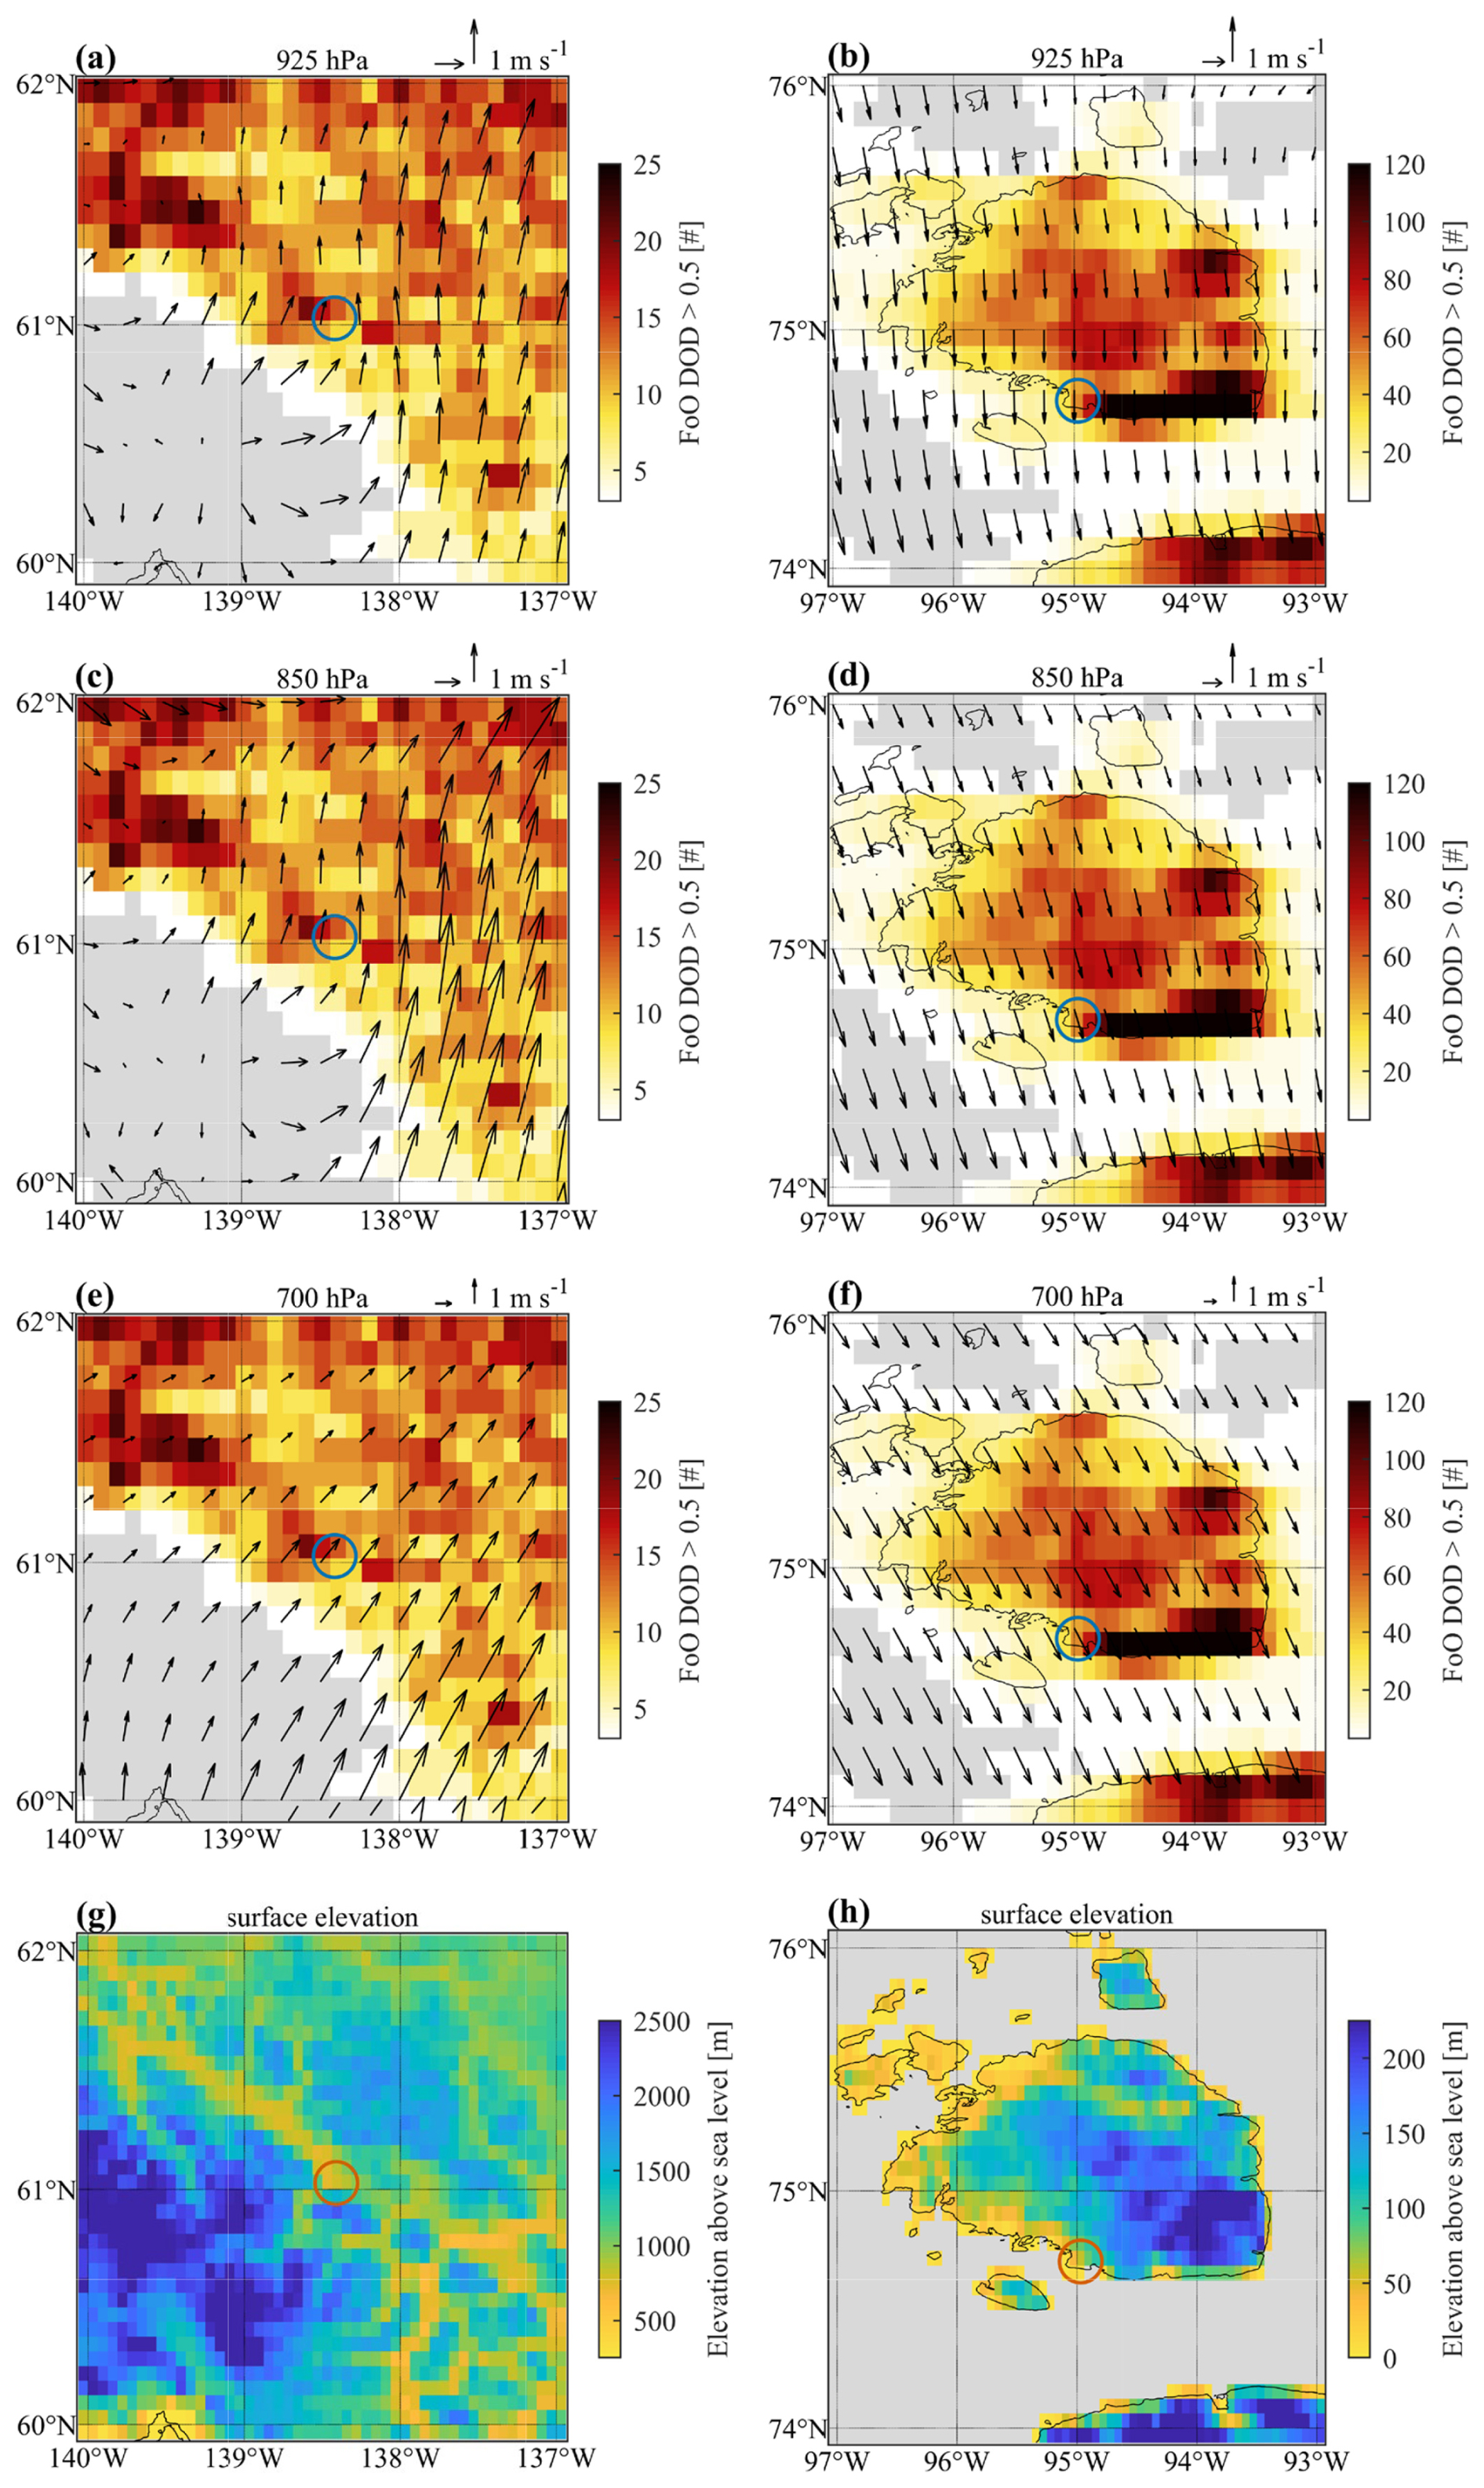
Figure 10(a, c, e) Winds at 925, 850, and 700 hPa above the region surrounding the Kluane Lake AERONET station (blue circle). Winds are the mean of ERA5 reanalysis data for June–August 2004–2023. Underlying shading corresponds to FoO DODPG16>0.5 for the period 2003–2022 (grey shading corresponds to no data). (g) Surface elevation surrounding Kluane Lake station (red circle) at 0.0625 degrees resolution from the Global Multi-resolution Terrain Elevation Data 2010 (GMTED2010) dataset. (b), (d), (f), (h) Like (a), (c), (e), (g) except for Resolute Bay AERONET station.
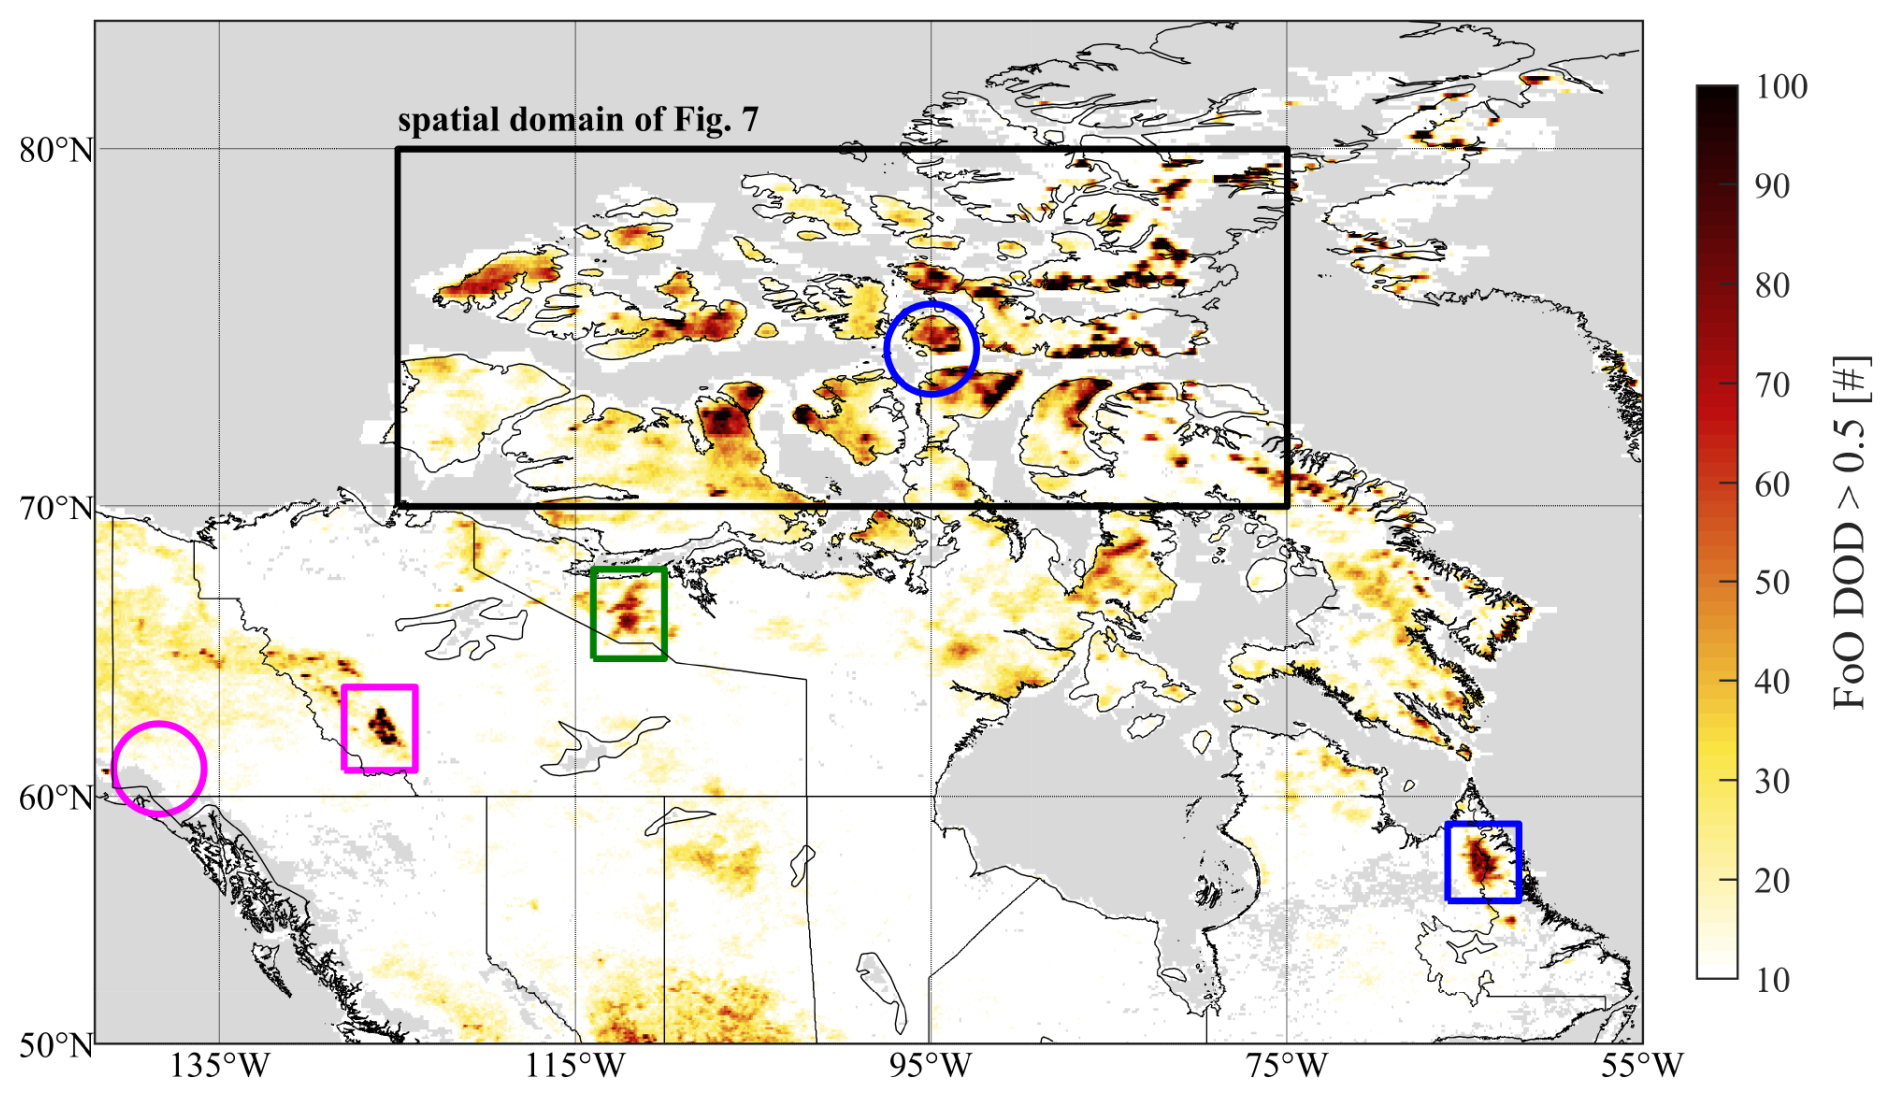
Figure 11The location of Kluane Lake AERONET station (pink circle) and Resolute Bay AERONET station (blue circle), together with newly identified dust source areas in the McKenzie Mountains (pink square), Quebec/Labrador (blue square), and western Nunavut (green square). Underlying shading corresponds to FoO (MODIS DODPG16>0.5) for the period 2003–2022 in JJAS (grey shading corresponds to no data).
A question arises about the poor correlation at Resolute Bay between AERONET AODRB and MODIS AOD datasets given the proximity to our potential emission hotspot regions and the more frequent VIIRS ATDUST presence there. One reason could be the deliberate positioning of an AERONET station to monitor dust at a known emission location (like Kluane Lake), which was not the case for Resolute Bay (notwithstanding the AOD disagreement at Kluane Lake found by Huck et al. (2023) using the MODIS-MAIAC product). Is it possible that coarse dust in the 1° × 1° search area around Resolute Bay is simply not passing over the AERONET station, given also that coarse dust does not generally travel far? The map of average regional winds above both stations (Fig. 10) shows that Kluane Lake is downwind of dust emission regions in the foothills of the mountains at glacial margins (where satellite data is increasingly lacking on account of the variable topography and surface properties) while Resolute Bay is upwind of the dust emission hotspot (identified with abundant satellite data). The elevated topography to the east of Resolute Bay may itself obscure any dust suspended in that direction from the AERONET instrument's field of view for low solar zenith angles in the morning. As may be expected in this situation, the correlation between MODIS AOD and AODRB increases from 0.32 to 0.58 as the MODIS search area is decreased from 1° × 1° to 0.5° × 0.5°, while the MODIS AOD correlation with AODKL hardly changes (0.87 vs. 0.90) under the same decrease (Fig. 8b). Since the AERONET station at Kluane Lake is already next to and downwind of the dust, decreasing the search area is not helpful to the correlation. Interestingly, this same decrease in search area size causes the ATDUST classification frequency at Resolute Bay to decrease from 32 % for 1° × 1° to 16 % for 0.5° × 0.5°, while the ATBACKGROUND classification frequency increases from 44 % to 64 % (Fig. 9); there is no appreciable change at Kluane Lake. This reduction supports the argument that dust in the broader region surrounding Resolute Bay is not within detection range of the AERONET station and highlights the challenge of detecting even nearby dust sources given the station's position and prevailing winds, as compared to the specific satellite product used in this analysis.
High-latitude mineral dust is receiving growing research interest, with evidence that its impacts on numerous components of the Arctic environment can be greater than for dust transported into the region from lower latitudes. Understanding these processes – and how they evolve – depends upon direct knowledge of where dust emission occurs at high latitudes, yet field measurements are exceedingly difficult (and therefore scarce) and satellite-based retrievals of suspended dust suffer from known high-latitude observational challenges (e.g., polar night, frequent cloudiness, variable snow and ice cover) which lead to biases. Together, this leads to a common lack of representation of HLD in global models. Using the Frequency of Occurrence (FoO) of extreme Dust Optical Depth (DOD > 0.5) at high-resolution (0.1° × 0.1°), derived for this study from twenty years (2002–2022) of MODIS observations, we present semi-quantitative observational evidence that dust emission sources are widespread across the islands of the Canadian Arctic Archipelago.
We also present qualitative supporting evidence from aerosol type “dust” classifications in the VIIRS (α<0.5 with AOD > 0.3) and CALIPSO (depolarization ratio > 0.20) satellite data products. VIIRS “dust” type shows qualitative agreement, spatially, with the FoO of extreme DOD events. There are areas with VIIRS “mixed” classification north of ∼ 80° N on Ellesmere Island, accounting for a high proportion (>60 %) of total aerosol type retrievals there, even as the polar dome is known to isolate this region in summer (e.g., Gong et al., 2023). “Mixed” aerosols (0.5<α<1) in this region may be indicative of smaller dust particles, as it is well known that the smaller clay fraction (<2 µm) dominates the emitted particle number distribution, even though in remote sensing dust is often taken as the coarse mode in order to avoid ambiguity with other aerosols. CALIOP “dust” type shows an enhanced detection frequency at low altitudes (<2 km) for the longitude range between 125–75° W, in good agreement with the dust emission hotspot regions identified in both the MODIS and VIIRS datasets. Low-altitude Arctic dust in summer is also in agreement with the source-tagged modelling work of Shi et al. (2022), who found that high-latitude dust constitutes 30.7 % of the total Arctic dust burden in the lower troposphere, on account of typically stable boundary layers and limited vertical transport. To assess the likelihood of CALIOP “dust” type being misclassified “diamond dust” we examined spatially and temporally matching meteorological reanalysis fields, which showed mean temperatures below 2 km altitude as above the freezing point over the Arctic (and also the “Iceland”) dust emission region, with air masses also subsaturated with respect to ice below 3 km altitude and a mean optical thickness of cloud ice <0.005 at all altitudes below 3 km. Above Greenland, temperatures below 2 km a.g.l. were >−10 °C and air masses were still subsaturated with respect to ice below 3 km; the mean optical depth of cloud ice was <0.003 below 1.5 km a.g.l., and <0.03 below 3 km a.g.l. Given this analysis, the likelihood of diamond dust contamination of the CALIOP aerosol type “dust” is very low in the Arctic (and “Iceland”), but it cannot be ruled out above Greenland without further study, e.g., of meteorological fields coincident with CALIOP overpasses, and individual (as opposed to mean) profiles of temperature and relative humidity over ice. Moreover, further study would be needed to determine the spatial origin of these elevated (in altitude and in terms of FoO) aerosol type “dust” signals over Greenland; their higher altitude (2.5–5 km) does not simply imply an Asian origin, as it might in the Canadian Arctic, particularly in JJA and combined with the clustering of FoO above Greenland instead of a zonal homogenization that would be expected after long-range transport. The flows around Greenland's extreme orography are complex, both near the surface (Gorter et al., 2014) and aloft (Moore et al., 2013), with a complex coupling of smaller-scale but intense “piteraq” (katabatic) winds, low-level jets, and synoptic-scale flows. It is possible that the Greenland plateau jets described by Moore et al. (2013, their Fig. 8 for JJA) contribute to a re-circulation of dust mobilized in lower, ice-free margins of Greenland, but this is speculative and requires further study.
The locations identified as dust emission hotspots (DOD > 0.5 with FoO >10 %) in the “Canadian Arctic Dust Belt” (overwhelmingly based on summertime MODIS retrievals from June to August) correspond to surfaces with high potential for dust emission during the summer season in the G-SDS-SBM dataset (Source Intensity, SI > 0.5). However, there are significant areas of disagreement in this region, where MODIS-derived DOD data shows extreme dust events (FoO > 10 %) but the G-SDS-SBM dataset shows lower emission potential (SI < 0.5), i.e., underestimated sources; there are fewer areas where MODIS-derived DOD data does not show extreme dust events (FoO < 10 %), but emission potential is higher (SI > 0.5), i.e., overestimated sources, notably on the southern portion of the Brodeur Peninsula of (far western) Baffin Island. Additionally, two considerable areas of disagreement emerge at lower latitudes in mainland Canada (MacKenzie Mountains and the border between northern Québec and Labrador), which we show to be likely dust emitting regions based on their geological features. A third large area of emission (northwest Nunavut) is neither significant on the SI map, nor does it meet the 10 % relative frequency of occurrence cutoff. This relates directly to the main limitation of this comparison, i.e., the use of threshold FoO and SI values, which can be shifted, influencing the level of agreement and disagreement. While we experimented with various thresholds and explained our logic in Sect. 3.4, the salient point is that all three datasets have limitations (G-SDS-SBM, MODIS, VIIRS) yet they all point to non-zero dust activity north of 60° N, in contrast to many model simulations of dust emission to date that have ignored these high-latitude dust sources, albeit reasonably so, e.g., on account of low model resolution or lack of input information.
When spatially averaged across the “Canadian Arctic Dust Belt” (70–80° N, 125–75° W), annual mean time series of FoO of MODIS DOD > 0.5 between 2003 and 2022 suggest some increase in the frequency of dustiness in the latter half of the period, which is consistent with our understanding that high-latitude dust emissions are likely increasing in a warming climate, but without a statistically significant anti-correlation to snow cover (only AOD and snow cover are anti-correlated). Other uncorrelated variables examined were wind speed, soil temperature, and soil moisture.
The MODIS AOD product used in our study compares well (R=0.81) to AOD from the AERONET station at Kluane Lake in Yukon Territory. While Kluane Lake is a known dust source area receiving focussed research attention, it is not a prominent dust emission hotspot in our study, likely because satellite retrievals are less frequent in the mountainous terrain. Nevertheless, the AERONET station was positioned downstream of known dust emission sources leading to good agreement with fewer data points. Conversely, the comparison is poor (R=0.31) between our MODIS AOD product and AOD from the AERONET station at Resolute Bay, Nunavut, with approximately double the data points. This AERONET station is situated close to satellite-derived dust emission hotspots in our study, however, its location is not well suited to detecting dust plumes emitted in the vicinity because the emission hotspots are downstream of the station (on average). Somewhat unsurprisingly, station location is critical for verifying satellite-derived dust aerosols; this becomes even more important when the dust product specifically targets coarse-mode particles that do not travel far from their sources. The specific satellite product used in the analysis may also be a significant factor in correlation results.
The results presented herein confirm the dust emission activity in the “Canadian Arctic Dust Belt”, and beyond, with satellite observations. The regions identified as dust emission hotspots are candidates for further research into processes involved in driving dust emission at high latitudes, and also provide a novel observational basis, which can be refined, for evaluating and improving numerical models that are used to simulate the dust cycle and the Earth System impacts of dust aerosols. Specific high-latitude locations with relatively frequent extreme dust emission events, as observed by the MODIS Aqua sensor employing the Deep Blue retrieval algorithm, during the most active emission season (JJAS) are presented in Fig. 11.
Future work to quantify the differences between retrieval algorithms that can retrieve atmospheric aerosol properties with reduced assumptions of surface reflectance over dust-emitting land types, i.e., MISR (Diner et al., 1998; Martonchik et al., 1998) and MAIAC (Lyapustin and Wang, 2022; Lyapustin et al., 2018) vs. Deep Blue (used herein, which relies on climatologies), could help to understand the potential influence of more variable surface reflectance on extreme DOD FoO statistics in the Arctic. Another area to explore is the balance between the inclusion of elevated DOD events and thin cirrus contamination (which this work treated conservatively by using DOD > 0.5), while recognizing that cloud clearing and retrieval in satellite observations is implemented in many different ways. Lastly, employing an algorithm that is optimized over water bodies, like Dark Target (Gupta et al., 2016, and references within), may yield useful information about dustiness proximal to coastal emission source regions, especially at the high spatial resolution that is appropriate for the Canadian Arctic Archipelago.
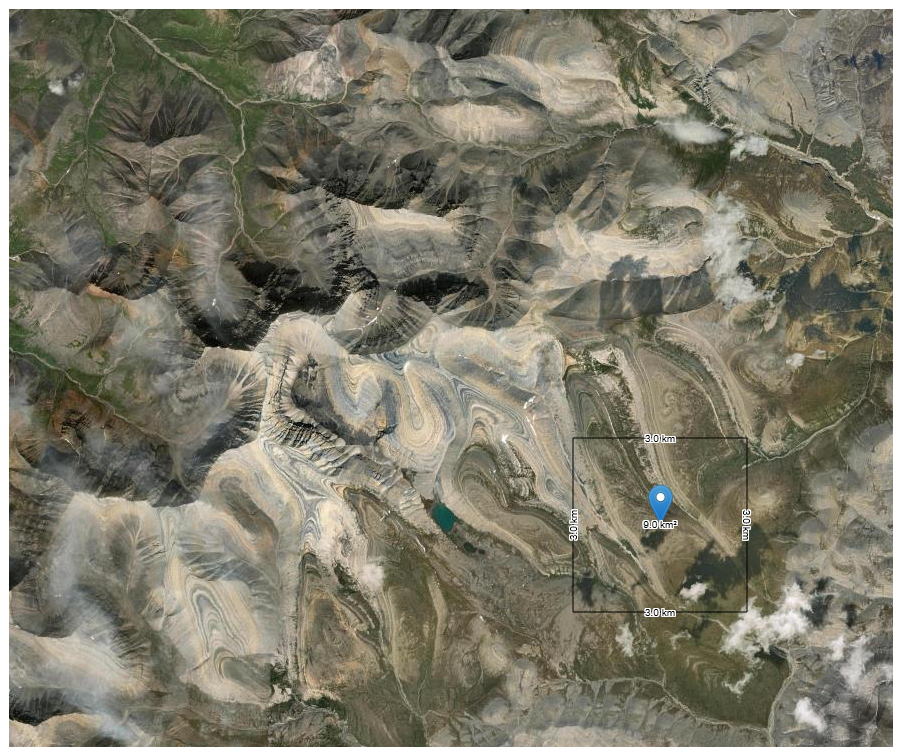
Figure A1Visible imagery of the dust emission source area in the MacKenzie Mountains (marked by a pink square in Fig. 11). Centre of 9.0 km2 box is at 63° N, 126° W with a mean wind speed of 8.13 m s−1 (predominantly westerly). Topography varies from 900 to 2300 m in full region shown. Obtained from the Global Wind Atlas (Davis et al., 2023) version 3.3, a free, web-based application developed, owned and operated by the Technical University of Denmark (DTU). The Global Wind Atlas version 3.3 is released in partnership with the World Bank Group, utilizing data provided by Vortex, using funding provided by the Energy Sector Management Assistance Program (ESMAP). For additional information: https://globalwindatlas.info (last access: 16 December 2025). 10 m resolution Google visible imagery is available at, e.g., 63.16920, −126.09163 (the precise location above is snow-covered).
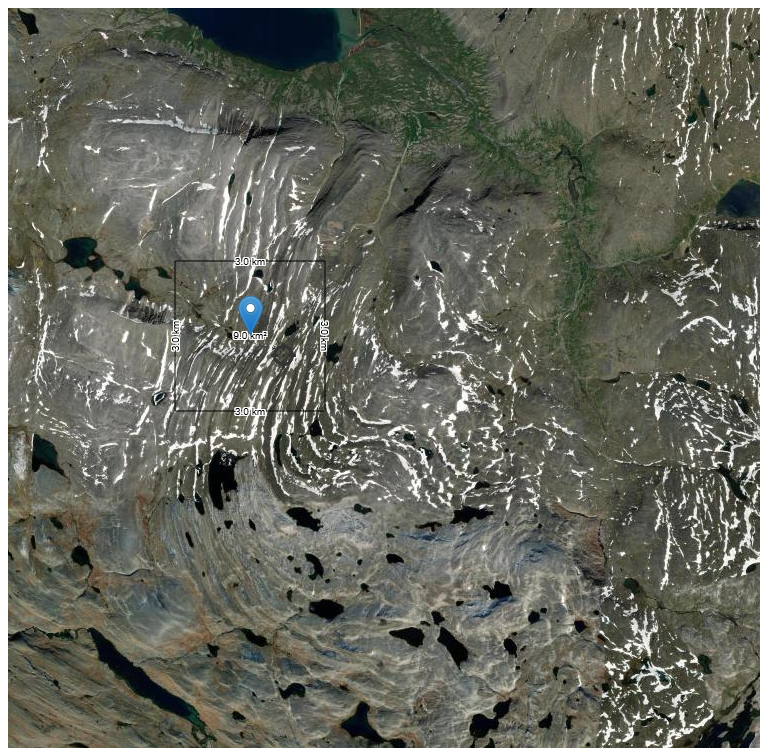
Figure A2Visible imagery of the dust emission source area at the Québec and Labrador border (marked by a blue square in Fig. 11). Centre of 9.0 km2 box is at 58.4° N, 65.1° W with a mean wind speed of 11.4 m s−1 (predominantly westerly). Topography varies from 200 to 900 m in full region shown. Obtained from the Global Wind Atlas (Davis et al., 2023) version 3.3, a free, web-based application developed, owned and operated by the Technical University of Denmark (DTU). The Global Wind Atlas version 3.3 is released in partnership with the World Bank Group, utilizing data provided by Vortex, using funding provided by the Energy Sector Management Assistance Program (ESMAP). For additional information: https://globalwindatlas.info. 10 m resolution Google visible imagery is available at, e.g., 58.38968, −65.12038.
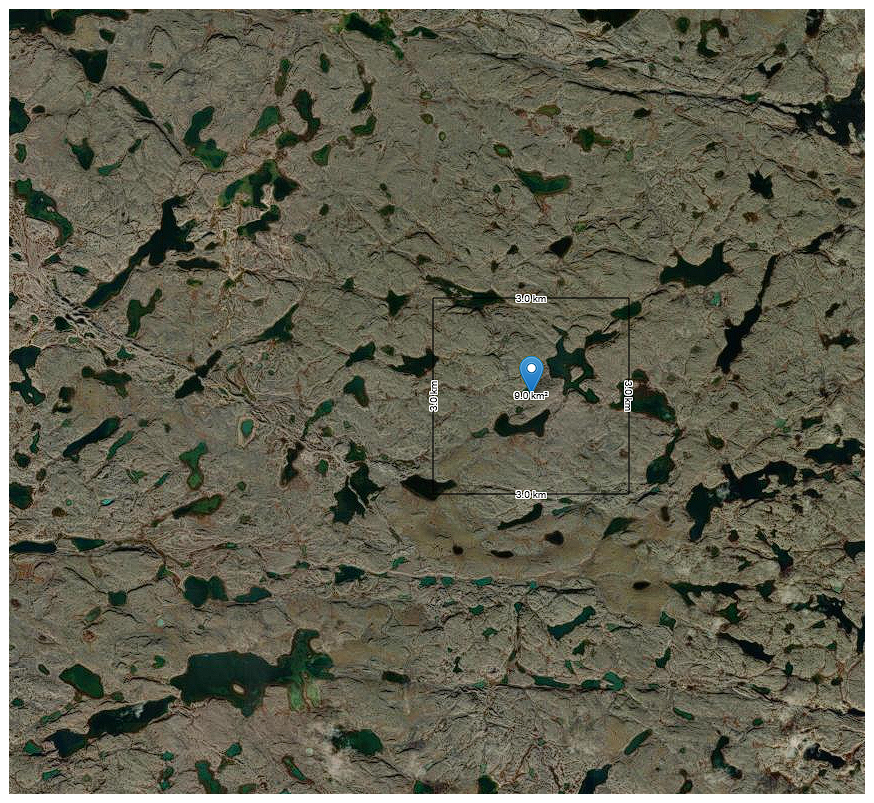
Figure A3Visible imagery of the dust emission source area in northwestern Nunavut (marked by a green square in Fig. 11). Centre of 9.0 km2 box is at 66.3° N, 112.1° W with a mean wind speed of 7.89 m s−1 (westerly and southerly). Topography varies from 500 to 600 m in full region shown. Obtained from the Global Wind Atlas (Davis et al., 2023) version 3.3, a free, web-based application developed, owned and operated by the Technical University of Denmark (DTU). The Global Wind Atlas version 3.3 is released in partnership with the World Bank Group, utilizing data provided by Vortex, using funding provided by the Energy Sector Management Assistance Program (ESMAP). For additional information: https://globalwindatlas.info. 10 m resolution Google imagery is available at, e.g., 66.83369, −111.86699.
The high-resolution MODIS AOD and DOD data products underlying this study are available upon request, as are all supporting datasets.
The supplement related to this article is available online at https://doi.org/10.5194/acp-26-5653-2026-supplement.
AW and IA both conceived of and designed the study. IA and BB performed data processing and analysis. All authors examined and interpreted the results. IA prepared the manuscript while AW edited it and BB supported the peer-review effort (including data production, results analysis, and manuscript review and revisions).
The contact author has declared that none of the authors has any competing interests.
Publisher's note: Copernicus Publications remains neutral with regard to jurisdictional claims made in the text, published maps, institutional affiliations, or any other geographical representation in this paper. The authors bear the ultimate responsibility for providing appropriate place names. Views expressed in the text are those of the authors and do not necessarily reflect the views of the publisher.
The authors thank Dr. Deanne Van Rooyen and Dr. Jacob Hanley for helpful discussions about the geological features and dust-emission potential of the MacKenzie Mountains, Québec/Labrador, and northwestern Nunavut. Any errors of discussion presented here are our own.
This research has been supported by the Canadian Space Agency (grant no. 21SUASMDAC), the Natural Sciences and Engineering Research Council of Canada (grant nos. RGPIN-2014-03888 and RGPIN-2022-05225) and Saint Mary's University.
This paper was edited by Toshihiko Takemura and reviewed by two anonymous referees.
AboEl-Fetouh, Y., O'Neill, N. T., Ranjbar, K., Hesaraki, S., Abboud, I., and Sobolewski, P. S.: Climatological-scale analysis of intensive and semi-intensive aerosol parameters derived from AERONET retrievals over the Arctic, J. Geophys. Res.-Atmos., 125, e2019JD031569, https://doi.org/10.1029/2019JD031569, 2020.
Adebiyi, A. A., Kibria, M. M., Abatzoglou, J. T., Ginoux, P., Pandey, S., Heaney, A., Chen, S.-H., and Akinsanola, A. A.: Fallowed agricultural lands dominate anthropogenic dust sources in California, Commun. Earth. Environ., 6, 324, https://doi.org/10.1038/s43247-025-02306-0, 2025.
Anderson, T. L., Wu, Y. H., Chu, D. A., Schmid, B., Redemann, J., and Dubovik, O.: Testing the MODIS satellite retrieval of aerosol fine-mode fraction, J. Geophys. Res.-Atmos., 110, D18204, https://doi.org/10.1029/2005jd005978, 2005.
Ashpole, I. and Washington, R.: An automated dust detection using SEVIRI: A multiyear climatology of summertime dustiness in the central and western Sahara, J. Geophys. Res.-Atmos., 117, D08202, https://doi.org/10.1029/2011JD016845, 2012.
Baddock, M. C., Ginoux, P., Bullard, J. E., and Gill, T. E.: Do MODIS-defined dust sources have a geomorphological signature?, Geophys. Res. Lett., 43, 2606–2613, https://doi.org/10.1002/2015GL067327, 2016.
Bi, L., Lin, W., Wang, Z., Tang, X., Zhang,X., and Yi, B.: Optical modeling of sea salt aerosols: The effects of nonsphericity and inhomogeneity, J. Geophys. Res.-Atmos., 123, 543–558, https://doi.org/10.1002/2017JD027869, 2018.
Bullard, J. E.: Contemporary glacigenic inputs to the dust cycle, Earth Surf. Proc. Land, 38, 71–89, https://doi.org/10.1002/esp.3315, 2013.
Bullard, J. E., Baddock, M., Bradwell, T., Crusius, J., Darlington, E., Gaiero, D., Gasso, S., Gisladottir, G., Hodgkins, R., and McCulloch, R.: High-latitude dust in the Earth system, Rev. Geophys., 54, 447–485, https://doi.org/10.1002/2016RG000518, 2016.
Danielson, J. J. and Gesch, D. B.: Global multi-resolution terrain elevation data 2010 (GMTED2010), U.S. Geological Survey Open-File Report 2011-1073, 26 pp., http://pubs.usgs.gov/of/2011/1073/pdf/of2011-1073.pdf (last access: 11 January 2024), 2011.
Dansie, A. P., Thomas, D. S. G., Wiggs, G. F. S., Baddock, M. C, and Ashpole, I.: Plumes and blooms – Locally-sourced Fe-rich aeolian mineral dust drives phytoplankton growth off southwest Africa, Sci. Total Environ., 829, https://doi.org/10.1016/j.scitotenv.2022.154562, 2022.
Davis, N. N., Badger, J., Hahmann, A. N., Hansen, B. O., Mortensen, N. G., Kelly, M., Larsén, X. G., Olsen, B. T., Floors, R. Lizcano, G., Casso, P., Lacave, O., Bosch, A., Bauwens, I., Knight, O. J., van Loon, A. P., Fox, R., Parvanyan, T., Krohn Hansen, S. B., Heathfield, D., Onninen, M., and Drummond, R.: The Global Wind Atlas: A high-resolution dataset of climatologies and associated web-based application, B. Am. Meteorol. Soc., 104, E1507–E1525, https://doi.org/10.1175/BAMS-D-21-0075.1, 2023.
Di Biagio, C., Pelon, J., Ancellet, G., Bazureau, A., and Mariage, V.: Sources, load, vertical distribution, and fate of wintertime aerosols north of Svalbard from combined V4 CALIOP data, ground-based IAOOS lidar observations and trajectory analysis, J. Geophys. Res.-Atmos., 123, 1363–1383, https://doi.org/10.1002/2017JD027530, 2018.
Diner, D. J., Beckert, J. C., Reilly, T. H., Bruegge, C. J., Conel, J. E., Kahn, R. A., Martonchik, J. V., Ackerman, T. P., Davies, R., Gerstl, S. A. W., Gordon, H. R., Muller, J.-P., Myneni, R., Sellers, P. J., Pinty, B., and Verstraete, M. M.: Multi-angle Imaging SpectroRadiometer (MISR) instrument description and experiment overview, IEEE T. Geosci. Remote, 36, 1072–1087, https://doi.org/10.1109/36.700992, 1998.
Dubovik, O., Holben, B., Eck, T. F., Smirnov, A., Kaufman, Y. J., King, M. D., Tanré, D., and Slutsker, I.: Variability of absorption and optical properties of key aerosol types observed in worldwide locations, J. Atmos. Sci., 59,590–608, https://doi.org/10.1175/1520-0469(2002)059<0590:VOAAOP>2.0.CO;2, 2002.
Eck, T. F., Holben, B. N., Reid, J. S., Dubovik, O., Smirnov, A., O'Neill, N. T., Slutsker, I., and Kinne, S.: Wavelength dependence of the optical depth of biomass burning, urban, and desert dust aerosols, J. Geophys. Res., 104, 31333–31349, https://doi.org/10.1029/1999JD900923, 1999.
Giles, D. M., Sinyuk, A., Sorokin, M. G., Schafer, J. S., Smirnov, A., Slutsker, I., Eck, T. F., Holben, B. N., Lewis, J. R., Campbell, J. R., Welton, E. J., Korkin, S. V., and Lyapustin, A. I.: Advancements in the Aerosol Robotic Network (AERONET) Version 3 database – automated near-real-time quality control algorithm with improved cloud screening for Sun photometer aerosol optical depth (AOD) measurements, Atmos. Meas. Tech., 12, 169–209, https://doi.org/10.5194/amt-12-169-2019, 2019.
Ginoux, P., Prospero, J. M., Gill, T. E., Hsu, N. C., and Zhao, M.: Global-scale attribution of anthropogenic and natural dust sources and their emission rates based on MODIS Deep Blue aerosol products, Rev. Geophys., 50, RG3005, https://doi.org/10.1029/2012RG000388, 2012.
Gong, X., Zhang, J., Croft, B., Yang, X., Frey, M. M., Bergner, N., Chang, R. Y.-W., Creamean, J. M., Kuang, C., Martin, R. V., Ranjithkumar, A., Sedlacek, A. J., Uin, J., Willmes, S., Zawadowicz, M. A., Pierce, J. R., Shupe, M. D., Schmale, J., and Wang, J.: Arctic warming by abundant fine sea salt aerosols from blowing snow, Nat. Geosci., 16, 768–774, https://doi.org/10.1038/s41561-023-01254-8, 2023.
González-Flórez, C., Klose, M., Alastuey, A., Dupont, S., Escribano, J., Etyemezian, V., Gonzalez-Romero, A., Huang, Y., Kandler, K., Nikolich, G., Panta, A., Querol, X., Reche, C., Yus-Díez, J., and Pérez García-Pando, C.: Insights into the size-resolved dust emission from field measurements in the Moroccan Sahara, Atmos. Chem. Phys., 23, 7177–7212, https://doi.org/10.5194/acp-23-7177-2023, 2023.
Gorter, W., van Angelen, J. H., Lenaerts, J. T. M., and van den Broeke, M. R.: Present and future near-surface wind climate of Greenland from high resolution regional climate modelling, Clim. Dynam., 42, 1595–1611, https://doi.org/10.1007/s00382-013-1861-2, 2014.
Groot Zwaaftink, C. D., Grythe, H., Skov, H., and Stohl, A.: Substantial contribution of northern high-latitude sources to mineral dust in the Arctic, J. Geophys. Res.-Atmos., 121, 13678–13697, https://doi.org/10.1002/2016JD025482, 2016.
Gulev, S. K., Thorne, P. W., Ahn, J. , Dentener, F. J., Domingues, C. M., Gerland, S., Gong, D., Kaufman, D. S., Nnamchi, H. C., Quaas, J., Rivera, J. A., Sathyendranath, S., Smith, S. L., Trewin, B., von Schuckmann, K., and Vose, R. S.: Changing State of the Climate System, in: Climate Change 2021: The Physical Science Basis. Contribution of Working Group I to the Sixth Assessment Report of the Intergovernmental Panel on Climate Change, edited by: Masson-Delmotte, V., Zhai, P., Pirani, A., Connors, S. L., Péan, C., Berger, S., Caud, N., Chen, Y., Goldfarb, L., Gomis, M. I., Huang, M., Leitzell, K., Lonnoy, E., Matthews, J. B. R., Maycock, T. K., Waterfield, T., Yelekçi, O., Yu, R., and Zhou, B., Cambridge University Press, Cambridge, United Kingdom and New York, NY, USA, 287–422, https://doi.org/10.1017/9781009157896, 2021.
Gupta, P., Levy, R. C., Mattoo, S., Remer, L. A., and Munchak, L. A.: A surface reflectance scheme for retrieving aerosol optical depth over urban surfaces in MODIS Dark Target retrieval algorithm, Atmos. Meas. Tech., 9, 3293–3308, https://doi.org/10.5194/amt-9-3293-2016, 2016.
Hersbach, H., Bell, B., Berrisford, P., Hirahara, S., Horányi, A., Muñoz‐Sabater, J., Nicolas, J., Peubey, C., Radu, R., Schepers, D., Simmons, A., Soci, C., Abdalla, S., Abellan, X., Balsamo, G., Bechtold, P., Biavati, G., Bidlot, J., Bonavita, M., De Chiara, G., Dahlgren, P., Dee, D., Diamantakis, M., Dragani, R., Flemming, J., Forbes, R., Fuentes, M., Geer, A., Haimberger, L., Healy, S., Hogan, R.J., Hólm, E., Janisková, M., Keeley, S., Laloyaux, P., Lopez, P., Lupu, C., Radnoti, G., de Rosnay, P., Rozum, I., Vamborg, F., Villaume, S., and Thépaut, J.-N.: Complete ERA5 from 1940: Fifth generation of ECMWF atmospheric reanalyses of the global climate. Copernicus Climate Change Service (C3S) Data Store (CDS) [data set], https://doi.org/10.24381/cds.143582cf, 2017.
Holben, B. N., Eck, T. F., Slutsker, I., Tanré, D., Buis, J. P., Setzer, A., Vermote, E., Reagan, J. A., Kaufman, Y. J., Nakajima, T., Lavenu, F., Jankowiak, I., and Smirnov, A.: AERONET – A federated instrument network and data archive for aerosol characterization, Remote Sens. Environ., 66, 1–16, https://doi.org/10.1016/S0034-4257(98)00031-5, 1998.
Hsu, N. C., Jeon, M.-J., Bettenhausen, C. , Sayer, A. M., Hansell, R., Seftor, C. S., Huang, J., and Tsay, S.-C.: Enhanced Deep Blue aerosol retrieval algorithm: The second generation, J. Geophys. Res.-Atmos., 118, 9296–9315, https://doi.org/10.1002/jgrd.50712, 2013.
Hsu, N. C., Lee, J., Sayer, A. M., Kim, W., Bettenhausen, C., and Tsay, S.-C.: VIIRS Deep Blue aerosol products over land: Extending the EOS long-term aerosol data records, J. Geophys. Res.-Atmos., 124, 4026–4053, https://doi.org/10.1029/2018JD029688, 2019.
Huck, R., Bryant, R. G., and King, J.: The (mis)identification of high-latitude dust events using remote sensing methods in the Yukon, Canada: a sub-daily variability analysis, Atmos. Chem. Phys., 23, 6299–6318, https://doi.org/10.5194/acp-23-6299-2023, 2023.
Kim, M.-H., Omar, A. H., Tackett, J. L., Vaughan, M. A., Winker, D. M., Trepte, C. R., Hu, Y., Liu, Z., Poole, L. R., Pitts, M. C., Kar, J., and Magill, B. E.: The CALIPSO version 4 automated aerosol classification and lidar ratio selection algorithm, Atmos. Meas. Tech., 11, 6107–6135, https://doi.org/10.5194/amt-11-6107-2018, 2018.
Kok, J. F.: A scaling theory for the size distribution of emitted dust aerosols suggests climate models underestimate the size of the global dust cycle, P. Natl. Acad. Sci. USA, 108, 1016–1021, https://doi.org/10.1073/pnas.1014798108, 2011.
Kok, J. F., Ridley, D. A., Zhou, Q., Miller, R. L., Zhao, C., Heald, C. L., Ward, D. S., Albani, S., and Haustein, K.: Smaller desert dust cooling effect estimated from analysis of dust size and abundance, Nat. Geosci., 10, https://doi.org/10.1038/Ngeo2912, 2017.
Kok, J. F., Ward, D. S., Mahowald, N. M., and Evan, A. T.: Global and regional importance of the direct dust-climate feedback, Nat. Commun., 9, https://doi.org/10.1038/s41467-017-02620-y, 2018.
Kylling, A., Groot Zwaaftink, C. D., and Stohl, A.: Mineral dust instantaneous radiative forcing in the Arctic, Geophys. Res. Lett., 45, 4290–4298, https://doi.org/10.1029/2018GL077346, 2018.
Lambert, A., Hallar, A. G., Garcia, M., Strong, C., Andrews, E., and Hand, J. L.: Dust impacts of rapid agricultural expansion on the Great Plains, Geophys. Res. Lett., 47, e2020GL090347, https://doi.org/10.1029/2020GL090347, 2020.
Lyapustin, A. and Wang, Y.: MODIS Multi-Angle Implementation of Atmospheric Correction (MAIAC) Data User’s Guide, Collection 6.1, Version 3.1, NASA, https://lpdaac.usgs.gov/documents/1500/MCD19_User_Guide_V61.pdf (last access: 19 December 2025), 2022.
Lyapustin, A., Wang, Y., Korkin, S., and Huang, D.: MODIS Collection 6 MAIAC algorithm, Atmos. Meas. Tech., 11, 5741–5765, https://doi.org/10.5194/amt-11-5741-2018, 2018.
Martonchik, J. V., Diner, D. J., Kahn, R. A., Ackerman, T. P., Verstraete, M. M., Pinty, B., and Gordon, H. R.: Techniques for the retrieval of aerosol properties over land and ocean using multiangle imaging, IEEE T. Geosci. Remote, 36, 1212–1227, https://doi.org/10.1109/36.701027, 1998.
Meinander, O., Dagsson-Waldhauserova, P., Amosov, P., Aseyeva, E., Atkins, C., Baklanov, A., Baldo, C., Barr, S. L., Barzycka, B., Benning, L. G., Cvetkovic, B., Enchilik, P., Frolov, D., Gassó, S., Kandler, K., Kasimov, N., Kavan, J., King, J., Koroleva, T., Krupskaya, V., Kulmala, M., Kusiak, M., Lappalainen, H. K., Laska, M., Lasne, J., Lewandowski, M., Luks, B., McQuaid, J. B., Moroni, B., Murray, B., Möhler, O., Nawrot, A., Nickovic, S., O’Neill, N. T., Pejanovic, G., Popovicheva, O., Ranjbar, K., Romanias, M., Samonova, O., Sanchez-Marroquin, A., Schepanski, K., Semenkov, I., Sharapova, A., Shevnina, E., Shi, Z., Sofiev, M., Thevenet, F., Thorsteinsson, T., Timofeev, M., Umo, N. S., Uppstu, A., Urupina, D., Varga, G., Werner, T., Arnalds, O., and Vukovic Vimic, A.: Newly identified climatically and environmentally significant high-latitude dust sources, Atmos. Chem. Phys., 22, 11889–11930, https://doi.org/10.5194/acp-22-11889-2022, 2022.
Moore, G., Renfrew, I. A., and Cassano, J. J.: Greenland plateau jets, Tellus A, 65, 17468, https://doi.org/10.3402/tellusa.v65i0.17468, 2013.
Nogueira, J., Evangelista, H., de Morisson Valeriano, C., Sifeddine, A., Neto, C., Vaz, G., Moreira, L. S., Cordeiro, R. C., Turcq, B., Aniceto, K. C., Bastos Neto, A., Martins, G., Barbosa, C. G. G., Godoi, R. H. M., and Shimizu, M. H.: Dust arriving in the Amazon basin over the past 7,500 years came from diverse sources, Commun. Earth Environ., 2, 5, https://doi.org/10.1038/s43247-020-00071-w, 2021.
Omar, A. H., Winker, D. M., Vaughan, M. A., Hu, Y., Trepte, C. R., Ferrare, R. A., Lee, K. P., Hostetler, C. A., Kittaka, C., Rogers, R. R., and Kuehn, R. E.: The CALIPSO Automated Aerosol Classification and Lidar Ratio Selection Algorithm, J. Atmos. Ocean. Tech., 26, 1994–2014, https://doi.org/10.1175/2009JTECHA1231.1, 2009.
Pierce, J. R., Kahn, R. A., Davis, M. R., and Comstock, J. M.: Detecting thin cirrus in Multiangle Imaging Spectroradiometer aerosol retrievals, J. Geophys. Res., 115, D08201, https://doi.org/10.1029/2009JD013019, 2010.
Platnick, S., King, M., Wind, B., and Ridgway, W.: MODIS Atmosphere L2 Joint Atmosphere Product. NASA MODIS Adaptive Processing System, Goddard Space Flight Center [data set], https://doi.org/10.5067/MODIS/MYDATML2.061, 2017.
Prijith, S. S., Aloysius, M., and Mohan, M.: Global aerosol source/sink map, Atmos. Environ., 80, 533–539, https://doi.org/10.1016/j.atmosenv.2013.08.038, 2013.
Prospero, J. M.: Long-range transport of mineral dust in the global atmosphere: Impact of African dust on the environment of the southeastern United States, P. Natl. Acad. Sci. USA, 96, 3396–3403, https://doi.org/10.1073/pnas.96.7.3396, 1999.
Prospero, J. M., Ginoux, P., Torres, O., Nicholson, S. E., and Gill, T. E.: Environmental characterization of global sources of atmospheric soil dust identified with the NIMBUS 7 Total Ozone Mapping Spectrometer (TOMS) absorbing aerosol product, Rev. Geophys., 40, 1002, https://doi.org/10.1029/2000RG000095, 2002.
Pu, B. and Ginoux, P.: The impact of the Pacific Decadal Oscillation on springtime dust activity in Syria, Atmos. Chem. Phys., 16, 13431–13448, https://doi.org/10.5194/acp-16-13431-2016, 2016.
Pu, B., Ginoux, P., Guo, H., Hsu, N. C., Kimball, J., Marticorena, B., Malyshev, S., Naik, V., O'Neill, N. T., Pérez García-Pando, C., Paireau, J., Prospero, J. M., Shevliakova, E., and Zhao, M.: Retrieving the global distribution of the threshold of wind erosion from satellite data and implementing it into the Geophysical Fluid Dynamics Laboratory land–atmosphere model (GFDL AM4.0/LM4.0), Atmos. Chem. Phys., 20, 55–81, https://doi.org/10.5194/acp-20-55-2020, 2020.
Ranjbar, K., O'Neill, N. T., Ivanescu, L., King, J., and Hayes, P. L.: Remote sensing of a high- Arctic, local dust event over Lake Hazen (Ellesmere Island, Nunavut, Canada), Atmos. Environ., 246, 118102, https://doi.org/10.1016/j.atmosenv.2020.118102, 2021.
Sarangi, C., Qian, Y., Rittger, K., Leung, L. R., Chand, D., Bormann, K. J., and Painter, T. H.: Dust dominates high-altitude snow darkening and melt over high-mountain Asia, Nat. Clim. Change, https://doi.org/10.1038/s41558-020-00909-3, 2020.
Sayedain, S. A. and O'Neill, N. T.: Community Comment 1 on “Satellite-based evidence of dust emission over Northern Canada” by Ashpole and Wiacek, EGUsphere [preprint], https://doi.org/10.5194/egusphere-2024-3828-CC1, 2025.
Sayedain, S. A., O'Neill, N. T., King, J., Hayes, P. L., Bellamy, D., Washington, R., Engelstaedter, S., Vicente-Luis, A., Bachelder, J., and Bernhard, M.: Detection and analysis of LhÃ1'à à n Mân' (Kluane Lake) dust plumes using passive and active ground-based remote sensing supported by physical surface measurements, Atmos. Meas. Tech., 16, 4115–4135, https://doi.org/10.5194/amt-16-4115-2023, 2023.
Sayer, A. M., Hsu, N. C., Bettenhausen, C., Jeong, M.-J., and Meister, G.: Effect of MODIS Terra radiometric calibration improvements on Collection 6 Deep Blue aerosol products: Validation and Terra/Aqua consistency, J. Geophys. Res.-Atmos., 120, 12157–12174, https://doi.org/10.1002/2015JD023878, 2015.
Sayer, A. M., Hsu, N. C., Lee, J., Kim, W. V., and Dutcher, S. T.: Validation, stability, and consistency of MODIS Collection 6.1 and VIIRS version 1 Deep Blue aerosol data over land, J. Geophys. Res.-Atmos., 124, 4658–4688, https://doi.org/10.1029/2018JD029598, 2019.
Shi, Y., Liu, X., Wu, M., Zhao, X., Ke, Z., and Brown, H.: Relative importance of high-latitude local and long-range-transported dust for Arctic ice-nucleating particles and impacts on Arctic mixed-phase clouds, Atmos. Chem. Phys., 22, 2909–2935, https://doi.org/10.5194/acp-22-2909-2022, 2022.
Tackett, J. L., Winker, D. M., Getzewich, B. J., Vaughan, M. A., Young, S. A., and Kar, J.: CALIPSO lidar level 3 aerosol profile product: version 3 algorithm design, Atmos. Meas. Tech., 11, 4129–4152, https://doi.org/10.5194/amt-11-4129-2018, 2018.
Tegen, I.: Modeling the mineral dust aerosol cycle in the climate system, Quaternary Sci. Rev., 22, 1821–1834, https://doi.org/10.1016/S0277-3791(03)00163-X, 2003.
Tobo, Y., Adachi, K., DeMott, P. J., Hill, T. C. J., Hamilton, D. S., Mahowald, N. M., and Koike, M.: Glacially sourced dust as a potentially significant source of ice nucleating particles, Nat. Geosci., 12, 253–258, https://doi.org/10.1038/s41561-019-0314-x, 2019.
Todd, M. C. and Cavazos-Guerra, C.: Dust aerosol emission over the Sahara during summertime from Cloud-Aerosol Lidar with Orthogonal Polarization (CALIOP) observations, Atmos. Environ., 128, 147–157, https://doi.org/10.1016/j.atmosenv.2015.12.037, 2016.
Tomasi, C., Kokhanovsky, A. A., Lupi, A., Ritter, C., Smirnov, A., O'Neill, N. T., Stone, R. S., Holben, B. N., Nyeki, S., Wehrli, C., Stohl, A., Mazzola, M., Lanconelli, C., Vitale, V., Stebel, K., Aaltonen, V., de Leeuw, G., Rodriguez, E., Herber, A. B., Radionov, V. F., and Piketh, S. J.: Aerosol remote sensing in polar regions, Earth-Sci. Rev., 140, 108–157, https://doi.org/10.1016/j.earscirev.2014.11.001, 2015.
VIIRS Atmosphere Science Team, S. S. E. C.: VIIRS/SNPP Deep Blue Aerosol L2 6-Min Swath 6 km, NASA Level 1 and Atmosphere Archive and Distribution System Distributed Active Archive Center [data set], https://doi.org/10.5067/VIIRS/AERDB_L2_VIIRS_SNPP.002, 2023.
Vukovic-Vimic, A.: Global high-resolution dust source map, InDust webinar, https://cost-indust.eu/sites/default/files/2021-04/vukovic_indust_webinar_april2021.pdf (last access: 11 January 2024), 2021.
Vukovic-Vimic, A.: Sand and dust storm source mapping, in United Nations Convention to Combat Desertification (UNCCD), Sand and Dust Storms Compendium: Information and Guidance on Assessing and Addressing the Risks, Bonn, Germany, ISBN 978-92-95118-11-9, 2022.
Washington, R. M., Todd, M., Middleton, N. J., and Goudie, A. S.: Dust-storm areas determined by the Total Ozone Monitoring Spectrometer and surface observations, Ann. Assoc. Am. Geogr., 93, 297–313, https://doi.org/10.1111/1467-8306.9302003, 2003.
Wiacek, A., Peter, T., and Lohmann, U.: The potential influence of Asian and African mineral dust on ice, mixed-phase and liquid water clouds, Atmos. Chem. Phys., 10, 8649–8667, https://doi.org/10.5194/acp-10-8649-2010, 2010.
Winker, D. M., Pelon, J., Coakley Jr, J. A., Ackerman, S. A., Charlson, R. J., Colarco, P. R., Flamant, P., Fu, Q., Hoff, R. M., Kittaka, C., Kubar, T. L., Le Treut, H., McCormick, M. P., Mégie, G., Poole, L., Powell, K., Trepte, C., Vaughan, M. A., and Wielicki, B. A.: The CALIPSO mission: A global 3D view of aerosols and clouds, B. Am. Meteorol. Soc., 91, 1211–1229, https://doi.org/10.1175/2010BAMS3009.1, 2010.
Yang, A., Tan, Q., Rajapakshe, C., and Chin, M.: Global premature mortality by dust and pollution PM2.5 estimated from aerosol reanalysis of the modern-era retrospective analysis for research and applications, version 2, Front. Environ. Sci., 10, https://doi.org/10.3389/fenvs.2022.975755, 2022.
Zamora, L. M., Kahn, R. A., Evangeliou, N., Groot Zwaaftink, C. D., and Huebert, K. B.: Comparisons between the distributions of dust and combustion aerosols in MERRA-2, FLEXPART, and CALIPSO and implications for deposition freezing over wintertime Siberia, Atmos. Chem. Phys., 22, 12269–12285, https://doi.org/10.5194/acp-22-12269-2022, 2022.
Zhao, X., Huang, K., Fu, J. S., and Abdullaev, S. F.: Long-range transport of Asian dust to the Arctic: identification of transport pathways, evolution of aerosol optical properties, and impact assessment on surface albedo changes, Atmos. Chem. Phys., 22, 10389–10407, https://doi.org/10.5194/acp-22-10389-2022, 2022.