the Creative Commons Attribution 4.0 License.
the Creative Commons Attribution 4.0 License.
 | 22 Apr 2026
PAMS-constrained top-down calibration of VOC-speciated CMAQ simulations
Chieh-Heng Wang
Yi-Ju Lee
Fang-Yi Cheng
Jia-Lin Wang
Accurate simulation of volatile organic compounds (VOCs) remains a persistent challenge in chemical transport models (CTMs), limiting their ability to diagnose species-specific emissions and their role in ozone (O3) formation. Most models rely on lumped surrogate species, which limits their ability to represent speciated VOCs and directly compare with observations. In this study, we develop an enhanced version of the Community Multiscale Air Quality model, termed CMAQ-PAMS, which explicitly incorporates 54 VOC species targeted by the Photochemical Assessment Monitoring Stations (PAMS) network in Taiwan.
We evaluate model performance during a representative high-ozone event in fall 2021 and apply a top-down calibration approach using hourly VOC data from 12 PAMS sites. The original simulation (OrigSIM) significantly misrepresents key species, largely due to reliance on U.S.-based speciation profiles. After adjustment, the modified simulation (ModSIM) shows substantial improvements in both individual species concentrations and group-level composition (e.g., alkanes, aromatics). Notably, acetylene, a key tracer of incomplete combustion, was underestimated in OrigSIM but successfully recovered in ModSIM.
Despite accounting for only ∼ 32 % of total VOC emissions, PAMS species contribute up to 52 % of modeled domestic O3 formation, highlighting their disproportionate impact in VOC-limited regimes. Additionally, the CMAQ-PAMS framework enables the use of diagnostic ratios (e.g., propylene acetylene) to identify emission sources and assess air mass aging. These findings underscore the importance of localized VOC profiling and demonstrate that the PAMS-constrained CMAQ-PAMS model provides a more chemically detailed and observationally anchored platform for ozone modeling and regulatory applications.
- Article
(10451 KB) - Full-text XML
-
Supplement
(11845 KB) - BibTeX
- EndNote


In recent years, due to the effectiveness of regulatory strategies implemented by the environmental authority (Ministry of the Environment (MOENV), Taiwan), most primary pollutants, including NOx, CO, VOCs, have shown a declining trend (Chen et al., 2021). However, ozone (O3) has exhibited a contrasting trend – increasing during the early 2000s and stabilizing only since around 2007 (Chen et al., 2014b, 2021). O3 formation is governed by highly nonlinear chemical reactions involving its precursors, nitrogen oxides (NOx) and volatile organic compounds (VOCs). The estimation of NOx emissions is relatively well-characterized, due to their simpler composition and reliable monitoring from over 80 air quality monitoring stations across Taiwan, VOC emissions present a far greater challenge.
VOCs comprise hundreds of chemically diverse species, each with distinct reactivities and emission sources (Atkinson, 2013; Goldstein and Galbally, 2007). This complexity makes accurate VOC emission estimation and model validation particularly difficult (Fine et al., 2003). Many widely used mechanisms, such as the Carbon Bond families (Yarwood et al., 2005) and SAPRC families (Carter, 2010), reduce computational cost by grouping chemically similar VOCs into lumped surrogate species. Other mechanisms, including RACM2 (Goliff et al., 2013), MOZART (Emmons et al., 2010), and the near-explicit Master Chemical Mechanism (MCM) (Metzger et al., 2008), provide more detailed or explicit representations of VOC oxidation pathways, albeit with substantially greater computational demands. As a result, many individual VOCs and their unique roles in O3 formation remain unresolved in model simulations (Kang et al., 2016).
However, despite their widespread use, lumped VOC species cannot be directly compared with observational VOC datasets such as NMHC measurements, because only a limited subset of explicitly modeled species corresponds to measurable compounds. As a result, validation of VOC simulations has remained an unresolved issue: most previous studies evaluate model performance primarily for O3, NOx and PM2.5 (Cheng et al., 2015, 2021; Chang et al., 2023; Chen et al., 2025; Tsai et al., 2025) prior to conducting sensitivity or scenario analyses, yet rarely validate VOC simulations due to this incompatibility. This gap makes it difficult to assess whether simulated VOC composition and reactivity are reasonable, even though these precursors critically determine ozone formation behavior.
Our current MOENV monitoring network monitors VOCs at approximately half of the 80 sites, but only provides total mixing ratios of non-methane hydrocarbons (NMHCs), making it difficult to validate the mixing ratios of individual VOC simulations and their subsequent impact on O3 formation.
Following the 1990 amendments to the Clean Air Act in the United States, Photochemical Assessment Monitoring Stations (PAMS) were established in ozone non-containment areas. These stations provide detailed observations of individual VOC species. Taiwan adopted a similar version of PAMS in 2001, using multiple automated gas chromatographs (auto-GC) as the core observation tool (Wang et al., 2004). PAMS stations in Taiwan measure up to 54 individual VOC species, providing critical hourly data for understanding the sources of pollution and offering direct evidence of the photochemical processes contributing to O3 formation.
Since the availability of PAMS, many researchers have used these data to investigate the relationship of individual VOC species with O3. In 1995, Cardelino and Chameides (1990) analyzed the Relative Incremental Reactivity (RIR) of 54 VOC species measured by PAMS, classifying these VOCs and assessing the contributions of anthropogenic and biogenic sources to O3 formation. In Taiwan, Yang et al. (2005) analyzed continuous PAMS data from central Taiwan, revealing diurnal and seasonal variability in VOC species, which were further classified into petroleum leaks, vehicular emissions, and biogenic sources. Lee and Wang (2006) also studied isoprene, identifying its seasonal variability and its relationship to diurnal O3 fluctuations. Ahmed et al. (2025) reported trends of PAMS species over two decades of measurements in Texas, highlighting an increase in isoprene attributed mainly to rising temperatures over time. However, most related studies only focused on individual VOC measurements without integrating the overall PAMS data with VOC simulations. Theoretically, ozone simulations require the incorporation of numerous key reactive species and their associated chemical reactions. However, due to computational limitations, current state-of-the-art air quality models (or chemical transport models) such as CMAQ and GEOS-Chem (http://www.geos-chem.org/, last access: 14 February 2026) employ a simplified chemical mechanism, where chemically similar species are aggregated into surrogates to reduce computational load (Zhang et al., 2005). Commonly used lumped mechanisms include CBM (Zaveri and Peters, 1999), SAPRC (Carter, 2010), RADM2 (Stockwell et al., 1990), and RACM (Stockwell et al., 1997). While these mechanisms significantly reduce simulation resource consumption, they obscure the representation of individual species and their specific reactions and limit the ability to compare modeled results with detailed speciated VOC observations, making it challenging to directly simulate individual VOC species with trustworthy results. As previous studies have shown, while PAMS stations have provided continuous VOC data for years, air quality models have yet to fully simulate the detailed variability of individual VOC species. Only in recent years have models begun to assess discrepancies between simulated VOC emissions and observations, leading to efforts to refine and update VOC emission inventories and source profiles (Chen et al., 2010, 2014a, 2015; Ying and Li, 2011; Su et al., 2016; Ge et al., 2024; Rowlinson et al., 2024). However, conventional CMAQ configurations do not explicitly resolve the full suite of PAMS species, limiting their ability to diagnose species-specific contributions to ozone formation or to evaluate model performance against detailed observational datasets. Each of the 54 PAMS species was assigned to a corresponding lumped surrogate species in both the CB05e51 and CB6r3 mechanisms based on molecular structure. Straight-chain and branched alkanes were mapped to PAR, terminal alkenes to OLE, internal alkenes to IOLE, mono-alkyl aromatics to TOL, poly-alkyl aromatics to XYL, benzene to BENZ, acetylene to ETHY, ethane to ETHA, ethene to ETH, propane to PRPA, and isoprene to ISOP. A complete species-level mapping list is provided in the Supplement (Table S1).
The novelty of CMAQ-PAMS lies in bridging this long-standing gap between lumped-mechanism modeling and species-resolved VOC observations. In this study, we introduce 54 PAMS-targeted VOC species into a regional CTM without resorting to a fully explicit mechanism, thereby maintaining the computational efficiency and chemical structure of the CB6 framework. At the same time, the model incorporates species-specific emission mapping and output configurations that allow direct comparison with PAMS measurements. This development established a new evaluation framework in which modeled and observed VOCs can be compared at the individual-species level – an outcome that has not been achievable using lumped mechanisms alone. As a result, CMAQ-PAMS substantially enhances diagnostic capability for source attribution, emission speciation assessment, and photochemical regime classification (e.g., VOC-limited vs. NOx-limited conditions), now grounded in species-resolved VOC reactivity rather than aggregated surrogates.
Previous work by our group has demonstrated the feasibility of incorporating PAMS-speciated VOC chemistry into an air-quality modeling framework through the development of the PAMS-AQM system (Chen et al., 2010). While this earlier system provided valuable insights into the benefits of species-resolved VOC simulations, it was not built upon the CMAQ modeling platform and therefore could not be integrated with the full chemical, dynamical, and diagnostic capabilities required for regional ozone simulations. Extending this concept to CMAQ represents a necessary next step and is a central objective of the present study.
This gap is critical because individual VOCs exhibit highly variable reactivities, emission sources, and sensitivities to control strategies. Developing CMAQ-PAMS – an enhanced version of CMAQ capable of simulating individual PAMS species – provides a necessary framework for directly linking model outputs with observational constraints, refining VOC emission inventories, and improving mechanistic understanding of ozone formation processes. By enabling species-level comparisons between simulations and PAMS observations, CMAQ-PAMS facilitates a more rigorous assessment of VOC model performance than has been possible with standard lumped-species mechanisms. This capability is particularly important for regions like Taiwan, where ozone episodes are strongly influenced by speciated VOC chemistry but where emission inventories and model representations remain uncertain.
In response, this work applies the CMAQ model together with PAMS observations to evaluate how well VOC species are represented. Specifically, the focus is on assessing how VOC simulations align with PAMS observations by employing a modified version of CMAQ, referred to as CMAQ-PAMS, which is designed to simulate individual PAMS species. By comparing the model results with PAMS observations, the study seeks to enhance VOC species simulations and refine emission inventories, ultimately quantifying the aggregated PAMS contribution to ozone formation.
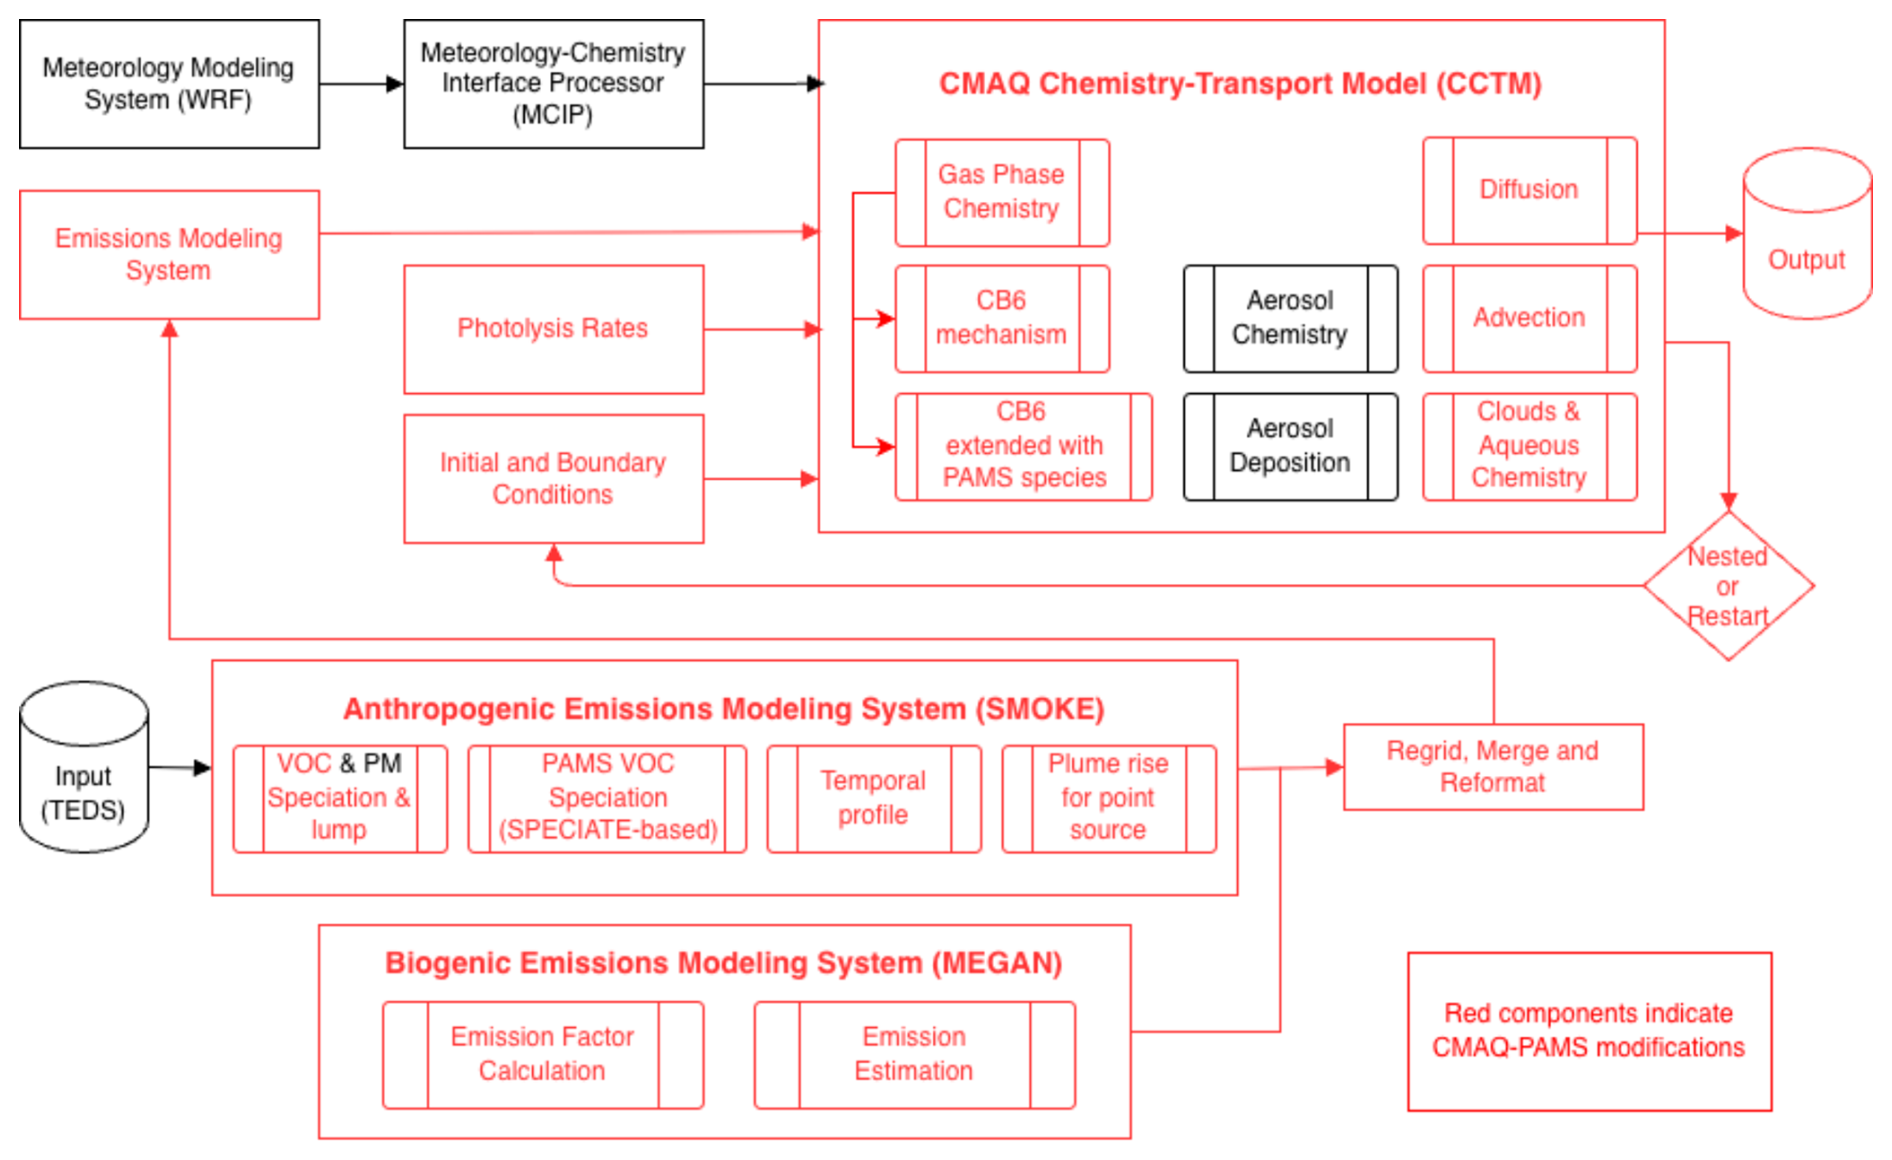
Figure 1Overview of the CMAQ-PAMS modeling system. Red components indicate modules modified or added for PAMS-speciated VOC simulation, including SPECIATE-based disaggregation of anthropogenic VOC emissions within SMOKE and the extension of the CB6 gas-phase mechanism in CMAQ to include 54 PAMS species. Black components denote standard CMAQ processes.
2.1 CMAQ-PAMS model development
2.1.1 Chemical Mechanism Implementation
Figure 1 shows the CMAQ modeling framework revised for CMAQ-PAMS (red parts). The chemical mechanism initialized for the 54 PAMS species is the Carbon Bond (CB) chemical mechanism (in the version of CB05e51 and CB6r3, under CMAQ v5.2 model structure; two versions of CB are revised for PAMS species, so-called CB05e51pams and CB6r3pams). The 54 PAMS species are found in CB05e51, i.e., ETHA (ethane), ETH (ethene), and ISOP (isoprene), and CB6r3, i.e., ETHA, ETH, ISOP, PRPA (propane), ETHY (ethyne), respectively.
The chemical reactions for the 54 PAMS species are assigned from the related lumped species (PAR, OLE, OLI, TOL, XYL, ETH, ETHA, ISOP, PRPA, ETHY, and BENZ, respectively). The PAMS species are primarily primary pollutants, and their chemical losses mainly occur through reactions with hydroxyl (OH), O3, and nitrate (NO3) radicals. The reaction rates for PAMS species can be found in the work of Chen et al. (2010), where the PAMS chemical mechanism was first developed.
The PAMS chemical mechanism is connected to the CB chemical mechanism in parallel; however, it does not contribute to ozone simulations. Instead, the PAMS species are assigned their own individual reaction constants for reactions with OH, NO3, and O3 to account for loss. This allows for comparisons with observed PAMS data.
The 54 PAMS VOC species generated during the emission preprocessing stage were incorporated into the CMAQ chemical mechanism by extending CB6. Each PAMS species was assigned to the most chemically appropriate CB6 surrogate based on structure, carbon number, and fractional groups, allowing the mechanism to track these species explicitly without altering the overall CB6 reaction family architecture. The extended mechanism enables the PAMS species to participate fully in gas-phase chemistry, transport, deposition, and diagnostic processes, providing consistency between emissions, chemistry, and model evaluation.
The full set of additional chemical reaction pathways introduced for PAMS species in the CB6r3 mechanism is provided in the Supplement (Table S2). These reactions are adapted from our previous PAMS-AQM development (Chen et al., 2010) but reformulated to be compatible with CB6 chemical structure.
2.1.2 CCTM revision
The UTIL modules in the CMAQ model are used to generate new chemical mechanisms, specifically for creating the CCTM module to simulate PAMS species. In the chemical mechanism compiler (chemmech), the PAMS species are put into the species name list (GC_cb6r3pams_ae6_aq.nml), and the additional chemical reactions are added with a new list of chemical reactions for PAMS species (mech_cb6r3pams_ae6_aq.def). These files are inputs for creating a new CCTM module to include PAMS species.
The Euler Backward Interactive (EBI) solver (create_ebi) is used for solving the new CB chemical mechanism with PAMS species. Also, the in-line photolysis option is chosen for calculating photolysis rates (inline_phot_preproc) to provide a set of molecular absorption CSQY data files consistent with the photolysis reactions in the new CB chemical mechanism with PAMS species. Finally, the new aqueous chemistry is merged with a pre-existing cloud module (acm_ae6) with updated Henry constants for the PAMS species (acm_ae6_pams). Altogether, the in-line photolysis rates and the new chemical mechanism with PAMS species are put into the MECHS module, the EBI solver is put into the gas module, and a revised aqueous chemistry is put into the cloud module.
2.1.3 Emission preprocessor for PAMS species
Anthropogenic VOC emissions from the TEDS inventory were disaggregated into 54 PAMS species using source-specific profiles from the U.S. EPA SPECIATE database. For each emission category (e.g., mobile, point, solvent, industrial processes, etc.), the corresponding SPECIATE profile was applied to redistribute mass from CB6 lumped VOC groups into their constituent PAMS species. This procedure produced a fully speciated VOC emission inventory that is compositionally consistent with the observational species measured at PAMS stations.
The emission preprocessor system for the CMAQ-PAMS modeling system (Fig. 1) followed the procedures of Sparse Matrix Operator Kernel Emissions (SMOKE) to process gas-phase and aerosol emissions. For CMAQ-PAMS modeling, there are mainly two code changes needed for adding PAMS species emissions: one is to add the 54 PAMS species array into the current CB emission array, and the other is to add the PAMS species speciation code into the current CB speciation profile for lumped VOC species. The original emission arrays for CB05e51 and CB6r3 included 46 and 48 species (including aerosols), respectively; now, after adding the 54 PAMS species, they include up to 100 and 102 species.
The VOC speciation data (GSPRO/GSCNV) are generated to provide VOC speciation profiles for the user-defined chemical mechanism for executing the emission preprocessor system (SMOKE). Before the VOC individual organics are lumped into lumping groups, the SPECIATE Tool (now moved to S2S-Tool) provides the linkages between separate organic gas and their speciation rates for each emission source (similar for aerosols and mercury). After the VOC speciation data is set, the emission preprocessor system follows the speciation profiles to divide the total VOC (NMHC) emission amounts into lumped groups. For CMAQ-PAMS, the VOC speciation data are updated in CB speciation profiles with PAMS source speciation details (gspro.cb05.pams and gspro.cb06.pams). While processing the emission inventory from the total to the gridded hourly amount, these additional PAMS speciation profiles (originally not in SMOKE therefore need to be summarized from the VOC speciation database) are used to subtract PAMS species emissions and put into the PAMS species emission array in the emission preprocessor system. After that, the PAMS species emissions abide by the consistent procedures of the emission preprocessor system to assign the temporal profiles, calculate plume rise for point sources, put geolocated emissions into the grid, and merge/reformate anthropogenic and biogenic emissions together. The biogenic emissions for the CMAQ-PAMS modeling system are generated by the Model of Emissions of Gases and Aerosols from Nature (MEGAN) modeling system (Guenther et al., 2006, 2012). Considering isoprene as the only species whose biogenic emission dominates the total isoprene emissions (anthropogenic + biogenic emissions), as isoprene (ISOP) has already been separated for CB. As a result, no code revision is needed for the CMAQ-PAMS on biogenic emissions.
The final lump-normalized speciation fractions for all PAMS specie, derived from domain-wide anthropogenic emissions, are provided in the Supplement (Table S3).
2.1.4 Top-down adjustment of PAMS species emissions
It is important to clarify that this procedure does not infer emission fluxes from ambient VOC concentrations. The observed-to-simulated ratios are used solely as multiplicative correction factors applied to the existing TEDS gridded emissions. Therefore, the spatial allocation of emissions follows the original bottom-up inventory, and only the magnitudes of species-level emissions are adjusted. No inverse modeling or redistribution of emissions across grid cells is involved in this process.
To reduce biases associated with VOC speciation profiles and to better match observed PAMS concentrations, a top-down adjustment was applied to anthropogenic PAMS emissions following the approach of Chen et al. (2014a). For each PAMS species i and for each PAMS station s, an hourly adjustment factor was calculated as:
where OBSi,s(t) and SIMi,s(t) denote the observed and simulated mixing ratios at time t.
To obtain a domain-wide correction factor, the station-based values were averaged across all available PAMS sites, yielding:
This hourly factor was then applied uniformly to all grid cells for the corresponding species:
Importantly, this correction does not conserve total VOC mass. Any positive or negative adjustment to PAMS species directly increases or decrease the total VOC inventory. No compensatory redistribution to non-PAMS VOC species was applied. As a result, the total VOC emissions after adjustment differ from the original inventory, consistent with Chen et al. (2014a), in which species-level corrections increased total VOC emissions by 26.7 % across Taiwan.
2.2 Model simulation setup
2.2.1 Model configuration
The WRF meteorological model version 3.8 (Skamarock et al., 2008) and CMAQ-PAMS model (based on CMAQ version 5.2) (Byun and Ching, 1999; Byun and Schere, 2006) were used in this study to conduct meteorological and air quality modeling. The physical and chemical configurations of the WRF-CMAQ system are based on the real-time air quality forecasting (AQF) system in Taiwan (Cheng et al., 2021), with an offline approach, two-level nesting domains from the East Asia coarse domain (15 km, D1) to the nested domain over Taiwan with a 3 km spatial resolution (D2), with 30 non-uniform sigma layers from the surface (a thickness of approximately 20 m) to the top of the atmosphere. Anthropogenic emissions for D1 are from the 2010 Model Inter-Comparison Study for Asia (MICS-Asia) emission inventory with the projections of China's anthropogenic emissions to 2017 (Zheng et al., 2018; Li et al., 2017). For the Taiwan domain (D2), anthropogenic emissions are taken from the TEDS version 11.0, whose baseline year is 2019, representing the most recent nationally reviewed emission inventory available for Taiwan. Biogenic emissions are estimated by MEGAN version 2.0.4 (Guenther et al., 2012).
Assuming the transboundary influence for the PAMS species is limited, the programs used for preparing chemical Initial CONditions (ICON) and Boundary CONditions (BCON), BCs for PAMS species are set as zero. Among the 54 PAMS species, alkanes such as ethane, propane, and butanes have much longer atmospheric lifetimes than the others and are therefore detectable during long-range transport (LRT) events (Chang et al., 2022). However, even these relatively long-lived alkanes exhibit only minimal mixing ratios in LRT air masses compared with local ambient levels, owing to extensive dilution through mixing with clean marine air. This assumption applies only to PAMS species themselves and does not affect discussions related to ozone or secondary products in later sections.
2.2.2 Case study background and model evaluations for critical pollutants
Since the development of the CMAQ-PAMS model, multiple case studies have been conducted to evaluate its performance under different synoptic conditions. Initial simulations were tested for events in November 2019 and September 2020 to verify the model's baseline stability and emission configurations under distinct meteorological scenarios. However, the primary analysis in this study focuses on the ozone pollution episode from 27 September to 3 October 2021 (Fig. S1 in the Supplement), which provides a representative case with comprehensive data coverage and suitable photochemical conditions for model evaluation.
The 2021 episode was influenced by two tropical systems: Typhoon Mindulle (No. 16) and Tropical Storm Kompasu (No. 18). Although neither storm made direct landfall in Taiwan, their movement created a stable high-pressure system over the island. This synoptic pattern resulted in low wind speeds and suppressed atmospheric mixing, which promoted the accumulation of ozone precursors. Despite occurring in early autumn, a period typically less favorable for photochemical activity, the lowered mixing layer heights effectively enhanced ozone production through increased precursor concentrations. High ozone levels were observed in central and southern Taiwan throughout the period, while northern Taiwan experienced elevated O3 between 29 September and 10 October (see Fig. S2).
Given the meteorological stagnation, regional representativeness, and elevated ozone levels, the 2021 case was selected for detailed model evaluation. The model's performance across all Taiwan Air Quality Monitoring Network (TAQMN) stations in western Taiwan is summarized in Table S4. Time series comparisons of wind fields and key pollutants (NOx, VOCs, and O3) at selected stations near PAMS sites are provided in Fig. S3. Statistical definitions and evaluation metrics are described in the Supplement.
2.2.3 Computing resources
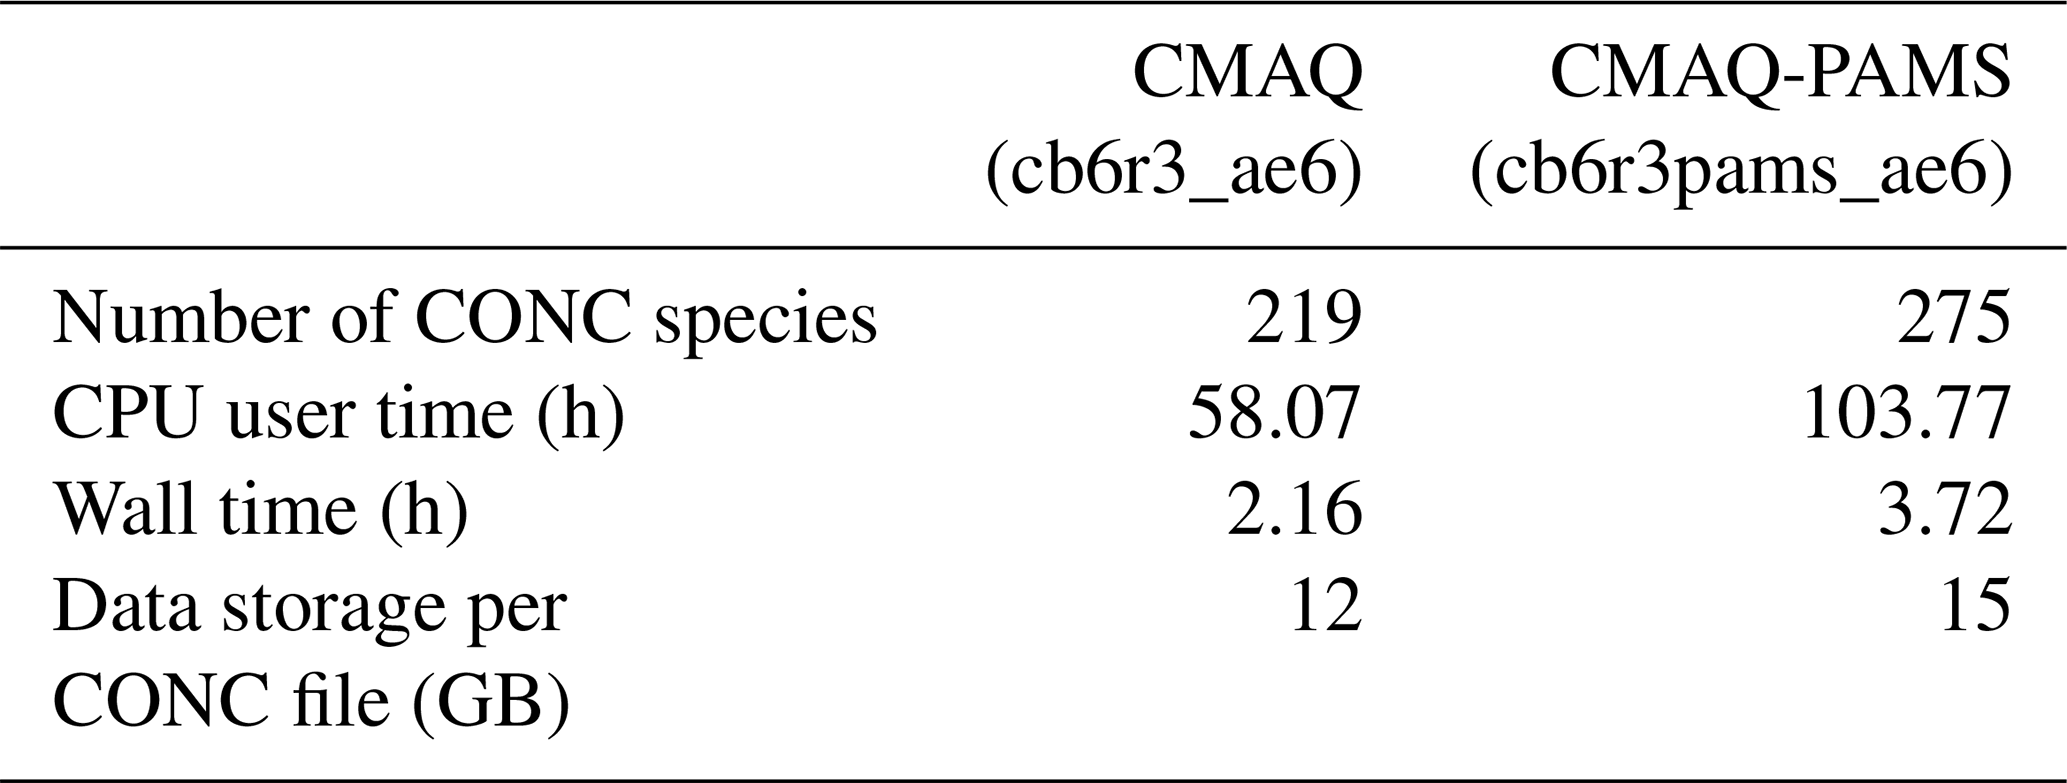
Because CMAQ-PAMS introduces 54 additional VOC species and substantially increases the size of the gas-phase chemical system, it is necessary to quantify the computational overhead relative to the original CB6 mechanism. This comparison allows model users and operational centers to assess the feasibility and resource requirements of adopting the expanded mechanism. The computing resources for executing CMAQ-PAMS were evaluated using a representative five-day run. The parallel computing environment was CentOS Linux version 7.4.1708 with Intel® Xeon® Silver 4110 CPU @ 2.10 GHz (8-Core), 28 nodes, and 64 GB RAM, with 56 nodes utilized for this case. The tested software environment included Intel compiler 19.0.1.144, ioapi 3.1, netCDF 4.1.3, and MPI 2.1.2.
Details of computing resources for the five-day scenario using CMAQ and CMAQ-PAMS are summarized in Table 1. CMAQ-PAMS outputs 275 species, including 54 individual PAMS VOC species. For direct comparison, the default CB05 VOC species (e.g., ethane, ethylene, and isoprene, represented as ETHA, ETH, and ISOP) were retained under the same nomenclature in both mechanisms. The CMAQ-PAMS simulation required approximately 1.8 times the CPU user time and 1.7 times the wall time compared with the standard CMAQ run. The additional 54 PAMS species increased the CONC file size by ∼ 3 GB relative to CMAQ.
Table 1Computing resource comparison between CMAQ and CMAQ-PAMS for a five-day scenario.
2.3 PAMS network in Taiwan
The PAMS operation is based on a model first introduced in the United States in 1990 as required by the Clean Air Act (https://www.epa.gov/laws-regulations/summary-clean-air-act, last access: 14 February 2026). These stations employed auto-GC systems as the core equipment to perform hourly measurements of 56 individual compounds with carbon numbers from C2–C12 in the U.S. The compound list was shortened to 54 species by giving up the last two C12 species of undecane and dodecane in Taiwan due to the severe wall effect and residual problem in the analysis. For each hourly measurement, a 400 mL aliquot of the air sample is drawn into the auto-GC for enrichment within an electronically cooled sorbent trap. The trap is then rapidly heated to desorb the VOC analytes, which are back-flushed by a stream of high-purity helium used as the carrier gas. The analytes are directed into two capillary columns with different stationary phases (PLOT and BP-1) to ensure optimal separation of the species. Two flame ionization detectors (FID) are employed for the two columns (Wang et al., 2004).
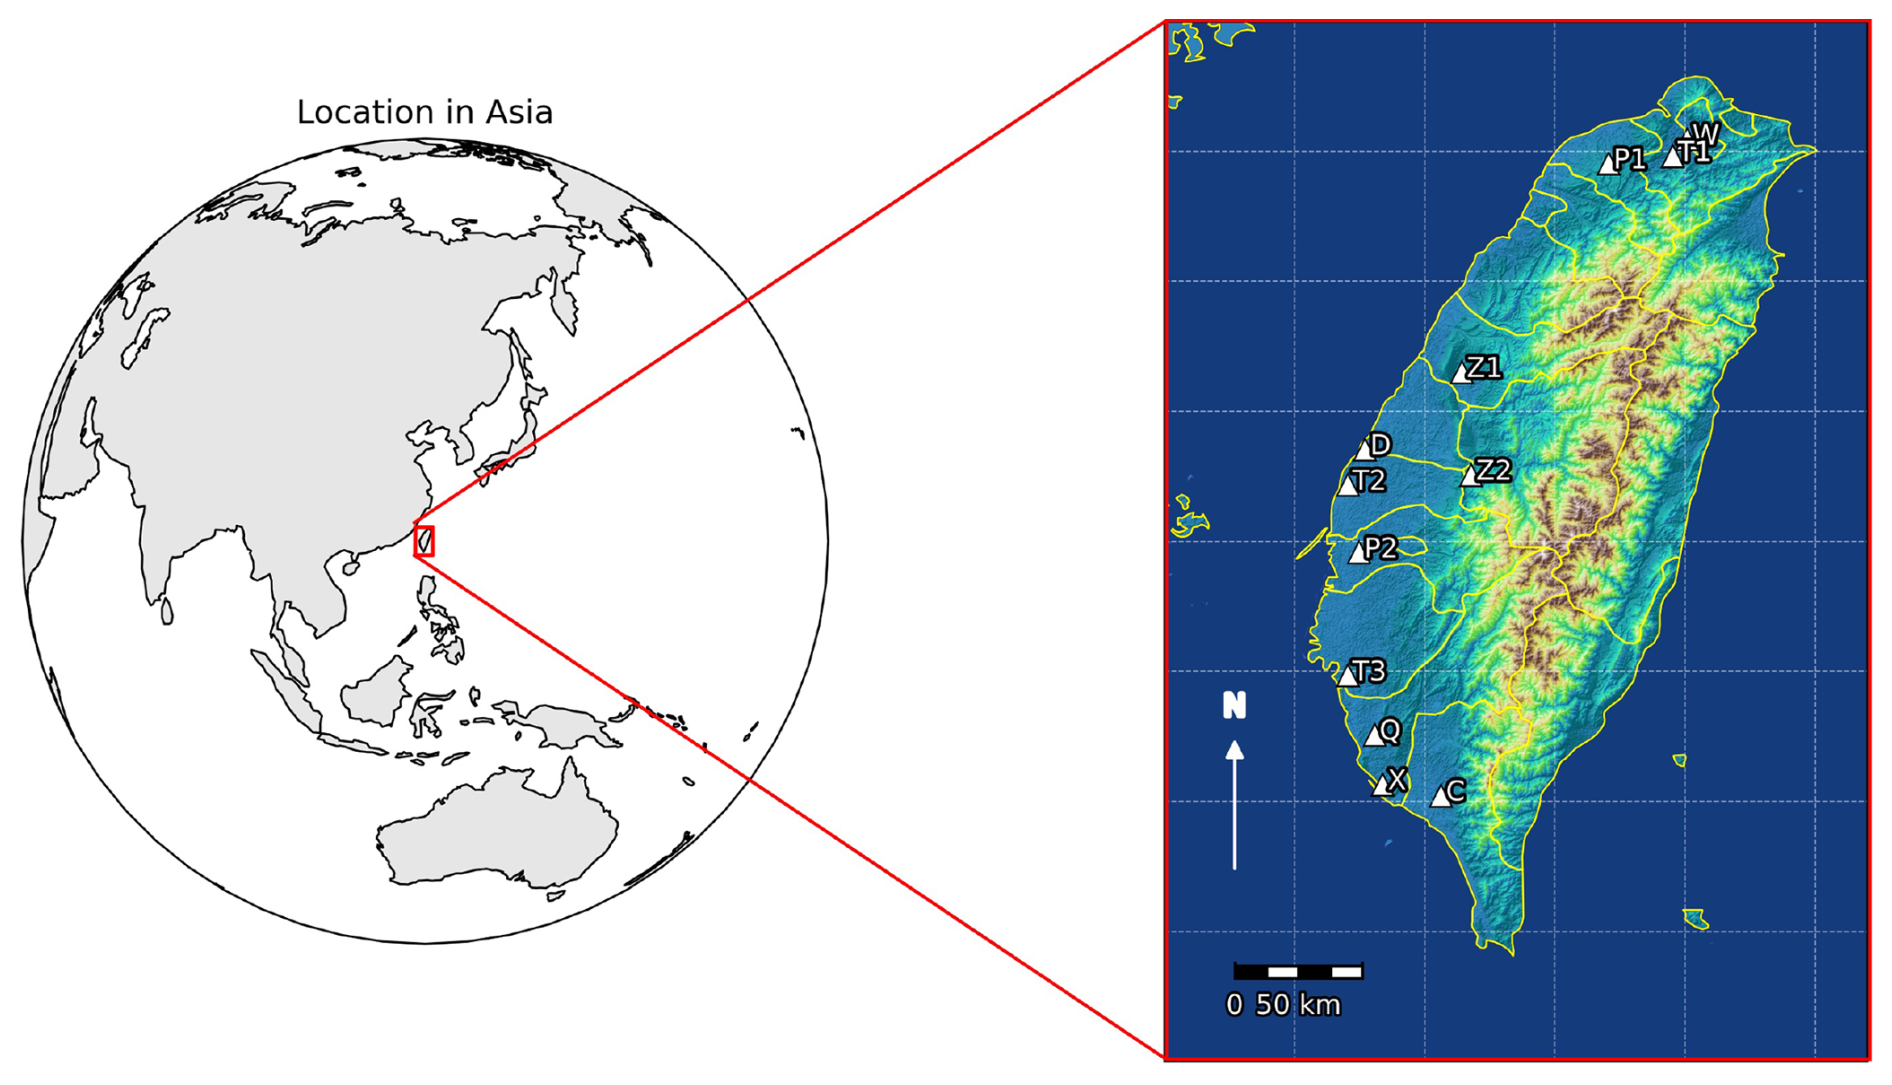
Figure 2Geolocations of 12 PAMS stations in Taiwan. Shaded areas indicate terrain heights (Indigo denotes the ocean. On land, elevation increases from green to yellow to brown with hill-shaded relief).
In 2001, MOENV of Taiwan adopted the U.S. PAMS program, which has been in operation ever since. Over the years, the program has expanded to include 15 stations located across the western part of the island, where more than 95 % of the population resides. This comprehensive dataset, characterized by a lengthy monitoring period and a significant number of stations over a relatively small geographical domain, provides valuable insights into identifying pollution sources and offers direct evidence of the photochemical processes that lead to the formation of O3. Each PAMS station is strategically placed next to a TAQMN station to provide hourly observations of meteorological conditions and criteria air pollutants.
There were 12 PAMS stations employed for the September 2021 case study based on data completeness (Fig. 2): Wanhua (W-site), Tucheng (T1-site), Pingzhen (P1-site), Zhongming (Z1-site), Zhushan (Z2-site), Taixi (T2-site), Puzih (P2-site), Tainan (T3-site), Qiaotou (Q-site), Xiangnag (X-site), Chaozhou (C-site), and Dacheng (D-site). Observations of individual VOC species from 12 PAMS stations across Taiwan will be directly compared with the CMAQ-PAMS model simulation results.
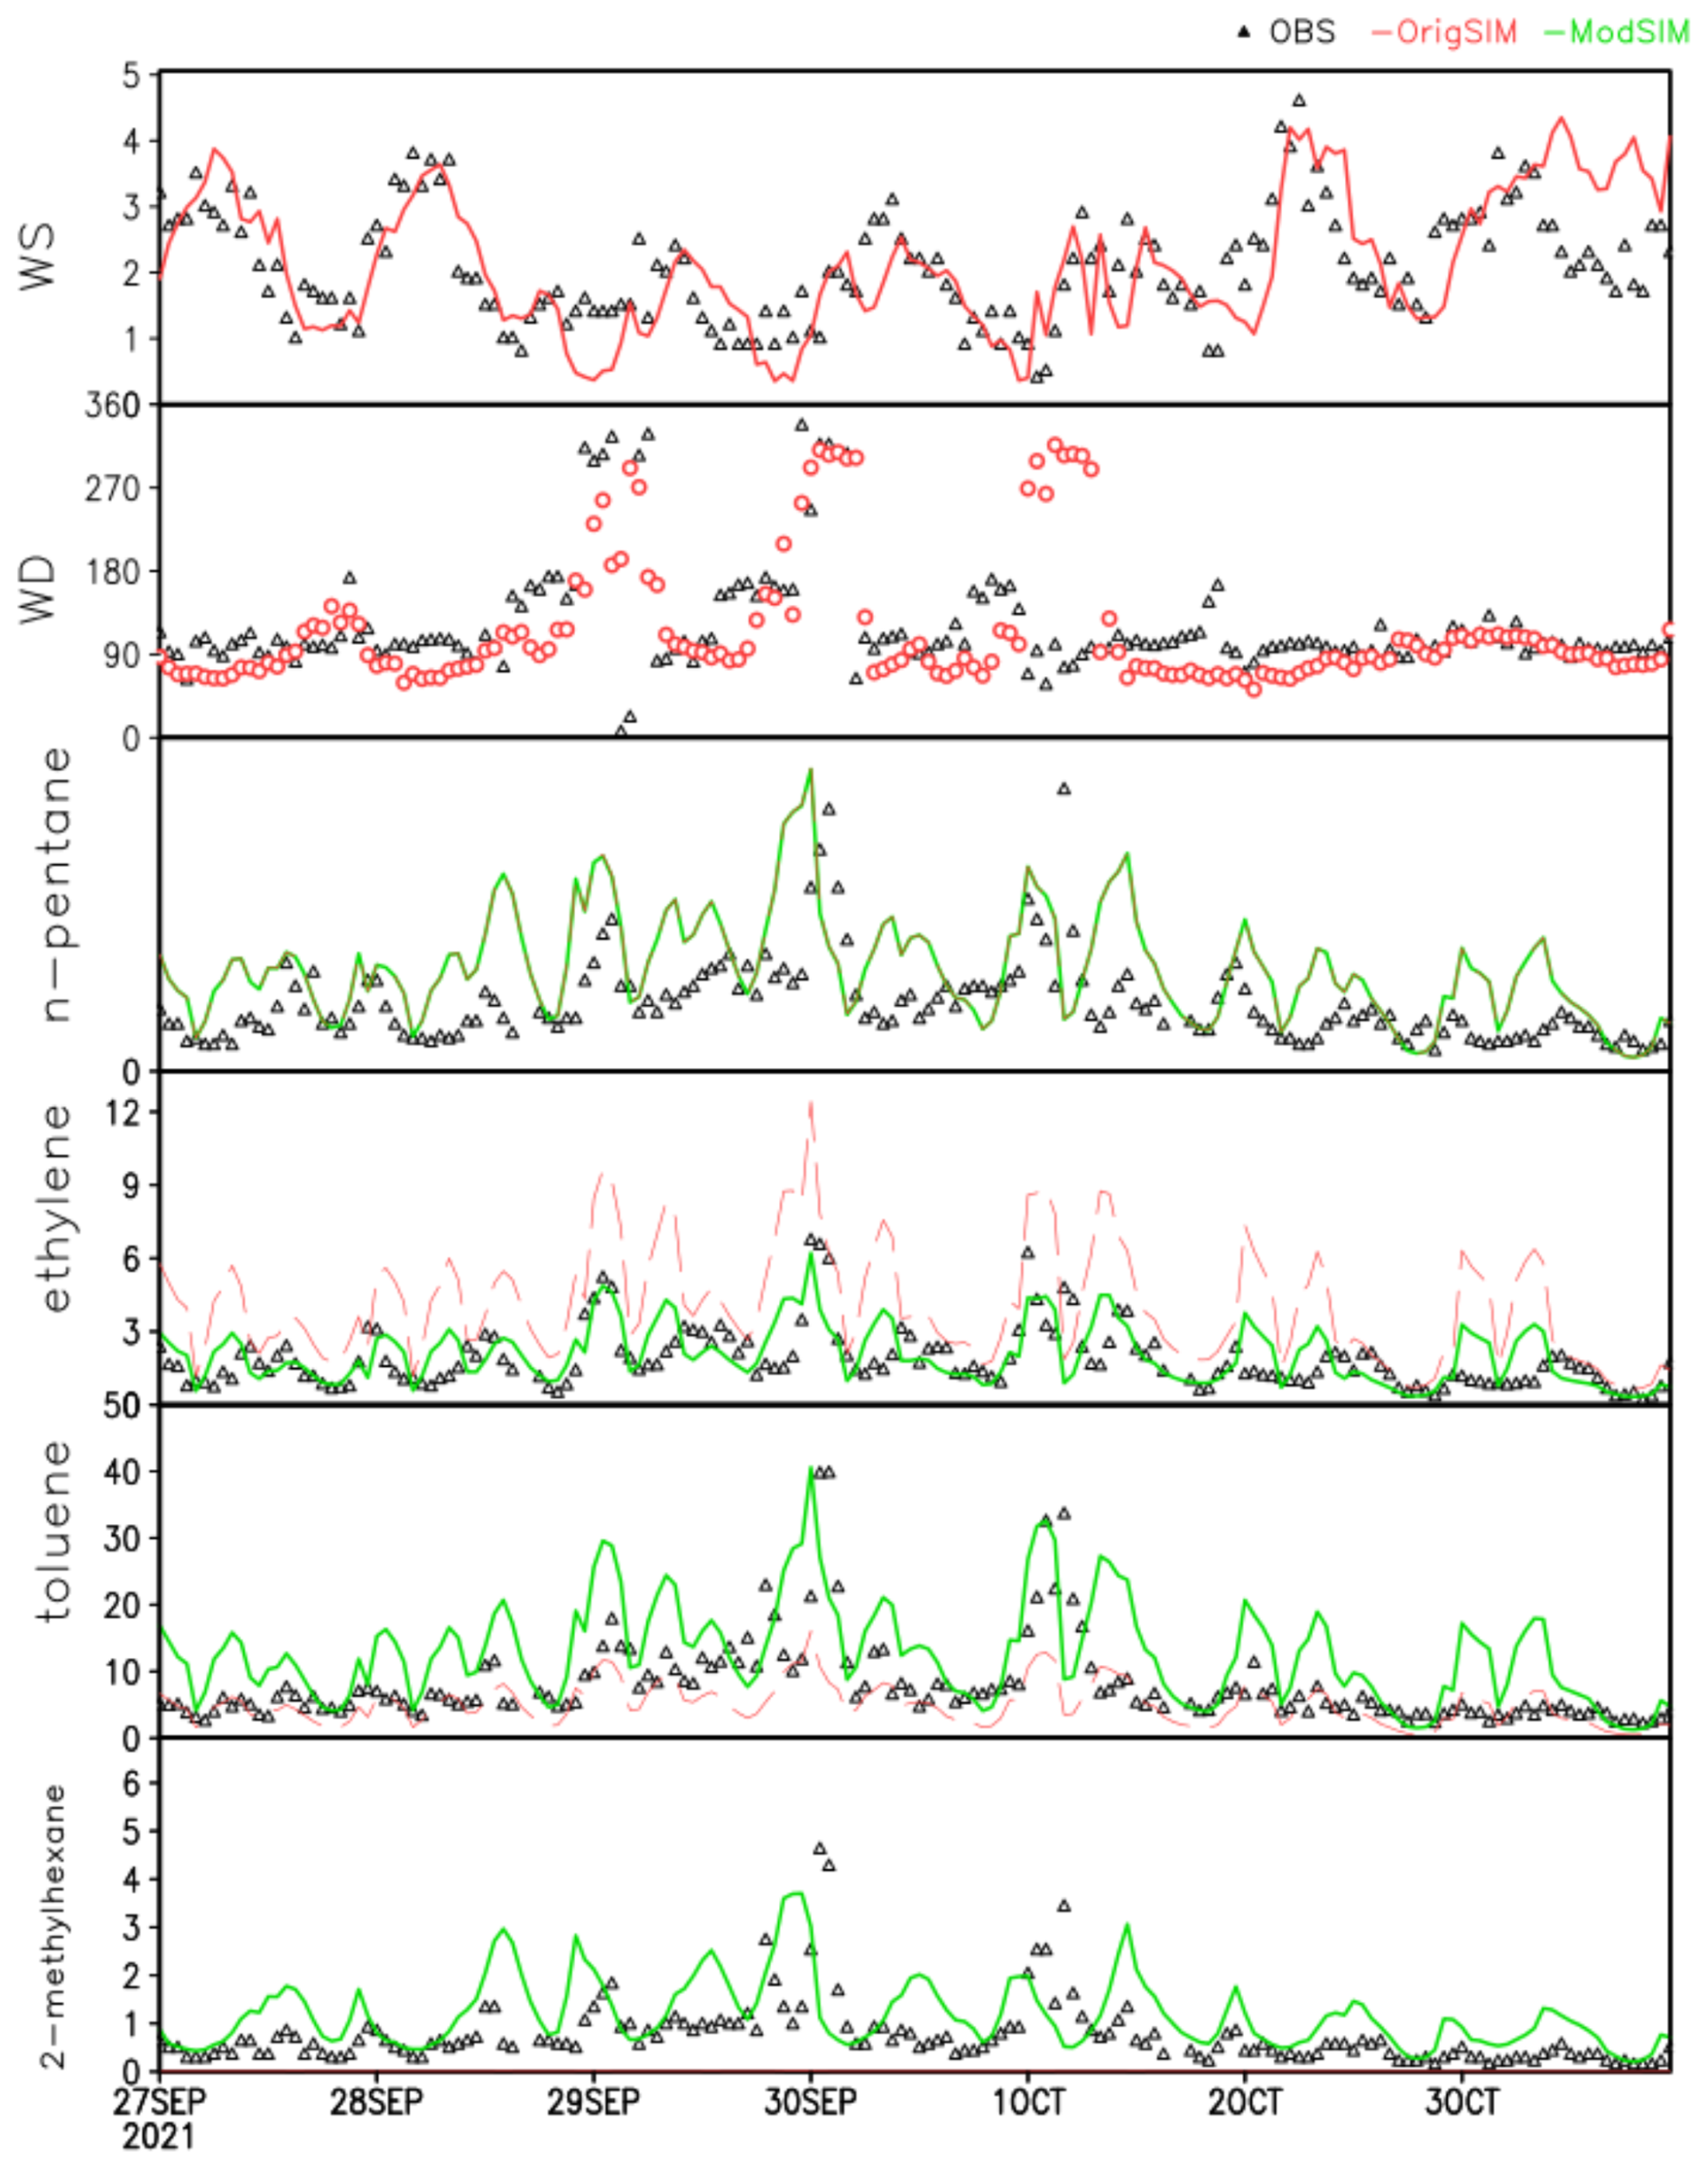
Figure 3Time series of wind fields and selected PAMS species simulations with observations at W-site (northern Taiwan). The black triangles are PAMS observations, and the red and green solid lines are PAMS simulations before and after the PAMS species emission adjustment – time labels at 00:00 CST. Units are ppbC.
3.1 Comparison of PAMS modeling results with observations
3.1.1 Individual species
Figure 3 presents the time series of the observations vs. simulation results at the W-site in northern Taiwan from 27 September to 3 October 2021. The W-site is shown as a representative example because it exhibits all four characteristic modeling behaviors observed across the PAMS stations. Full results for all 12 stations, demonstrating similar patterns, are provided in Fig. S4. The parameters evaluated include the mixing ratios of the summation and selected PAMS VOCs, measured in ppbC (normalized to methane in carbon number), such as TPAMS, n-pentane, ethylene, toluene, and 2-methylhexane.
When analyzing the PAMS species simulations, our first criterion is to evaluate both the simulated and observed wind fields to confirm that the atmospheric circulation patterns are true to the environment. Notably, model simulations clearly captured the significant change in wind direction for any simulation period, as shown in Fig. 3 for a case study from 29 September to 1 October. The diurnal variations of the PAMS species illustrate the effectiveness of the physical and chemical processes estimated through CMAQ-PAMS modeling. However, the discrepancies between the simulations of PAMS species and actual observations highlight the inaccuracy in the emission estimates for these species, despite showing similar diurnal patterns (Fig. 3). Conventional lumped chemical mechanisms inherently restrict VOC evaluation because only a few explicit model species can be directly compared with observations. As a result, most prior modeling studies validate O3 and NOx but cannot systematically assess VOC model performance at the species level. CMAQ-PAMS overcomes this limitation by enabling direct, species-resolved comparisons for all 54 PAMS VOCs, allowing emission biases, chemical misrepresentation, and inventory deficiencies to be diagnosed with a level of detail not achievable using lumped surrogates. This represents a fundamental advancement in VOC model evaluation for Taiwan. Some species are either underestimated or overestimated, with some even reporting zero emissions. This discrepancy was noted when the PAMS species modeling technique was first introduced (Chen et al., 2010). The primary cause of this inconsistency stems from the mismatch in using U.S. VOC speciation profiles to represent the local organic sources on the island.
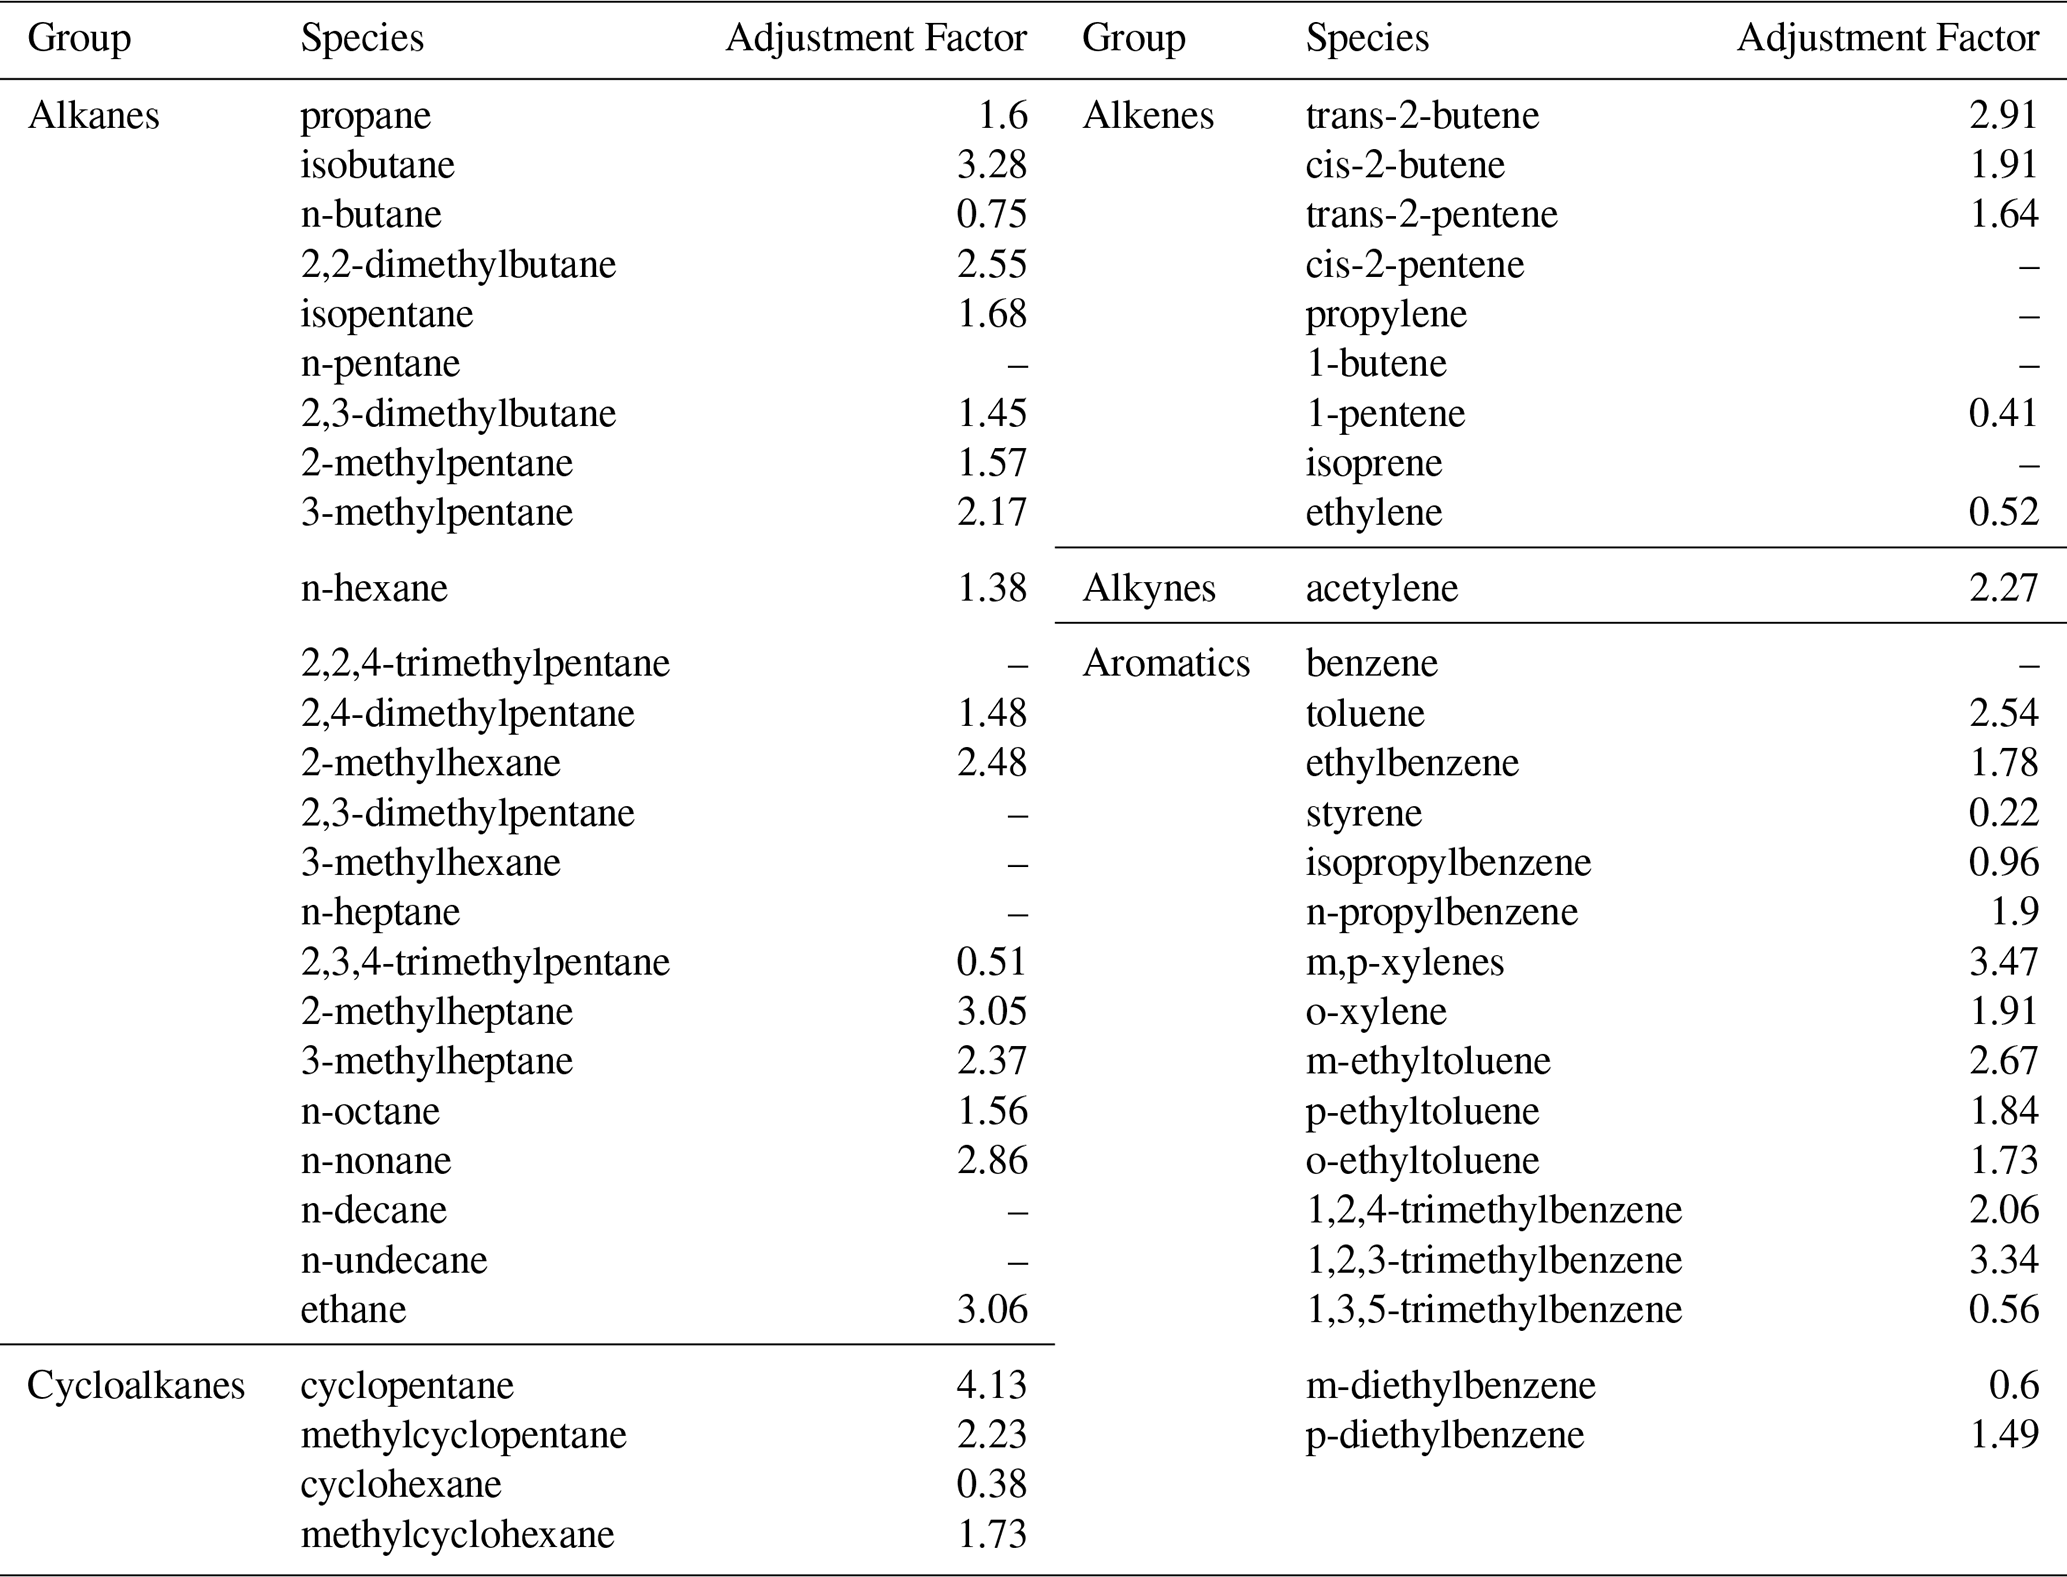
While improving emission inventories and speciation profiles could theoretically help close the gap, doing so requires tremendous effort with uncertain outcomes. Instead, we adopted a reverse modeling, or top-down, approach (Chen et al., 2014a) to calibrate PAMS species emissions using observations from 12 PAMS monitoring sites as the “ground truth”. After adjustment, the simulated mixing ratios (ModSIM) became more consistent with the observations, as indicated by stronger correlations between simulated and observed PAMS species. For example, during the case study periods in the autumn of 2021, the median predicted-to-observed (P O) ratio improved from 0.66 in OrigSIM to 1.05 in ModSIM. Figure 3 exemplifies four species for four types of simulation outcomes: comparable, overestimated, underestimated, and zero adjustment. For n-pentane, the simulated and observed results are in agreement; thus, no adjustments are needed. In the case of ethylene, OrigSIM (shown in red) significantly overestimates its mixing ratios, with numerous peaks not reflected in the observations. ModSIM (shown in green) effectively reduces these overestimations, leading to a much-improved agreement with observations throughout the period. In the case of toluene, OrigSIM substantially underestimates its concentrations, particularly in the middle portion of the time series. ModSIM demonstrates a marked improvement, closely matching observed values. In the case of 2-methylhexane, OrigSIM produces zero concentrations throughout the entire period due to the absence of emissions. ModSIM, on the other hand, significantly enhances the simulation and reasonably captures the observed mixing ratios. Some species, such as cyclohexane, 1-pentene, and styrene, have emissions that are excessively high and require significant adjustments to align with observed levels, as shown in Table 2. Among the 54 PAMS species, 11 showed simulated concentrations comparable to observations, eight overestimated, 31 underestimated, and four species – 2-methylhexane, p-ethyltoluene, o-ethyltoluene, and p-diethylbenzene – displayed zero simulated values. Similar patterns were observed in other case studies conducted in 2019 and 2020 (results not presented for brevity). Overall, ModSIM represents a substantial improvement over OrigSIM in simulating PAMS species in ambient air. As a result, given the current limitations in updating the VOC speciation profiles to align with domestic emission conditions, utilizing PAMS hourly observations across the island offers an alternative to enhance emission estimations significantly. By employing the top-down approach, these observations can effectively refine and calibrate the PAMS emission amounts, offering a more realistic representation of VOC emissions despite the lack of suitable updates to the speciation profiles. Von Schneidemesser et al. (2023) demonstrated significant discrepancies between emission inventories and observed non-methane VOC levels, particularly due to outdated speciation profiles and missing oxygenated VOCs (OVOCs). The current study further supports these findings by demonstrating that traditional Source Classification Code (SCC)-based speciation does not adequately capture urban VOC profiles. By incorporating PAMS-based speciation, CMAQ-PAMS significantly improves model performance and aligns better with real-world abundance.
Table 2Averaged adjustment factors applied to PAMS species emissions in CMAQ-PAMS.
3.1.2 Summation of PAMS species (i.e., TPAMS)
Previously, the absence of PAMS observations and CMAQ-PAMS simulations made it difficult to simulate and validate individual VOC simulations directly. As mentioned earlier, the lumping technique prevents modeling from being directly compared with speciated VOC observations. Only a few isolated species, such as ethane, ethylene, and isoprene, could be directly matched with PAMS data. Moreover, even the total lumped VOC concentrations did not align well with the observed total VOC concentrations (Chen et al., 2015). The development of the CMAQ-PAMS model now allows for direct validation of both speciated VOC simulations and total PAMS (TPAMS) concentrations by summing up the 54 PAMS species. It is worth noting that the TAQMN network also monitors total ambient VOCs using a non-methane hydrocarbon (NMHC) analyzer, which can be used to validate total VOC (TVOC) simulations. However, this instrument, equipped with a flame ionization detector, is more sensitive to straight-chain hydrocarbons than to oxygenated hydrocarbons. As a result, it may theoretically underestimate total VOC concentrations to some extent. In Fig. 3a, the TPAMS is expected to be slightly lower than the TVOC values observed by TAQMN, and certainly lower than the true ambient TVOC, since only 54 major NMHCs are detected, rather than the full spectrum of ambient VOCs (Chen et al., 2014a). Figure 3 presents a time series comparison of observed and simulated TPAMS at W-site from 27 September to 9 October 2021. The observed values (OBS) are compared with two simulation sets: the original simulation (OrigSIM, shown in red) and the adjusted simulation (ModSIM, shown in green). Overall, the modeled TPAMS diurnal patterns align well with observed variations, though the model fails to capture some extreme values. This discrepancy arises because PAMS species emissions in the emission preprocessor follow predefined temporal cycles (e.g., monthly, weekly, and daily), whereas real-world emissions can exhibit irregular fluctuations. The model effectively simulates the evolution of organic species under typical atmospheric conditions, but is unsuitable for accounting for unusual emission events. Despite these limitations, ModSIM overall matches the observed averages and demonstrates a significant improvement over OrigSIM. This improved performance is consistent across all 12 monitoring stations, successfully correcting the over- and underestimations observed in OrigSIM (Fig. S4). The limited improvement in correlation (R) between the original and modified simulations and the observations can be attributed to the type of adjustments applied in the modified simulation. When the PAMS emissions were updated over time, no changes were made to the temporal cycles of the individual species. These cycles are crucial for determining the temporal variability of simulated concentrations and hence their correlation with observations. Therefore, even though the emission magnitudes were correct, the lack of proper adjustment in the emission temporal characteristics for individual species limits the model's ability to capture the observed temporal patterns. This led to only marginal improvements in the correlation (R) between the simulations and the observations.
While the top-down approach of PAMS species emission modification can successfully improve the model simulation results to represent the evolution of the observed values better, one still needs to roll back to consider the possible causes of this misrepresentation. Since the VOC speciation processes are based on U.S. VOC speciation profiling, the mismatch of the VOC profiles for the sources will lead to biased speciated VOC emission amounts. As an example, the Supplement (Fig. S5) illustrates uncertainties arising from erroneous VOC speciation profiling, using household emissions in Taiwan as a case study.
Overall, the island-wide PAMS dataset, featuring hourly resolution and extensive spatial coverage, serves as a reliable ground truth, enhancing the robustness of model evaluations in both spatial and temporal representativeness.
Our previous development of the PAMS-AQM system, an Eulerian grid-based air quality model derived from the RADM2 framework, demonstrated the scientific value of simulating speciated VOCs. However, PAMS-AQM was not designed as a community-supported CTM and lacked the modular emissions processing, CB6 chemistry integration, and diagnostic capabilities of CMAQ. Consequently, its applicability for regional ozone assessment and regulatory analyses was limited.
The present study built on this earlier effort by embedding full PAMS-speciated VOC representation directly into CMAQ for the first time. This integration leverages CMAQ's mainstream Eulerian transport, chemical mechanism, and pre/post-processing ecosystem, enabling species-level VOC evaluation in a fully dynamic regional framework. This capability has not previously been available in Taiwan's CTM applications.
The PAMS-adjusted VOC emissions described in Sect. 3.1 were used as the baseline emission input for all subsequent O3 and precursor analyses (Sect. 3.3–3.5). Thus, all reported O3 results reflect the influence of the corrected PAMS emission speciation.
3.2 Dominant PAMS species and their distributions across the island
While both NOx and VOCs are precursors to the O3 formation, NOx consists only of NO and NO2 and thus is not discriminative between sources. Conversely, VOCs include numerous organics and are different in composition between sources; therefore, each source type may have a composition profile unique to itself. Due to source characteristics and photochemical reactivities of species, the relative abundance among species changes with time and space. After the PAMS emission has been modified, Table 3 provides a comparative list of the top 20 individual VOC emissions from anthropogenic sources in Taiwan, including point, line, and area sources. The VOCs are ranked according to their emission quantities from each source type, highlighting the significant contributors to overall VOC emissions. The top 10 VOC species, such as toluene, xylenes, propylene, ethylene, formaldehyde, 1,3-butadiene, etc., dominate point sources to contribute 58 % to total VOC emissions.
The comparison of VOC emissions from point, line, and area sources reveals that toluene is the largest individual VOC emitted across all three source types. When modifying the PAMS species emissions, adjustments were primarily based on a linear relationship between the modeled values and observed data at each grid point, while the total VOC amount is not conserved; adjusting PAMS species will modify the total VOC mass in the inventory.
Table 3List of top 20 VOC emissions from point, line, and area sources.
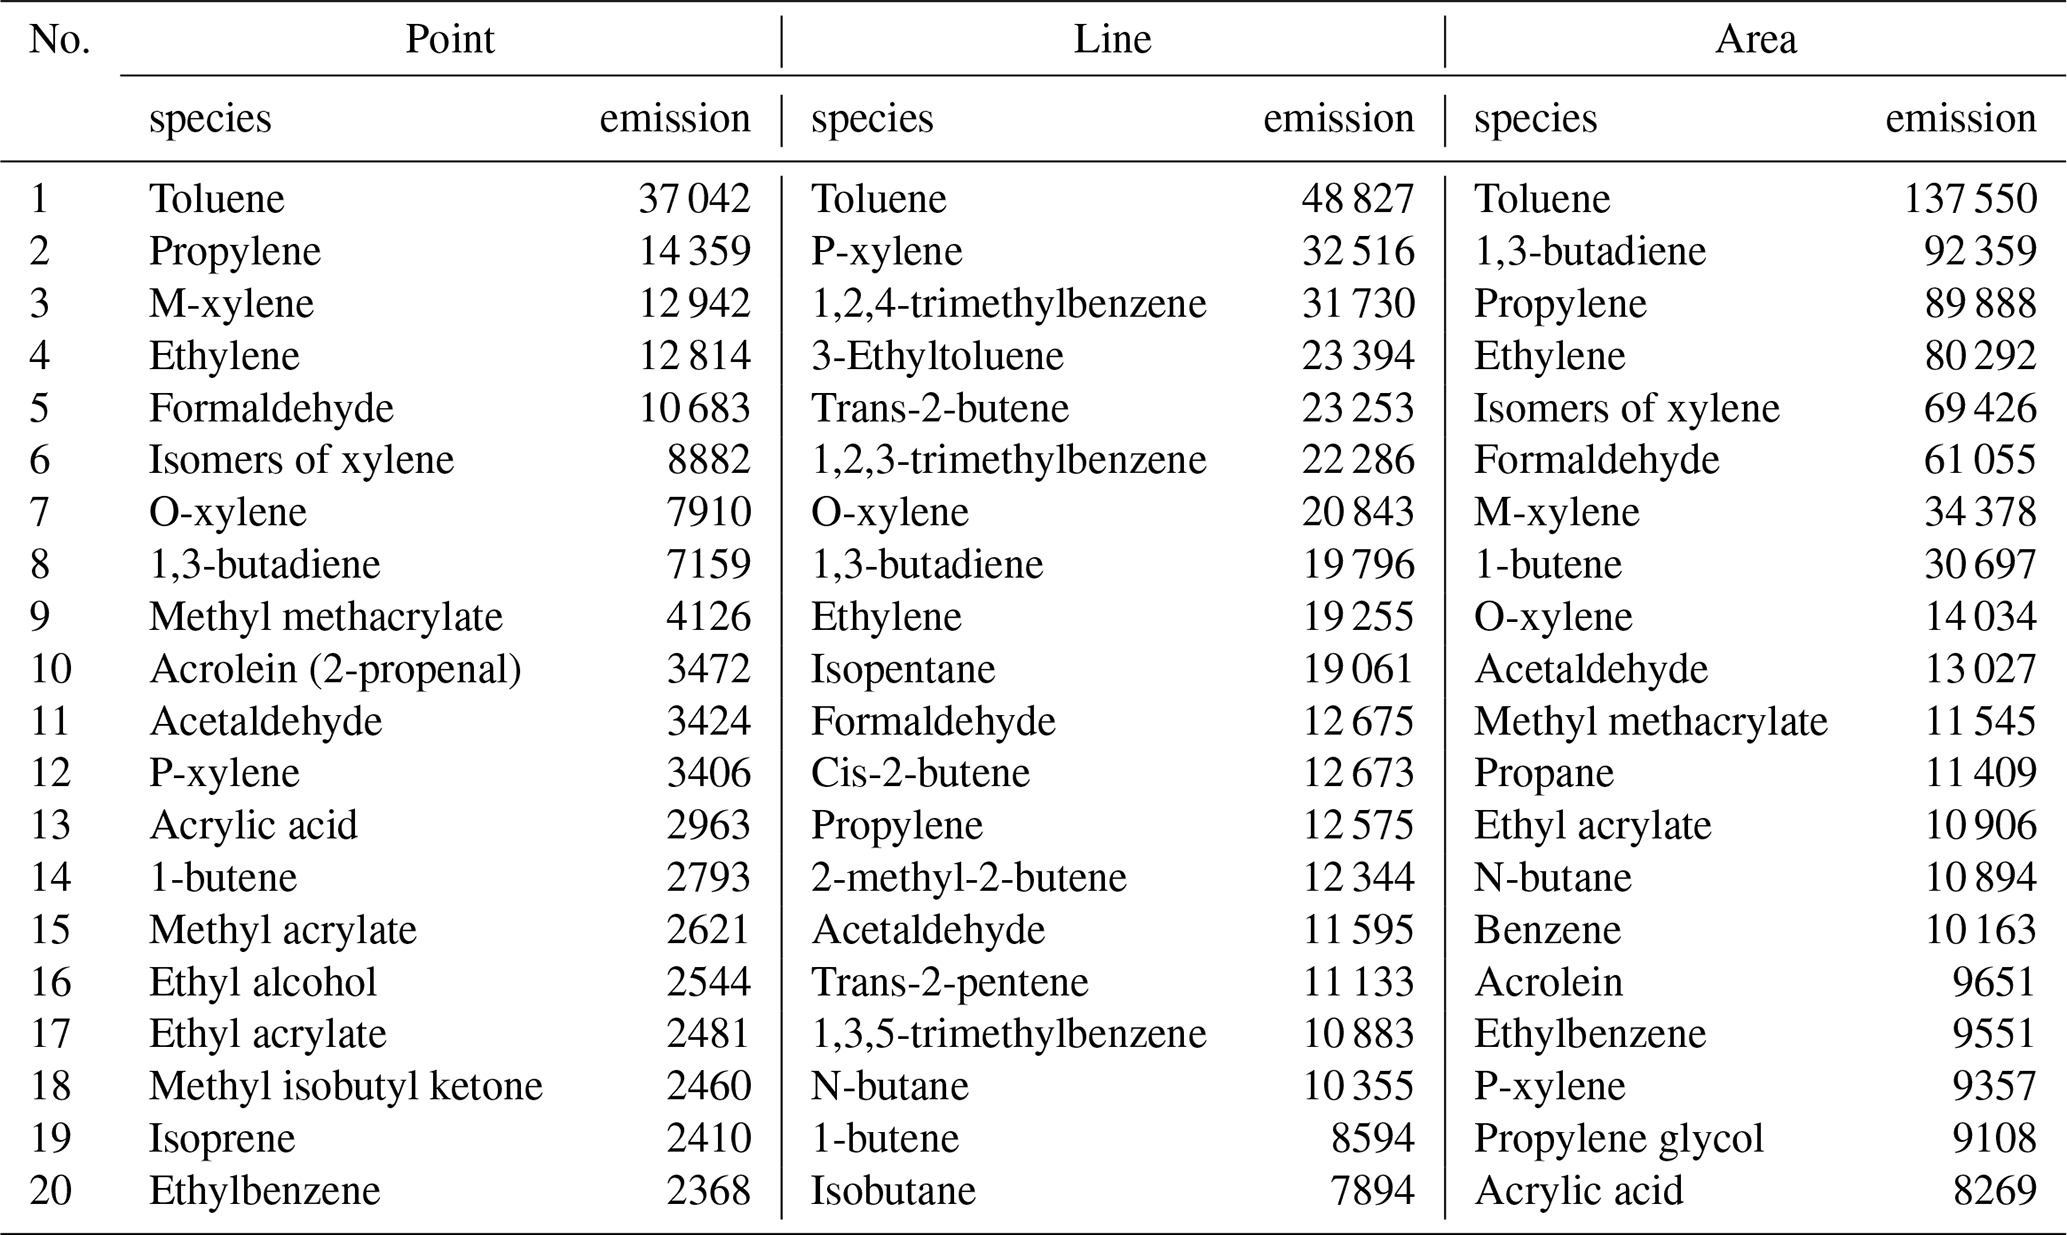
The units of emissions are t yr−1.
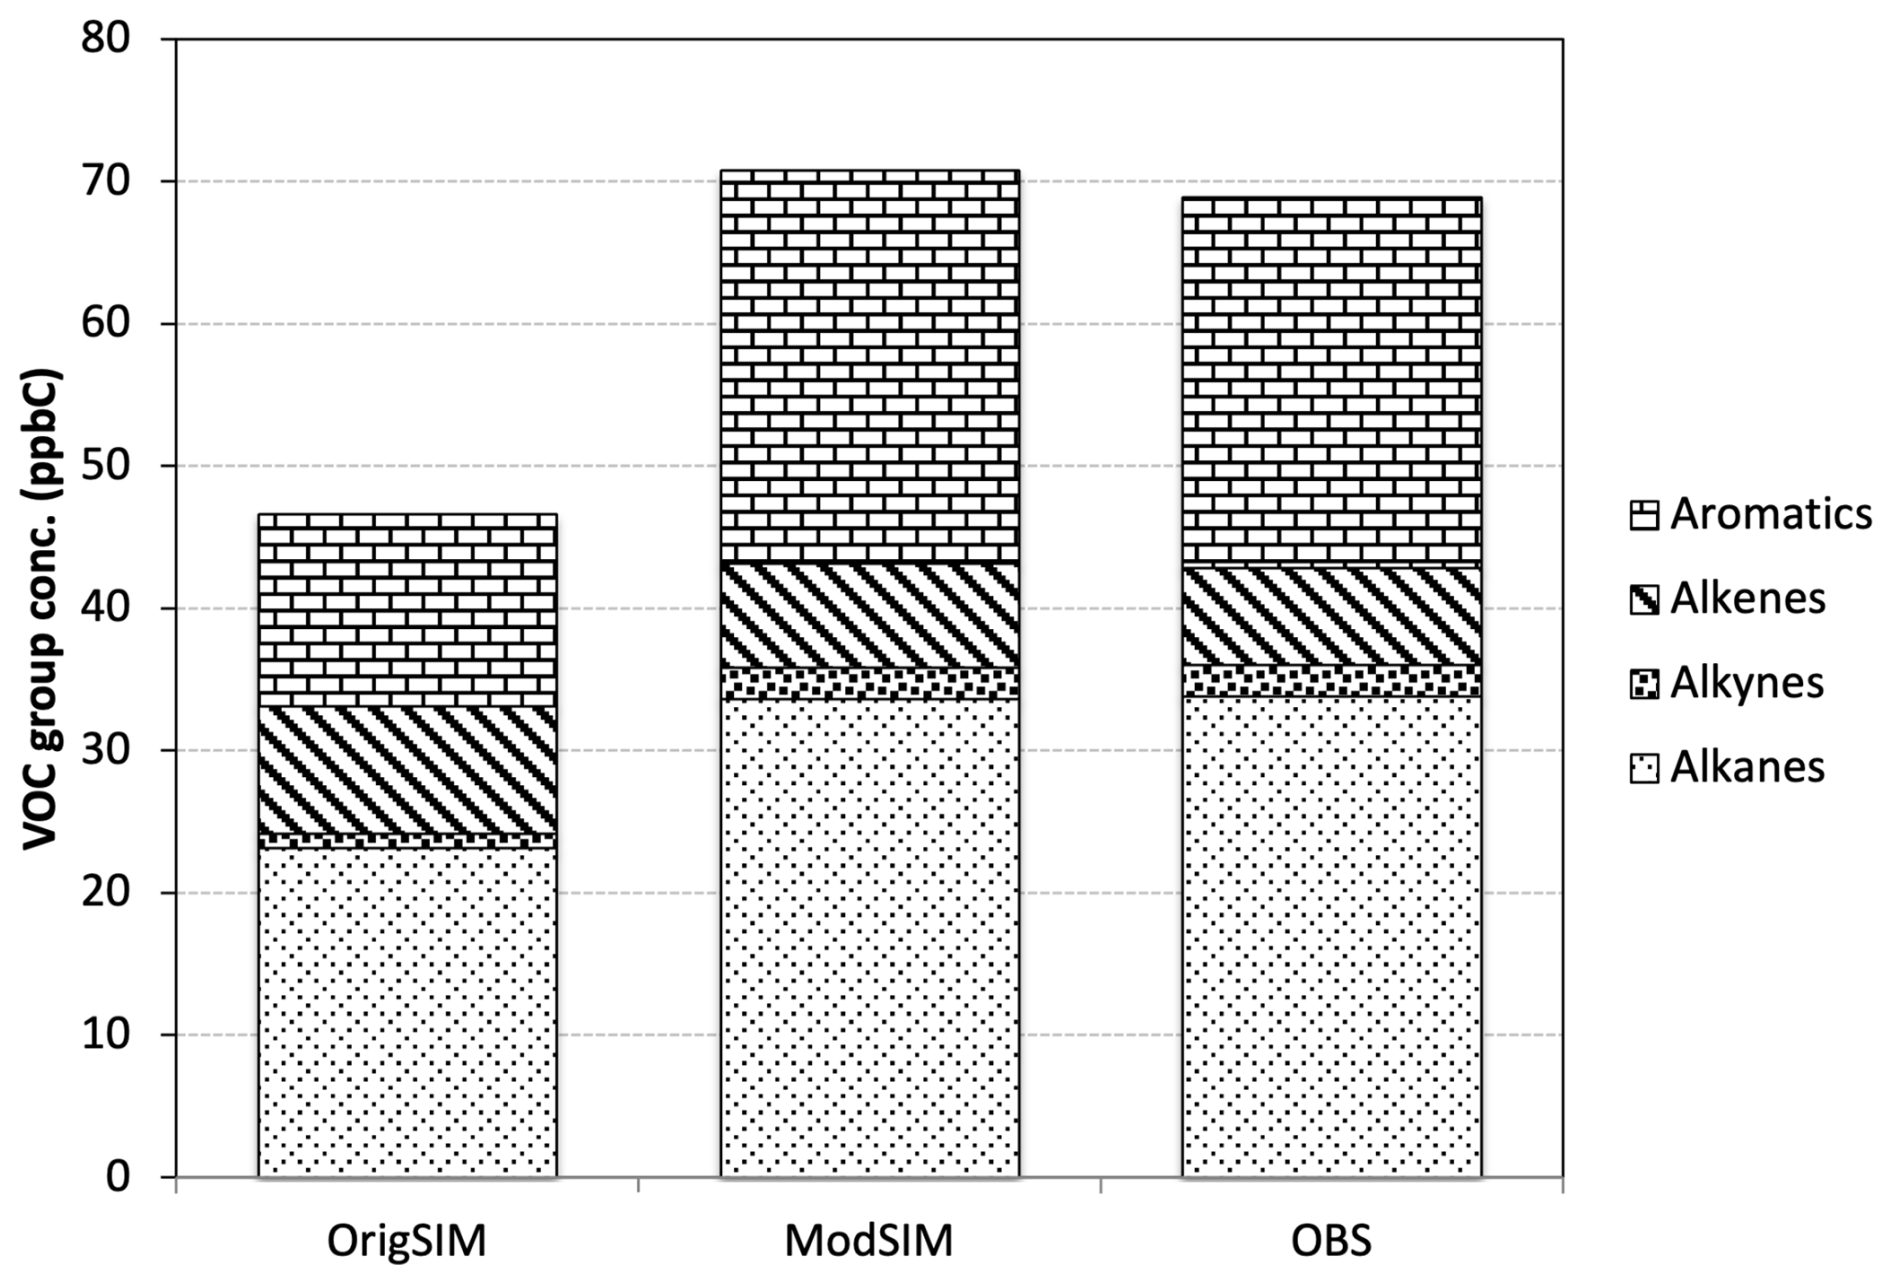
Figure 4 presents the average concentrations of VOC groups from PAMS simulations and observations at monitoring stations for the selected 2021 case. The ModSIM results demonstrate a marked improvement over OrigSIM, particularly for the alkane and aromatic groups (species-level comparisons are provided in Table S5). For TPAMS, the average concentration increased from 39.61 ppbC in OrigSIM to 68.39 ppbC in ModSIM, bringing it much closer to the observed 63.94 ppbC. The original simulation tends to underestimate alkanes, whereas the modified simulation better captures the total magnitude in alignment with observations. Notably, acetylene – underrepresented in OrigSIM but not absent – has been corrected through the top-down calibration approach. Unlike the alkane, alkene, and aromatic groups, which include multiple PAMS species, the alkyne group in Fig. 4 consists solely of acetylene. This emission in the original emission inventory is under-representative, as acetylene serves as a key tracer for incomplete combustion (see Sect. 3.4). The adjustment in ModSIM helps recover this loss and brings simulated values into closer agreement with observations, improving overall mass conservation.
3.3 In-depth diagnosis of ModSIM by CMAQ-PAMS
Most PAMS species have shown notable improvements following emission adjustments. A more in-depth demonstration of the enhanced model performance can be illustrated through two representative species: toluene, a typical anthropogenic VOC primarily emitted from solvent use and vehicular sources, and isoprene, a dominant biogenic VOC released from vegetation. These species not only represent contrasting emission origins but also play distinct roles in ozone formation chemistry. The species-resolved outputs provided by CMAQ-PAMS offer diagnostic insights unattainable with lumped-mechanism models. By resolving each VOC individually, the model reveals the contributions of specific emission categories, highlights species that dominate reactivity, and identifies inconsistencies between emission profiles and ambient composition. These diagnostics clarify the chemical pathways responsible for ozone formation and help isolate biases in the anthropogenic and biogenic VOC inventories that would otherwise remain hidden behind surrogate groupings. When applying modeling to real-world scenarios, ensuring realistic and accurate temporal and spatial distributions is critical for effectively identifying underlying issues and informing appropriate mitigation strategies.
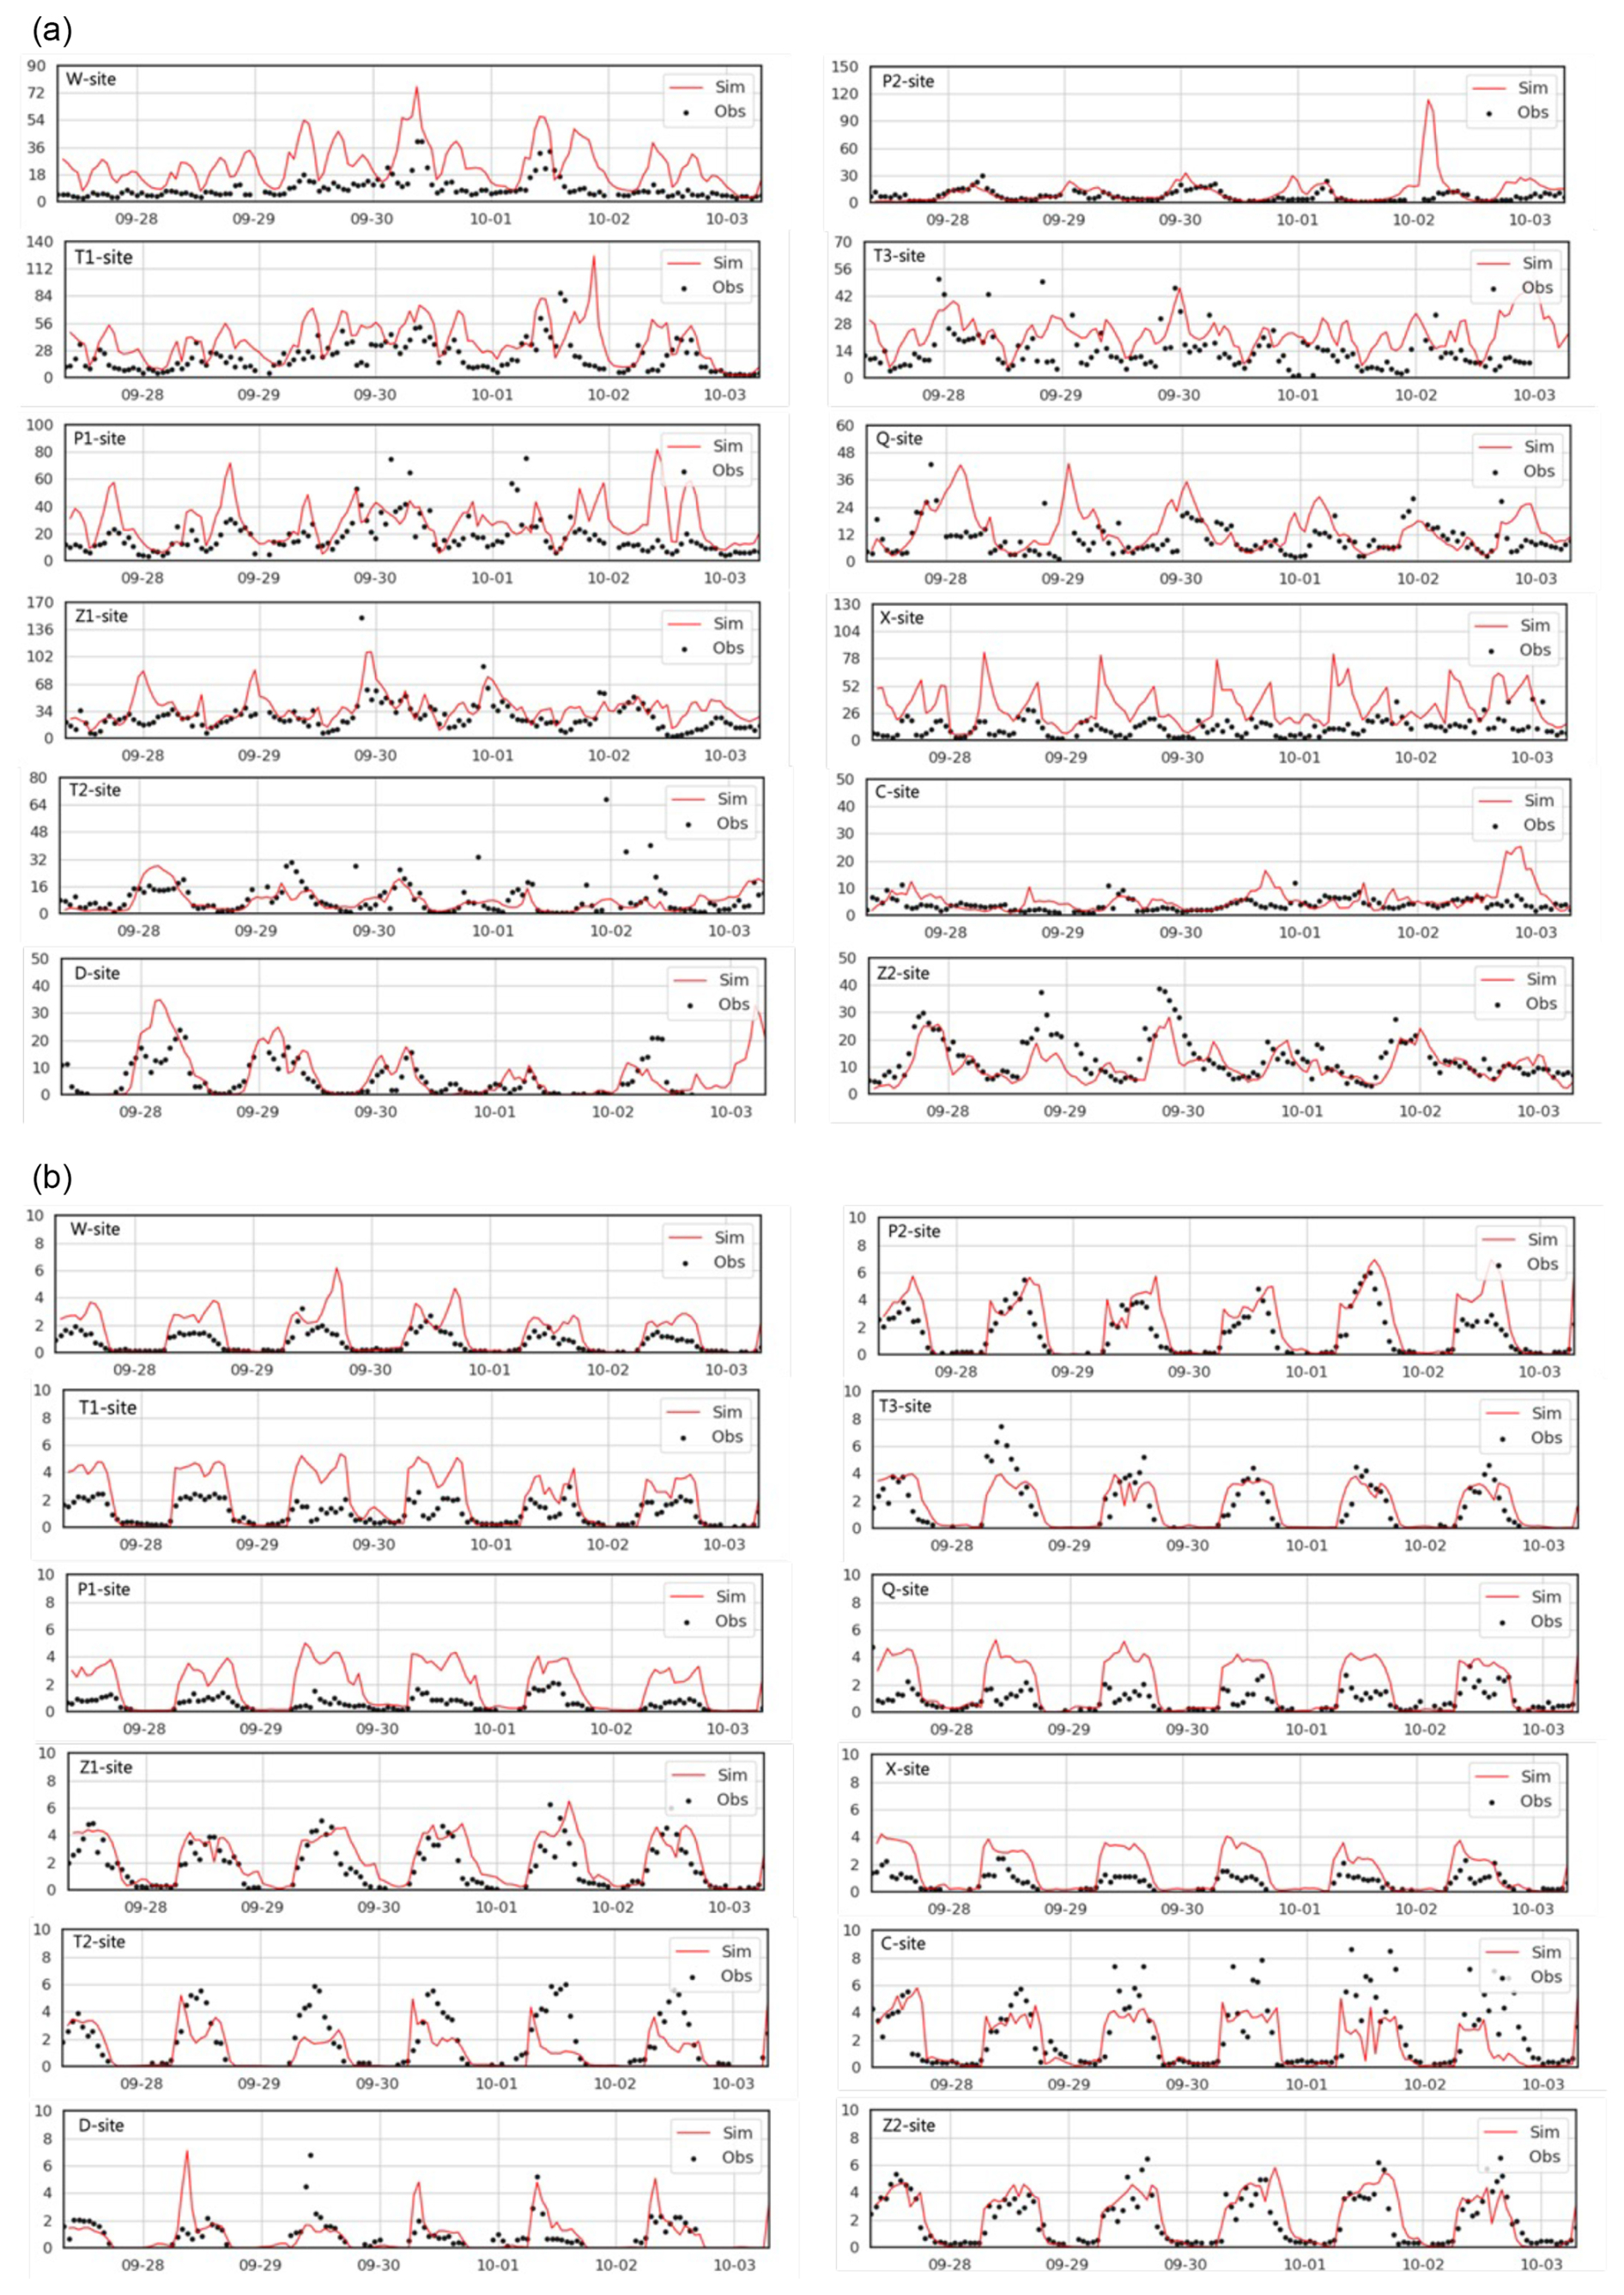
Figure 5Time series of (a) toluene and (b) isoprene at PAMS sites across the island (ppbC). Black triangles are PAMS observations, and green/red solid lines are CMAQ-PAMS simulations (with/without PAMS emission modification) – time labeled at 00:00 CST.
Toluene, being the most abundant compound observed across the PAMS network and exhibiting the highest emissions from point, line, and area sources (Table 3), warrants a detailed evaluation of model performance throughout the island. For the point source, toluene is the most used solvent and an important feedstock in the industry. For line sources, four-stroke motorcycles and light-duty gasoline passenger vehicles are the primary contributors to toluene emissions. For area sources, the main contributor is surface painting or coating of industrial products category, which includes emissions related to solvents used in commercial and residential activities. Figure 5a presents a comparison of observed and simulated toluene concentrations over time at all PAMS stations. The original simulations consistently underestimated toluene levels, with predicted-to-observed (p o) ratios around 0.5 (results not presented). Emission adjustment would require an increase by a factor of 2.54 to reach the observed island-wide averages (refer to Table 2). The time series of toluene mixing ratios across all PAMS sites indicates that the model generally captures the overall observed levels and distinct diurnal cycles. However, discrepancies remain in some peak values, which may result from inaccuracies in the emission inventory or limitations in some local sources as described earlier. The temporal alignment of concentration peaks suggests that the model reasonably captures diurnal variation patterns.
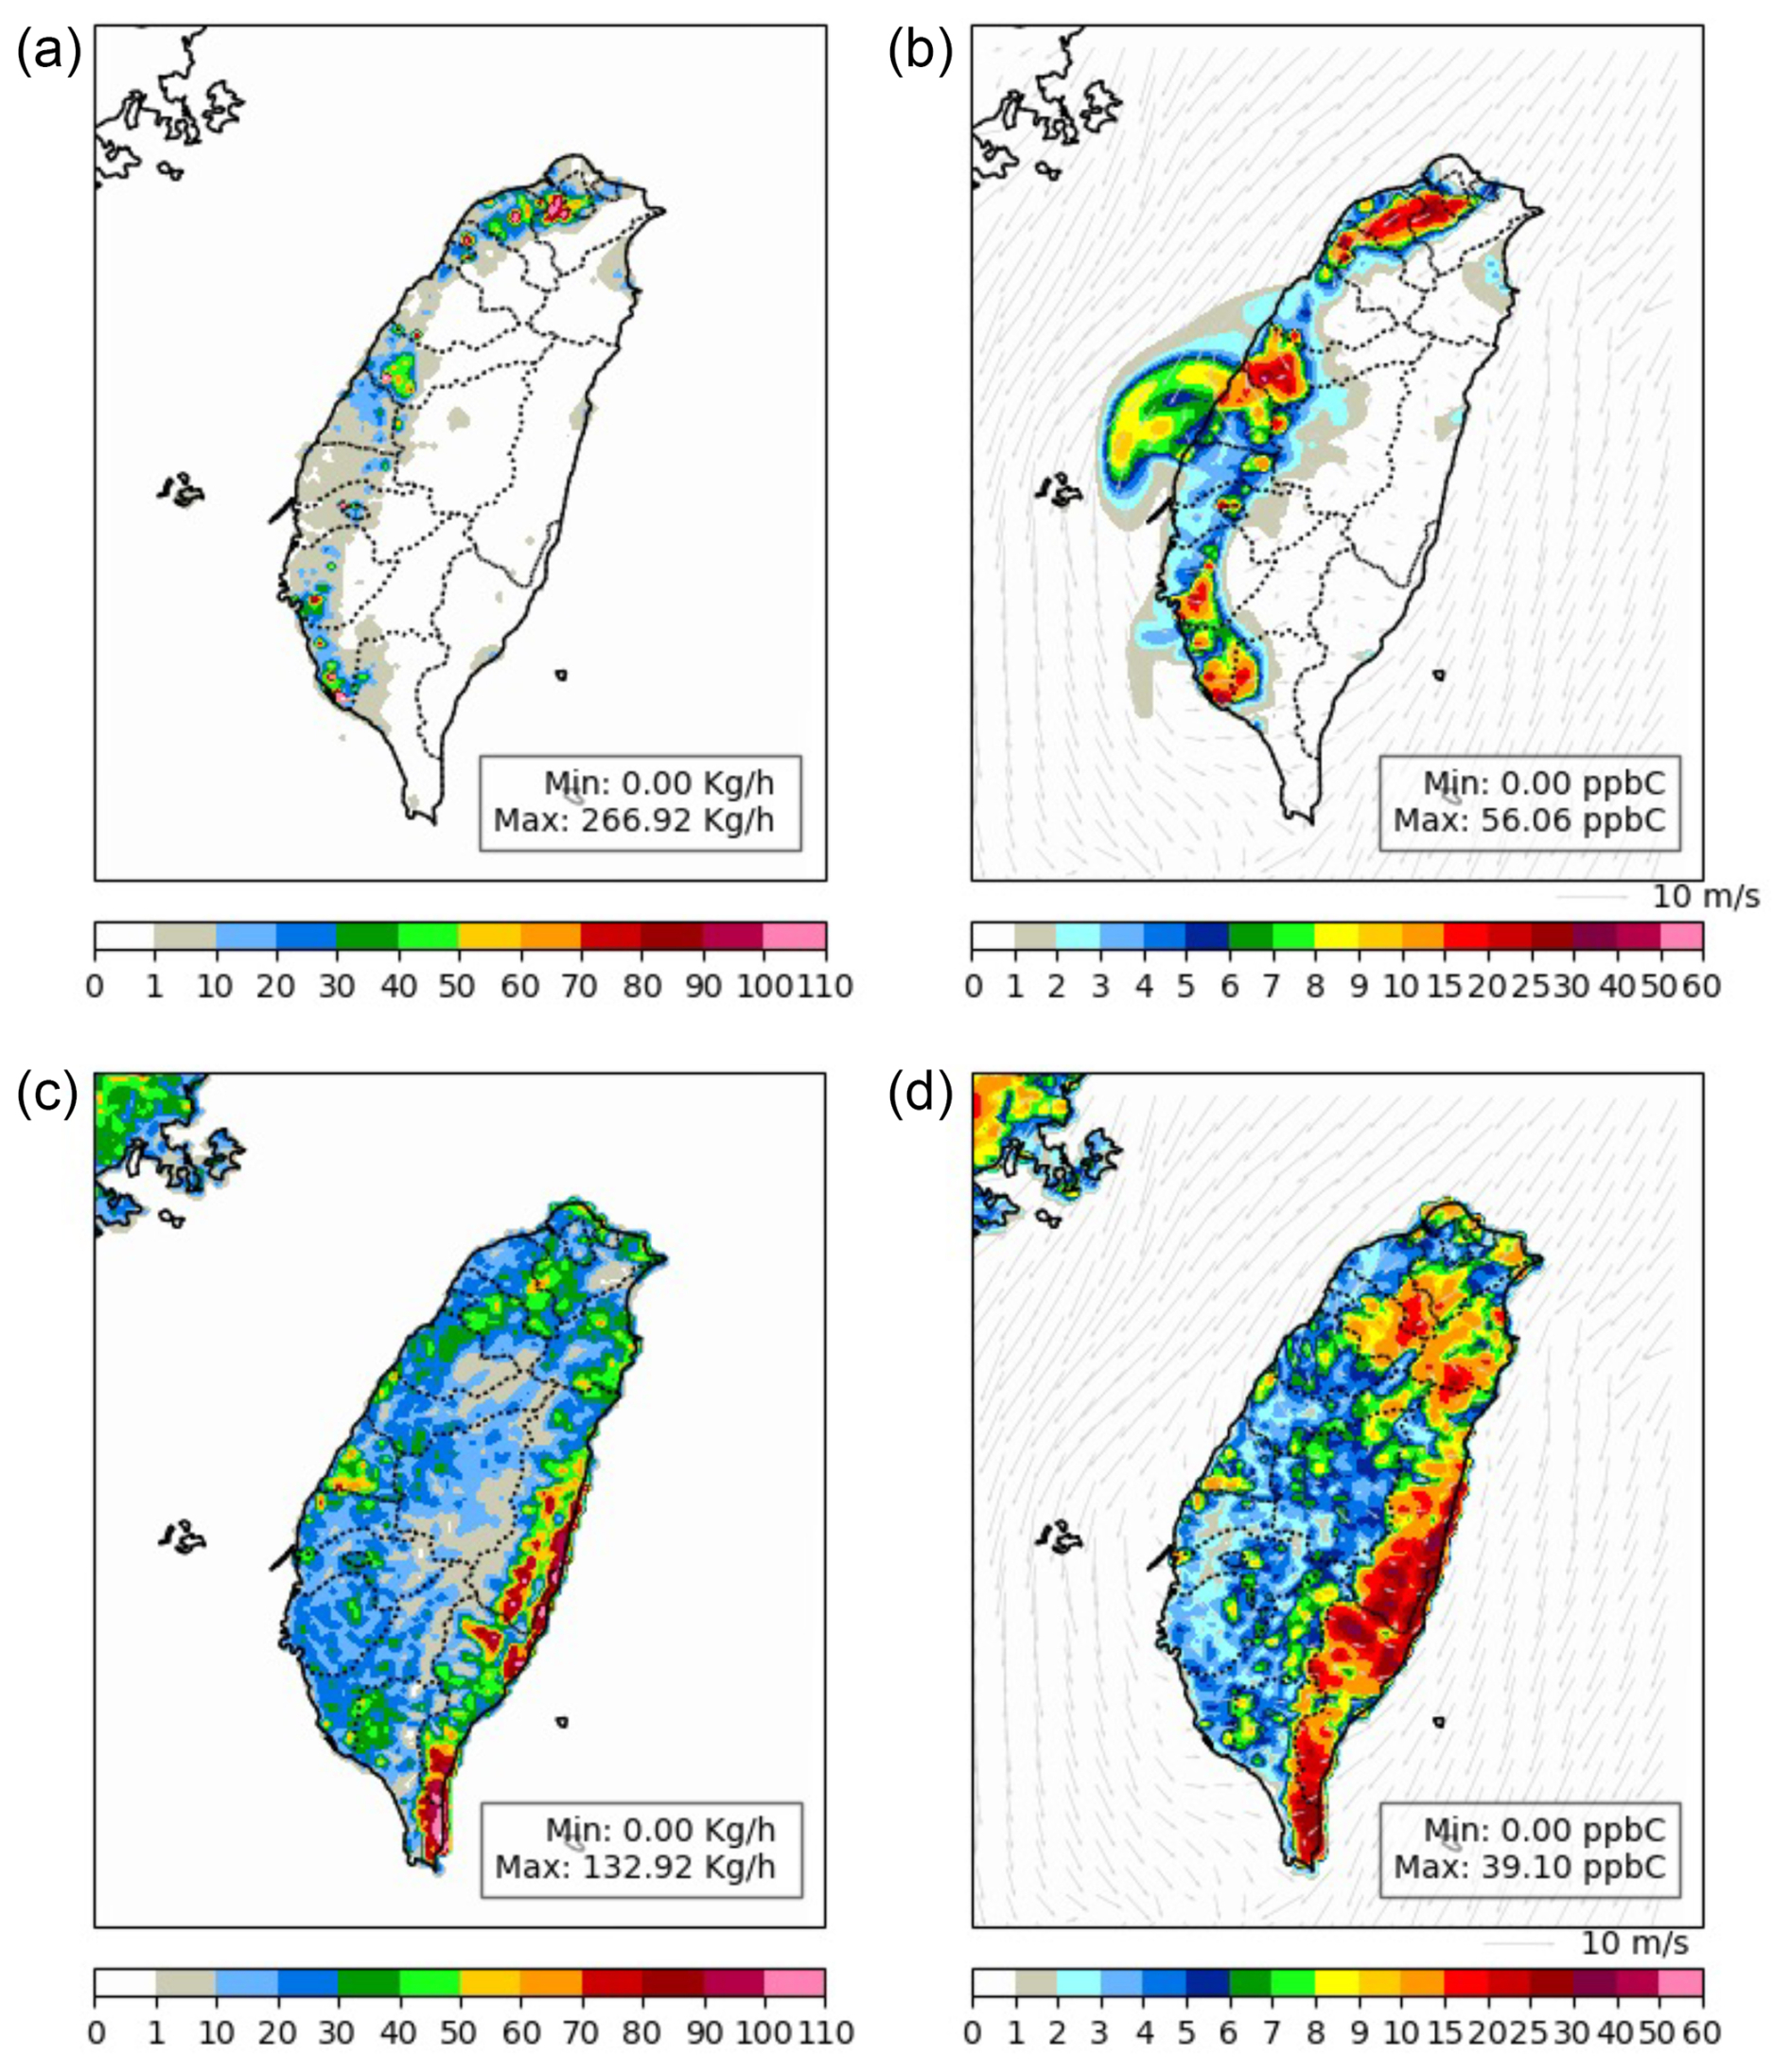
Figure 6Spatial mapping of toluene (a) emission (kg h−1) and (b) simulation (ppbC), and isoprene (c) and (d) along with the wind field across the island at 10:00 CST, 28 September 2021. Panels (a) and (c) show emission fluxes (kg h−1), whereas panels (b) and (d) show simulated ambient mixing ratios (ppbC). These quantities represent different physical variables and are therefore not directly convertible. All times are shown in CST (UTC+8), consistent with PAMS and TAQMN observations.
Figure 6a–b presents the spatial mapping of toluene emissions and simulated concentrations at 10:00 CST on 28 September 2021, alongside the corresponding wind field. The emission mapping reveals that high toluene emissions are concentrated in urban and industrial areas, particularly in the western part of the island, where population density, traffic, and industrial activity are the most prevalent. These correspond to major area, line, and point sources. The spatial distribution of toluene is strongly influenced by local circulation, referring to diurnally driven land-sea breezes and terrain-channeled valley winds that dominate surface flow under weak synoptic conditions. These circulations transport emissions downwind and reshape concentration patterns, resulting in spatial maxima that do not always coincide with the emission hotspots. However, noticeable mismatches in some regions between high-emission zones and corresponding simulated concentrations suggest that wind patterns significantly reshaped the spatial distribution of toluene concentrations.
Isoprene, the only PAMS species primarily of biogenic origin, exhibits distinctly unique diurnal and seasonal variations that differ markedly from those of the other 53 PAMS compounds. Due to its extremely high reactivity as an essential precursor of ozone and secondary organic aerosols (SOA), and ubiquitous presence across the island, where approximately 70 % of the land surface is covered by vegetation, isoprene warrants an in-depth understanding through improved modeling approaches. Both anthropogenic and biogenic VOC emissions contribute to isoprene emissions; nevertheless, biogenic origin is thought to contribute the majority of the ambient abundance. The isoprene from anthropogenic emissions follows the protocol of emission procedures (VOC speciation, temporal/spatial allocation), whereas that from biogenic emissions is derived from the MEGAN emission model (Fig. 1). Although isoprene has been explicitly represented and analyzed in many prior studies, e.g., (Palmer et al., 2006; Guenther et al., 2012), in Taiwan its emissions are overwhelmingly biogenic (Wang et al., 2013). Therefore, no emission adjustment factors were applied to ISOP in this study. Instead, our contribution lies in providing the first island-wide temporal comparison between simulated and observed isoprene concentrations across PAMS stations, offering new insight into the model's ability to capture biogenic emission-driven variability. The results highlight the model's ability to capture the diurnal variation of isoprene concentrations (Fig. 5b), particularly the daytime peaks driven by biogenic emissions. However, some discrepancies between simulated and observed data – especially underestimations during peak emission hours (Fig. 5b) – suggest that the model may not fully capture the complexity of biogenic emissions, which are highly sensitive to environmental factors including vegetation type, land use, soil conditions, temperature, and solar radiation. Overall, the model performs reasonably well in simulating isoprene levels, but further refinement could be achieved by incorporating more detailed land-use and vegetation data. For example, in Fig. 5b, the northernmost sites (W, T1, and P1) show lower observed isoprene concentrations than predicted by the model. This overestimation is likely due to outdated land-use and vegetation data, as rapid urbanization in these areas may have significantly reduced vegetation cover (with lower isoprene biogenic emissions). Updating biogenic emission inventories and land-use status using satellite-based retrievals may provide a more accurate representation of current environmental conditions, thereby improving the fidelity of isoprene modeling (Palmer et al., 2003). When simulating isoprene emissions, no adjustments were made to the biogenic emission factors in the emission modification. Despite its strong emissions during the warm seasons, isoprene remains at consistently low yet detectable levels on the western side of the island. This is attributed to its high photochemical reactivity and the limited vegetation cover, as much of the land is allocated for dense human settlement. These levels generally align with the PAMS measurements (Fig. 6c–d). In sharp contrast, the eastern side of the island exhibits significantly higher isoprene concentrations, primarily driven by the abundance of vegetation and minimal urban development.
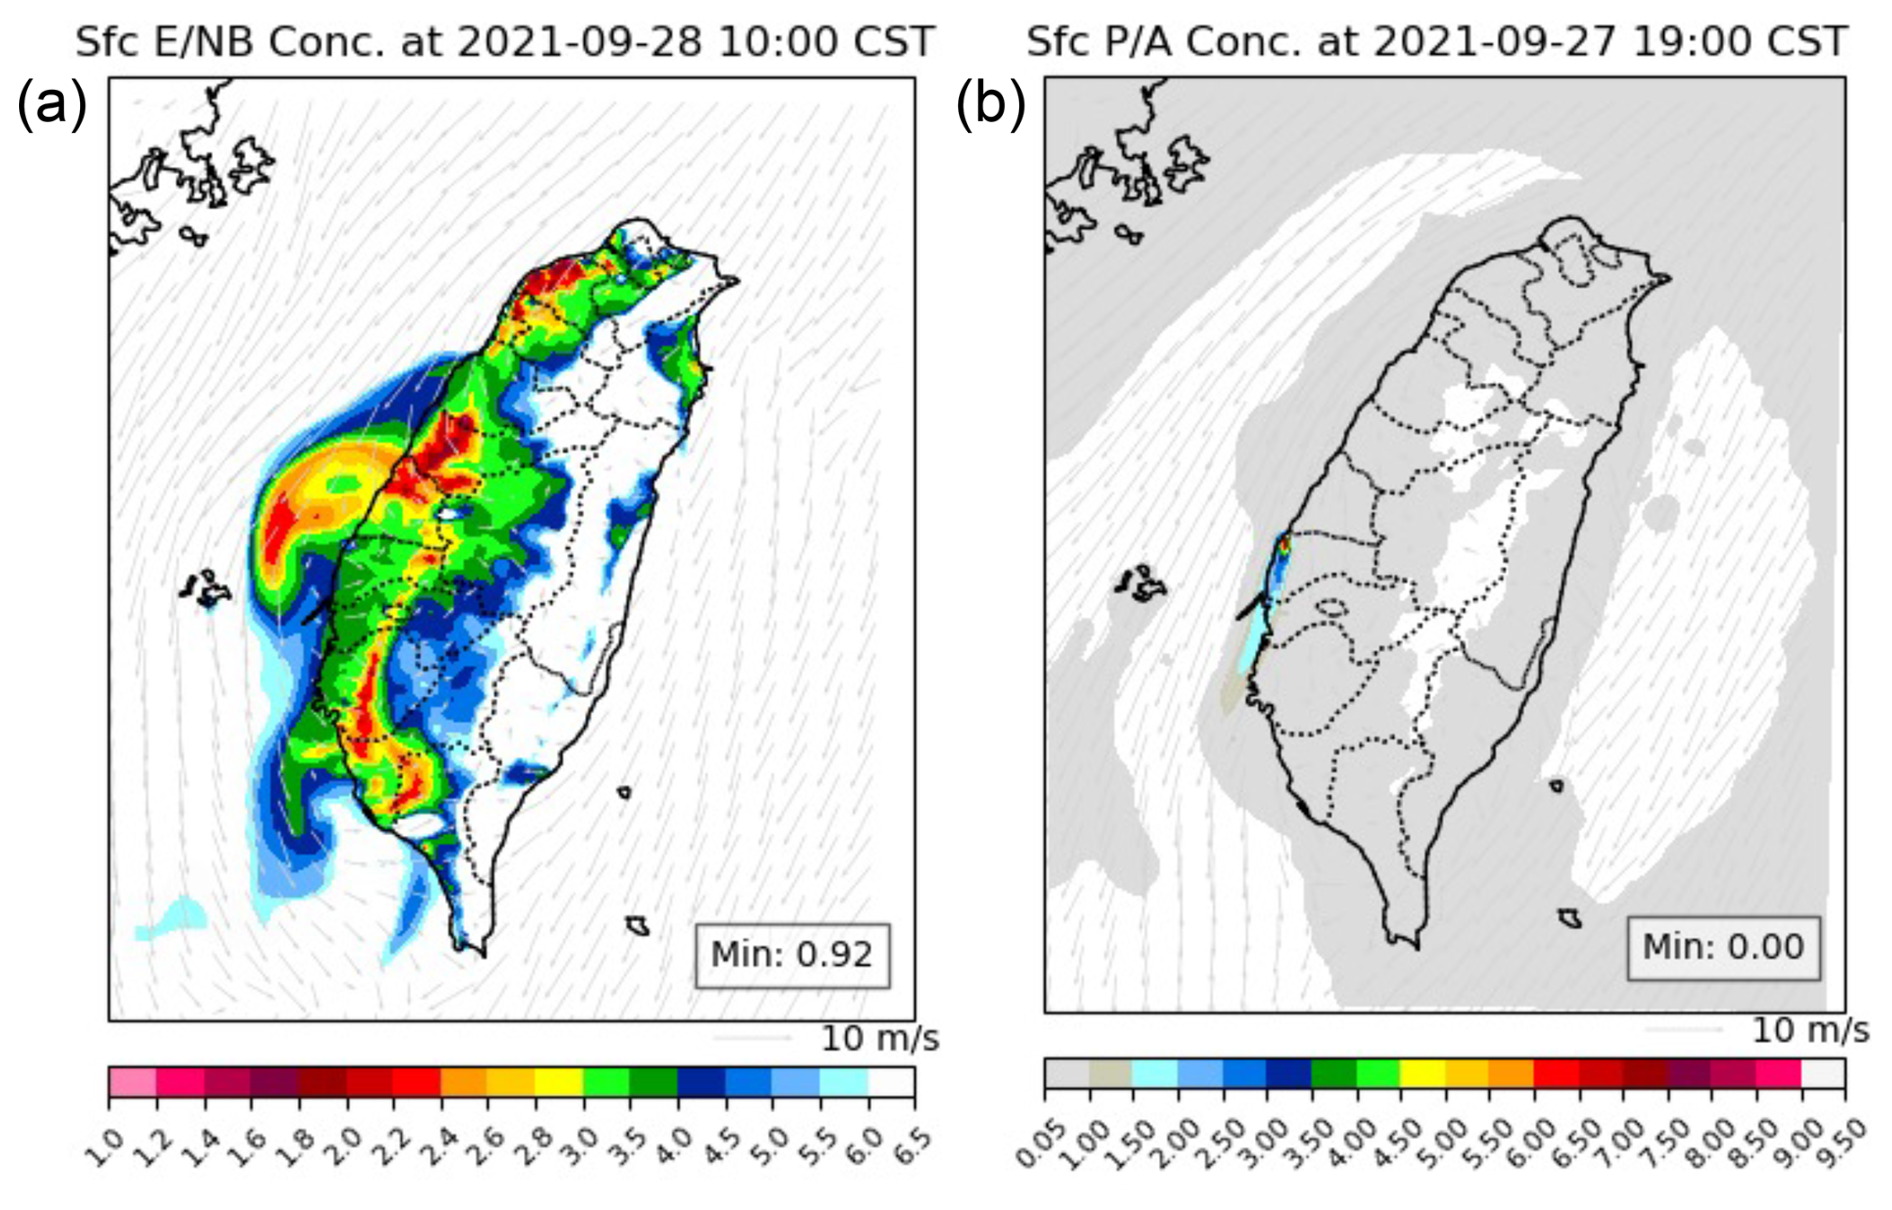
Figure 7Spatial mapping of modeled wind fields and indicative ratios of (a) ethane n-butane (E nB) at 10:00 CST, 28 September 2021, and (b) propylene acetylene (P A) at 19:00 CST, 27 September 2021.
3.4 Enhanced source specificity
Previous sections have presented PAMS species simulations validated against observations from the PAMS network. Notably, using species ratios – rather than individual compounds – provides a sharper delineation of VOC source distributions across the island. An example is the display of ethane vs. n-butane (E nB) ratios in Fig. 7a. Both ethane and n-butane are emitted from a wide range of sources and are relatively unreactive, resulting in significant background concentrations that hinder the distinction between source types. Consequently, their spatial gradients – from source-rich to source-poor areas – can be subtle when examining individually. However, their ratio offers greater discriminatory power, revealing source contrasts that are otherwise obscured. As shown in Fig. 7a, the E nB ratio clearly highlights major metropolitan areas in the north, center, and south, as well as the primary traffic corridors along the island's west coast. The gradient displays a strong local influence near emission hotspots with decreasing intensity toward the east of less populated lands.
Another example is displaying the ratio mapping of propylene to acetylene (P A). P A serving as a proxy for petrochemical emissions. Ethylene and propylene are important feedstocks for petrochemical industries and are produced by oil refineries as the upstream processes. However, traffic emissions are also a source of these two species due to incomplete internal combustion in vehicles. Using acetylene as a denominator can effectively distinguish vehicle emissions from petrochemical emissions, as has been demonstrated by PAMS observation data (Su et al., 2016), as it is also released from internal combustion vehicles by a significant proportion but not in the refinery process. In Fig. 7b, the mapping of the ratio highlights a distinct source of a major petrochemical complex, accounting for 47 % of Taiwan's gasoline production capacity and 37 % of the island's total propylene feedstock.
The spatial patterns align with the regional industrial and urban activities, offering a clearer understanding of the source-receptor dynamics. Moreover, the modeled variability underscores the influence of meteorological factors, such as wind speed and direction, in shaping pollutant distribution across the island domain. These insights are critical for refining regional air quality models and forming emission control strategies targeting specific VOC sources for health and ozone relevance. Through the CMAQ-PAMS species simulation, VOC ratios may provide a more sensitive diagnosis of the interplay between emissions, photochemistry, and air movements.
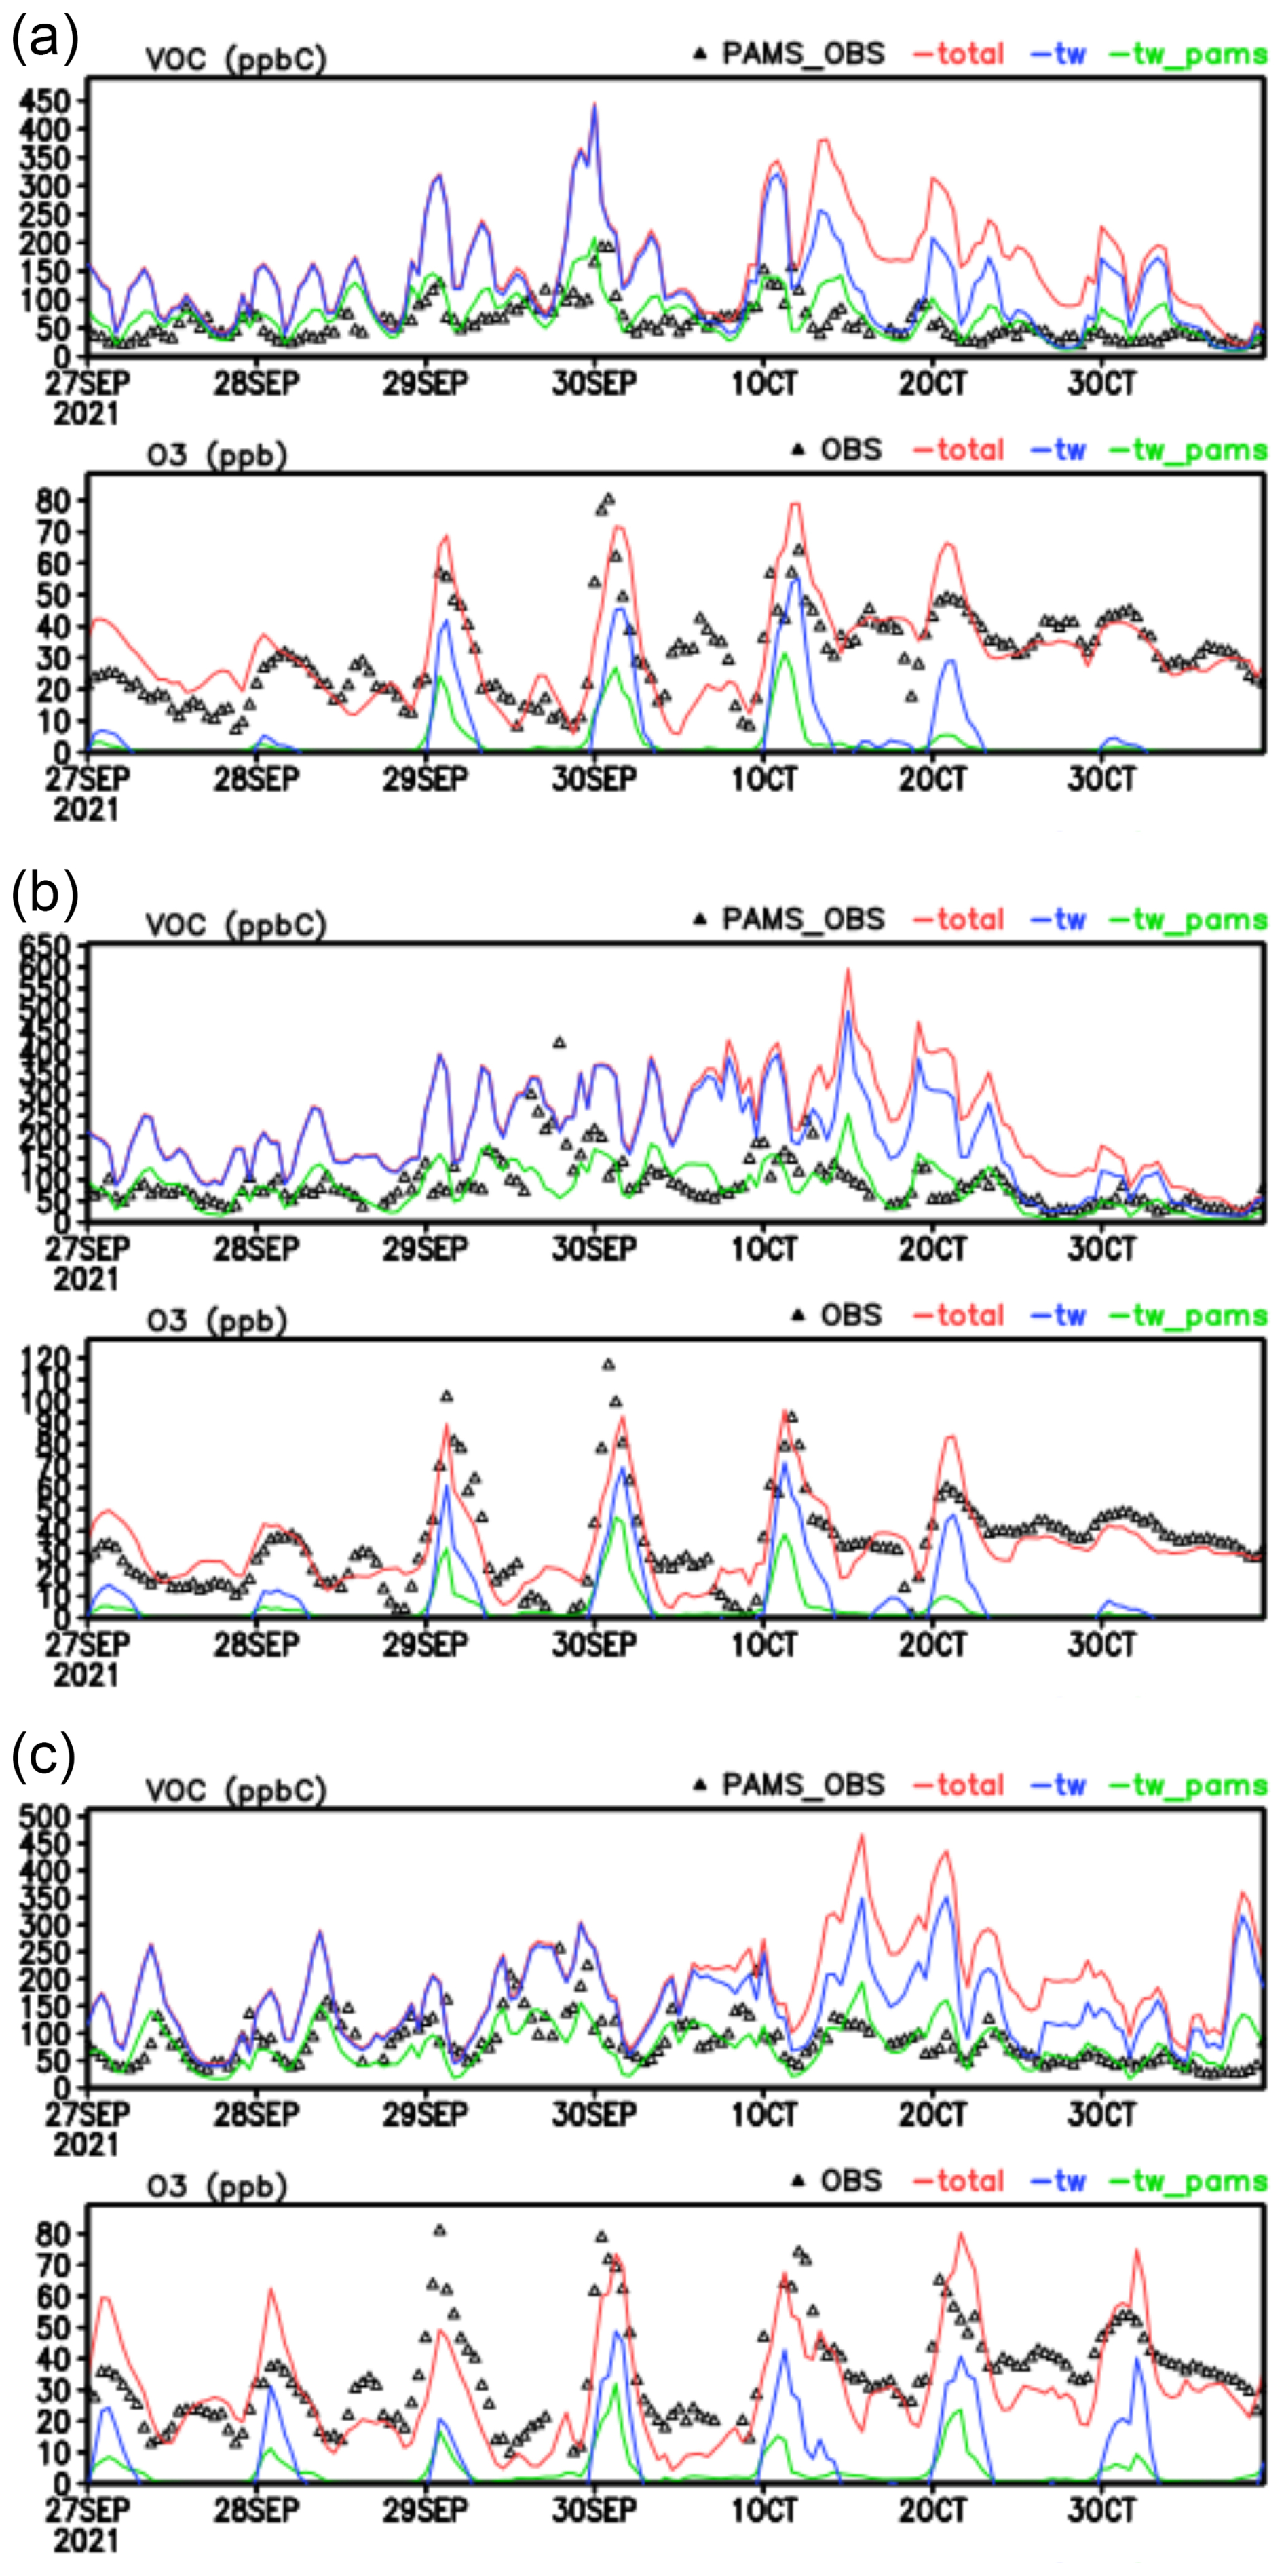
Figure 8Time series of observed and modeled VOCs and O3 at selected TAQMN stations in the 2021 event from 27 September–3 October (labeled at 08:00 CST). The black triangles are observations (from PAMS or TAQMN), red lines are simulations with total sources (background, transboundary, and domestic emissions), blue lines are simulations with domestic emissions (PAMS and non-PAMS VOC emissions), and green lines are simulations with domestic PAMS VOC emissions only.
3.5 Accountability of PAMS emissions to ozone formation
In VOC-limited regimes, reducing VOC emissions is key to controlling O3 formation. Understanding how PAMS species contribute to O3 production is essential both for identifying mitigation targets and for justifying the value of the islandwide PAMS network. If PAMS species are found to significantly influence O3 levels, targeting their sources could be an effective control strategy. The earlier calibration of PAMS species emissions against observed data provides a foundation for evaluating their area-specific contributions to O3 formation across Taiwan.
Numerous field and modeling studies have demonstrated that major urban and industrial regions in western Taiwan frequently operate under VOC-limited ozone formation regimes. Early observational analyses showed that ozone formation in Taipei and northern Taiwan is constrained by VOC availability (Chang and Lee, 2006; Wu et al., 2006). Similar VOC-sensitive behaviour has been reported in central Taiwan (Shiu et al., 2007). More recent analyses further confirm this pattern: long-term NOx reductions have led to higher ozone levels across Taiwan (Chen et al., 2021), and scenario-based modeling shows that NOx-only reductions increase ozone in northern Taiwan, consistent with a VOC-limited regime (Chuang et al., 2022). Collectively, these independent studies strongly support the VOC-limited interpretation applied in this study.
Table 4Station-specific PAMS and total VOC amounts and their ratios across emissions, observations, and simulations, including associated modeled O3 levels.
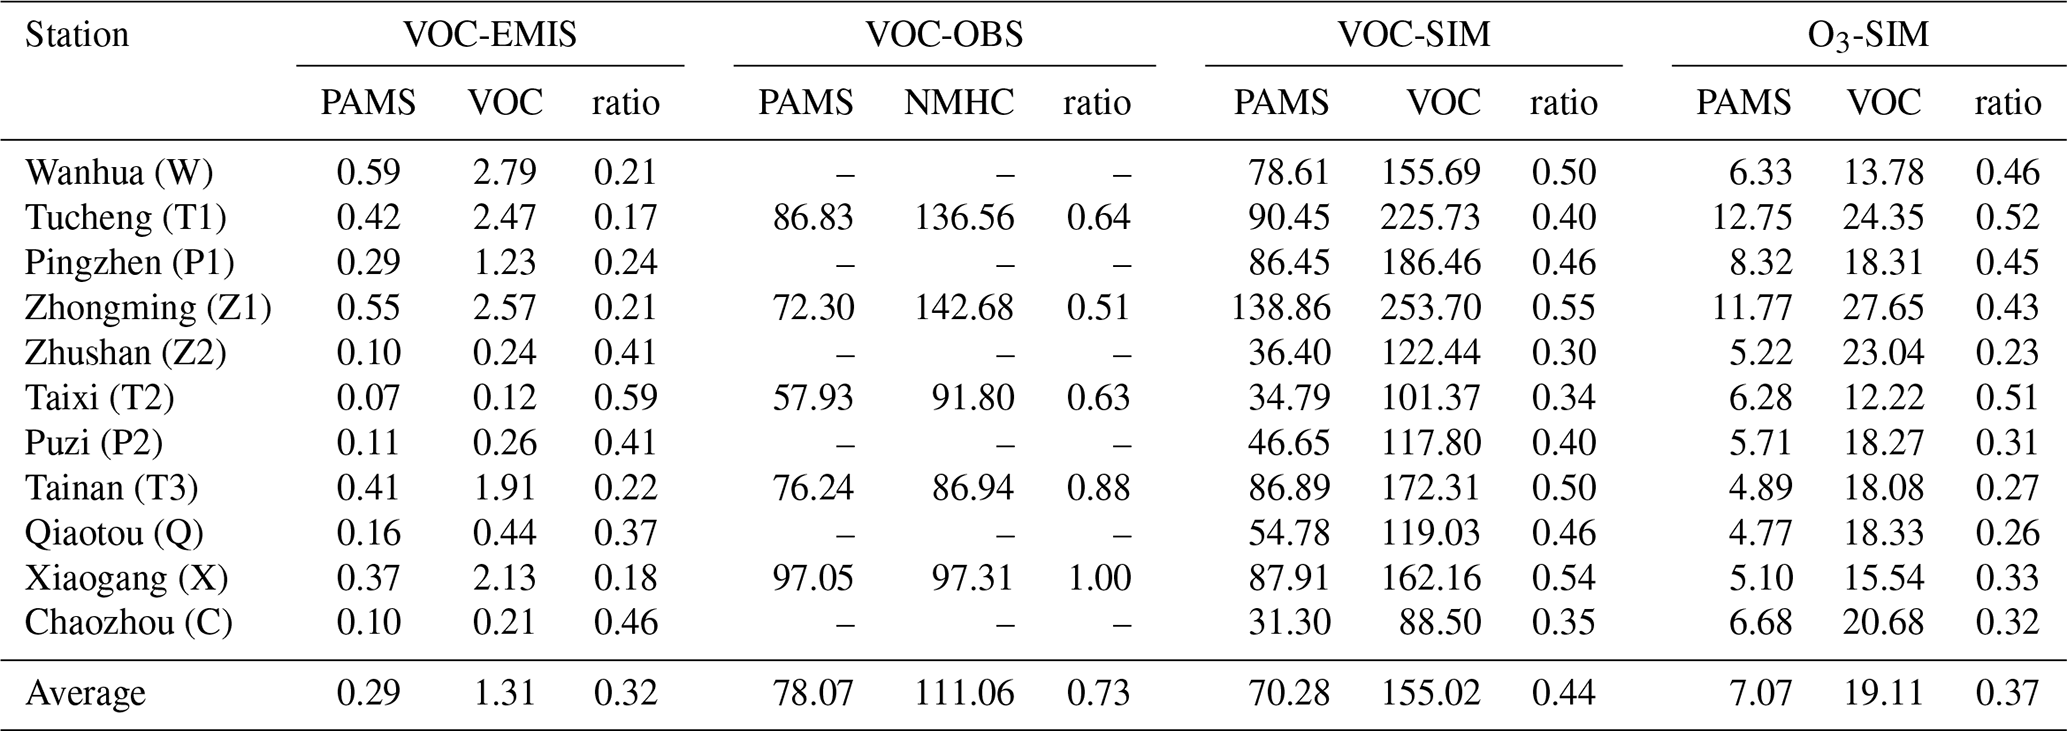
Note: The units for VOC_EMIS, VOC_OBS, VOC_SIM, O3_SIM are mole/s, ppbC, ppbC, ppb, respectively. The ratios of modeled O3 are calculated for the morning O3, considering local photochemistry. – Stands for sites not equipped with NMHC instruments.
Figure 8 presents the time series of observed and modeled VOC and O3 concentrations during a 2021 episode, categorized by site types: W-site (urban), T1-site (urban/industrial), and P-site (urban/industrial). Model results are shown for total (including transboundary and background), domestic-only (TW), and PAMS-only emissions (TW_PAMS). Observed and modeled speciated PAMS values were drawn from nearby PAMS sites (locations in Fig. 2). Previous studies (Chen et al., 2014a) showed strong coherence between observed total PAMS (TPAMS) and TVOC values, with TPAMS consistently ∼ 30 % lower due to limited speciation (54 NMHC species), while TVOC includes additional compounds such as OVOCs (Chen et al., 2015). To assess PAMS contributions to total VOCs and ozone, we examined TPAMS TVOC ratios from three perspectives: emissions (EMIS), observations (OBS), and simulations (SIM), as summarized in Table 4 and Fig. 8. Emission data showed TPAMS accounted for 17 %–59 % of TVOC, averaging 32 %, indicating a substantial presence of non-PAMS VOCs (e.g., OVOCs and other unmeasured low-abundant species). In contrast, observations revealed higher PAMS contributions, especially at X and T3 sites, where PAMS/TVOC approached 1.0, suggesting dominance of PAMS species in measured profiles. Intermediate ratios (0.51–0.64) at other sites were consistent with historical PAMS data (∼ 0.7 average from 2007–2011) (Chen et al., 2014a), confirming the representativeness of current observations. However, simulated PAMS TVOC ratios averaged 0.44, with higher values (≥0.50) at urban sites (W, Z1, T3, X), indicating improved model performance in populated areas. A notably lower ratio at T1 (0.34) may reflect model underrepresentation of OVOCs near industrial sources.
O3 levels over Taiwan result from both domestic photochemistry and transboundary influences, which vary seasonally and regionally (Lin et al., 2007; Chen et al., 2021; Choi et al., 2024). As Fig. 9 shows, the modeled O3 based on PAMS-only emissions (green lines) captures the timing of observed peaks but underestimates their magnitudes compared to full-VOC simulations (blue lines). PAMS only contributions accounted for 23 %–52 % of total domestic O3 production, underscoring their importance in VOC-limited urban and industrial areas, yet also revealing the role of other VOCs, possibly OVOCs, as well as numerous low-abundant species not covered by the PAMS measurements. Overall, PAMS species represent a substantial fraction of total VOCs and play a significant role in shaping observed VOC profiles relevant to ozone formation. The strong sensitivity of ozone production to specific PAMS VOCs underscores the importance of validating VOC simulations at the species level. Traditional lumped mechanisms assume representative reactivity within group surrogates, but the present results show that misrepresentation of even a few key reactive species-such as aromatics, alkanes, or acetylene-can substantially alter O3 formation. CMAQ-PAMS enables these deviations to be explicitly quantified and corrected, ensuring that ozone sensitivity analyses and future control-strategy evaluations are grounded in chemically realistic VOC compositions. Bridging the gap between observed and modeled O3 levels may require expanding the VOC speciation spectrum to include aldehydes and other major oxygenated VOCs (OVOCs). However, such enhancements would significantly increase the complexity and cost of monitoring infrastructure, an issue beyond the scope of this study.
This study presents CMAQ-PAMS, an enhanced air quality modeling framework that integrates speciated VOCs observed by Taiwan's PAMS network into the CMAQ system. By explicitly simulating 54 PAMS-targeted species, the model overcomes a major limitation of conventional lumped-species chemical mechanisms and allows direct comparison with observed VOC data.
Through a top-down calibration using islandwide PAMS observations, the modified model substantially improves agreement with observed VOC concentrations across chemical groups of alkanes, alkenes, and aromatics, and restored key tracers such as acetylene in the alkyne group. These refinements yielded more realistic spatial distributions and source contributions, improving the model's ability to represent VOC-limited O3 formation regimes.
The calibrated PAMS species account for only ∼ 32 % of total VOC emissions yet contribute disproportionately (up to 52 %) to domestic O3 production, underscoring the importance of a few highly reactive species in driving ozone pollution. The integration of VOC indicator ratios further enhanced diagnostic capability for source identification and atmospheric processing.
CMAQ-PAMS serves as a robust, observation-constrained platform for improving chemical accuracy in regional ozone modeling. Future efforts should prioritize updating VOC speciation profiles with localized measurements, expanding coverage of oxygenated VOCs, and integrating satellite-based land use data to refine both anthropogenic and biogenic emission representations. These improvements are essential for advancing air quality forecasting and informing targeted ozone mitigation strategies.
The CMAQ-PAMS model is based on the U.S. EPA Community Multiscale Air Quality (CMAQ) model version 5.2, which is publicly available from the EPA GitHub repository (https://doi.org/10.5281/zenodo.13883210, US EPA Office of Research and Development, 2024). The modified source codes and scripts used to implement the 54 PAMS species are available from the corresponding author upon reasonable request. Hourly PAMS observations and air quality monitoring data are provided by the Ministry of Environment, Taiwan (MOENV). These datasets are publicly accessible through the MOENV data service portal (https://data.moenv.gov.tw/, last access: 14 February 2026). Model input data (emission inventories, meteorology, and boundary conditions) and simulation outputs are available upon reasonable request to the corresponding author.
The supplement related to this article is available online at https://doi.org/10.5194/acp-26-5497-2026-supplement.
S.-P. Chen designed, supervised the entire study, and led model development of this research. C.-H. Wang processed the QAQC of the PAMS observational data. Y.-J. Lee and F.-Y. Cheng assisted with model configuration and supported meteorological modeling. J.-L. Wang contributed to the interpretation of results. All authors discussed the findings of the manuscript.
The contact author has declared that none of the authors has any competing interests.
Publisher's note: Copernicus Publications remains neutral with regard to jurisdictional claims made in the text, published maps, institutional affiliations, or any other geographical representation in this paper. The authors bear the ultimate responsibility for providing appropriate place names. Views expressed in the text are those of the authors and do not necessarily reflect the views of the publisher.
The authors thank the Ministry of Environment, Taiwan (MOENV), for providing valuable hourly air quality and PAMS data.
This research has been supported by the National Science and Technology Council (NSTC), Taiwan (grant no. NSTC 111-2111-M-033-001-MY3), and the Ministry of Environment, Taiwan (MOENV) (contract nos. 111-EPA-F003, MOENV113F018, 111A152, 112AA213, and 113AA083).
This paper was edited by Kelvin Bates and reviewed by two anonymous referees.
Ahmed, M., Ahmad, M., and Rappenglueck, B.: Twenty years (2004–2023) observation of non-methane hydrocarbons in a subtropical coastal environment – Indications of increased isoprene emissions, Atmospheric Environment, 343, 120993, https://doi.org/10.1016/j.atmosenv.2024.120993, 2025.
Atkinson, R.: Atmospheric chemistry of VOCs and NOx, Atmos. Environ., 34, 2063–2101, https://doi.org/10.1016/S1352-2310(99)00460-4, 2013.
Byun, D. and Ching, J.: Science algorithms of the EPA Models-3 Community Multiscale Air Quality (CMAQ) Modeling System, U.S. Environmental Protection Agency, EPA/600/R-99/030, Research Triangle Park, NC, USA, 1999.
Byun, D. and Schere, K.: Review of the Governing Equations, Computational Algorithms, and Other Components of the Models-3 Community Multiscale Air Quality (CMAQ) Modeling System, Applied Mechanics Reviews, 59, 51–77, https://doi.org/10.1115/1.2128636, 2006.
Cardelino, C. and Chameides, W. L.: Natural hydrocarbons, urbanization, and urban ozone, Journal of Geophysical Research, 95, https://doi.org/10.1029/JD095iD09p13971, 1990.
Carter, W.: Development of the SAPRC-07 chemical mechanism, Atmos. Environ., 44, 5324–5335, https://doi.org/10.1016/j.atmosenv.2010.01.026, 2010.
Chang, C. Y., Wang, J. L., Chen, Y. C., Pan, X. X., Chen, W. N., Lin, M. R., Ho, Y. J., Chuang, M. T., Liu, W. T., and Chang, C. C.: A study of the vertical homogeneity of trace gases in East Asian continental outflow, Chemosphere, 297, 134165, https://doi.org/10.1016/j.chemosphere.2022.134165, 2022.
Chang, J. H.-W., Griffith, S. M., Kong, S. S.-K., Chuang, M.-T., and Lin, N.-H.: Development of a CMAQ–PMF-based composite index for prescribing an effective ozone abatement strategy: a case study of sensitivity of surface ozone to precursor volatile organic compound species in southern Taiwan, Atmos. Chem. Phys., 23, 6357–6382, https://doi.org/10.5194/acp-23-6357-2023, 2023.
Chang, S. C. and Lee, C. T.: Ozone variations through vehicle emissions reductions based on air quality monitoring data in Taipei City, Taiwan, from 1994 to 2003, Atmospheric Environment, 40, 3513–3526, https://doi.org/10.1016/j.atmosenv.2006.01.038, 2006.
Chen, S. P., Liu, T. H., Chen, T. F., Ou-Yang, C. F., Wang, J. L., and Chang, J. S.: Diagnostic Modeling of PAMS VOC Observation, Environmental Science & Technology, 44, 4635–4644, https://doi.org/10.1021/es903361r, 2010.
Chen, S. P., Liu, W. T., Ou-Yang, C. F., Chang, J. S., and Wang, J. L.: Optimizing the emission inventory of volatile organic compounds (VOCs) based on network observations, Atmospheric Environment, 84, 1–8, https://doi.org/10.1016/j.atmosenv.2013.10.059, 2014a.
Chen, S. P., Chang, C. C., Liu, J. J., Chou, C. C. K., Chang, J. S., and Wang, J. L.: Recent improvement in air quality as evidenced by the island-wide monitoring network in Taiwan, Atmospheric Environment, 96, 70–77, https://doi.org/10.1016/j.atmosenv.2014.06.060, 2014b.
Chen, S. P., Su, Y. C., Chiu, C. J., Lin, C. H., Chang, J. S., Chang, C. C., and Wang, J. L.: Inter-comparison of network measurements of non-methane organic compounds with model simulations, Atmospheric Environment, 122, 94–102, https://doi.org/10.1016/j.atmosenv.2015.09.033, 2015.
Chen, S. P., Liu, W. T., Hsieh, H. C., and Wang, J. L.: Taiwan ozone trend in response to reduced domestic precursors and perennial transboundary influence, Environmental Pollution, 289, 117883, https://doi.org/10.1016/j.envpol.2021.117883, 2021.
Chen, T. F., Gong, X. L., Tsai, C. Y., and Chang, K. H.: Method for planning subarea emission reduction strategies to improve ozone over a large area: A case of Taiwan, Atmospheric Environment, 350, 121149, https://doi.org/10.1016/j.atmosenv.2025.121149, 2025.
Cheng, F.-Y., Jian, S.-P., Yang, Z.-M., Yen, M.-C., and Tsuang, B.-J.: Influence of regional climate change on meteorological characteristics and their subsequent effect on ozone dispersion in Taiwan, Atmospheric Environment, 103, 66–81, https://doi.org/10.1016/j.atmosenv.2014.12.020, 2015.
Cheng, F. Y., Feng, C. Y., Yang, Z. M., Hsu, C. H., Chan, K. W., Lee, C. Y., and Chang, S. C.: Evaluation of real-time PM2.5 forecasts with the WRF-CMAQ modeling system and weather-pattern-dependent bias-adjusted PM2.5 forecasts in Taiwan, Atmospheric Environment, 244, 117909, https://doi.org/10.1016/j.atmosenv.2020.117909, 2021.
Choi, J., Henze, D. K., Nawaz, M. O., and Malley, C. S.: Source Attribution of Health Burdens From Ambient PM2.5, O3, and NO2 Exposure for Assessment of South Korean National Emission Control Scenarios by 2050, GeoHealth, 8, e2024GH001042, https://doi.org/10.1029/2024GH001042, 2024.
Chuang, M. T., Chou, C. C. K., Lin, C. Y., Lee, J. H., Lin, W. C., Chen, Y. Y., Chang, C. C., Lee, C. T., Kong, S. S.-K., and Lin, T. H.: A numerical study of reducing the concentration of O3 and PM2.5 simultaneously in Taiwan, Journal of Environmental Management, 318, 115614, https://doi.org/10.1016/j.jenvman.2022.115614, 2022.
Emmons, L. K., Walters, S., Hess, P. G., Lamarque, J.-F., Pfister, G. G., Fillmore, D., Granier, C., Guenther, A., Kinnison, D., Laepple, T., Orlando, J., Tie, X., Tyndall, G., Wiedinmyer, C., Baughcum, S. L., and Kloster, S.: Description and evaluation of the Model for Ozone and Related chemical Tracers, version 4 (MOZART-4), Geosci. Model Dev., 3, 43–67, https://doi.org/10.5194/gmd-3-43-2010, 2010.
Fine, J., Vuilleumier, L., Reynolds, S., Roth, P., and Brown, N.: Evaluating Uncertainties in Regional Photochemical Air Quality Modeling, Annual Review of Environment and Resources, 28, 59–106, https://doi.org/10.1146/annurev.energy.28.011503.163508, 2003.
Ge, Y., Solberg, S., Heal, M. R., Reimann, S., van Caspel, W., Hellack, B., Salameh, T., and Simpson, D.: Evaluation of modelled versus observed non-methane volatile organic compounds at European Monitoring and Evaluation Programme sites in Europe, Atmos. Chem. Phys., 24, 7699–7729, https://doi.org/10.5194/acp-24-7699-2024, 2024.
Goldstein, A. and Galbally, I.: Known and Unexplored Organic Constituents in the Earth's Atmosphere, Environmental Science and Technology, 41, https://doi.org/10.1021/es072476p, 2007.
Goliff, W. S., Stockwell, W. R., and Lawson, C. V.: The regional atmospheric chemistry mechanism, version 2, Atmospheric Environment, 68, 174–185, https://doi.org/10.1016/j.atmosenv.2012.11.038, 2013.
Guenther, A., Karl, T., Harley, P., Wiedinmyer, C., Palmer, P. I., and Geron, C.: Estimates of global terrestrial isoprene emissions using MEGAN (Model of Emissions of Gases and Aerosols from Nature), Atmos. Chem. Phys., 6, 3181–3210, https://doi.org/10.5194/acp-6-3181-2006, 2006.
Guenther, A. B., Jiang, X., Heald, C. L., Sakulyanontvittaya, T., Duhl, T., Emmons, L. K., and Wang, X.: The Model of Emissions of Gases and Aerosols from Nature version 2.1 (MEGAN2.1): an extended and updated framework for modeling biogenic emissions, Geosci. Model Dev., 5, 1471–1492, https://doi.org/10.5194/gmd-5-1471-2012, 2012.
Kang, Y. H., Oh, I., Jeong, J.-H., Bang, J.-H., Kim, Y.-K., Kim, S., Kim, E., Hong, J.-H., and Lee, D.-G.: Comparison of CMAQ Ozone Simulations with Two Chemical Mechanisms (SAPRC99 and CB05) in the Seoul Metropolitan Region, Journal of Environmental Science International, 25, 85–97, https://doi.org/10.5322/JESI.2016.25.1.85, 2016.
Lee, B. S. and Wang, J. L.: Concentration variation of isoprene and its implications for peak ozone concentration, Atmospheric Environment, 40, 5486–5495, https://doi.org/10.1016/j.atmosenv.2006.03.035, 2006.
Li, M., Zhang, Q., Kurokawa, J.-I., Woo, J.-H., He, K., Lu, Z., Ohara, T., Song, Y., Streets, D. G., Carmichael, G. R., Cheng, Y., Hong, C., Huo, H., Jiang, X., Kang, S., Liu, F., Su, H., and Zheng, B.: MIX: a mosaic Asian anthropogenic emission inventory under the international collaboration framework of the MICS-Asia and HTAP, Atmos. Chem. Phys., 17, 935–963, https://doi.org/10.5194/acp-17-935-2017, 2017.
Lin, C. Y., Wang, Z., Chou, C. C. K., Chang, C. C., and Liu, S. C.: A numerical study of an autumn high ozone episode over southwestern Taiwan, Atmospheric Environment, 41, 3684–3701, https://doi.org/10.1016/j.atmosenv.2006.12.050, 2007.
Metzger, A., Dommen, J., Gaeggeler, K., Duplissy, J., Prevot, A. S. H., Kleffmann, J., Elshorbany, Y., Wisthaler, A., and Baltensperger, U.: Evaluation of 1,3,5 trimethylbenzene degradation in the detailed tropospheric chemistry mechanism, MCMv3.1, using environmental chamber data, Atmos. Chem. Phys., 8, 6453–6468, https://doi.org/10.5194/acp-8-6453-2008, 2008.
Palmer, P. I., Jacob, D. J., Fiore, A. M., Martin, R. V., Chance, K., and Kurosu, T. P.: Mapping isoprene emissions over North America using formaldehyde column observations from space, Journal of Geophysical Research: Atmospheres, 108, https://doi.org/10.1029/2002JD002153, 2003.
Palmer, P. I., Abbot, D. S., Fu, T. M., Jacob, D. J., Chance, K., Kurosu, T. P., Guenther, A., Wiedinmyer, C., Stanton, J. C., Pilling, M. J., Pressley, S. N., Lamb, B., and Sumner, A. L.: Quantifying the seasonal and interannual variability of North American isoprene emissions using satellite observations of the formaldehyde column, Journal of Geophysical Research: Atmospheres, 111, https://doi.org/10.1029/2005JD006689, 2006.
Rowlinson, M. J., Evans, M. J., Carpenter, L. J., Read, K. A., Punjabi, S., Adedeji, A., Fakes, L., Lewis, A., Richmond, B., Passant, N., Murrells, T., Henderson, B., Bates, K. H., and Helmig, D.: Revising VOC emissions speciation improves the simulation of global background ethane and propane, Atmos. Chem. Phys., 24, 8317–8342, https://doi.org/10.5194/acp-24-8317-2024, 2024.
Shiu, C. J., Liu, S. C., Chang, C. C., Chen, J. P., Chou, C. C. K., Lin, C. Y., and Young, C. Y.: Photochemical production of ozone and control strategy for Southern Taiwan, Atmospheric Environment, 41, 9324–9340, https://doi.org/10.1016/j.atmosenv.2007.09.014, 2007.
Skamarock, W. C., Klemp, J., Dudhia, J., Gill, D. O., Barker, D., Wang, W., and Powers, J. G.: A Description of the Advanced Research WRF Version 3, NCAR Technical Note NCAR/TN-475+STR, National Center for Atmospheric Research (NCAR), Boulder, Colorado, USA, 113 pp., 3–27, 2008.
Stockwell, W., Middleton, P., and Chang, J.: The Second Generation Regional Acid Deposition Model Chemical Mechanism for Regional Air Quality Modeling, Journal of Geophysical Research, 951, 16343–16367, https://doi.org/10.1029/JD095iD10p16343, 1990.
Stockwell, W., Kirchner, F., Kuhn, M., and Seefeld, S.: A New Mechanism for Regional Atmospheric Chemistry Modeling, Journal of Geophysical Research-Atmospheres, 102, 25847–25879, https://doi.org/10.1029/97JD00849, 1997.
Su, Y. C., Chen, S. P., Tong, Y. H., Fan, C. L., Chen, W. H., Wang, J. L., and Chang, J. S.: Assessment of regional influence from a petrochemical complex by modeling and fingerprint analysis of volatile organic compounds (VOCs), Atmospheric Environment, 141, 394–407, https://doi.org/10.1016/j.atmosenv.2016.07.006, 2016.
Tsai, C. S., Huang, P. C., Lai, H. C., Lin, J. C., and Hung, H. M.: Addressing underestimated carbon monoxide emissions in Taiwan using CMAQ and impacts on local ozone concentration, Atmospheric Environment, 26, 100325, https://doi.org/10.1016/j.aeaoa.2025.100325, 2025.
US EPA Office of Research and Development: CMAQ (5.5), Zenodo [data set], https://doi.org/10.5281/zenodo.13883210, 2024.
von Schneidemesser, E., McDonald, B. C., Denier van der Gon, H., Crippa, M., Guizzardi, D., Borbon, A., Dominutti, P., Huang, G., Jansens-Maenhout, G., Li, M., Ou-Yang, C.-F., Tisinai, S., and Wang, J.-L.: Comparing Urban Anthropogenic NMVOC Measurements With Representation in Emission Inventories–A Global Perspective, Journal of Geophysical Research: Atmospheres, 128, e2022JD037906, https://doi.org/10.1029/2022JD037906, 2023.
Wang, J. L., Chew, C., Chang, C. Y., Liao, W. C., Lung, S. C. C., Chen, W. N., Lee, P. J., Lin, P. H., and Chang, C. C.: Biogenic isoprene in subtropical urban settings and implications for air quality, Atmospheric Environment, 79, 369–379, https://doi.org/10.1016/j.atmosenv.2013.06.055, 2013.
Wang, Y. X., McElroy, M. B., Wang, T., and Palmer, P. I.: Asian emissions of CO and NOx: Constraints from aircraft and Chinese station data, Journal of Geophysical Research: Atmospheres, 109, https://doi.org/10.1029/2004JD005250, 2004.
Wu, B. Z., Chang, C. C., Sree, U., Chiu, K., and Lo, J. G.: Measurement of non-methane hydrocarbons in Taipei city and their impact on ozone formation in relation to air quality, Analytica Chimica Acta, 576, 91–99, https://doi.org/10.1016/j.aca.2006.03.009, 2006.
Yang, K. L., Ting, C. C., Wang, J. L., Wingenter, O. W., and Chan, C. C.: Diurnal and seasonal cycles of ozone precursors observed from continuous measurement at an urban site in Taiwan, Atmospheric Environment, 39, 3221–3230, https://doi.org/10.1016/j.atmosenv.2005.02.003, 2005.
Yarwood, G., Rao, S., Yocke, M., and Whitten, G.: Updates to the carbon bond chemical mechanism: CB05 final report to the US EPA, RT-0400675, Final Report to the U.S. Environmental Protection Agency, RT-0400675, Ramboll Environ, Novato, CA, USA, 2005.
Ying, Q. and Li, J.: Implementation and initial application of the near-explicit Master Chemical Mechanism in the 3D Community Multiscale Air Quality (CMAQ) model, Atmospheric Environment, 45, 3244–3256, https://doi.org/10.1016/j.atmosenv.2011.03.043, 2011.
Zaveri, R. A. and Peters, L. K.: A new lumped structure photochemical mechanism for large-scale applications, Journal of Geophysical Research: Atmospheres, 104, 30387-30415, https://doi.org/10.1029/1999JD900876, 1999.
Zhang, Y., Vijayaraghavan, K., and Seigneur, C.: Evaluation of three probing techniques in a three-dimensional air quality model, Journal of Geophysical Research: Atmospheres, 110, https://doi.org/10.1029/2004JD005248, 2005.
Zheng, B., Tong, D., Li, M., Liu, F., Hong, C., Geng, G., Li, H., Li, X., Peng, L., Qi, J., Yan, L., Zhang, Y., Zhao, H., Zheng, Y., He, K., and Zhang, Q.: Trends in China's anthropogenic emissions since 2010 as the consequence of clean air actions, Atmos. Chem. Phys., 18, 14095–14111, https://doi.org/10.5194/acp-18-14095-2018, 2018.