the Creative Commons Attribution 4.0 License.
the Creative Commons Attribution 4.0 License.
Observational insights into atmospheric CO2 and CO at the urban canopy layer top in Metropolitan Shanghai, China
Shuang Fu
Xuemei Qing
Kunpeng Zang
Yi Lin
Shuo Liu
Yuanyuan Chen
Bingjiang Chen
Wei Gao
Martin Steinbacher
Shuangxi Fang
Major metropolitan areas are critical carbon emission hotspots, and understanding their carbon dynamics is essential for developing targeted climate mitigation strategies. Remote background stations often capture spatially smoothed anthropogenic signals, failing to resolve distinct urban source–sink processes. Here, we leveraged the unique 632 m Shanghai Tower (121.51° E, 31.23° N) to conduct a nearly 2-year field campaign (April 2021–March 2023), aiming to investigate CO2 and CO dynamic from the top of urban canopy layer (UCL) via stationary, continuous, single-level, high-precision, in situ measurements with a cavity ringdown laser spectrometer. Campaign-averaged mole fractions substantially exceeded global and regional backgrounds, confirming a pronounced urban carbon burden. Through a multi-stage filtering framework targeting nocturnal measurements, we derived robust regional background values. Component analysis of CO2 excess, using CO as a reliable regional combustion tracer, revealed burning of fossil fuels as the dominant contributor (avg. 85 %), alongside biogenic processes that enhanced this atmospheric excess, especially in winter under respiratory predominance, but less so in summer when partially offset by net photosynthetic uptake and cleaner airmass dilution. The 2022 Shanghai lockdown provided a natural experiment that underscored the pronounced sensitivity of UCL-top observations to metropolitan-scale anthropogenic perturbations, as reflected in synchronized decline and rapid rebound of CO2 and CO, along with a marked reversal of their emission ratio compared to 2021. Overall, these findings affirm that UCL-top observations effectively capture integrated metropolitan carbon signals, supporting refined emission tracking and top-down carbon neutrality strategies.
- Article
(10836 KB) - Full-text XML
-
Supplement
(3744 KB) - BibTeX
- EndNote
Carbon dioxide (CO2) is the predominant greenhouse gas (GHG) and a central focus of climate change (Rogelj et al., 2013; Zhu et al., 2019), accounting for the largest share of effective radiative forcing from all long-lived GHGs (2.29 W m−2, or 66 % of the total; AGGI, 2024). The ever-increasing worldwide reliance on fossil fuels has raised atmospheric CO2 concentrations from a pre-industrial value of 280 ppm to a historic high of 423.9 ppm in 2024 (Fu et al., 2022; Friedlingstein et al., 2022; WMO, 2025), far exceeding the proposed safe threshold of 350 ppm (Rogelj et al., 2013). Carbon monoxide (CO), beyond its direct adverse effects as an atmospheric pollutant on human health and the environment (Henry et al., 2006), acts as an indirect GHG that plays a vital role in atmospheric chemistry by serving as a major sink of tropospheric hydroxyl radicals (OH) (Lelieveld et al., 2016). The OH-initiated reactions that promote CO-to-CO2 conversion and tropospheric O3 yield (under sufficient NOx conditions) competitively deplete atmospheric OH reservoir (Crutzen, 1973; Seinfeld and Pandis, 2016), and thereby prolong the lifetime of other reducing agents, including important GHGs such as methane (CH4), leading to an indirect positive radiative forcing of 0.2 W m−2 (Forster et al., 2007; IPCC, 2023). In the recent decade, the global average mole fraction of carbon monoxide (CO) was around 90 ppb (WDCGG, 2025a) with recorded levels between 85 and 200 ppb at background stations in East-Asia (Patel et al., 2024). The efficacy of CO and CO2 as co-tracers in pinpointing combustion sources and atmospheric processes (Bond et al., 2004; Kamal et al., 2024) necessitates an in-depth investigation into their concurrent footprint patterns and underlying drivers, particularly in regions with high fuel demand and a stringent clean-air imperative.
As the world's largest GHG emitter, with cities accounting for a large share of direct carbon emissions (Tong et al., 2018; Meng et al., 2025), China is under mounting international scrutiny in light of its commitment to achieve carbon neutrality by 2060 (CNCA, 2020). Supporting this goal, China has been deploying an extensive urban and suburban carbon monitoring network (comprising over 100 stations across more than 30 cities) to complement its WMO/GAW-affiliated background stations, namely one global background station (Waliguan, WLG) and seven regional background stations (WDCGG, 2025b). Although these background stations are primarily located in remote areas, a direct outcome from this monitoring infrastructure is that the data tend to represent blended, regionally-smoothed signals that are often contaminated by ground-based influences (Fang et al., 2015b; Liu et al., 2019; Chen et al., 2024). To extract regionally representative data with minimal local emission influence, a variety of filtering methods have been developed. These range from simple statistical thresholds (e.g., the 1st or 5th percentiles) (Wang et al., 2010; Ye et al., 2024) to more principled approaches including the Robust Extraction of Baseline Signal (REBS) (Ruckstuhl et al., 2012) and Standard Deviation of Running Mean (SDM) (Tsutsumi et al., 2006), diurnal patterns (Yuan et al., 2018), meteorological filtering (MET) (Fang et al., 2014), and the use of specialized tracers such as CO (Tsutsumi et al., 2006; Wang et al., 2010), black carbon (Pu et al., 2014), radon-related (Brunke et al., 2004), and CH4 (Fang et al., 2015b) for filtering CO2, which are described in detail on previous publications (Fang et al., 2015b; Liu et al., 2019). Nevertheless, it can be inferred from these limitations that even after filtering, background data from the lower atmosphere remain compromised by near-surface interference, while those from suburban mountaintops are likewise affected by plant canopy dynamics, both of which can consequently obscure real anthropogenic source–sink signals. Furthermore, it is imperative to move beyond solely quantifying background levels and decipher underlying source–sink dynamics. This expanded focus contributes to a robust, top-down understanding that underpins targeted carbon control strategies, particularly in advanced metropolitan areas with strategically deployed observational infrastructure.
The flow over urban areas within the planetary boundary layer (i.e., the urban boundary layer, UBL) is intensified by the urban heat island effect, generating a heat dome that deepens the boundary layer, enhances turbulence mixing, and complicates wind patterns compared to rural surroundings (Oke, 1976; Cosgrove and Berkelhammer, 2018). Conceptually, the UBL consists of several dynamical sublayers (Wang et al., 2014; Vega et al., 2019): the urban canopy layer (UCL), characterized by highly complex flows governed by the geometry of building and vegetation canopies; the roughness sublayer (RSL), a transitional zone extending 2–5 times the mean building height (Hb; Arnfield, 2003), in which turbulence develops and progressively homogenizes the flow; the surface layer (SL), with nearly constant fluxes and logarithmic wind profile; and the mixed layer, where fluxes and scalars exhibit vertical uniformity. Conventional near-surface observations, typically conducted within the lower UCL, struggle to represent city-scale emissions due to strong hyperlocal influences. In contrast, the world's tallest towers far exceed Hb and allow access to the UCL top and even penetrate the overlying RSL. Thus, stationary measurements are possible at an elevation less affected by transient, hyperlocal sources (e.g., a single vehicle), yet still sensitive to the integrated urban anthropogenic footprint. Although such elevated sites hold promise for capturing metropolitan-scale GHG signals and bridging the gap between ground sources and regional background, their deployment on super-tall skyscrapers remains limited globally.
Shanghai, the largest metropolitan representative in the Yangtze River Delta (YRD) region, China, covers 6340.5 km2 with a permanent population of 24.9 million and total GDP of CNY 4.32 trillion in 2021, making it a carbon emission hotspot (Fig. 1a). This study utilizes the unique Shanghai Tower site (SHT; Fig. 1b), a 632 m skyscraper-based platform situated at the UCL top in Shanghai's Lujiazui financial district, to investigate CO2 and CO dynamics in a megacity environment through a nearly 2-year continuous campaign (April 2021–March 2023). Through a combination of multi-scale analytical approaches, including robust background filtering and the use of CO as a tracer for fossil-derived CO2, we quantify the urban carbon burden and identify its key drivers. Moreover, this study capitalizes on the unprecedented natural experiment created by the COVID-19 lockdown and subsequent recovery period in Shanghai to examine the environmental implications of drastic changes in human activity on urban carbon loadings and combustion efficiency. In general, by elucidating the characteristics, composition, and dominant factors governing CO2 and CO levels from this strategic vantage point directly over the urban core, this study aims to provide several scientific insights that inform targeted carbon mitigation in megacities across China and other rapidly urbanizing regions worldwide.
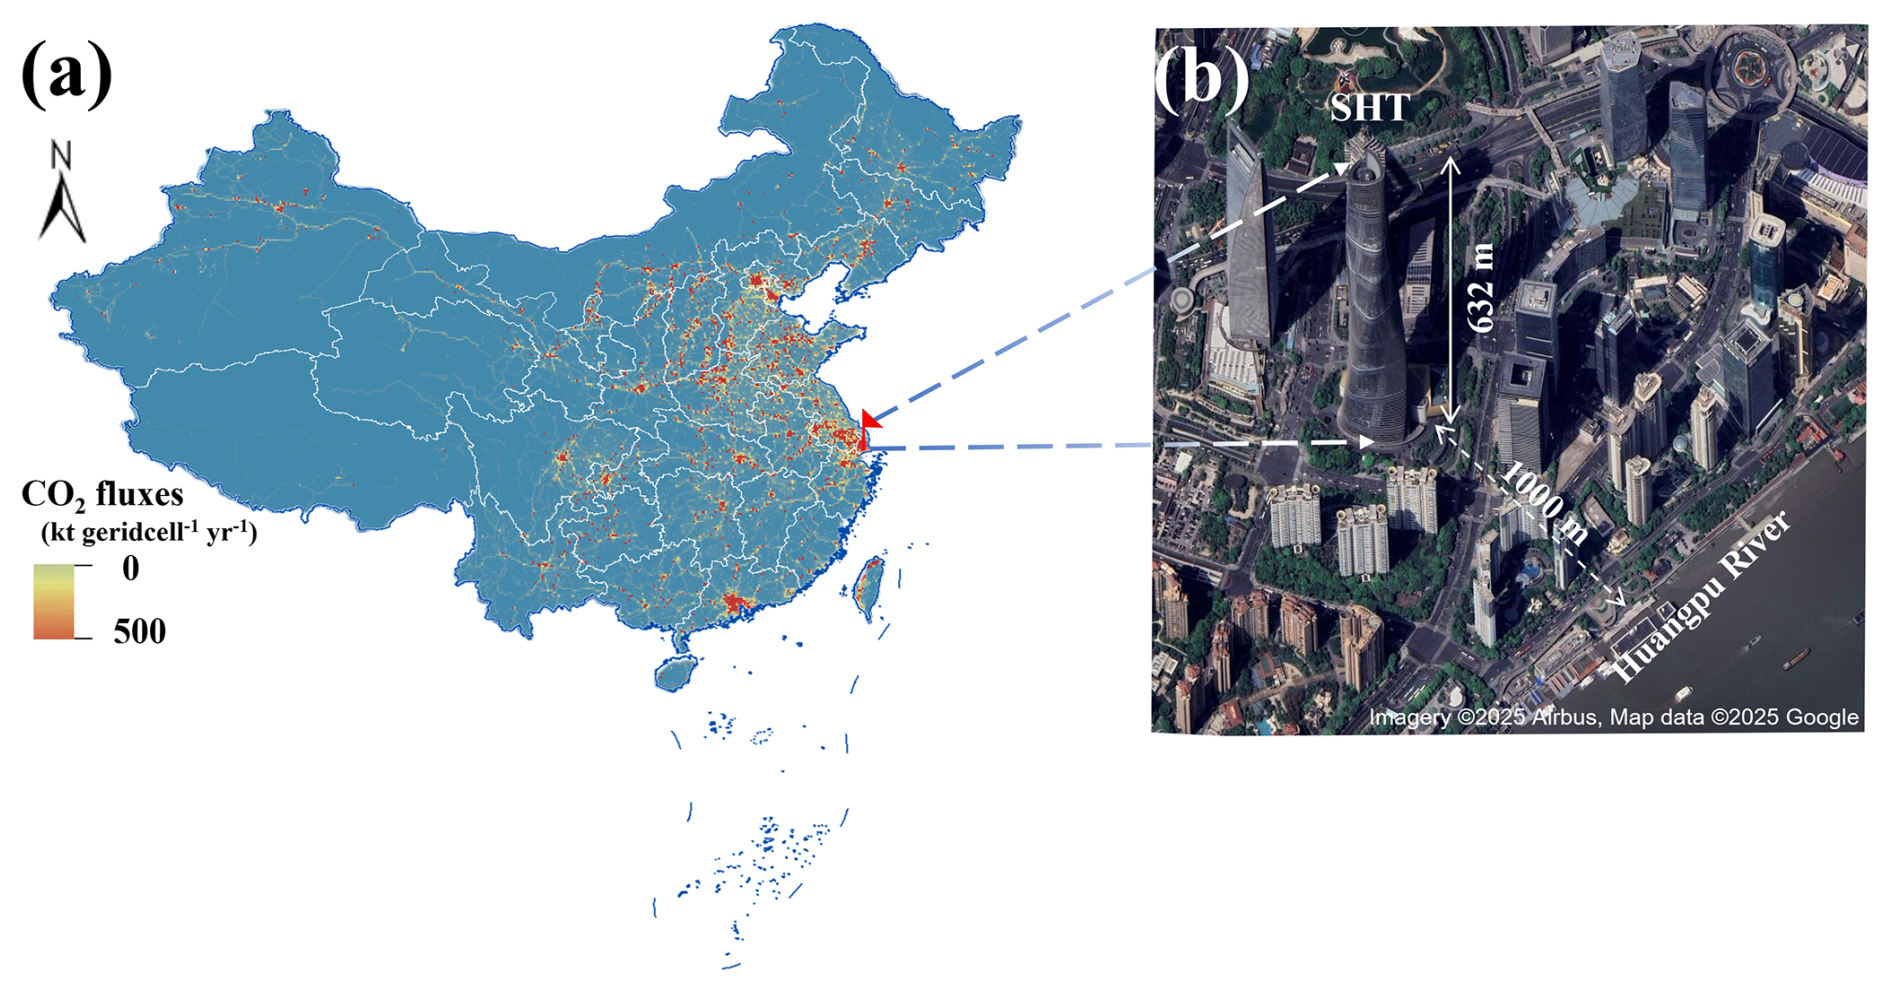
Figure 1Location and terrain of the Shanghai Tower (SHT) site. (a) Spatial distribution of CO2 fluxes in 2021 (CO2 flux data: Emissions Database for Global Atmospheric Research (EDGAR), https://edgar.jrc.ec.europa.eu/, last access: 18 October 2025; base map: National Earth System Science Data Center, https://www.geodata.cn, last access: 10 September 2023). (b) Surrounding area of the SHT site (Imagery © 2025 Airbus, Map data © 2025 Google).
2.1 Locations and field observations
Continuous in situ CO2 and CO measurements were conducted from 17 April 2021 to 6 March 2023 (a period of nearly two years) at the Shanghai Tower (SHT, 121.51° E, 31.23° N), an urban GHG monitoring site erected atop the world's second-tallest skyscraper. The sampling inlet was positioned at 632.0 m above ground level (a.g.l.); with the tower base at 5 m above mean sea level (a.m.s.l.), this corresponds to approximately 637 m a.m.s.l. This campaign yielded high-precision, in situ data on CO2 and CO levels at the UCL top in metropolitan Shanghai, a key carbon emission hotspot in China (Fig. 1a). As shown in Fig. 1b, the site is situated within the densely urbanized Lujiazui Financial and Commercial District, where it is encircled by roads and high-rise buildings and lies adjacent to the Huangpu River, Shanghai's most vital and busiest shipping artery, thereby being significantly affected by human activities.
2.1.1 CO2 and CO Field Campaigns
The SHT-based field campaign for CO2 and CO observation employed stationary, continuous, single-level, high-precision, in situ measurements via an analytical system equipped with Wave Scan Cavity Ring-down Spectroscopy (WS-CRDS) analyzer (G2401; Picarro Inc., Santa Clara, CA, USA), following a methodology analogous to that described by Fang et al. (2013, 2015a) and implemented in Chen et al. (2024). During this observation, air samples were drawn using a vacuum pump (N022, KNF Neuberger, Germany), with the sampling inlet extending from a 4 m2 platform on the tower's uppermost accessible floor (132nd) up to the full structural summit of the Shanghai Tower at 632 m a.g.l. (corresponding to 637 m a.m.s.l.). This elevation is significantly higher than the highest observation deck open to the public (118th floor, ∼ 550 m a.m.s.l.), and therefore immediate anthropogenic interference there can be considered negligible. The sample stream first passed through a three-stage self-assembled filter to remove particulate matter, and was then delivered to a glass trap immersed in a methanol bath at −50 °C (Xiong et al., 2022), where it was dried to a dew point of approximately −35 °C to reduce the influence of water vapor, followed by temperature equilibration and pressure adjustment prior to analysis. Therefore, the measurements on atmospheric CO2 and CO were their mole fractions in dry air, and specific calibration procedures are detailed in a previous study (Fang et al., 2014). In brief, the instrument was calibrated daily using two standard gases with high and low concentrations (WH and WL) to establish a two-point linear calibration, while system performance was checked every 6 h using a target gas (T) with a known concentration. All standards used in the campaign are linked to the WMO-CO2_X2019 scale for CO2 and WMO-CO_X2014A scale for CO. Accounting for a ∼ 1 min stabilization period after flushing the internal volume (Fang et al., 2016), an average over the subsequent stable 4 min interval was used for instrument calibration. The measurement precision (1σ over 5 min) derived from repeated target gas measurements was approximately 0.06 ppm for CO2 and 1.0 ppb for CO during the observation period (Fig. S1 in the Supplement), with accuracy meeting WMO/GAW compatibility goals (GGMT, 2024). For clarity in presentation, data were subsequently processed into 10 min or 1 h averages (see Figs. 2 and 3). In addition, comparative observations were conducted simultaneously from April 2021 to December 2022 at a high-altitude background site (Damingshan, DMS, 119.00° E, 30.01° N; 1489.9 m a.m.s.l.) in the YRD region, where the measurement and quality control protocols for CO and CO2 mole fractions were consistent with those at the SHT site.
2.1.2 Additional Environmental Data
Ground-based supplementary measurements, synchronized with the SHT-based observation periods, were obtained from two stations in Shanghai: (i) China's air quality monitoring station of Baoshan Miaohang (BSMH; 121.43° E, 31.33° N; 12–15 m a.g.l.; 5.6 km from SHT), which provided criteria gaseous pollutants (NO2, SO2, CO, and O3; 1 h intervals) measured by a series of Thermo Scientific instruments (42i, 43i, 48i, and 49i, respectively); and (ii) the Baoshan Meteorological Station (BS; 31.23° N, 121.29° E; 1.5 m a.g.l.; 20.9 km from SHT), where meteorological parameters were recorded at 3 h intervals (temperature, pressure, wind direction (wd), wind speed (ws)) and 6 h intervals (cumulative rainfall), as displayed in Fig. S1. Additionally, reanalysis data of the planetary boundary layer height (PBLH) at the SHT site were derived from the European Center for Medium-Range Weather Forecasts (Copernicus Climate Change Service, 2025). For detailed data sources and dataset, refer to section Data Availability.
2.2 Model simulation and apportionment
Considering the high wind speeds (ca. 11.5 m s−1) at the SHT top (637 m a.m.s.l.) and the aerodynamic effects of its 120° spiral facade (Zhao et al., 2011), the measurement point can be reasonably inferred to lie near the urban roughness sublayer (RSL), where turbulence initiates the homogenization of urban flow. For determining background CO2 and CO level ([CO2, bk] and [CObk]), previous studies have employed tracer analysis related to the 5 % lower value of CO (Wang et al., 2010), or data screening focused on intense vertical mixing around noon, (e.g., 10:00–16:00 local time (LT); Fang et al., 2017, 2022). However, during this campaign, noontime tower-top measurements may be subject to the upward transport of local anthropogenic emissions (see details in Sect. 3.2), as suggested by the PBLH variations (daytime: 728 ± 389 m; nighttime: 290 ± 222 m vs. SHT Top of 637 m; Fig. 2). Thus, to derive regional CO2, bk and CObk amplitudes, we preferentially selected stable nocturnal hours (22:00–05:00 LT) during which the sampling height (SHT top) remained above the urban boundary layer. The procedure for excluding data influenced by local emissions or advected pollution is detailed in Sect. 3.3. The excess CO2 concentration relative to its background level, expressed as [CO2, ex], can be further decomposed as follows:
where [CO2] is the measured dry-air CO2 mole fraction (ppm); [CO2, bk] represents the background CO2 level determined by the filtering method (Sect. 3.3); [CO2, ff] denotes the CO2 increment attributed to fossil fuel combustion; and [CO2, bio-dominated] is the increment dominated by biological processes (positive for net respiration, negative for net photosynthesis). TH and TV stand for the residual influences of horizontal and vertical transport impacts on the observed CO2 level, respectively. In practice, the CO2, bio-dominated term may partially encompass effects attributed to TH and TV.
To understand the probable transport pathways of air masses arriving at the SHT site, we analyzed back trajectories using the Hybrid Single-Particle Lagrangian Integrated Trajectory (HYSPLIT) dispersion model from the National Oceanic and Atmospheric Administration Air Resources Laboratory (NOAA ARL). The calculations were based on gridded meteorological data from the Global Data Assimilation System (GDAS) provided by the National Centers for Environmental Prediction (NCEP). Specifically, MeteoInfo software (version 3.3.12) combined with NCEP/GDAS reanalysis data (ftp://arlftp.arlhq.noaa.gov/pub/archives/gdas1, last access: 25 October 2025, 1° × 1°; Rousseau et al., 2004) was used to calculate 72 h back trajectories with 1 h intervals. Trajectories for each season were computed with an arrival height of 600 m a.g.l., corresponding closely to the sampling inlet height at the SHT site. The spatial source distributions of CO2 and CO were then analyzed using Potential Source Contribution Function (PSCF) method. This method identifies potential source areas by calculating the conditional probability that a measured concentration exceeds a predefined threshold (e.g., the seasonal mean; see Table S1 in the Supplement) when an air mass resides over a particular grid cell (Polissar et al., 1999). In the PSCF model, the geographical area covered by the trajectory was divided into grid cells with a spatial resolution of 0.5° × 0.5°. The PSCF value for a given cell (i, j) is defined as:
where nij represented the number of trajectories endpoints passing through the ij unit, and mij represented the number of trajectories endpoints causing atmospheric CO2 and CO values to exceed the threshold.
To reduce the influence of nij outliers, a weight function Wij was applied to obtain a weighted PSCF (WPSCF):
Additionally, to evaluate the influence of local surface wind on species concentrations, we employed the polarPlot function from the OpenAir package in R (Carslaw and Ropkins, 2012; Carslaw, 2019), which uses smoothing techniques to generate bivariate polar plots, depicting pollutant concentration as a continuous surface over ws and wd. The conditional probability function (CPF) was also applied to identify specific wind sectors with a high probability of being associated with elevated concentrations.
3.1 Overview of the Observations
Figure 2 displays the time series of CO2 and CO mole fractions measured at the SHT top, alongside ground-level measurements of O3, NO2, SO2, and COgl (from the nearby BSMH station) and simultaneous records of rainfall (at BS station) and PBLH (reanalysis data) over the 2-year campaign from April 2021 to March 2023. Additional meteorological parameters, including surface wind, atmospheric pressure, temperature, and dew point, are presented in Fig. S2. Throughout the campaign, CO2 mole fractions exhibited significant variability, with the 5 min records changing in the range of 362.1–783.7 ppm (388.3–536.5 ppm after 1 h smoothing) and campaign-averaged values (±95 % CI) of 433.50 ± 0.33 ppm. Meanwhile, tower-based 5 min CO mole fractions varied considerably from 58.7 to more than 4000 ppb (60.0 to approximately 2000 ppb after smoothing), with an overall average of 313.59 ± 4.91 ppb. Focusing on CO2, a crucial GHG contributor, Table S1 summarizes CO2 values measured at various observation sites from recent reports and studies. Generally, the CO2 measurement conducted at the SHT site was significantly higher than that of a comparable elevation (e.g., Akedala: 420.2 ± 1.4 ppm; 563.3 m a.m.s.l.; KRE: 427.05 ± 0.64; 534 m a.m.s.l.) and those recorded at high-altitude stations (including LLN, WLG, MLO, JFJ, ABLECAS, TPB, TOH and DMS: ca. 417–428 ppm; above 1000 m a.m.s.l.), whether based on mountains or tower platforms that are situated in global/regional background settings, and also substantially exceeded the global average value of 416.8 ± 0.20 ppm (in 2021–2022; Table S1). Notably, while elevated, the SHT-based CO2 value remained appreciably lower than those observed at nearby near-ground sites (e.g., ca. 441.6–446.5 ppm at LAN and HZ site, reported by Chen et al., 2024), where CO2 levels are strongly influenced by local anthropogenic emissions. Similarly, the CO value at SHT site was also elevated above regional background level (233.4 ± 3.8 ppb at DMS by Lin et al., 2025) in the YRD region. These results suggest a distinct surplus of both CO2 and CO at the UCL top in this highly-urbanized megacity, likely stemming from strong local/regional influences and underscoring the need for further investigation.
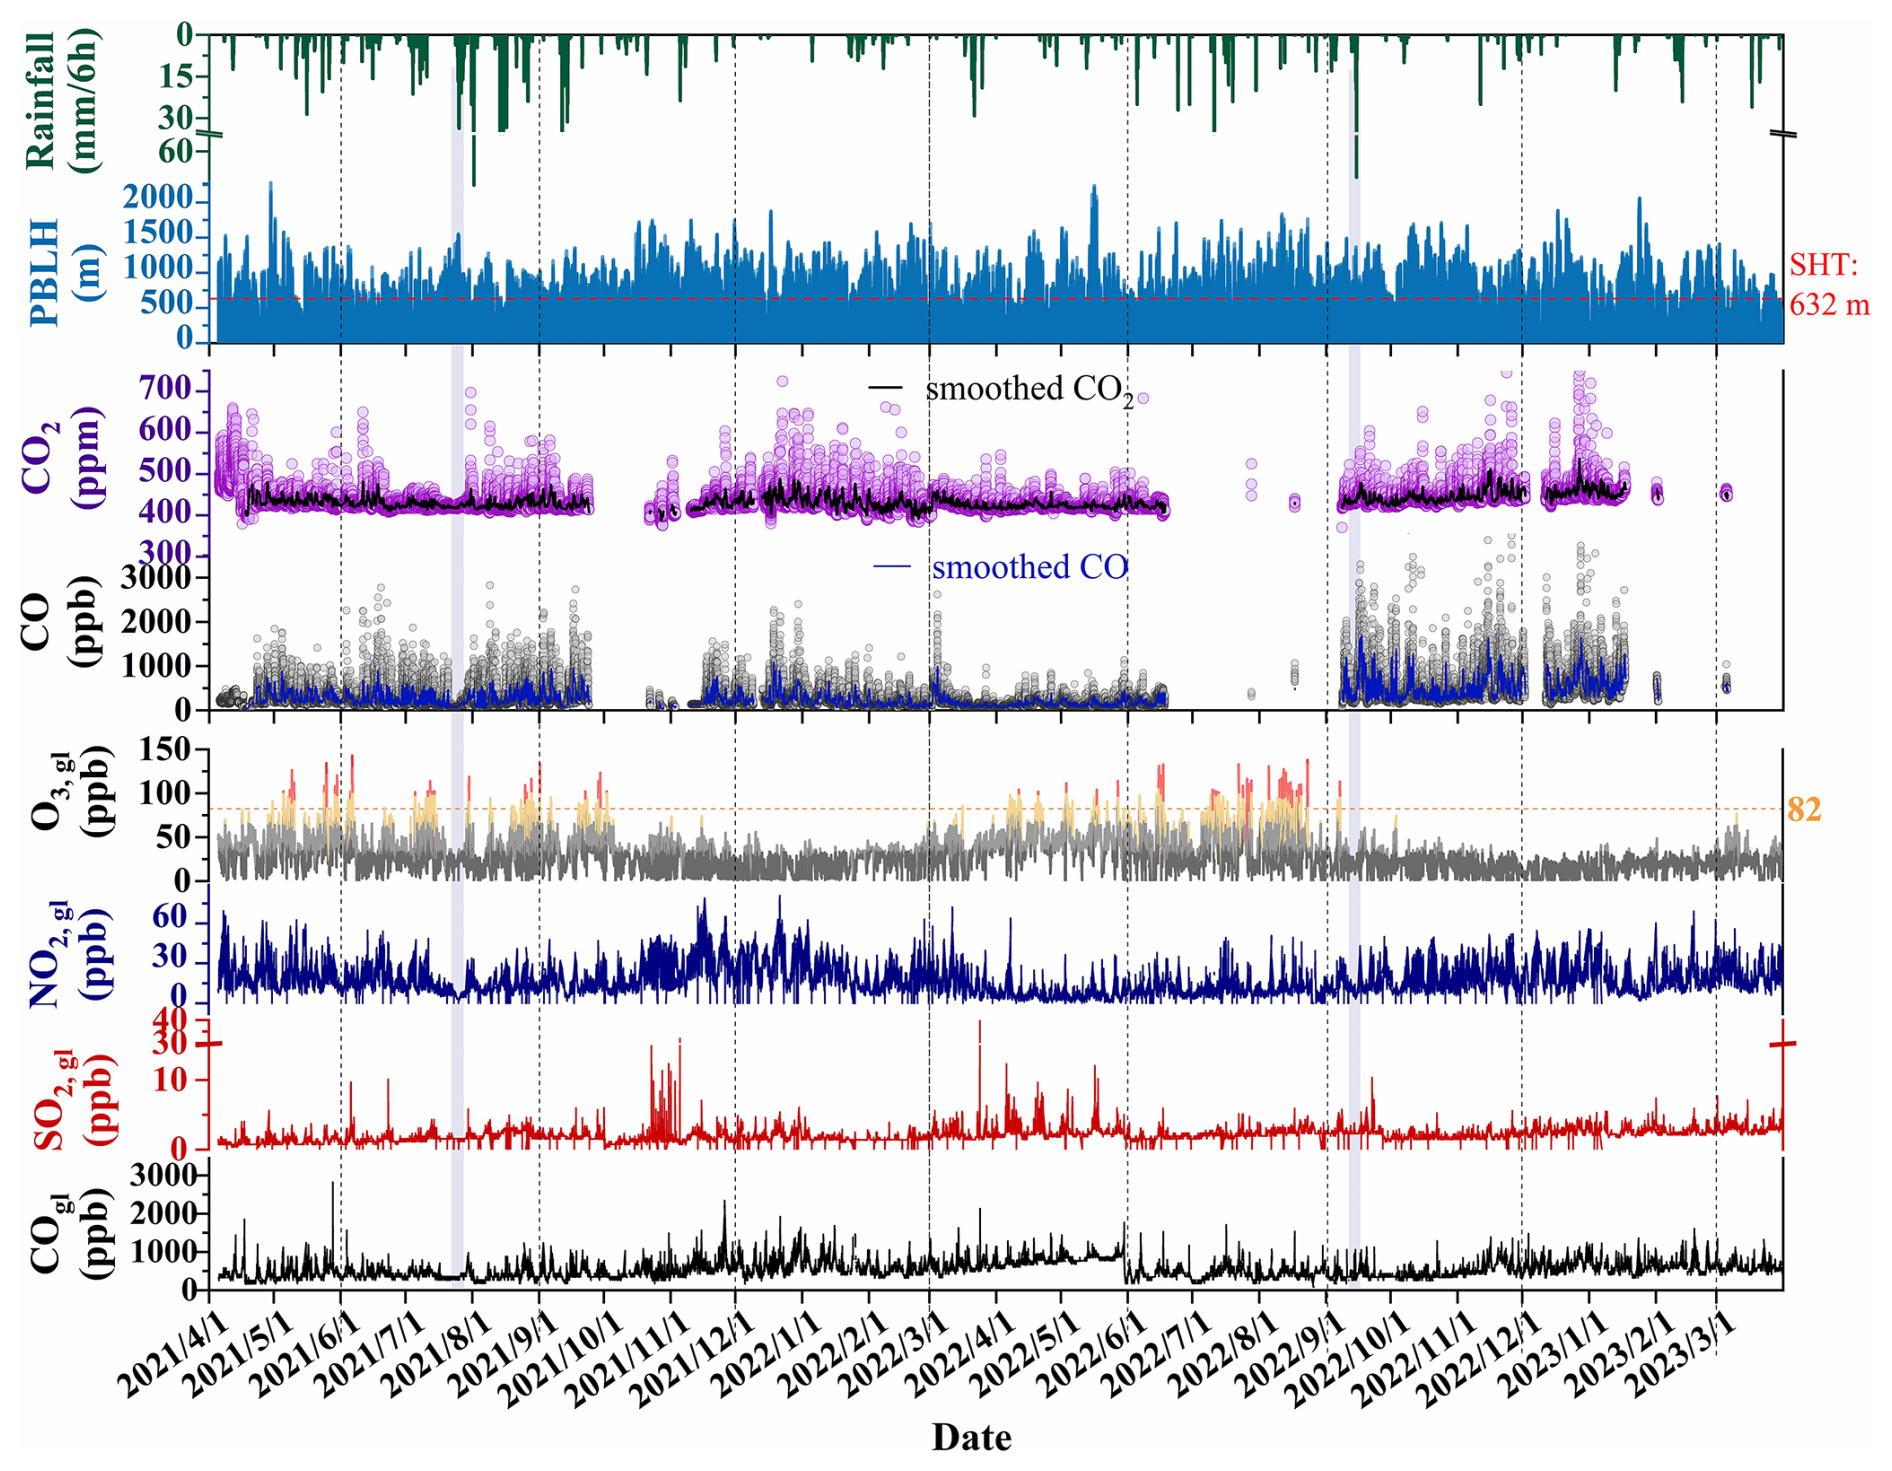
Figure 2Time series of the key atmospheric species and meteorological parameters during the 2-year campaign from April 2021 to March 2023. The presented dataset includes: CO2 and CO mole fractions measured at the top of Shanghai Tower (SHT; 121.51° E, 31.23° N; sampling at 632 m a.g.l.); hourly ground-level gaseous species of O3, NO2, SO2, and COgl obtained from a nearby ground-based observation station (BSMH; 5.6 km from SHT); rainfall data from a separate meteorological station (BSM; 20.9 km from SHT); and hourly reanalyzed planetary boundary layer height (PBLH) at the SHT site. The time series of tower-top CO2 and CO are presented as 10 min averages, with smoothed curves generated at 1 h intervals using the curve-fitting method described by Thoning et al. (1989). Pale blue shaded areas indicate typhoon events (25–26 July 2021 and 14–15 September 2022). Intermittent data gaps occurred during the campaign, mainly due to logistical disruptions (e.g., standard gas shortages) and restricted site access.
It is noteworthy that Shanghai experienced contrasting meteorological conditions and anthropogenic lockdowns during the campaign. In 2021, it received exceptionally high precipitation (1228.2 mm during April–December), influenced by typhoons (e.g., Typhoon In-Fa in July; Wang et al., 2023; Fig. 2), flood seasons, and plum rains; whereas in 2022, it was recorded significantly lower and unevenly distributed rainfall (870.6 mm, a 38-year low, including Typhoon Muifa in September; Lin et al., 2024), alongside epidemic-related lockdowns (Sect. 3.5). Interannual variability in CO2 was modest (430.94 ± 0.19 ppm in 2021 vs. 433.89 ± 0.15 ppm in 2022), whereas CO was markedly lower in 2021 (290.23 ± 1.88 ppb vs. 313.77 ± 2.26 ppb). This contrast intensified during typhoons, which brought strong winds, heavy rainfall, a sharp V-shaped pressure drop, and cooling (Fig. S2). Specifically, under Typhoon In-Fa, CO decreased by 121.76 ppb (a reduction of 53.4 %), compared to a decrease of only 4.2 ppm (0.98 %) for CO2; and during Typhoon Muifa, CO dropped by 246.14 ppb (45.5 %) vs. 2.9 ppm (0.67 %) for CO2. Concurrently, ground-level reactive species (such as O3, NO2, and SO2; Fig. 2) exhibited scavenging behavior consistent with that of CO. These results underscore that short-term meteorological perturbations exert a much weaker influence on CO2 than on CO, reflecting their divergent atmospheric lifetimes and chemical reactivity. Beyond meteorological factors, the interannual variability also reflects differences in regional anthropogenic emissions. In 2021, extensive lockdowns across regions upwind of Shanghai – particularly the North China Plain and central China – substantially suppressed anthropogenic mobile source emissions, contributing to a lower background. Given its elevated location, the SHT site was particularly sensitive to this reduction, capturing the long-range transport signal from distant upwind regions more effectively than surface sites. In contrast, by late 2022, following Shanghai's prolonged citywide lockdown (March–June 2022) and subsequent nationwide relaxation of COVID-19 restrictions, anthropogenic emissions had rebounded. These emission differences, together with the distinct meteorological conditions noted above, shaped the observed pronounced interannual CO pattern at the elevated SHT site.
Unlike the chemically inert CO2, CO has a relatively short atmospheric lifetime (τCO, ∼ 1–3 month; Zheng et al., 2019), governed primarily by OH-initiated oxidation; and its sources are dominated by ground incomplete combustion and, to a lesser extent, the oxidation of CH4 and biogenic hydrocarbons (Ehhalt and Rohrer, 2009; Seiler, 2010). During this campaign, its diurnal cycles observed at the tower top displayed clear non-uniform distributions, also indicative of near-surface influence (further discussed below). To explore local effects, it is necessary to isolate the regional background signal from the tower-top measurements. Prior to that, vertical CO variations between tower top and base provide a practical perspective for assessing near-surface influences, as discussed in Sect. 3.2.
3.2 Temporal Dynamics of Tower-top Measurements Response to Upward Urban plume
Figure 3 illustrates diurnal profiles of tower-top CO and CO2 alongside ground-level primary pollutants (including COgl) throughout the entire campaign and across different seasons. Monthly cycles for species/parameters are provided in Fig. S3. Both CO2 and CO exhibited a relatively consistent bimodal pattern, while in terms of CO, its ground mole fraction (avg. 543.11 ppb) was substantially higher and more variable than that (avg. 313.59 ppb) observed at the tower top. In addition, the initial peak at the tower-top occurred around 10:00–11:00 LT (ca. 443.33 ppb for CO and 438.04 ppm for CO2), lagging the ground peak (e.g., ca. 584.71 ppb for COgl; 08:00–09:00 LT) by about 2 h. The UBL uplifts rapidly in the morning, surpassing the SHT top from ca. 09:00–10:00 LT, and remained above it until around 17:00 LT. Accordingly, the intense vertical turbulence during these hours enhanced an upward mixing of gaseous species such as CO, leading to a smaller concentration difference between the tower base and top (CO vs. COgl), especially on summer and autumn afternoons. In the evening, rush-hour traffic emissions produced a second peak in ground-level CO and tower-top CO2 at around 19:00 LT, comparable to the morning spikes despite slight declines of 2.3 % and 0.2 % (Fig. 3a). In contrast, the secondary peak in tower-top CO occurred earlier (∼ 17:00 LT) and was significantly weaker, showing a −19.2 % decrease compared to the first one. This pronounced attenuation was likely due to limited replenishment of air masses at the elevated measurement site following the onset of atmospheric subsidence and the PBLH falling below the tower height. At night, CO2 and CO measurements at the SHT site (UCL top; above urban PBLH, ca. 329.5 ± 246.2 m; Fig. S3) were largely free from ground influence, contrasting with the near-surface accumulation of pollutants in the stable nocturnal layer, a pattern consistent with previous hierarchical tower observations that also recorded limited nighttime concentration variability at upper levels (Denning et al., 2008; Winderlich et al., 2014). This vertical decoupling also aligns with tethered-balloon-based observations, which indicated that the impact of surface emissions on atmospheric carbon was mostly restricted to the lower atmosphere (0–1 km), even to below 300 m (Li et al., 2014; Liu et al., 2025). Consequently, measurements taken at or approaching the PBL top can provide a more representative estimate of regional carbon emission characteristics, and reduce the uncertainty in source rates (Kondo et al., 2006; Wang et al., 2006; Han et al., 2009). However, it is worth noting that, in contrast to the diurnal cycles observed at background tall towers (e.g., KRE; Fig. S4), the SHT-based measurements from an elevated urban core site were subject to pronounced daytime urban emissions, whereas the nighttime data remained more representative of regional surface flux influences. In this context, tower-top nocturnal measurements at SHT site were considered suitable proxies for the regional background, as detailed in Sect. 3.3 alongside the specific filtering criteria.
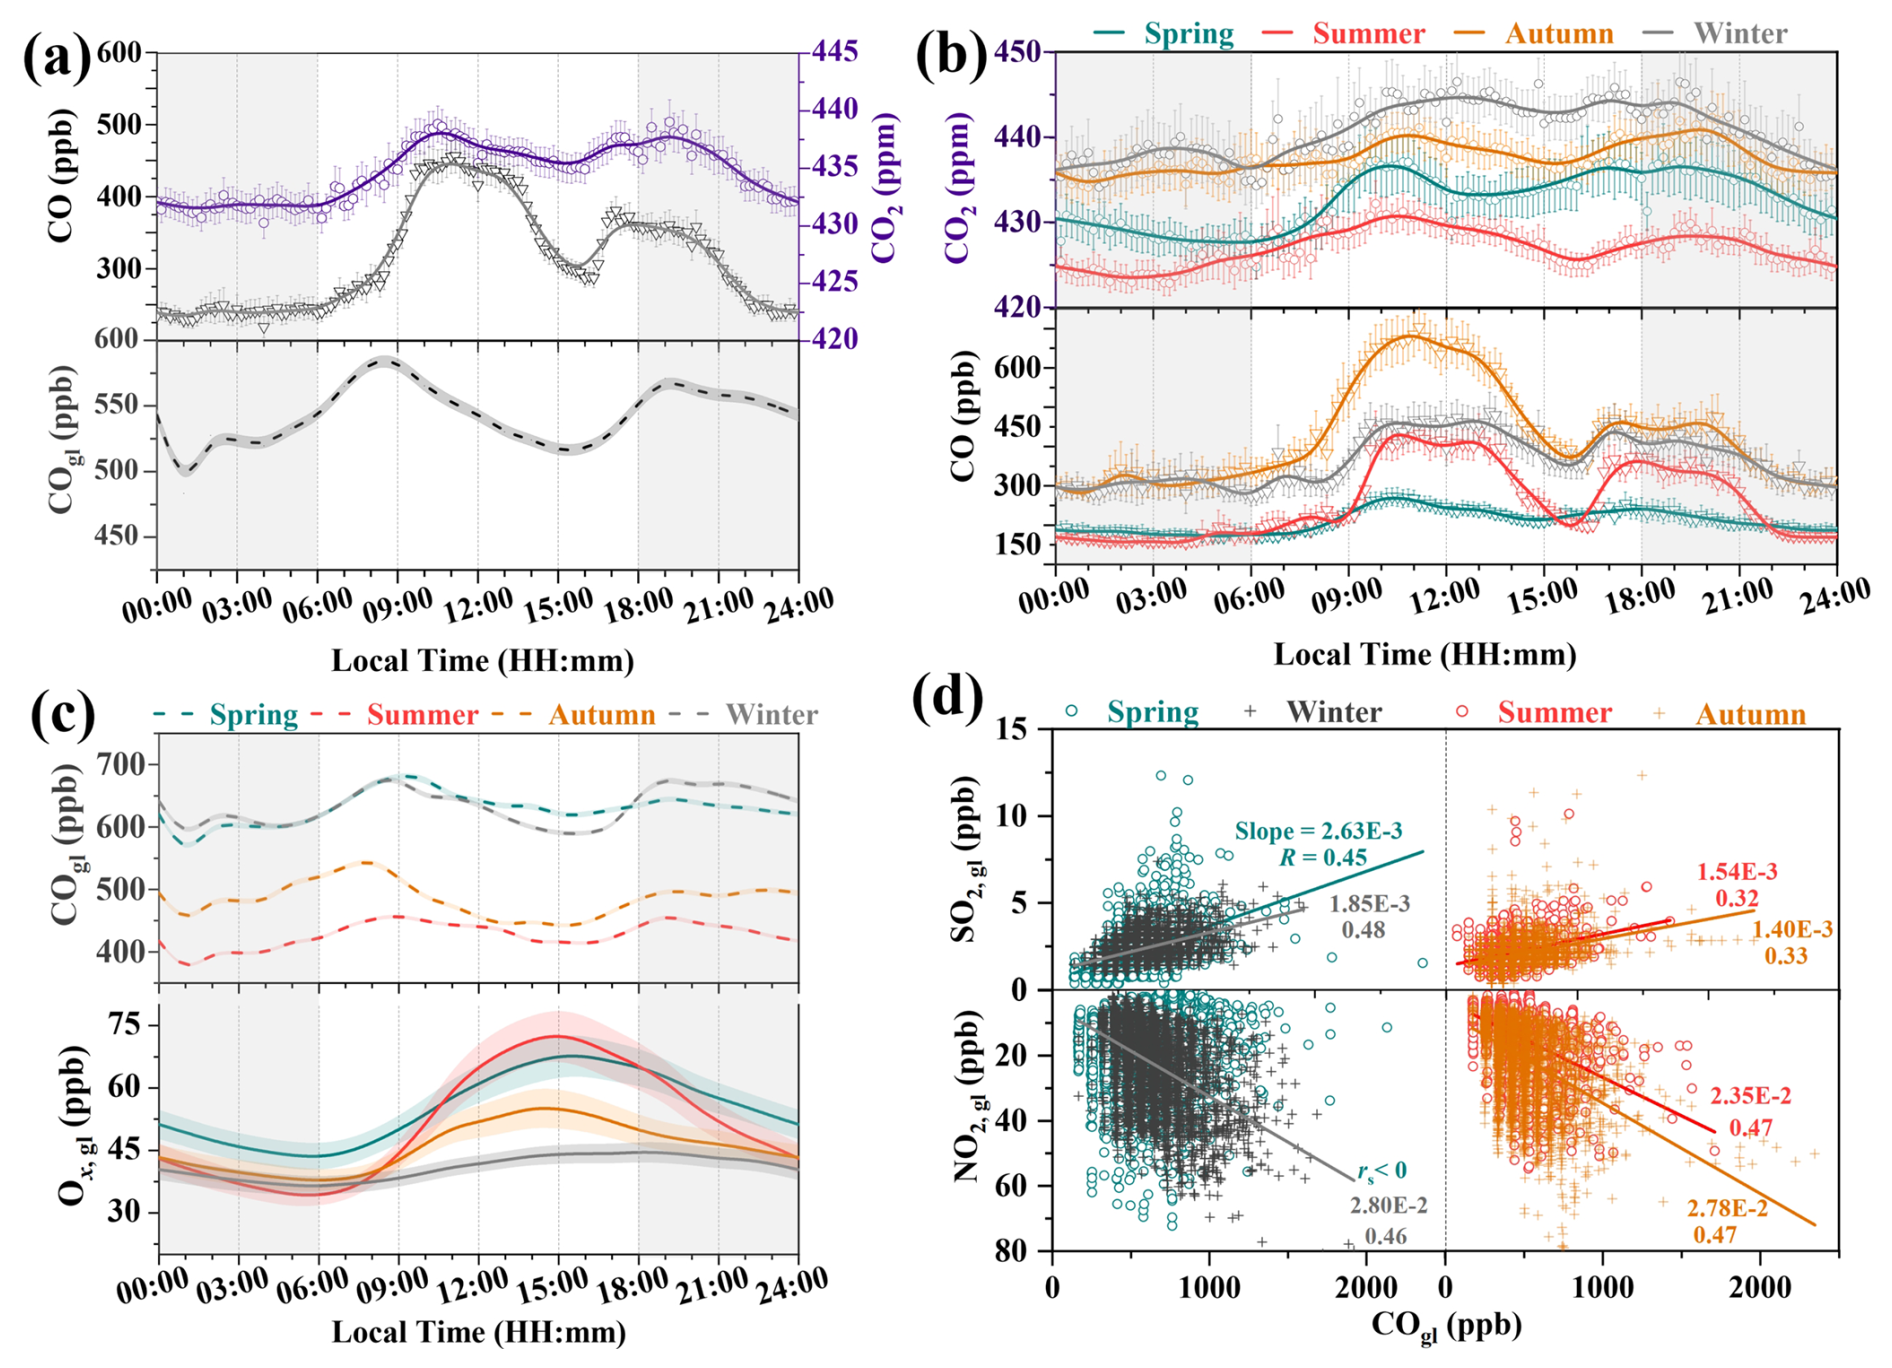
Figure 3Diurnal profiles of tower-top CO and CO2 and their relationships with ground-level species across seasons. Panels (a) and (b) show 10 min average tower-top CO and CO2 mole fractions with confidence intervals (95 % CI) in circles and inverted triangles with error bars. In panels (a)–(c), the curves with shaded areas display 1 h means and corresponding 95 % CI; the unshaded interval in the middle of the day cycle corresponds to daytime, whereas flanking grey shaded periods indicate nighttime (roughly 18:00–06:00, LT). Panel (d) presents the correlations of ground-level primary pollutants (SO2 and NO2 vs. CO; d), based on 1 h data.
In addition, Fig. 3a and b present diurnal comparisons between tower-top 10-min observations and the unified hourly values. Despite the absence of real-time CO2 vertical gradient measurements in this campaign, its variation can be inferred to be smaller than that of CO (even in daytime), owing to its chemical stability and high background abundance. The reactive species CO was also analyzed in relation to variations in co-located ground-level pollutants. The unimodal diurnal cycle of odd oxygen (Ox = NO2 + O3; Fig. 3c), an index of photochemical oxidation capability (Lin et al., 2021), featured elevated concentrations during daytime photochemical hours that potentially intensified CO depletion, particularly during May–August (Fig. S3). Temporal variations in the correlations between CO and SO2 (a tracer of coal combustion (Li et al., 2006)) and NO2 (a byproduct of fuel combustion, particularly traffic-related; Allen et al., 2013) implied distinct emission regimes (Fig. 3d). In the warmer summer and autumn months, CO showed a stronger correlation with NO2, underscoring the influence of traffic-related sources. In contrast, the tighter CO–SO2 association in cold seasons was a possible reflection of sulfur-containing industrial coal combustion. Despite the limited coal combustion and biomass burning for cooking and heating in urban Shanghai, the elevated wintertime concentrations observed in the study region were likely attributable to the widespread use of these fuels in the upwind North China regions (Liu et al., 2016; Zhang et al., 2022).
The observed CO top-base difference (Fig. S5) indicated upward transport (TV) of an urban plume driven by daytime turbulence, and this effect was potentially reinforced during autumn noontime as high CO levels at the tower top coincided with deeper PBLH, particularly in October (Fig. S3). Moreover, the SHT site appeared to be affected by horizontal transport (TH) within the lower troposphere (up to 700 hPa), especially from the northwest upwind direction where autumn crop residue burning remains active (Wang et al., 2019), despite the long-standing prohibition of open straw burning in Shanghai (Tian et al., 2022). As an elevated site within a coastal metropolis, SHT is subject to pronounced sea–land breeze circulations, the periodic nature of which significantly complicates pollutant transport and dispersion (Huang et al., 2025). Accordingly, we analyzed 24 h back trajectories from three representative time periods (morning and evening rush hours, and the stable nighttime period; Fig. S6), as well as 72 h trajectories and their associated cluster concentrations (Fig. 4) at the SHT site across seasons. Regarding diurnal cycles, CO2 and CO levels were primarily influenced by air masses from the eastern coastal areas and by urban plumes passing through the regions of Jiangsu, Anhui, and Zhejiang. In contrast, higher loads of CO and CO2 at the SHT receptor site in winter were consistently linked to 3 d aged plumes from inland North China, indicating a greater influence from distant anthropogenic sources driven by land breeze. The sea breeze effect was most pronounced in autumn, with the vast majority of air masses arriving at the SHT site within 24 h being driven by sea breeze (Fig. S6c), broadly consistent with recent findings by Huang et al. (2025). Notably, summertime patterns were characterized by a stronger influence from sources within the YRD region and by sea breeze extending toward the eastern sea area, accompanied by smaller vertical height variations. Furthermore, these anthropogenic impacts were more pronounced on weekdays, as supported by elevated diurnal concentrations of CO and CO2 (ca. +5.66 ppb and +1.48 ppm, respectively; Fig. S7) compared to weekends.
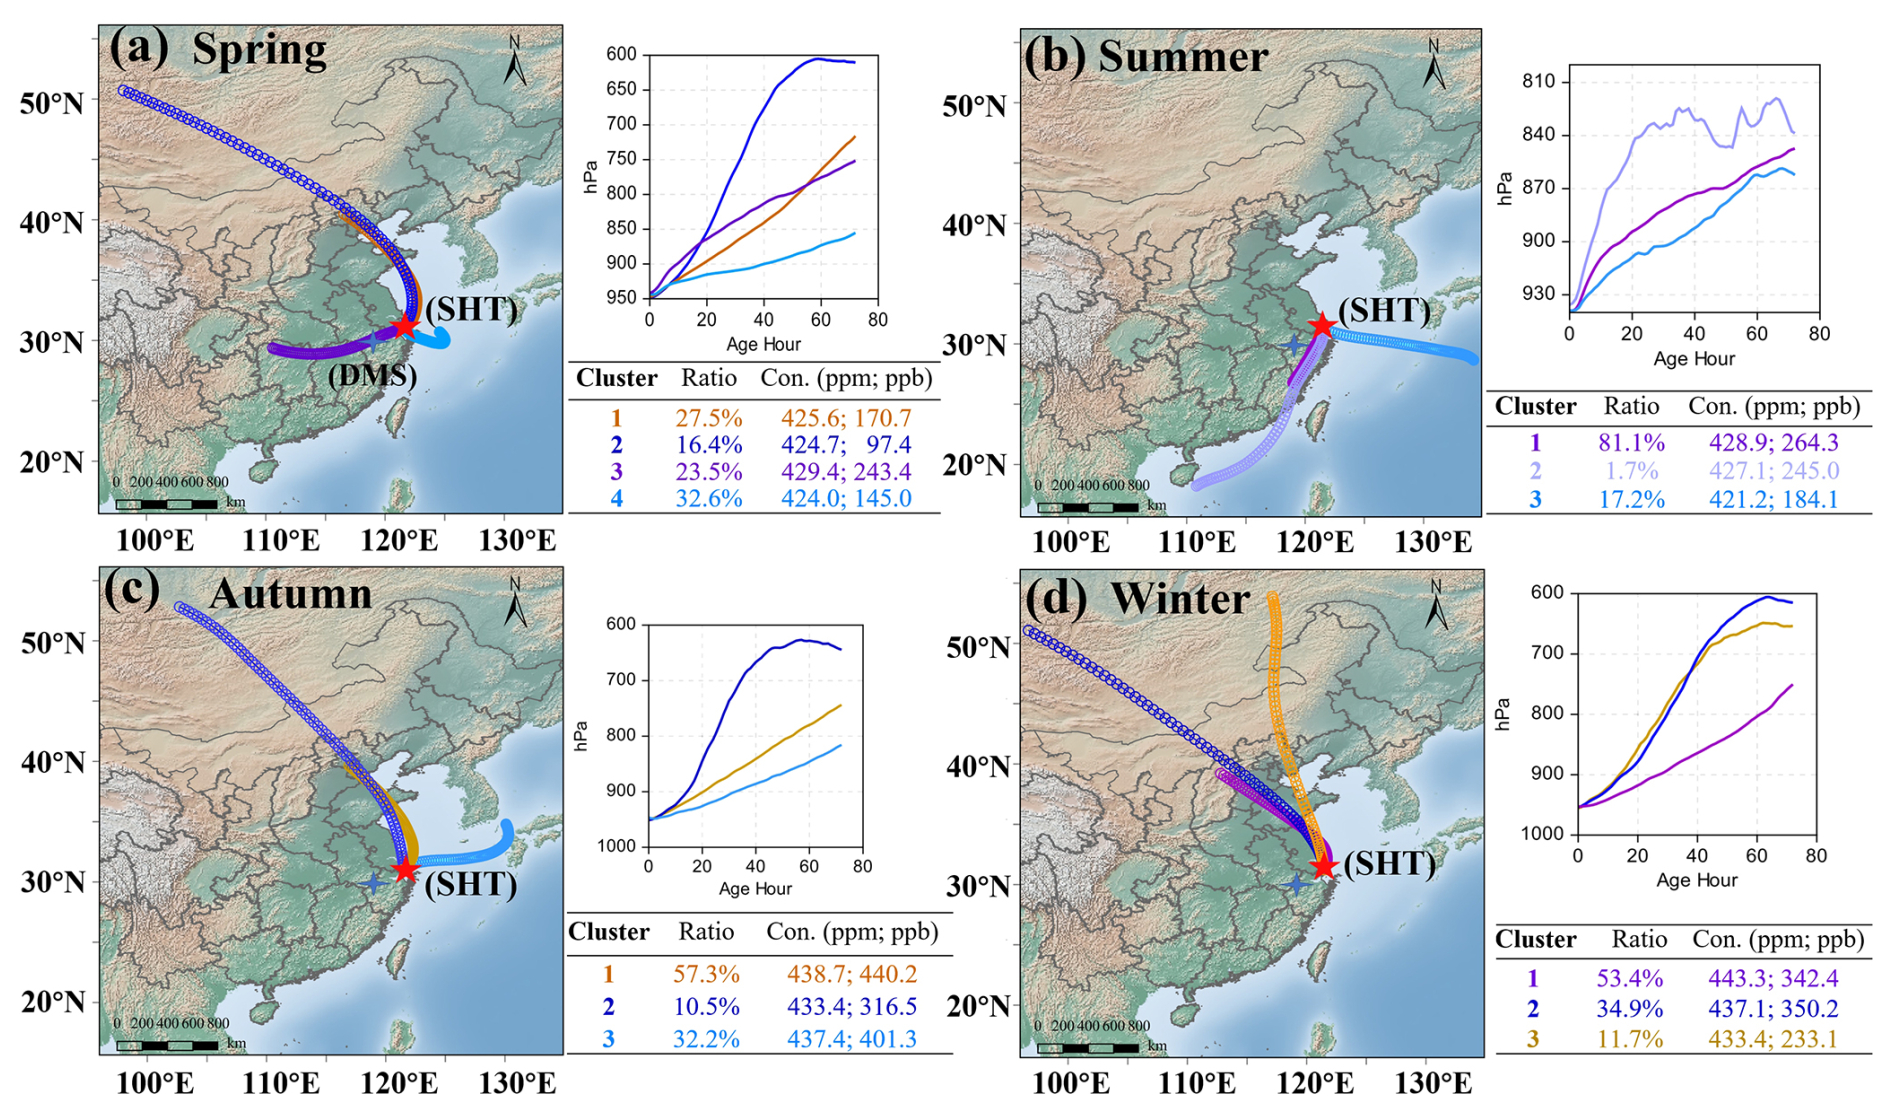
Figure 4Cluster analysis on 72 h back trajectories at the SHT site across different seasons. The trajectories were computed with an arrival height of 600 m a.g.l., close to the sampling intake height (632 m a.g.l.) at the SHT site. The right panels include cluster-specific pressure profiles and associated CO2 and CO mole fractions. The SHT and DMS sites in the YRD region are marked as a red five-pointed star and a blue four-pointed star, respectively.
3.3 Background Values Filtering Based on Nighttime Measurements
The principle of background value filtering is to distinguish the signal of a well-mixed atmospheric state from the noise caused by transient emission or sink events. To reduce filtering bias, we applied a meteorological filter to nocturnal tower-top measurements before further statistical processing, as suggested by Ruckstuhl et al. (2012), to derive regional background values of CO and CO2 (i.e., CObk and CO2, bk). As noted earlier, the SHT site (637 m a.m.s.l.) is located at UCL top and typically remains above the nighttime PBLH, experiencing strong winds (∼ 11.5 m s−1) that favor a well-mixed condition. Even so, the measurements could still be affected by certain meteorological conditions and plume transport events, as discussed below.
Rainfall influence. The elevation of nocturnal PBLH during rainfall (ca. +110 m; Fig. 5a) indicated enhanced vertical mixing, likely driven by cloud radiative effects that suppress near-surface cooling, along with mechanical turbulence enhancement and potential evaporative cooling aloft (Paul et al., 2018). Measurements further showed a more pronounced decline in tower-top CO concentrations (−16.9 % or −43.0 ppb) than in CO2 (−0.6 % or −2.6 ppm), as compared to stable rain-free nights (22:00–05:00 LT). This distinct nocturnal response can be explained by reduced anthropogenic activity that disproportionately curtails CO emissions but has little effect on persistent CO2 respiration, coupled with the rainfall-induced downward mixing of cleaner air, to which the locally concentrated CO was significantly more susceptible than the relatively well-mixed CO2. Therefore, the analysis of concurrent CObk and CO2, bk (and subsequent parameters) was restricted to non-rainy days, with extreme typhoon events also excluded as previously noted.
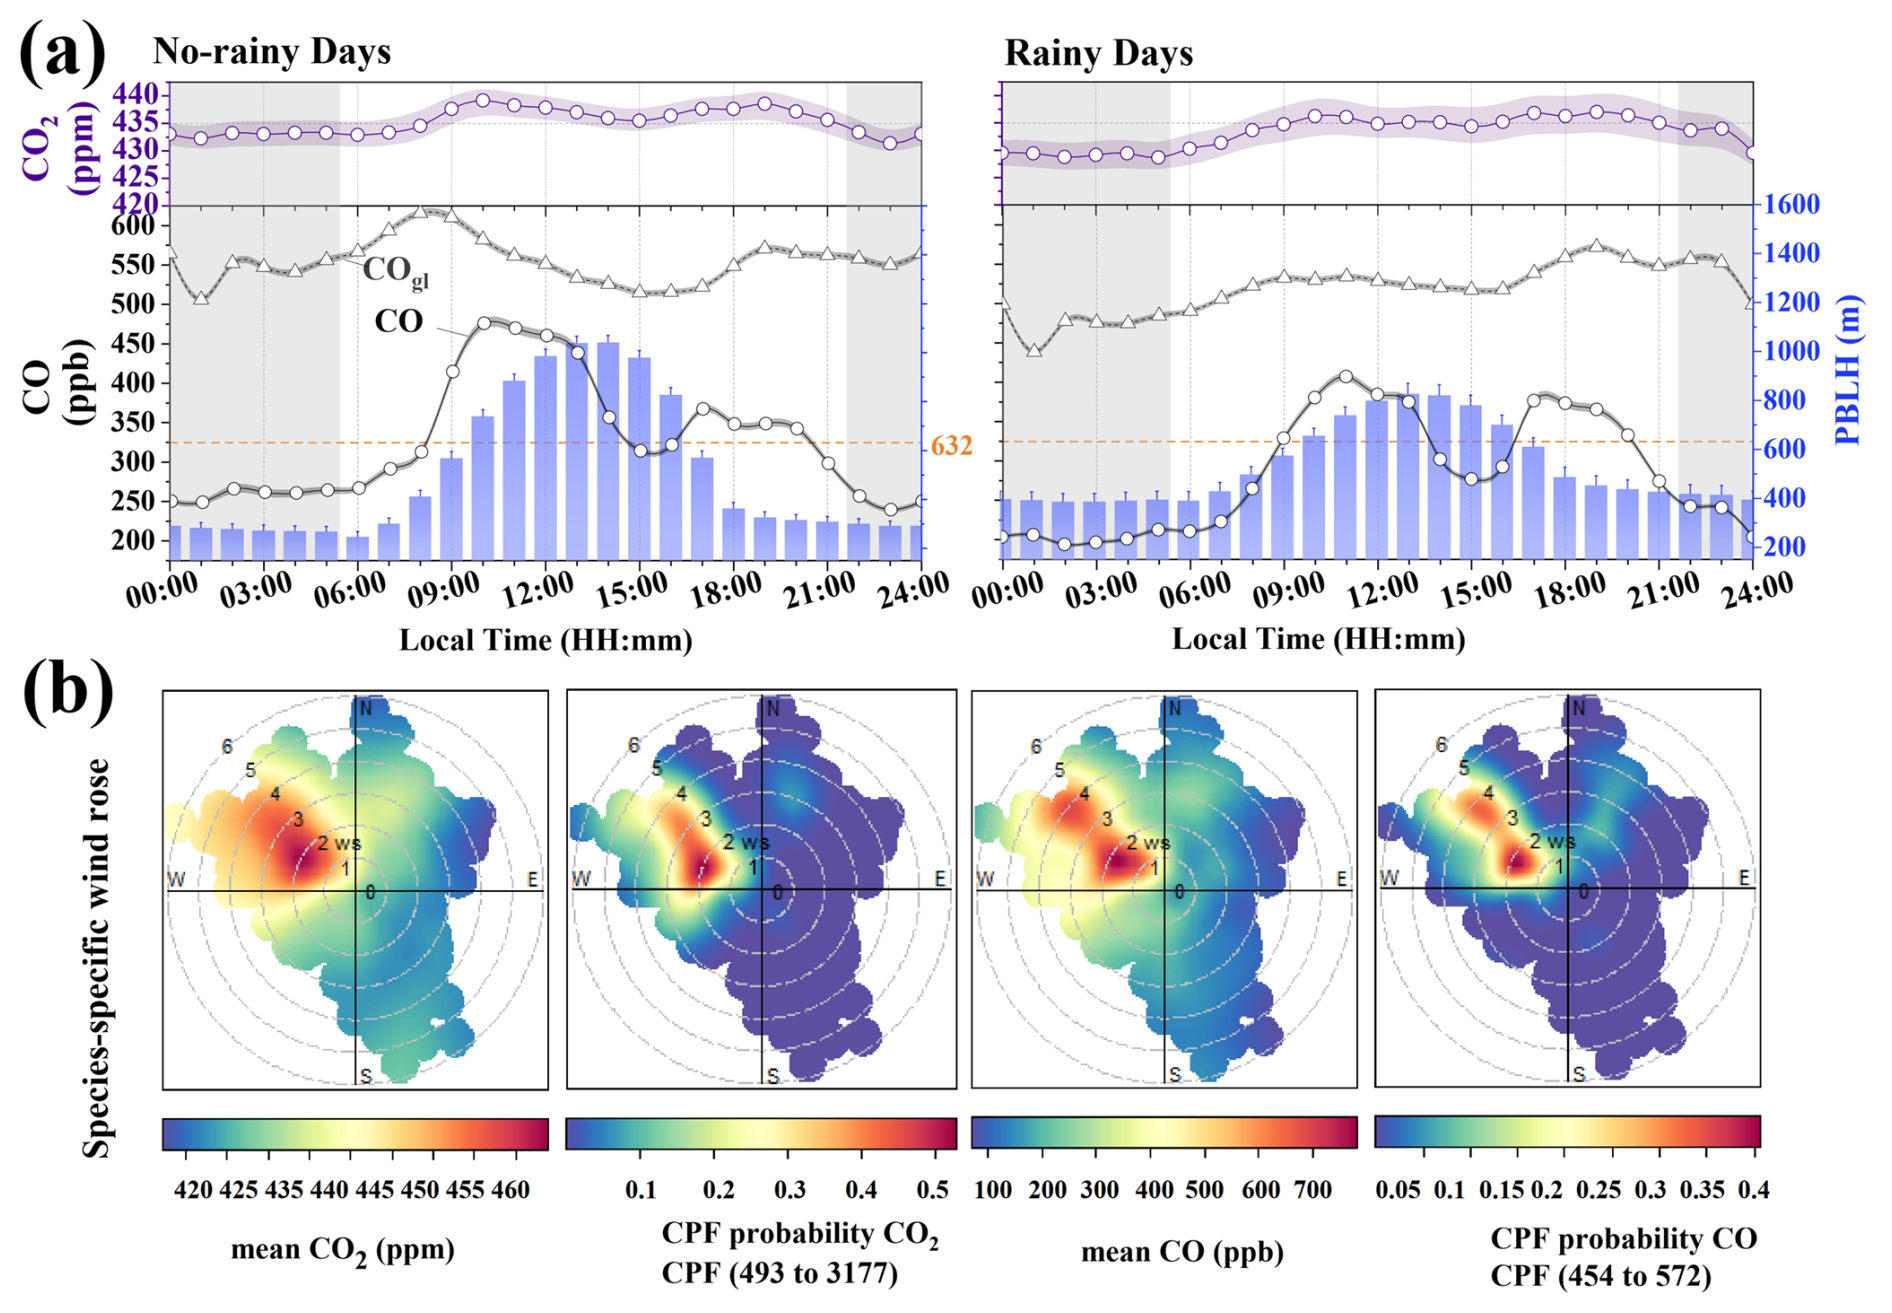
Figure 5Impacts of rainfall and wind patterns on tower-top CO2 and CO, alongside associated variations in PBLH and ground-level CO. The darker grey shading area in panels (a) and (b) highlights the condensed stable nighttime period (defined herein as 00:00–05:00 and 22:00–24:00 LT). The Conditional Probability Function (CPF) was applied to the highest 10 % of nocturnal CO and CO2 values in this period to identify potential source directions from the wind rose plots (wind speed, ws, in m s−1).
Transport impact of upwind, high-load airmass. Pollutant transport also plays a significant role in tower-based measurements, as emphasized earlier. Under the regime of the East Asian monsoon, clean maritime airmasses from the east alternate with polluted air from the west and northwest. These continental inflows were particularly evident in the autumn/winter (Clusters 1 and 2, Fig. 4), leading to a marked increase in CO and CO2 concentrations. The PSCF-resolved potential source areas (Fig. S8) further identified significant inland extensions during spring, in contrast to a contraction toward the vicinity of the SHT site in other seasons, but it can broadly characterize the overall picture of source influence for the SHT site within a radius of approximately 200 km (with PSCF values > 0.9). In the absence of real-time wind speed and direction data at the tower top, tower-base wind fields were adopted as a proxy, and corresponding distributions of CO and CO2 across nocturnal (22:00–05:00 LT) and diurnal periods are presented in Figs. 5b and S9, respectively. In particular, a relatively diffuse CO hotspot in the diurnal profile indicated considerable regional transport influence on the SHT receptor site. Under nocturnal conditions, both CO2 and CO (in terms of averages and top 10 % highs) exhibited clustered hotspot patterns in the W, WNW, and NW sectors at ground wind speeds of ca. 1–4 m s−1, suggesting persistent and mild upwind transport at night. These western sectors represent the upwind areas where the nighttime offshore land breeze may also partially contribute to the carbon footprint observed at the SHT receptor site (Huang et al., 2025; Zhao et al., 2022).
The selection of regional background data involved a sequential filtering procedure (Fig. 6a). Foremost, the NGT_MET-based process selected concurrent nocturnal CO and CO2 measurements (22:00–next 05:00 LT used, constituting 33.3 % of the total hourly dataset) from the SHT site, followed by the exclusions of rainy days, typhoon-affected periods, and winds from W, WNW, and NW sectors, which collectively accounted for 14.5 % of the total. Subsequently, a comprehensive top-down statistical filter (defined as NGT_MET_SDM and detailed in the following section) was employed to screen out local events (resulting in an additional 5.3 % exclusion). Overall, this multi-step filtering process effectively normalized the initially right-skewed distribution of the measurements. The final background dataset consisted of 1604 hourly records collected over 276 nights during this nearly 2-year campaign, yielding background concentrations of 425.6 ppm for CO2, bk and 191.1 ppb for CObk.
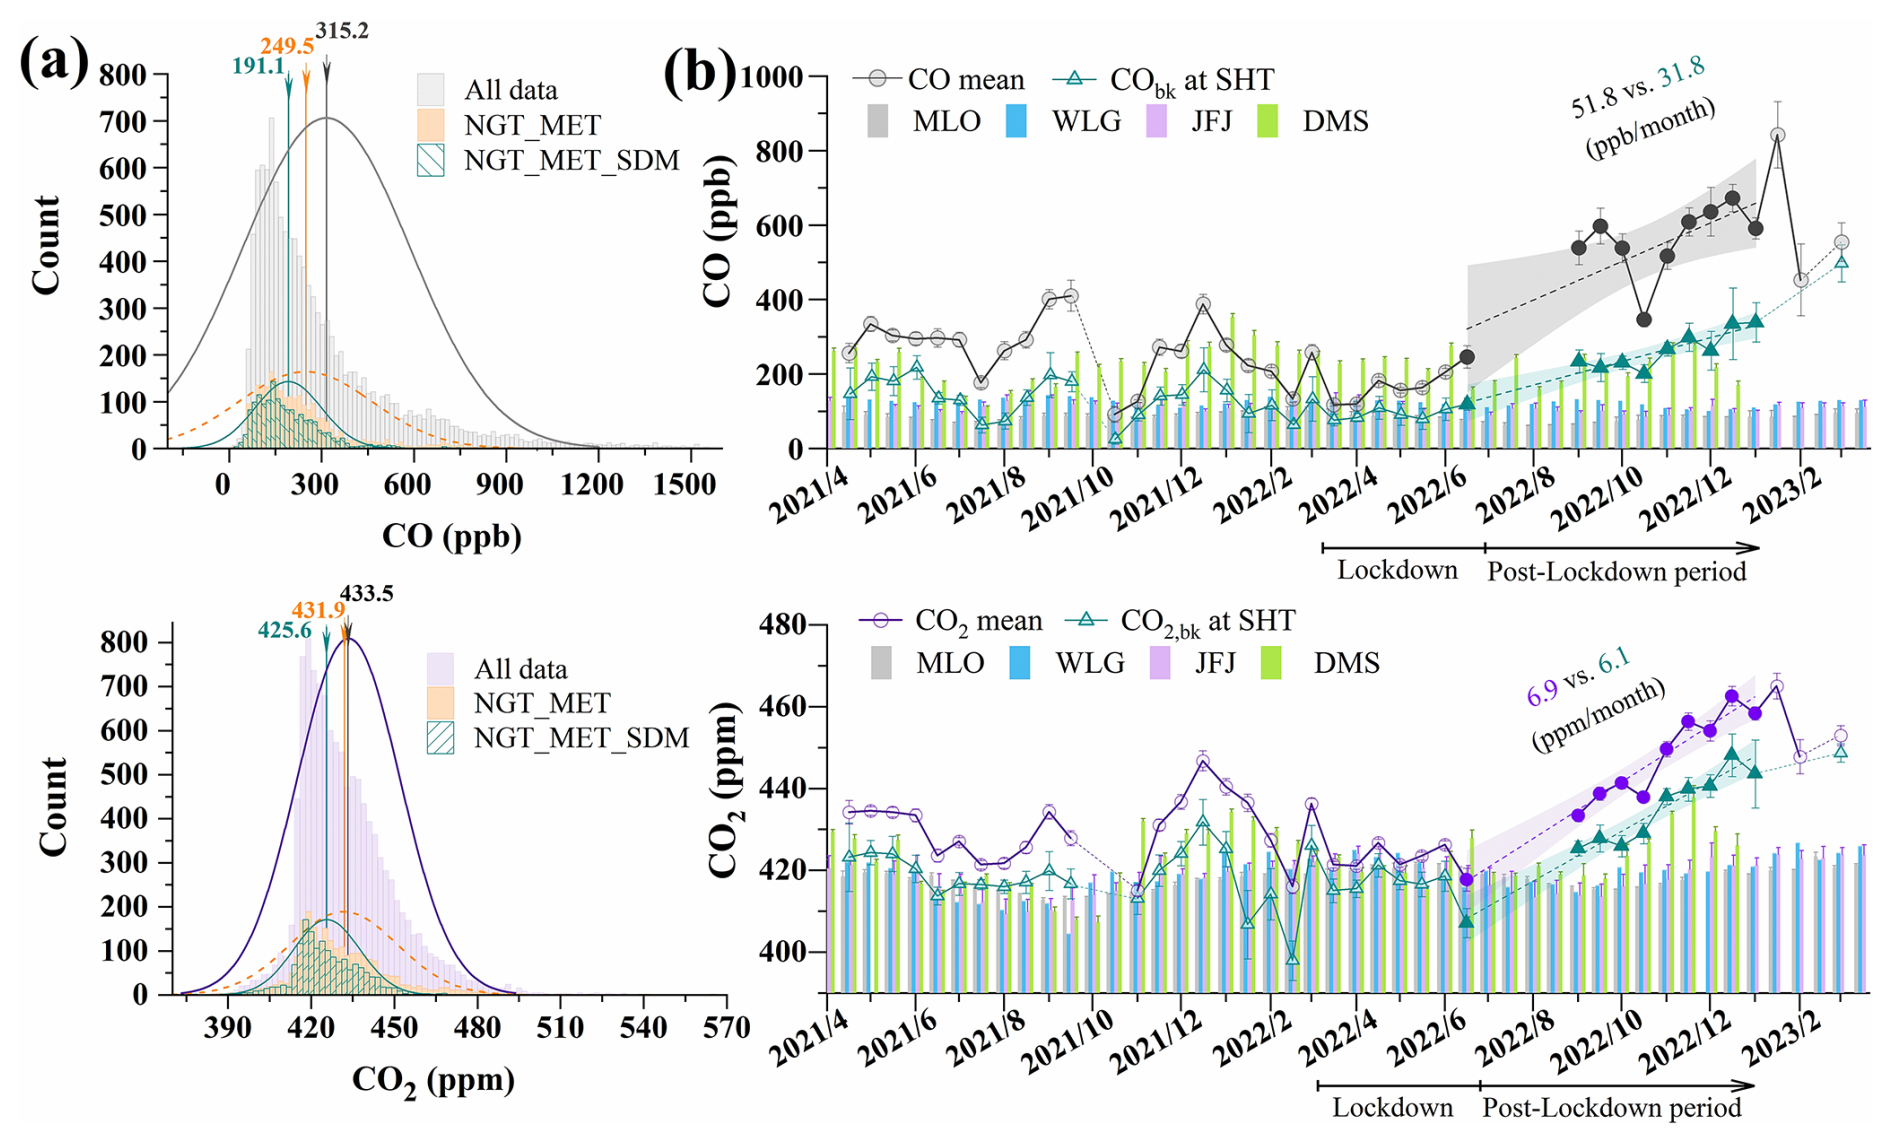
Figure 6Statistical distributions (a) and temporal variations (b) of regional background signal at the SHT site via multi-stage filtering, compared with synchronous observations from global stations (MLO, WLG, and JFJ) and a regional YRD site (DMS; see Table S1 for site details). Monthly-resolution CO data from MLO and WLG, obtained from WDCGG dataset, were linearly interpolated to a half-monthly scale. Values are given as mean ± standard deviation (SD) or mean ± 95 % confidence interval (CI), as specified. For SHT and DMS measurements, error bars indicate the 95 % CI; for MLO, WLG, and JFJ, error bars indicate SD (source: WDCGG database). The lockdown (March–June 2022) and post-lockdown (late June 2022–approximately January 2023) periods are marked in panel (b), and growth trends during the post-lockdown recovery phase were fitted using the reduced major axis (RMA) method for both overall (solid circles) and background (solid triangles) data at SHT.
Significant short-term variations (e.g., at minute scales) in species concentrations are commonly indicative of local emission or sink processes (Tsutsumi et al., 2006; Seinfeld and Pandis, 2016; Liu et al., 2019). On this basis, we implemented the SDM approach to analyze hourly standard deviation (SD, derived from 5 min resolution data; Fig. S10a) and examined its distribution across the NGT_MET-screened datasets. As shown in Fig. S10b, a high-variability threshold (±4.4 ppm for CO2 variation and ±34 ppb for CO variation over 1 h intervals) was adopted for retracing local events, with 5.1 % of records subsequently flagged as anomalous. Suspected outliers were then re-check and removed (additional ∼ 0.2 %) from the NGT_MET-screened data using two statistical criteria: the conventional 1.5 × IQR rule (Q1 − 1.5IQR, Q3 + 1.5IQR; Fig. 6a) applied to the overall dataset, and the ±3σ range relative to the smoothed values (Fig. 2) for hourly time series. Following this screening procedure, the final dataset comprised 248 sliding daily CObk and CO2, bk, each of which satisfied the requirement of at least 3 valid nocturnal data within the 8 h period (i.e., 22:00–next 05:00 LT) and served as a dynamic baseline for calculating subsequent daytime excess concentrations. In cases where no valid background was available for a given day, a biweekly sliding average was applied as a substitute to account for temporal variability. Accordingly, Fig. 6b presents CO and CO2 levels in semi-monthly intervals during non-rainy periods of the campaign, together with their corresponding background values vs. global (MLO, WLG, and JFJ) and YRD regional (DMS) background measurements.
Regarding CObk, the filtered mole fractions (±95 % CI: 190.1 ± 4.7 ppb) from tower-top measurements roughly aligned with synchronous values recorded at the sites of DMS, MLG, and JFJ (avg. 227.0, 125.2, and 116.6 ppb, respectively; Fig. 6b); however, this contrasted sharply with surface-based observations, such as the 373–413 ppb range reported at the nearby LAN site by Liu et al. (2019) using multiple filtering approaches. Given the high spatial heterogeneity of CO in the lower atmosphere over non-background regions, the tower-based deployments at the UCL top in this campaign appears to offer a superior vantage point for capturing its reliable regional signals. Focusing on CO2, bk, the derived value at SHT (425.6 ± 0.3 ppm) showed an enhancement of approximately 6–7 ppm over the global/regional backgrounds (417.8–422.3 ppm at MLO, WLG, JFJ, and DMS; Fig. 6b and Table S1), suggesting significant net source effects within the YRD region, China. The dynamics of atmospheric CO2 are governed by multiple factors, including biospheric processes (photosynthesis and respiration), PBLH, local anthropogenic activities, etc. (Yang et al., 2021; Chen et al., 2022). Previous studies (Chen et al., 2024; Lin et al., 2025) employed filtered DMS data as a background representative for the YRD; however, these data seem to be still confounded by sources on or advected to the mountain, with a notably enhanced influence from net vegetative CO2 release during winter (Fig. S11). Specially, nighttime SHT data, measured from within the mixed layer directly above the city center, can be proposed as a better background proxy. In parallel, anthropogenic emission variations were captured at SHT (Fig. 6b), as shown by concurrent declines in CO and CO2 (including background levels) during the March–June 2022 pandemic lockdown in Shanghai and a subsequent rebound during recovery. The strong coherence between CO2 and CO (a tracer of incomplete combustion of carbon-containing fuels; Seiler, 2010) underscores the significant role of fuel combustion on atmospheric CO2 levels. Furthermore, during the recovery period, the total growth rates of CO and CO2 significantly exceeded their dynamic regional backgrounds (CObk and CO2, bk; Fig. 6b). These growth imbalances can be explained by an increasing concentration excess (e.g., CO2, ex = CO2 − CO2, bk), highlighting pronounced local net source effects. A detailed compositional analysis of these excess signals follows in Sect. 3.4. In addition, a comprehensive case study focusing on Shanghai lockdown and recovery phases is presented in Sect. 3.5.
3.4 Analysis on the Main Cause of CO2 and CO Excesses
Specifically, the dynamic excesses of CO and CO2 (i.e., COex and CO2, ex) were calculated by subtracting the sliding daily background values (CObk and CO2, bk) from their corresponding real-time measurements. Figure 7 displays the resulting hourly excess values and their inter-correlations across seasons. Since CO is mainly co-emitted with CO2 from fuel combustion sources, a significant positive correlation between them is therefore expected when combustion processes dominate the observed CO2, ex. Accordingly, the fossil fuel-derived CO2 component (CO in Eq. 1) could be quantified using its co-emission ratio with CO (defined as ), as formulated in Eq. (4). It should be noted that ratios in this study (Fig. 7a) were determined via the reduced major axis rather than the ordinary least square method to appropriately account for uncertainties in both COex and CO2, ex, consistent with previous studies (Hirsch and Gilroy, 1984; Wang et al., 2010).
Figure 7a reveals a clear seasonal pattern in ratios, with higher values in spring (99.9 ppm ppm−1) and winter (76.5) compared to summer (64.3) and autumn (47.8). As mentioned earlier, a lower ratio in autumn may be related to crop residue burning as a possible source of autumn CO enhancement (Wang et al., 2019). Moreover, the generally higher estimates throughout this campaign reflect a lower relative CO ratio (i.e., , 1.5 ± 0.4 %) than reported across China (typically 1 %–6 %) (Liu et al., 2018; Xia et al., 2020; Che et al., 2022; Li et al., 2022; Wu et al., 2022), which may be due to relatively well-mixed atmospheric CO levels at the UCL top and/or a gradual improvement in regional combustion efficiency over time. Notably, high-efficiency fossil fuel combustion is typically associated with traffic and power plants (Yang et al., 2020; Che et al., 2022; Zhao et al., 2024). Significant reductions in have also been observed in specific industrial sectors in the YRD region, such as the steel industry, as suggested by Zhao et al. (2024), and these improvements are largely linked to China's Clean Air Action Plan (2013–2017), after which regional has stabilized at low levels. Compared with other urban-integrated observations, the derived at SHT is comparable to values in Sacramanto and California (∼ 1 %) (Wu et al., 2022), but remains higher than those in Europe areas such as Netherlands (0.2 %–0.4 %; Super et al., 2017) and France (0.3 %–0.7 %; Ammoura et al., 2016; Wu et al., 2022), indicating potential for further decline. This trend was also noticeable under the pandemic-related lockdown, as detailed in Sect. 3.5. Moreover, the relatively weak correlation between summertime CO2, ex and COex can be explained by disproportionate enhancement of CO2 signals from biospheric processes (Fig. S3; Wang et al., 2010; Tohjima et al., 2014) and of CO from in situ oxidation of biogenic hydrocarbons (Bi et al., 2022; Fawole et al., 2022). Despite this, strong vertical mixing during summer helped maintain a good correlation of concurrent CO2 and CO measurements (R = 0.53–0.80, Fig. S12). In densely populated urban areas, total respiration may substantially contribute to CO2, ex, forming part of the urban plume. In addition to diel variations in photosynthesis/respiration, atmospheric transport processes (TH and TV; Eq. 1) may also affect observed CO2, ex–COex correlations. In this study, except for the application of a seasonally constant , we also estimated summertime CO2, ff using a time-dependent expressed as the function of local time (Fig. S13). The results show that CO2, ff estimates would decrease by 4–5 ppm in the evening hours (17:00–20:00 LT), while the diurnal average remained nearly unchanged (6.3 vs. 6.4 ppm; Fig. 7b). Consequently, a seasonal (47.8–99.9; corresponding to of 0.8 %–2 %) was adopted in the subsequent analysis. Figure 7b further illustrates the diurnal cycles of main CO2, ex components (CO2, ff and CO2, bio-dominated) across seasons. In addition, Table S2 summarizes the magnitudes of these resolved excesses relative to filtered background levels.
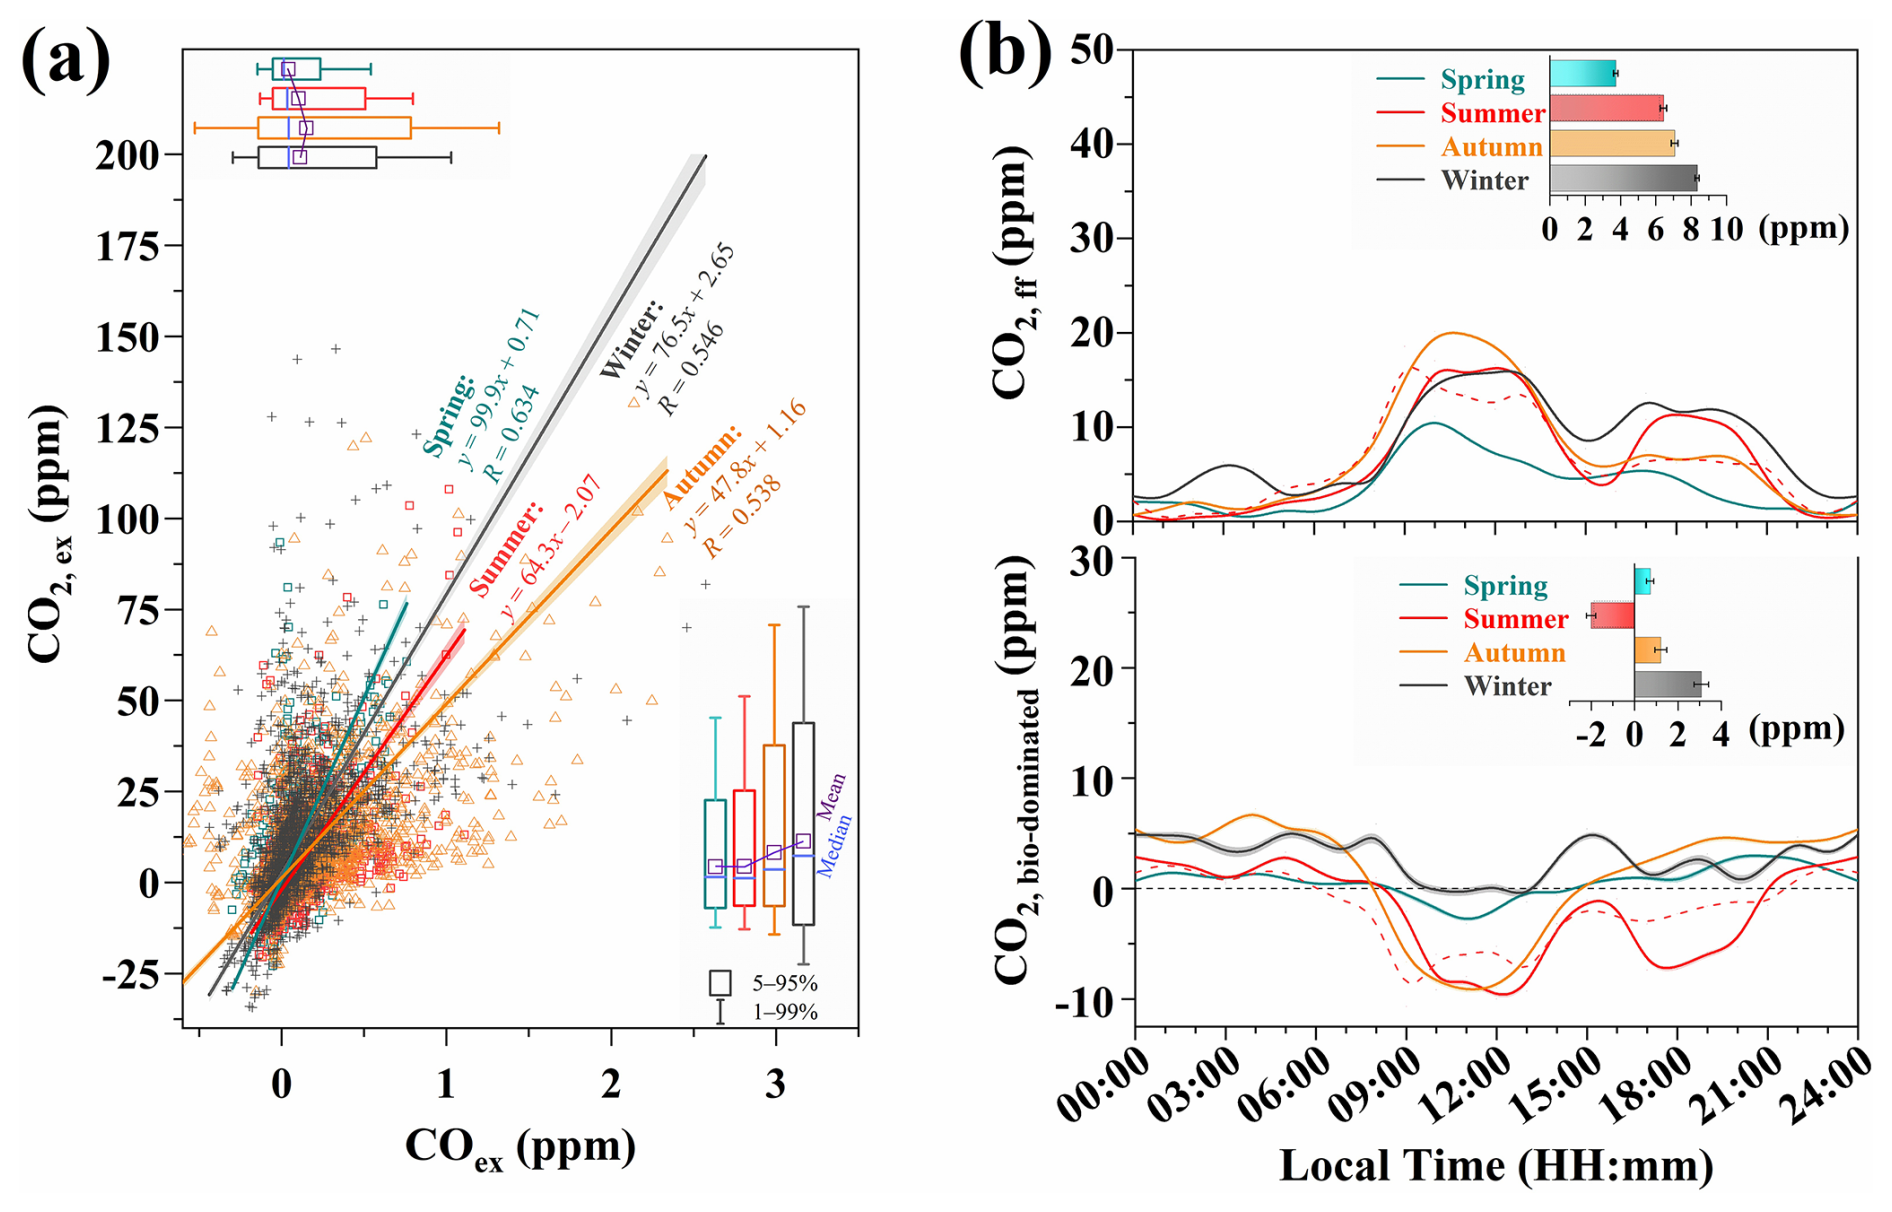
Figure 7Variations in panel (a): CO2 and CO excess concentration (i.e., [CO2, ex] and [COex]) and (b): further apportionment of CO2 excess to fossil fuel combustion and biologically dominated partition ([CO2, ff] and [CO2, bio-dominated]), respectively. Solid lines: estimates using seasonally constant from panel (a); dashed red line: summer estimates using a time-dependent .
Overall, the considerable variability in both CO and CObk at the SHT site (mean COex = 98.9 ppb; Table S2), consistent with previous observations (Wang et al., 2010; Liu et al., 2019; Xia et al., 2020), indicates their heightened susceptibility to local/regional, short-term emissions and depletion. It should be noted that our team conducted simultaneous 14C measurements in atmospheric CO2 and CO at the site of Hengxiwu (HXW, 119.48° E, 30.60° N; 200 m a.m.s.l.) in Anji, Zhejiang, a representative area of intensive urbanization in the YRD region. Based on these observations, CO2, ff concentrations were quantified via radiocarbon mass balance (according to Levin et al., 2003 and Vásquez et al., 2022), and the results (Fig. S14) revealed a strong positive correlation (R = 0.98) between CO2, ff and COex, with an averaged of 1.45 ± 0.13 % that was highly consistent with estimates from the SHT site (1.5 ± 0.4 %). These findings further confirm that CO emissions in the YRD region originate predominantly from fossil fuel combustion and high combustion efficiency there, thereby validating the application of Eq. (4) with an empirically constrained for determining regional CO2, ff. Focusing on CO2, ex at SHT site, its averaged concentration was 7.5 ppm, exhibiting a distinct seasonal pattern that peaked in winter (11.4 ppm) and dropped to a minimum in summer and spring (∼ 4.4 ppm). Source decomposition indicated that fossil fuel combustion (CO2, ff) was its dominant source, contributing 6.4 ppm (∼ 85 %) to the total excess, with the remainder (1.1 ppm, ∼ 15 %) mainly due to biological activities (CO2, bio-dominated). Notably, CO2, ff consistently served as the major source and was the primary driver of CO2 diurnal cycles (Fig. 3), while CO2, bio-dominated transitioned to a net summertime sink as intense sunlight enhanced photosynthetic CO2 uptake (Wang et al., 2010; Tohjima et al., 2014). This biological sink offset the apparent effect of ecosystem respiration, pointing to a potential underestimation of its true role in summer. Moreover, the notable CO2, bio-dominated sink (i.e., strong negative values; Fig. 7b) in summer evenings may stem from the oversimplified constant and/or dilution by advected sea breeze (Fig. 4) from afternoon to evening, observed at the tower top in the evening. Diurnal analysis during winter revealed a slightly amplified CO2, bio-dominated signal (3.1 ppm, representing 27 % of CO2, ex) during non-noon hours, attributable to pronounced net respiration, alongside a substantia CO2, ff contribution (8.3 ppm) that increased notably at night (Fig. 7b). The latter half of 2022 coincided with the post-lockdown economic recovery, a period marked by elevated CO2 and CO levels (Fig. 6b) that were likely linked to combustion-related emissions. The following section aims to investigate the underlying variables responsible for this observed growth.
3.5 Environmental Implications of Lockdown and Recovery Phases
A retrospective look at Shanghai's epidemic measures from late 2019 to early 2023 indicates that this metropolis underwent a phased evolution, commencing with routine containment, pivoting through emergency lockdowns and targeted management, and culminating in a comprehensive reopening. To account for intraseasonal variability, the following analysis focused on monthly comparisons for two specific intervals: the lockdown period (May–June 2022 vs. 2021) and post-pandemic recovery period (September 2022–January 2023 vs. the preceding year), as shown in Fig. 8. As reported earlier, lockdown measures primarily curbed residential mobility and public traffic, with limited disruption to industrial operations (SHMS, 2022). Thus, the most prominent change during this campaign was a sharp 56.2 ± 78.7 % drop in traffic-related NO2 during lockdown, followed by post-lockdown declines of 21.4 ± 12.2 % in NO2 and 9.4 ± 4.1 % in CO. These variations, against a backdrop of modest PBLH increase (11.2 ± 8.4 %), highlight overall air quality improvement and specific success of curbing vehicle-related emissions (Wang et al., 2022). It should be noted that SO2 (largely tied to industrial activities) increased significantly during the lockdown, likely due in part to a certain increase in industrial emissions, but driven more by reduced OH regeneration from NOx decline, which weakened its atmospheric loss (Ye et al., 2023; Zhang et al., 2023). Ground-level CO also exhibited variable patterns (e.g., between May and June, 2021–2022), likely more influenced by localized sources such as residential fuel burning and emissions from emergency services during the pandemic peak than by regional transport.
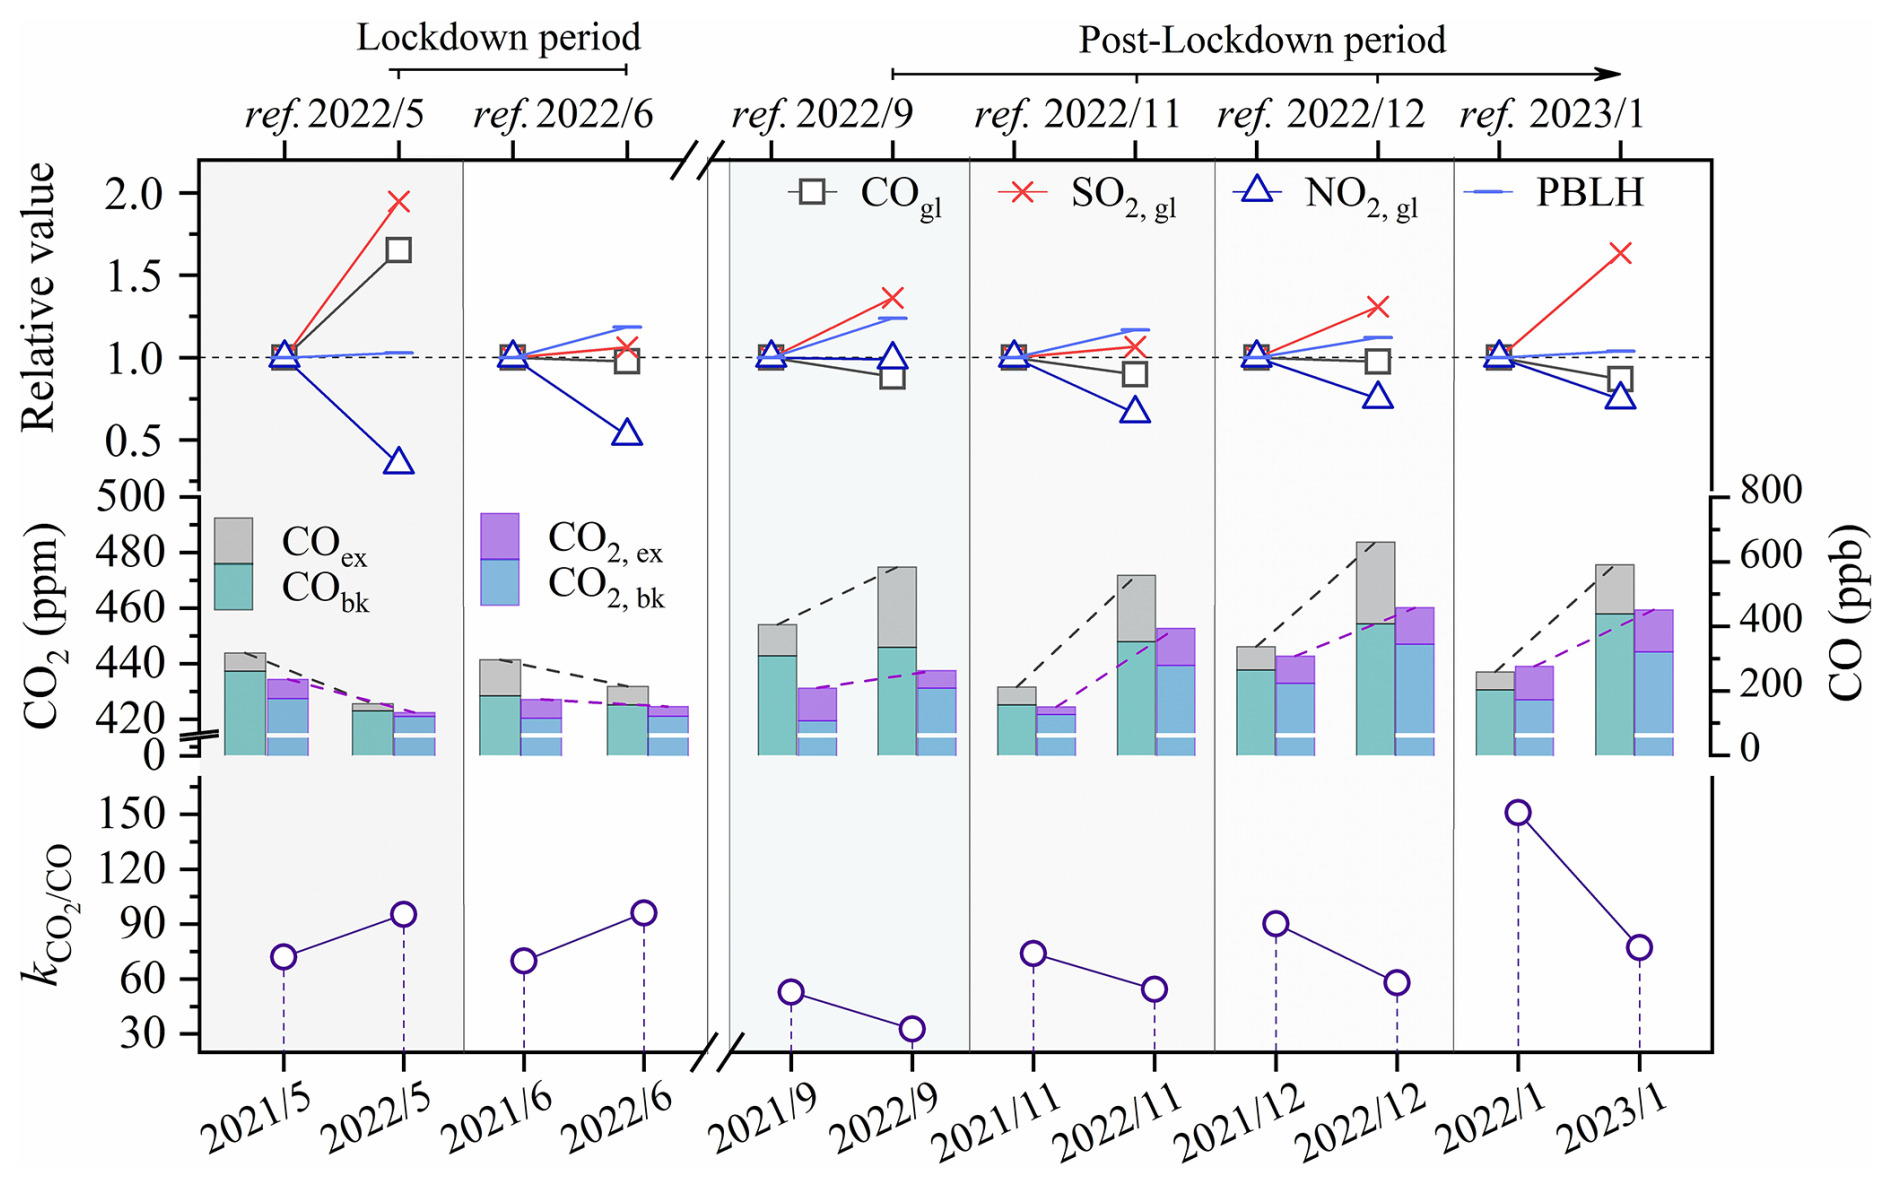
Figure 8Interannual comparison of ground-level and tower-top species and associated parameters for the lockdown period (May–June 2022 vs. 2021) and post-pandemic recovery period (September 2022–January 2023 vs. 2021–2022).
Generally, UCL top medium- to long-lived carbon oxides (CO and CO2) showed a pronounced divergence from that of ground-level short-lived pollutants such as NOx and SO2. The ongoing lockdown of about 3–4 months yielded a 38.8 % decline in tower-top CO and 1.7 % in CO2, matching concurrent declines in their regional background and local excess concentrations (−75.4 ± 47.2 and −44.8 ± 9.6 ppb for CO; −2.8 ± 3.5 and −4.4 ± 1.1 ppm for CO2). In contrast, the subsequent recovery saw a sharp rebound in atmospheric carbon loading, reflected by net increases in both CO (150.2 ± 191.6 and 145.3 ± 142.9 ppb) and CO2 (15.2 ± 16.4 and 2.9 ± 5.7 ppm) background and excess components. These coordinated variations indicate that anthropogenic activities in this densely-populated metropolis (Shanghai) exerted a dominant influence on the regional carbon footprint and induced an additional localized excess/deficit. Moreover, the reversal in carbon load differences between the two scenarios implies a fundamental shift in emission structure. This transition is clearly reflected in the combustion efficiency proxy, , which increased by ∼ 25 during the control period before a decrease of 36 ± 22 in the relaxation phase (Fig. 8). A widespread enhancement in in response to anthropogenic emission controls has been also observed in other conditions, such as its near doubling during the 2008 Beijing Olympics (46.4 ± 4.6) relative to the pre-Olympic period (23–29 in September 2005–2007) (Wang et al., 2010). This trend is further supported by long-term interannual increases, exemplified by a rise from 10–18 to ca. 50 based on Δ14C measurements in the Los Angeles basin between 1980 and 2008 (Djuricin et al., 2012), and a climb from 46.5 to about 80–90 over the YRD region from 2012 to 2021 (Wu et al., 2022; Zhao et al., 2024).
UCL-top measurements are representative of the vertically integrated and homogenized urban carbon footprint, whereas ground-level observations are strongly influenced by local, transient sources. The 2022 lockdown in Shanghai precipitated a near-total collapse of its urban and intercity transport systems, showing a dramatic plummet of over 90 % in aviation, rail, and maritime passenger volumes (MOT, 2022), an approximate 20 % decline in road traffic, and a severe operational crisis at the Port of Shanghai with soaring vessel queues and cargo backlogs. The recovery period saw a gradual normalization of port operations, concurrent with a lasting behavioral shift toward private car usage over public transport. Variations in combustion efficiency across fuel types (e.g., gasoline, diesel, and biomass) and traffic states (e.g., moving, congested, or stationary) (Westerdahl et al., 2009; Popa et al., 2014; Wu et al., 2022) are also reflected in the differences of . The observed elevation in (Fig. 8) during the lockdown may be explained by the sharp reduction in urban traffic, along with a temporarily increased contribution from low- diesel shipping near the port (Zhang et al., 2016; Kim et al., 2020; Wu et al., 2022). In the recovery phase, the dropped by 36 ± 22 from ca. 90 ± 22, and this shift can be attributed to resumption of gasoline vehicle-related traffic and potentially increasing influence from upwind inefficient combustion sources such as biomass burning Tohjima et al. (2014) in autumn and winter, 2022. Generally, in our year-to-year comparison for the same month (without accounting for biospheric influences here), localized CO2 excess or deficit could be primarily attributed to variations in emissions related to fossil fuels (CO2, ff).
This study, based on a nearly 2-year campaign conducted at the Shanghai Tower (632 m a.g.l.), systematically investigates for the first time the temporal dynamics and drivers of atmospheric CO2 and CO in metropolitan Shanghai. Elevated concentrations (433.50 ± 0.33 ppm for CO2 and 313.59 ± 4.91 ppb for CO) at this site revealed excess carbon in the urban atmosphere aloft, with the lagged peak against ground-based CO serving as a clear indicator of daytime upward transport of local anthropogenic emissions. By applying a robust background filtering procedure (NGT_MET_SDM) focused on nocturnal stable periods and combining meteorological and statistical methods, we identified that the CO background level was comparable to, or slightly below, that recorded at the DMS background site in the YRD region. In contrast, the higher CO2 regional background level combined with significant CO2 excess over diurnal cycle characterizes this region as a perennial CO2 hotspot, a characteristic urban phenomenon further intensified by local net source effects in megacities.
The relationship between CO2 and CO excess at SHT, corroborated by independent CO2-Δ14C and CO correlations from the YRD region, definitively confirms that the region exhibits high fossil fuel combustion efficiency and that CO emissions are overwhelmingly fossil-derived. Accordingly, through excess concentration analysis and CO2 CO emission ratio ( CO) tracing, we further quantified source contributions: fossil fuel combustion accounted for ∼ 85 % (7.5 ppm) of the diurnal CO2, ex, with the remainder dominated by biogenic processes that shifted from a net sink in summer (−2.0 ppm) to a source in winter (+2.8 ppm). Moreover, this campaign successfully captured a clear signature of emission changes during the pandemic lockdown and recovery. A distinct pattern was observed at the tower top, differing somewhat from ground-level measurements, characterized by a simultaneous decline in both CO2 and CO levels (including their backgrounds) followed by a coordinated rapid rebound. Critically, the year-on-year difference in the ratio increased during the lockdown and decreased afterwards, indicating a structural shift in dominant emission sources. These findings demonstrate a sensitive response of atmospheric carbon footprint at the urban canopy top to variations in anthropogenic emissions.
Our findings suggest that utilizing existing infrastructure at the UCL top (or above Hb) minimizes near-ground effects and provides an immediate and representative signal of the metropolitan-scale anthropogenic influence on GHG concentrations in non-background regions. This approach captures the dynamically mixed urban plume, offering insights that may distinct from those obtained at background sites, which are influenced by broader regional conditions. On this basis, we also recommend combining these measurements with complementary platforms (e.g., drones, tethered balloons and remote sensing) to better resolve vertical profiles of GHG within the UBL. Moreover, extending the current excess CO2 analysis with multi-tracer techniques such as incorporating isotopic or specific VOC markers would enable more precise apportionment of contributions from fossil fuel, biogenic, and industrial sources, thereby reducing attribution uncertainty. Together, these advances will strengthen the scientific basis for evaluating carbon neutrality policies and quantifying impacts of extreme events such as public health interventions and severe weather on urban GHG dynamics.
The gridded meteorological data utilized were sourced from the NOAA Air Resources Laboratory (https://www.ready.noaa.gov/archives.php, NOAA-ARL, 2024). PBLH data are reanalysis products from the fifth generation ECMWF reanalysis for the global climate and weather (https://doi.org/10.24381/cds.adbb2d47, Copernicus Climate Change Service, 2025). Global CO2 measurements from multiple meteorological stations are available from https://gaw.kishou.go.jp/search (WDCGG, 2025b). Air quality observations from China's national monitoring network are accessible via https://air.cnemc.cn:18007/ (CNEMC, 2025), and meteorological data are available at https://doi.org/10.25504/FAIRsharing.52d9fa from CMDC (2024). The data on measured CO2 and CO profiles in the study are available at https://doi.org/10.6084/m9.figshare.30918203 (Fu and Fang, 2025).
The Supplement, and in which Tables S1–S2 provide an overview of measured CO2 mixing ratio across sites and component analysis of CO2 and CO at the SHT site; Figs. S1–S12 mainly present the relevant meteorological parameters, as well as supported profile information on CO2, CO and their associated background and excess values. The supplement related to this article is available online at https://doi.org/10.5194/acp-26-5477-2026-supplement.
SF (Shuangxi Fang) led the study. KZ, XQ, BC, and WG contributed to the instrument calibration and field measurements. SL and YC contributed to data quality control. SF (Shuang Fu) analyzed the observation data, conducted the study concept, and wrote the manuscript draft with input from all co-authors. YL and MS were involved in the scientific interpretation and discussions. The paper was reviewed and commented on by all authors.
The contact author has declared that none of the authors has any competing interests.
Publisher's note: Copernicus Publications remains neutral with regard to jurisdictional claims made in the text, published maps, institutional affiliations, or any other geographical representation in this paper. The authors bear the ultimate responsibility for providing appropriate place names. Views expressed in the text are those of the authors and do not necessarily reflect the views of the publisher.
This article is part of the special issue “Greenhouse gas monitoring in the Asia–Pacific region (ACP/AMT/GMD inter-journal SI)”. It is a result of the 4th China Greenhouse Gas Monitoring Symposium, Nanjing, China, 2–3 November 2024.
This research has been supported by the National Key Research and Development Program of China (grant no. 2023YFC3705205), the Key Research and Development Program of Zhejiang Province (“Pioneer” and “Leading Goose” (grant no. 2024C03246)), and the National Natural Science Foundation of China (grant no. 42275113).
This paper was edited by Christoph Gerbig and reviewed by two anonymous referees.
AGGI: The NOAA annual greenhouse gas index (AGGI), https://gml.noaa.gov/aggi/aggi.html (last access: 25 October 2025), 2024.
Allen, R. W., Gombojav, E., Barkhasragchaa, B., Byambaa, T., Lkhasuren, O., Amram, O., Takaro, T. K., and Janes, C. R.: An assessment of air pollution and its attributable mortality in Ulaanbaatar, Mongolia, Air Qual. Atmos. Hlth., 6, 137–150, https://doi.org/10.1007/s11869-011-0154-3, 2013.
Ammoura, L., Xueref-Remy, I., Vogel, F., Gros, V., Baudic, A., Bonsang, B., Delmotte, M., Té, Y., and Chevallier, F.: Exploiting stagnant conditions to derive robust emission ratio estimates for CO2, CO and volatile organic compounds in Paris, Atmos. Chem. Phys., 16, 15653–15664, https://doi.org/10.5194/acp-16-15653-2016, 2016.
Arnfield, A. J.: Two decades of urban climate research: a review of turbulence, exchanges of energy and water, and the urban heat island, Int. J. Climatol., 23, 1–26, https://doi.org/10.1002/joc.859, 2003.
Bi, J., Zuidema, C., Clausen, D., Kirwa, K., Young Michael, T., Gassett Amanda, J., Seto Edmund, Y. W., Sampson Paul, D., Larson Timothy, V., Szpiro Adam, A., Sheppard, L., and Kaufman Joel, D.: Within-city variation in ambient carbon monoxide concentrations: Leveraging low-cost monitors in a spatiotemporal modeling framework, Environ. Health Persp., 130, 097008, https://pmc.ncbi.nlm.nih.gov/articles/PMC9518741/ (last access: 23 November 2025), 2022.
Bond, T. C., Streets, D. G., Yarber, K. F., Nelson, S. M., Woo, J.-H., and Klimont, Z.: A technology-based global inventory of black and organic carbon emissions from combustion, J. Geophys. Res.-Atmos., 109, https://doi.org/10.1029/2003JD003697, 2004.
Brunke, E. G., Labuschagne, C., Parker, B., Scheel, H. E., and Whittlestone, S.: Baseline air mass selection at Cape Point, South Africa: application of 222Rn and other filter criteria to CO2, Atmos. Environ., 38, 5693–5702, https://doi.org/10.1016/j.atmosenv.2004.04.024, 2004.
Carslaw, D. C.: The openair manual – Open-source tools for analysing air pollution data, Manual for version 2.6-2, King's College London, GitHub [code], https://github.com/davidcarslaw/openair (last access: 17 November 2021), 2019.
Carslaw, D. C. and Ropkins, K.: openair – An R package for air quality data analysis, Environ. Modell. Softw., 27–28, 52–61, https://doi.org/10.1016/j.envsoft.2011.09.008, 2012.
Che, K., Liu, Y., Cai, Z., Yang, D., Wang, H., Ji, D., Yang, Y., and Wang, P.: Characterization of regional combustion efficiency using ΔXCO: ΔXCO2 observed by a portable fourier-transform spectrometer at an urban site in Beijing, Adv. Atmos. Sci., 39, 1299–1315, https://doi.org/10.1007/s00376-022-1247-7, 2022.
Chen, Y., Cheng, J., Song, X., Liu, S., Sun, Y., Yu, D., and Fang, S.: Global-scale evaluation of XCO2 products from GOSAT, OCO-2 and carbontracker using direct comparison and triple collocation method, Remote Sens., 14, https://doi.org/10.3390/rs14225635, 2022.
Chen, Y., Lu, Y., Qi, B., Ma, Q., Zang, K., Lin, Y., Liu, S., Pan, F., Li, S., Guo, P., Chen, L., Lan, W., and Fang, S.: Atmospheric CO2 in the megacity Hangzhou, China: Urban-suburban differences, sources and impact factors, Sci. Total Environ., 926, https://doi.org/10.1016/j.scitotenv.2024.171635, 2024.
CMDC (China Meteorological Data Service Center): China Meteorological Data, China Meteorological Data Service Center [data set], https://doi.org/10.25504/FAIRsharing.52d9fa, 2024.
CNEMC (China National Environmental Monitoring Centre): China's air quality monitoring data, National Urban Air Quality Real-time Release Platform [data set], https://air.cnemc.cn:18007/ (last access: 1 August 2025), 2025.
CNCA (Carbon Neutral Cities Alliance): https://carbonneutralcities.org/about/ (last access: 25 October 2025), 2020.
Copernicus Climate Change Service: ERA5, the fifth generation ECMWF reanalysis for the global climate and weather: ERA5 hourly data on single levels from 1940 to present, Copernicus Climate Data Store [data set], https://doi.org/10.24381/cds.adbb2d47, 2025
Cosgrove, A. and Berkelhammer, M.: Downwind footprint of an urban heat island on air and lake temperatures, npj Clim. Atmos. Sci., 1, https://doi.org/10.1038/s41612-018-0055-3, 2018.
Crutzen, P.: A discussion of the chemistry of some minor constituents in the stratosphere and troposphere, Pure Appl. Geophys., 106, 1385–1399, https://doi.org/10.1007/BF00881092, 1973.
Denning, A.Zhang, N., Yi, C., Branson, M., Davis, K., Kleist, J., and Bakwin, P.: Evaluation of modeled atmospheric boundary layer depth at the WLEF tower, Agr. Forest Meteorol., 148, 206–215, https://doi.org/10.1016/j.agrformet.2007.08.012, 2008.
Djuricin, S., Xu, X., and Pataki, D. E.: The radiocarbon composition of tree rings as a tracer of local fossil fuel emissions in the Los Angeles basin: 1980–2008, J. Geophys. Res.-Atmos., 117, https://doi.org/10.1029/2011JD017284, 2012.
Ehhalt, D. H. and Rohrer, F.: The tropospheric cycle of H2: A critical review, Tellus B, 61, 500–535, https://doi.org/10.1111/j.1600-0889.2009.00416.x, 2009.
Fang, S., Luan, T., Zhang, G., Wu, Y., and Yu, D.: The determination of regional CO2 mole fractions at the Longfengshan WMO/GAW station: A comparison of four data filtering approaches, Atmos. Environ., 116, 36–43, https://doi.org/10.1016/j.atmosenv.2015.05.059, 2015a.
Fang, S., Zhou, L., Masarie, K. A., Xu, L., and Rella, C. W.: Study of atmospheric CH4 mole fractions at three WMO/GAW stations in China, J. Geophys. Res.-Atmos., 118, 4874–4886, https://doi.org/10.1002/jgrd.50284, 2013.
Fang, S., Tans, P. P., Steinbacher, M., Zhou, L., Luan, T., and Li, Z.: Observation of atmospheric CO2 and CO at Shangri-La station: results from the only regional station located at southwestern China, Tellus B, 68, https://doi.org/10.3402/tellusb.v68.28506, 2016.
Fang, S., Tans, P. P., Yao, B., Luan, T., Wu, Y., and Yu, D.: Study of atmospheric CO2 and CH4 at Longfengshan WMO/GAW regional station: The variations, trends, influence of local sources/sinks, and transport, Sci. China Earth Sci., 60, 1886–1895, https://doi.org/10.1007/s11430-016-9066-3, 2017.
Fang, S., Du, R., Qi, B., Ma, Q., Zhang, G., Chen, B., and Li, J.: Variation of carbon dioxide mole fraction at a typical urban area in the Yangtze River Delta, China, Atmos. Res., 265, https://doi.org/10.1016/j.atmosres.2021.105884, 2022.
Fang, S. X., Zhou, L. X., Tans, P. P., Ciais, P., Steinbacher, M., Xu, L., and Luan, T.: In situ measurement of atmospheric CO2 at the four WMO/GAW stations in China, Atmos. Chem. Phys., 14, 2541–2554, https://doi.org/10.5194/acp-14-2541-2014, 2014.
Fang, S. X., Tans, P. P., Steinbacher, M., Zhou, L. X., and Luan, T.: Comparison of the regional CO2 mole fraction filtering approaches at a WMO/GAW regional station in China, Atmos. Meas. Tech., 8, 5301–5313, https://doi.org/10.5194/amt-8-5301-2015, 2015b.
Fawole, O. G., Yusuf, N., Sunmonu, L. A., Obafaye, A., Audu, D. K., Onuorah, L., Olusegun, C. F., Deme, A., and Senghor, H.: Impacts of COVID-19 restrictions on regional and local air quality across selected West African cities, GeoHealth, 6, e2022GH000597, https://doi.org/10.1029/2022gh000597, 2022.
Forster, P., Ramaswamy, V., Artaxo, P., Berntsen, T., Betts, R., Fahey, D., Haywood, J., Lean, J., Lowe, D., Myhre, G., Nganga, J., Prinn, R., Raga, G., Michael, S., and Dorland, R.: Changes in Atmospheric Constituents and in Radiative Forcing, Chap. 2, in: The Physical Science Basis of Climate Change, edited by: Solomon, S., Qin, D., Manning, M., Chen, Z., Marquis, M., Averyt, K. B., Tignor, M., and Miller, H. L., Cambridge University Press, Cambridge, United Kingdom and New York, NY, USA, ISBN 978-0-521-88009-1, 2007.
Friedlingstein, P., Jones, M. W., O'Sullivan, M., Andrew, R. M., Bakker, D. C. E., Hauck, J., Le Quéré, C., Peters, G. P., Peters, W., Pongratz, J., Sitch, S., Canadell, J. G., Ciais, P., Jackson, R. B., Alin, S. R., Anthoni, P., Bates, N. R., Becker, M., Bellouin, N., Bopp, L., Chau, T. T. T., Chevallier, F., Chini, L. P., Cronin, M., Currie, K. I., Decharme, B., Djeutchouang, L. M., Dou, X., Evans, W., Feely, R. A., Feng, L., Gasser, T., Gilfillan, D., Gkritzalis, T., Grassi, G., Gregor, L., Gruber, N., Gürses, Ö., Harris, I., Houghton, R. A., Hurtt, G. C., Iida, Y., Ilyina, T., Luijkx, I. T., Jain, A., Jones, S. D., Kato, E., Kennedy, D., Klein Goldewijk, K., Knauer, J., Korsbakken, J. I., Körtzinger, A., Landschützer, P., Lauvset, S. K., Lefèvre, N., Lienert, S., Liu, J., Marland, G., McGuire, P. C., Melton, J. R., Munro, D. R., Nabel, J. E. M. S., Nakaoka, S.-I., Niwa, Y., Ono, T., Pierrot, D., Poulter, B., Rehder, G., Resplandy, L., Robertson, E., Rödenbeck, C., Rosan, T. M., Schwinger, J., Schwingshackl, C., Séférian, R., Sutton, A. J., Sweeney, C., Tanhua, T., Tans, P. P., Tian, H., Tilbrook, B., Tubiello, F., van der Werf, G. R., Vuichard, N., Wada, C., Wanninkhof, R., Watson, A. J., Willis, D., Wiltshire, A. J., Yuan, W., Yue, C., Yue, X., Zaehle, S., and Zeng, J.: Global Carbon Budget 2021, Earth Syst. Sci. Data, 14, 1917–2005, https://doi.org/10.5194/essd-14-1917-2022, 2022.
Fu, J., Li, P., Lin, Y., Du, H., Liu, H., Zhu, W., and Ren, H.: Fight for carbon neutrality with state-of-the-art negative carbon emission technologies, Eco-Environment & Health, 1, 259–279, https://doi.org/10.1016/j.eehl.2022.11.005, 2022.
Fu, S. and Fang, S.: Shanghai Tower atmospheric CO2 and CO during 2021-2023, figshare [data set], https://doi.org/10.6084/m9.figshare.30918203, 2025.
GGMT: GAW Report No. 292: Twenty-first WMO/IAEA Meeting on Carbon Dioxide, Other Greenhouse Gases and Related Measurement Techniques (GGMT-2022), https://library.wmo.int/records/item/68925 (last access: 21 November 2025), 2024.
Han, S., Kondo, Y., Oshima, N., Takegawa, N., Miyazaki, Y., Hu, M., Lin, P., Deng, Z., Zhao, Y., Sugimoto, N., and Wu, Y.: Temporal variations of elemental carbon in Beijing, J. Geophys. Res.-Atmos., 114, https://doi.org/10.1029/2009JD012027, 2009.
Henry, C. R., Satran, D., Lindgren, B., Adkinson, C., Nicholson, C. I., and Henry, T. D.: Myocardial injury and long-term mortality following moderate to severe carbon monoxide poisoning, JAMA, 295, 398–402, https://doi.org/10.1001/jama.295.4.398, 2006.
Hirsch, R. and Gilroy, E.: Methods of fitting a straight line to data: Examples in water resources, Water Resour. Bull., 20, 705–711, https://doi.org/10.1111/j.1752-1688.1984.tb04753.x, 1984.
Huang, Y., Li, S., Zhu, Y., Liu, Y., Hong, Y., Chen, X., Deng, W., Xi, X., Lu, X., and Fan, Q.: Increasing sea-land breeze frequencies over coastal areas of China in the past five decades, Geophys. Res. Lett., 52, e2024GL112480, https://doi.org/10.1029/2024GL112480, 2025.
IPCC: Intergovernmental Panel on Climate Change. Climate Change 2021 – The Physical Science Basis: Working Group I Contribution to the Sixth Assessment Report of the Intergovernmental Panel on Climate Change, Cambridge University Press, 675–714, https://doi.org/10.1017/9781009157896, 2023.
Kamal, A. T. M. M., Islam, M. S., Zaman, S. U., Miah, M. J., Ahmed, T., Hoque, S., and Salam, A.: Quantification and source apportionment of atmospheric trace gases over Dhaka, Bangladesh, J. Atmos. Chem., 81, 4, https://doi.org/10.1007/s10874-024-09457-y, 2024.
Kim, M.-K., Park, D., Kim, M., Heo, J., Park, S., and Chong, H.: A study on characteristic emission factors of exhaust gas from diesel locomotives, Int. J. Env. Res. Pub. He., 17, 3788, https://doi.org/10.3390/ijerph17113788, 2020.
Kondo, Y., Komazaki, Y., Miyazaki, Y., Moteki, N., Takegawa, N., Kodama, D., Deguchi, S., Nogami, M., Fukuda, M., Miyakawa, T., Morino, Y., Koike, M., Sakurai, H., and Ehara, K.: Temporal variations of elemental carbon in Tokyo, J. Geophys. Res.-Atmos., 111, https://doi.org/10.1029/2005JD006257, 2006.
Lelieveld, J., Gromov, S., Pozzer, A., and Taraborrelli, D.: Global tropospheric hydroxyl distribution, budget and reactivity, Atmos. Chem. Phys., 16, 12477–12493, https://doi.org/10.5194/acp-16-12477-2016, 2016.
Levin, I., Kromer, B., Schmidt, M., and Sartorius, H.: A novel approach for independent budgeting of fossil fuel CO2 over Europe by 14CO2 observations, Geophys. Res. Lett., 30, https://doi.org/10.1029/2003GL018477, 2003.
Li, Y., Tong, H., Zhuo, Y., Chen, C., and Xu, X.: Simultaneous removal of SO2 and trace SeO2 from flue gas: Effect of product layer on mass transfer, Environ. Sci. Technol., 40, 4306–4311, https://doi.org/10.1021/es052381s, 2006.
Li, Y., Deng, J., Mu, C., Xing, Z., and Du, K.: Vertical distribution of CO2 in the atmospheric boundary layer: Characteristics and impact of meteorological variables, Atmos. Environ., 91, 110–117, https://doi.org/10.1016/j.atmosenv.2014.03.067, 2014.
Li, Y., Ma, Z., Han, T., Quan, W., Wang, J., Zhou, H., He, D., and Dong, F.: Long-term declining in carbon monoxide (CO) at a rural site of Beijing during 2006–2018 implies the improved combustion efficiency and effective emission control, J. Environ. Sci., 115, 432–442, https://doi.org/10.1016/j.jes.2020.11.011, 2022.
Lin, J., Fang, S., He, R., Tang, Q., Qu, F., Wang, B., and Xu, W.: Monitoring ocean currents during the passage of Typhoon Muifa using optical-fiber distributed acoustic sensing, Nat. Commun., 15, 1111, https://doi.org/10.1038/s41467-024-45412-x, 2024.
Lin, Y., Zhang, Y., Xie, F., Fan, M., and Liu, X.: Substantial decreases of light absorption, concentrations and relative contributions of fossil fuel to light-absorbing carbonaceous aerosols attributed to the COVID-19 lockdown in east China, Environ. Pollut., 275, 116615, https://doi.org/10.1016/j.envpol.2021.116615, 2021.
Lin, Y., Li, S., Yu, Y., Lu, M., Chen, B., Chen, Y., Zang, K., Liu, S., Qi, B., and Fang, S.: A new regional background atmospheric station in the Yangtze River Delta region for carbon monoxide: Assessment of spatiotemporal characteristics and regional significance, Atmosphere, 16, https://doi.org/10.3390/atmos16010101, 2025.
Liu, L., Tans, P. P., Xia, L., Zhou, L., and Zhang, F.: Analysis of patterns in the concentrations of atmospheric greenhouse gases measured in two typical urban clusters in China, Atmos. Environ., 173, 343–354, https://doi.org/10.1016/j.atmosenv.2017.11.023, 2018.
Liu, P., Zhang, C., Mu, Y., Liu, C., Xue, C., Ye, C., Liu, J., Zhang, Y., and Zhang, H.: The possible contribution of the periodic emissions from farmers' activities in the North China Plain to atmospheric water-soluble ions in Beijing, Atmos. Chem. Phys., 16, 10097–10109, https://doi.org/10.5194/acp-16-10097-2016, 2016.
Liu, S., Fang, S., Liang, M., Ma, Q., and Feng, Z.: Study on CO data filtering approaches based on observations at two background stations in China, Sci. Total Environ., 691, 675–684, https://doi.org/10.1016/j.scitotenv.2019.07.162, 2019.
Liu, S., Chen, B., Fang, S., Zhang, C., Zang, K., He, W., Chen, Y., Lin, Y., Jin, Z., Chen, Z., Lan, W., and Xu, H.: Contrasting high-resolution vertical CO2 patterns: Insights from economically developed regions in Southeast China, J. Geophys. Res.-Atmos., 130, https://doi.org/10.1029/2024jd043181, 2025.
Meng, F., Hu, H., Sun, Y., Zhang, L., Hou, J., Zhang, Z., Pang, L., Cai, B., and Shan, Y.: Full-scope carbon dioxide emission dataset for Chinese cities in 2023, Sci. Data, 12, 1672, https://doi.org/10.1038/s41597-025-05949-y, 2025.
MOT (The Ministry of Transport of the People's Republic of China): Statistical Report on Transportation Industry Development 2022, MOT https://xxgk.mot.gov.cn/2020/jigou/zhghs/202205/t20220517_3655699.html (last access: 3 August 2025), 2022.
NOAA-ARL (Air Resources Laboratory): Global data assimilation system (GDAS) model one-degree archive, NOAA-ARL (Air Resources Laboratory), https://www.ready.noaa.gov/archives.php (last access: 1 August 2025), 2024.
Oke, T. R.: The distinction between canopy and boundary-layer urban heat islands, Atmosphere, 14, 268–277, https://doi.org/10.1080/00046973.1976.9648422, 1976.
Patel, A., Mallik, C., Chandra, N., Patra, P. K., and Steinbacher, M.: Revisiting regional and seasonal variations in decadal carbon monoxide variability: Global reversal of growth rate, Sci. Total Environ., 909, 168476, https://doi.org/10.1016/j.scitotenv.2023.168476, 2024.
Paul, S., Ghosh, S., Mathew, M., Devanand, A., Karmakar, S., and Niyogi, D.: Increased spatial variability and intensification of extreme monsoon rainfall due to urbanization, Sci. Rep., 8, 3918, https://doi.org/10.1038/s41598-018-22322-9, 2018.
Polissar, A. V., Hopke, P. K., Paatero, P., Kaufmann, Y. J., Hall, D. K., Bodhaine, B. A., Dutton, E. G., and Harris, J. M.: The aerosol at Barrow, Alaska: long-term trends and source locations, Atmos. Environ., 33, 2441–2458, https://doi.org/10.1016/S1352-2310(98)00423-3, 1999.
Popa, M. E., Vollmer, M. K., Jordan, A., Brand, W. A., Pathirana, S. L., Rothe, M., and Röckmann, T.: Vehicle emissions of greenhouse gases and related tracers from a tunnel study: CO : CO2, N2O : CO2, CH4 : CO2, O2 : CO2 ratios, and the stable isotopes 13C and 18O in CO2 and CO, Atmos. Chem. Phys., 14, 2105–2123, https://doi.org/10.5194/acp-14-2105-2014, 2014.
Pu, J., Xu, H., He, J., Fang, S., and Zhou, L.: Estimation of regional background concentration of CO2 at Lin'an Station in Yangtze River Delta, China, Atmos. Environ., 94, 402–408, https://doi.org/10.1016/j.atmosenv.2014.05.060, 2014.
Rogelj, J., McCollum, D. L., Reisinger, A., Meinshausen, M., and Riahi, K.: Probabilistic cost estimates for climate change mitigation, Nature, 493, 79–83, https://doi.org/10.1038/nature11787, 2013.
Rousseau, D.-D., Duzer, D., Etienne, J.-L., Cambon, G., Jolly, D., Ferrier, J., and Schevin, P.: Pollen record of rapidly changing air trajectories to the North Pole, J. Geophys. Res.: Atmos., 109, https://doi.org/10.1029/2003JD003985, 2004.
Ruckstuhl, A. F., Henne, S., Reimann, S., Steinbacher, M., Vollmer, M. K., O'Doherty, S., Buchmann, B., and Hueglin, C.: Robust extraction of baseline signal of atmospheric trace species using local regression, Atmos. Meas. Tech., 5, 2613–2624, https://doi.org/10.5194/amt-5-2613-2012, 2012.
Seiler, W.: Cycle of atmospheric CO, Tellus, 26, 116–135, https://doi.org/10.1111/j.2153-3490.1974.tb01958.x, 2010.
Seinfeld, J. H. and Pandis, S. N.: Atmospheric chemistry and physics: From air pollution to climate change, 2nd edn., John Wiley & Sons, https://doi.org/10.1063/1.882420, 2016.
SHMS: Shanghai Municipal Human Resources and Social Security Bureau, http://rsj.sh.gov.cn/tgwyrsb_17088/20211220/t0035_1404512.html (last access: 11 January 2024), 2022.
Super, I., Denier van der Gon, H. A. C., Visschedijk, A. J. H., Moerman, M. M., Chen, H., van der Molen, M. K., and Peters, W.: Interpreting continuous in-situ observations of carbon dioxide and carbon monoxide in the urban port area of Rotterdam, Atmos. Pollut. Res., 8, 174–187, https://doi.org/10.1016/j.apr.2016.08.008, 2017.
Thoning, K. W., Tans, P. P., and Komhyr, W. D.: Atmospheric carbon dioxide at Mauna Loa Observatory: 2. Analysis of the NOAA GMCC data, 1974–1985, J. Geophys. Res.-Atmos., 94, 8549–8565, https://doi.org/10.1029/JD094iD06p08549, 1989.
Tian, X., Ren, B., Xie, P., Xu, J., Li, A., Hu, F., Zheng, J., Ren, H., Hu, Z., Pan, Y., Huang, X., Zhang, Z., Lv, Y., Tian, W., and Wang, Z.: The vertical distribution and potential sources of aerosols in the Yangtze River Delta region of China during open straw burning, Sci. Total Environ., 849, 157749, https://doi.org/10.1016/j.scitotenv.2022.157749, 2022.
Tohjima, Y., Kubo, M., Minejima, C., Mukai, H., Tanimoto, H., Ganshin, A., Maksyutov, S., Katsumata, K., Machida, T., and Kita, K.: Temporal changes in the emissions of CH4 and CO from China estimated from CH4 CO2 and CO CO2 correlations observed at Hateruma Island, Atmos. Chem. Phys., 14, 1663–1677, https://doi.org/10.5194/acp-14-1663-2014, 2014.
Tong, K., Fang, A., Li, Y., Shi, L., Wang, Y., Wang, S., and Ramaswami, A.: The collective contribution of Chinese cities to territorial and electricity-related CO2 emissions, J. Clean. Prod., 189, 910–921, https://doi.org/10.1016/j.jclepro.2018.04.037, 2018.
Tsutsumi, Y., Mori, K., Ikegami, M., Tashiro, T., and Tsuboi, K.: Long-term trends of greenhouse gases in regional and background events observed during 1998–2004 at Yonagunijima located to the east of the Asian continent, Atmos. Environ., 40, 5868–5879, https://doi.org/10.1016/j.atmosenv.2006.04.036, 2006.
Vásquez, M., Lara, W., Valle, J. I. D., and Sierra, C.: Reconstructing past fossil-fuel CO2 concentrations using tree rings and radiocarbon in the urban area of Medellín, Colombia, Environ. Res. Lett., 17, 055008, https://doi.org/10.1088/1748-9326/ac63d4, 2022.
Vega, M., Cespedes, L., Lombardo, F., Re, G., Garcia, N., Busnelli, A., Fedele, F. D., Lopez, M., Pomar, J., Salvati, A., and Piacentini, R.: Measurements and modelization of the Rosario City Heat Island, Argentina - Preliminary Results, IOP Conf. Ser.: Mater. Sci. Eng., 471, 092088, https://doi.org/10.1088/1757-899X/471/9/092088, 2019.
Wang, L., Li, D., Gao, Z., Sun, T., Guo, X., and Bou-Zeid, E.: Turbulent transport of momentum and scalars above an urban canopy, Bound.-Lay. Meteorol., 150, 485–511, https://doi.org/10.1007/s10546-013-9877-z, 2014.
Wang, L., Gu, X., Slater, L. J., Lai, Y., Zhang, X., Kong, D., Liu, J., and Li, J.: Indirect and direct impacts of typhoon In-Fa (2021) on heavy precipitation in inland and coastal areas of China: Synoptic-scale environments and return period analysis, Mon. Weather Rev., 151, 2377–2395, https://doi.org/10.1175/MWR-D-22-0241.1, 2023.
Wang, L., Xiong, Q., Wu, G., Gautam, A., Jiang, J., Liu, S., Zhao, W., and Guan, H.: Spatio-temporal variation characteristics of PM2.5 in the Beijing–Tianjin–Hebei Region, China, from 2013 to 2018, Int. J. Env. Res. Pub. He., 16, 4276, https://doi.org/10.3390/ijerph16214276, 2019.
Wang, S., Wang, Q., Zhu, S., Zhou, M., Qiao, L., Huang, D., Ma, Y., Lu, Y., Huang, C., Fu, Q., Duan, Y., and Yu, J. Z.: Hourly organic tracers-based source apportionment of PM2.5 before and during the Covid-19 lockdown in suburban Shanghai, China: Insights into regional transport influences and response to urban emission reductions, Atmos. Environ., 289, 119308, https://doi.org/10.1016/j.atmosenv.2022.119308, 2022.
Wang, Y., Munger, J. W., Xu, S., McElroy, M. B., Hao, J., Nielsen, C. P., and Ma, H.: CO2 and its correlation with CO at a rural site near Beijing: implications for combustion efficiency in China, Atmos. Chem. Phys., 10, 8881–8897, https://doi.org/10.5194/acp-10-8881-2010, 2010.
Wang, Z., Li, J., Wang, X., Pochanart, P., and Akimoto, H.: Modeling of regional high ozone episode observed at two mountain sites (Mt. Tai and Huang) in East China, J. Atmos. Chem., 55, 253–272, https://doi.org/10.1007/s10874-006-9038-6, 2006.
WDCGG (World Data Centre for Greenhouse Gases): WMO WDCGG Data Summary reports No. 49, https://gaw.kishou.go.jp/static/publications/summary/sum49/sum49.pdf (last access: 20 November 2025), 2025a.
WDCGG (World Data Centre for Greenhouse Gases): Greenhouse Gases Data, WDCGG [data set], https://gaw.kishou.go.jp/search (last access: 31 December 2025), 2025b.
Westerdahl, D., Wang, X., Pan, X., and Zhang, K. M.: Characterization of on-road vehicle emission factors and microenvironmental air quality in Beijing, China, Atmos. Environ., 43, 697–705, https://doi.org/10.1016/j.atmosenv.2008.09.042, 2009.
Winderlich, J., Gerbig, C., Kolle, O., and Heimann, M.: Inferences from CO2 and CH4 concentration profiles at the Zotino Tall Tower Observatory (ZOTTO) on regional summertime ecosystem fluxes, Biogeosciences, 11, 2055–2068, https://doi.org/10.5194/bg-11-2055-2014, 2014.
WMO: WMO Greenhouse Gas Bulletin, No. 21, The State of Greenhouse Gases in the Atmosphere Based on Global Observations through 2024, https://library.wmo.int/records/item/69654-no-21-16-october-2025 (last access: 27 October 2025), 2025.
Wu, D., Liu, J., Wennberg, P. O., Palmer, P. I., Nelson, R. R., Kiel, M., and Eldering, A.: Towards sector-based attribution using intra-city variations in satellite-based emission ratios between CO2 and CO, Atmos. Chem. Phys., 22, 14547–14570, https://doi.org/10.5194/acp-22-14547-2022, 2022.
Xia, L., Zhang, G., Liu, L., Li, B., Zhan, M., Kong, P., and Wang, H.: Atmospheric CO2 and CO at Jingdezhen station in central China: Understanding the regional transport and combustion efficiency, Atmos. Environ., 222, 117104, https://doi.org/10.1016/j.atmosenv.2019.117104, 2020.
Xiong, H., Fang, S., Zang, K., Lin, Y., Qiu, S., Hong, H., Li, J., Qing, X., and Jiang, K.: The utility model relates to a gas pretreatment device, CN215876659U, 2022-02-22, http://epub.cnipa.gov.cn/Dxb/PatentDetail (last access: 13 July 2025), 2022.
Yang, Y., Zhou, M., Wang, T., Yao, B., Han, P., Ji, D., Zhou, W., Sun, Y., Wang, G., and Wang, P.: Spatial and temporal variations of CO2 mole fractions observed at Beijing, Xianghe, and Xinglong in North China, Atmos. Chem. Phys., 21, 11741–11757, https://doi.org/10.5194/acp-21-11741-2021, 2021.
Yang, Y., Zhou, M., Langerock, B., Sha, M. K., Hermans, C., Wang, T., Ji, D., Vigouroux, C., Kumps, N., Wang, G., De Mazière, M., and Wang, P.: New ground-based Fourier-transform near-infrared solar absorption measurements of XCO2, XCH4 and XCO at Xianghe, China, Earth Syst. Sci. Data, 12, 1679–1696, https://doi.org/10.5194/essd-12-1679-2020, 2020.
Ye, C., Zhou, X., Zhang, Y., Wang, Y., Wang, J., Zhang, C., Woodward-Massey, R., Cantrell, C., Mauldin, R. L., Campos, T., Hornbrook, R. S., Ortega, J., Apel, E. C., Haggerty, J., Hall, S., Ullmann, K., Weinheimer, A., Stutz, J., Karl, T., Smith, J. N., Guenther, A., and Song, S.: Synthesizing evidence for the external cycling of NOx in high- to low-NOx atmospheres, Nat. Commun., 14, 7995, https://doi.org/10.1038/s41467-023-43866-z, 2023.
Ye, J., Zhang, Y., Yao, W., Liu, H., Lei, S., Zhang, Y., Zhang, J., Li, S., Lv, S., Wu, L., Tang, X., Sun, Y., Xin, J., Li, J., Wang, Z., Liu, L., Su, H., and Pan, X.: Significant shift of footprint patterns and pollutant source contributions: insights from observations at Shanghuang observatory, East China, Environ. Res. Lett., 19, https://doi.org/10.1088/1748-9326/ad8369, 2024.
Yuan, Y., Ries, L., Petermeier, H., Steinbacher, M., Gómez-Peláez, A. J., Leuenberger, M. C., Schumacher, M., Trickl, T., Couret, C., Meinhardt, F., and Menzel, A.: Adaptive selection of diurnal minimum variation: a statistical strategy to obtain representative atmospheric CO2 data and its application to European elevated mountain stations, Atmos. Meas. Tech., 11, 1501–1514, https://doi.org/10.5194/amt-11-1501-2018, 2018.
Zhang, F., Chen, Y., Tian, C., Lou, D., Li, J., Zhang, G., and Matthias, V.: Emission factors for gaseous and particulate pollutants from offshore diesel engine vessels in China, Atmos. Chem. Phys., 16, 6319–6334, https://doi.org/10.5194/acp-16-6319-2016, 2016.
Zhang, P., Wang, Y., Chen, T., Yu, Y., Ma, Q., Liu, C., Li, H., Chu, B., and He, H.: Insight into the Mechanism and Kinetics of the Heterogeneous Reaction between SO2 and NO2 on Diesel Black Carbon under Light Irradiation, Environ. Sci. Technol., 57, 17718–17726, https://doi.org/10.1021/acs.est.2c09674, 2023.
Zhang, W., Tong, S., Jia, C., Ge, M., Ji, D., Zhang, C., Liu, P., Zhao, X., Mu, Y., Hu, B., Wang, L., Tang, G., Li, X., Li, W., and Wang, Z.: Effect of different combustion processes on atmospheric nitrous acid formation mechanisms: a winter comparative observation in urban, suburban and rural areas of the North China Plain, Environ. Sci. Technol., 56, 4828–4837, https://doi.org/10.1021/acs.est.1c07784, 2022.
Zhao, D., Xin, J., Wang, W., Jia, D., Wang, Z., Xiao, H., Liu, C., Zhou, J., Tong, L., Ma, Y., Wen, T., Wu, F., and Wang, L.: Effects of the sea-land breeze on coastal ozone pollution in the Yangtze River Delta, China, Sci. Total Environ., 807, 150306, https://doi.org/10.1016/j.scitotenv.2021.150306, 2022.
Zhao, J., Chen, H., Qi, X., Chi, X., Jia, M., Jiang, F., Zhong, S., Zheng, B., and Ding, A.: Observed decade-long improvement of combustion efficiency in the Yangtze River Delta region in China, Environ. Res. Lett., 19, 074001, https://doi.org/10.1088/1748-9326/ad521e, 2024.
Zhao, X., Ding, J. M., and Suna, H. H.: Structural Design of Shanghai Tower for wind Loads, Procedia Engineer., 14, 1759–1767, https://doi.org/10.1016/j.proeng.2011.07.221, 2011.
Zheng, B., Chevallier, F., Yin, Y., Ciais, P., Fortems-Cheiney, A., Deeter, M. N., Parker, R. J., Wang, Y., Worden, H. M., and Zhao, Y.: Global atmospheric carbon monoxide budget 2000–2017 inferred from multi-species atmospheric inversions, Earth Syst. Sci. Data, 11, 1411–1436, https://doi.org/10.5194/essd-11-1411-2019, 2019.
Zhu, W., Kattel, S., Jiao, F., and Chen, J. G.: Shape-controlled CO2 electrochemical reduction on nanosized Pd hydride cubes and octahedra, Adv. Energy Mater., 9, https://doi.org/10.1002/aenm.201802840, 2019.